Gas-Liquid Flow and Interphase Mass Transfer in LL Microreactors

 and
and
Abstract
1. Introduction
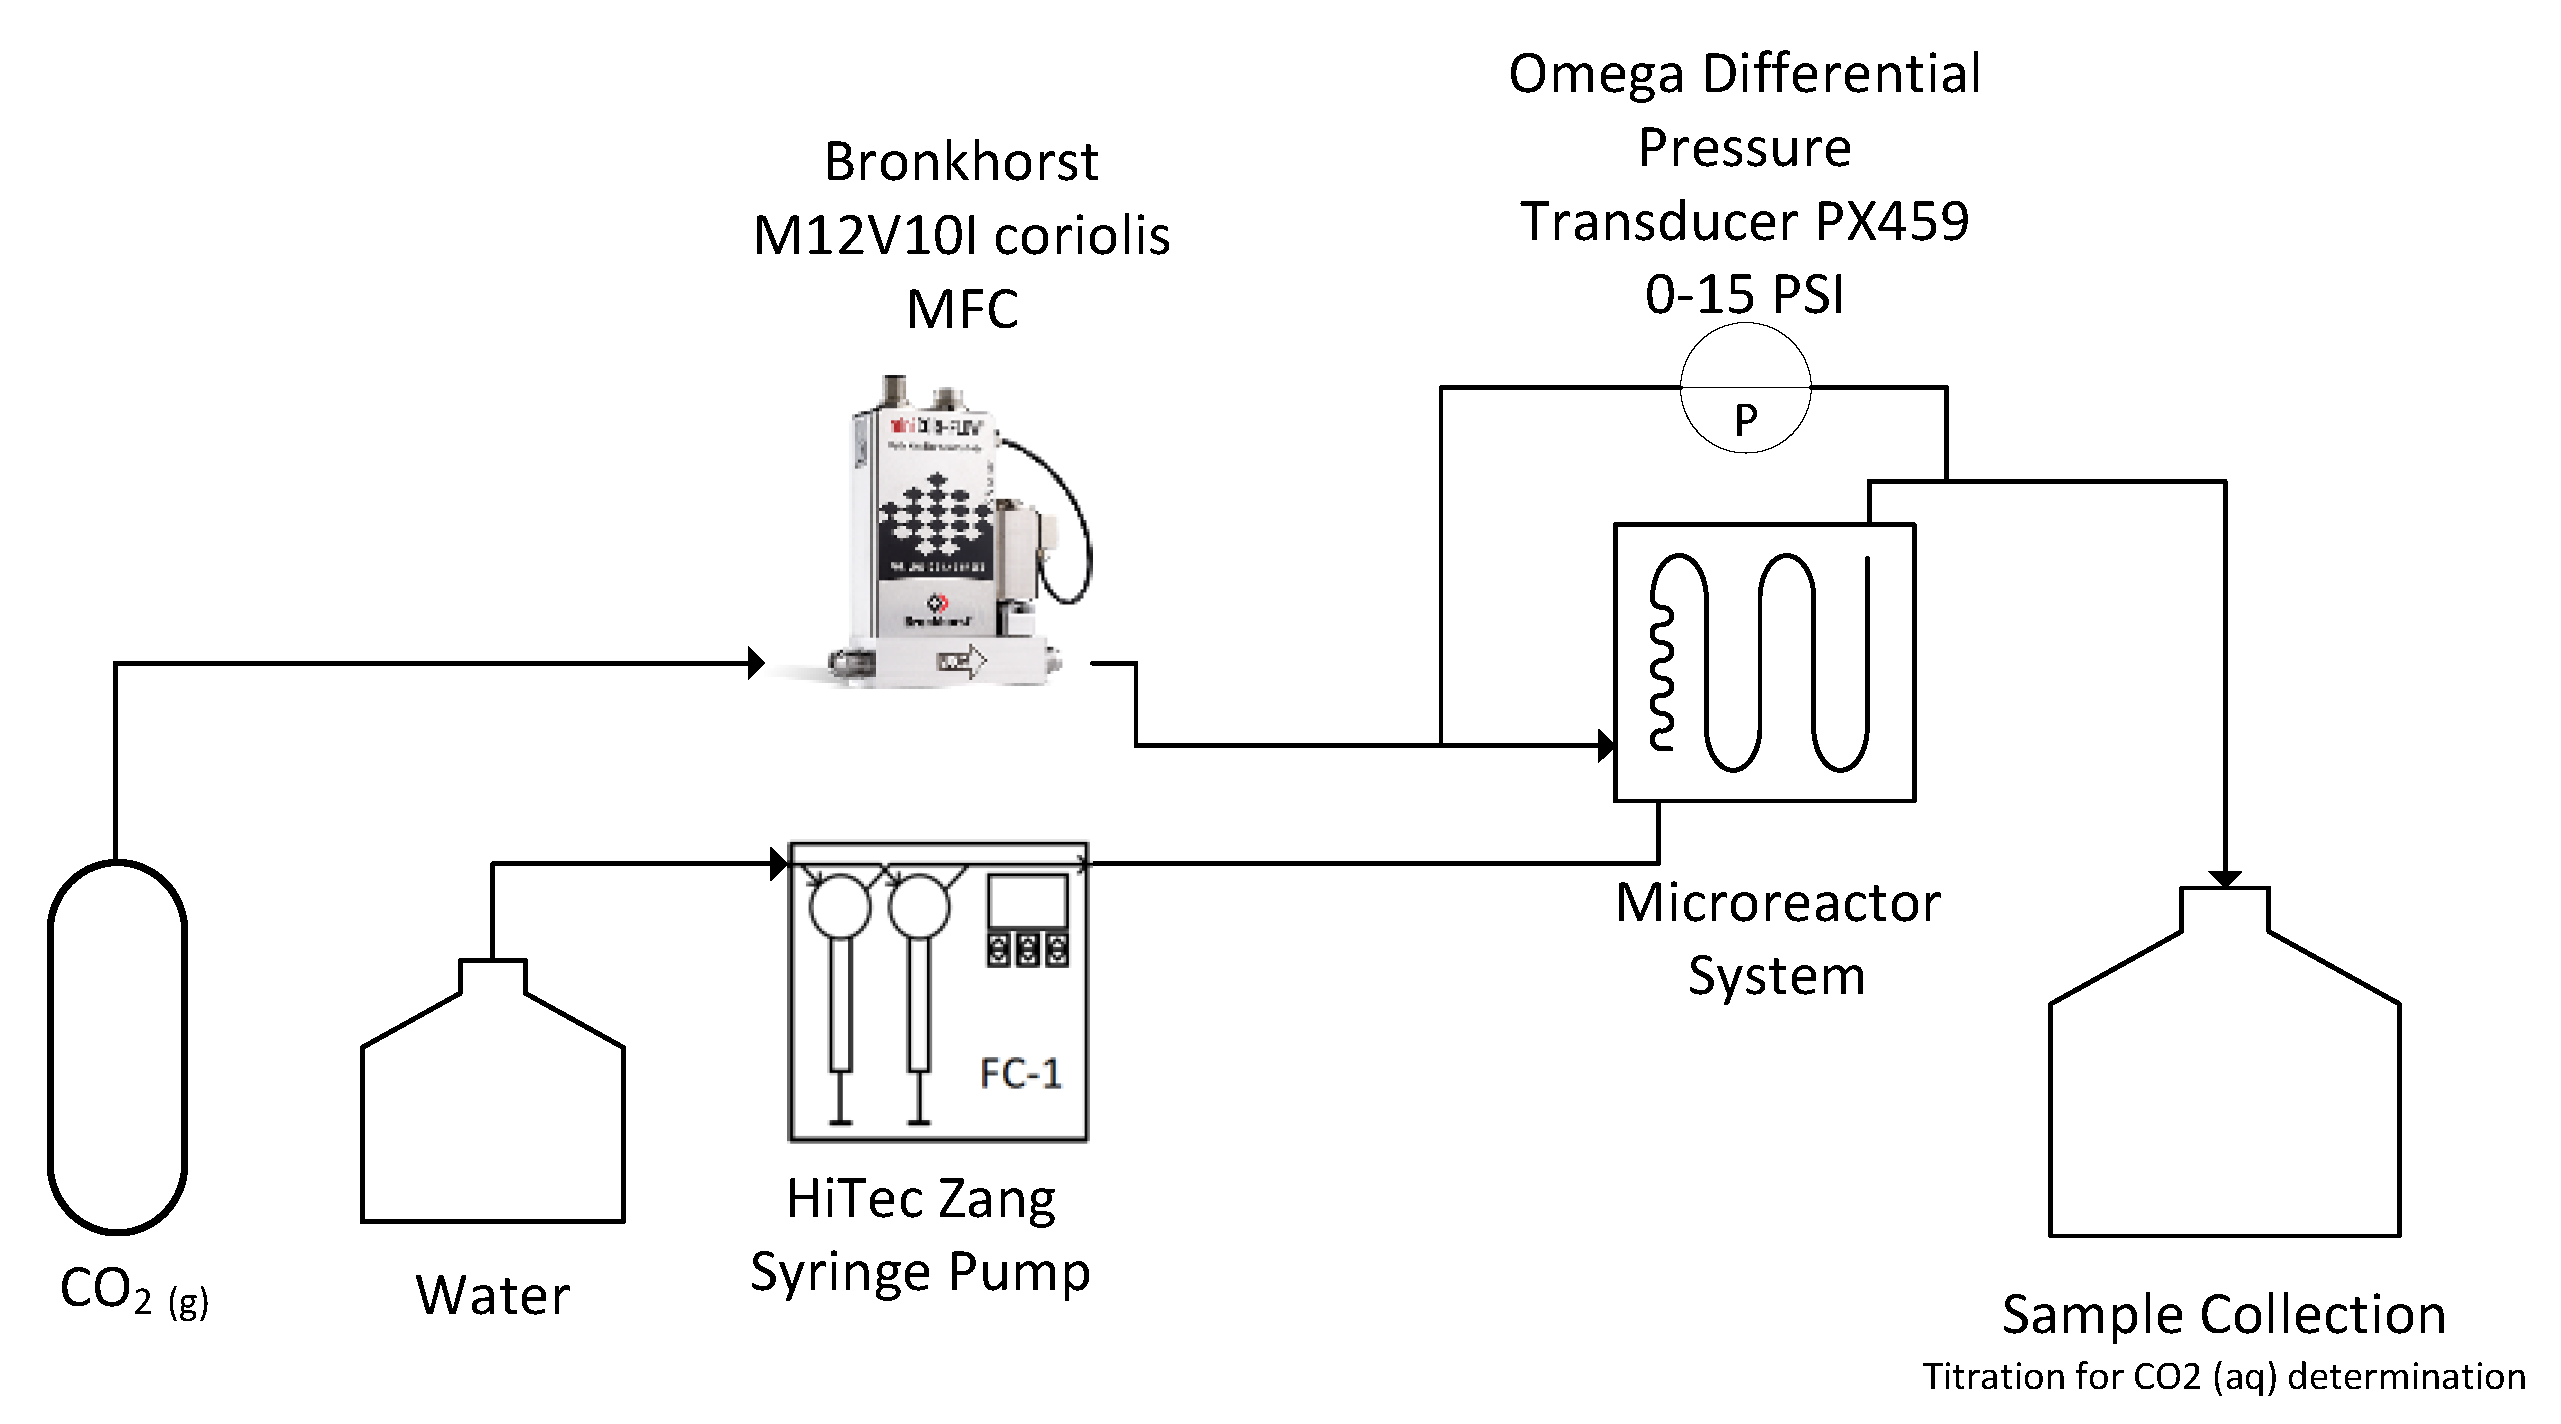
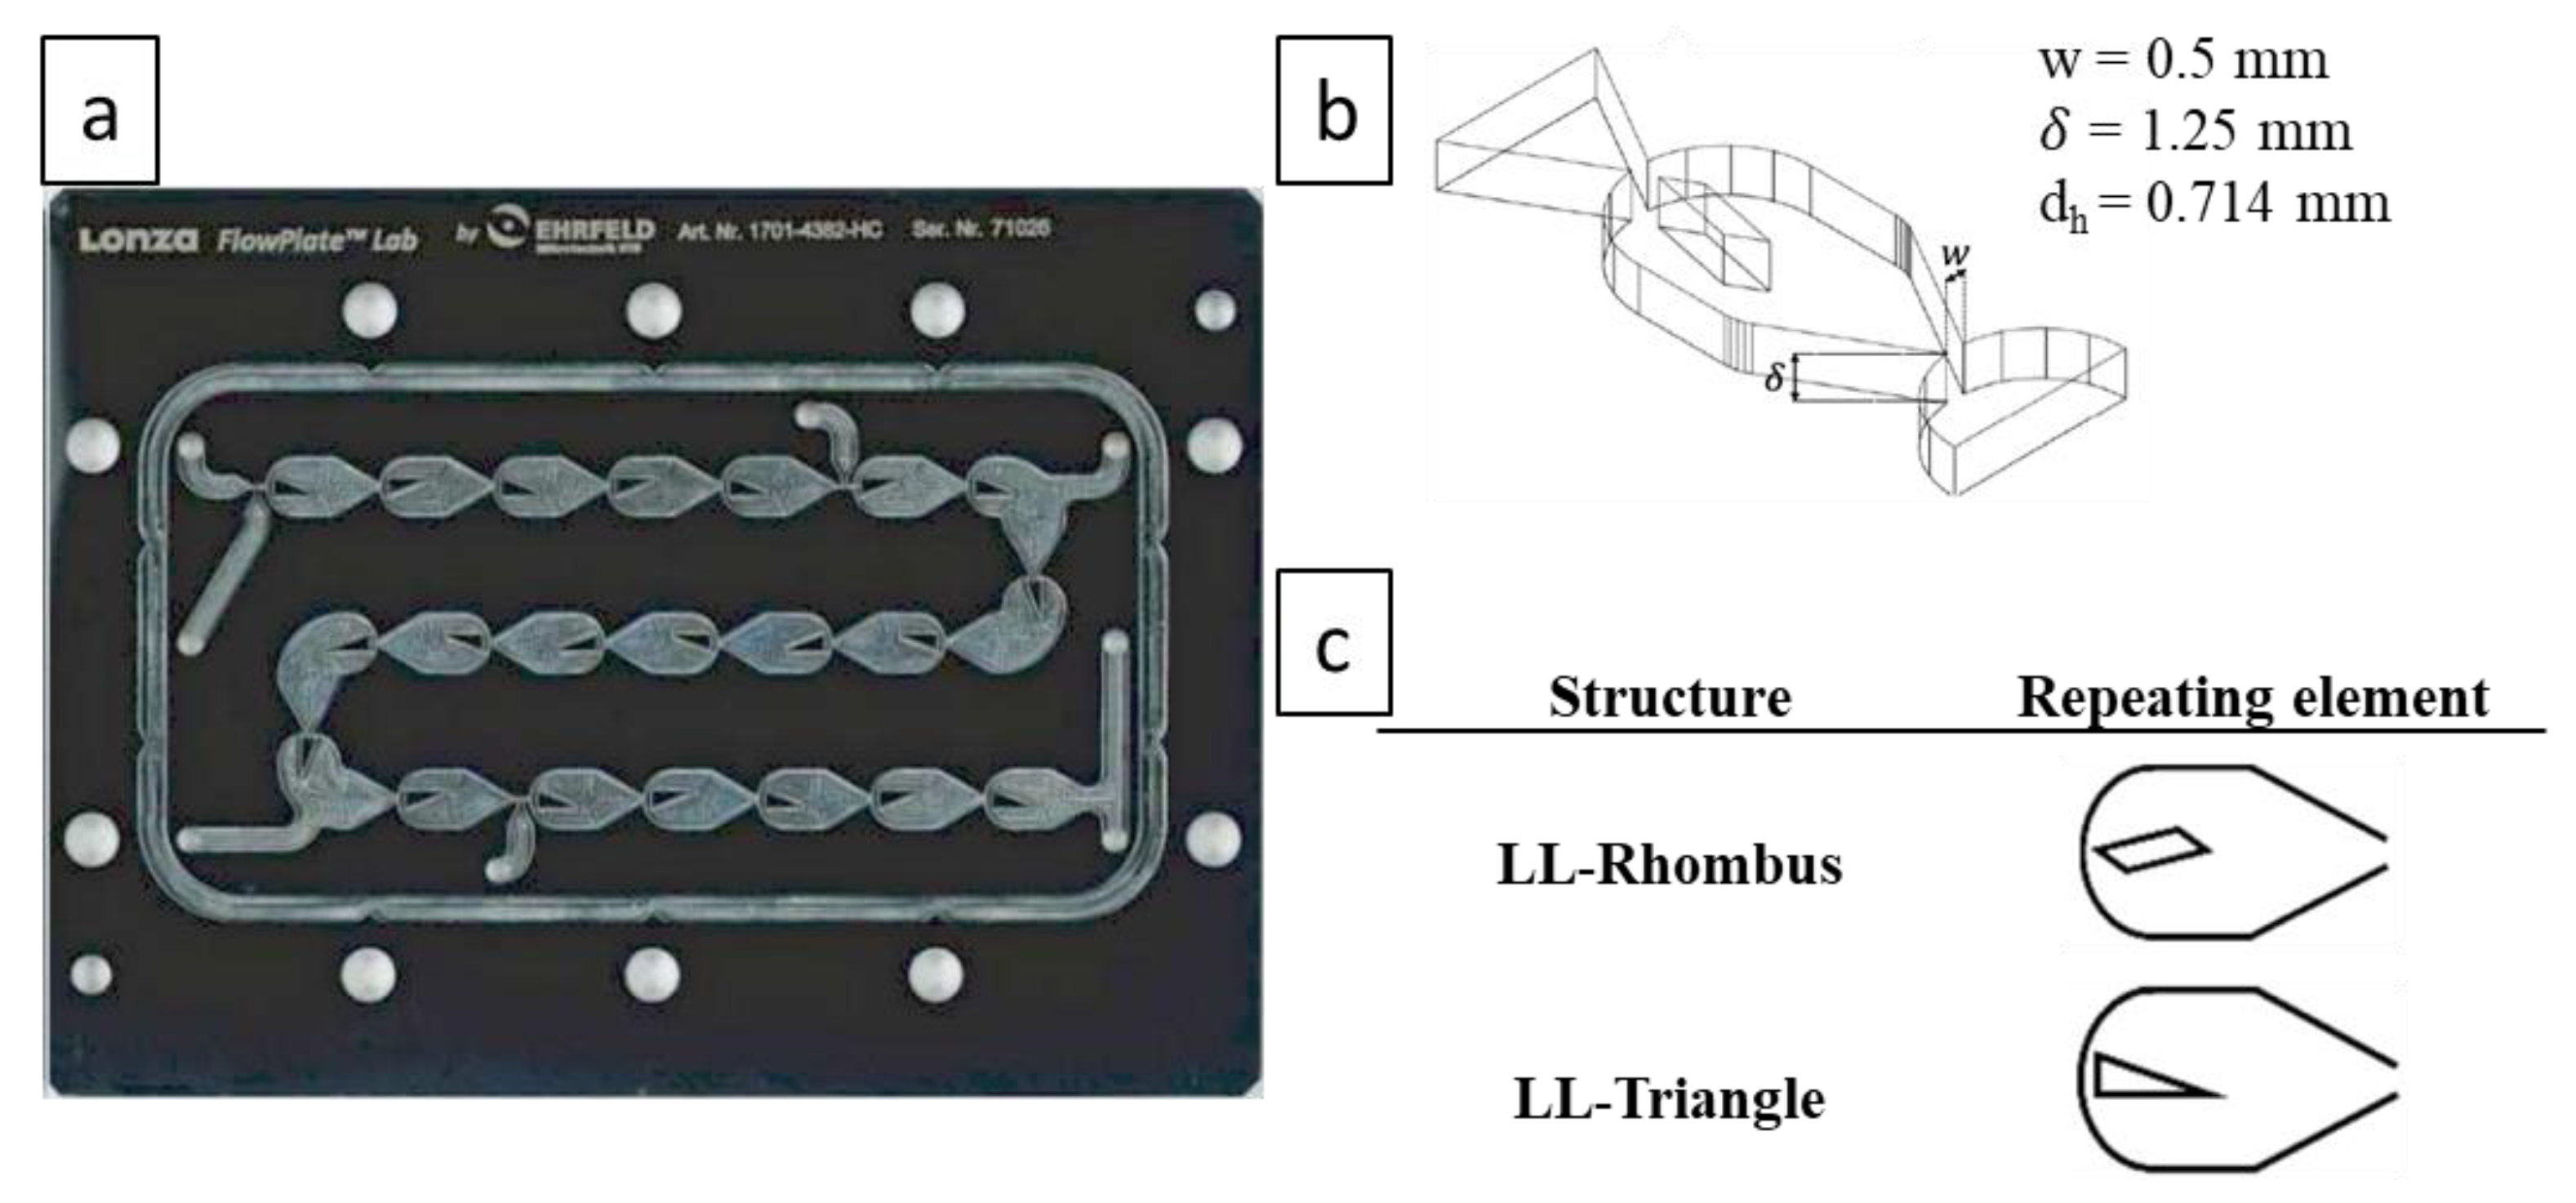
2. Materials and Methods
3. Results
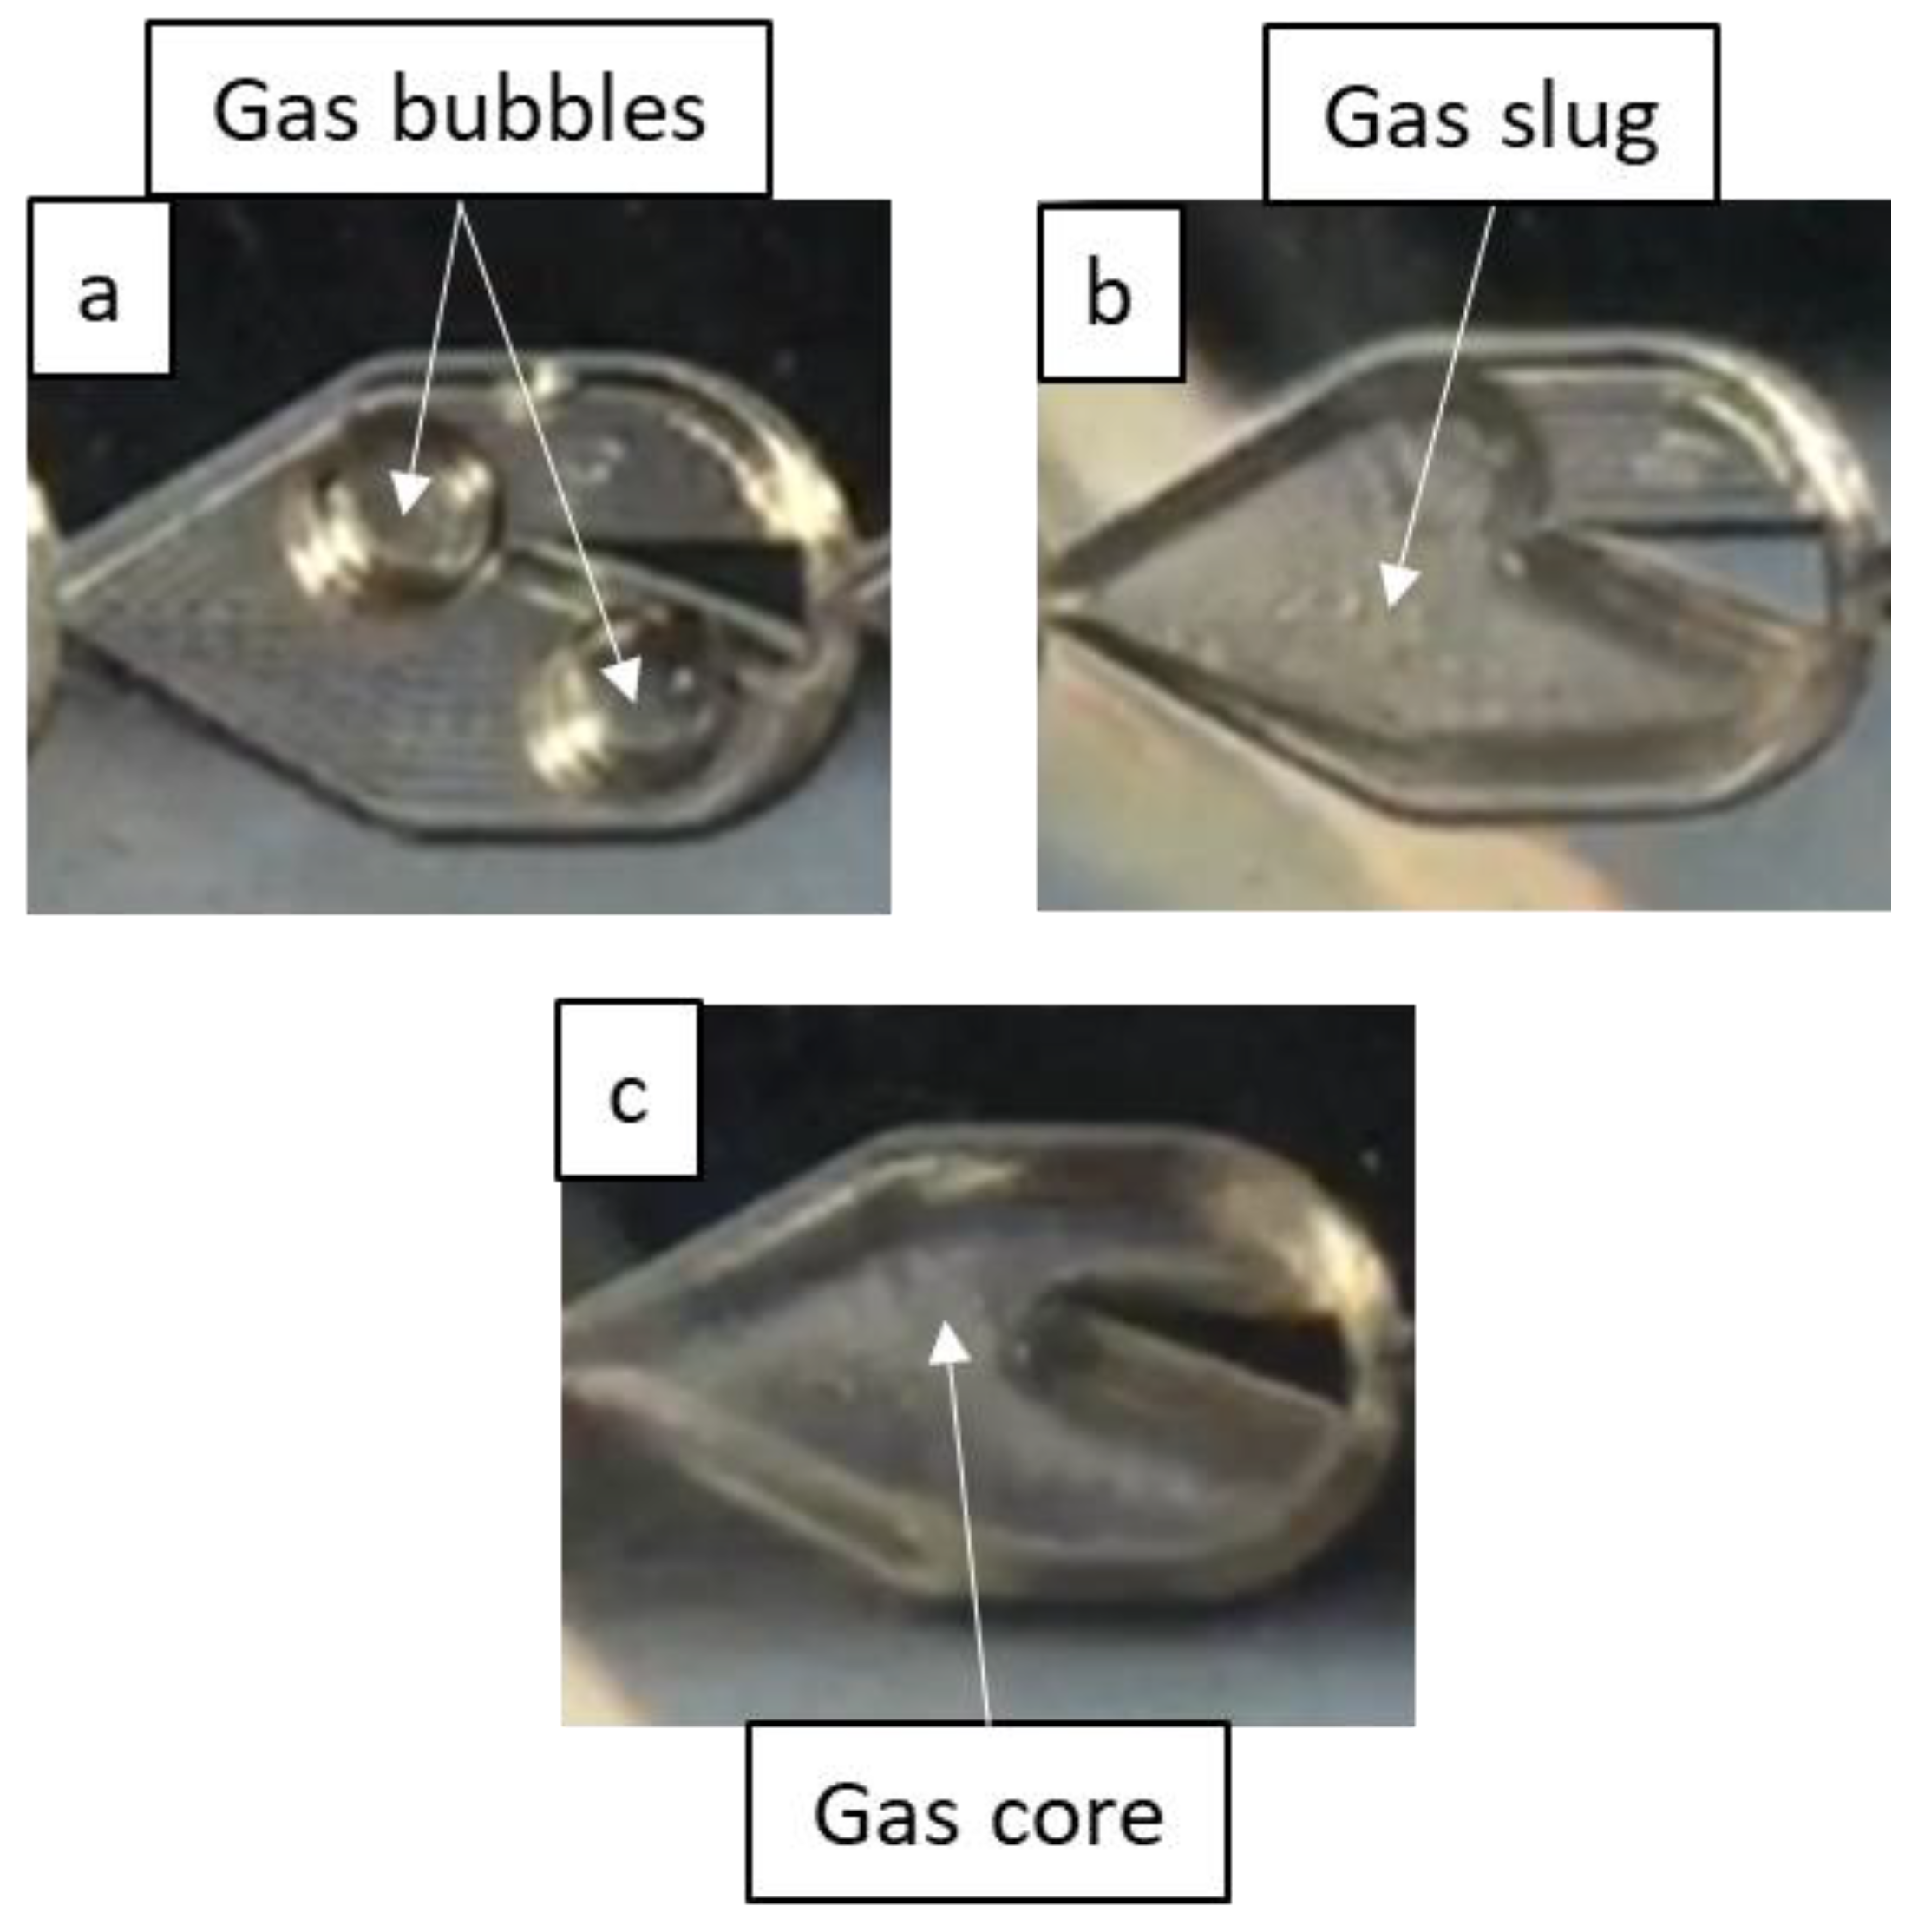
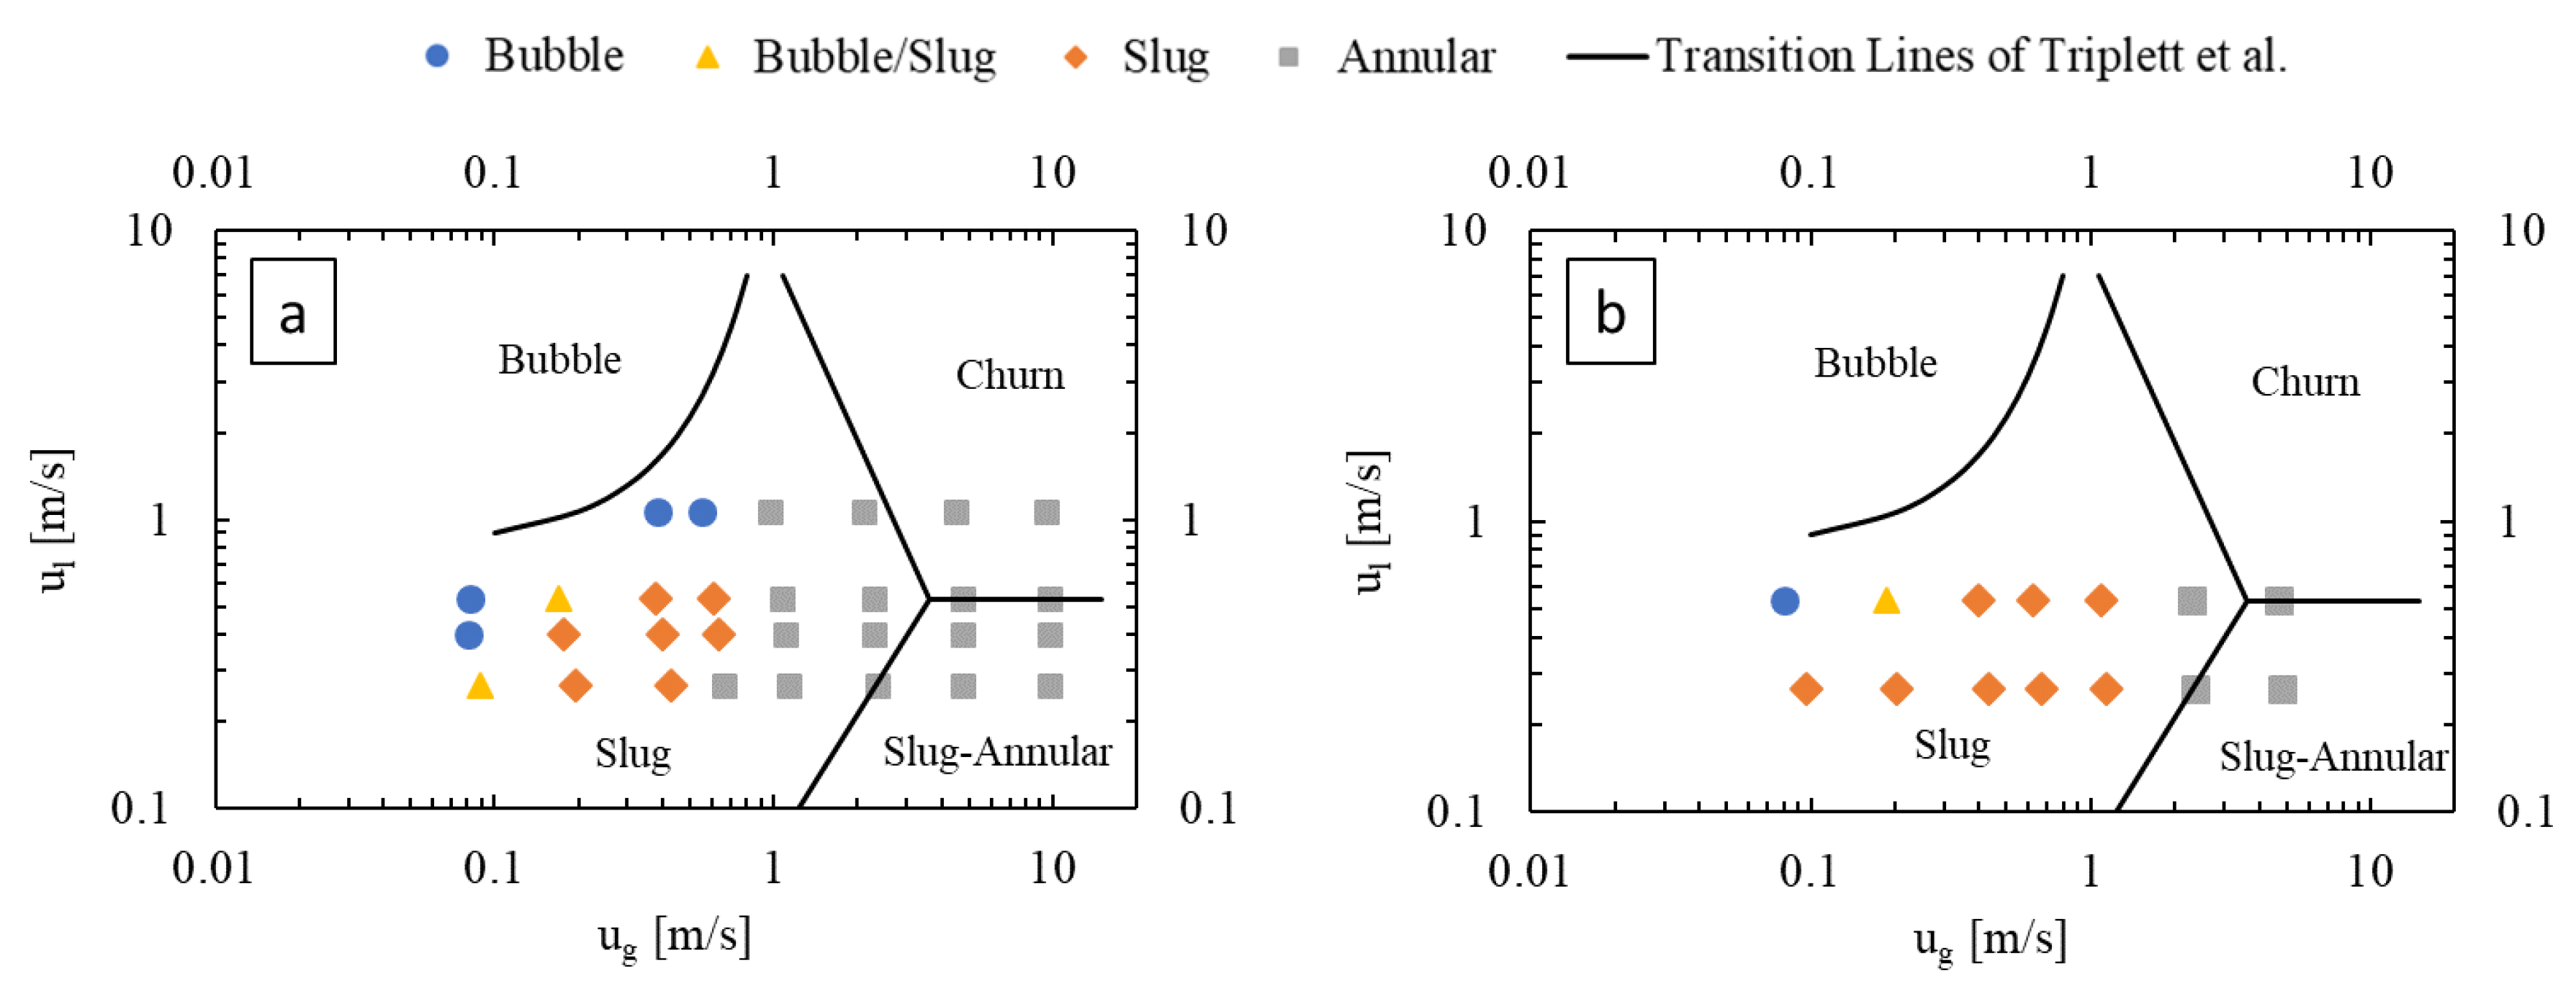
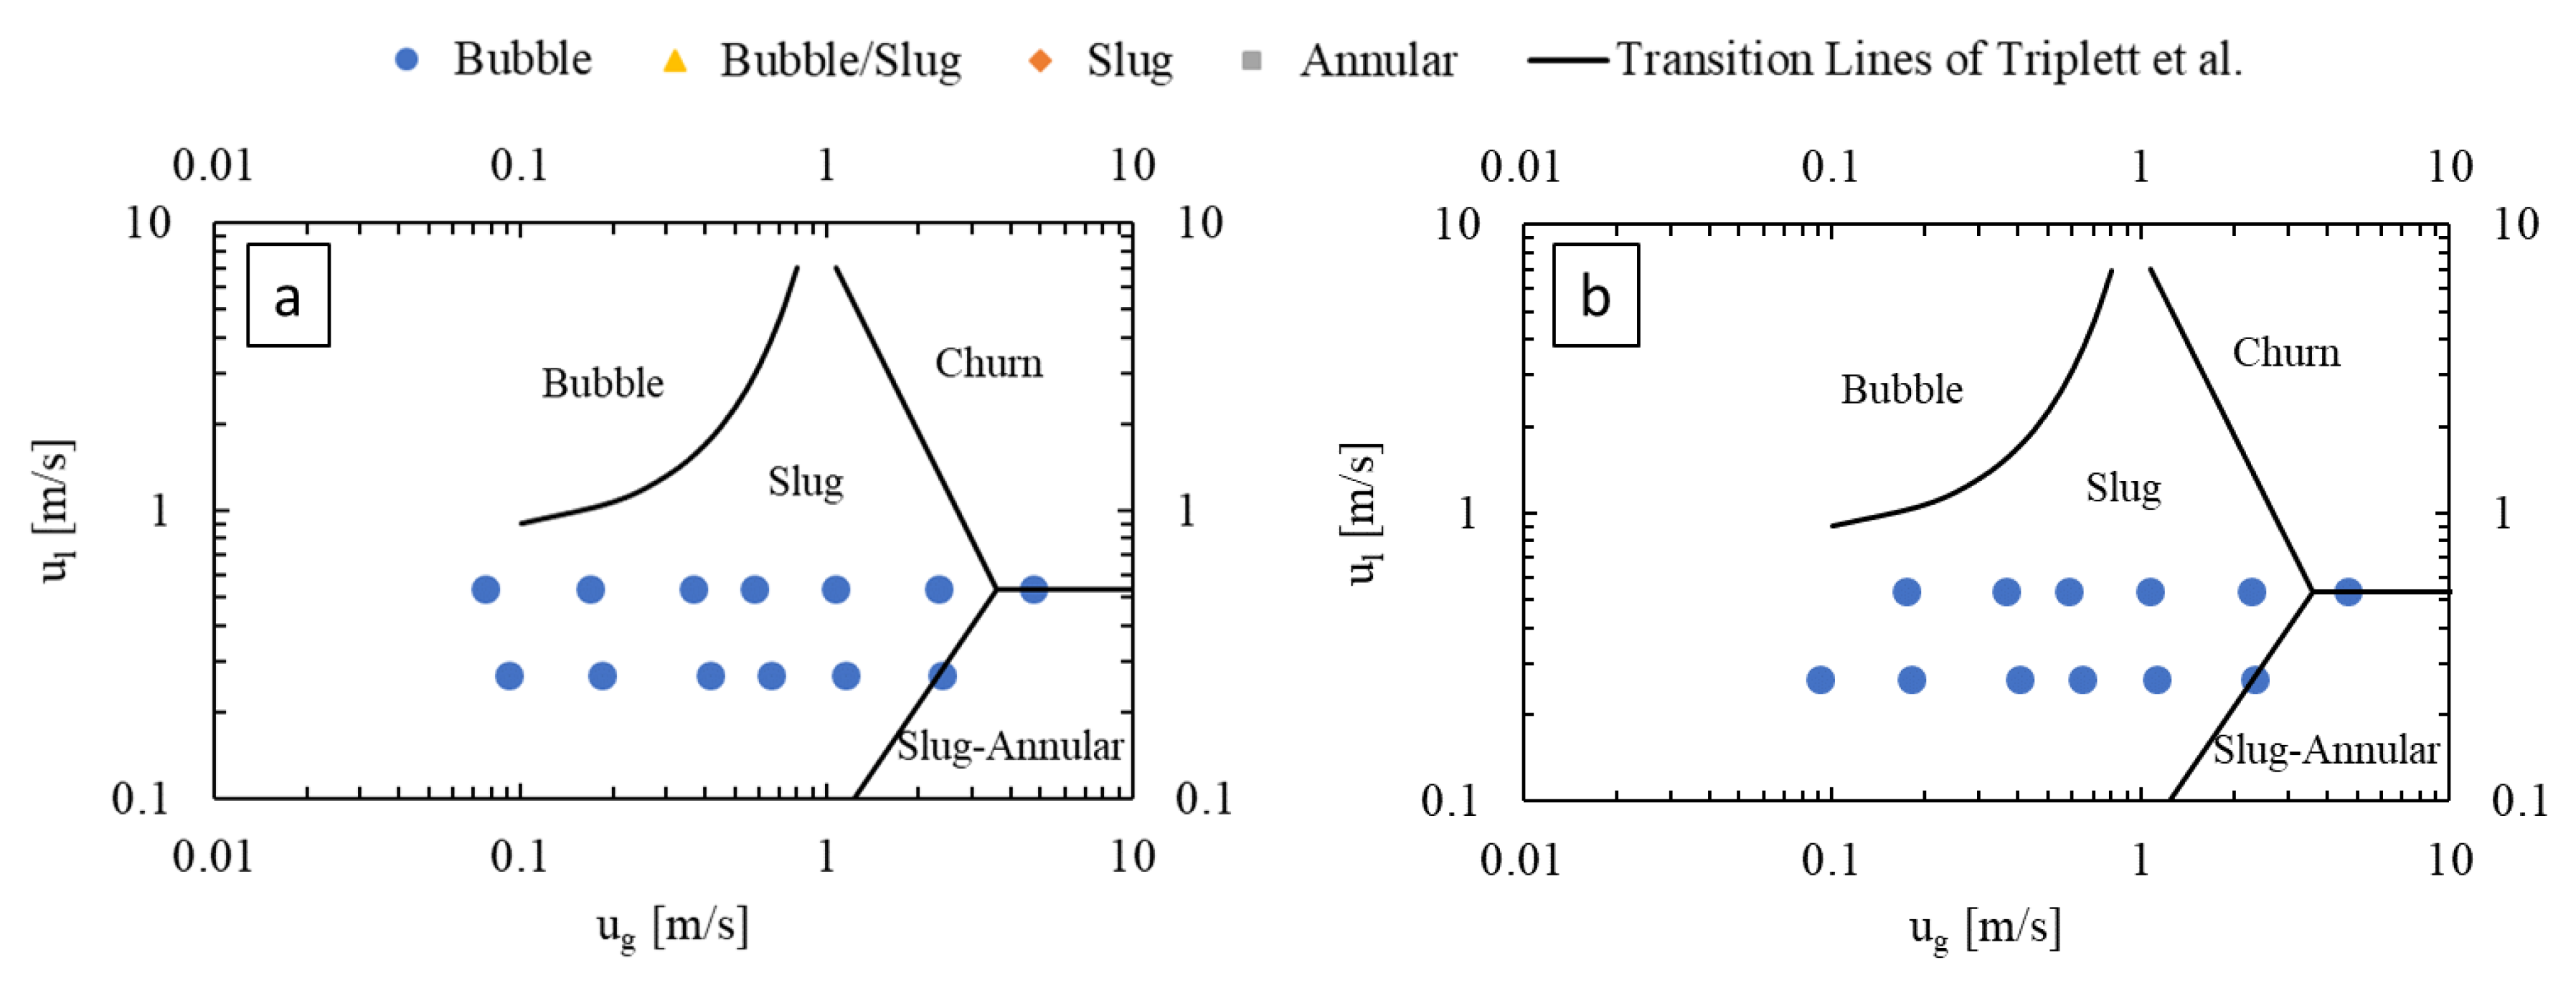
3.1. Flow Regimes
3.1.1. Effect of Gas and Liquid Flow Rates
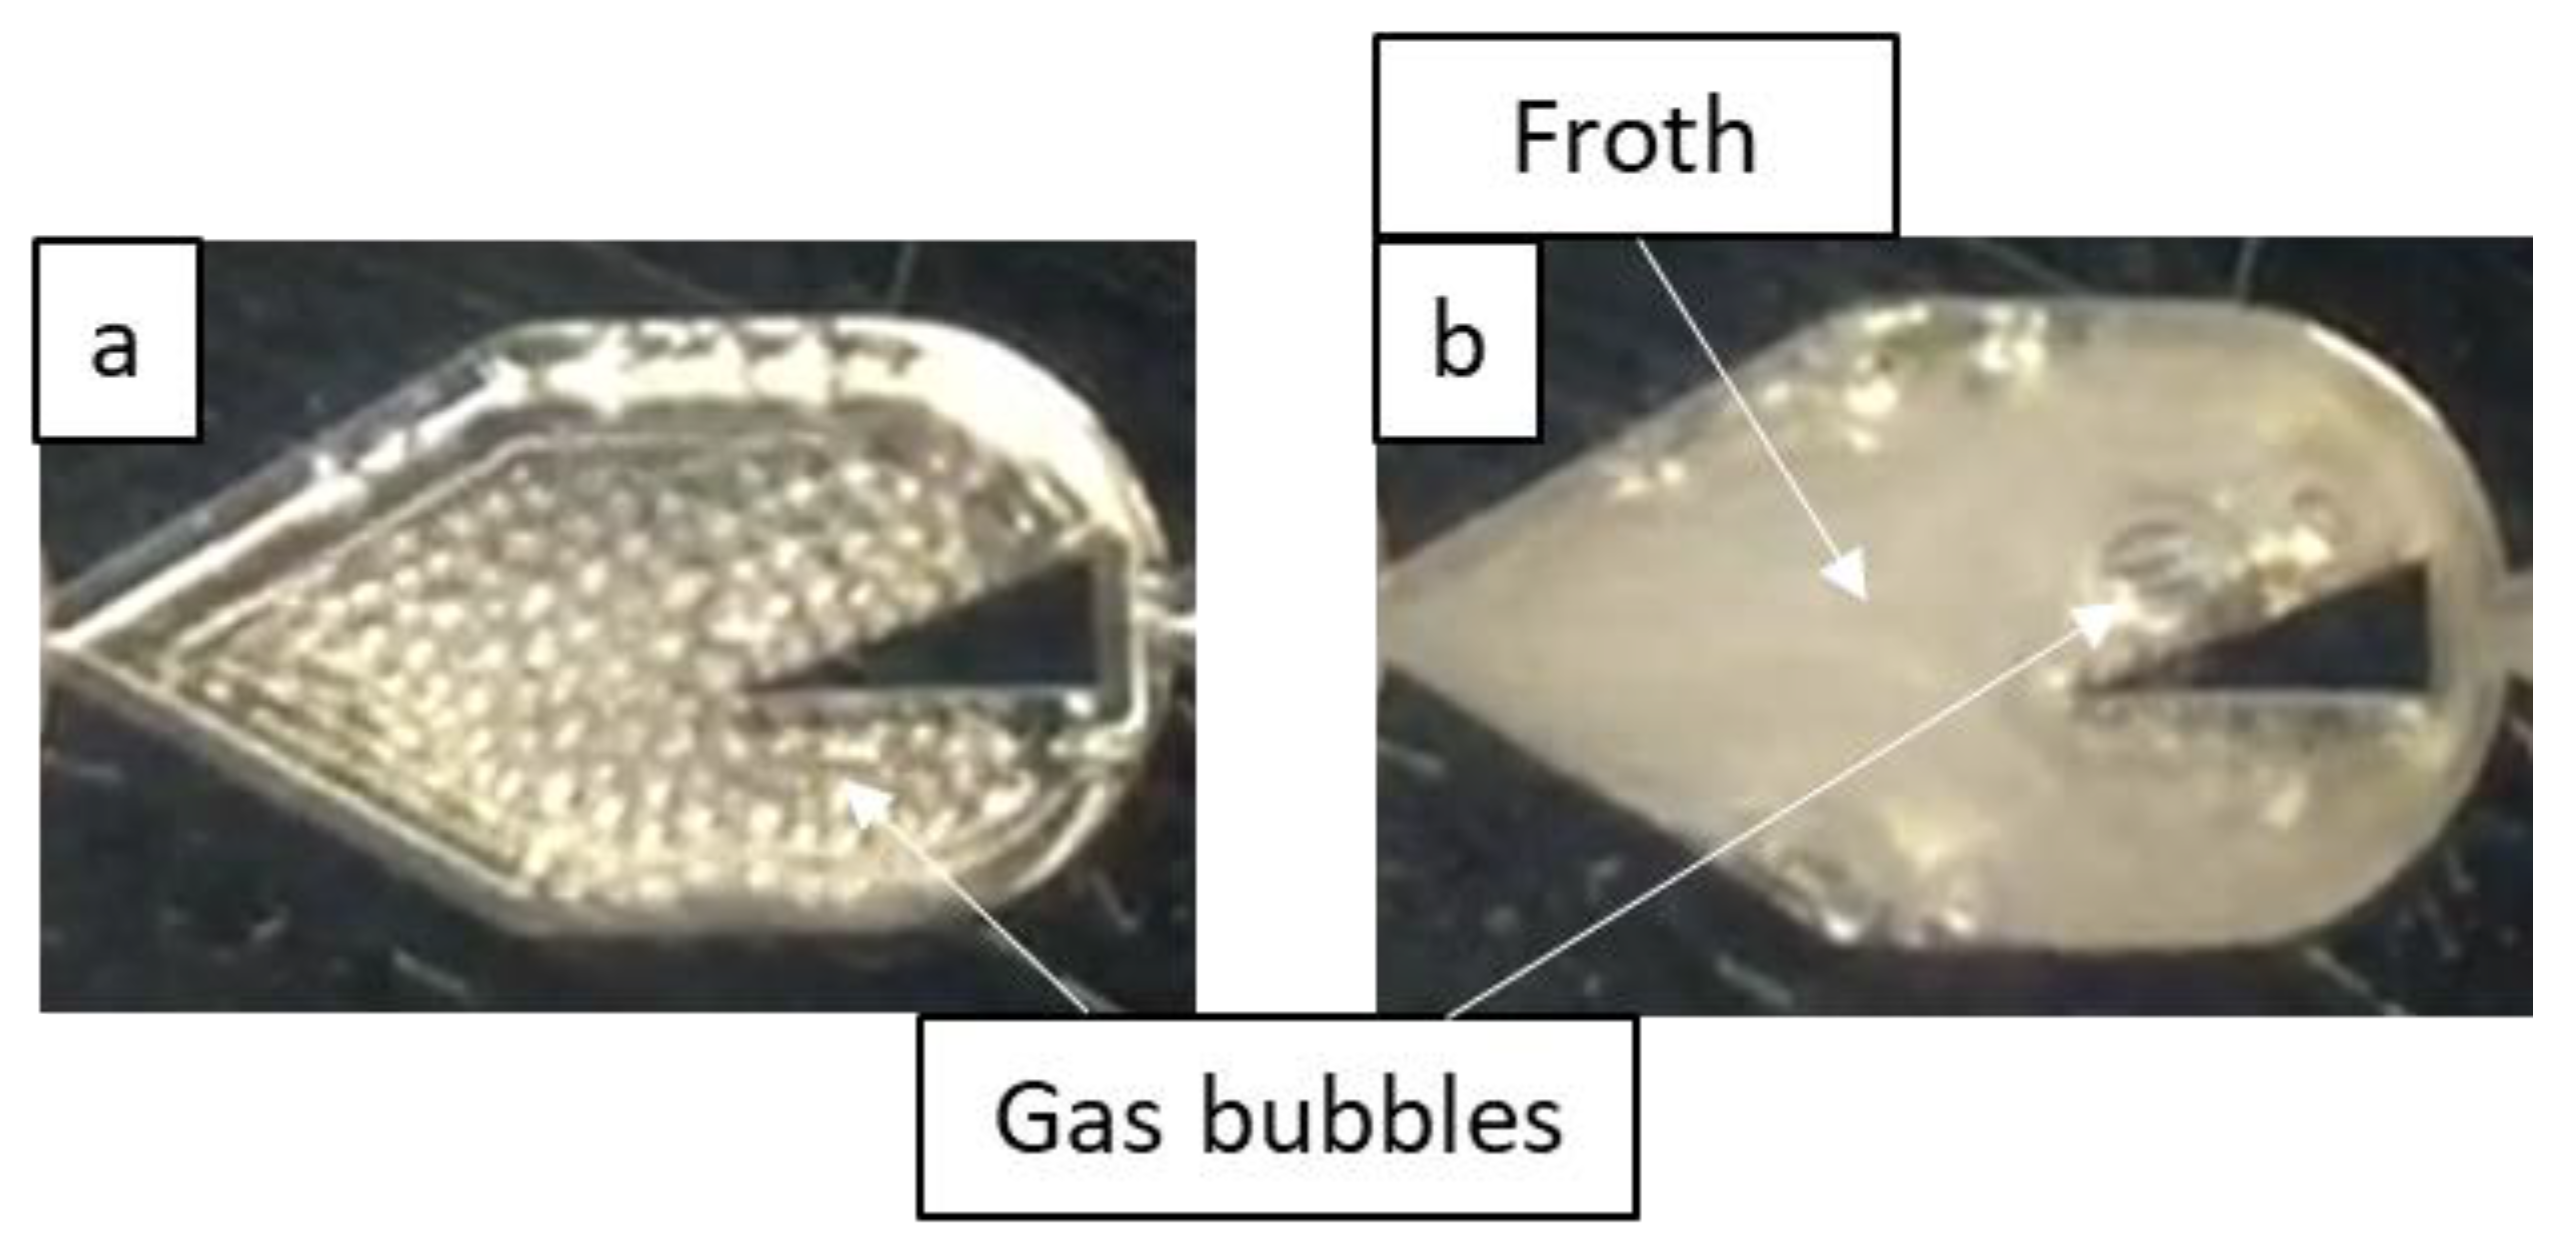
3.1.2. Effect of Surfactant
3.2. Pressure Drop
3.2.1. Impact of Operating Conditions
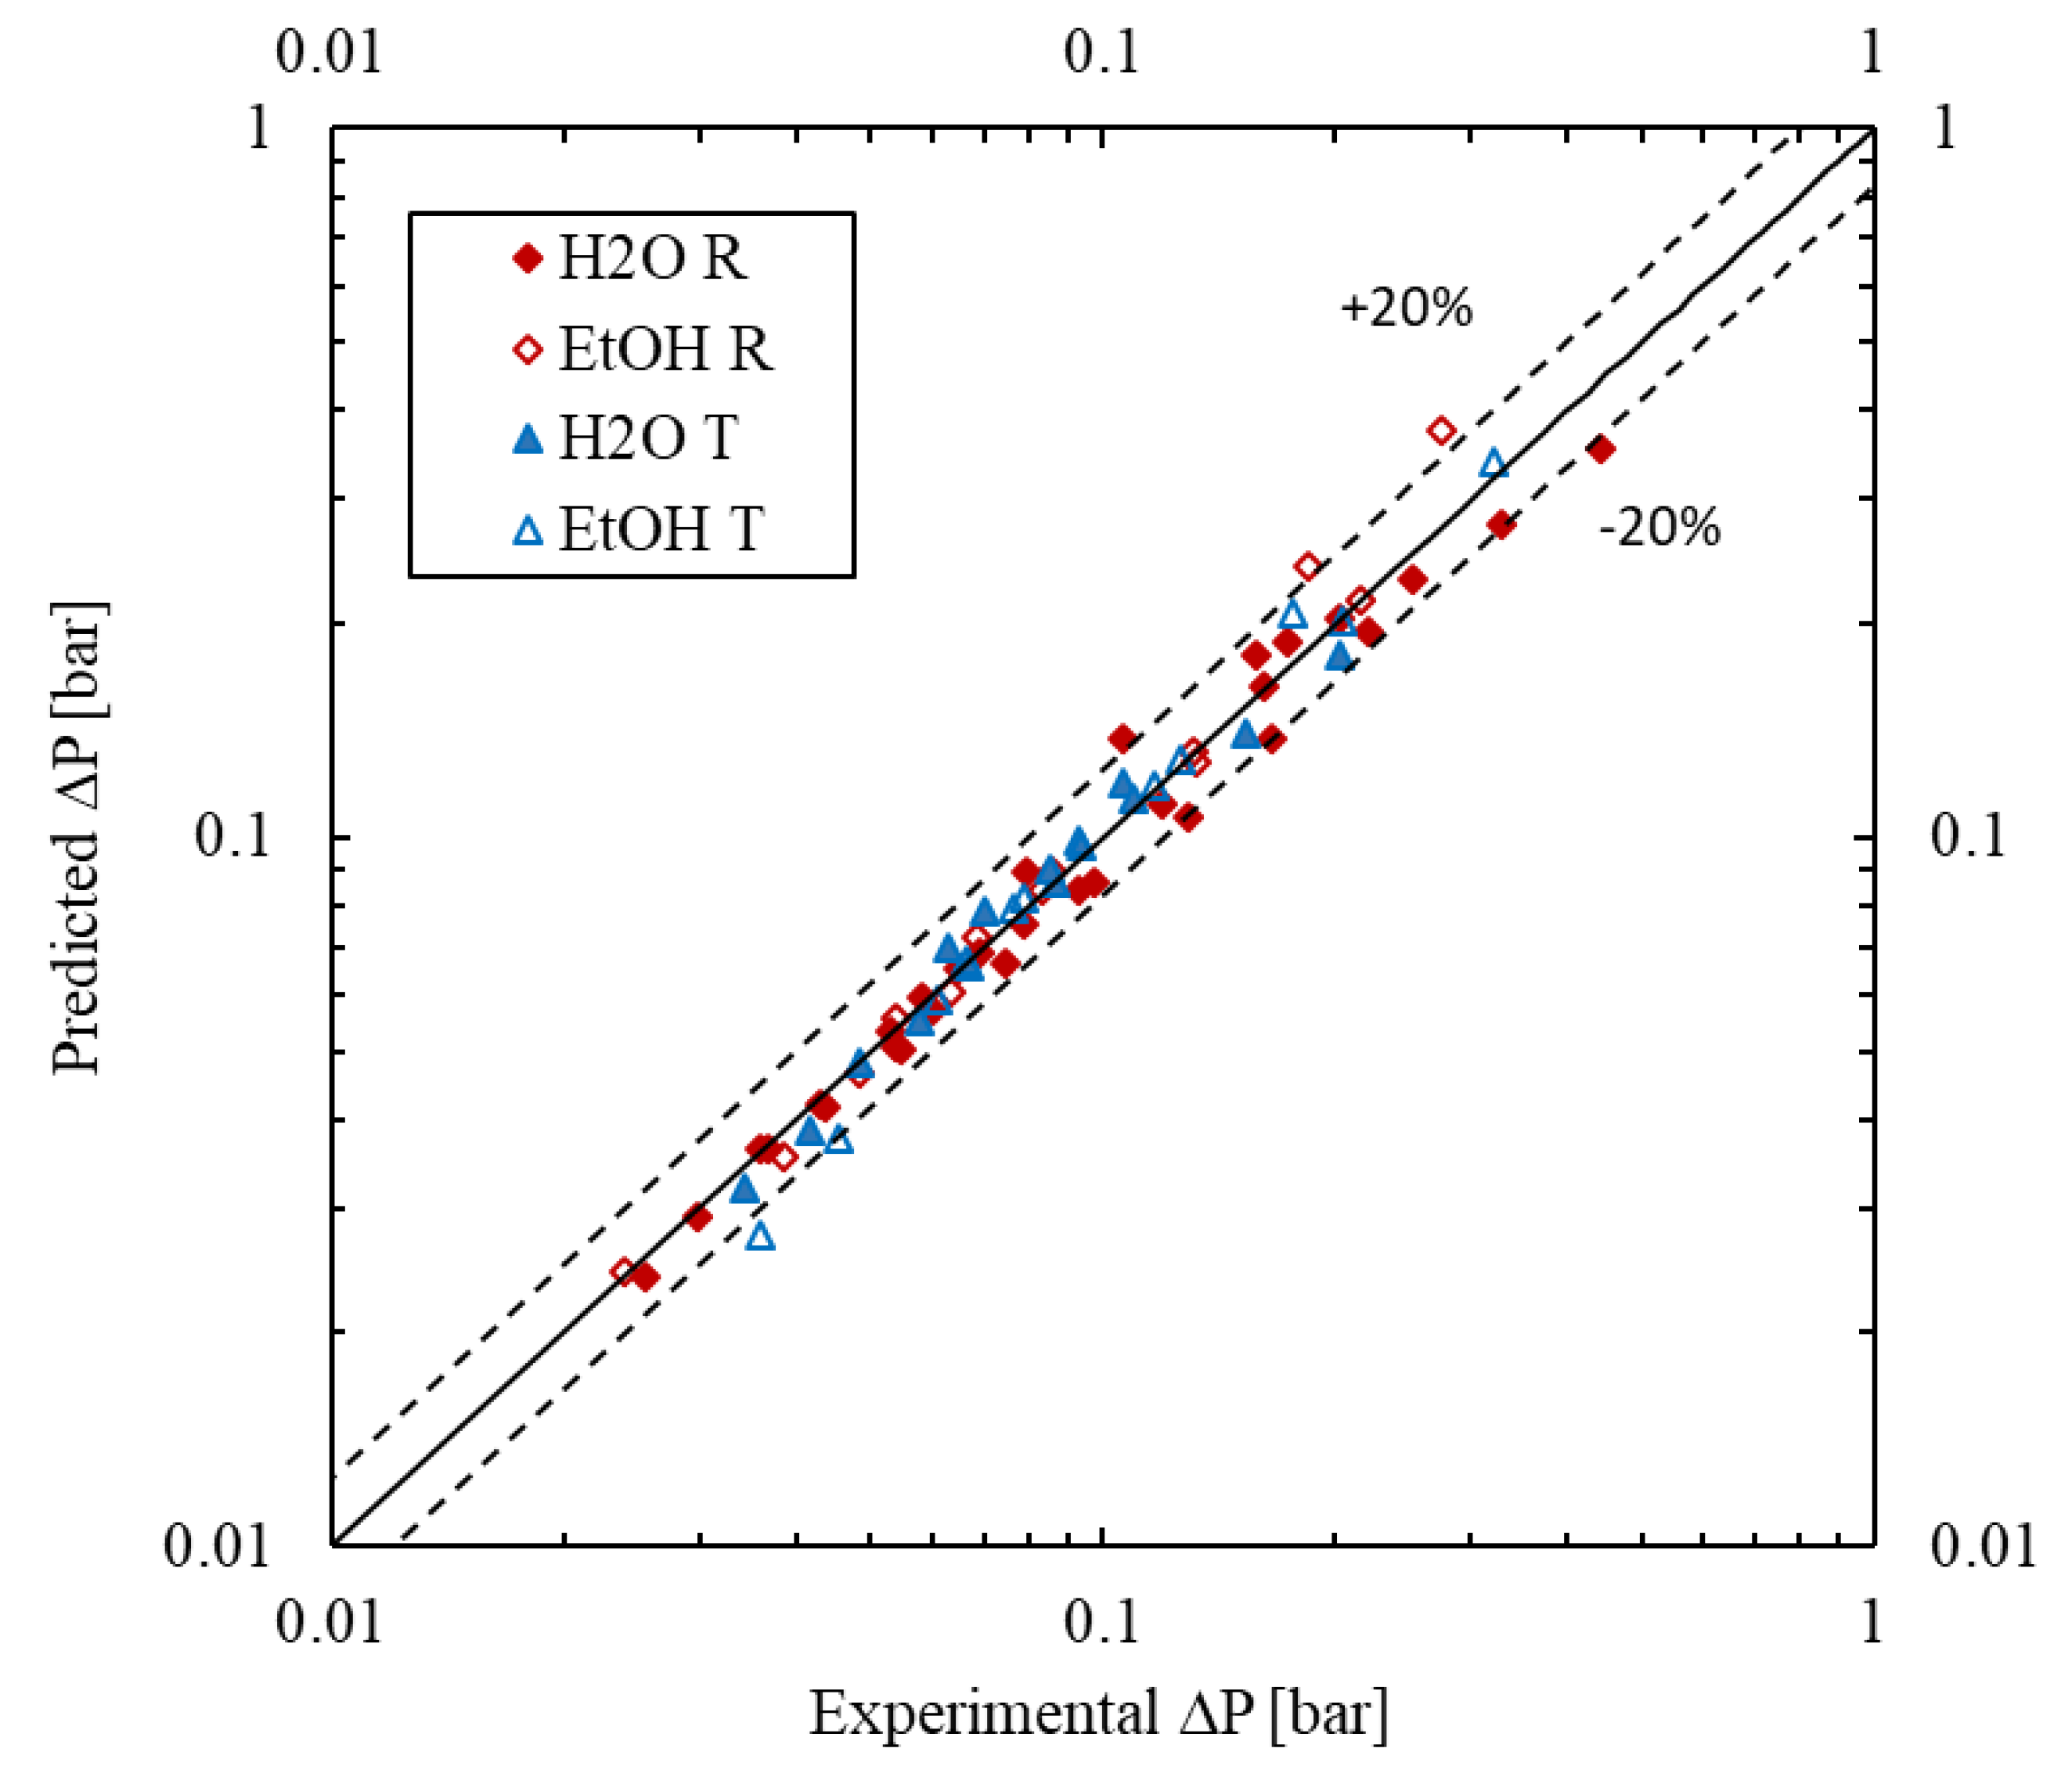
3.2.2. Model
3.3. Volumetric Liquid-Side Mass Transfer Coefficient (kla)
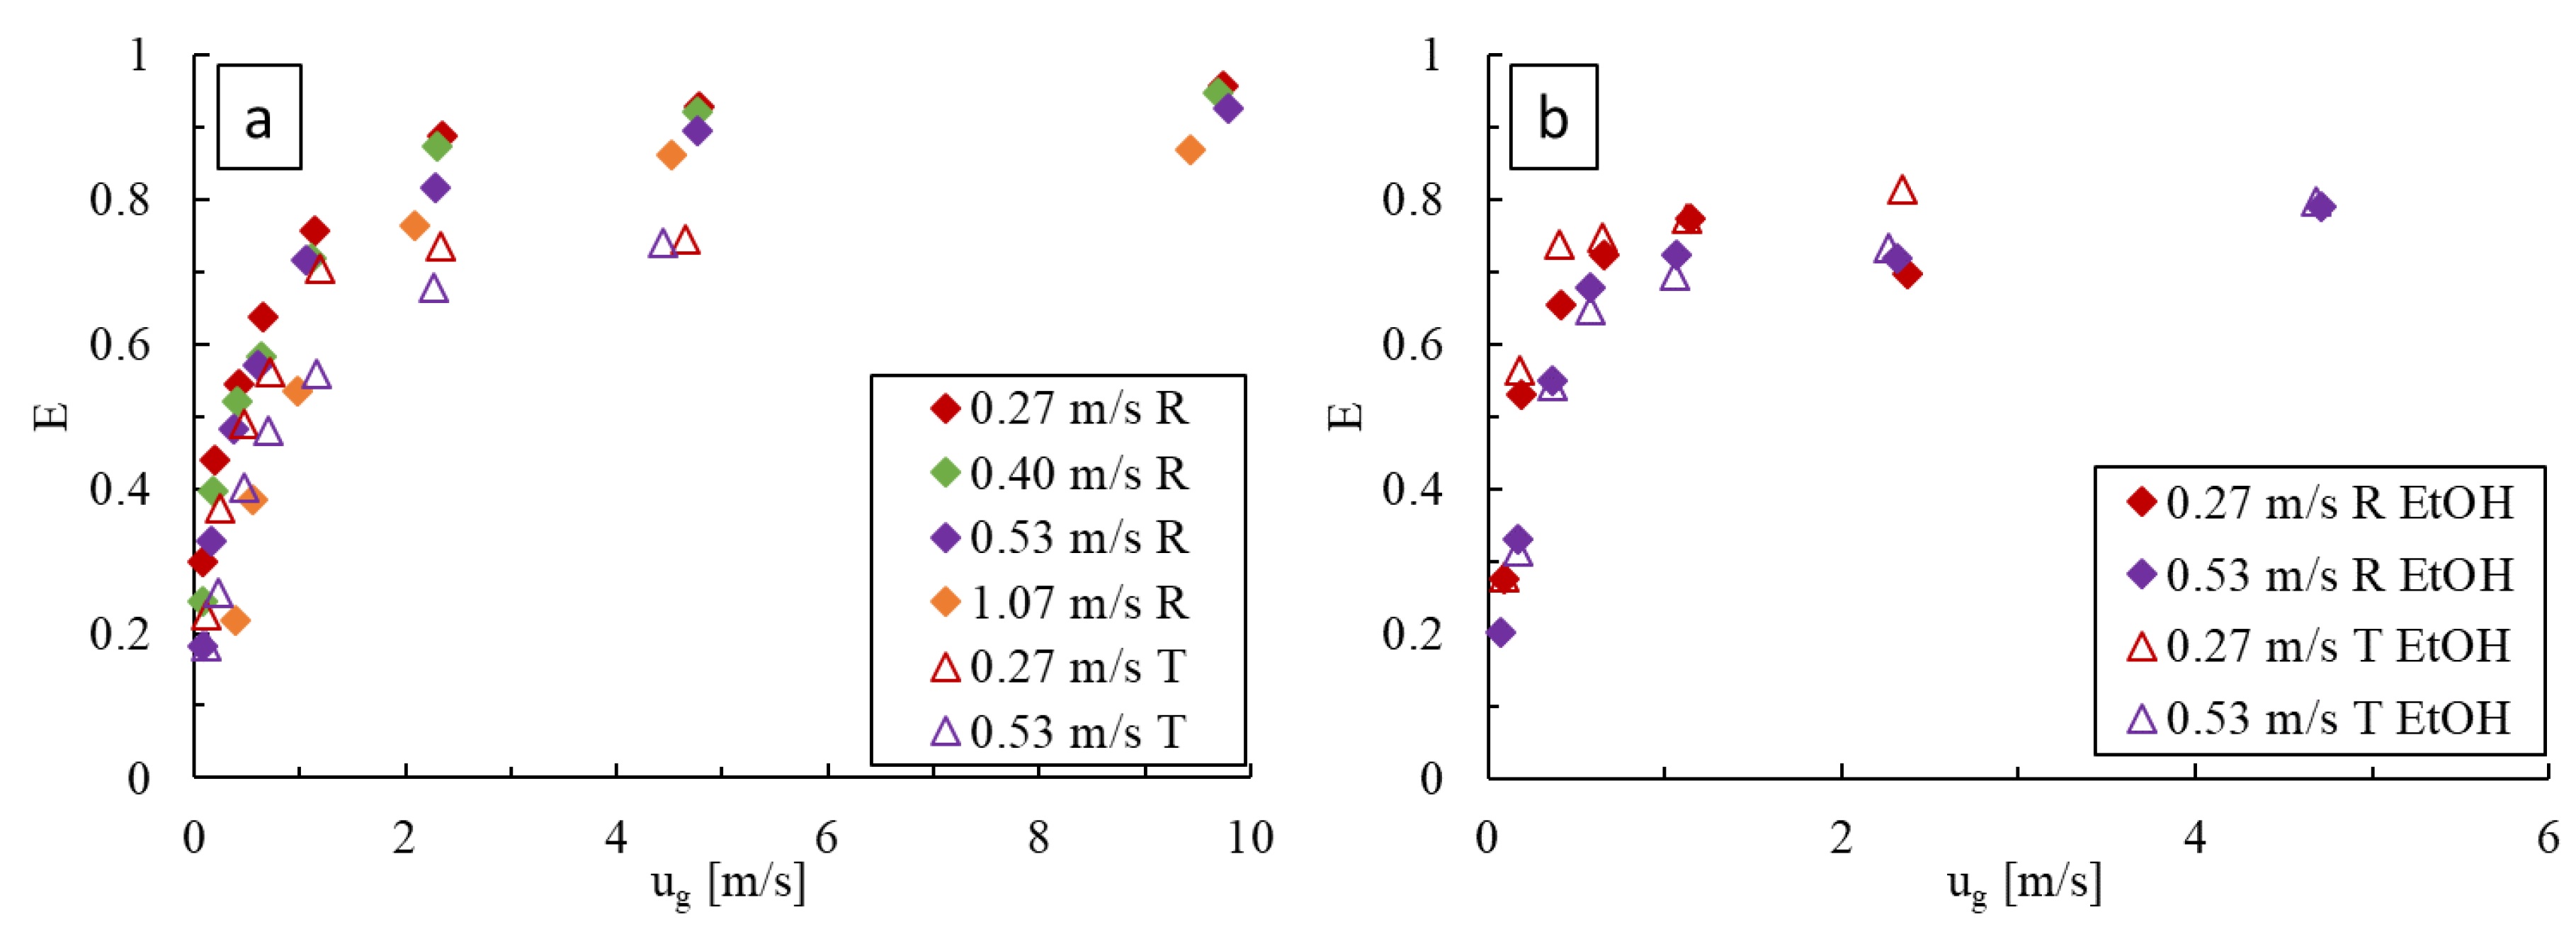
3.3.1. Impact of Operating Conditions
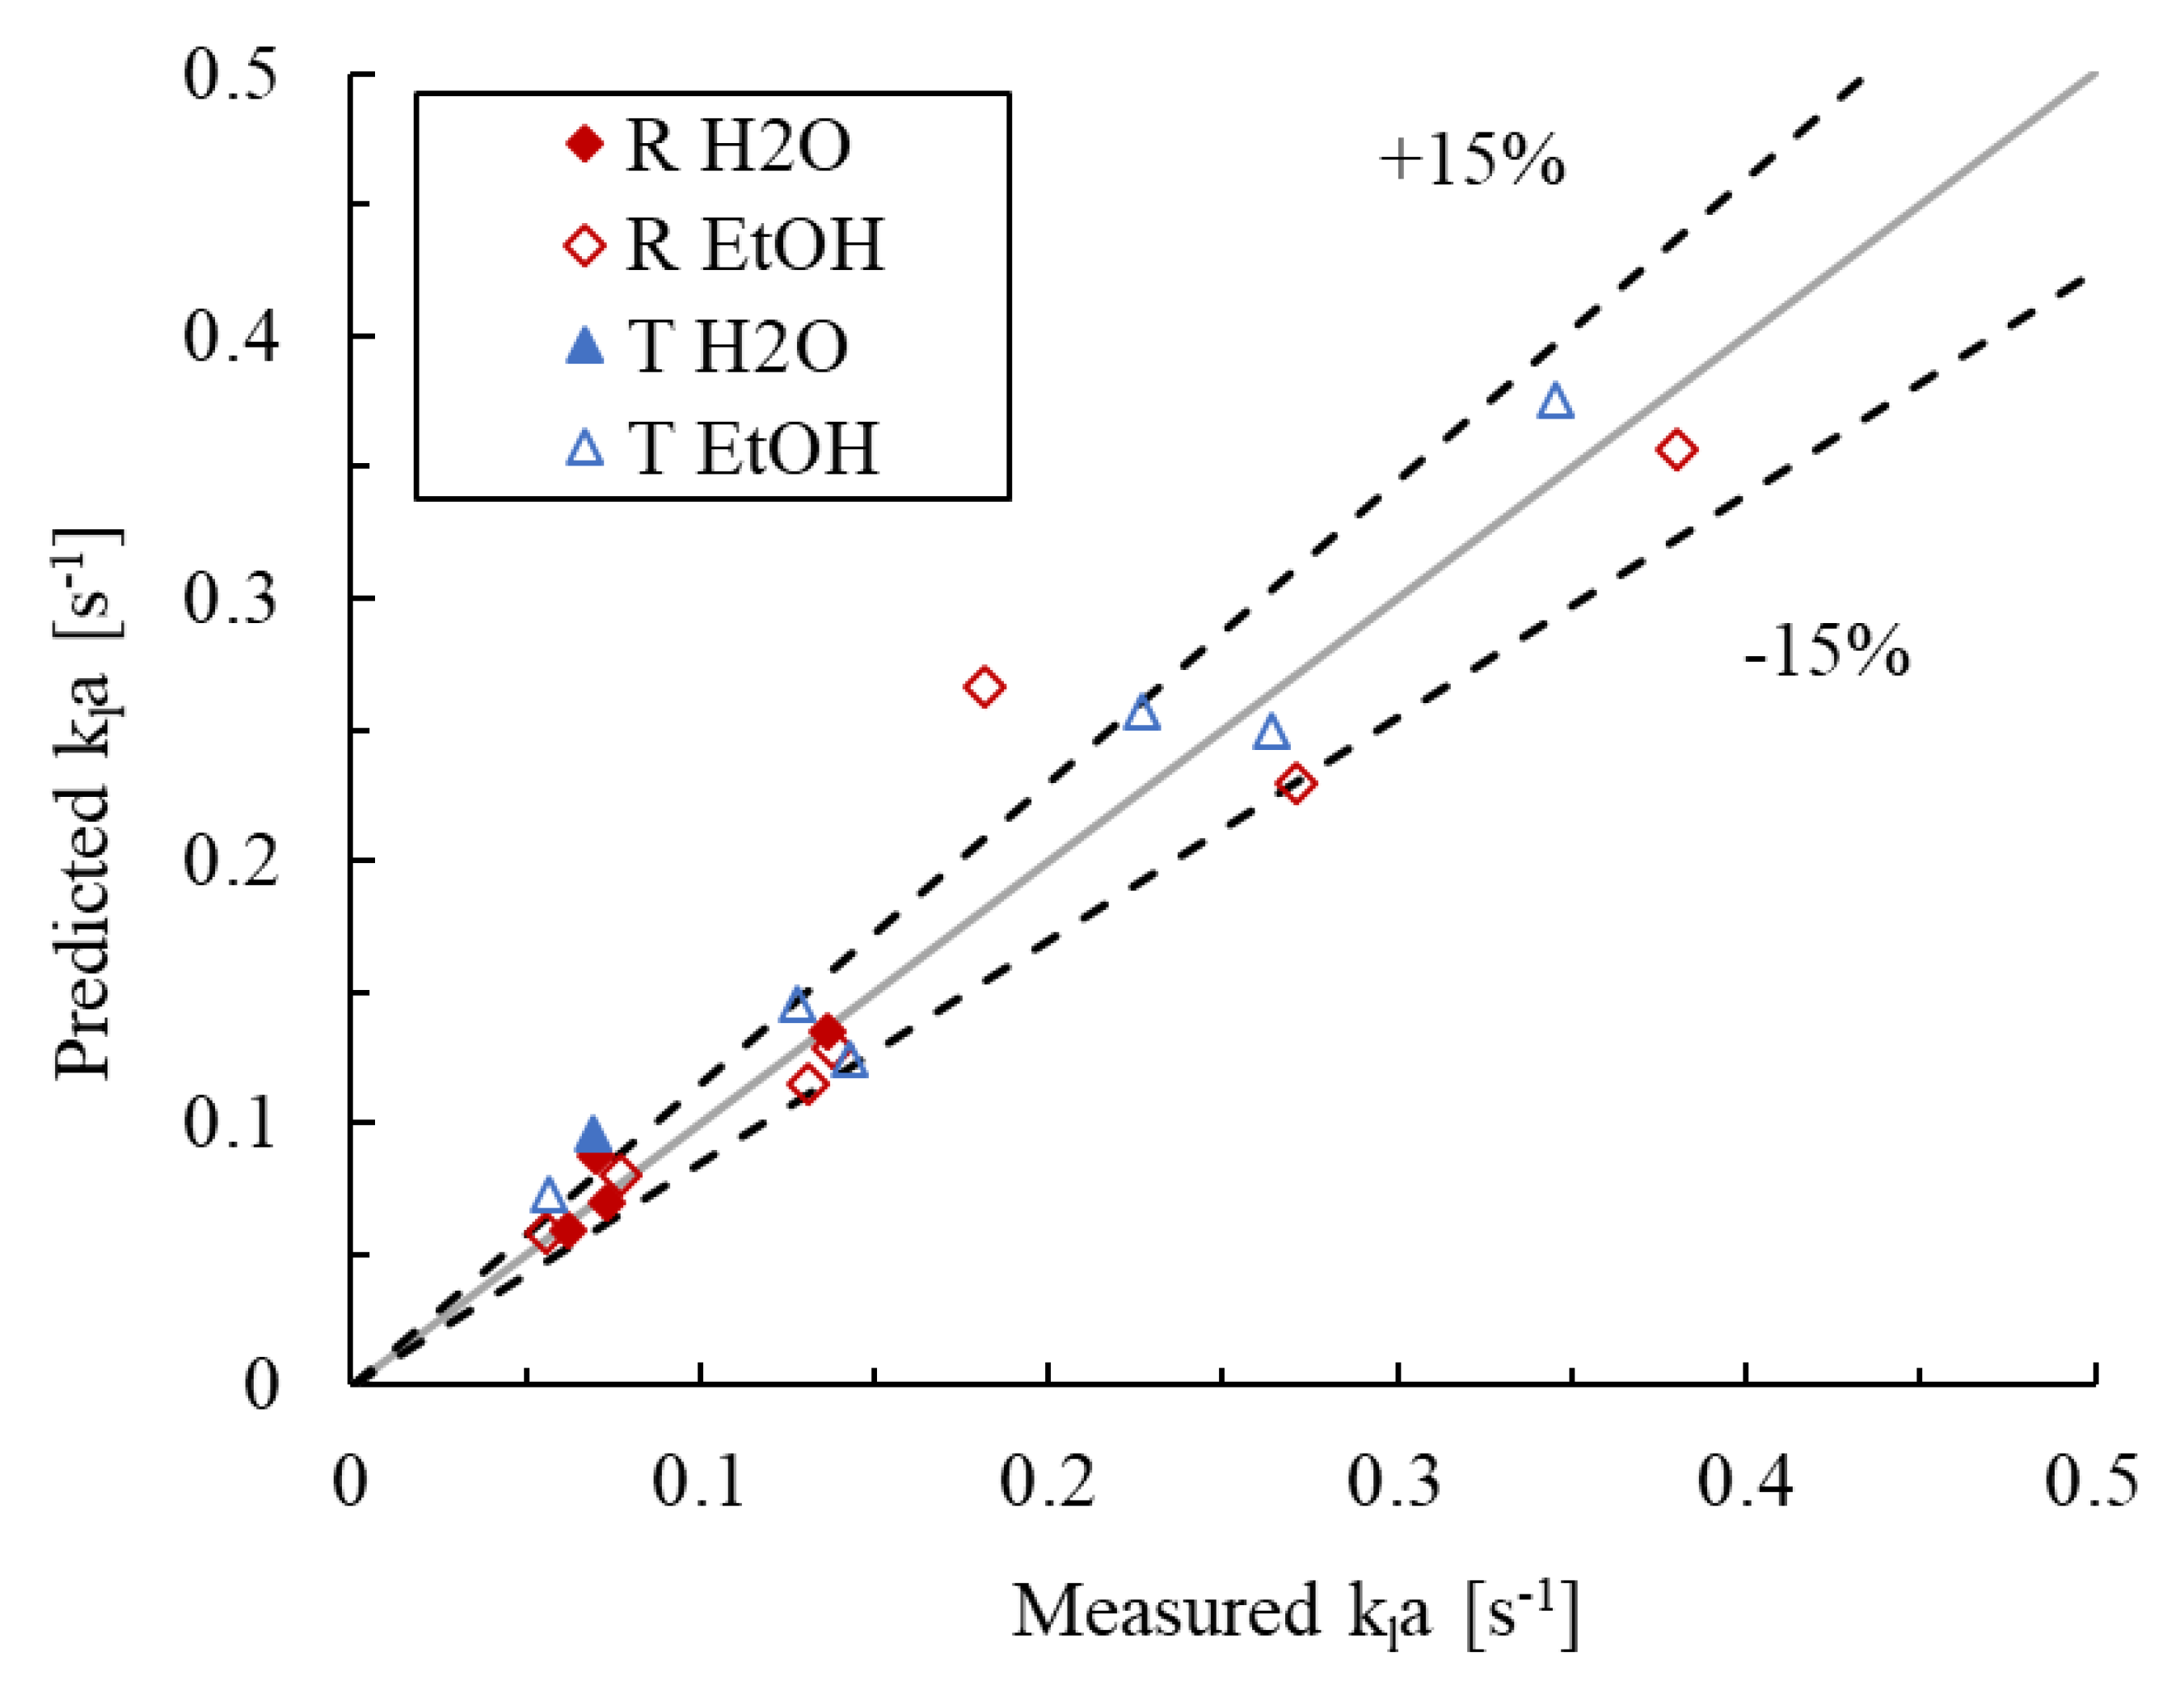
3.3.2. Model
4. Conclusions
Author Contributions
Funding
Acknowledgments
Conflicts of Interest
Abbreviations
| Nomenclature (units): | |
| Bubble interfacial area per unit reactor volume [m2/m3] | |
| AARE | Average absolute relative error [%] |
| c | Parameter in Equation (6) [-] |
| C | Concentration [mol/m3] |
| C* | Equilibrium concentration [mol/m3] |
| Ch | Chisholm parameter [-] |
| dh | Hydraulic diameter of channel [m] |
| E | Extraction efficiency [-] |
| Eo | Eötvös number [-] |
| fl | Liquid phase friction factor [-] |
| flam | Laminar friction factor contribution [-] |
| fturb | Turbulent friction factor contribution [-] |
| Bias factor [-] | |
| g | Gravitational constant [m/s2] |
| He | Henry’s constant [mol/(kg·bar)] |
| Volumetric liquid-side mass transfer coefficient [s−1] | |
| ()L | Length of channel [m] |
| m | Mass flow rate [kg/s] |
| Average absolute relative error [%] | |
| Nmixer | Number of mixers [-] |
| P | Pressure [Pa] |
| ∆P | Pressure drop [Pa] |
| Q | Volumetric flowrate [m3/s] |
| Re | Reynolds number [-] |
| u | Superficial velocity [m/s] |
| VR | Reactor volume [m3] |
| w | Width of channel [m] |
| y | Parameter in Equation (6) [-] |
| Greek Symbols [units] | |
| Fitting parameter [-] | |
| Channel height [m] | |
| Energy dissipation rate [W/kg] | |
| Gas holdup [-] | |
| Density [kg/m3] | |
| ∆ | Difference in density between liquid and gas [kg/m3] |
| Surface tension [N/m] | |
| Two-phase friction multiplier [-] | |
| Martinelli parameter [-] | |
| Indices | |
| g | Gas phase |
| l | Liquid phase |
| t | Total |
| TPF | Two-phase flow |
References
- Gutmann, B.; Cantillo, D.; Kappe, C.O. Continuous-Flow Technology—A Tool for the Safe Manufacturing of Active Pharmaceutical Ingredients. Angew. Chem. Int. Ed. 2015, 54, 6688–6728. [Google Scholar] [CrossRef] [PubMed]
- Doyle, B.J.; Elsner, P.; Gutmann, B.; Hannaerts, O.; Aellig, C.; Macchi, A.; Roberge, D.M. Mini-Monoplant Technology for Pharmaceutical Manufacturing. Org. Process. Res. Dev. 2020, 24, 2169–2182. [Google Scholar] [CrossRef]
- Hessel, V.; Angeli, P.; Gavriilidis, A.; Löwe, H. Gas−Liquid and Gas−Liquid−Solid Microstructured Reactors: Contacting Principles and Applications. Ind. Eng. Chem. Res. 2005, 44, 9750–9769. [Google Scholar] [CrossRef]
- Dencic, I.; Hessel, V. Gas–Liquid Reactions. In Microreactors in Organic Chemistry and Catalysis; Wirth, T., Ed.; Wiley-VCH Verlag GmbH & Co. KGaA: Weinheim, Germany, 2013; pp. 221–288. [Google Scholar]
- Kashid, M.N.; Renken, A.; Kiwi-Minsker, L. Gas–liquid and liquid–liquid mass transfer in microstructured reactors. Chem. Eng. Sci. 2011, 66, 3876–3897. [Google Scholar] [CrossRef]
- Nieves-Remacha, M.J.; Kulkarni, A.A.; Jensen, K.F. Gas-Liquid Flow and Mass Transfer in an Advanced-Flow Reactor. Ind. Eng. Chem. Res. 2013, 52, 8996–9010. [Google Scholar] [CrossRef]
- Nieves-Remacha, M.J.; Jensen, K.F. Mass transfer characteristics of ozonolysis in microreactors and advanced-flow reactors. J. Flow Chem. 2015, 5, 160–165. [Google Scholar] [CrossRef]
- Wu, K.-J.; Nappo, V.; Kuhn, S. Hydrodynamic Study of Single- and Two-Phase Flow in an Advanced-Flow Reactor. Ind. Eng. Chem. Res. 2015, 54, 7554–7564. [Google Scholar] [CrossRef]
- Plouffe, P.; Bittel, M.; Sieber, J.; Roberge, D.M.; Macchi, A. On the scale-up of micro-reactors for liquid—liquid reactions. Chem. Eng. Sci. 2016, 143, 216–225. [Google Scholar] [CrossRef]
- Plouffe, P.; Macchi, A.; Roberge, D.M. From Batch to Continuous Chemical Synthesis–A Toolbox Approach. Org. Process Res. Dev. 2014, 18, 1286–1294. [Google Scholar] [CrossRef]
- Macchi, A.; Plouffe, P.; Patience, G.S.; Roberge, D.M. Experimental Methods in Chemical Engineering: Micro-Reactors. Can. J. Chem. Eng. 2019, 97, 2578–2587. [Google Scholar] [CrossRef]
- Wu, B.; Firouzi, M.; Mitchell, T.; Rufford, T.E.; Leonardi, C.; Towler, B. A critical review of flow maps for gas-liquid flows in vertical pipes and annuli. Chem. Eng. J. 2017, 326, 350–377. [Google Scholar] [CrossRef]
- Ullmann, A.; Brauner, N. The prediction of flow pattern maps in minichannels. Multiph. Sci. Technol. 2007, 19, 49–73. [Google Scholar] [CrossRef]
- Akbar, M.; Plummer, D.; Ghiaasiaan, S. On gas-liquid two-phase flow regimes in microchannels. Int. J. Multiph. Flow 2003, 29, 855–865. [Google Scholar] [CrossRef]
- Chinnov, E.; Ron’shin, F.; Kabov, O. Regimes of two-phase flow in micro- and minichannels (review). Thermophys. Aeromech. 2015, 22, 265–284. [Google Scholar] [CrossRef]
- Yue, J.; Chen, G.; Yuan, Q.; Luo, L.; Gonthier, Y. Hydrodynamics and mass transfer characteristics in gas–liquid flow through a rectangular microchannel. Chem. Eng. Sci. 2007, 62, 2096–2108. [Google Scholar] [CrossRef]
- Mielke, E.; Roberge, D.M.; Macchi, A. Microreactor Mixing-Unit Design for Fast Liquid-Liquid Reactions. J. Flow Chem. 2016, 6, 279–287. [Google Scholar] [CrossRef]
- Mielke, E.; Plouffe, P.; Mongeon, S.S.; Aellig, C.; Filliger, S.; Macchi, A.; Roberge, D.M. Micro-reactor mixing unit interspacing for fast liquid-liquid reactions leading to a generalized scale-up methodology. Chem. Eng. J. 2018, 352, 682–694. [Google Scholar] [CrossRef]
- Dargar, P.; Macchi, A. Effect of surface-active agents on the phase holdups of three-phase fluidized beds. Chem. Eng. Process. Process Intensif. 2006, 45, 764–772. [Google Scholar] [CrossRef]
- Song, S.; Peng, C. Viscosities of Binary and Ternary Mixtures of Water, Alcohol, Acetone, and Hexane. J. Dispers. Sci. Technol. 2008, 29, 1367–1372. [Google Scholar] [CrossRef]
- Benedetti-Pichler, A.A.; Cefola, M.; Waldman, B. Warder’s method for the titration of carbonates. Ind. Eng. Chem. Ed. 1939, 11, 327–332. [Google Scholar] [CrossRef]
- Triplett, K.A.; Ghiaasiaan, S.M.; Abdel-Khalik, S.I.; Sadowski, D.L. Gas-liquid two-phase flow in microchannels—Part I: Two-phase flow patterns. Int. J. Multiph. Flow 1999, 25, 377–394. [Google Scholar] [CrossRef]
- Balasubramaniam, R.; Ramé, E.; Kizito, J.; Kassemi, M. Two Phase Flow Modeling: Summary of Flow Regimes and Pressure Drop Correlations in Reduced and Partial Gravity; National Aeronautics and Space Administration: Cleveland, OH, USA, 2006. [Google Scholar]
- Ju Lee, H.; Yong Lee, S. Pressure drop correlations for two-phase flow within horizontal rectangular channels with small heights. Int. J. Multiph. Flow 2001, 27, 783–796. [Google Scholar] [CrossRef]
- Hebrard, G.; Zeng, J.; Loubiere, K. Effect of surfactants on liquid side mass transfer coefficients: A new insight. Chem. Eng. J. 2009, 148, 132–138. [Google Scholar] [CrossRef]
- Kawase, Y.; Moo-Young, M. Mathematical models for design of bioreactors: Applications of: Kolmogoroff’s theory of isotropic turbulence. Chem. Eng. J. 1990, 43, B19–B41. [Google Scholar] [CrossRef]


| Geometry | c | y |
|---|---|---|
| LL-Rhombus | 3.68 ± 0.76 | 0.18 ± 0.035 |
| LL-Triangle | 5.01 ± 0.23 | 0.18 ± 0.008 |
| Continuous Phase | Geometry | β0 | β1 | β2 |
|---|---|---|---|---|
| Water | Rhombus & Triangle | 10,497 ± 4758 | 1.02 ± 0.070 | 0.58 ± 0.033 |
| 0.5 wt% aqueous ethanol | Rhombus | 68,721 ± 42,191 | 1.28 ± 0.10 | 0.16 ± 0.062 |
| Triangle | 51,761 ± 27,724 | 1.29 ± 0.091 | 0.20 ± 0.052 |
| Parameter | β3 | β4 | β5 |
|---|---|---|---|
| Value | 0.124 ± 0.022 | 0.55 ± 0.12 | 0.41 ± 0.11 |
Publisher’s Note: MDPI stays neutral with regard to jurisdictional claims in published maps and institutional affiliations. |
© 2020 by the authors. Licensee MDPI, Basel, Switzerland. This article is an open access article distributed under the terms and conditions of the Creative Commons Attribution (CC BY) license (http://creativecommons.org/licenses/by/4.0/).
Share and Cite
Doyle, B.J.; Morin, F.; Haelssig, J.B.; Roberge, D.M.; Macchi, A. Gas-Liquid Flow and Interphase Mass Transfer in LL Microreactors. Fluids 2020, 5, 223. https://doi.org/10.3390/fluids5040223
Doyle BJ, Morin F, Haelssig JB, Roberge DM, Macchi A. Gas-Liquid Flow and Interphase Mass Transfer in LL Microreactors. Fluids. 2020; 5(4):223. https://doi.org/10.3390/fluids5040223
Chicago/Turabian StyleDoyle, Brendon J., Frederic Morin, Jan B. Haelssig, Dominique M. Roberge, and Arturo Macchi. 2020. "Gas-Liquid Flow and Interphase Mass Transfer in LL Microreactors" Fluids 5, no. 4: 223. https://doi.org/10.3390/fluids5040223
APA StyleDoyle, B. J., Morin, F., Haelssig, J. B., Roberge, D. M., & Macchi, A. (2020). Gas-Liquid Flow and Interphase Mass Transfer in LL Microreactors. Fluids, 5(4), 223. https://doi.org/10.3390/fluids5040223