Article

Analysis of Hydraulic Mixing Efficiency in Widespread Models of Micromixers

by
Andrey V. Minakov
1,2,*,
Alexander S. Lobasov
1,2,
Anna A. Shebeleva
1 and
Alexander V. Shebelev
1,2
1
Department of Thermophysics, Siberian Federal University, 660041 Krasnoyarsk, Russia
2
Kutateladze Institute of Thermophysics, SB RAS, 630090 Novosibirsk, Russia
*
Author to whom correspondence should be addressed.
Fluids 2020, 5(4), 211; https://doi.org/10.3390/fluids5040211
Submission received: 25 October 2020 / Revised: 15 November 2020 / Accepted: 17 November 2020 / Published: 18 November 2020
(This article belongs to the Special Issue Recent Advances in Single and Multiphase Flows in Microchannels)

Abstract

:
In this paper, we present the results of a systematic numerical study of the flow and mixing modes of fluids in micromixers of various configurations, in particular, an analysis of passive micromixers, the most widely used in practice, as well as the main methods to intensify mixing. The advantages of microstructure reactors can significantly reduce reaction times and increase productivity compared to traditional bulk reactors. Four different geometries of micromixers, including the straight T-shaped microchannel, were considered. The effect of the geometrical patterns of micromixers, as well as of the Reynolds number on flow regimes and mixing efficiency were analyzed. The Reynolds number varied from 1 to 300. Unlike other studies, the efficiency of the considered mixers was for the first time compared with the cost of pressure loss during pumping. As a result, the efficiency of the most optimal micromixer in terms of hydraulic mixing and the optimal operation ranges were determined. It was shown that the maximum normalized mixing efficiency in the entire range of Re numbers was noted for mixer, in which a vortex-based intensification of mixing occurs due to the flow swirling in cylindrical chambers. This mixer allows mixing the fluids 600 times more efficiently than a straight T-mixer, while all other conditions being equal.

Graphical Abstract

1. Introduction

Currently, much attention is paid to energy efficiency and energy conservation issues. Miniaturization of devices and processes is being actively promoted in various applications, such as the aerospace industry, transportation industry, and energy. In this regard, capillary hydrodynamics and heat exchange in microsystems becomes of particular interest and consideration. The development of micro- and nanotechnologies and their implementation in various branches of human activity results in the emerging of scientific problems related to fluid flow in micro- and nanochannels [1,2,3,4,5,6,7,8,9,10]. Microchannels with a typical diameter of about 100 microns are widely used in various applications. They are employed for nanoparticle transport, cooling microchips, chemical microreactors, and other applications. Thus, a fundamentally new type of devices and technologies, used in many industries, namely microsystems technology, has emerged in contemporary science and engineering. The use of microfluidic systems, in particular, microreactors, will lead to a significant improvement in the performance and efficiency of various processes in physical, chemical, and biological laboratories. The speed and accuracy of changing reaction parameters make microreactor systems an ideal tool for efficient and fast optimization of chemical reactions. Full automation of such systems, associated with the use of integrated analytical instruments in real-time mode, allows obtaining complete information on optimal parameters in a matter of hours, even for complex multi-stage reactions. The advantages of microstructure reactors can significantly reduce reaction times and increase productivity compared to traditional bulk reactors [1,2,3,4,5,6,7,8,9,10].
This leads to a large amount of fundamental research on this topic. Here, first of all, it is necessary to note a large number of works related to the study of flow regimes in micromixers—special microchannels used to intensify the mixing of fluids. The mixing is a basic process in most microfluidic devices (chemical microreactors, analyzers of chemical and biological substances, drug delivery systems, etc.). Increasing the efficiency of fluids mixing in microchannels is important from a practical point of view [11,12,13,14,15].
Currently, among the various forms of micromixers, the most common are T-type mixers, consisting of inlet channels that receive fluids, and an outlet channel (mixing channel). The first studies of the fluids mixing process in a T-shaped microchannel were reported in the work of Bökenkamp et al., published in 1998 [16]. For the first time, it was shown experimentally that effective mixing of fluids was observed in a T-shaped micromixer at certain flow rates at the mixer inlet. Numerical simulation of mixing for that channel for small Reynolds numbers was performed in 2001 by Goddy et al. [17], who studied the effect of the cross-section dimensions of the channel, as well as the angle of the mixer inlet sections and the mixing channel on the mixing length. Engler et al. undertook a more detailed study of this effect in 2004 [18]. It was found that for a channel with dimensions of 600 × 300 × 300 microns, the critical Reynolds number was about 150, and the critical Reynolds number strongly depended on the channel size. The mixing efficiency (ME) in such mode was calculated using numerical simulation that allowed also presenting the flow structure. In the work of Telib et al. [19], conducted in 2004, transient flow modes (Re = 300–700) in a T-shaped macrochannel were studied using direct numerical simulation (DNS). The flow structure was shown employing the velocity magnitude isosurfaces. In this paper, mixing was not considered. In experimental and numerical studies [18,20,21,22,23,24,25], the operating regimes of micromixers were studied depending on the Reynolds number. It was determined that at incredibly low Reynolds numbers, the two flows, coming from the inlet channels, remain completely separated even in the outlet channel (stratified flow), and mixing occurs only due to diffusion. As the Reynolds number increases, a second (vortex) mode begins to appear, in which the secondary flow in the outlet channel forms double pairs of vortices with opposite rotation directions. For large Reynolds numbers, an organized and steady-state pattern of vortex structures is observed (the engulfment flow regime), in which the flow symmetry is broken, and elements of one fluid flow reach the opposite side of the mixing channel, which leads to a significant increase in the mixing efficiency compared to previous modes. With further growth in the Reynolds number, the flow becomes unsteady. The critical Reynolds numbers corresponding to the beginning of different modes can change depending on the configuration and flow parameters, such as the conditions at the inlet to the micromixer or the shape of the channel cross-section [22]. Among the detected flow modes, the steady-state and engulfment modes are the most interesting for application, since they lead to effective mixing inside the device. Some studies show the effects of density [23] and viscosity [24] on the mixing efficiency of the micromixer. In contrast to most studies, the paper [25] shows the effect of geometric dimensions on the efficiency of fluids mixing and the pressure drop (PD), as well as determines the optimal operating modes of the T-shaped micromixer.
Recently, various ways to improve mixing performance have been considered, including using mixers with complex geometric shapes [11,12,13,14,15,26,27,28,29,30,31,32,33,34,35], e.g., multi-objective shape optimization of a micromixer with staggered herringbone grooves on the top and bottom walls has been performed in the work of Hossain et al. [30]. In [35], the influence of the anode bed geometry on the hydraulic behavior of PEM (proton-exchange membrane or polymer-electrolyte membrane) fuel cells is assessed. It was shown that the flow rate non-uniformity and the pressure drop in bed channels, as well as the residence time increase as the flow Reynolds number increases. At the same time, despite all the variety of passive mixers, the most widespread are micromixers that implement the following principles to intensify mixing: diffusion (mixing in long channels), alternate split and recombine of the flow, chaotic advection, and vortex mixing (Dean vortices, etc.). Currently, a large number of studies have been conducted for each type of mixer. However, in most of the previously performed works, the goal was to obtain only the maximum mixing efficiency. The issues of energy consumption for mixing and pumping fluids in micromixers were practically not considered. However, to talk about the optimal operation mode of the mixer, it is necessary to consider not only the mixing efficiency in the mixer but also the energy consumption when pumping the fluid through this mixer. Effective mixers and operation modes can be called those, in which the increase in mixing efficiency (ME) is higher than the increase in pressure drop (PD) under the same conditions. The present paper deals with the systematic study of flow modes and analysis of the hydraulic efficiency of mixing in the most common types of micromixers.

2. Mathematical Model and Numerical Computation Method

A numerical simulation is a powerful tool that allows understanding the main processes that occur inside microreactors, as well as obtaining optimal parameters that can be used to improve the process efficiency. Computational fluid dynamics (CFD) is used as the main approach when solving this problem. In this approach, microflows were simulated by solving a system of Navier–Stokes equations:
ρ t + ( ρ   v ) = 0 ,
ρ   v t + ( ρ   v v ) = P + T ,
where v is the mixture velocity vector, P is the pressure, ρ is the mixture density, T is the stress tensor:
T i j = μ ( u j x i + u i x j ) ,
where ui are components of the velocity vector, μ is the viscosity coefficient.
In this case, the density and viscosity of the mixture included in the Navier–Stokes equations are determined as follows:
μ = f   μ 1 + ( 1 f )   μ 2 1 ρ = f ρ 1 + ( 1 f ) ρ 2 ,
where, ρ1, μ1 are density and viscosity of first fluid, ρ2, μ2 are density and viscosity of second fluid.
The mass of mixture fraction conservation equation, in this case, has a standard form:
ρ   f t + ( ρ   f v ) = ( ρ   D f ) ,
where f is mixture fraction, D is the diffusion coefficient.
The numeric technique used in this paper and the results of its testing are described in detail in the papers [23,24,25]. To solve the system of nonlinear differential Equations (1)–(5), we used the finite-volume method (FVM) [36,37]. The coupled between the velocity and pressure fields is realized using the SIMPLEC (Semi-Implicit Method for Pressure Linked Equations-Consistent) algorithm. The PRESTO (PREssure STaggering Option) scheme for calculation continuity balance was used. A second-order upwind-difference scheme was used to approximate the convective terms of the Navier–Stokes equations. A total variation diminishing (TVD) scheme with a compressive limiter was used to solve the transport Equation (5).
In the present paper, we studied the flow structure and the mixing efficiency of fluids for several most common types of micromixers. The 3D geometries of these mixers are shown in Figure 1. First, the case of mixing in a basic T-shaped mixer was considered in detail (Figure 1a). The performance characteristics of other mixers were compared with the performance of the basic mixer. In other mixers, various principles of mixing intensification were implemented. Mixer No. 2 implements the principle of split and recombine of the flow, mixer No. 3 implements chaotic advection, while mixer No. 4 implements vortex mixing. Each of these mixers configurations consists of a set of separate mixing chambers. To improve mixing, the number of mixing chambers was increased. The mixers with similar geometries [38,39,40] were investigated before by different research teams, but in this paper, for the first time, we investigated the effect of the different number of mixing chambers of such mixers. In the mixers used in practice, the number of such chambers can be more than 10. Naturally, it increases the pressure loss when pumping the mixture through such a mixer. Accordingly, the optimization problem arises. When designing the geometric configuration of the considered mixers, the same inlet part and dimensions of the mixing channel were set. This made it possible to compare the efficiency of various mixers with each other at the same inlet conditions.
The problem was stated as follows. Clean water and water tinted with dye were supplied into the mixer. The properties of both fluids were the same. The fluid density was 1000 kg/m3, the viscosity coefficient was 0.001 Pa×s, the dye diffusion coefficient was constant and was equal to D = 2.63 × 10⁻¹⁰ m2/s. Such a diffusion coefficient corresponds to the experimentally measured one of rhodamine in water. The dye was considered as a passive scalar, and its presence did not affect the fluid flow patterns.
A constant flow rate of fluid (Qin) with a developed velocity profile was set at the inlet of the channels. The “free exit” boundary conditions were set on the outlet of the computational domain. The summary of the boundary conditions for all cases is shown in Table 1.
The change of flow regimes in this microchannel was described by the value of the Reynolds number, which is defined as: Re = Q d h μ w h , were dh = 267 μm is the hydraulic diameter, Q = 2Qin is the mean mass flow rate in the mixing channel, w and h are the width and the height of the mixing channel, respectively. In calculations, the Reynolds number ranged widely from 1 to 300. Such high Reynolds numbers are not typical for microchannels, however, currently, there are many applications, in which flow modes are implemented at so large Re. Besides, as shown by the research results, several interesting new phenomena, both from a fundamental scientific standpoint and in terms of practical applications, were revealed in microchannels at relatively high Reynolds numbers. Uniform Cartesian grids were used for numerical computations. The grid step for all configurations was the same and equal to 5 × 10⁻⁶ m. Conducted methodological computations have shown that such grid refinement was sufficient to obtain a grid-independent solution.
During the conducted computations, the PD and the ME were calculated. To quantify the mixing efficiency, the parameter M = 1 − (σ/σ0)0.5 was used [20,21,22,23,24,25,41,42], where σ = V 1 V ( f f ) 2 d V is the standard deviation; f = 0.5 is the average value of mixing fraction; σ 0 = f ( 1 f ) = 0.25 is the maximum value of standard deviation; V is the volume of the calculated domain.

3. Results

3.1. Flow Analysis in a Basic T Micromixer

The flow and mixing modes in a T-type micromixer are studied in detail in [22,23,24,25,41,42]. Here we will briefly describe the flow modes in this mixer.
The following modes were revealed as a consequence of the conducted research. For the Reynolds number equal to ~1, a creeping stratified flow was observed with a rather weak mixing of the dye (Figure 2a).
As the Reynolds number increases, a pair of symmetrical horseshoe-shaped vortices forms in the mixer, which appears at the left end wall of the mixer, and propagates into the mixing channel. These vortices can be seen in Figure 3a. Here and further, the vortex structure of flows is visualized using isosurfaces of the normalized Q-criterion value.
These vortices gradually fade in the mixing channel. Horseshoe-shaped vortices appear due to the development of secondary flows under the action of the rotational force associated with the flow rotation. Such vortices are called Dean vortices. Each such horseshoe vortex, being within the same fluid, does not cross the interface of mixing fluids. Therefore, the interface between the fluids remains almost flat.
Further increasing the Re number results in an interesting rearrangement of the flow regime can be observed. Beginning from the Re equal approximately to 145, due to the development of the Taylor–Gertler instability, a pair of horseshoe-shaped vortices unfolds at an angle about 30° to the central longitudinal plane of the mixer. Because of this flow overturning, one branch of the horseshoe vortex gradually fades, while the intensity of the other increases. As a result, two intense vortices with the same swirl are formed in the mixing channel (Figure 3b). The flow in this regime is stationary. The swirling flow in the mixing channel leads to the formation of the S-shaped mixture structure (Figure 2b). The contact surface of mixing fluids in such an S-shaped structure is much extended. For this reason, the ME increases significantly (see Figure 4a) at the transition from symmetric (Re <145) to asymmetric or engulfment flow regime (Re >145). It is revealed that such restructuring of the flow regime practically does not affect the pressure loss (Figure 4b).
Without undergoing significant changes, the described above vortex structure of the steady-state flow exists within the range of Re numbers from 145 to about 240. For higher values of Re, the flow becomes unsteady. It can be considered periodic within the range of Re from 240 to 400. The transition from engulfment to unsteady flow mode (at Re > 250) leads to an increase in the ME up to M = 17% (Figure 4a).
The turbulent flow mode in the T-microchannel begins manifesting at Re > 400. The S-shaped vortex structures are destroyed, which is why the mixing efficiency is somewhat reduced. It is shown that turbulent flow pulsations are maximal near the inlet to the mixing chamber at the confluence of the flow. Moving along the mixing channel, the pulsations decay. This is illustrated in Figure 5.
There are a large number of experimental studies of fluids mixing in T-shaped microchannels, in which the appearance of S-shaped vortices was recorded [41,42]. A comparison of these results with calculations was carried out in our previous works many times [24,25,42]. A comprehensive and complex comparison of the flow and mixing of two fluids in a T-shaped microchannel was carried out in [42]; below we give only a brief excerpt from this work. A qualitative and quantitative comparison of the calculated and experimental data [42] is presented in Figure 6a, which shows a comparison of the calculated and experimentally measured [42] (using micro Laser-Induced Fluorescence (μ-LIF) technique) concentration field C, normalized to the maximum concentration Cmax in the mixing channel for a Reynolds number of 30. In addition, Figure 6b shows a comparison of the calculated and experimentally measured [42] (using micro Particle Image Velocimetry (μ-PIV) technique) velocity profiles in the transverse plane of the mixing channel at a distance of 2.5 calibers from the entrance to this channel. In all cases, the experimental data are in good agreement with the numerical ones; the maximum deviation does not exceed 10%, which grows with an increase in the Reynolds number due to the significant three-dimensionality of the flow structure.

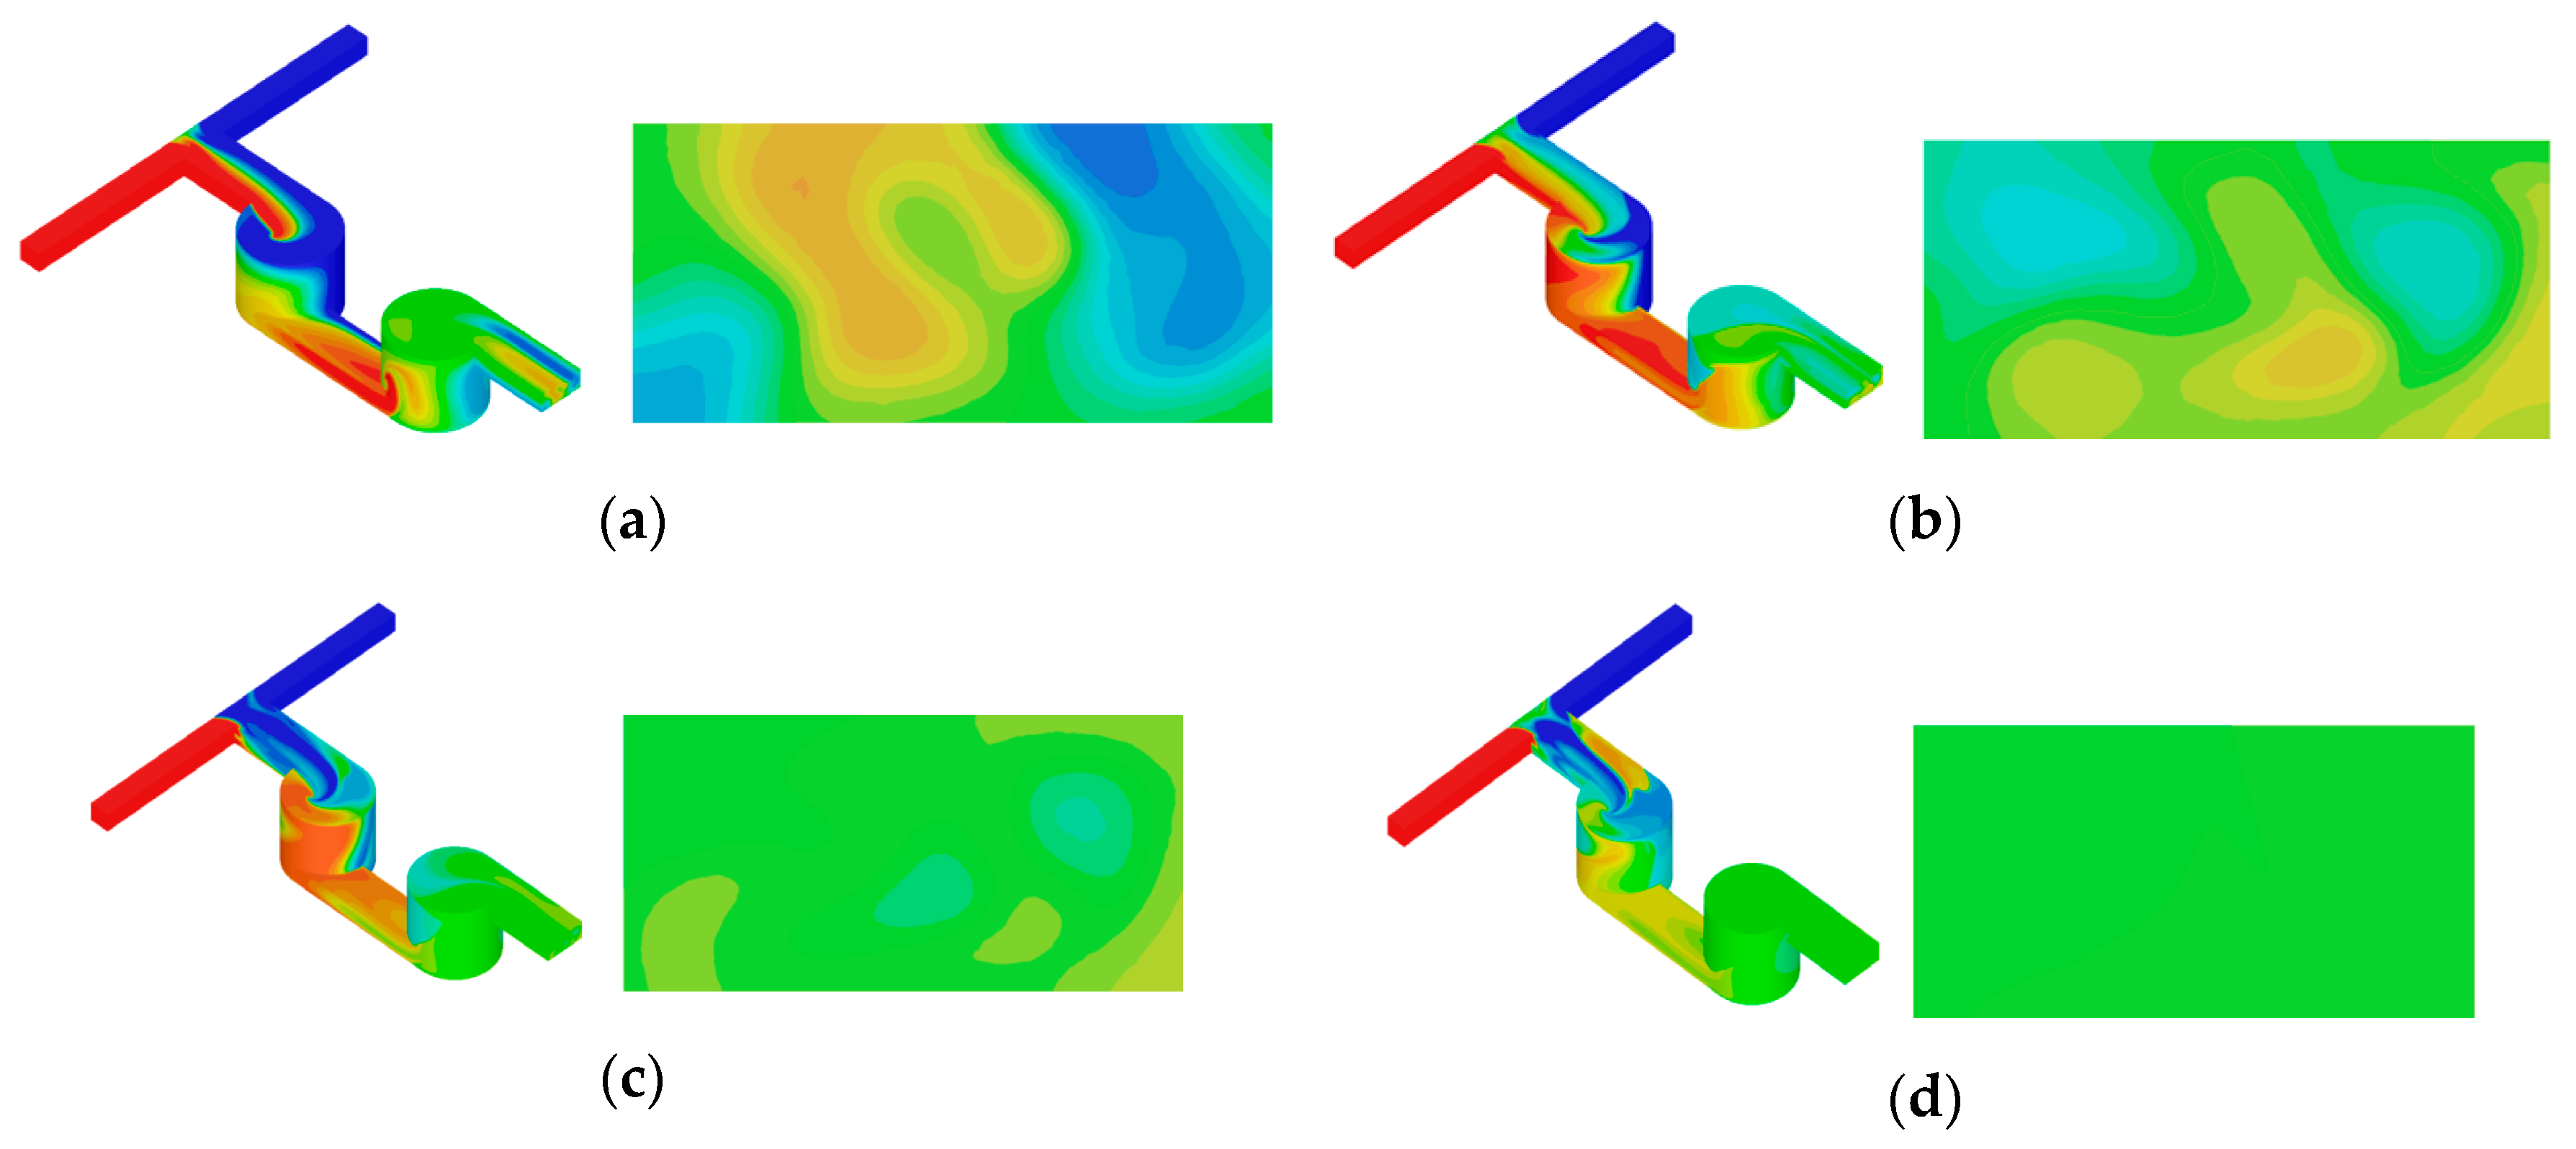
3.2. Flow Analysis in Micromixer No. 2

Further, the flow structures were studied for several widespread models of industrial micromixers. A numerical study was performed for each of the considered geometries to determine the dependence of the ME, PD, and normalized mixing efficiency on the Re number, as well as on the number of mixing chambers. The formulation of numerical simulation was similar to that used to study mixing in a basic T-shaped mixer at high Reynolds numbers. First, we investigated the dependence of the ME on the Re for the mixer model No. 2 with several mixing chambers, which is similar to that considered in [38]. Figure 1b shows the configuration of this micromixer, consisting of inlet channels, and a small pre-channel to which the mixing chambers are connected. This mixer implements the principle of alternating split and recombine of the flow. Once in the mixing chamber, the flow is split into two streams flowing in opposite directions. Then the separated streams are recombined in the direct channel and enter the second mixing chamber, where the entire sequence is repeated. At that, when separating, two mixing liquids move through separate channels.
The results of numerical simulation of mixing of two fluids in mixer No. 2 for several characteristic Reynolds numbers are shown in Figure 7 as a distribution of the concentration field of these fluids along the channel of the micromixer and at its outlet. The conducted study revealed that for this mixer configuration, the flow modes are the same as those found for a straight T-shaped microchannel, namely, a steady-state stratified flow, observed at Re < 5; steady-state flow with two symmetrical Dean vortices at the inlet to the mixing channel, observed within the range of Re between 5 and 145; steady-state asymmetric (engulfment) flow, observed within the range of Re number between 146 and 240; and unsteady periodic flow observed at 240 < Re < 400. Among the above flow modes, the most important is the engulfment flow regime with two symmetrical vortices, which is formed at Re > 145. The ME for this configuration is shown in Figure 8a. As is seen, the dependence of the ME on the Re number for this mixer is similar to that for a straight T-mixer. Similarly, the efficiency changes skippingly when the flow mode is switched to the two-vortex mode. A comparison of the ME of this micromixer with the ME of a straight T-mixer of similar length shows that for this mixer, the efficiency is approximately 1.42 times higher at Re < 145, and 1.1 times higher at Re > 145. However, such a mixer cannot be considered highly effective, given the complexity of its manufacture due to its geometric configuration.
Further, the effect of the number of mixing chambers on the flow modes, as well as on the ME and PD, was studied for this mixer. The simulation results are presented in Figure 9. It was shown that over the entire range of Re, the ME increases with an increase in the number of mixing chambers (Figure 8a). At that, the most significant effect was observed at Re < 145. Thus, for Re = 10, the mixing efficiency for six chambers was 1.3 times higher than that for four chambers, and 1.8 times higher than for two chambers. After the transition to another flow regime, the increase in ME decreases with an increase in the number of chambers (at Re = 180, the ME for six chambers was 1.18 times greater than that for four chambers, and 1.6 times greater than for two chambers).
Really, as the number of mixing chambers increases, the pressure drop increases as well (Figure 8b). The PD for six chambers is 1.5 times higher than that for four chambers and 2.8 times higher than that for two chambers.

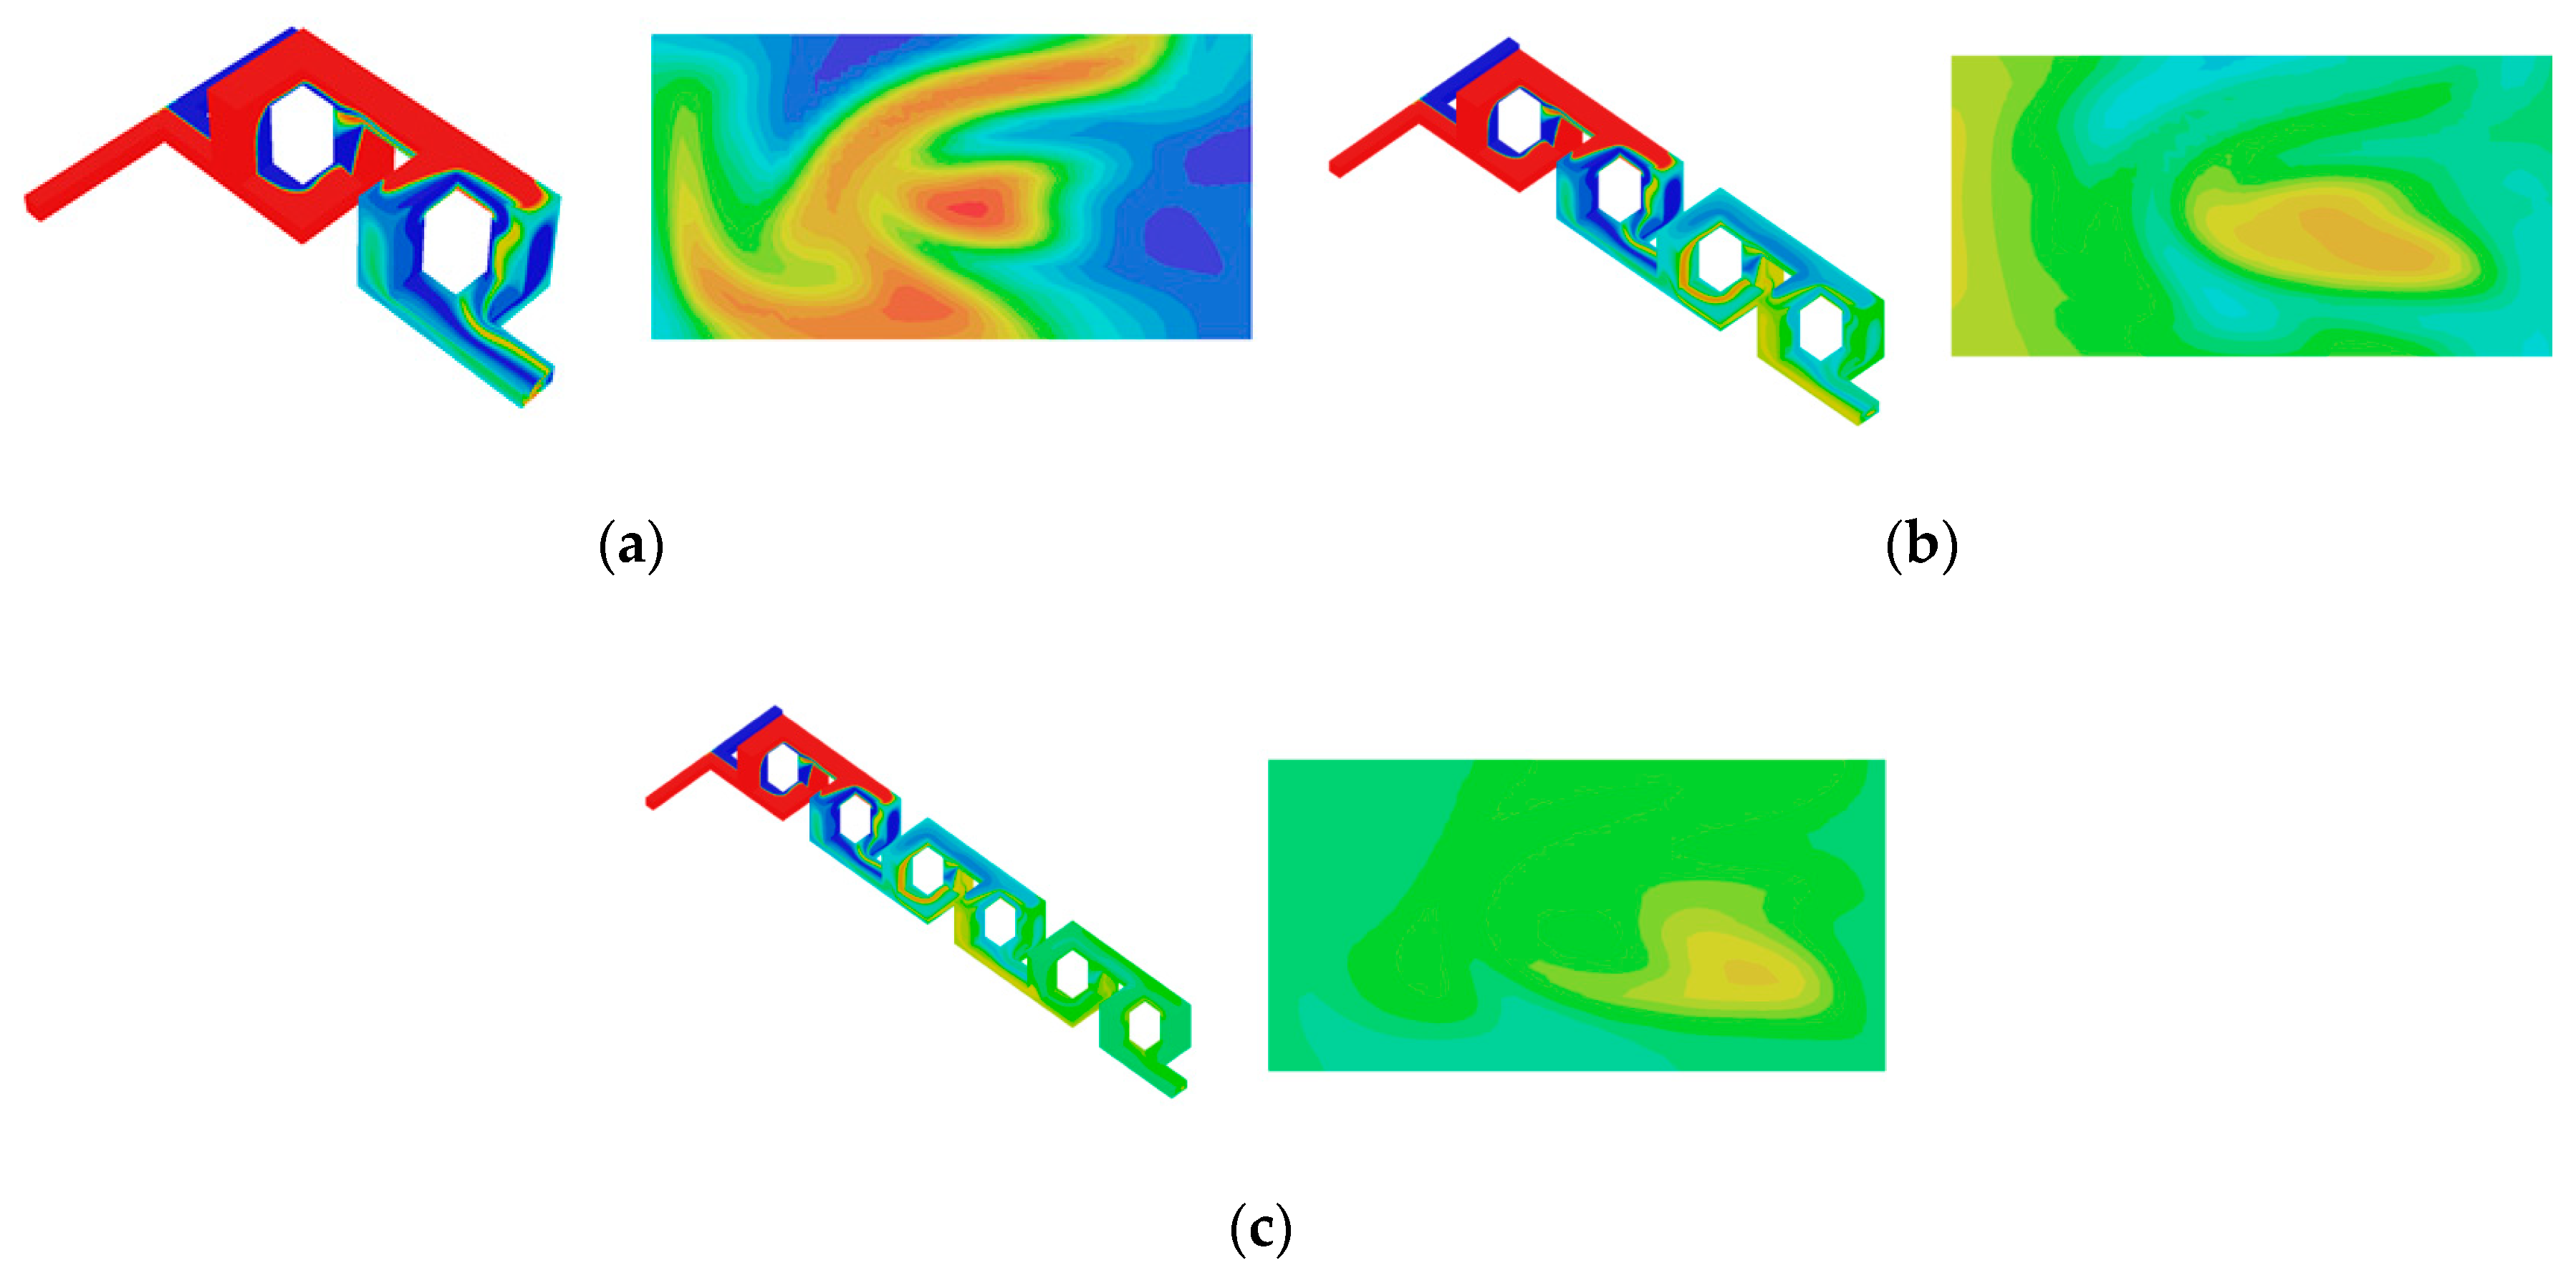
3.3. Flow Analysis in Micromixer No. 3

Figure 1c shows the configuration of the more complex mixer No. 3, which is similar to that considered in [39]. In this mixer, the flows, passing through the channels into the mixing chamber, are separated into two flows; one continues moving straight, while the second moves into a perpendicular channel. Then the separated flows are merged again. Unlike the previous mixer, where the flow was separated into channels, here the mixing fluids move together. Because of this, the contact area of the mixing fluids after passing the first mixing chamber increases twice, after the second chamber, four times, and so on. This implements the flow multiplication principle.
The results of numerical simulation of mixing of two fluids in this mixer are shown in Figure 10 as the distribution of the mixture fraction at the channel walls and at the channel outlet for the following Reynolds numbers: Re = 50; 120; 160; 250. As can be seen from Figure 10, because the contact area of the mixing fluids in this mixer increases many times, the ME is significantly higher than that in the previous two configurations. The ME and PD for this configuration are shown in Figure 11. A significant feature of this mixer is that it has a high ME even at low Re. So at Re = 50, the ME for such a micromixer is about 15% and continues to increase with increasing Re number. Under the same conditions, for micromixers No. 1 and No. 2, the mixing efficiency does not exceed 0.1% and continues to decrease with increasing Reynolds number.
This is because for mixers No. 1 and No. 2, mixing is mainly carried out in the diffusion mode, and the residence time of the mixture in the mixer decreases with an increase in the Reynolds number, and mixing worsens accordingly. Mixing by vortices, whose intensity increases with the increase in the Reynolds number, plays an important role for mixer No. 3. This is because with an increase in the Reynolds number, the mixing efficiency for these mixers increases. In quantitative terms, the use of mixer No. 3 within the range of Re from 10 to 145 allows increasing the ME by hundreds of times compared to the straight T-mixer and mixer No. 2, having the same length.
This mixer is also characterized by a flow rearrangement occurring when the Re reaches a value of approximately 145. Due to the development of the Taylor–Gertler instability, a pair of horseshoe-shaped vortices at the inlet of the mixing channel unfolds, resulting in flow overturning with the formation of an S-shaped vortex structure. This is evidenced by a surge in the ME occurring at Re = 145.
However, due to the high ME of this mixer at low Re, the surge in mixing efficiency here is not as noticeable as for the previous two mixers. At that, the ME in the flow mode at Re > 145 for this mixer is approximately 1.5 times higher under similar conditions than that for mixer No. 2. At the same time, it should be noted that the pressure loss spent on pumping the fluids through this mixer (Figure 11b) is approximately two times lower than that for mixer No. 2 (Figure 8b). This is because the flow during separation moves in this mixer in channels whose width is equal to the initial width of the mixing channel. In mixer No. 2, the flow when separated into streams moves in channels that are half the size of the original mixing channel. This leads to an additional increase in pressure losses.
Further, the effect of the number of mixing chambers (two, four, and six chambers) on the ME and the PD was studied for the same mixer. Figure 12 shows the effect of the number of chambers on the ME. It was demonstrated that over the entire range of Re, the ME increases with an increase in the number of chambers. The mixing efficiency for six chambers is 1.34 times higher than that for four chambers and 2.8 times higher than for two chambers. Further increase in the number of chambers is not advisable, since the increase in ME slows down with increasing in chambers number, while the pressure drop will continue to increase monotonously. Thus, the PD for mixer No. 3 with six chambers is 1.5 times higher than that for the same mixer with four chambers, and 2.6 times higher than for mixer with two chambers.

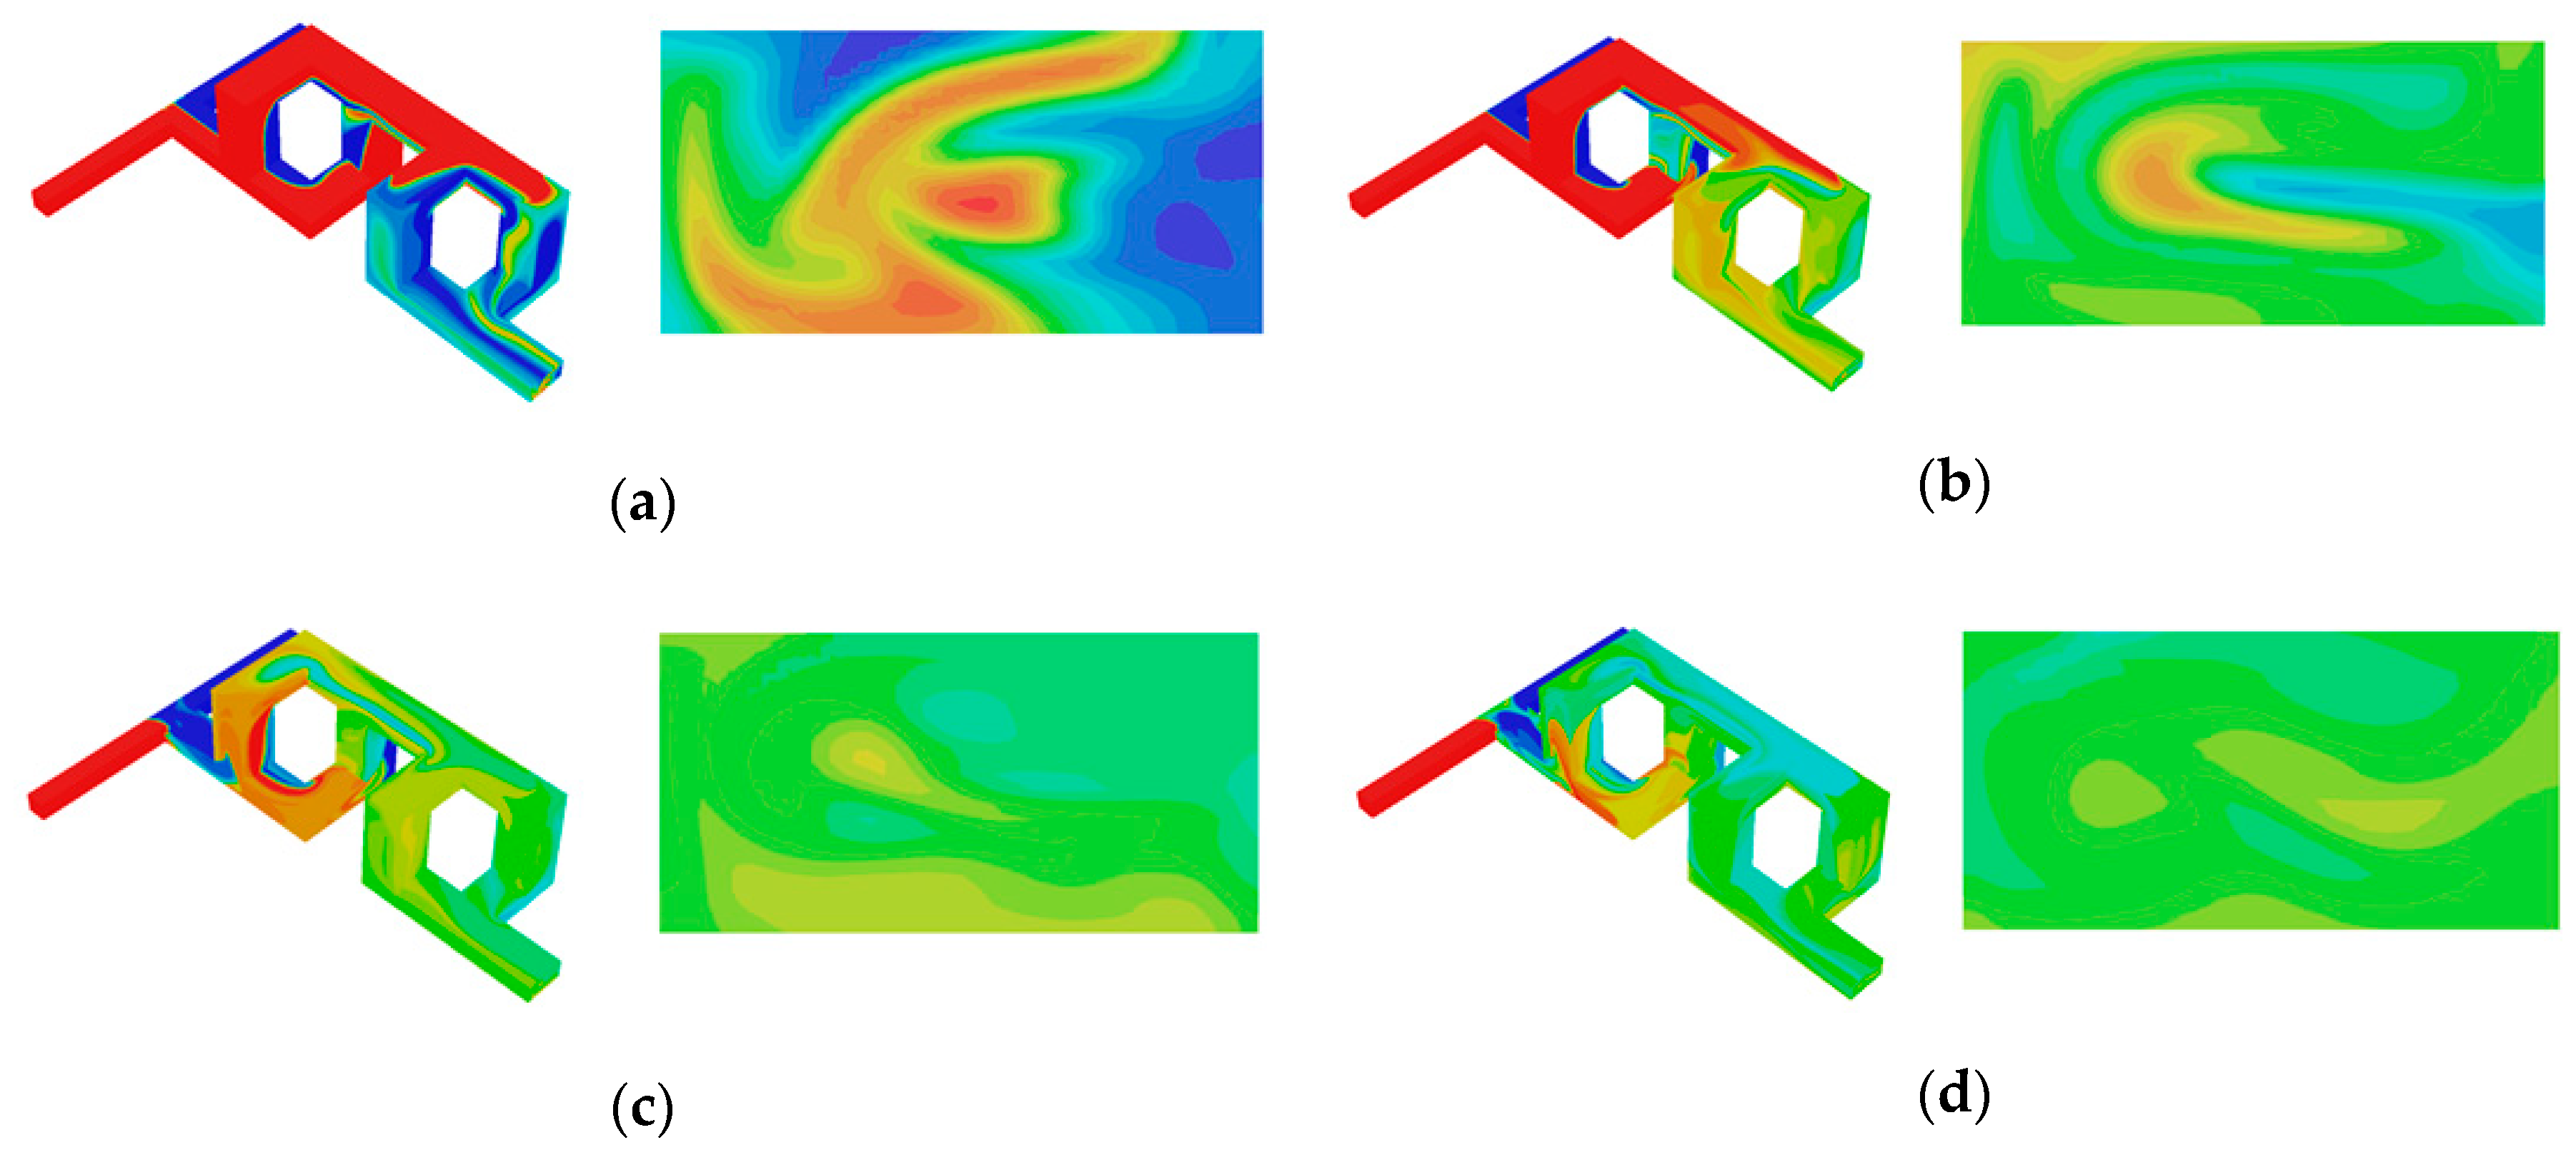
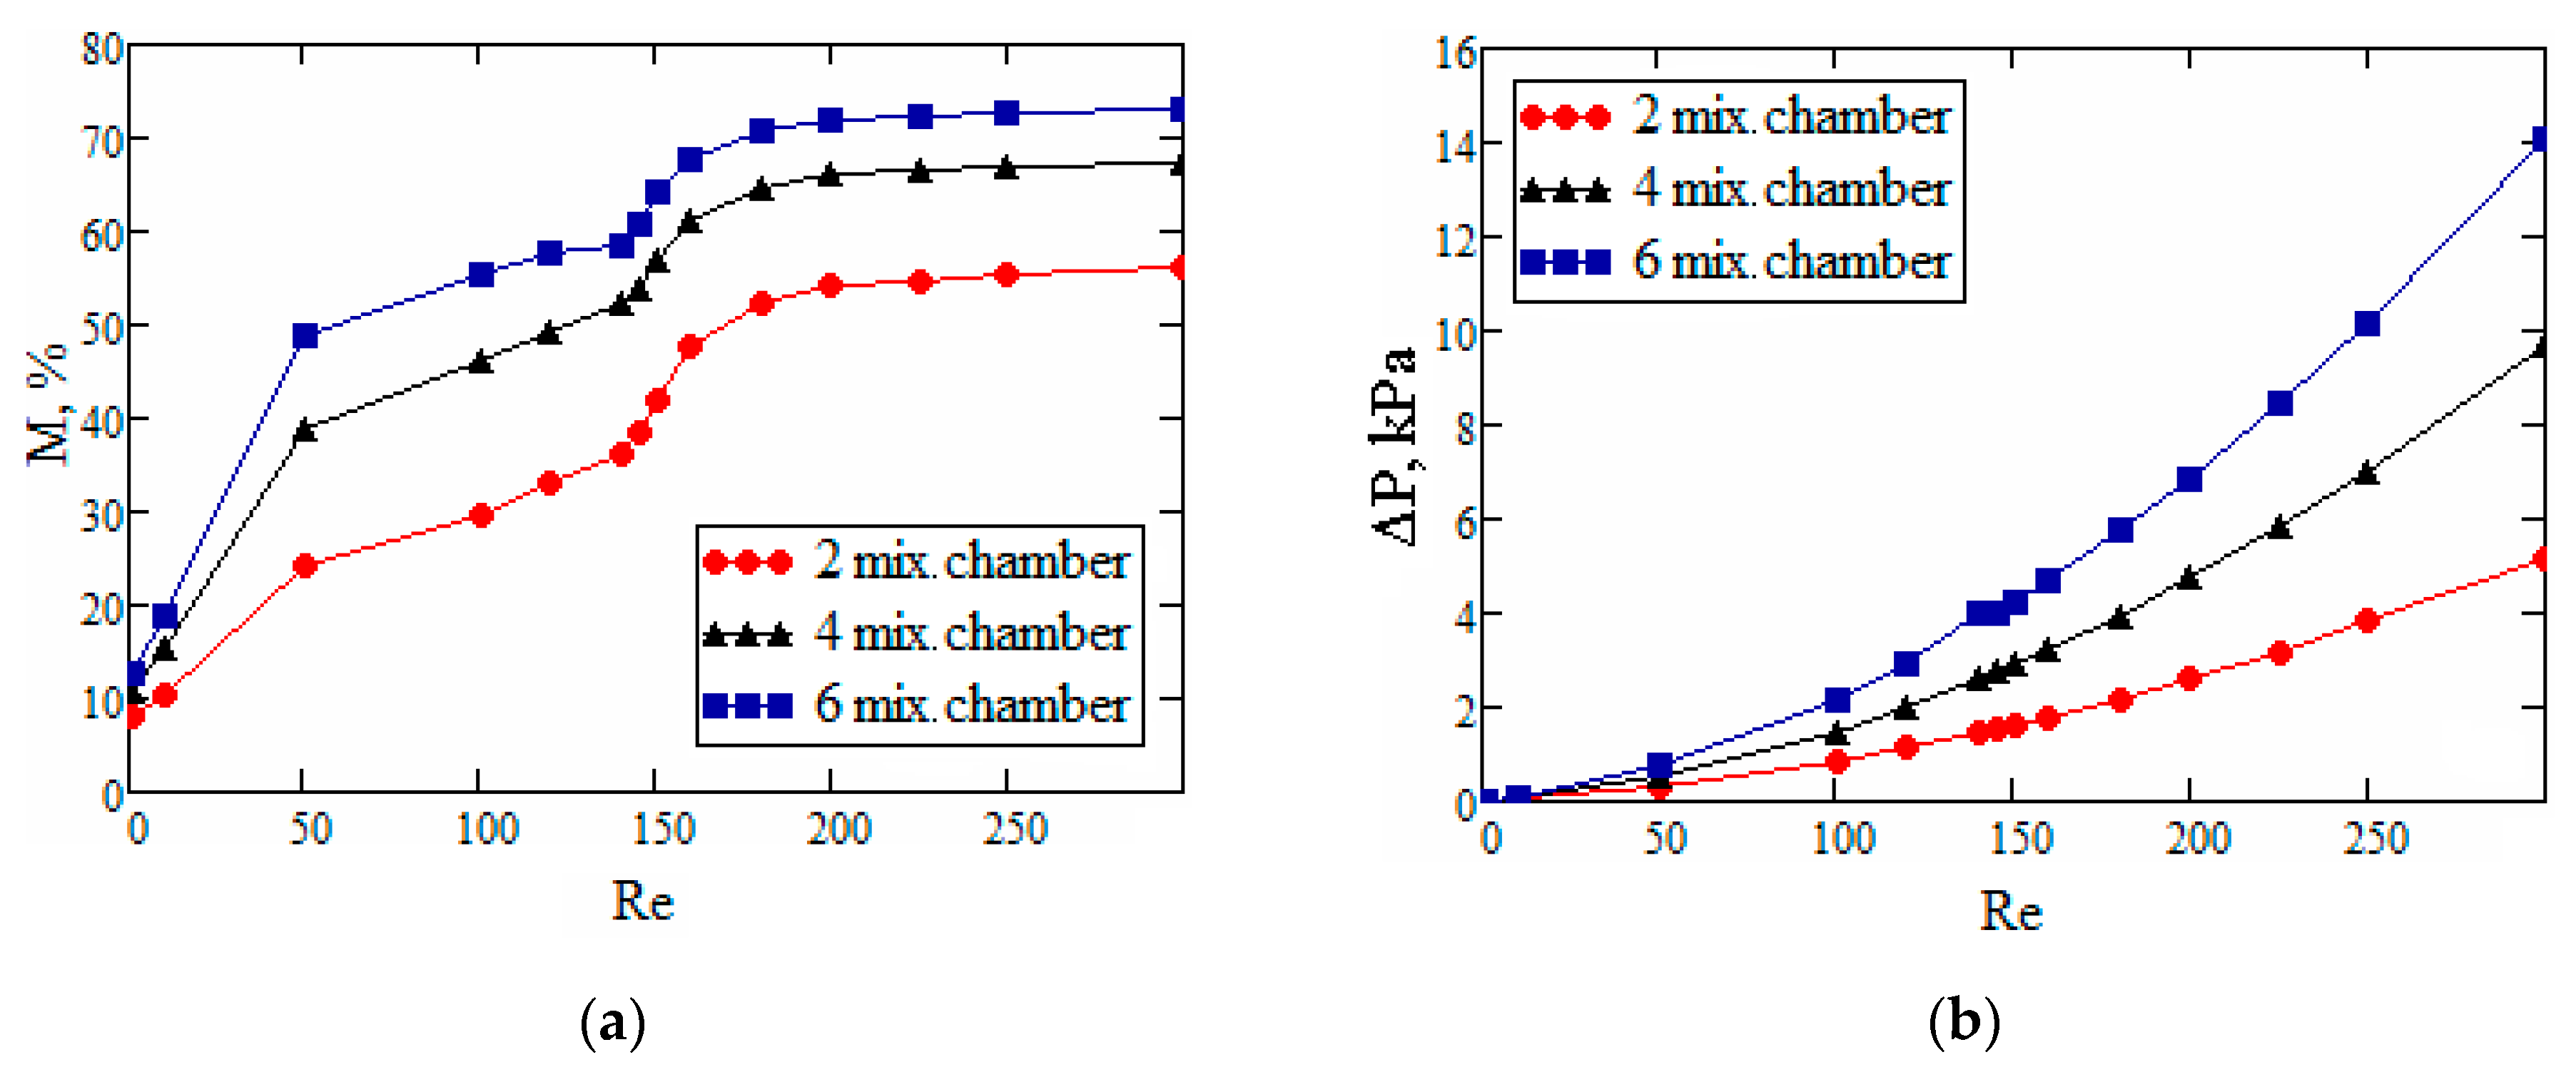
3.4. Flow Analysis in Micromixer No. 4

Similar studies were conducted for the mixer model No. 4. Figure 1d shows the configuration of micromixer No. 4, which is similar to the physical principle that was considered in [40]. As is seen, it differs significantly from the previous models by the presence of cylindrical mixing chambers. Fluids flow, after merging in a straight channel, enter a cylindrical chamber, then again into a straight channel, and then get into the next cylindrical chamber. In this mixer, mixing is intensified by flow swirling in a cylindrical chamber. This mixer is most effective at the Reynolds numbers greater than 20 when a vortex is formed in the mixing chamber. The results of mixing process simulation in such a mixer are shown in Figure 13 and Figure 14.
An analysis of the efficiency of this mixer has shown that it allows obtaining a much higher mixing efficiency compared to the mixers discussed above (Figure 14a) within almost the entire range of Reynolds numbers considered. At the same time, there is a qualitative difference in the mixing efficiency variations depending on the Re. Thus, for the straight T-mixer and mixer No. 2, the mixing efficiency decreases with increasing Re at low Reynolds numbers (Re < 145). For configurations No. 3 and No. 4, an important role is played by mixing due to vortices whose intensity increases with increasing Re. This explains the fact that with an increase in the Reynolds number, the ME for these mixers increases, and quite significantly. The use of this type of mixer within the range of low Reynolds numbers (up to 145) allows increasing the mixing efficiency by hundreds of times compared to the T-mixer and mixer No. 2 having the same length. At that, mixer No. 4 gives the mixing efficiency on average 60% higher than mixer No. 3. Thus, from the perspective of obtaining the maximum mixing efficiencies, this mixer is the best among the considered ones. Analysis of the flow structure has shown that this is achieved by the formation of a concentrated vortex in a cylindrical mixing chamber. The presence of the flow swirl in the mixing chamber is visible by the dye concentration contours shown in Figure 13. It should also be noted that for this mixer configuration, a sharp increase in the ME was revealed at Reynolds numbers within the range from 140 to 150 (Figure 14a). This indicates a change in flow mode. Analysis of the flow structure has shown that when Reynolds number reaches the indicated range, the two-vortex S-shaped structure described in Section 3.1 was formed in the pre-mixing channel. As already mentioned, this is exactly the reason for the increase in mixing efficiency. This vortex structure propagates into cylindrical mixing chambers, further intensifying mixing. But unlike mixers No. 1 and No. 2, the increase in mixing efficiency for this mixer configuration is smoother.
The dependencies of the mixing efficiency on the Reynolds number were also obtained for mixer No. 4 having a different number of mixing chambers. Figure 15 shows the effect of the number of mixing chambers on the performance of this mixer. Quantitative data are shown in Figure 14a. The presence of the mixing chambers allows increasing the mixing efficiency; however, the increase in mixing efficiency when adding additional chambers is not so significant.
As can be seen from Figure 14a, using more than four mixing chambers is not expedient, since this leads to an additional increase in pressure losses. Figure 14b shows the dependencies of the PD in the mixers depending on the Reynolds number. The analysis shows that mixers No. 3 and No. 4 have close pressure losses, while the pressure loss in mixer No. 2, as already mentioned, is about twice as high.

4. Discussions

Thus, as can be seen from the data shown in Figure 4, Figure 8, Figure 11 and Figure 14, the considered mixers have significantly different mixing efficiencies and energy consumption for pumping. From a practical perspective, it is important to have optimal mixers in which the increase in ME is higher than the increase in PD under the same conditions. Note that, in most of the previously performed studies, the goal was just to obtain just the maximum mixing efficiency. At that, the energy consumption on mixing and pumping the fluids in micromixers was not practically considered. The present study is the first to compare the efficiency of the considered mixers, taking into account the pressure loss when pumping the mixture. To do this, we introduced a mixing efficiency criterion, normalized to the PD between the mixer inlet and outlet. A comparison of the normalized ME for the four above considered mixers with two mixing chambers is given in Figure 16. As is seen, the normalized mixing efficiency of the considered mixers differs significantly. Mixer No. 4 has the maximum normalized mixing efficiency. At Re < 145, it allows mixing the fluids about 600 times more efficiently than a straight T-mixer. In terms of normalized mixing efficiency, mixer No. 3 is inferior to mixer No. 4 by about 1.5 times. In this range of Re numbers, mixer No. 2 allows increasing the mixing efficiency by only 1.5 times compared to the straight T-mixer. At Re > 145, the increment in mixing efficiency for mixers No. 3 and No. 4 compared to the straight T-mixer and mixer No. 2 is not so significant but is about two times.
Besides, it is important to note that as the Re increases, the normalized ME for all mixers decreases. This is because increasing the Reynolds number quickly increases the pressure loss, while the mixing efficiency increases slowly or even decreases (mixers No. 1 and No. 2). In this context, mixing is optimal at the lowest possible flow velocities. In this case, the residence time of the mixing fluids in the mixer will tend to infinity, while the mixing efficiency will approach 100%. However, this does not apply in practice, since many applications require high performances of the mixer or microreactor, which means that the device needs to operate at the highest possible Reynolds number. Thus, it was revealed that from the standpoint of overall efficiency, the best mixer from the above considered is mixer No. 4 with cylindrical mixing chambers, in which, at moderate Reynolds numbers, concentrated vortices are formed, which intensify mixing hundreds of times compared to a straight T-mixer, energy consumption for pumping being the same.
Figure 17 shows the normalized mixing efficiency for three micromixers with different numbers of mixing chambers. Adding additional mixing chambers leads to an increase in the overall length of the mixer and, consequently, to an increase in pressure losses. At that, the increase in the ME, in this case, is not so significant. This leads to the fact that the normalized mixing efficiency for all mixers in the entire range of Reynolds numbers decreases with an increase in the number of chambers.

5. Conclusions

A systematic study and the mixing process optimization of the fluids in microchannels were carried out based on numerical simulation. At that, micromixers, which operate, based on the most common principles of mixing intensification, such as diffusion mixing in long channels, the principle of alternating split and recombine of the flow, the principle of multiplication of flows, and vortex mixing were analyzed. The effect of channel configuration and the Reynolds number on flow regimes and ME was studied. For the first time, a comparison was made of the performance efficiency of the considered mixers, taking into account the pressure losses when pumping the mixture. As a result, the following conclusions were drawn.
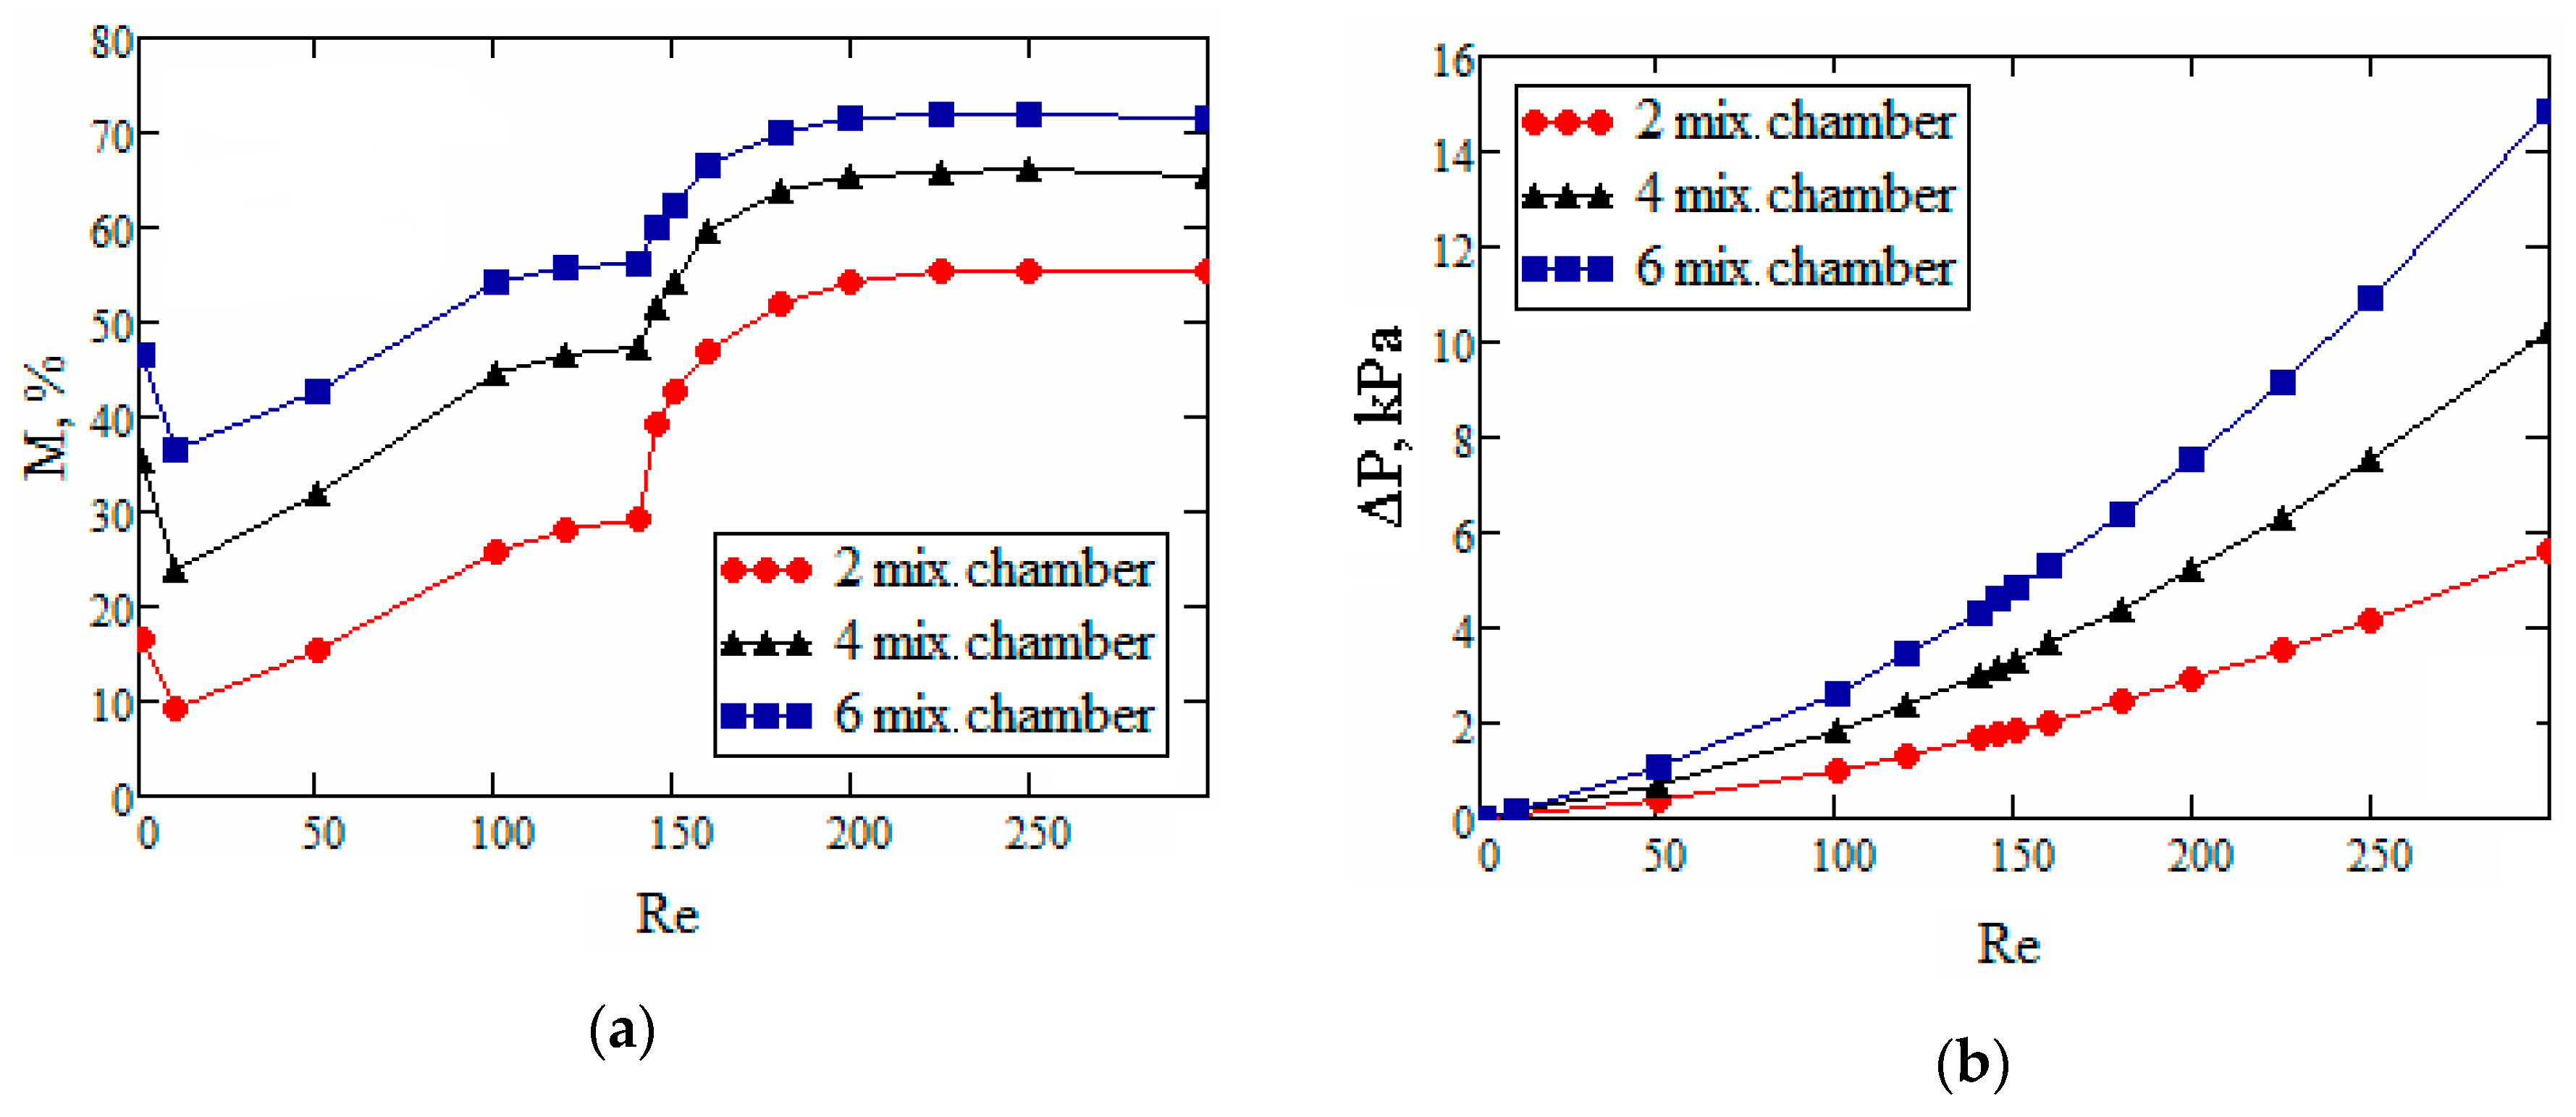
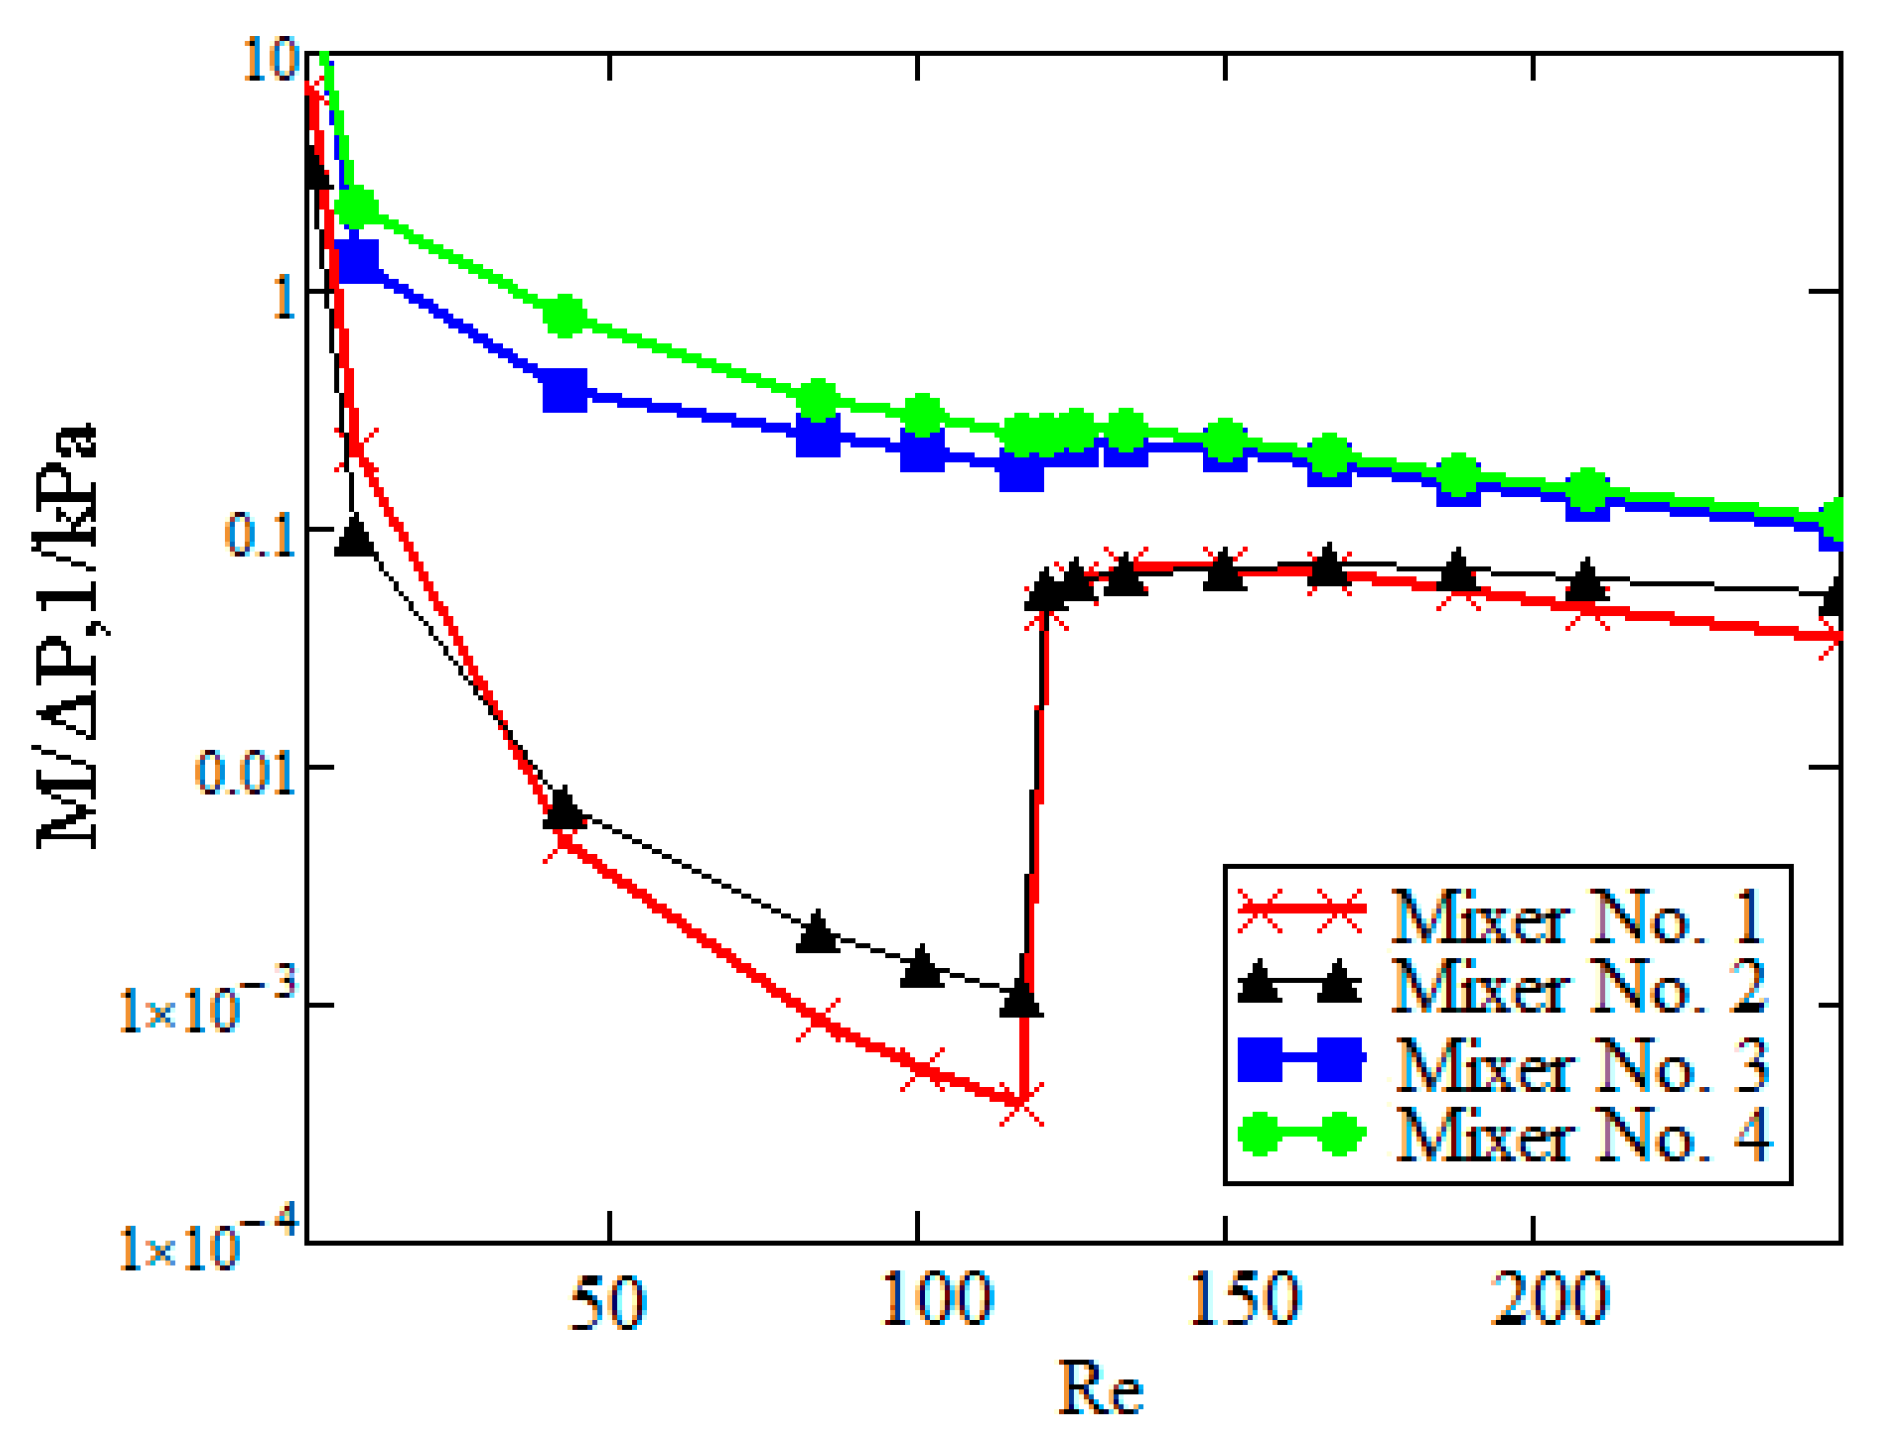
  • The normalized mixing efficiency decreases with an increase in the Re number for all the considered mixers.
  • It is shown that the maximum normalized mixing efficiency in the entire range of Re numbers was noted for mixer No. 4, in which a vortex-based intensification of mixing occurs due to the flow swirling in cylindrical chambers. This mixer allows mixing the fluids 600 times more efficiently than a straight T-mixer, while all other conditions being equal.
  • Mixer No. 3, which implements the flow multiplication principle, is inferior in terms of normalized mixing efficiency to mixer No. 4 by about 1.5 times. At the same time, this mixer is much more difficult to manufacture due to its complicated geometric configuration.
  • It was shown that mixer No. 2, which implements, the principle of alternating split and recombine of the flow, has a minimum normalized mixing efficiency. This mixer allows increasing the mixing efficiency by only 1.5 times compared to the straight T-mixer.
  • It is established that in addition to the mixer geometric configuration, the flow mode has a determining effect on mixer performance efficiency. It is shown that for all the considered mixers, at Re > 145, the flow regime is rearranged to form a two-vortex S-shaped structure that increases the mixing efficiency tenfold without an additional increase in pressure loss. From a practical perspective, this flow mode is the most effective for any micromixer.

Author Contributions

Conceptualization, A.V.M. and A.S.L.; methodology, A.V.M. and A.S.L.; calculations, A.S.L., A.V.S., and A.A.S.; validation, A.V.M. and A.S.L.; writing—original draft preparation, A.V.M.; writing—review and editing, A.V.M. and A.S.L.; visualization, A.S.L., A.V.S., and A.A.S. All authors have read and agreed to the published version of the manuscript.

Funding

The numerical simulation was funded by RFBR (pr. 18-48-243011). The generalization and systematization of the results and writing of the paper were supported by the grant (SFU, FSRZ-2020-0012).

Conflicts of Interest

The authors declare no conflict of interest.

References

  1. Tabeling, P. Introduction to Microfluidics; Oxford University Press: Oxford, UK, 2005. [Google Scholar]
  2. Karnidakis, G.; Beskok, A.; Aluru, N. Microflows and nanoflows. Interdiscip. Appl. Math. 2005, 29, 817. [Google Scholar]
  3. Elvira, K.S.; Solvas, X.C.; Wootton, R.C.; de Mello, A.J. The past, present and potential for microfluidic reactor technology in chemical synthesis. Nat. Chem. 2013, 11, 905–915. [Google Scholar] [CrossRef] [PubMed]
  4. Yew, M.; Ren, Y.; Koh, K.S.; Sun, C.; Snape, C. A Review of State-of-the-Art Microfluidic Technologies for Environmental Applications: Detection and Remediation. Global Chall. 2018. [Google Scholar] [CrossRef] [PubMed] [Green Version]
  5. Convery, N.; Gadegaard, N. 30 years of microfluidics. Micro Nano Eng. 2019, 2, 76–91. [Google Scholar] [CrossRef]
  6. Shestopalov, I.; Tice, J.D.; Ismagilov, R.F. Multi-step synthesis of nanoparticles performed on millisecond time scale in a microfluidic droplet-based system. Lab Chip. 2004, 4, 316–321. [Google Scholar] [CrossRef] [Green Version]
  7. Tsai, T.T.; Shen, S.W.; Cheng, C.M.; Chen, C.F. Paper-based tuberculosis diagnostic devices with colorimetric gold nanoparticles. Sci. Technol. Adv. Mater. 2013, 14. [Google Scholar] [CrossRef] [Green Version]
  8. Cheng, C.; Martinez, A.W.; Gong, J. Paper-based ELISA. Angew. Chem. 2010, 122, 4881–4884. [Google Scholar] [CrossRef] [Green Version]
  9. Martinez, A.W.; Phillips, S.T.; Whitesides, G.M. Three-dimensional microfluidic devices fabricated in layered paper and tape. Proc. Natl. Acad. Sci. USA 2008, 105, 19606–19611. [Google Scholar] [CrossRef] [Green Version]
  10. Tawfik, D.S.; Griffiths, A.D. Man-made cell-like compartments for molecular evolution. Nat. Biotechnol. 1998, 16, 652–656. [Google Scholar] [CrossRef]
  11. Karnik, R. Microfluidic mixing. In Encyclopedia of Microfluidics and Nanofluidics; Li, D., Ed.; Springer: Cham, Switzerland, 2008; pp. 1177–1186. [Google Scholar]
  12. Jeong, G.; Chung, S.; Kim, C.; Lee, S. Applications of micromixing technology. Analyst 2010, 135, 460–473. [Google Scholar] [CrossRef]
  13. Gaozhe, C.; Xue, L.; Zhang, H.; Lin, J. A Review on Micromixers. Micromachines 2017, 8, 274. [Google Scholar]
  14. Kwang-Yong, K.; Mubashshir, A.A.; Arshad, A. Passive Micromixers; MDPI: Basel, Switzerland, 2018; p. 166. [Google Scholar]
  15. Stroock, A.D.; Dertinger, S.K.; Whitesides, G.M.; Ajdari, A. Patterning flows using grooved surfaces. Anal. Chem. 2002, 74, 5306–5312. [Google Scholar] [CrossRef] [PubMed]
  16. Bökenkamp, D.; Desai, A.; Yang, X.; Tai, Y.C.; Marzluff, E.M.; Mayo, S.L. Microfabricated Silicon Mixers for Submillisecond Quench-Flow Analysis. Anal. Chem. 1998, 70, 232–236. [Google Scholar] [CrossRef]
  17. Gobby, D.P.; Angeli, A. Mixing characteristics of T-type microfluidic mixers. Micromech. Microeng. 2001, 11, 126–132. [Google Scholar] [CrossRef]
  18. Engler, M.; Kockmann, N.; Kiefer, T.; Woias, P. Numerical and experimental investigations on liquid mixing in static micromixers. Chem. Eng. J. 2004, 101, 315–322. [Google Scholar] [CrossRef]
  19. Telib, H.; Manhart, M.; Iollo, A. Analysis and Low-Order Modeling of the Inhomogeneous Transitional Flow inside a TMixer. Phys. Fluids 2004, 16, 2717–2731. [Google Scholar] [CrossRef]
  20. Bothe, D.; Stemich, C.; Warnecke, H.J. Fluid mixing in a T-shaped micromixer. Chem. Eng. Sci. 2006, 61, 2950–2958. [Google Scholar] [CrossRef]
  21. Dreher, S.; Kockmann, N.; Woias, P. Characterization of laminar transient flow regimes and mixing in T-shaped micromixers. Heat Transf. Eng. 2009, 30, 91–100. [Google Scholar] [CrossRef]
  22. Galletti, C.; Roudgar, M.; Brunazzi, E.; Mauri, R. Effect of inlet conditions on the engulfment pattern in a T-shaped micro-mixer. Chem. Eng. J. 2012, 185, 300–313. [Google Scholar] [CrossRef]
  23. Lobasov, A.S.; Minakov, A.V. Density effect on the mixing efficiency and flow modes in T-shaped micromixers. MATEC Web Conf. 2017, 115. [Google Scholar] [CrossRef] [Green Version]
  24. Lobasov, A.S.; Minakov, A.V. Analyzing mixing quality in a T-shaped micromixer for different fluids properties through numerical simulation. Chem. Eng. Process. 2018, 124, 11–23. [Google Scholar] [CrossRef] [Green Version]
  25. Lobasov, A.S.; Minakov, A.V.; Kuznetsov, V.V.; Rudyak, V.Y.; Shebeleva, A.A. Investigation of mixing efficiency and pressure drop in T-shaped micromixers. Chem. Eng. Process. 2018, 134, 105–114. [Google Scholar] [CrossRef] [Green Version]
  26. Kim, D.S.; Lee, S.H.; Kwon, T.H.; Ahn, C.H. A serpentine laminating micromixer combining splitting/recombination and advection. Lab Chip 2005, 5, 739–747. [Google Scholar] [CrossRef] [PubMed] [Green Version]
  27. Long, M.; Sprague, M.; Grimes, A.; Rich, B.; Khine, M. A simple three dimensional vortex micromixer. Appl. Phys. Lett. 2009, 94. [Google Scholar] [CrossRef]
  28. Park, J.; Kim, D.; Kang, T.; Kwon, T. Improved serpentine laminating micromixer with enhanced local advection. Microfluid. Nanofluid. 2008, 4, 513–523. [Google Scholar] [CrossRef]
  29. Wang, L.; Yang, J. An overlapping crisscross micromixer using chaotic mixing principles. J. Micromech. Microeng. 2006, 16, 2684. [Google Scholar] [CrossRef]
  30. Hossain, S.; Husain, A.; Kim, K.-Y. Optimization of Micromixer with Staggered Herringbone Grooves on Top and Bottom Walls. Eng. Appl. Comp. Fluid Mech. 2011, 5, 506–516. [Google Scholar] [CrossRef] [Green Version]
  31. Hossain, S.; Ansari, M.A.; Husain, A.; Kim, K.-Y. Analysis and optimization of a micromixer with a modified Tesla structure. Chem. Eng. J. 2010, 158, 305–314. [Google Scholar] [CrossRef]
  32. Afzal, A.; Kim, K.-Y. Passive split and recombination micromixer with convergent–divergent walls. Chem. Eng. J. 2012, 203, 182–192. [Google Scholar] [CrossRef]
  33. Karvelas, E.; Liosis, C.; Benos, L.; Karakasidis, T.; Sarris, I. Micromixing Effciency of Particles in Heavy Metal Removal Processes under Various Inlet Conditions. Water 2019, 11, 1135. [Google Scholar] [CrossRef] [Green Version]
  34. Liosis, C.; Karvelas, E.; Karakasidis, T.; Sarris, I. Numerical study of magnetic particles mixing in waste water under an external magnetic field. J. Water Supply Res. Tech. AQUA 2020, 69, 266–275. [Google Scholar] [CrossRef]
  35. Karvelas, E.G.; Koubogiannis, D.G.; Hatziapostolou, A.; Sarris, I.E. The effect of anode bed geometry on the hydraulic behaviour of PEM fuel cells. Renew. Energy 2016, 93, 269–279. [Google Scholar] [CrossRef]
  36. Patankar, S. Numerical Methods for Solving Problems of Heat Exchange and Fluid Dynamics; Energoatomizdat: Moscow, Russia, 1984; p. 152, [Russian translation]. [Google Scholar]
  37. Ferziger, J.H.; Peric, M. Computational Methods for Fluid Dynamics; Springer Science + Business Media Inc.: Berlin, Germany, 2002; p. 423. [Google Scholar]
  38. Chen, H.; Meiners, J.C. Topologic mixing on a microfluidic chip. Appl. Phys. Lett. 2004, 84, 2193–2195. [Google Scholar] [CrossRef]
  39. Garstecki, P.; Fuerstman, M.J.; Fischbach, M.A.; Sia, S.K.; Whitesides, G.M. Mixing with bubbles: A practical technology for use with portable microfluidic devices. Lab Chip 2006, 6, 207–212. [Google Scholar] [CrossRef]
  40. Chung, Y.-C.; Hsu, Y.-L.; Jen, C.-P.; Lud, M.-C.; Lin, Y.-C. Design of passive mixers utilizing microfluidic self-circulation in the mixing chamber. Lab Chip 2004, 4, 70–77. [Google Scholar] [CrossRef]
  41. Hoffmann, M.; Schluter, M.; Rabiger, N. Experimental investigation of liquid-liquid mixing in T-shaped micro-mixers using μ-LIF and μ-PIV. Chem. Eng. Sci. 2006, 61, 2968–2976. [Google Scholar] [CrossRef]
  42. Lobasov, A.; Minakov, A.; Rudyak, V.; Yagodnitsina, A.; Bilsky, A. Micro-LIF and Numerical Investigation of Mixing in Microchannel. J. Sib. Fed. Univ. Tech. technol. 2013, 6, 15–27. [Google Scholar]
Figure 1. Configuration of micromixers: (a) No. 1, (b) No. 2, (c) No. 3, and (d) No. 4.
Fluids 05 00211 g001
Figure 2. The isolines of the mixture fraction for the Re = 1 (a), and Re = 186 (b).
Fluids 05 00211 g002
Figure 3. Vortex flow structure in the T-mixer for the Re = 120 (a) and Re = 186 (b). The left image is a front view, the right image is a side view.
Fluids 05 00211 g003
Figure 4. The mixing efficiency (ME) (a) and the pressure drop (PD) (b) in the mixer depending on the Reynolds number.
Fluids 05 00211 g004
Figure 5. Isosurface λ2, colored with the dye concentration in a T-mixer for Re = 600.
Fluids 05 00211 g005
Figure 6. Comparison of experimental [42] and calculated concentration (a) and velocity (b) fields in the central section of the T-mixer.
Fluids 05 00211 g006
Figure 7. The mixture fraction at the channel walls and at the channel outlet for mixer configuration No. 2, (a) Re = 120; (b) Re = 160; (c) Re = 250.
Fluids 05 00211 g007
Figure 8. ME (a) and PD (b) for mixer No. 2 with different mixing chambers.
Fluids 05 00211 g008
Figure 9. The mixture fraction at the channel walls and the channel outlet for mixer configuration No. 2 at Re = 160; mixer with two (a), four (b), and six (c) chambers.
Fluids 05 00211 g009
Figure 10. The mixture fraction at the channel walls and at the channel outlet for mixer configuration No. 3: (a) Re = 50; (b) Re = 120; (c) Re = 160; (d) Re = 250.
Fluids 05 00211 g010
Figure 11. ME (a) and PD (b) for mixer No. 3 with different mixing chambers.
Fluids 05 00211 g011
Figure 12. The mixture fraction at the channel walls and the channel outlet for mixer configuration No. 3 at Re = 50; mixer with two (a), four (b), and six (c) chambers.
Fluids 05 00211 g012
Figure 13. The mixture fraction at the channel walls and at the channel outlet for mixer configuration No. 4: (a) Re = 50; (b) Re = 120; (c) Re = 160; (d) Re = 250.
Fluids 05 00211 g013
Figure 14. ME (a) and PD (b) for mixer No. 4 with a different number of mixing chambers.
Fluids 05 00211 g014
Figure 15. The mixture fraction at the channel walls and the channel outlet for mixer configuration No. 4 at Re = 160; mixer with two (a), four (b), and six (c) chambers.
Fluids 05 00211 g015
Figure 16. Mixing efficiency normalized to pressure losses for different micromixers with two mixing chambers.
Fluids 05 00211 g016
Figure 17. Mixing efficiency for different micromixers with multiple mixing chambers normalized to the pressure losses.
Fluids 05 00211 g017
Table 1. The boundary conditions for all considered cases.
BoundaryMass Flow Rate (Qin) (mg/s)Pressure (pa)Passive Scalar (φ)
Inlets0.2, 2, 10, 20, 24, 28, 29, 30, 32, 36, 40, 45, 50, 60Zero gradient1
OutletZero gradient00
Walls0Zero gradientZero gradient
Publisher’s Note: MDPI stays neutral with regard to jurisdictional claims in published maps and institutional affiliations.

