Article

New Generalized Viscosity Model for Non-Colloidal Suspensions and Emulsions

Department of Chemical Engineering, University of Waterloo, Waterloo, ON N2L 3G1, Canada
Fluids 2020, 5(3), 150; https://doi.org/10.3390/fluids5030150
Submission received: 31 July 2020 / Revised: 25 August 2020 / Accepted: 28 August 2020 / Published: 1 September 2020
(This article belongs to the Special Issue Fluid Mechanics of Suspensions and Emulsions)

Abstract

:
The viscous behavior of solids-in-liquid suspensions and liquid-in-liquid emulsions of non-Brownian solid particles and liquid droplets dispersed in Newtonian liquids is thoroughly discussed and reviewed. The full concentration range of the dispersed particles/droplets is covered, that is, 0 < ϕ < ϕ m , where ϕ is the volume fraction of inclusions (particles or droplets) and ϕ m is the maximum packing volume fraction of inclusions. The existing viscosity models for suspensions and emulsions are evaluated using a large pool of experimental viscosity data on suspensions and emulsions. A new generalized model for the viscosity of suspensions and emulsions is proposed and evaluated. The model takes into consideration the influence of shear-induced aggregation of particles and droplets. It also includes the effect of the droplet-to-matrix viscosity ratio λ on the viscosity of emulsions. In the limit of high ratio of droplet viscosity to matrix viscosity ( λ ), the model reduces to the suspension viscosity model. The proposed model uncovers some important and novel characteristics of suspension systems rarely discussed heretofore in the literature. The model is validated using twenty sets of experimental viscosity data on solids-in-liquid suspensions and twenty-three sets of experimental viscosity data on liquid-in-liquid emulsions.

Graphical Abstract

1. Introduction

Suspensions and emulsions are two-phase dispersions consisting of solid particles or liquid droplets dispersed in a matrix of immiscible liquid. The applications of suspensions and emulsions are many. Some of the industries where they find applications are: food, petroleum, cosmetics and toiletries, pharmaceuticals, paints, etc. [1]. Knowledge of the rheology of suspensions and emulsions is required in the formulation, handling, mixing, processing, storage, and pumping operations.
The rheological behavior of non-colloidal suspensions and emulsions of spherical inclusions can generally be described adequately by the following Newtonian constitutive equation:
σ _ _ = P δ _ _ + 2 η E _ _
where σ _ _ is the bulk stress tensor, P is the pressure, δ _ _ is the unit tensor, η is the shear viscosity, and E _ _ is the bulk rate of strain tensor [1]. Thus, shear viscosity is the only rheological property that is relevant in the description of the rheology of non-colloidal suspensions and emulsion of spherical inclusions, especially when ϕ < ϕ m where   ϕ is the volume fraction of inclusions and ϕ m is the maximum packing volume fraction of particles. Note that non-colloidal spherical inclusions of suspensions are also referred to as non-Brownian hard spheres. Such hard spheres are solid and rigid spherical particles that do not interact with each other non-hydrodynamically (non-hydrodynamic or colloidal forces such as electrostatic, steric, van der Waals, and Brownian forces are all absent). Only hydrodynamic interactions occur in these suspensions. Non-colloidal spherical inclusions of emulsions are spherical un-deformed liquid droplets that interact with each other only hydrodynamically. The capillary number (defined as C a = η C γ ˙ / ( σ / R ) , where η C is the continuous-phase or matrix liquid viscosity, γ ˙ is the shear rate, σ is the interfacial tension, and R is the droplet radius) is vanishingly small for droplets to remain spherical in a shear field [1,2].
This work deals with the modelling, prediction, and experimental validation of the shear viscosity of concentrated non-colloidal suspensions and emulsions over the full concentration range of particles and droplets. The existing viscosity/concentration equations for suspensions and emulsions are reviewed and their limitations are pointed out. A large pool of experimental data on the viscosity of non-colloidal suspensions and emulsions is gathered from different sources and the predictions of the existing viscosity models are compared with the experimental data. No single existing viscosity equation has been found to represent the experimental data adequately. A new generalized model for the viscosity of concentrated non-colloidal suspensions and emulsions is developed taking into consideration the influence of shear-induced aggregation of particles and droplets. The same model describes the experimental viscosity data for both suspensions and emulsions very well over the full range of dispersed-phase concentration.

2. Viscosity Models for Suspensions of Non-Brownian Hard Spheres

2.1. Infinitely Dilute Suspensions

For very dilute suspension of non-Brownian hard spheres, the relative viscosity ( η r ) defined as the ratio of suspension viscosity ( η ) to matrix viscosity ( η C ), is given by the Einstein equation:
η r = 1 + 2.5 ϕ
where ϕ is the volume fraction of the dispersed particles. The Einstein equation is valid only when ϕ is small ( ϕ 0 ). It ignores any particle-particle hydrodynamic interactions. It is generally valid for ϕ 0.03 [2]. It should be noted that the Einstein equation is not restricted to non-Brownian hard spheres. It is equally valid for suspensions of Brownian hard spheres as Brownian motion has no effect on the rheology of infinitely dilute suspensions of hard spheres.

2.2. Non-Dilute Suspensions

At finite concentration of particles, particle-particle hydrodynamic interactions cannot be ignored. For example, when two spheres are close to each other, the flow field around one sphere is affected by the presence of the other sphere. Thus, the general expression for relative viscosity of suspension in the presence of multi-particle hydrodynamic interactions can be written in the form of virial expansion as:
η r = 1 + β 1 ϕ + β 2 ϕ 2 + β 3 ϕ 3 +
where β 1 is 2.5, β 2 is a two-particle (pair) hydrodynamic interaction coefficient, and β 3 is a three-particle hydrodynamic interaction coefficient. The problem with Equation (3) is that the values of the hydrodynamic interaction coefficients β’s (especially β 3 and higher order) are not easily calculable. Several authors have computed the value of the pair hydrodynamic interaction coefficient β 2 , but there is no agreement. Guth and Simha [3] obtained a β 2 value of 14.1; Saito [4] obtained β 2 of 2.5; Vand [5] obtained β 2 of 7.349; Manley and Mason [6] obtained β 2 of 10.05; Batchelor and Green [7] obtained a β 2 value of 5.2 by assuming a random particle distribution and neglecting Brownian motion.
Several closed form expressions have also been proposed in the literature for the relative viscosity of concentrated suspensions of hard spheres. According to Pal [8], the Einstein equation could be extended to non-dilute suspensions provided that free volume available to particles is used in the equation as shown below:
η r = 1 + 2.5 ( V o l u m e   o f   p a r t i c l e s F r e e   v o l u m e   a v a i l a b l e   t o   p a r t i c l e s ) = 1 + 2.5 ( ϕ 1 ϕ ) = 1 + ( 3 / 2 ) ϕ 1 ϕ
This equation was originally derived by Saito [4] taking into consideration the hydrodynamic interactions between uncorrelated particles. In the limit ϕ 0 , Equation (4) reduces to the Einstein equation.
Several authors have used an “effective medium” approach to develop the viscosity equations for concentrated suspensions [9,10]. For example, consider a volume V of a suspension with dispersed-phase concentration ϕ 1 . If V d amount of dispersed phase is added further to the dispersion, the new concentration ϕ becomes:
ϕ = ϕ 1 V + V d V + V d ϕ 1 + ϕ 2
where ϕ 2 = V d / ( V + V d ) . If we now assume that the starting suspension acts like an effective medium of viscosity η ( ϕ 1 ) towards the newly added dispersed phase ( V d ), the final suspension will have a relative viscosity η r ( ϕ 2 ) given as:
η r ( ϕ 2 ) = η ( ϕ )   η ( ϕ 1 )   = η r ( ϕ 1 + ϕ 2 ) η r ( ϕ 1 )
Hence,
η r ( ϕ 1 + ϕ 2 ) = η r ( ϕ 1 ) × η r ( ϕ 2 )
This functional relation has the following solution that also satisfies the Einstein equation, Equation (2), in the limit 0 :
η r = e x p ( 2.5 ϕ )
The functional relation, Equation (7), is approximate in nature as it is based on Equation (5), which assumes V / ( V + V d ) 1 . The exact relationship between ϕ , ϕ 1 , and ϕ 2 is as follows:
ϕ = ϕ 1 ( V V + V d ) + ϕ 2
Or,
ϕ = ϕ 1 ( 1 ϕ 2 ) + ϕ 2
Thus, the correct form of the functional relationship Equation (7) is as follows:
η r ( ϕ 1 + ϕ 2 ϕ 1 ϕ 2 ) = η r ( ϕ 1 ) × η r ( ϕ 2 )
This functional relationship has the following solution that also satisfies the Einstein equation, Equation (2), in the limit 0 :
η r = ( 1 ϕ ) 2.5
This viscosity equation, first derived independently by Roscoe [11] and by Brinkman [12], gives reasonable predictions of relative viscosity of suspensions of hard spheres at low to moderate volume fractions of the dispersed phase. It under predicts the viscosity at high volume fractions of dispersed phase as it does not consider the packing limit of particles. The viscosity of suspensions of hard spheres diverges at maximum packing volume fraction ϕ m of particles, which is always less than unity. For random close packing of uniform spheres, ϕ m is 0.637. The packing limit, that is, ϕ m , is 0.7404 for hexagonal close packing of uniform spheres.
Mooney [13] argued that the functional relationship, Equation (11), should be modified to the following form in order to take into account the packing limit of particles:
η r ( ϕ 1 + ϕ 2 ) = η r ( ϕ 1 1 ϕ 2 / ϕ m ) × η r ( ϕ 2 1 ϕ 1 / ϕ m )
This functional relationship has the following solution that also satisfies the Einstein equation in the limit 0 :
η r = e x p ( 2.5 ϕ 1 ϕ / ϕ m )
According to Krieger and Dougherty [14], Equation (13) over-corrects the crowding and packing of particles. They suggested the following functional relationship:
η r ( ϕ 1 + ϕ 2 ) = η r ( ϕ 1 ) × η r ( ϕ 2 1 ϕ 1 / ϕ m )
The solution of Equation (15) that also satisfies the Einstein equation in the limit ϕ 0 is as follows:
η r = ( 1 ϕ ϕ m ) 2.5 ϕ m
Several authors have used the “cell model” approach to derive the expressions for the viscosity of suspensions of non-Brownian hard spheres. In the cell model approach, the particles of a suspension are envisioned to reside in well-defined unit cells in which the flow behavior is the same [9,10]. The flow behavior in a unit cell is determined by solving Stokes equations in and around a reference particle surrounded by the matrix. Simha [15] chose the unit cell to be spherical in shape with the reference particle at its center. The cell boundary was considered to be a rigid surface. The solution of Stokes equation inside such a rigid concentric enclosure led to the following expression for the suspension viscosity:
η r = 1 + 5 2 χ 3 [ 4 ( 1 χ 7 ) 42 χ 5 25 χ 3 ( 1 + χ 4 ) + 4 ( 1 + χ 10 ) ]
where χ is the ratio of the particle radius ( R ) to cell radius ( R C ), that is:
χ = R / R C
Happel [16] treated the cell boundary as a frictionless surface and chose the unit cell radius R C to be such that the volume fraction of particle in the cell was equal to the actual volume fraction of particles in the suspension, that is, χ = R / R C = ϕ 1 / 3 . He obtained the following expression of suspension viscosity:
η r = 1 + 5.5 χ 3 [ 4 χ 7 + 10 ( 84 / 11 ) χ 2 10 ( 1 χ 10 ) 25 χ 3 ( 1 χ 4 ) ]
Frankel and Acrivos [17] also utilized the cell model approach to derive a viscosity equation for highly-concentrated hard-sphere dispersions. However, their approach was different from that of Simha [15] and Happel [16] in that they used hydrodynamic lubrication theory to analyze the viscous dissipation in a cell rather than obtaining an exact solution to the Stokes equations. The Frankel and Acrivos equation is as follows:
η r = 9 8 [ ( ϕ / ϕ m ) 1 / 3 1 ( ϕ / ϕ m ) 1 / 3 ]
This equation is valid only in the limit ϕ ϕ m .
Graham [18] modified the Frankel and Acrivos analysis to develop the following viscosity equation for hard sphere non-Brownian suspensions valid over the full range of dispersed-phase concentration ( 0 ϕ ϕ m ):
η r = 1 + 5 2 ϕ + 9 4 [ 1 ψ ( 1 + ψ 2 ) ( 1 + ψ ) 2 ]
where
ψ = 2 [ 1 ( ϕ / ϕ m ) 1 / 3 ( ϕ / ϕ m ) 1 / 3 ]
This equation reduces to the Einstein equation in the limit ϕ 0 and to the Frankel-Acrivos equation in the limit ϕ ϕ m .
The main problem with the cell models is that the results obtained are strongly dependent on the choices of the shape and size of the cells and on the boundary conditions imposed on the cells.
A number of empirical and semi-empirical equations have been proposed in the literature for the viscosity of concentrated hard sphere non-Brownian suspensions. For example, Thomas [19] proposed the following correlation on the relative viscosity of suspensions of uniform spheres based on the extensive amount of experimental data available at that time:
η r = 1 + 2.5 ϕ + 10.05 ϕ 2 + 0.00273 exp ( 16.6 ϕ )
Another empirical equation popular in the literature, originally proposed by Maron and Pierce [20] and later derived by Quemada [21], is as follows:
η r = ( 1 ϕ ϕ m ) 2
Mendoza and Santamaria-Holek [22] proposed the following semi-empirical equation recently to describe the viscosity of concentrated suspensions of spherical rigid particles:
η r = ( 1 ϕ 1 c ϕ ) 2.5
where c = ( 1 ϕ m ) / ϕ m .
More recently, Faroughi and Huber [23] used the effective medium approach and proposed the following equation for the viscosity of concentrated suspensions of spherical rigid particles:
η r = [ ϕ m ϕ ϕ m ( 1 ϕ ) ] 2.5 ϕ m / ( 1 ϕ m )
Table 1 summarizes and classifies the various suspension viscosity models just discussed. The origin and limitations of the models are also noted.

3. New Approach to Modelling the Viscosity of Suspensions of Non-Brownian Hard Spheres

The viscosity models discussed in the preceding section do not explicitly consider collision and aggregation of particles in a shear field. A number of theoretical and experimental studies [5,24,25,26] indicate that collision and aggregation of particles is a common occurrence in the flow of suspensions of non-Brownian hard spheres. In shear flow of suspension, particles in the same stratum move with the same velocity, and therefore, the mutual distances between the particles do not change. However, particles moving in different strata are moving with different velocities, and therefore, collisions and hence aggregation of particles takes place.
Vand [5] was probably the first to hypothesize the existence of shear-induced microstructure in suspensions even in the absence of any non-hydrodynamic interactions. The experimental work of Graham and Bird [26] confirms the formation of clusters of particles in sheared suspensions where only hydrodynamic forces are present. The experimental observations of Graham and Bird [26] indicate that clusters are continuously created and destroyed in shear flow of suspensions of non-Brownian hard spheres. The clusters formed translate and rotate as the suspension is sheared. Figure 1 shows schematically the existence of clusters in shear flow of suspension. At low concentration of particles, the aggregates may consist of just doublets of particles. With further increase in particle concentration, the size of the aggregates grows from doublets to triplets, from triplets to quartets, and so on. As an example, Figure 2 shows the formation of doublets of particles. When the distance between the particles is relatively large, the particles rotate and translate independently of each other. When the spheres are close enough, they are no longer able to rotate independently. The pair of particles form a doublet that rotates about its center of mass. The rotation of the doublet eventually brings the particles into different strata moving with different velocities resulting in separation of doublet into individual particles.
According to Vand [5], when a doublet is formed, the liquid in the neighborhood of the points of contact of the particles is essentially immobilized. Thus, when aggregates of particles are formed, a significant amount of the continuous phase liquid is immobilized within the aggregates. The immobilized liquid becomes part of the dispersed phase and consequently, the effective volume fraction of the dispersed phase becomes significantly higher than the actual volume fraction of particles. Figure 3 shows schematically some examples of matrix liquid immobilization within different types of clusters of particles.
The number and size of aggregates are expected to grow with the increase in the particle concentration. The aggregation of particles with the increase in particle concentration is shown schematically in Figure 4.
The effective volume fraction of particles ( ϕ e f f ) can be expressed as:
ϕ e f f = k ϕ
where k is the aggregation coefficient. The aggregation coefficient k is unity in the absence of aggregation, otherwise it is greater than unity. The aggregation coefficient k is expected to a be function of ϕ as the size and number of aggregates increase with the increase in ϕ , that is:
ϕ e f f = k ( ϕ ) ϕ
The simplest model of aggregation coefficient is a linear relation:
k = a + b ϕ
Using the boundary conditions: ϕ 0 ,   k = 1 and ϕ ϕ m ,   ϕ e f f = 1 ,   k = 1 / ϕ m , one can readily show that:
k = 1 + [ 1 ϕ m ϕ m 2 ] ϕ
Thus, the effective volume fraction of particles ( ϕ e f f ) can be expressed as:
ϕ e f f = { 1 + [ 1 ϕ m ϕ m 2 ] ϕ } ϕ
Figure 5 shows the plots of aggregation coefficient k for different packing arrangement of particles within clusters. The plots are generated from Equation (30) using the following ϕ m values: random close packing (RCP) of spheres, ϕ m = 0.637 , glass transition concentration of spherical particles, ϕ m = 0.58 , and hexagonal close packing (HCP) of spheres, ϕ m = 0.7404 . For any given ϕ , the effective volume fraction of particles, and hence k , is highest for glassy clusters as the particles are arranged randomly in a loose manner. The lowest value of k corresponds to hexagonal close packing of particles within clusters.
In what follows, a viscosity model is developed for concentrated non-colloidal suspensions of hard spheres taking into consideration shear-induced aggregation of particles. The viscosity model is derived using the differential effective medium approach used extensively by Pal in his work on the development of models for different physical properties of disperse media [27,28,29,30,31,32]. The approach is discussed here only briefly. Consider a concentrated suspension of actual volume fraction of particles ϕ and effective volume fraction of ϕ e f f (expressed in the form of Equation (28) or Equation (31)). The concentrated suspension is now imagined to be obtained from an initial matrix liquid by adding differential or infinitesimally small quantities of particles successively to the system until the final volume fraction of particles is attained. The addition of an infinitesimally small amount of particles at any arbitrary stage (i) leads to the next stage (i + 1). According to the effective medium approach, the suspension of stage (i) can be replaced by an equivalent effective medium, which has the same viscosity as that of suspension at stage (i) and which is homogeneous (single-phase) with respect to the new set of particles added to reach stage (i + 1). As a result, the Einstein equation (Equation (2) with ϕ replaced by ϕ e f f ) can be utilized to calculate the differential increase in viscosity in going from stage (i) to stage (i + 1). This process leads to the development of a differential equation, which can be integrated to obtain the final solution. Roscoe [11] and Brinkman [12] used a similar approach to derive a viscosity equation (Equation (12)) for suspensions of rigid spheres. The differential equation is as follows:
d η η = 2.5 [ d ϕ e f f 1 ϕ e f f ]
Upon integrating Equation (32) with the limit η η c at ϕ = 0 (also ϕ e f f = 0 ), the following result is obtained:
η r = ( 1 ϕ e f f ) 2.5
Substituting Equation (31) in Equation (33), the following model for the viscosity of non-colloidal suspensions of hard spheres is obtained:
η r = [ 1 { 1 + ( 1 ϕ m ϕ m 2 ) ϕ } ϕ ] 2.5
This model could be re-cast as:
η r = [ 1 k ϕ ] 2.5
where k is the aggregation coefficient, given by Equation (30). Although this model (Equation (35)) was published recently by Pal [33], it was never validated for non-colloidal suspensions. Furthermore, the theoretical background leading to the development of the model presented here was lacking.

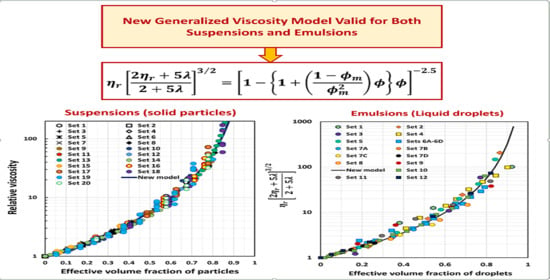
4. Comparison of Experimental Suspension Viscosity Data with Model Predictions

The viscosity models for suspensions of non-Brownian hard spheres discussed in the preceding sections are evaluated using twenty sets of experimental data available on the viscosity of suspensions of non-Brownian hard spheres. Table 2 gives the summary of the various suspension systems considered in evaluating the viscosity models. The suspension systems considered are generally monodispersed or mono-modal consisting of non-Brownian hard spheres of different average particle sizes. Non-hydrodynamic interactions are negligible.
Figure 6, Figure 7, Figure 8, Figure 9, Figure 10, Figure 11 and Figure 12 compare the model predictions with the experimental viscosity data for suspensions of non-Brownian hard spheres. The comparisons reveal the following information: (1) the Einstein and Roscoe-Brinkman models (Equations (2) and (12), respectively) severely under predict the relative viscosity of suspensions (see Figure 6); (2) the Mooney model (Equation (14)) over predicts the suspension viscosity, whereas the Krieger-Dougherty model (Equation (16)) under predicts the viscosity (see Figure 7). The experimental data fall in between the predictions of the Mooney and Krieger-Dougherty models. Note that ϕ m of 0.637 corresponding to random close packing of uniform spheres is used in the models to generate the plots in Figure 7; (3) the cell models of Simha and Happel (Equations (17) and (19), respectively) are a poor fit to the experimental data (see Figure 8). They predict higher viscosities at low concentrations and lower viscosities at high concentrations; (4) The Graham and Thomas empirical equations (Equations (21) and (23), respectively) generally predict lower viscosities at high concentrations ( ϕ > 0.30 ) . The MPQ (Maron-Pierce-Quemada) model (Equation (24)) with ϕ m of 0.637 generally over predicts the viscosity at low concentrations ( ϕ < 0.30 ) and under predicts at high concentrations (see Figure 9); (5) the model proposed by Faroughi and Huber (Equation (26)) over predicts the viscosities (see Figure 10). This is not surprising as they incorrectly incorporated the exclusion effect twice in their derivation as pointed out by Pal [44]; (6) the semi-empirical equation promoted by Mendoza and Santamaria-Holek (Equation (25)) generally under predicts the viscosity especially when ϕ > 0.30   (see Figure 11); and (7) the model proposed in this work, Equation (34), describes the experimental data satisfactorily over the full range of particle concentration (see Figure 12). It represents the average curve for twenty sets of experimental data on the relative viscosity vs. particle concentration of suspensions.
Interestingly, the proposed model, Equation (34), describes all the experimental viscosity data adequately with ϕ m G l a s s ϕ m ϕ m H C P , where ϕ m G l a s s is the glass transition concentration of particles where the suspension becomes glassy and ϕ m H C P is the hexagonal close packing concentration of particles. As noted earlier, ϕ m G l a s s = 0.58 and ϕ m H C P = 0.7404 for uniform spheres. Figure 13 show the bounds generated from the model, Equation (34), using 0.58 ϕ m 0.7404 . As can be seen, all the experimental data fall within the bounds: the upper bound with ϕ m = ϕ m G l a s s = 0.58 and the lower bound with ϕ m = ϕ m H C P = 0.7404 . Thus, it is clear that the variation or spread in experimental relative viscosity data at a given concentration of particles is largely due to different packing microstructure, and hence different ϕ m values, of different suspension systems. Interestingly, all the suspension viscosity data for twenty sets can be collapsed on to a single curve by slight tweaking of ϕ m values. Figure 14 shows the plot where all the twenty sets of experimental viscosity data collapse on to a single master curve. The data are plotted as η r versus ϕ e f f where ϕ e f f is defined in Equation (31). Table 3 summarizes the ϕ m values used in plotting of Figure 14. The ϕ m value varies from one set to another set in the range of 0.58 to 0.68. The average value of ϕ m is 0.6105.
It is interesting to note that the proposed model uncovers some important and novel characteristics of suspension systems rarely discussed heretofore in the literature. For example, consider the relative viscosity vs. particles volume fraction experimental data of Set 10 suspensions, shown in Figure 15. The same suspension system undergoes a transition of microstructure from hexagonally close packed (HCP) clusters to randomly packed clusters (RCP) at a particle volume fraction of about 0.40. A similar behavior is exhibited by other suspension systems shown in Figure 16 and Figure 17. Figure 16 shows the experimental data of Set 18. In this case, the same suspension system undergoes a transition of microstructure from randomly packed clusters (RCP) to glassy clusters at a particle volume fraction of about 0.40. The experimental data of Set 19 is shown in Figure 17. This suspension system undergoes a transition of microstructure from hexagonally close packed (HCP) clusters to randomly packed clusters (RCP) at a particle volume fraction of about 0.35.

5. Viscosity Models for Emulsions of Non-Brownian Spherical Droplets

5.1. Infinitely Dilute Emulsions

Assuming droplets to remain nearly spherical in shape, Taylor [45] developed the following expression for the relative viscosity of infinitely dilute emulsions:
η r = 1 + ( 2 + 5 λ 2 + 2 λ ) ϕ
where λ is the ratio of droplet viscosity ( η d ) to matrix viscosity ( η C ). According to the Taylor equation, Equation (36), the relative viscosity of emulsion depends not only on the volume fraction of inclusions (droplets) but also on the viscosity ratio λ . The Taylor equation reduces to the Einstein equation, Equation (2), in the limit of λ as expected.
The plots of relative viscosity η r versus droplet volume fraction ϕ for dilute emulsions generated from the Taylor equation for different values of the viscosity ratio λ are shown in Figure 18. With the decrease in λ , the relative viscosity of emulsion decreases. When λ , the droplets behave as rigid particles and therefore, the relative viscosity is the highest. When λ 0 , the droplets behave as bubbles and consequently, the relative viscosity is the lowest. It should be noted that when droplets are subjected to a shear field, the fluid within the droplets undergoes internal circulation due to transmission of stresses from the surrounding matrix fluid. The internal circulation reduces the distortion of flow patterns around the droplets in comparison with the solid particles. Consequently, emulsions exhibit lower viscosities in comparison with suspensions.
Like the Einstein equation, the Taylor is valid only when ϕ is small ( ϕ 0 ). It ignores any hydrodynamic and non-hydrodynamic interactions between the droplets.

5.2. Non-Dilute Emulsions

Oldroyd [46] extended the Taylor analysis of the viscosity of infinitely dilute emulsions to higher volume fractions of droplets using the effective medium approach. He first treated emulsion as an equivalent homogeneous medium with properties same as that of the actual emulsion. A small portion of the effective homogeneous medium was then replaced by the actual components of the emulsion. Assuming that there is no difference in the rheological behavior of the two systems at a macroscopic level, the properties of the effective medium were determined. The Oldroyd viscosity equation for emulsions is as follows:
η r = [ 1 + 3 2 ϕ H 1 ϕ H ]
where
H = ( 2 + 5 λ 5 + 5 λ )
The Oldroyd model, Equation (37), reduces to Equation (4) in the limit λ where H = 1 . In the limit ϕ 0 , the Oldroyd model reduces to the Taylor equation, Equation (36).
Yaron and Gal-Or [47] and Choi and Schowalter [48] used the “cell model” approach to derive the expressions for the viscosity of concentrated emulsions of spherical droplets. Following the cell model approach of Happel [16], Yaron and Gal-Or [47] derived the following expression for the emulsion viscosity:
η r = 1 + 5.5 χ 3 [ 4 χ 7 + 10 ( 84 / 11 ) χ 2 + ( 4 / λ ) ( 1 χ 7 ) 10 ( 1 χ 10 ) 25 χ 3 ( 1 χ 4 ) + ( 10 / λ ) ( 1 χ 3 ) ( 1 χ 7 ) ]
Choi and Schowalter [48] extended the cell model analysis of Simha [15] for concentrated suspensions to concentrated emulsions. They derived the following expression for the emulsion viscosity:
η r = 1 + 5 2 χ 3 [ 4 { ( λ + 2 5 ) ( λ 1 ) χ 7 } 4 ( 1 + λ ) 5 ( 2 + 5 λ ) χ 3 + 42 λ χ 5 5 ( 5 λ 2 ) χ 7 + 4 ( λ 1 ) χ 10 ) ]
where χ is the ratio of the droplet radius ( R ) to cell radius ( R C ) given as χ = R / R C = ϕ 1 / 3 . In the limit λ , Equation (39) reduces to the Happel model, Equation (19), whereas Equation (40) reduces to the Simha model, Equation (17). Also note that while the Choi and Schowalter model, Equation (40), reduces to the Taylor equation, Equation (36), in the limit ϕ 0 , the Yaron and Gal-Or model, Equation (39), does not reduce to the Taylor equation.
Pal [49] developed the following two expressions for the viscosity of concentrated emulsions of spherical droplets. The differential effective medium approach was utilized to derive these expressions. The crowding and packing of droplets were included in the derivation.
η r [ 2 η r + 5 λ 2 + 5 λ ] 3 / 2 = e x p ( 2.5 ϕ 1 ϕ / ϕ m )
η r [ 2 η r + 5 λ 2 + 5 λ ] 3 / 2 = ( 1 ϕ ϕ m ) 2.5 ϕ m
Equation (41) reduces to the Mooney equation, Equation (14), in the limit λ , whereas Equation (42) reduces to the Krieger-Dougherty equation, Equation (16), when λ .
Pal [50] also proposed and verified through experimental viscosity data that, in general, any explicit relative viscosity vs. concentration equation for suspension can be transformed to emulsion relative viscosity vs. concentration equation by replacing η r with η r [ ( 2 η r + 5 λ ) / ( 2 + 5 λ ) ] 3 / 2 . Thus, the suspension viscosity model proposed in Section 3 and validated with experimental data for suspensions in Section 4 can be generalized to suspensions and emulsions as follows:
η r [ 2 η r + 5 λ 2 + 5 λ ] 3 / 2 = [ 1 k ϕ ] 2.5
where k is the aggregation coefficient, given by Equation (30). From Equations (30) and (43), it follows that:
η r [ 2 η r + 5 λ 2 + 5 λ ] 3 / 2 = [ 1 { 1 + ( 1 ϕ m ϕ m 2 ) ϕ } ϕ ] 2.5
Equation (44) is a new generalized model for the viscosity of concentrated suspensions and emulsions never published heretofore. This model takes into consideration the shear-induced aggregation and packing of inclusions (solid particles, droplets, or bubbles) and associated increase in the effective dispersed phase concentration. In the case of fluidic inclusions (droplets and bubbles), the model also incorporates the effect of the viscosity ratio λ , that is, the ratio of inclusion material viscosity to matrix liquid viscosity. The full derivation of the new generalized model, Equation (44), is given in Appendix A.
Figure 19 compares the predictions of various emulsion viscosity models for viscosity ratio λ of 2.5. The maximum packing volume fraction ϕ m is taken as 0.637. Note that the Oldroyd model (Equation (37)) and the cell models of Choi and Schowalter (Equation (40)) and Yaron and Gal-Or (Equation (39)) do not involve any ϕ m . The Oldroyd and cell models show, relatively speaking, a gradual rise in the emulsion viscosity with the increase in volume fraction of droplets ( ϕ ) . For a given ϕ , these models generally predict emulsion relative viscosity in the following order Oldroyd (Equation (37))<Yaron and Gal-Or (Equation (39))<Choi and Schowalter (Equation (40)). The models involving the crowding effect and packing limit ( ϕ m ) of droplets, that is, Equations (41), (42), and (44) all show a much sharper rise in the emulsion relative viscosity with the increase in volume fraction of droplets. The new model proposed in this work, that is, Equation (44), predicts emulsion relative viscosities, which fall in between the predictions of Equations (41) and (42).

6. Comparison of Experimental Emulsion Viscosity Data with Proposed Model Predictions

The generalized viscosity model for emulsions and suspensions proposed in the preceding section is evaluated using twenty-three sets of experimental data available on the viscosity of emulsions of non-Brownian spherical droplets. Table 4 gives the summary of the various emulsion systems considered in evaluating the viscosity models. The emulsion systems considered are generally monodispersed or mono-modal consisting of non-Brownian droplets of different average droplet sizes. Non-hydrodynamic interactions are negligible.
Figure 20 compares the experimental viscosity data for emulsions of non-Brownian spherical droplets with the prediction of the proposed suspension model (Equation (34)) ignoring the effect of the viscosity ratio. Except for Set 12 data (Pickering emulsions), all the emulsion viscosity data fall well below the suspension curve. This is not unexpected as the viscosity ratio λ plays an important role in determining the viscosity of an emulsion. For example, the viscosity of a suspension of bubbles ( λ 0 ) is expected to be much lower than the viscosity of a suspension of solid particles ( λ ) at the same volume fraction of the dispersed phase ϕ . Pickering emulsions (Set 12 data) follow the suspension curve as the droplets of such emulsions are covered with a rigid layer of solid nanoparticles.
When the effect of viscosity ratio is taken into account, the agreement between the experimental emulsion viscosity data and model prediction improves markedly. Figure 21 shows comparison between emulsion viscosity data and proposed emulsion model (Equation (44)) that takes into consideration the effect of the viscosity ratio. Clearly the agreement between the model prediction and experimental data has improved markedly as compared with the suspension viscosity model shown in Figure 20. The maximum packing volume fraction ϕ m is taken as 0.637 in the model. Although the proposed emulsion model (Equation (44)) with ϕ m of 0.637 describes the experimental data reasonably well, there is a significant scatter of data around the model prediction.
Interestingly, the proposed model, Equation (44), describes the experimental viscosity data adequately with ϕ m G l a s s ϕ m ϕ m H C P , where ϕ m G l a s s is the glass transition concentration of droplets where the emulsion becomes glassy and ϕ m H C P is the hexagonal close packing concentration of droplets. Note that ϕ m G l a s s = 0.58 and ϕ m H C P = 0.7404 for uniform spherical droplets. Figure 22 show the bounds generated from the model, Equation (44), using 0.58 ϕ m 0.7404 . As can be seen, most of the experimental data fall within the bounds: the upper bound with ϕ m = ϕ m G l a s s = 0.58 and the lower bound with ϕ m = ϕ m H C P = 0.7404 . The variation or spread in experimental relative viscosity data at a given concentration of droplets is largely due to different packing microstructure, and hence different ϕ m values, of different emulsion systems. Interestingly, the experimental viscosity data for emulsions can be collapsed on to a single curve by slight tweaking of ϕ m values. Figure 23 shows the plot where all the experimental viscosity data collapse on to a single master curve. The data are plotted as η r versus ϕ e f f where ϕ e f f is defined in Equation (31). Table 5 summarizes the ϕ m values used in plotting Figure 23. The ϕ m value varies from one set to another set in the range of 0.637 to 0.7404. The average value of ϕ m is 0.67.
In Figure 24, the experimental relative viscosity data at a fixed ϕ value of 0.5 but varying viscosity ratio λ (Sets 13–17, Table 4) are compared with the predictions of the proposed emulsion model, Equation (44). At low to moderate values of viscosity ratio ( λ < 10 ), the emulsion viscosity data follow the model with ϕ m of 0.637 (random close packing of droplets). At high viscosity ratios ( λ > 10 ), the viscosity data follow the model with ϕ m of 0.7404 (hexagonal close packing of droplets). Thus, the microstructure of emulsions is affected by the viscosity ratio λ .

7. Conclusions

The viscous behavior of dilute and concentrated suspensions of non-Brownian hard spheres is reviewed. The existing viscosity models for suspensions are tested using a large pool of experimental viscosity data (twenty sets) available on suspensions. No single model is found to describe the experimental viscosity data of suspensions adequately. A new model is proposed for the viscosity of concentrated suspensions of non-Brownian hard spheres, taking into consideration the shear-induced aggregation and maximum packing of particles. The model is validated using the available viscosity data on suspensions. The proposed suspension viscosity model uncovers some important and novel characteristics of suspension systems rarely discussed heretofore in the literature.
The viscous behavior of dilute and concentrated emulsions of non-Brownian droplets is reviewed. The available viscosity models for emulsions are discussed. A new generalized viscosity model is proposed for suspensions and emulsions taking into consideration the effect of the viscosity ratio λ . The generalized model reduces to the proposed suspension viscosity model in the limit λ . The new generalized viscosity model for suspensions and emulsions is validated using the available viscosity data for suspensions and emulsions. Thus, a single model describes the viscosity data for both suspensions and emulsions adequately.

Funding

This research received no external funding.

Conflicts of Interest

The author declares no conflict of interest.

Appendix A. Derivation of Equation (44)

Equation (44) can be derived in a manner similar to the derivation of suspension viscosity equation, Equation (34), using the differential effective medium approach. The Taylor equation, Equation (36), for the viscosity of infinitely dilute emulsions is used to determine the incremental increase in the emulsion viscosity d η when the effective dispersed phase concentration of the emulsion is increased by a differential amount d ϕ e f f . Thus,
d η = η [ 5 η d + 2 η 2 η d + 2 η ] [ d ϕ e f f 1 ϕ e f f ]
where η is the emulsion viscosity, η d is the viscosity of the dispersed-phase (droplets), and ϕ e f f is the effective volume fraction of dispersed phase given by Equation (31) as:
ϕ e f f = { 1 + [ 1 ϕ m ϕ m 2 ] ϕ } ϕ
Upon integration, Equation (A1) gives:
η r [ 2 η r + 5 λ 2 + 5 λ ] 3 / 2 = [ 1 { 1 + ( 1 ϕ m ϕ m 2 ) ϕ } ϕ ] 2.5
where η r is the relative viscosity of emulsion and λ is the viscosity ratio (ratio of dispersed-phase viscosity to matrix viscosity). Equation (A3) is the same as Equation (44).

References

  1. Pal, R. Rheology of Particulate Dispersions and Composites; CRC Press: Boca Raton, FL, USA, 2007. [Google Scholar]
  2. Pal, R. Fundamental Rheology of Disperse Systems Based on Single-Particle Mechanics. Fluids 2016, 1, 40. [Google Scholar] [CrossRef]
  3. Guth, E.; Simha, R. Untersuchungen über die Viskosität von Suspensionen und Lösungen. 3. Über die Viskosität von Kugelsuspensionen. Kolloid Z. 1936, 74, 266–275. [Google Scholar] [CrossRef]
  4. Saito, N. Concentration Dependence of the Viscosity of High Polymer Solutions. I. J. Phys. Soc. Jpn. 1950, 5, 4–8. [Google Scholar] [CrossRef]
  5. Vand, V. Viscosity of Solutions and Suspensions. I. Theory. J. Phys. Colloid Chem. 1948, 52, 277–299. [Google Scholar] [CrossRef] [PubMed]
  6. Manley, R.S.J.; Mason, S.G. The viscosity of suspensions of spheres: A note on the particle interaction coefficient. Can. J. Chem. 1954, 32, 763–767. [Google Scholar] [CrossRef]
  7. Batchelor, G.K.; Green, J.T. The determination of the bulk stress in a suspension of spherical particles to order c 2. J. Fluid Mech. 1972, 56, 401. [Google Scholar] [CrossRef]
  8. Pal, R. Viscosity-Concentration relationships for nanodispersions based on glass transition point. Can. J. Chem. Eng. 2017, 95, 1605–1614. [Google Scholar] [CrossRef]
  9. Pal, R. Rheology of emulsions containing polymeric liquids. In Encyclopedia of Emulsion Technology; Becher, P., Ed.; Marcel Dekker: New York, NY, USA, 1996; Volume 4, pp. 93–263. [Google Scholar]
  10. Pal, R. Rheology of simple and multiple emulsions. Curr. Opin. Colloid Interface Sci. 2011, 16, 41–60. [Google Scholar] [CrossRef]
  11. Roscoe, R. The viscosity of suspensions of rigid spheres. Br. J. Appl. Phys. 1952, 3, 267–269. [Google Scholar] [CrossRef]
  12. Brinkman, H.C. The Viscosity of Concentrated Suspensions and Solutions. J. Chem. Phys. 1952, 20, 571–581. [Google Scholar] [CrossRef]
  13. Mooney, M. The viscosity of a concentrated suspensions of spherical particles. J. Colloid Sci. 1951, 6, 162–170. [Google Scholar] [CrossRef]
  14. Krieger, I.M.; Dougherty, T.J. Mechanism for non-Newtonian flow in suspensions of rigid particles. Trans. Soc. Rheol. 1959, 3, 137–152. [Google Scholar] [CrossRef]
  15. Simha, R. A Treatment of the Viscosity of Concentrated Suspensions. J. Appl. Phys. 1952, 23, 1020. [Google Scholar] [CrossRef]
  16. Happel, J. Viscosity of Suspensions of Uniform Spheres. J. Appl. Phys. 1957, 28, 1288. [Google Scholar] [CrossRef]
  17. Frankel, N.A.; Acrivos, A. On the viscosity of a concentrated suspension of solid spheres. Chem. Eng. Sci. 1967, 22, 847–853. [Google Scholar] [CrossRef]
  18. Graham, A.L. On the viscosity of suspensions of solid spheres. Appl. Sci. Res. 1981, 37, 275–286. [Google Scholar] [CrossRef]
  19. Thomas, D.G. Transport characteristics of suspension: VIII. A note on the viscosity of Newtonian suspensions of uniform spherical particles. J. Colloid Sci. 1965, 20, 267–277. [Google Scholar] [CrossRef]
  20. Maron, S.H.; Pierce, P.E. Application of Ree-Eyring generalized flow theory to suspensions of spherical particles. J. Colloid Sci. 1956, 11, 80–95. [Google Scholar] [CrossRef]
  21. Quemada, D. Rheology of concentrated disperse systems and minimum energy dissipation principle: 1. Viscosity-concentration relationship. Rheol. Acta 1977, 16, 82–94. [Google Scholar] [CrossRef]
  22. Mendoza, C.I.; Santamaria-Holek, I. The rheology of hard sphere suspensions at arbitrary volume fractions: An improved differential viscosity model. J. Chem. Phys. 2009, 130, 44904. [Google Scholar] [CrossRef] [Green Version]
  23. Faroughi, S.A.; Huber, C. A generalized equation for rheology of emulsions and suspensions of deformable particles subjected to simple shear flow at low Reynolds number. Rheol. Acta 2015, 54, 85–108. [Google Scholar] [CrossRef]
  24. Van den Temple, M. Effect of droplet flocculation on emulsion viscosity. In Rheology of Emulsions; Sherman, P., Ed.; Pergamon Press Ltd.: Oxford, UK, 1963. [Google Scholar]
  25. Gillespie, T. The effect of concentration on the viscosity of suspensions and emulsions. In Rheology of Emulsions; Sherman, P., Ed.; Pergamon Press Ltd.: Oxford, UK, 1963. [Google Scholar]
  26. Graham, A.L.; Bird, R.B. Particle clusters in concentrated suspensions. 1. Experimental observations of particle clusters. Ind. Eng. Chem. Fundam. 1984, 23, 406–410. [Google Scholar] [CrossRef]
  27. Pal, R. A new model for the viscosity of asphaltene solutions. Can. J. Chem. Eng. 2015, 93, 747–755. [Google Scholar] [CrossRef]
  28. Pal, R. Rheology of suspensions of solid particles in power-law fluids. Can. J. Chem. Eng. 2015, 93, 166–173. [Google Scholar] [CrossRef]
  29. Pal, R. Electromagnetic, Mechanical, and Transport Properties of Composite Materials; CRC Press: Boca Raton, FL, USA, 2014. [Google Scholar]
  30. Pal, R. Porosity-Dependence of Effective Mechanical Properties of Pore-Solid Composite Materials. J. Compos. Mater. 2005, 39, 1147–1158. [Google Scholar] [CrossRef]
  31. Pal, R. On the Electrical Conductivity of Particulate Composites. J. Compos. Mater. 2007, 41, 2499–2511. [Google Scholar] [CrossRef]
  32. Pal, R. Thermal conductivity of three-component composites of core-shell particles. Mater. Sci. Eng. A 2008, 498, 135–141. [Google Scholar] [CrossRef]
  33. Pal, R. New Models for the Viscosity of Nanofluids. J. Nanofluids 2014, 3, 260–266. [Google Scholar] [CrossRef]
  34. Vand, V. Viscosity of solutions and suspensions. II. Experimental determination of the viscosity-concentration function of spherical inclusions. J. Phys. Colloid Chem. 1948, 52, 300–314. [Google Scholar] [CrossRef] [PubMed]
  35. Ward, S.G.; Whitmore, R.L. Studies of the viscosity and sedimentation of suspensions Part 1—The viscosity of suspension of spherical particles. Br. J. Appl. Phys. 1950, 1, 286–290. [Google Scholar] [CrossRef]
  36. Lewis, T.B.; Nielsen, L.E. Viscosity of Dispersed and Aggregated Suspensions of Spheres. J. Rheol. 1968, 12, 421–443. [Google Scholar] [CrossRef]
  37. Rutgers, I.R. Relative viscosity of suspensions of rigid spheres in Newtonian liquids. Rheol. Acta 1962, 2, 202–210. [Google Scholar] [CrossRef]
  38. Ting, A.P.; Luebbers, R.H. Viscosity of suspensions of spherical and other isodimensional particles in liquids. AIChE J. 1957, 3, 111–116. [Google Scholar] [CrossRef] [Green Version]
  39. Zarraga, I.E.; Hill, D.A.; Leighton, D.T. The characterization of the total stress of concentrated suspensions of noncolloidal spheres in Newtonian fluids. J. Rheol. 2000, 44, 185–220. [Google Scholar] [CrossRef]
  40. Tanner, R.I.; Qi, F.; Dai, S. Scaling the normal stresses in concentrated non-colloidal suspensions of spheres. Rheol. Acta 2013, 52, 291–295. [Google Scholar] [CrossRef]
  41. Chong, J.S.; Christiansen, E.B.; Baer, A.D. Rheology of concentrated suspensions. Trans. Soc. Rheol. 1968, 12, 281–301. [Google Scholar] [CrossRef]
  42. Ilić, V.; Phan-Thien, N. Viscosity of concentrated suspensions of spheres. Rheol. Acta 1994, 33, 283–291. [Google Scholar] [CrossRef]
  43. Smith, J.H. Rheology of Concentrated Suspensions of Spheres. Ph.D. Thesis, California Institute of Technology, Pasadena, CA, USA, 1972. [Google Scholar]
  44. Pal, R. Comment on “Effective thermal conductivity of metal and non-metal particulate composites with interfacial thermal resistance at high volume fraction of nano to macro-sized spheres”. J. Appl. Phys. 2015, 117, 216101. [Google Scholar] [CrossRef]
  45. Taylor, G.I. The viscosity of a fluid containing small drops of another liquid. Proc. R. Soc. Lond. Ser. A Math. Phys. Sci. 1932, 138, 41–48. [Google Scholar] [CrossRef]
  46. Oldroyd, J.G. The elastic and viscous properties of emulsions and suspensions. Proc. R. Soc. Lond. Ser. A Math. Phys. Sci. 1953, 218, 122–132. [Google Scholar] [CrossRef]
  47. Yaron, I.; Gal-Or, B. On viscous flow and effective viscosity of concentrated suspensions and emulsions. Rheol. Acta 1972, 11, 241–252. [Google Scholar] [CrossRef]
  48. Choi, S.J.; Schowalter, W.R. Rheological properties of nondilute suspensions of deformable particles. Phys. Fluids 1975, 18, 420–427. [Google Scholar] [CrossRef]
  49. Pal, R. Novel viscosity equations for emulsions of two immiscible liquids. J. Rheol. 2001, 45, 509–520. [Google Scholar] [CrossRef]
  50. Pal, R. Single-Parameter and Two-Parameter Rheological Equations of State for Nondilute Emulsions. Ind. Eng. Chem. Res. 2001, 40, 5666–5674. [Google Scholar] [CrossRef]
  51. Pal, R. Rheological properties of emulsions of oil in aqueous non-newtonian polymeric media. Chem. Eng. Commun. 1992, 111, 45–60. [Google Scholar] [CrossRef]
  52. Pal, R. Rheology of polymer-thickened emulsions. J. Rheol. 1992, 36, 1245–1259. [Google Scholar] [CrossRef]
  53. Hsieh, I.T.G. On-Line Viscosity Measurement of Emulsions. Master’s Thesis, University of Waterloo, Waterloo, ON, Canada, 2000. [Google Scholar]
  54. Pal, R. Emulsions: Pipeline Flow Behavior, Viscosity Equations, and Flow Measurement. Ph.D. Thesis, University of Waterloo, Waterloo, ON, Canada, 1987. [Google Scholar]
  55. Pal, R. Shear viscosity behavior of emulsions of two immiscible liquids. Colloid Interface Sci. 2000, 225, 359–366. [Google Scholar] [CrossRef]
  56. Leviton, A.; Leighton, A. Viscosity Relationships in Emulsions Containing Milk Fat. J. Phys. Chem. 1936, 40, 71–80. [Google Scholar] [CrossRef]
  57. Bains, U. In-Situ Continuous Monitoring of Catastrophic Phase Inversion and Viscosity of Pickering Emulsions. Master’s Thesis, University of Waterloo, Waterloo, ON, Canada, 2018. [Google Scholar]
  58. Buhidma, A. Flow Measurement of Two-Phase Oil-In-Water Emulsions Using Wedge Meters and Segmental Orifice Meters. Master’s Thesis, University of Waterloo, Waterloo, ON, Canada, 1995. [Google Scholar]
  59. Wolf, B.; Lam, S.; Kirkland, M.; Frith, W.J. Shear thickening of an emulsion stabilized with hydrophilic silica particles. J. Rheol. 2007, 51, 465. [Google Scholar] [CrossRef]
  60. Pal, R. Viscoelastic properties of polymer-thickened oil-in-water emulsions. Chem. Eng. Sci. 1996, 51, 3299–3305. [Google Scholar] [CrossRef]
  61. Pal, R. Multiple O/W/O Emulsion Rheology. Langmuir 1996, 12, 2220–2225. [Google Scholar] [CrossRef]
  62. Sibree, J.O. The viscosity of emulsions—Part 1. Trans. Faraday Soc. 1930, 104, 26–36. [Google Scholar] [CrossRef]
  63. Broughton, G.; Squires, L. The viscosity of oil-water emulsions. J. Phys. Chem. 1938, 42, 253–263. [Google Scholar] [CrossRef]
  64. Pal, R. Rheological behaviour of surfactant-flocculated water-in-oil emulsions. Colloids Surf. A 1993, 71, 173–185. [Google Scholar] [CrossRef]
Figure 1. Aggregation/clustering in shear flow of suspension of non-Brownian hard spheres.
Fluids 05 00150 g001
Figure 2. Formation of doublets of particles in shear flow of non-Brownian suspension.
Fluids 05 00150 g002
Figure 3. Effective volume of clusters of particles. The shaded area outside the particles represents the immobilized matrix liquid.
Fluids 05 00150 g003
Figure 4. Variation in microstructure of suspension with successive addition of particles.
Fluids 05 00150 g004
Figure 5. Variation of aggregation coefficient k with ϕ for different packing arrangement of particles within clusters.
Fluids 05 00150 g005
Figure 6. Comparison of experimental viscosity data for suspensions of non-Brownian hard spheres with the predictions of Einstein equation and Roscoe-Brinkman model.
Fluids 05 00150 g006
Figure 7. Comparison of experimental viscosity data for suspensions of non-Brownian hard spheres with the predictions of Mooney and Krieger-Dougherty equations ( ϕ m = 0.637 ) .
Fluids 05 00150 g007
Figure 8. Comparison of experimental viscosity data for suspensions of non-Brownian hard spheres with the predictions of Simha and Happel models.
Fluids 05 00150 g008
Figure 9. Comparison of experimental viscosity data for suspensions of non-Brownian hard spheres with the predictions of Graham, Thomas, and Maron-Pierce-Quemada (MPQ) models. ϕ m = 0.637 for the Graham and MPQ models.
Fluids 05 00150 g009
Figure 10. Comparison of experimental viscosity data for suspensions of non-Brownian hard spheres with the predictions of model proposed by Faroughi and Huber ( ϕ m = 0.637 ).
Fluids 05 00150 g010
Figure 11. Comparison of experimental viscosity data for suspensions of non-Brownian hard spheres with the predictions of model proposed by Mendoza and Santamaria-Holek ( ϕ m = 0.637 ).
Fluids 05 00150 g011
Figure 12. Comparison of experimental viscosity data for suspensions of non-Brownian hard spheres with the prediction of the proposed model ( ϕ m = 0.637 ).
Fluids 05 00150 g012
Figure 13. Upper and lower bounds predicted from the proposed model, Equation (34). Upper bound with ϕ m = ϕ m G l a s s = 0.58   and lower bound with ϕ m = ϕ m H C P = 0.7404 .
Fluids 05 00150 g013
Figure 14. Comparison of experimental viscosity data for suspensions of non-Brownian hard spheres with the prediction of the proposed model, Equation (34) ( ϕ m varies from one set to another in the range of 0.58 to 0.68).
Fluids 05 00150 g014
Figure 15. Transition in suspension microstructure from hexagonally close packed (HCP) clusters to randomly packed clusters (RCP) at a particle volume fraction of about 0.40.
Fluids 05 00150 g015
Figure 16. Transition in suspension microstructure from randomly packed clusters (RCP) to glassy clusters at a particle volume fraction of about 0.40.
Fluids 05 00150 g016
Figure 17. Transition in suspension microstructure from hexagonally close packed (HCP) clusters to randomly packed clusters (RCP) at a particle volume fraction of about 0.35.
Fluids 05 00150 g017
Figure 18. Relative viscosity η r versus droplet concentration ϕ for dilute emulsions for different values of the viscosity ratio λ .
Fluids 05 00150 g018
Figure 19. Comparison of various emulsion viscosity models (viscosity ratio λ = 2.5 and ϕ m = 0.637 ).
Fluids 05 00150 g019
Figure 20. Comparison of experimental viscosity data for emulsions with proposed suspension model (Equation (34) with ϕ m of 0.637).
Fluids 05 00150 g020
Figure 21. Comparison of experimental viscosity data for emulsions with proposed emulsion model (Equation (44) with ϕ m of 0.637).
Fluids 05 00150 g021
Figure 22. Upper and lower bounds predicted from the proposed emulsion model, Equation (44). Upper bound with ϕ m = ϕ m G l a s s = 0.58 and lower bound with ϕ m = ϕ m H C P = 0.7404 .
Fluids 05 00150 g022
Figure 23. Comparison of experimental viscosity data for emulsions of non-Brownian droplets with the prediction of the proposed model, Equation (44) ( ϕ m varies from one set to another in the range of 0.637 to 0.7404).
Fluids 05 00150 g023
Figure 24. Comparison of experimental viscosity data for emulsions with the prediction of the proposed emulsion model, Equation (44), at a fixed ϕ value of 0.5 but varying viscosity ratio λ .
Fluids 05 00150 g024
Table 1. Summary and classification of various available suspension viscosity models.
Class of Suspension Viscosity ModelEquation NumbersReferencesComments
Exact theoretical models(2)[2]The exact theoretical models are based on single particle mechanics. The dipole strength of a single particle immersed in an infinite matrix fluid is calculated rigorously from the knowledge of flow fields around the particle. Using the dipole strength, the exact rheological constitutive equation for dilute suspension is developed.
Virial expansions of viscosity(3)[3,4,5,6,7]Only the truncated form of the virial expansion of viscosity is useful as the virial coefficients of third and higher order are generally not known.
Effective medium models-no packing limit(8), (12)[11,12]The drawback of these models is that they place no restriction on the amount of dispersed (particulate) phase that can be incorporated in a suspension. They allow the volume fraction of the dispersed particles to reach unity. This is physically impossible in a suspension of rigid particles.
Effective medium models—with packing limit(14), (16), (26)[13,14,23]The effective medium models with packing limit are popular in the literature as they incorporate the effects of crowding and packing of particles on the suspension viscosity. The viscosity of suspension diverges when the packing limit is reached. However, the available models often fail to correctly account for the crowding and packing effects of particles on suspension viscosity. For example, the Mooney equation, Equation (14), often over predicts and the Krieger-Dougherty equation, Equation (16), often under predicts the suspension viscosity
Cell models(17), (19), (20)[15,16,17]The drawback of the cell model approach is that it gives different expressions of suspension viscosity depending on the shape and size of the cell and the boundary condition specified at the boundary of the cell. There is no single equation (derived on the basis of the cell model approach) that is known to describe the viscosity data of suspensions adequately.
Models based on minimization of viscous energy dissipation(24)[21]The Maron-Pierce-Quemada (MPQ) model, Equation (24), can be derived on the basis of minimization of viscous energy dissipation. One problem with the MPQ model is that it does not reduce to the exact theoretical model (Einstein equation) in the limit ϕ 0
Semi-empirical models(21), (23), (25)[18,19,22]The drawback of these models is that they contain terms or factors which have no theoretical basis. Furthermore, there is no single semi-empirical equation that is known to describe the viscosity data of all suspensions.
Table 2. Summary of various suspension systems considered in evaluating the viscosity models.
Set NoRange of ϕDescriptionSource
10–0.50Glass spheres, diameter range 100–160 µmVand [34]
20–0.30Methyl methacrylate smooth spheres, non-Brownian particles, diameter ratio of largest to smallest particle 1.6:1Ward and Whitmore [35]
30–0.30Methyl methacrylate smooth spheres, non-Brownian particles, diameter ratio of largest to smallest particle 3:1Ward and Whitmore [35]
40–0.397Glass spheres, diameter range 5–10 µmLewis and Nielsen [36]
50–0.410Glass spheres, diameter range 30–40 µmLewis and Nielsen [36]
60–0.50Glass spheres, diameter range 45–60 µmLewis and Nielsen [36]
70–0.45Glass spheres, diameter range 90–105 µmLewis and Nielsen [36]
80–0.50Data represents average experimental viscosity curve drawn through several different suspension systems of non-Brownian spheresRutgers [37]
90–0.57Data represents average experimental viscosity curve drawn through several different suspension systems of non-Brownian spheresThomas [19]
100–0.512Glass spheres, diameter 230 µmTing and Luebbers [38]
110–0.50Glass spheres, diameter 43 ± 5.7 µmZarraga et al. [39]
120–0.45Polystyrene spheres, 40 µmTanner et al. [40]
130.50–0.576Monodispersed glass spheres, diameter ranging from 53.8 to 236 µmChong et al. [41]
140–0.40Monodispersed solid spheres, suspensions of different diameter particles Chong et al. [41]
150–0.398Polystyrene spheres, diameter 700 µmIlic and Phan-Thien [42]
160–0.50Monomodal suspensions, glass spheres average diameter 26 µmSmith [43]
170–0.50Monomodal suspensions, glass spheres average diameter 61 µmSmith [43]
180–0.5236Monomodal suspensions, glass spheres average diameter 125 µmSmith [43]
190–0.55Monomodal suspensions, glass spheres average diameter 183 µmSmith [43]
200–0.50Monomodal suspensions, glass spheres average diameter 221 µmSmith [43]
Table 3. Summary of ϕ m values used in the plotting of Figure 14.
Set No ϕ m Set No ϕ m
10.60110.60
20.58120.62
30.58130.64
40.58140.63
50.58150.63
60.60160.61
70.58170.60
80.58180.59
90.68190.65
100.68200.60
Table 4. Summary of various emulsion systems considered in evaluating the viscosity models.
Set NoType of EmulsionRange of ϕViscosity Ratio (λ)DescriptionSource
1O/W0–0.604.15 × 10−3Polymer-thickened emulsionsPal [51]
2O/W0–0.601.12 × 10−2Polymer-thickened emulsions Pal [51]
3O/W0–0.605.82 × 10−2Polymer-thickened emulsionsPal [52]
4W/O0–0.651.65 × 10−1Mineral oil emulsionsHsieh [53]
5O/W0–0.5962.574Mineral oil emulsionsPal [54]
6AO/W0–0.5165.52Set 6 emulsions prepared from same oil and aqueous phase but droplet sizes were differentPal [55]
6BO/W0–0.4945.52Pal [55]
6CO/W0–0.5535.52Pal [55]
6DO/W0–0.5435.52Pal [55]
7AO/W0–0.3435.573Milk-fat emulsions. The matrix phase consisted of skim milk, diluted, and concentrated skim milk Leviton & Leighton [56]
7BO/W0–0.23012.35Leviton & Leighton [56]
7CO/W0–0.39721.74Leviton & Leighton [56]
7DO/W0–0.21829.41Leviton & Leighton [56]
8O/W0–0.6351.17 × 103Heavy oil emulsionsPal [49]
9O/W0–0.5512.67Mineral oil emulsionsPal [54]
10O/W0–0.6023.7Mineral oil emulsionsBains [57]
11O/W0–0.5492.91Mineral oil emulsionsBuhidma [58]
12O/W0–0.554.0Pickering type emulsions; droplets coated with a layer of solid nanoparticles Wolf et al. [59]
13O/W0.53.87 × 10−4–1.95Polymer-thickened emulsionsPal [52,60]
14O/W0.52.574–3.26 × 105Emulsions prepared from different viscosity oilsPal [49,54,55,57,61]
15O/W0.51.7–64.2Limpid and viscous paraffin emulsionsSibree [62]
16O/W0.50.834–123.1Emulsions prepared from three different oils: nujol, benzene, and olive oilBroughton and Squires [63]
17W/O0.50.153–0.447Emulsions prepared from different viscosity oilsPal [54,64]
Table 5. Summary of ϕ m values used in the plotting of Figure 23.
Set No ϕ m Set No ϕ m
10.6377A–7D0.637
20.6780.7404
30.740490.637
40.637100.72
50.68110.637
6A–6D0.66120.637

