Abstract
Wind energy and photovoltaic solar energy (PV) are the most mature renewable energy technologies and are widely used to increase renewable energy penetration in non-interconnected Greek islands. However, their penetration is restricted due to technical issues related to the safe operation of autonomous power systems, the current conventional power infrastructure and their variable power output. In this framework, renewable energy curtailment is sometimes a necessity to ensure the balance between demand and supply. The ability of autonomous power systems to absorb wind and PV power is related to the load demand profile, the type and the flexibility of conventional power plants, the size of power system and the spatial dispersion of wind farms. In this connection, a probabilistic approach for estimating wind energy curtailment is thoroughly applied in most of the autonomous power systems in Greece, using detailed information about load demand and conventional power supply. In parallel, high resolution mesoscale model-based hourly wind data for typical meteorological wind year are used to represent the wind features in all the sites of interest. Technical constraints imposed by the local power system operator, related to the commitment of conventional power plants and the load dispatch strategies are taken into account to maximize renewable energy penetration levels. Finally, application for wide ranges of wind and PV capacity and the thorough analysis of the parameters leads to the presentation of comparable results and conclusions, which could be widely used to predict wind energy curtailment in non-interconnected power systems.
1. Introduction
1.1. Background
In general, energy curtailment mainly occurs in the case of an energy surplus during hours of low demand and transmission grid inadequacy [1]. It is considered as one of the many methods that power system’s operators use to keep a balance between supply and demand [2]. Curtailment of variable output renewable energy, especially wind and solar, increases for high levels of wind and PV penetration [2]. Energy curtailment could happen in large power systems [3,4,5], in local clusters [6] and especially in isolated non-interconnected power systems [2].
Energy curtailment attracts the attention of the scientific community. A reference report on wind energy curtailment has been produced by National Renewable Energy Laboratory (NREL) in 2009, analyzing wind curtailment in several case studies in the USA and in Europe [1]. A more recent publication [3] reviews the international experience with curtailment of wind and solar energy in eleven countries in Europe, North America and Asia, providing a comparison of the level of curtailment, the causes and the market’s operational and institutional issues to reduce renewable energy curtailment. Similar works have focused on China [4,5], parts of China such as the Northeast [6], Germany [7] and Great Britain [8]. The effect of the spatial dispersion of wind power plants on the wind curtailment has been analyzed for the Greek power supply system using mesoscale wind data [9].
Due to the wide range of case studies in Greece, several publications focus on wind energy curtailment in non-interconnected Greek islands [10,11,12]. The relative probabilistic methodology for the estimation of wind power curtailment with application, resulting in a specific Greek island, was presented in 2006 [10]. A similar algorithm based on time-series data is applied in Crete island with a comparative analysis of the results with actual data of wind curtailment [11]. A parallel evaluation of wind energy curtailment was presented for three representative Greek islands, Serifos (small island), Lesvos (medium island) and Crete (large island), demonstrating the use of the annual mean load to levelize wind installed capacity instead of the peak load demand [12].
A step further, there are many papers which focus on Greek islands as a preferable and privileged area to analyze and implement innovative concepts for the large-scale integration of renewable energy sources. On one hand, analysis of various scenarios for Crete accents the fact that higher than 30% of renewable energy sources in electricity supply is not easy to achieve given the existing technical infrastructure [13]. On the other hand, most of the Greek islands are characterized by high current electricity production costs, and the upgrade of current infrastructure through hybrid solutions—such as pumped hydro storage systems or electrochemical lead acid batteries—could be proved cost-effective [14]. The sodium sulfur battery energy storage system is also considered as an effective means to reduce wind power curtailment in Crete island [15]. Recently, some innovative projects are realized in Tilos and Ikaria islands. The former has already been completed and concerns the development and operation of a local smart grid with a wind turbine, PV and battery [16]. The latter was inaugurated in June 2019 and constitutes the first wind hydro pumped storage hybrid system on a Greek island [17].
1.2. Scientific Originality
Besides the abundant wind and solar resources, the effective implementation of wind and PV into the Greek islands is restricted due to technical aspects related to the reliability of local non-interconnected power systems and their ability to absorb variable output renewable power. In this connection, a steady state probabilistic approach was used to recognize the technical limits, the conditions and the consequences from wind and PV integration into autonomous Greek power systems. Renewable energy absorption (or equivalently its complement, the renewable power curtailment) was initially associated with the variability of wind and solar resources and the flexibility of local power systems. In larger systems, the annual distribution of wind power, which is strongly affected by the size of the systems and the spatial distribution of wind farms, could have a positive impact on the ability of the power system to absorb wind power [9]. Conventional units’ commitment, power dispatch and technical constraints were taken into consideration to increase renewable energy penetration and ensure safe operation of the system. Maximum safe renewable energy absorption is of crucial importance for non-interconnected power systems and obviously affects the annual revenues of projects and the actual renewable energy contribution.
A contiguous methodology was applied in three non-interconnected Greek islands (i.e., Serifos, Lesvos and Crete), considering the available wind potential as an unknown parameter [12] and comparative results for low, moderate and high average wind speeds were presented. However, large differences among islands occurred in wind potential and load demand profile. The former due to complex terrain in Greece and the latter due to different levels of touristic development, local population, quality of life and climatic conditions.
In this connection, high resolution mesoscale data were used to introduce accurate information about wind potential in each case study. Mesoscale modeling is considered as one of the methods of wind resource assessment, summarized in the review of Landberg et al. (2003) [18], especially when high resolution modeling is combined with long term measurements [19]. Additionally, actual data, such as load demand and details of local conventional power plants, were used for all the examined non-interconnected power system case studies. The objective of this work was to identify the effect of the parameters on the results and draw comparative conclusions about wind and PV integration in respect to curtailment. For this purpose, all the available information was used for the thorough analysis of Greek island case studies. As a result, an overview of the Greek islands’ power systems is presented with details about interconnections, current wind and PV integration, conventional power units, wind and solar potential. It was a strategic choice of this work to provide a parallel comparative presentation of data, application, analysis and results for many case studies, in order to increase the compatibility of the results and draw conclusions which could be used in other similar cases worldwide.
1.3. Current Power System Situation in Greek Islands
Greece has a large number of islands with an estimation of about 3000, but only 124 are inhabited. Their size varies from many small rock-islands, up to very big islands, such as Crete which is the fourth largest Mediterranean island. Almost 16% of the population of Greece lives on islands, while the area of islands represents 19% of the whole Greek territory.
More than one third of the Greek islands (35%) is electrified by local power stations or are interconnected with other contiguous islands. Local power stations use exclusively diesel and heavy fuel oil (HFO). Another significant part of Greek islands (36%) is interconnected with the mainland, and finally, there are still some small rock-islands (29%) without local station or interconnection.
In Table 1, a classification of Greek islands in relation with their current power system situation is presented. In Table 2, the most important Greek islands are presented with details on their location and information about the current power system situation. Crete and most of the islands in Cyclades, Dodecanese, North and East Aegean Sea are not interconnected with the mainland. On the other hand, most of the Ionian, Sporades complex and Saronic Gulf islands are interconnected with the mainland.

Table 1.
Overview of the current power system situation in Greek islands.
Table 2.
Power system situation of the main Greek islands at the end of 2020.
1.4. Non-Interconnected Greek Islands
In this connection, the focus was on the non-interconnected Greek islands. The islands of Mykonos, Syros and the former local power system of Paronaxia (consisting of Paros, Antiparos, Folegandros, Ios, Irakleia, Koufonisi, Naxos, Sikinos and Schinousa), which were recently interconnected (end of 2018), were included in the current connection and were analyzed as non-interconnected cases (Figure 1). According to Public Power Utility data [20], in 2016, in non-interconnected Greek islands the electricity consumption was 5571 GWh while the cumulative peak demand was 1230 MW. The maximum electricity demand was reached in 2010, while the electricity consumption over the last six years decreased due to the economic crisis. The cumulative conventional installed capacity in non-interconnected Greek islands was 1714 MW.
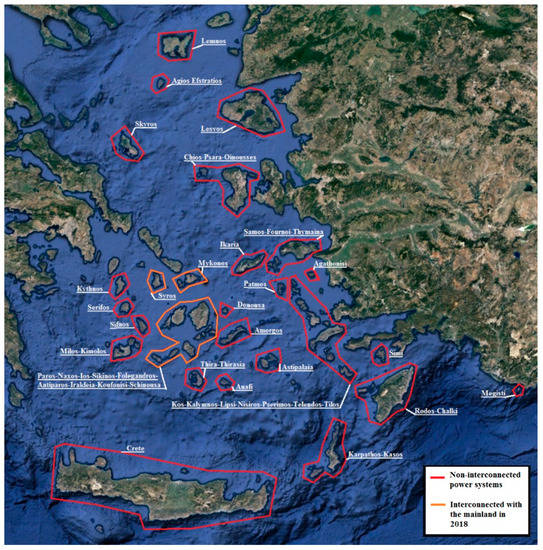
Figure 1.
Overview of non-interconnected power systems in the Aegean Sea.
In Figure 2 and Table 3, a summary of local conventional power stations is presented. Figure 2 provides a comparative splintering of conventional capacity normalized by the peak demand of each island. A succinct view of the number of conventional units and the relative size of each unit are presented for each non-interconnected power system. This figure permits a comparative visual assessment of the local power systems’ flexibility. Local power systems of Crete, Rhodes and Paros consist of more, and relatively smaller, units, and they are more flexible for adjusting the number of conventional units committed to the specific demand during the year. On the other hand, local systems of Amorgos, Milos and Karpathos consist of less, and relatively larger, units, and a more conventional capacity is generally committed than is required, drawing less flexibility and higher technical minimums. Obviously, conventional units’ order of commitment is a critical parameter, related to their cost, technical features, reliability and system operator’s decisions. A classification of the islands in terms of their power system flexibility is presented in Table 4. Most local power systems consist of typical diesel power units with technical minimums in the range 40% to 70%. However, in some cases of larger islands, such as Crete and Rodos together with typical diesel units, low cost heavy fuel oil steam turbines and flexible expensive oil fuel gas turbines are also used with technical minimums of 50–70% and 10–20%, respectively. In Table 3, details about the local demand (peak load, mean load and load factor) and the structure of conventional power system (number of units, minimum and maximum unit, range of technical minimums, fuel and cumulative conventional capacity) are presented.
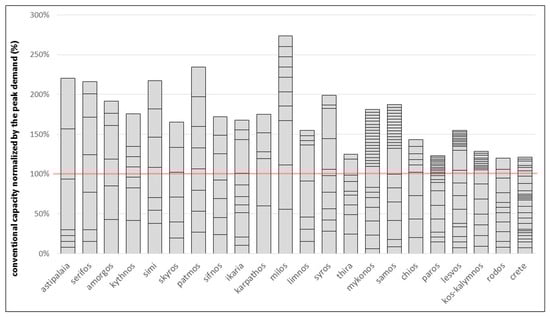
Figure 2.
Splintering of conventional capacity normalized by the peak demand.
Table 3.
Overview of local conventional power stations (data 2016).
Table 4.
Ranking of islands in terms of power system’s flexibility.
High differences occurred in the normalized conventional capacity among the examined local power systems. On one hand, the normalized conventional capacity covered 120–150% of the peak in some large systems such as Crete, Rodos, Kos-Kalymnos, Thira, Paros and Chios. On the other hand, it surpassed the 200% of the peak in some cases of smaller systems (Milos, Patmos, Astipalaia, Serifos, Simi). This diversity was related to the antiquity, the reliability and the load factor of each conventional unit and the ability of local maintenance staff to deal with presumable failures. In other cases, such as Lesvos and Thira, there was a lack of capacity. In Lesvos, there were local reactions against the installation of new conventional power plants. In Thira (Santorini), there were objective difficulties to extend the local power station in addition to the increasing demand due to tourism development.
Greek autonomous electrical systems were classified by their peak demand to 8 “micro” systems—with less than 1 MW maximum demand (Megisti, Anafi, Ag.Efstratios, Othonoi, Erikousa, Donousa, Agathonisi, Anikithira), to 11 “small” of MW-scale—up to 10 MW (Karpathos, Ikaria, Simi, Skyros, Sifnos, Serifos, Patmos, Milos, Kythnos, Astypalaia, Amorgos), to 9 “medium” of the ten-MW-scale (Chios, Syros, Paros, Myconos, Lemnos, Lesvos, Samos, Kos-Kalymnos, Thira) and to 2 “large” systems, Rodos and Crete, with a peak demand of more than 100 MW (195 MW and 645 MW, respectively). In Figure 3, Greek islands with more than a 1 MW peak were classified by their load factor and wind potential. Load factor was defined as the ratio of the annual average by the annual peak load demand of the island. For the wind potential assessment on each island, the wind capacity factor was calculated given the analytical mesoscale wind data hourly timeseries at 50 m height of the typical meteorological wind year [19] and using commercial indicative wind turbine power curves. More specifically, the selection of the class of wind turbine was based on the average wind speed of each island. The Vestas V100-2.0 MW IEC IIB was used for an average wind speed of 7.5–10 m/s, and type V110-2.0 MW IEC IIIA, for lower wind potential cases with an average wind speed of 6–7.5 m/s. The dimensionless power curves used on the calculations are presented in Figure 4.
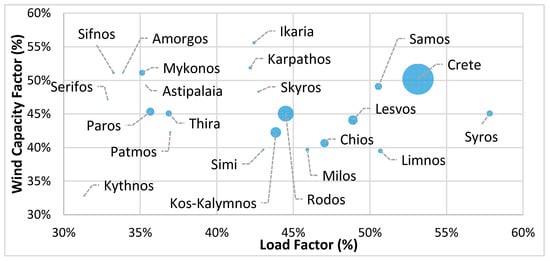
Figure 3.
Overview of the examined case studies classified by their wind capacity factor (at 50 m height), load factor and load demand size.
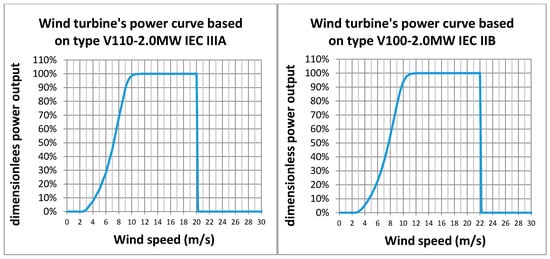
Figure 4.
Dimensionless wind turbine’s power curves.
1.5. Wind and PV Development in Non-Interconnected Greek Islands
The development of wind energy in Greece started on Kythnos island, with the first small wind farm installed in 1982. Later, in 1999, taking advantage of the recently established law 2244/1994, wind energy development was extended by private investors in Crete and other islands. Thanks to the abundant wind potential, the relevant incentives set by legislation and the actuation of investors, the limits of wind energy penetration were reached quickly in most of the medium and large non-interconnected power systems. At that time, wind installed capacity was defined by law as up to 30% of the previous year peak demand. Although a general rule was not easy to draw, a wind installed capacity more than 25–35% of the annual peak load demand was not considered economically feasible due to the rapid increase in the wind curtailment rate [10]. In 2003, the Greek Regulatory Authority for Energy (RAE) specified the limits per island. As a result, the maximum wind energy supply could not exceed 15–20% of the annual needs given the current infrastructure [12]. At that period, a scientific and political debate started about the technical solutions to further increase wind energy exploitation. Especially Hydro Pumped Storage was considered as a promising solution in this direction. The law 3468/2006 set the principles for the operation and the tariffs of these systems.
In 2008, the development of photovoltaics started with small-scale plants up to 100 kWp and roof-top installations up to 10 kWp. From the early beginning of PV development, the Regulatory Authority of Energy sets specific relative limits for the capacity to be installed per island.
Today, according to the official data provided by the Regulatory Authority of Energy, the cumulative wind and PV capacity in non-interconnected Greek islands has reached 319.7 and 161 MW, respectively (data end of 2018). In fact, half of PV capacity and the two thirds of wind capacity were installed in Crete. Wind and PV capacity is presented per island in Table 5, while the normalized wind and PV capacity by the annual mean load of each island is presented in Figure 5. The highest normalized capacity was installed in the power systems of Kythnos, Crete, Rodos and Paros. In most of the islands there is more wind than PV capacity. However, there are 7 out of 22 non-interconnected power systems with only PV installations (Thira, Sifnos, Skyros, Simi, Amorgos, Serfios and Astypalaia). Thira is a unique case of low renewable energy penetration due to the objective low availability of area which makes any Renewable Energy development difficult. In smaller islands, the permitted wind capacity is low, and this set back the realization of the projects. For example, in the island of Skyros the permitted wind installed capacity is only 500 kW. Then, besides the abundant wind potential in the island, it is rather a non-attractive project. The cost of high infrastructures and the small scale of the wind turbine which is no longer offered by the wind industry were some of the drawbacks.
Table 5.
Wind and PV installed capacity in non-interconnected Greek islands.
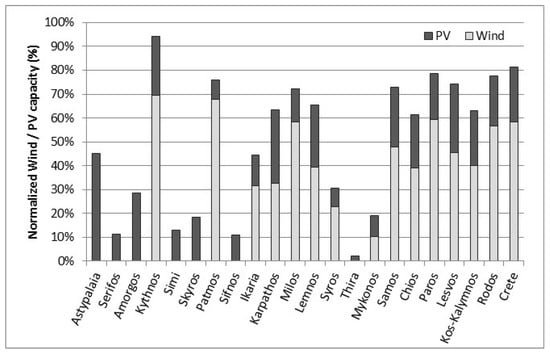
Figure 5.
Normalized wind and photovoltaic solar energy (PV) capacity by the annual mean load in non-interconnected Greek islands.
2. Methodological Approach
2.1. Probabilistic Consideration
For the estimation of the annual wind energy, which can be absorbed safely or must be curtailed by the non-interconnected Greek islands, a probabilistic approach was applied. The first version of this methodology was presented by RAE in 2003 and systematically applied before drawing comparative conclusions to analyze wind energy integration in three representative Greek islands [12]. In the current connection, the methodology was adjusted in order to take into consideration PV integration, and high resolution data were used. The main principle was that load demand and PV production were highly time-dependent, so they were considered as fully dependent variables. Then, PV production was subtracted by the load demand and the remaining demand was resulted. From that, wind production was accounted as an independent variable. The ignorance of the positive correlation between the high demand period and seasonal strong North winds called “Meltemi”, which always flow in Aegean Sea during summer, was considered as a safe side assumption for the produced results. In reality, the positive correlation between summer peak demand and seasonal high winds will result in a higher wind absorption rate than was estimated by the current probabilistic approach.
The flowchart of the methodology is presented in Figure 6. For each non-interconnected power system, Μ different power load situations were identified. For each of them (i), the remaining power load (after the subtraction of PV production from the load) in the specific island was P(L−PV)i and its duration was hi hours annually. The corresponding probability of occurrence was f(P(L−PV)i) = hi/8760, i = 1, M. Calculations for all power load situations resulted in the power load probability distribution function and annual duration curve.
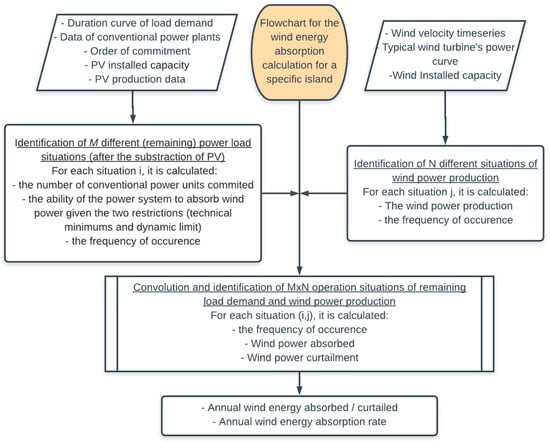
Figure 6.
Flowchart of the probabilistic methodology for the calculation of wind energy absorption.
For each situation i, the grid’s ability to directly absorb wind power P(Ability)i was estimated based on the technical constraints imposed by the system operator. For this purpose, the remaining load demand P(L−PV)i, the necessary conventional power plants to be committed, their technical minimums and the dynamic wind penetration limit applied for stability purposes were taken into consideration. The order of commitment of conventional units were defined by the strategy of the system operator on each island. Different strategies in different seasons of the year could optimize the ability of the system to absorb wind power. Additionally, the order of commitment could be modified due to unit failures. In this connection, due to the lack of more detailed information, the order of commitment provided by the system operator was used. The conventional power plants to be committed should have maximum capacity P(Tmax)i:
Then, the required number of committed thermal power plants ΝTi and their technical minimum P(Tmin)i could be derived, according to the scheduled order of commitment. The use of wind power forecast tools could be used to reduce the required conventional spinning reserves, their technical minimums and finally improve the ability of the power system to absorb wind power. Finally, the grid’s ability to directly absorb wind power P(Ability)i was calculated with respect to the technical minimum of the thermal power stations and the dynamic wind penetration limit applied for stability purposes δ (defined as a percentage of the remaining load power demand) as
It is mentioned that this calculation referred to the grid’s ability to directly absorb wind power and not to the actually absorbed wind power.
Similarly, N different situations of wind power production were identified. For each of them j, the aggregated (aggregated means that wind power output is resulted from the consideration of mesoscale data of more than one point in cases of larger islands or a complex of islands which consist of one local power system) wind power production was PWj and its probability of occurrence was g(PWj), j = 1, N. The corresponding probability distribution and duration curve were calculated.
Convolution of f(P(L−PV)i) and g(PWj) resulted in a 2-D matrix M × N whose elements corresponded to the probability of occurrence of every possible operational mode:
Given the wind power production PWj for each situation j, the wind power absorbed PWA_ij and the wind curtailment PWC_ij were calculated:
The probability of occurrence for every situation, the annual wind energy absorption and the relative annual wind energy absorption rate were calculated.
The above procedure was elaborated and implemented within a computational tool, which foresaw the wind absorption in Greek islands based on typical wind year data, developed and parametrically applied for various scenarios of wind and PV integration in non-interconnected islands.
The necessary data for the application consisted of annual time-series of load demand, characteristics of conventional power plants and time series of wind and PV generation.
2.2. Wind Data—Mesoscale Modeling
Analytical wind data were essential in all the examined case studies islands for this analysis. Wind measurements were practically difficult to represent similar data series and cover every potential area of interest. Existing wind monitoring networks are relatively large and can provide large spatial coverage but not necessarily high resolution [21]. Wind potential maps can only provide an estimate of the spatial distribution of the mean wind speed without any information about the temporal variation. For all this, the application of a Numerical Weather Prediction (NWP) model effectively provided the wind data timeseries required for this analysis.
In this connection, high resolution analytical wind data timeseries for typical wind year were produced by the systematic application of the numerical weather prediction model MM5. An analytical presentation and description of the approach were given in a recent publication [19]. An indicative wind atlas of Greece is presented in Figure 7. High resolution results over Greece [19] were based on a typical wind year simulation for grid boxes 2 × 2 km2 in size. Each month was selected separated from a 10 year period. The typical year consisted of months selected from individual years. The criterion for the selection was to have the most representative month among the 10 available months. The methodology used in order to define the typical months has been analytically described [19] and has been introduced and applied in the past [22]. The numerical weather prediction model (MM5) runs operationally at the National Observatory of Athens since 2002 [23] and has been verified [24,25] for its forecast skill over the area of interest. Based on this systematic application, wind data are available in two heights of 10 and 50 m in the Greek territory. The first wind turbines installed in Greek islands at the end of the 1990s has a rated power of 500–800 kW with a hub height of the order of 40–60 m. This is still today an indicative height of wind turbines in Greek islands, due to the lack of new projects recently. Additionally, in complex terrain the wind profile is not easy to predict, and the use of exponential or logarithmic law is not recommended [26]. Then, taking into consideration the availability of data, the height of wind turbines and the complex terrain, the wind data at 50 m height were considered as the best approach in this connection.
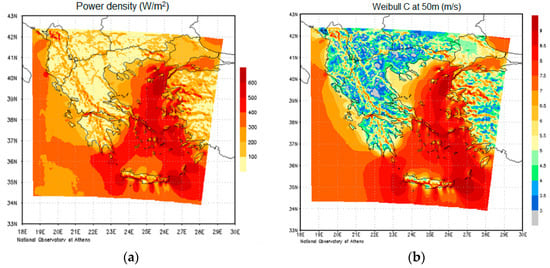
Figure 7.
High resolution wind atlas based on typical wind year (a) power density (W/m2) [19], (b) parameter c of Weibull distribution.
The selection of 32 representative points in the Aegean Archipelago was based on the location of wind farms, as per the interest of the investors, and it is depicted in the RAE’s geographical information system of wind farms application in the Greek territory (Figure 8). The specific number of selected points depended on the size of each island and the spatial dispersion of wind farms. As a result, one point was used in smaller islands, two points in medium islands (i.e., Lesvos), three points in a group of islands with a local interconnection (i.e., Paros–Naxos) and nine points in Crete. The details of the selected 32 points data are presented in Table 6. The target of this approach was to define one timeseries of aggregated wind power output representative for each island or group of islands to be used for the identification of N different situations of wind power production. By this way, the correlation between different locations which host wind farms was taken into consideration. For example, in Crete, 9 simultaneous hourly timeseries of wind velocity were used to develop the probability distribution of the aggregated wind power output in the islands. The wind installed capacity under examination was considered to be split equivalently into the 9 points.
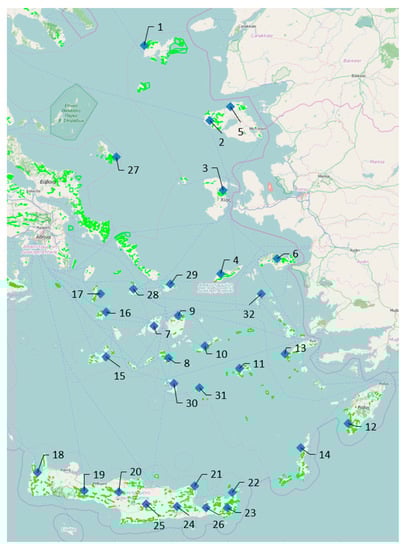
Figure 8.
Overview of wind farms applications in the Greek territory with focus on the Aegean islands [27] and selection of representative points in the non-interconnected power systems.
Table 6.
Wind data based on mesoscale typical wind year data [19].
In order to demonstrate the number of points that were necessary to consider in each island or group of islands, the correlation of wind velocity versus the distance is presented for the selected points (Figure 9). These two charts depict the necessity of more points to represent wind features in larger islands, or on the other hand, justifies why one point is enough in smaller islands. In Lesvos, the correlation factor between the two selected points in a distance of 29 km was 0.81. In the 9 points of Crete, the correlation factor was positive besides the large area of the island. However, due to the complex terrain, the high mountains in the center of the island and the diverse impact of the Aegean and Libyan Sea, a rather moderate correlation factor (0.4–0.6) occurred between some points located in a small distance (<100 km). In the case of Paros–Naxos, the three selected points in Paros, Naxos and Ios, in a distance of 32, 42 and 52 km, resulted in high correlation factors of 0.87, 0.88 and 0.84, respectively, showing the adequacy of three points to describe the wind potential features in this complex.
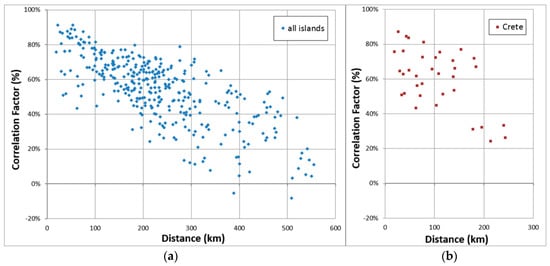
Figure 9.
Correlation factor of wind velocity versus distance: (a) among 32 points (all islands), (b) among 9 points (only Crete island).
The duration curves of aggregated normalized wind power output are presented in Figure 10. Normalized wind power is defined as the ratio P/PR, where P was the wind power output and PR was the rated wind power. Calculations are based on the mesoscale wind data used and the selected points on each island. The smoothing effect on aggregated wind power output, thanks to the integration of wind farms in the wider area, was also depicted in the cases of Crete (9 points), Lesvos (2 points) and Paros–Naxos (3 points). The duration curve of wind power output was affected by the spatial distribution of wind farms. The wind power production history of a single wind turbine typically shows extended time periods with zero or rated production. However, as the spatial dispersion is increased and more wind farms are introduced, the time periods with cumulative zero or rated production are reduced [9,28]. Among the presented curves, the most convenient for the power system operator was the duration curve in Crete which represented the smallest probability of zero or rated wind power output. A classification of the duration curves showed that the best cases were Crete, Paros, Karpathos, Lesvos and Chios. At the other side, the islands with a large probability of zero or rated wind power output were Ikaria, Samos, Myconos, Sifnos and Skyros.
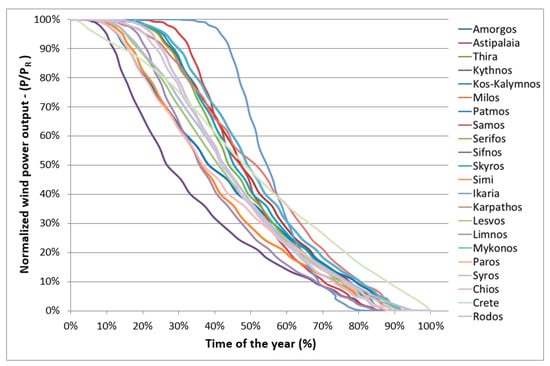
Figure 10.
Annual duration curves of wind power output in all the examined case studies.
2.3. PV and Load Demand Data
For the consideration of PV production, actual time-series provided by CRES (Centre of Renewable Energy Sources) were used and adjusted. The adjustment was based on Photovoltaic Geographical Information System (PVGIS) estimated annual output [29] for fixed ground PV panels (installed in the optimal tilt angle), which is the most typical case in Greek islands. Table 7 and Figure 11 present the information used from PVGIS and representative duration curves of PV power output for five cases.
Table 7.
Adjustment of yearly sum of PV production based on Photovoltaic Geographical Information System (PVGIS) [29].
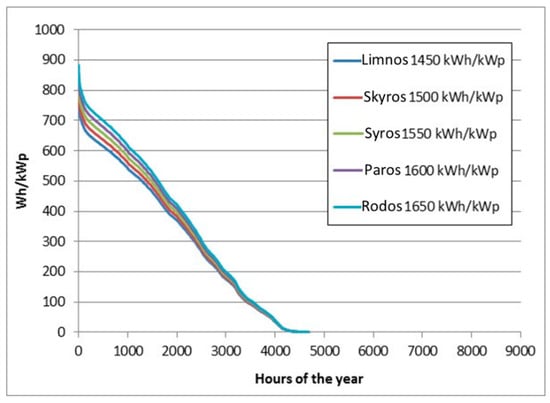
Figure 11.
Annual duration curves of PV power output for five representative islands: 1450–1650 kWh/kWp.
For the consideration of load demand, actual time-series data of the non-interconnected power systems were used (PPC data). The duration curves of normalized power load demand are presented in Figure 12. In order to present comparable duration curves, the normalized power demand PL/PPeak was used, where PL was the load power demand and PPeak was the annual peak demand in each island (presented in Table 3).
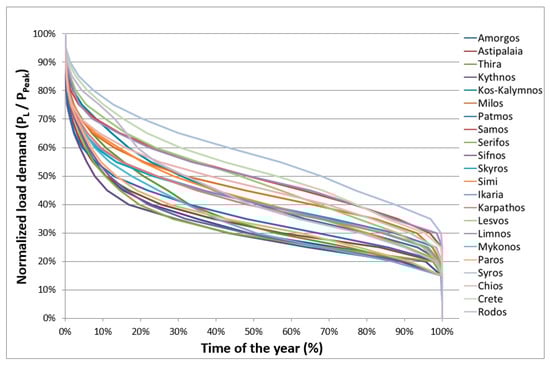
Figure 12.
Annual duration curves of load demand in all the examined case studies.
3. Application—Results
The application of the methodology in the autonomous Greek islands was carried out for normalized wind capacity in the range of 10% up to 200% of the annual mean load. The aim of this application was to identify the effect of the various parameters on the wind energy curtailment. In this connection, load demand, wind and PV power output were considered as well-known input data.
The information about the technical minimums of conventional power plants were provided by the islands power plants operation department of the Public Power Corporation [20]. However, scenarios for lower technical minimums and different mixes of conventional units were examined to identify the effect of power system flexibility on the wind energy absorption.
The instantaneous wind energy penetration limit was defined by the system operator. Higher values could be used in islands with more flexible units and in larger islands or a complex of islands where the wind installed capacity could be geographically dispersed resulting in a beneficial smoothing effect on the aggregated wind power output for the system operator. Additionally, the instantaneous wind energy penetration limit is related to the time response and the ramp rate of conventional units in the specific local power system. Extreme variations of wind power output could occur especially in the case that wind speed overcomes the cut-out wind speed. In this extreme case, wind power collapses from the rated value to zero output. Then, conventional units in thermal reserve operating at the technical minimum should increase their power output to keep the balance between demand and supply. The basic value of δ per island is presented in Table 8.
Table 8.
Instantaneous wind penetration limit δ.
Before the results are presented, an overview of the following examined cases studies is presented:
- Initially, using the actual data for each island the effect of PV capacity on wind energy absorption was analyzed. This scenario could be considered as the reference one.
- The second scenario analyzed the effect of instantaneous wind penetration creating comparable results between islands for δ = 30% and δ = 50%, using real data for conventional units and their technical minimums.
- The third scenario analyzed the effect of technical minimums, creating comparable results between islands for TM = 20%, TM = 40% and TM = 60%.
- Finally, a last scenario examined the effect of power system flexibility. The cumulative conventional capacity was taken equal to the 120% of the peak demand and comparisons were discussed for 2, 5, 10 and 20 units and technical minimums 30% and 50%.
3.1. Reference Scenario: Actual Data per Island and the Effect of PV Capacity
Initially, the combined integration of wind and PV was examined. The PV capacity was examined in the range of 0% up to 120% of the annual mean load, while wind capacity was examined in the range of 0% up to 200% of the annual mean load. Comparative conclusions were drawn.
The wind energy absorption was propitious in the power systems of Crete, Kos-Kalymnos, Mykonos, Simi, Chios, Rodos, Patmos and Paros. The worst cases in terms of wind energy absorption rate were the power systems of Astypalaia, Serifos, Karpathos, Ikaria, Limnos and Amorgos, Sifnos and Thira. This classification occurred due to the different instantaneous wind penetration limit δ (Table 8), the flexibility and splintering of conventional units (technical minimums, number and size of units presented in Figure 2) and the smoothing effect of wind power (Figure 10) due to geographical dispersion of wind farms especially in the case of Crete (Figure 8 and Figure 9b).
The integration of PV did not affect wind energy absorption in all the examined islands in the same way. In general, PV power output was considered fully predictable and PV integration affected the necessary conventional units that should be committed. Less units were committed during the day thanks to PV (Equation (2). Therefore, wind power absorption must deal with a less conventional technical minimum (Equation (3). However, for higher PV integration the remaining load was lower, and the ability of the system to absorb wind power could be lower due to the dynamic limit of instantaneous wind penetration (Equation (3). Only if the predictable PV power output was combined with a smart strategy on the commitment of conventional units, could this become the basic case. Otherwise, as shown in most of the case studies in Figure 13, the integration of PV slightly declined the wind energy absorption rate.
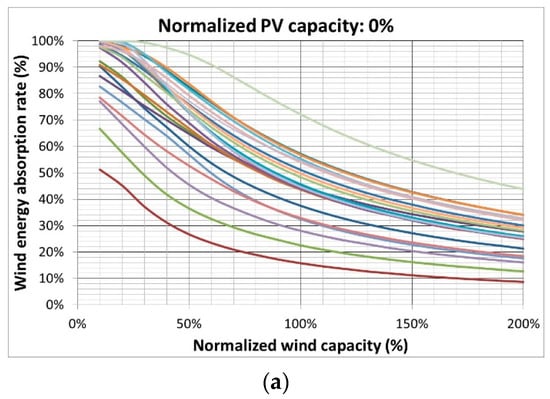
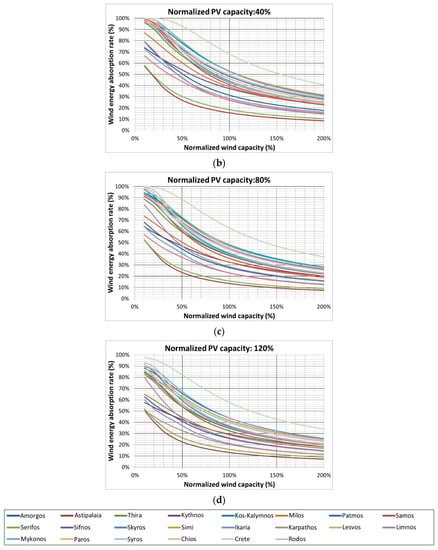
Figure 13.
Wind energy absorption rate for different normalized PV capacity: (a) 0%, (b) 40%, (c) 80%, (d) 120% (case specific instantaneous wind penetration δ—Table 8).
At this point it is useful to distinguish PV energy curtailment from wind energy curtailment. From the point of view of the system’s operator, energy surplus is a surplus regardless of from which energy source it is derived. However, in the current analysis, there was a special interest to understand the effect of one resource to the other and the involved parameters. Based on the described methodology, PV energy curtailment will occur only in the case of high PV penetration and especially in the case that PV power output is greater than the load demand. Today, PV capacity does not surpass the 50% of the annual mean load in any non-interconnected power systems (Figure 5), and PV curtailment never occurs. Following the same concept, wind installed capacity does not affect the PV energy absorption rate.
In Figure 14, PV energy absorption rate is presented for all the examined islands. It is presented to emphasize that high PV absorption rate occurred even for high PV integration. These results are valid for any wind capacity, underlying that wind installed capacity does not affect PV absorption rate. Given the specific profile of load demand and PV power output, for normalized PV capacity up to 110%, the absorption rate was 100% in all the examined cases. This happened, especially due to the fact that there was a seasonal and diurnal positive correlation between PV power output and load demand. For higher PV capacity i.e., 150% of the annual mean load, the absorption rate was still higher than 94%.
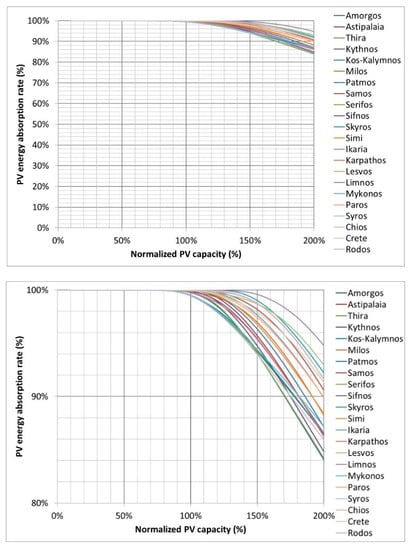
Figure 14.
PV energy absorption rate for normalized PV capacity of 0% up to 200% (regardless of the wind capacity).
The parallel analysis of wind and PV integration drew a conclusion on the effect of one technology on the integration of the other. Wind absorption rate could increase thanks to the parallel integration of PV, while PV absorption rate was not affected by the wind integration.
3.2. Second Case: On the Effect of Instantaneous Wind Penetration Limit
In the previous section a case-specific limit δ was adopted. In this section, the effect of instantaneous wind penetration limit was examined, using common values of δ = 30% and δ = 50% for all the examined cases (Figure 15).
Figure 15.
Wind energy absorption rate for different instantaneous wind penetration δ: (a) 30%, (b) 50% (without PV capacity).
Despite the common δ used in all the examined islands, Crete remained the best and Astypalaia the worst case in terms of wind energy absorption. Actually, Crete had many reasons to be the best case (i.e., geographical dispersion and the most flexible conventional power system) and Astypalaia was still the worst case due to the non-flexible conventional power system (relatively large conventional units and high technical minimums—Figure 2).
However, there were some small changes in the classification of the rest of the islands. At the top side, for δ = 30%, the order was Crete, Kos-Kalymnos, Simi, Chios and Patmos. For δ = 50%, Skyros and Mykonos were in the top 5 instead of Patmos. At the bottom, Astypalaia, Serifos, Limnos, Karpathos and Ikaria were found in both cases. Additionally, in both cases (δ = 30% and δ = 50%) there were some islands, such as Amorgos, Thira, Kythnos, Milos, Samos, Sifnos, Lesvos, Paros, Syros and Rodos which had a moderate performance in terms of wind energy absorption rate. These islands could be considered as typical islands in comparison with those that were included in the top 5 and bottom 5. In these islands, there were no special positive or negative reasons in terms of their system’s flexibility, geographical dispersion of wind farms and features of conventional units to differentiate their results.
In the case of δ = 30%, the instantaneous wind penetration constraint was the dominant constraint which was activated more often. In the case of δ = 50%, this constraint was less likely to be activated in comparison with the technical minimums which then became the dominant one. For this reason, there were some differences in the top 5 between δ = 30% and δ = 50%. For the same reason, in the latter case (δ = 50%), the resulted curves were widely spread. The case of Crete had by far the best performance for δ = 50%, but for δ = 30%, the results were much closer to the other islands, because the constraint of instantaneous wind penetration was activated more often and overlapped the other positive parameters.
3.3. Third Scenario: On the Effect of Conventional Units’ Technical Minimums
The effect of technical minimums is presented in this section. Previously, the real technical minimums were used. Here, the results are presented for common technical minimums in all the conventional units in the Aegean islands equal to 20%, 40% and 60% (Figure 16). Results are presented for the case-specific instantaneous wind penetration δ of Table 8, without PV integration.
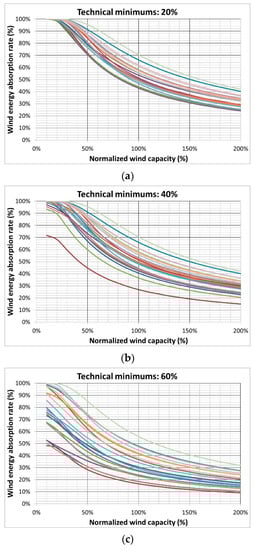

Figure 16.
Wind energy absorption rate for different technical minimums TM: (a) 20%, (b) 40%, (c) 60% (without PV capacity).
The high technical minimum (60%) give rise to wind energy curtailment even for very low wind installed capacity (10–20% of the average load).
For higher technical minimums (40–60%), the splintering of conventional power system became more critical. This is the reason that the resulted curves were widely dispersed for technical minimum 60%. The opposite occurred for low technical minimums (20%).
In all the three examined cases, the worst case in terms of wind energy absorption was Astypalaia, Serifos, Amorgos, Sifnos and Thira. The reason was the non-flexible power system in these islands due to large power plants. The further decrease in the technical minimums (i.e., from 20% to 0%) did not affect the results.
On the other hand, the best cases were Crete, Kos-Kalymnos, Rodos, Chios and Lesvos. Obviously, in the case of Crete, the geographical dispersion of wind farms, the flexibility of conventional power system and the higher instantaneous wind penetration determined the results.
3.4. Fourth Scenario: On the Effect of Conventional Power System Flexibility
Obviously, from the previous results and discussion, the effect of a system’s flexibility is critical. As a“more flexible conventional power system” was defined a power system which consisted of more conventional units with less technical minimums. In this section, the specific features and the details of each case study related to the conventional system’s flexibility were ignored in order to detect the effect of the rest parameters on the results. For this purpose, it was supposed that in all the examined islands the conventional power system consisted of the same number of units and all of them had the same technical minimums. The cumulative conventional capacity in all the examined islands was considered equal to 120% of the peak demand and comparisons were discussed for 2, 5, 10 and 20 units and technical minimums 30% and 50%.
Instead of an 8 plot presentation, the lower and upper values detected from the parallel analysis on 20 power systems are presented for normalized wind capacity 50% and 100% (Table 9). Obviously, more units with a low technical minimum was the ideal synthesis of the local power station and more wind power could be absorbed. However, there were some limits on the impact of these parameters on the results. For technical minimums of 50%, there was almost no improvement in the absorption rate for the number of units above 10. For technical minimums of 30%, the saturation point of the absorption rate was reached for 5 units. As a conclusion, the number of units is an important parameter, but it is not independent from the technical minimums. The relative beneficial effect on the absorption rate thanks to the number of units is more important when these units are characterized by higher technical minimums.
Table 9.
Extreme values of the absorption rate (%) detected for different cases of conventional systems flexibility (number of units 2, 5, 10 and 20 and technical minimums 30% and 50%).
Given the fact that today the technical minimum of diesel units in Greek islands is about 50% (Table 3), local power systems of Amorgos, Astyplaia, Kythnos, Milos, Serifos and Karpathos, which consisted of fewer and relatively larger conventional power units, represented a lower ability to absorb wind power.
3.5. Discussion
Obviously, in all the examined case studies, the increase in the wind installed capacity results in more wind energy curtailment. The wind capacity factor is reduced consequently. Additionally, in this connection, the parallel development of wind and PV was analyzed. Besides the prospective that more variable power output renewables would lead to a lower absorption rate capability, a smaller increase in wind energy curtailment occurs as far as PV capacity increases. In fact, wind power curtailment may decrease thanks to the parallel integration of photovoltaics. This is justified by the fact that it is preferable for the non-interconnected power system to absorb well predicted and distributed PV generation instead of conventional power produced in conventional power plants with high technical minimums which restrict wind power absorption. However, for higher PV capacity, extreme variations on the sunrise and sunset impose special management from the system operator and could finally reduce the ability of the power system to absorb wind power. Apart from that, a very high PV integration (i.e., more than 80–100% of the annual mean load) may cause wind power curtailment, even for rather low wind integration. This occurs due to the discrepancy of the load demand profile and the solar generation availability (i.e., May and June are the months with the highest solar radiation, but it is a low demand season).
A second point of discussion clearly indicates the positive impact of geographical dispersion of wind farms on the wind energy absorbed. The analysis performed in this work shows that this impact is more remarkable in larger power systems (i.e., Crete) or a complex of islands which comprise one local power system (i.e., Paros–Naxos, Kos–Kalymnos).
In all the stages of this work, the technical constrain of the allowed instantaneous wind penetration was proved critical. The role of this parameter is more important in medium and large size systems, due to the fact that this is the dominant constraint against the constraint of the technical minimum, which is rarely activated. This is due to the fact that larger systems are always more flexible with more units and a relatively lower size of each unit. In this case, the use of higher instantaneous wind penetration has a direct positive impact on the wind energy absorbed. Far from that, in the case of inflexible power systems with large units and high technical minimums, wind curtailment is not affected even when a higher limit was applied (i.e., Astypalaia). Additionally, the role of δ is more critical for higher levels of wind penetration.
On the other hand, the technical minimum of conventional power units becomes the critical parameter both in cases of lower levels of wind penetration and in cases of inflexible power systems. Especially, in the case that technical minimums are above the level of 50%, this constraint is dominant on wind energy curtailment. It was shown that the further decrease in technical minimums below the level of 30% has almost no effect on the wind energy curtailment. At this low level of technical minimums, the instantaneous wind penetration limit and the discrepancy between wind power output and load demand define the wind energy absorption.
The splintering of the conventional part was proved as another critical parameter for the flexibility of the local power system to absorb wind power. The number of units, together with all the technical features of the units (type, fuel), set the limit of instantaneous wind penetration and definitely affects the ability of the power system to absorb wind power. In most of the examined cases in Greek non-interconnected power systems, the conventional power system consisted of old diesel units with relatively high technical minimums (40–70%). However, in Crete and Rhodes, together with the typical old diesel units, there are HFO units for the base loads and flexible newer diesel units with a much lower technical minimum (10–20%). As a result, in these two islands more wind power can be absorbed. In the case of Crete, the large number of units and the spatial dispersion of wind farms also has a positive impact on wind energy absorption, nominating Crete as the champion in terms of wind energy absorption among all the Greek islands.
In parallel with the analysis of the parameters which affect wind energy curtailment and the relative comparative assessment in non-interconnected power systems, which is the main focus of this connection, it is clear that for a considerable further exploitation of wind energy in Greek islands, the upgrading of the current infrastructure is required. In this framework, the alternatives of hydro pumped storage and interconnections are discussed. Several applications of wind energy with hydro pumped storage projects, especially in large non-interconnected islands (Crete, Rhodes and Lesvos), are under consideration, but the implementation of such projects was low. Only the project “Naeras” on Ikaria island which constitutes the Europe’s second hybrid wind hydro storage power plant, has been completed in 2019.
The solution of hydro pumped storage is critical not only for non-interconnected power systems, but also for large systems towards large scale non-dispatchable renewable energy penetration [30]. The policy framework for large scale electricity storage to recover wind energy curtailment will be comparatively analyzed in France and Germany by 2020 and 2030 [31]. Hydro pumped storage has been widely examined as a means to reduce wind energy curtailment in the cases of Ireland [32], China [33,34] and Greece [35,36,37]. A special research interest on the combination of hydro pumped storage with wind energy was shown for autonomous islands, such as Azores [38], Gran Canaria [39], El Hierro [40], Crete [41,42] and other Greek islands [36,41]. Seawater pumped storage was analyzed as a potential solution for the Greek island of Sifnos [43], as it has been implemented in the demonstration plant of Okinawa Yanbaru Seawater Pumped Storage Power Station since 1999. A techno-economic comparative analysis of different storage methods is performed for Crete [44].
On the other hand, the prospect of Greek island interconnections was always a priority for the Greek energy policy makers. The use of fuel oil for electricity production, high current cost, local pollution, conventional power capacity deficit, low reliability of the power systems and low exploitation of abundant wind and solar potential in non-interconnected power systems are some of the current challenges to be overcome in case of interconnection. Additionally, the recent technological achievements on the cables, thanks to the extensive offshore wind energy development in North Europe, makes, today, the accomplishment of these plans more realistic. In this framework, the feasibility of the interconnections has been presented in recent studies and the first interconnections are realized. In 2018, many islands in central Cyclades complex, such as Mykonos, Syros and the local system of Paros–Naxos which also includes the small islands of Antiparos, Folegandros, Ios, Irakleia, Koufonisi, Sikinos and Schinousa were interconnected with the mainland, setting local conventional power stations in a cool reserve. Additionally, for the interconnection of Crete island, firstly an underwater connection via Peloponesse is to be established by the end of 2020 and soon will supply the one third of electricity load demand on the island. Then, a second one with a larger capacity will connect the island directly to Athens by 2023. As regards the Dodecanese and North Aegean islands, the interconnections will not be realized earlier than the end of the current decade. Wind power penetration will be improved thanks to the interconnection, but still there are some restrictions related to power flows, stability and the capacity of the cables.
Finally, over the last two decades, there have been several projects for large scale wind farms on the Greek islands. Most of the Greek islands become fields of such applications and most of the local populations display negative behavior against these projects. Since the implementation of underwater interconnections is proved difficult and time consuming, the conclusions of this work could be used in the meantime towards the increase in wind energy penetration.
4. Conclusions
In this connection, wind energy curtailment is analyzed in parallel in 20 local power systems in Greece, and a discussion was made about the critical parameters, the effect of PV integration, the geographical dispersion of wind farms and the design of the local power systems towards the effective integration of wind energy. Recent detailed information and real data about non-interconnected power systems in Greece were selected and presented. Especially an accurate wind potential representation is provided in this analysis thanks to high resolution mesoscale wind data [19], in order to apply a probabilistic methodology for wind energy curtailment assessment [12]. This work demonstrates the value of mesoscale models to provide high resolution wind data to analyze renewable energy integration issues. Besides the similarity of Greek autonomous power systems, there are differences in the wind potential, on the flexibility of their conventional power systems and on the conventional units’ technical features which differentiate their performance. Towards the effective integration of wind energy in non-interconnected power systems, it is essential to replace old conventional power units with newer, modern and more flexible units. Additionally, the power system’s operator should adjust the load dispatch and optimize the units’ commitment in order to ensure the maximization of wind energy absorption.
Author Contributions
Data curation, G.C., A.K., V.K. and K.L.; formal analysis, G.C. and A.K.; investigation, Y.P.; methodology, G.C., Y.P. and P.C.; software, G.C., A.K., V.K. and K.L.; supervision, G.C. and A.Z.; validation, A.K.; writing—original draft, G.C.; writing—review and editing, G.C. All authors have read and agreed to the published version of the manuscript.
Funding
This research received no external funding.
Conflicts of Interest
The authors declare no conflict of interest.
References
- Fink, S.; Mudd, C.; Porter, K.; Morgenstern, B. Wind Energy Curtailment. Case Studies, NREL, Report SR-550-46716. 2009. Available online: http://www.nrel.gov/docs/fy10osti/46716.pdf (accessed on 20 December 2018).
- Bird, L.; Cochran, J.; Wang, X. Wind and Solar Energy Curtailment: Experience aznd Practices in the United States, NREL, Technical Report, NREL/TP-6A20-60983. March 2014. Available online: https://www.nrel.gov/docs/fy14osti/60983.pdf (accessed on 20 December 2018).
- Bird, L.; Lew, D.; Milligan, M.; Carlini, E.M.; Estanqueiro, A.; Flynn, D.; Gomez-Lazaro, E.; Holttinen, H.; Menemenlis, N.; Orths, A.; et al. Wind and solar energy curtailment: A review of international experience. Renew. Sustain. Energy Rev. 2016, 65, 577–586. [Google Scholar] [CrossRef]
- Zhang, Y.; Tang, N.; Niu, Y.; Du, X. Wind energy rejection in China: Current status, reasons and perspectives. Renew. Sustain. Energy Rev. 2016, 66, 322–344. [Google Scholar] [CrossRef]
- Qi, Y.; Dong, W.; Dong, C.; Huang, C. Understanding institutional barriers for wind curtailment in China. Renew. Sustain. Energy Rev. 2019, 105, 476–486. [Google Scholar] [CrossRef]
- Xiong, W.; Wang, Y.; Mathiesen, B.V.; Zhang, X. Case study of the constraints and potential contributions regarding wind curtailment in Northeast China. Energy 2016, 110, 55–64. [Google Scholar] [CrossRef]
- Schill, W. Residual load, renewable surplus generation and storage requirements in Germany. Energy Policy 2014, 73, 65–79. [Google Scholar] [CrossRef]
- Villamor, L.V.; Avagyan, V.; Chalmers, H. Opportunities for reducing curtailment of wind energy in the future electricity systems: Insights from modelling analysis of Great Britain. Energy 2019, 116777, in press. [Google Scholar] [CrossRef]
- Caralis, G.; Rados, K.; Zervos, A. The effect of spatial dispersion of wind power plants on the curtailment of wind power in the Greek power supply system. Wind Energy 2010, 13, 339–355. [Google Scholar] [CrossRef]
- Papathanassiou, S.A.; Boulaxis, N.G. Power limitations and energy yield evaluation for wind farms operating in island systems. Renew Energy 2006, 31, 457–479. [Google Scholar] [CrossRef]
- Kaldellis, J.K.; Kavadias, K.A.; Filios, A.E. A new computational algorithm for the calculation of maximum wind energy penetration in autonomous electrical generation systems. Appl. Energy 2009, 86, 1011–1023. [Google Scholar] [CrossRef]
- Caralis, G.; Zervos, A. Analysis of wind power penetration in autonomous Greek islands. Wind Eng. 2007, 31, 487–502. [Google Scholar] [CrossRef]
- Georgios, P.G.; Theocharis, D.T.; Zografakis, N. Sustainable power planning for the island of Crete. Energy Policy 2009, 37, 1222–1238. [Google Scholar] [CrossRef]
- Katsaprakakis, D.A. Hybrid power plants in non-interconnected insular systems. Appl. Energy 2016, 164, 268–283. [Google Scholar] [CrossRef]
- Rodrigues, E.M.G.; Osório, G.J.; Godina, R.; Bizuayehu, A.W.; Lujano-Rojas, J.M.; Matias, J.C.O.; Catalão, J.P.S. Modelling and sizing of NaS (sodium sulfur) battery energy storage system for extending wind power performance in Crete Island. Energy 2015, 90, 1606–1617. [Google Scholar] [CrossRef]
- Tilos Project. Available online: https://www.tiloshorizon.eu/ (accessed on 20 December 2018).
- Hybrid Energy Project of Ikaria. Available online: https://ses.jrc.ec.europa.eu/hybrid-energy-project-ikariaenergy-sustainable-island-real-life-community (accessed on 20 December 2018).
- Landberg, L.; Myllerup, L.; Rathmann, O.; Petersen, E.L.; Jørgensen, B.H.; Badger, J.; Mortensen, N.G. Wind resource estimation—An overview. Wind Energy 2003, 6, 261–271. [Google Scholar] [CrossRef]
- Kotroni, V.; Lagouvardos, K.; Lykoudis, S. High-resolution model-based wind atlas for Greece. Renew. Sustain. Energy Rev. 2014, 30, 479–489. [Google Scholar] [CrossRef]
- Public Power Corporation. Available online: https://www.dei.gr/en (accessed on 20 December 2018).
- Archer, C.L.; Jacobson, M.Z. Spatial and temporal distributions of U.S. winds and wind power at 80 m derived from measurements. J. Geophys. Res. 2003, 108, 4289. [Google Scholar] [CrossRef]
- Hall, I.J. Generation of Typical Meteorological Years for 26 SOLMET Stations; SAND78-1601; Sandia National Laboratories: Albuquerque, NM, USA, 1978. [Google Scholar]
- Kotroni, V.; Lagouvardos, K. Evaluation of MM5 high-resolution real-time forecasts over the urban area of Athens, Greece. J. Appl. Meteorol. 2004, 43, 1666–1678. [Google Scholar] [CrossRef]
- Kotroni, V.; Lagouvardos, K. Precipitation forecast skill of different convective parameterization and microphysical schemes: Application for the cold season over Greece. Geoph. Res. Let. 2001, 108, 1977–1980. [Google Scholar] [CrossRef]
- Akylas, E.; Kotroni, V.; Lagouvardos, K. Sensitivity of high resolution operational weather forecasts to the choice of the planetary boundary layer scheme. Atmos. Res. 2007, 84, 49–57. [Google Scholar] [CrossRef]
- Alafouzos, V.; Vougiouka, A.; Perivolaris, Y.; Mourikis, D.; Zagorakis, V.; Theodorakakos, A. A Method for Estimating Wind Speed Profile in Complex Terrain Based on an Advanced CFD Tool. In Proceedings of the EWEC Conference, Athens, Greece, 27 February–2 March 2006. [Google Scholar]
- Regulatory Authority of Energy (RAE). Geographical Information System of Energy. Available online: http://www.rae.gr/geo/ (accessed on 20 December 2018).
- Caralis, G.; Perivolaris, Y.; Rados, K.; Zervos, A. On the Effect of Spatial Dispersion of Wind Power Plants on the Wind Energy Capacity Credit in Greece. Environ. Res. Lett. 2008, 3, 015003. [Google Scholar] [CrossRef]
- Photovoltaic Geographical Information System (PVGIS). Geographical Assessment of Solar Resource and Performance of Photovoltaic Technology. Available online: http://re.jrc.ec.europa.eu/pvgis/ (accessed on 20 December 2018).
- Weitemeyer, S.; Kleinhans, D.; Vogt, T.; Agert, C. Integration of Renewable Energy Sources in future power systems: The role of storage. Renew. Energy 2015, 75, 14–20. [Google Scholar] [CrossRef]
- Loisel, R.; Mercier, A.; Gatzen, C.; Elms, N.; Petric, H. Valuation framework for large scale electricity storage in a case with wind curtailment. Energy Policy 2010, 38, 7323–7337. [Google Scholar] [CrossRef]
- Tuohy, A.; O’Malley, M. Pumped storage in systems with very high wind penetration. Energy Policy 2011, 39, 1965–1974. [Google Scholar] [CrossRef]
- Zhang, N.; Lu, X.; Michael; McElroy, B.; Nielsen, C.P.; Chen, X.; Deng, Y.; Kang, C. Reducing curtailment of wind electricity in China by employing electric boilers for heat and pumped hydro for energy storage. Appl. Energy 2016, 184, 987–994. [Google Scholar] [CrossRef]
- Kong, Y.; Kong, Z.; Liu, Z.; Wei, C.; Zhang, J.; An, G. Pumped storage power stations in China: The past, the present, and the future. Renew. Sustain. Energy Rev. 2016, in press. [Google Scholar] [CrossRef]
- Anagnostopoulos, J.S.; Papantonis, D.E. Study of pumped storage schemes to support high RES penetration in the electric power system of Greece. Energy 2012, 45, 416–423. [Google Scholar] [CrossRef]
- Caralis, G.; Rados, K.; Zervos, A. On the market of wind with hydro-pumped storage systems in autonomous Greek islands. Renew. Sustain. Energy Rev. 2010, 14, 2221–2226. [Google Scholar] [CrossRef]
- Tigas, K.; Giannakidis, G.; Mantzaris, J.; Lalas, D.; Sakellaridis, N.; Nakos, C.; Vougiouklakis, Y.; Theofilidi, M.; Pyrgioti, E.; Alexandridis, A.T. Wide scale penetration of renewable electricity in the Greek energy system in view of the European decarbonization targets for 2050. Renew. Sustain. Energy Rev. 2015, 42, 158–169. [Google Scholar] [CrossRef]
- Lopes, S.; Castro, R.; de Jesus, J.M.F. Contributions to the preliminary assessment of a Water Pumped Storage System in Terceira Island (Azores). J. Energy Storage 2016, 6, 59–69. [Google Scholar] [CrossRef]
- Padrón, S.; Medina, J.F.; Rodríguez, A. Analysis of a pumped storage system to increase the penetration level of renewable energy in isolated power systems. Gran Canaria: A case study. Energy 2011, 36, 6753–6762. [Google Scholar] [CrossRef]
- Bueno, C.; Carta, J.A. Technical–economic analysis of wind-powered pumped hydrostorage systems. Part II: Model application to the island of El Hierro. Sol. Energy 2005, 78, 3–396. [Google Scholar] [CrossRef]
- Caralis, G.; Zervos, A. Analysis of the combined use of wind and pumped storage systems in autonomous Greek islands. IET Renew. Power Gener. 2007, 1, 49–60. [Google Scholar] [CrossRef]
- al Katsaprakakis, D.; Dimitris; Christakis, G.; Zervos, A.; Papantonis, D.; Voutsinas, S. Pumped storage systems introduction in isolated power production systems. Renew. Energy 2008, 33, 467–490. [Google Scholar] [CrossRef]
- Katsaprakakis, D.A.; Voumvoulakis, M. A hybrid power plant towards 100% energy autonomy for the island of Sifnos, Greece. Perspectives created from energy cooperatives. Energy 2018, 161, 680–698. [Google Scholar] [CrossRef]
- Caralis, G.; Christakopoulos, T.; Karellas, S.; Gao, Z. Analysis of energy storage systems to exploit wind energy curtailment in Crete. Renew. Sustain. Energy Rev. 2019, 103, 122–139. [Google Scholar] [CrossRef]
© 2020 by the authors. Licensee MDPI, Basel, Switzerland. This article is an open access article distributed under the terms and conditions of the Creative Commons Attribution (CC BY) license (http://creativecommons.org/licenses/by/4.0/).