Article

Droplet Impact on Suspended Metallic Meshes: Effects of Wettability, Reynolds and Weber Numbers

by
Konstantinos Vontas
1,2,*,†,
Cristina Boscariol
2,
Manolia Andredaki
2,
Anastasios Georgoulas
2,
Cyril Crua
2,
Jens Honoré Walther
1,3 and
Marco Marengo
2
1
Department of Mechanical Engineering, Technical University of Denmark, Nils Koppels Allé, DK-2800 Kgs. Lyngby, Denmark
2
Advanced Engineering Centre, University of Brighton, Lewes Road, Brighton BN2 4GJ, UK
3
Computational Science & Engineering Lab., Swiss Federal Institute of Technology Zurich, Clausiusstrasse 33, CH-8092 Zurich, Switzerland
*
Author to whom correspondence should be addressed.
Current address: Advanced Engineering Centre, University of Brighton, Lewes Road, Brighton BN2 4GJ, UK.
Fluids 2020, 5(2), 81; https://doi.org/10.3390/fluids5020081
Submission received: 25 April 2020 / Revised: 16 May 2020 / Accepted: 19 May 2020 / Published: 22 May 2020
(This article belongs to the Special Issue Classical and Modern Topics in Fluid Dynamics and Transport Phenomena)

Abstract

:
Liquid penetration analysis in porous media is of great importance in a wide range of applications such as ink jet printing technology, painting and textile design. This article presents an investigation of droplet impingement onto metallic meshes, aiming to provide insights by identifying and quantifying impact characteristics that are difficult to measure experimentally. For this purpose, an enhanced Volume-Of-Fluid (VOF) numerical simulation framework is utilised, previously developed in the general context of the OpenFOAM CFD Toolbox. Droplet impacts on metallic meshes are performed both experimentally and numerically with satisfactory degree of agreement. From the experimental investigation three main outcomes are observed—deposition, partial imbibition, and penetration. The penetration into suspended meshes leads to spectacular multiple jetting below the mesh. A higher amount of liquid penetration is linked to higher impact velocity, lower viscosity and larger pore size dimension. An estimation of the liquid penetration is given in order to evaluate the impregnation properties of the meshes. From the parametric analysis it is shown that liquid viscosity affects the adhesion characteristics of the drops significantly, whereas droplet break-up after the impact is mostly controlled by surface tension. Additionally, wettability characteristics are found to play an important role in both liquid penetration and droplet break-up below the mesh.

1. Introduction

Droplet impact onto solid, dry surfaces is a widely studied phenomenon, which has been extensively investigated in the past decades due to its involvement in many environmental and industrial applications [1,2]. In order to understand the behaviour of the droplets in such cases, the mechanisms involved in droplet impact dynamics must be thoroughly investigated. Droplet dynamics depend on a number of parameters that are related to the droplet itself, the impacted surface and the local gas layer near the wall. Studies have shown that droplet diameter ( D 0 ), impact velocity ( U 0 ), viscosity ( μ ), surface tension ( σ ), wettability of the solid surface, as well as the non-isothermal effects (e.g., solidification, evaporation) constitute important parameters in the droplet impact dynamics [3,4,5]. In addition to the above-mentioned parameters, in order to quantify the droplet impact outcome, previous studies have used non-dimensional numbers expressed by the Reynolds ( R e = ρ D 0 U 0 / μ ), Weber ( W e = ρ D 0 U 0 2 / σ ), Ohnesorge ( O h = W e / R e ), and Capillary number ( C a = μ U 0 / σ ), where ρ is the density of the liquid.
Many experimental investigations have studied the effects of wettability on the droplet outcome after the impact, through the dynamic contact angle (DCA) values of the liquid-gas interface with the solid surfaces [6,7]. Antonini et al. [8] conducted laboratory experiments for understanding the effects of surface wettability on impact characteristics of water droplets on solid, dry surfaces. Furthermore, it was concluded that the receding contact angle and the contact angle hysteresis are important wetting parameters for the droplet impact dynamics both at the beginning and recoiling phases of the droplet. Finally, it has been also found that when the Reynolds and Weber numbers are sufficiently high, the spreading droplet can be subdivided into two main regions: an almost circular rim appearing due to a combination of capillary forces and viscosity, and a radially spreading lamella [9,10].
The properties of the impacted substrate are also important as they can significantly affect the overall phenomenon. The surface condition is characterised by its wettability (i.e., hydrophilic/hydrophobic), dry/wet state (i.e., with/without the presence of a liquid film), and roughness and temperature [11]. The importance of the surface characteristics on droplet impact (i.e., anti-icing) was studied by Antonini et al. [12]. It was found that super-hydrophobic surfaces can enhance ice removal from a surface.
Droplet composition also plays an important role, and compounds that modify the physical properties, such as surfactants, are widely used in industry. Their main characteristic is that they can reduce the surface tension between two liquids, a gas and a liquid, or a liquid and a solid. Pasandideh-Fard et al. [9] performed experiments and numerical simulations of droplet impact on stainless steel solid surfaces and studied the effects of DCA and surface tension. The study indicated that the addition of a surfactant did not affect the initial stages of the impact, but an increment in the maximum spread diameter and a reduction of recoil height was observed.
Numerical simulations can give important insights into complex two-phase flow characteristics that can be difficult or impossible to access experimentally. The selection of the appropriate interface capturing method (e.g., volume-of-fluid (VOF) or level-set (LS) method) is of high importance to achieve accurate outcomes as well as to reduce the computational time and cost. A numerical study of low W e number droplets impacting onto a solid dry surface was performed by Patil et al. [13] using a DCA model based on experimental inputs. Their numerical results show that the accuracy of the partially refined dual-grid LS method is close to the results of the fine-grid LS method, at a computational cost which is close to that of the coarse-grid LS method. A coupled LS and VOF framework (CLSVOF), together with a volume/surface integrated average-based multi-moment method, and a continuum surface force model was developed by Yokoi et al. [14]. Their model was used to perform simulations of droplet impact on a dry solid surface, showing the important role of the DCA modelling for predicting droplet impact behaviour. Šikalo et al. [15] conducted experiments and numerical investigations focusing on a contact angle modelling treatment for the case of hydrophobic surfaces. The key points of their experimental results was that the DCA is a function of the contact line speed as well as the flow field in the vicinity of the moving contact line. Additionally, there is no effect of the equilibrium contact angle to the DCA during the spreading stage where the inertia and viscous forces cause the deformation of the droplet. For the numerical study of these experiments the VOF method was used. For the spreading process, the results from the numerical model showed very good agreement with the measurements. However, in the receding phase of the droplet the numerical model shows poor agreement with the experimental data, due to the double accounting of the model for inertial effects.
Even though droplet impact on solid surfaces has been an area of interest for many researchers for a few decades now, droplet impact on porous surfaces and especially on metallic meshes is a relatively new field that has attracted attention both in academia and industry. Potential applications of metallic meshes include medical spray penetration in the human skin, irrigation mechanisms and ink jet printing. Droplets behave differently when impacting heterogeneous media, introducing influence of surface properties such as surface roughness [16]. Absorption of the droplet itself by the porous surface depends on both the properties of the liquid and the porous medium [17]. Spreading on porous media has received little attention compared to similar investigations on impermeable surfaces, despite its common presence in applications [18]. Alam et al. [19] concluded that important factors for the spreading of an impacting drop on a porous surface include the properties of the liquid (viscosity, surface tension), impact conditions (impact velocity, droplet diameter), absorption, wettability and roughness. Ryu et al. [20] investigated in their experiments the effect of wettability of water drop impacting on a hydrophobic and superhydrophobic mesh. From the experiments it was shown that water can penetrate superhydrophobic meshes easier, compared to the hydrophobic surfaces and that penetration on a superhydrophobic mesh can occur either during the impact or during the recoil.
Older as well as recently published numerical investigations of drop impact into porous media can be found in the literature. Reis et al. [21] conducted parametric analysis of drop impact on porous medium with the VOF method. The results showed that for large R e due to the viscous drag forces, relatively large degrees of penetration in the substrate was observed. By comparison, for small R e values the degree of change of the momentum of the droplet, due to viscous effects outside the substrate starts to become more significant, resulting in a reduction of the lateral spreading. In addition it was found, that the potential penetration or absorption of the droplet into the porous surface will also influence the impact dynamics. Simulations of a sessile droplet on porous substrates using the VOF method in ANSYS were performed by Fu et al. [22]. Their results showed that the interaction between droplet and porous substrates is generally determined by the spreading and the penetration processes that are competing. For the wettability effect it was found that for smaller static equilibrium contact angle, more pronounced spreading and permeation can be seen, and when the static equilibrium contact angle increases, the spread and imbibition of the droplet become more difficult.
Liwei et al. [23] utilised a 3D Many-Body Dissipative Particle Dynamics (MDPD) model and tested it against experiments of droplet impact on mesh screens. They found good agreement between the numerical and experimental results, and concluded that the influence of the droplet speed and size of the mesh is of higher importance, compared to the wettability characteristics and the drop viscosity.
The present study uses the enhanced VOF method developed by Georgoulas et al. [24] and Vontas et al. [25]. The enhancements mitigate spurious velocities and enables accurate treatment of dynamic contact angle by employing the Kistler DCA model. The implementation of the Kistler model was validated in Reference [25] with the experimental data of Patil et al. [13] and Yokoi et al. [14]. In both cases, low Weber number water droplet impacts on dry, flat surfaces under isothermal conditions were considered. Further validation for higher Weber numbers is presented in this study. The validated model is subsequently used to study water droplets impacting on metallic suspended meshes, along with detailed experimental investigations. The aim of the numerical modelling is to identify and quantify valuable information that cannot be accurately revealed from the measurements, such as the volume of liquid entrapped within the metallic mesh with respect to time. This information offers additional insight into the complex underpinning mechanisms in the considered droplet impact phenomena.

2. Numerical Simulation Framework

2.1. Governing Equations

With the utilised VOF method, a transport equation for the volume fraction α of the secondary phase (liquid) is simultaneously solved with a single set of continuity and Navier-Stokes equations for the whole flow field. For the primary phase (gas) the corresponding volume fraction is calculated as ( 1 α ). The two fluids (gas and liquid) are considered to be Newtonian, immiscible and incompressible, while the environmental conditions are considered isothermal. The governing equations have the following form:
· U = 0
α t + · α U = 0
ρ b U t + · ( ρ b U U ) = p + · μ b U + ( U ) T + ρ b g + F s ,
where ρ b and μ b are the bulk density and viscosity of the fluid, U is the fluid velocity, p is the pressure, g is acceleration due to gravity, and F s is the volumetric representation of the surface tension force. The bulk physical properties of the mixture are calculated as weighted averages of the corresponding properties of the liquid and gaseous phases:
ρ b = α ρ l + ( 1 α ) ρ g
μ b = α μ l + ( 1 α ) μ g ,
where ρ l , ρ g , μ l and μ g , denote the density and viscosity of the liquid and the gas phases respectively, In the VOF method, α is advected by the velocity field. In incompressible flows this is equivalent to conservation of the volume fraction, and makes the method mass conservative. Additionally, the surface tension force is modelled as a volumetric force, and it uses the Continuum-Surface-Force (CSF) method, which was first introduced by Brackbill et al. [26] applying the following equations:
F s = σ κ α
κ = · α | α | ,
where σ is the surface tension, and κ is the curvature of the interface.

2.2. Sharpening the Interface

For the sharpening of the interface, Equation (2), is modified and takes the following form:
α t + · ( α U ) · ( α ( 1 α ) U r ) = 0 ,
where U r is an artificial compression velocity at the interface. In the finite volume discretisation used in “interFoam” this is given by:
U r = n f min C γ | ϕ | | s f | , max | ϕ | s f ,
where n f is the cell surface normal vector, ϕ is the mass flux, s f is the surface area of the cells, and C γ is a coefficient that controls the artificial compression of the interface diffusion, where its value can be set between 0 and 4. Further details can be found in the work of Georgoulas et al. [24].

2.3. VOF Smoothing

The enhanced VOF-based solver used in the present study overcomes numerical artefacts of the original model, known as “spurious currents”, that are usually developed at the interface between the liquid and gaseous phases. The proposed enhancement involves the calculation of the interface curvature κ using the smoothed volume fraction values α ˜ which are obtained from the initially calculated α field, smoothing it over a finite region near the interface Equation (10). All other equations are using the initially calculated (non-smoothed) volume fraction values of α [27]. Further details on the proposed implementation can be found in the article by Georgoulas et al. [24].
κ = · α ˜ | α ˜ | .

2.4. Dynamic Contact Angle Treatment

The enhanced numerical simulation framework also contains an implementation of the DCA model originally suggested by Kistler [28]. This implementation was tested in Reference [25] against experiments available in the literature for droplet impact on flat surfaces with different wettability, and it was shown that it can predict accurately both the spreading and recoiling stages of the impacts. In more detail, with this DCA treatment, the dynamic contact angle θ d is given as a function of the contact line velocity ( u c l i n e ), through the capillary number C a and the inverse of Hoffman’s function. The θ d , can be calculated by the following Equation (11):
θ d = f H C a + f H 1 θ e q ,
where f H 1 is the inverse function of the Hoffman’s empirical function, which is given by:
f H = arccos 1 2 tanh 5 . 16 x 1 + 1.31 x 0.99 0.706 ,
where x is equal to:
x = C a + f H 1 θ e q .
The capillary number is defined as
C a = μ u c l i n e σ ,
where u c l i n e is the velocity of the contact line. The equilibrium angle θ e q is replaced by either a limiting advancing or receding contact angle θ a or θ r , respectively, depending on the sign of the velocity vector at the contact line.

3. Validation of the Numerical Simulation Framework

3.1. Low Weber Number Impacts

Numerous empirical models related to the DCA with the contact line velocity are available in the literature [29,30]. As mentioned in Section 2, the numerical investigation performed by Vontas et al. [25], showed that the predictions of Kistler’s DCA model are closer to experimental measurements compared to both the Constant Contact Angle (CCA) model, and the DCA model that is offered in the original distribution of OpenFOAM. The numerical predictions of the present numerical simulation framework with the Kistler DCA model can be seen in Figure 1, compared with the experimental results reported by Yokoi et al. [14] for droplet impact with a comparatively low Weber number W e = 32 on a hydrophobic surface. The present results clearly show good agreement with the experiments and are consistent with previous validation results presented by Vontas et al. [25].

3.2. High Weber Number Impacts

For the purposes of the present investigation it was deemed appropriate to further check the validity of the proposed VOF-based numerical simulation framework, also for higher W e number droplet impacts. Therefore, the droplet impact experiments that were conducted by Šikalo et al. [15], are also simulated here. In the experiment, for the detailed observation of the spreading droplet, a high resolution charge-coupled device (CCD) camera (Sensicam PCO, 1280 × 1024 pixels) equipped with a long-distance microscope is used. The working liquid is water impacting a horizontal hydrophobic surface (dry wax), the droplet diameter is D 0 = 2.45   m m and the droplet impact velocity is U 0 = 1.64   m / s , while the advancing θ a and receding θ r contact angles are 105° and 95° respectivey. The R e and W e numbers are 4010 and 90 respectively.
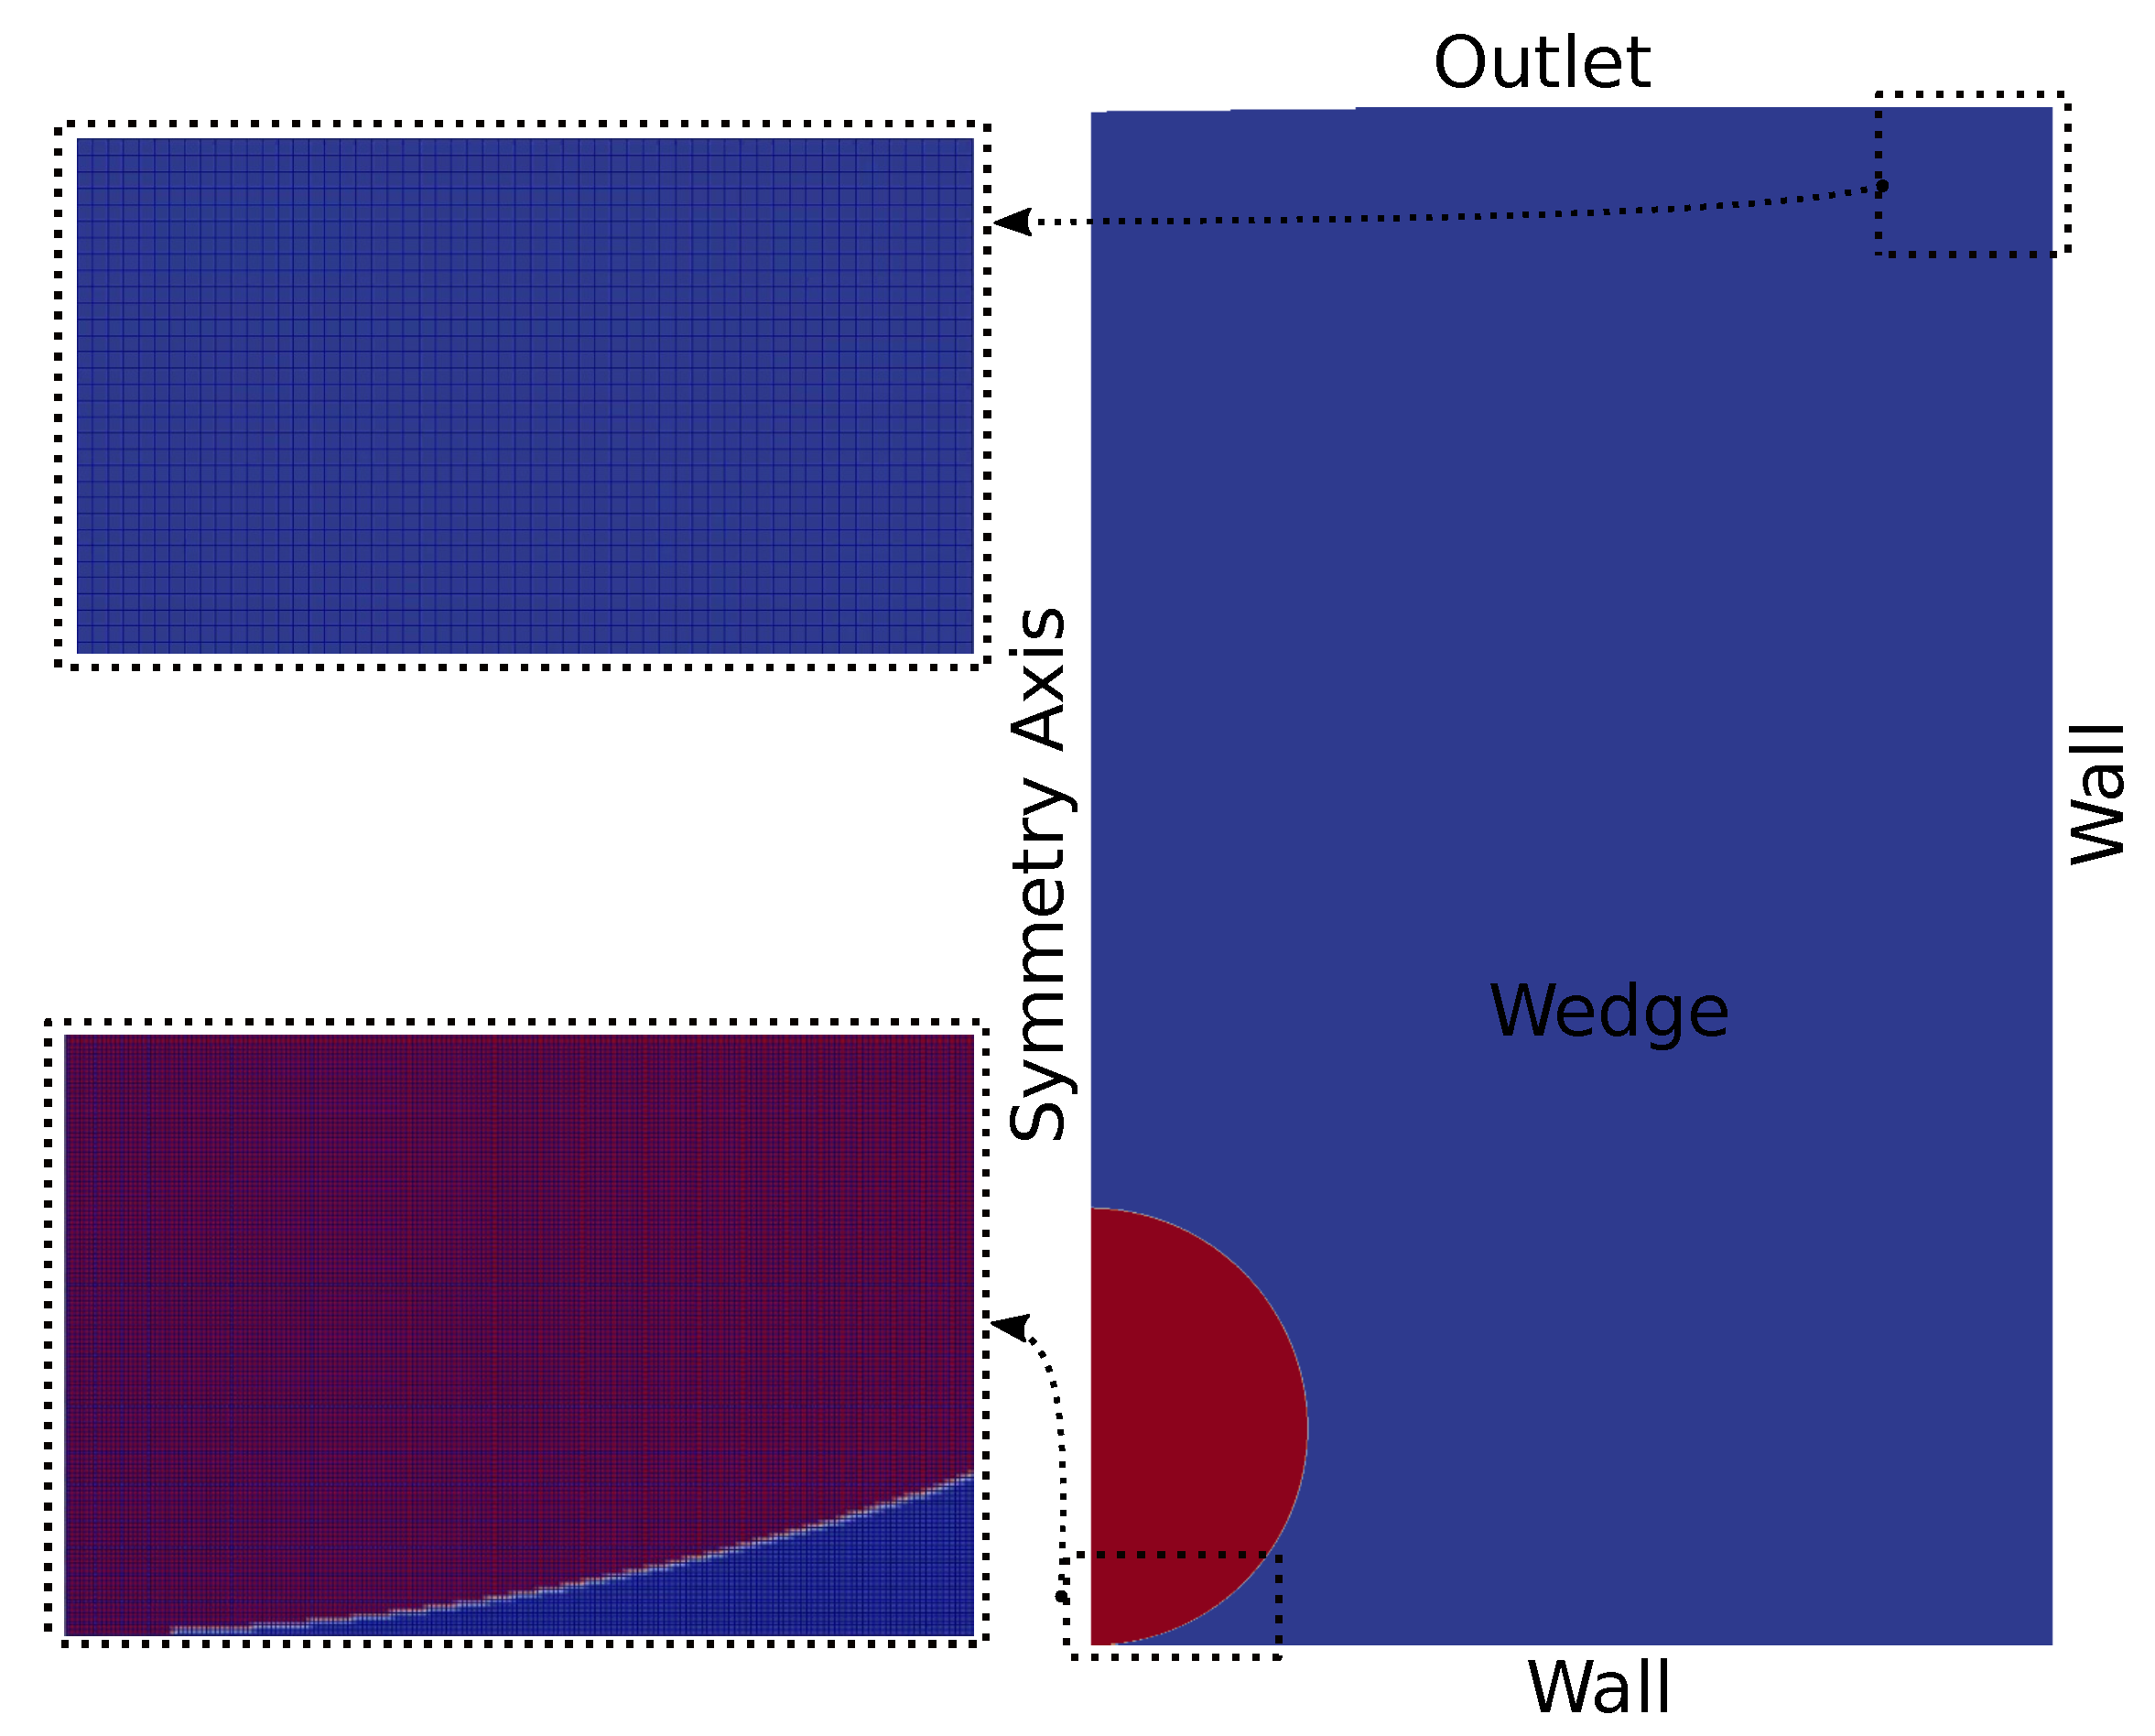
A 2D axisymmetric simulation is performed. For higher W e number processes, a finer computational mesh is required. After conducting a mesh independence study, it is found that the solution is mesh independent for 5 μ m of minimum grid size. The utilised computational domain is a 5° wedge, with 5 m m radius and 8 m m height. The computational domain, mesh details and boundary conditions are illustrated in Figure 2.
The total number of cells is 1.6 million ( 1000 × 1600 × 1 in the x, y and z direction respectively). A structured mesh of hexahedral and prismatic elements with a grid clustering towards the bottom-left corner of the computational domain (i.e., the central point of the simulated droplet impact) is utilised. A no-slip velocity boundary condition is imposed at solid walls, and a dynamic contact angle boundary condition for the volume fraction. At the outer boundary, a homogeneous Neumann condition is imposed on the pressure allows the flow to exit and enter freely.
As can be observed in Figure 3 and Figure 4, the 2D axisymmetric simulation predicts very well the spatial and temporal evolution of the considered droplet impact. However, since for the main aim of the present work 2D axisymmetric simulations cannot be performed, it was deemed appropriate to also perform a 3D simulation and check the validity of the results for the same experiment. In order to reduce significantly the computational time and the total number of cells, a 3D symmetric simulation was conducted, representing only one-fourth of the considered droplet impact case. Using a minimum cell size of 5 μ m , as in the 2D case, was not possible due to a limitation in the available computational resources. Therefore the minimum cell size in the 3D case is 25 μ m , and in total four successive levels of mesh refinement were applied, utilising the “topoSet” utility in OpenFOAM. The total number of cells is 23.6 M, consisting of hexahedral and polyhedral cells. However, in order to compare and demonstrate the quantitative difference between 2D and 3D simulations, an additional 2D simulation with minimum cell size of 25 μ m , is also performed.
The numerical results of the 3D simulations are compared to the experimental results in Figure 3. As can be observed qualitatively, the 3D numerical case shows good agreement with the experiment.
In Figure 4, a quantitative comparison of the four cases is presented, where the contact diameter D over time t is plotted. The results show that both the 3D and 2D (both cases) simulations are in good agreement with the experimental measurements. Additionally, it can be seen that the 2D axisymmetric case produces results in closer agreement with the experimental values compared to the 3D case. This can be explained from the fact that the 2D simulations have five times smaller minimum cell size. However, it can be seen that the 3D solution with 25 μ m minimum cell dimension offers a good compromise between accuracy and computational cost despite not being a mesh-independent solution. Therefore, this minimum cell size value of 25 μ m is adopted for the 3D parametric numerical simulations in the main part of the present work.

4. Droplet Impact on Metallic Meshes

In this section, the experimental and numerical results obtained for droplets impacting onto metallic meshes are presented, analysed and compared. More detailed descriptions of these experiments are available in Reference [31]. The main aim here is to select the appropriate computational domain, mesh, boundary conditions and overall computational set-up characteristics for the parametric numerical analysis.

4.1. Experimental Investigation

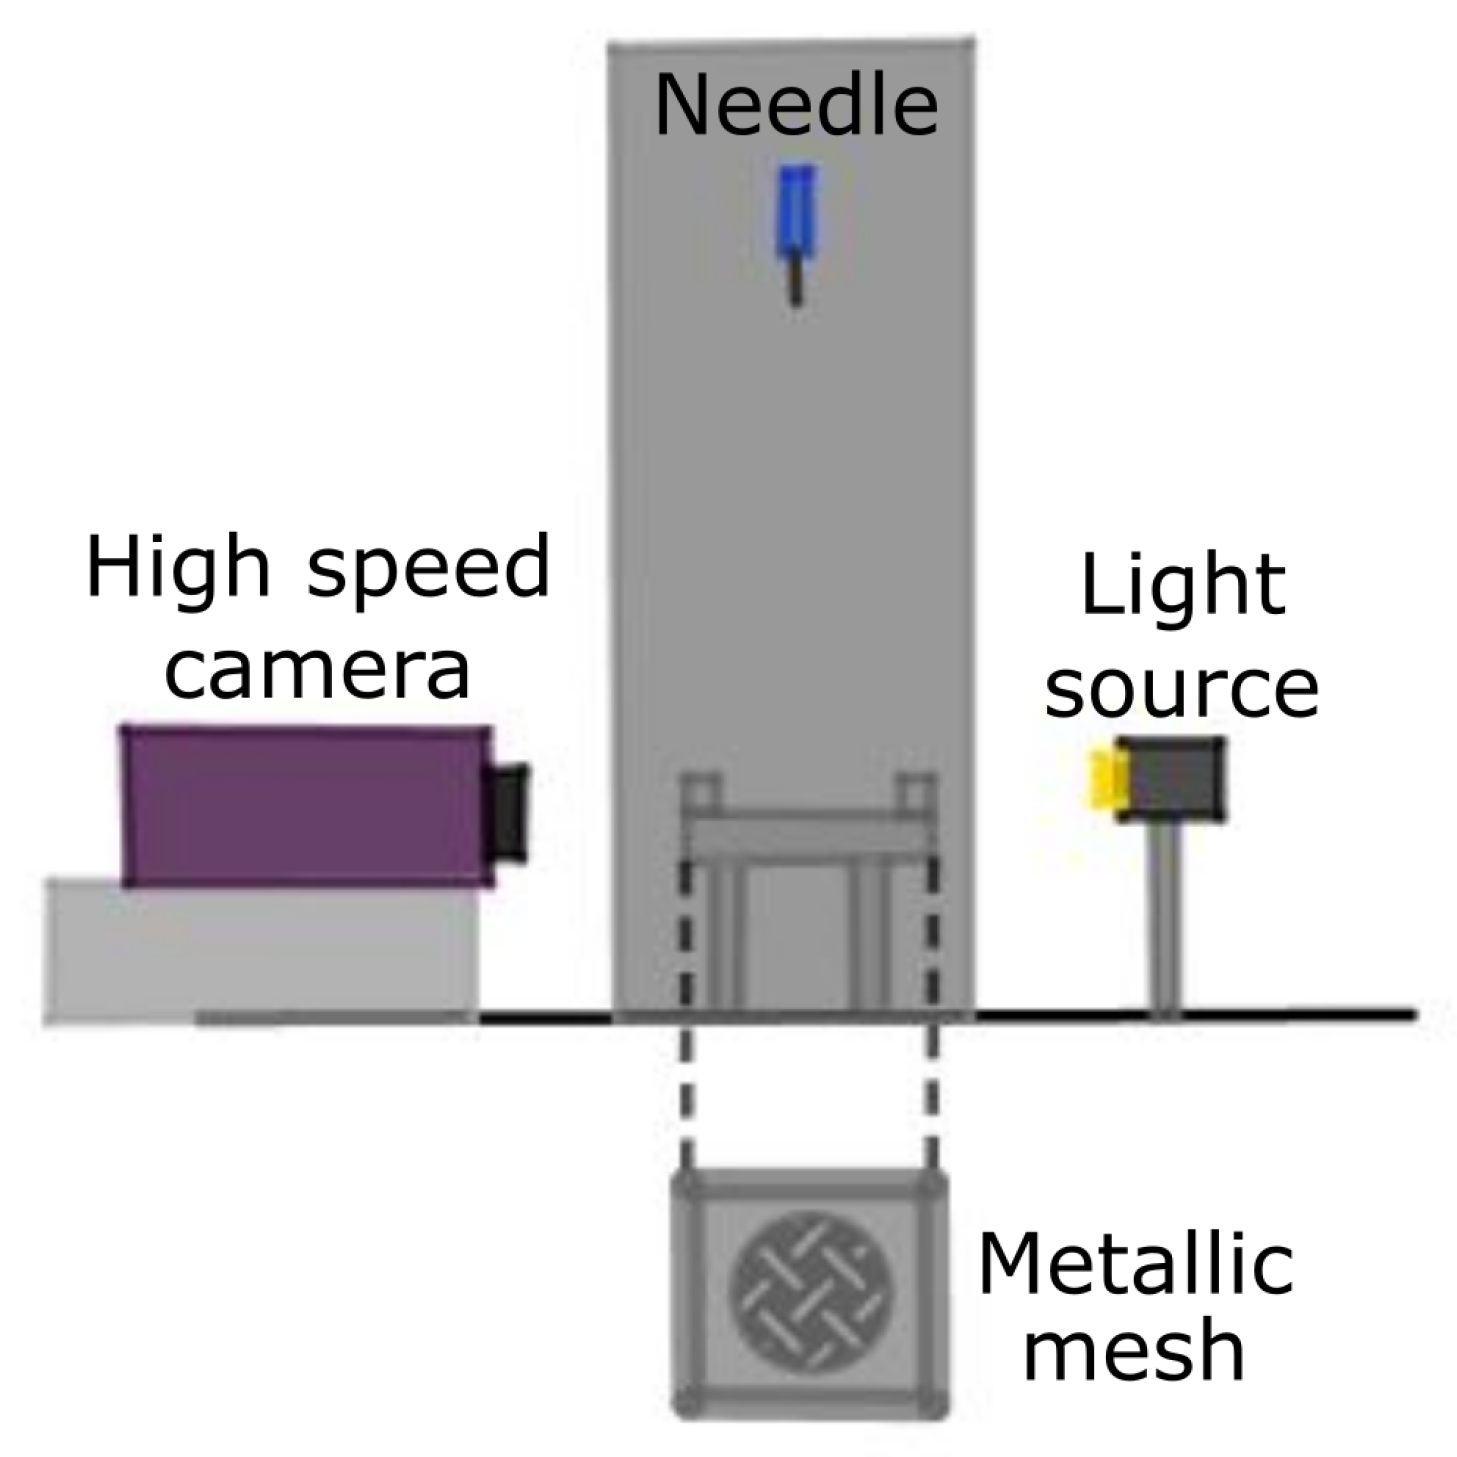
The droplet impact experiments were recorded using a Photron Fastcam SA4 high-speed camera (with a resolution of 1024 × 800 pixels). The test area was illuminated using a custom-built high-speed LED light source, synchronised to the high-speed camera. A purpose-built image processing algorithm was developed using MATLAB to measure the droplet initial diameter and the maximum spreading area of the impact. The impact velocity was also determined by measuring the rate of displacement of the droplet’s centre of mass from the video images. To confirm repeatability, droplet impacts were repeated at least 5 times for each set of impact conditions. A portion of the mesh was suspended using a ring with a 20 m m inner diameter. It was observed that a small vertical movement of the suspended mesh occurred after the impact of the droplet, particularly for high impact velocities. Figure 5 shows a schematic illustration of the experimental set-up.
The experiments are organised in different groups characterised by a different combination of initial parameters such as impact velocity, droplet diameter and liquid physical properties. To obtain a range of impact velocity U 0 between 2.0 m s 1 and 4.0 m s 1 , the height of release varies between 20 c m and 80 c m . The droplet is released from the needle exclusively by gravity. Two different needle sizes, 21 gauge needle, ( 0.82 m m OD, 0.51 m m ID), and 26 s gauge needle ( 0.47 m m OD, 0.13 m m ID) are used to vary droplet diameter. Three liquids are used—water, acetone, and a glycerol-in-water solution composed of 20% of water and 80% of glycerol (by volume), to analyse the effect of liquid viscosity and surface tension. The properties of the liquid and the mean droplet diameter, are listed in Table 1 and Table 2. Different liquids and needle size were chosen in order to maintain the same range of non-dimensional parameters.
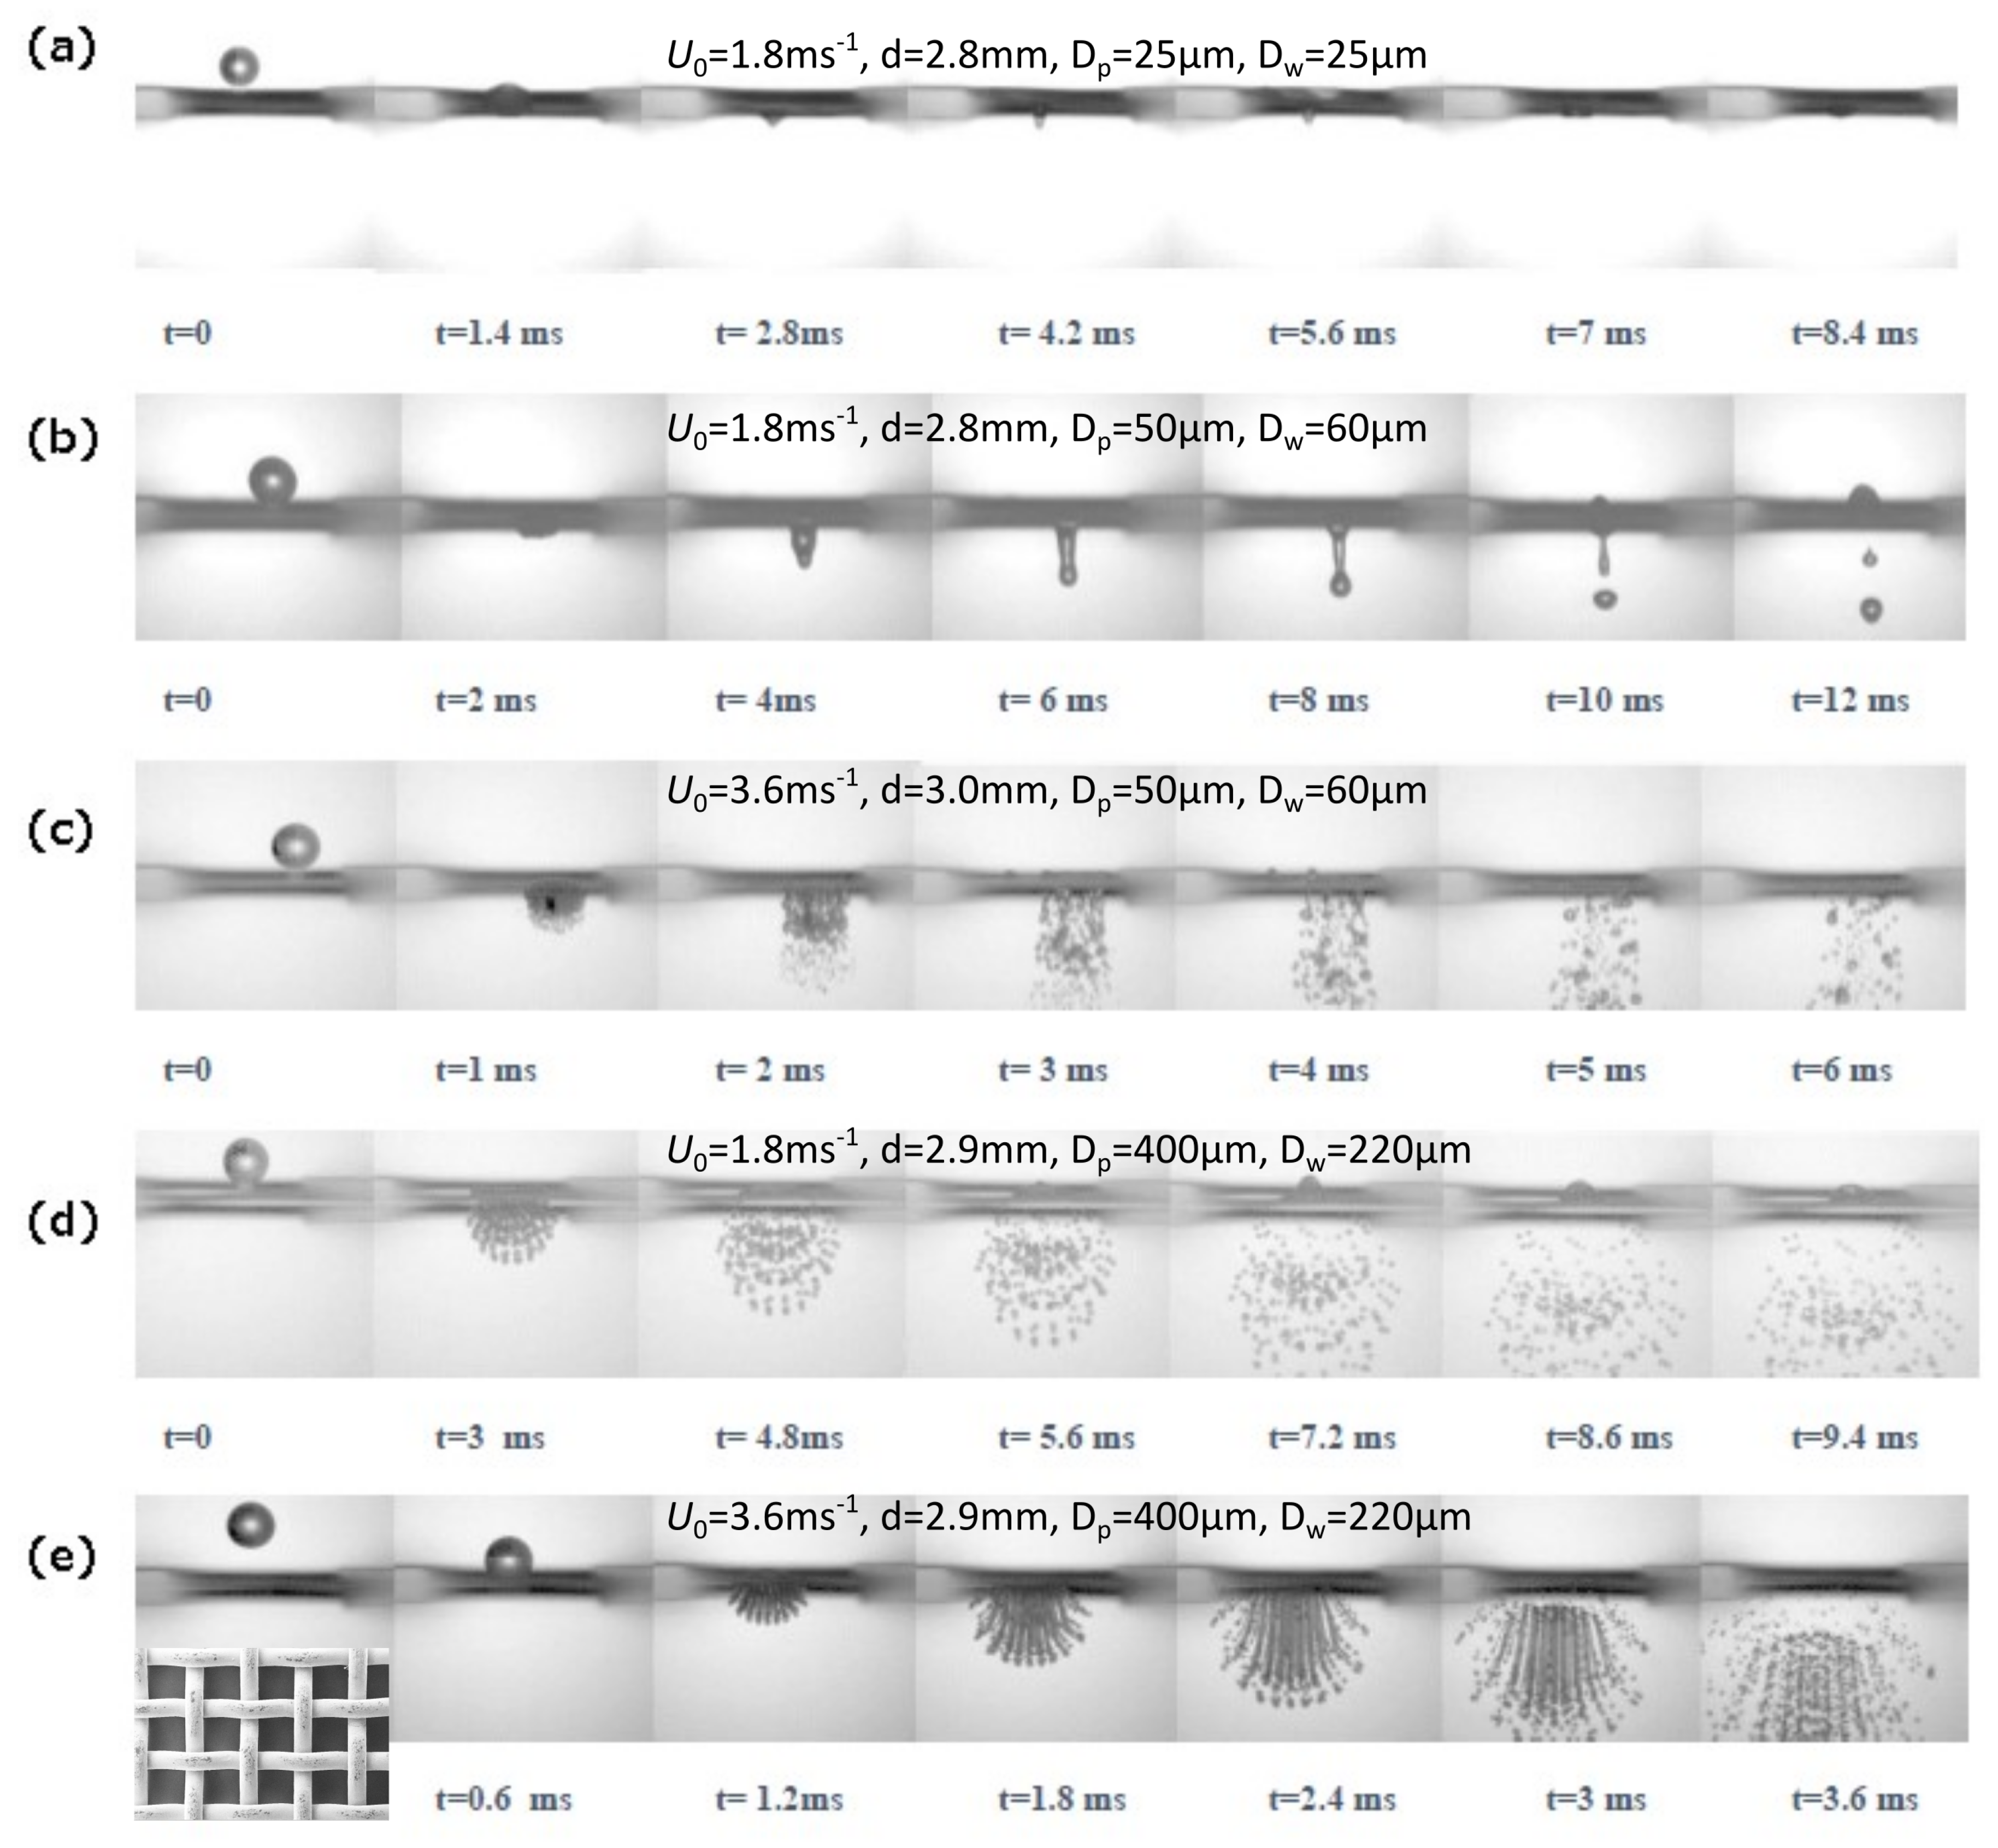
The impact of the droplet on the mesh led to three different possible outcomes; deposition, imbibition and penetration. In the case of deposition, after the impact there is no penetration of the droplet below the upper mesh surface. The deposition outcome is mainly influenced by a high viscosity, small pore size, and low impact velocity. The partial imbibition is mainly influenced by a larger dimension of the pores and a higher impact velocity. Depending on the initial parameters, the partial imbibition led to the formation of a liquid jet or a spray cone below the mesh, and subsequently to the separation of daughter droplets from the initial droplet. In the case of penetration, all the liquid penetrates below the mesh. A higher amount of liquid penetration is linked to a higher velocity impact, lower viscosity and a larger dimension of the pore size. The mesh pore size D p and wire diameter D w , spanned between 25–400 μ m and 25–220 μ m respectively. Figure 6, shows an example of the different outcomes. The main characteristics of the metallic mesh are also shown at the left bottom corner of the same figure.
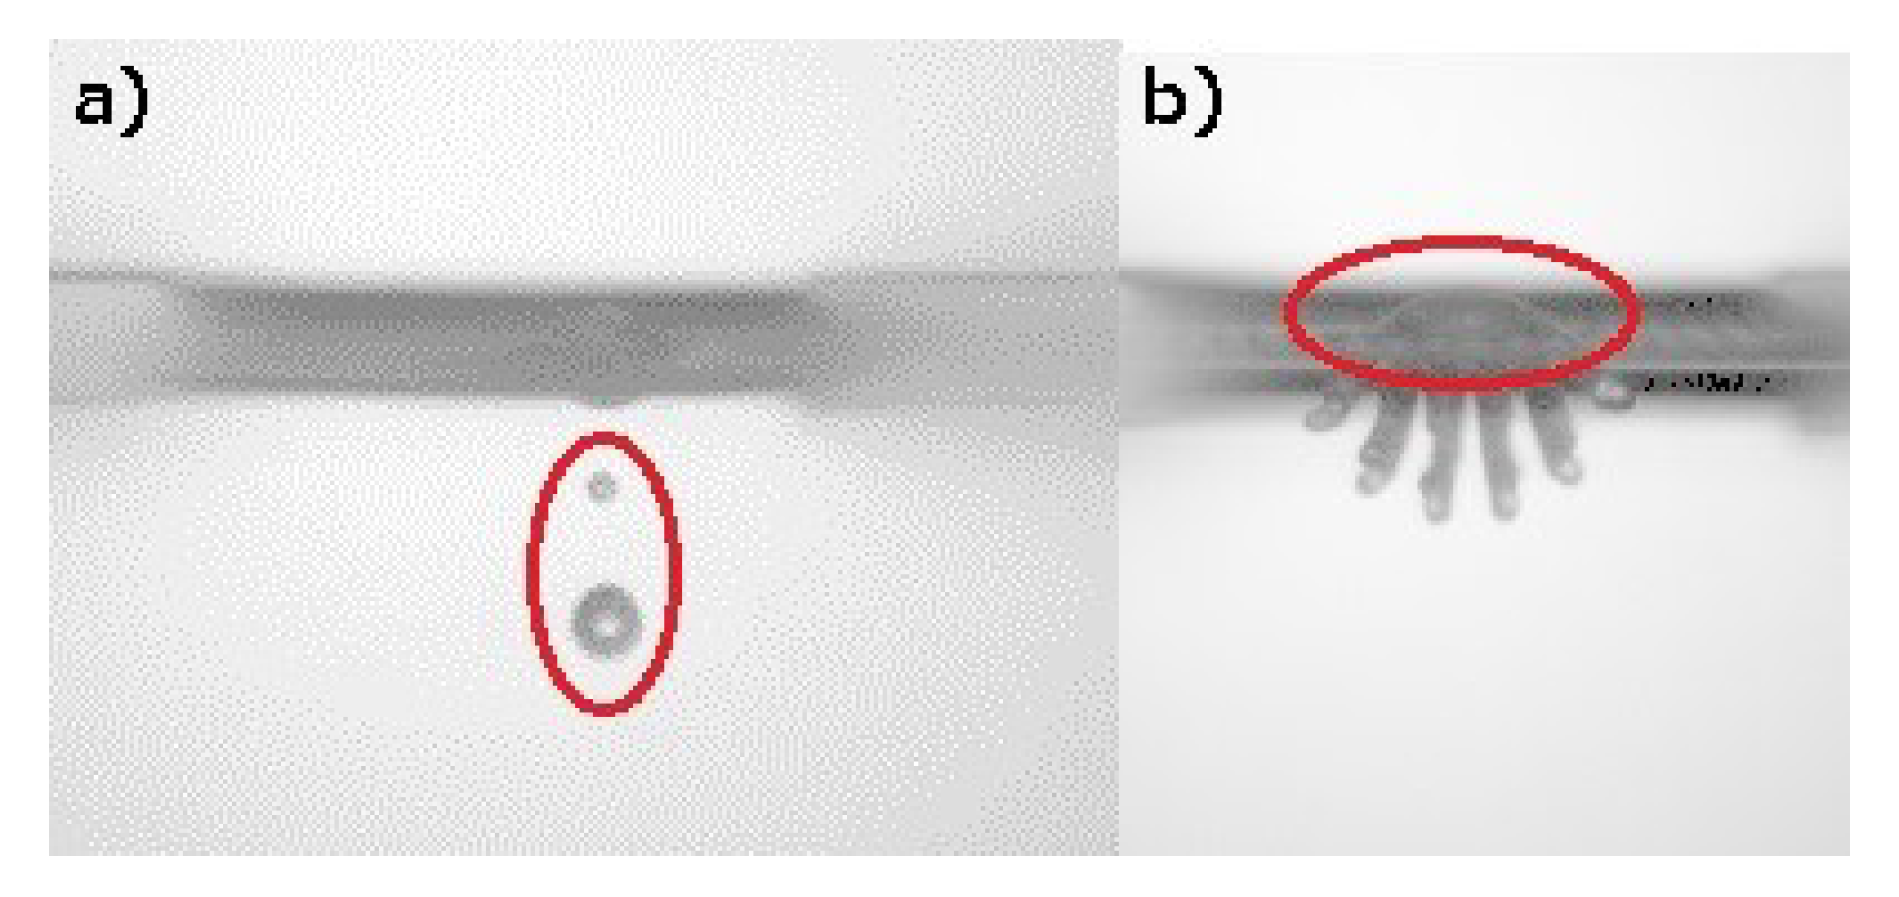
To evaluate the impregnation properties of the meshes an estimation of the liquid penetration is obtained by computing the volume of the daughter droplets ejected from the surface after the impact, or subtracting the volume of the remaining cap above the mesh from the initial droplet volume as highlighted in Figure 7.
The initial volume of the droplet is calculated from the initial droplet radius r i , assuming that the droplet has a perfectly spherical shape before the impact. Consequently, in the case shown in Figure 7a, the liquid penetration will be given by:
V ˜ = i = 1 n 4 3 π r i 3 .
This corresponds to the sum of all the individual droplets ejected below the mesh. Again here the assumption is that all of these droplets have a spherical shape and that their centre is along the same 2D vertical plane. In the case of Figure 7b, due to the complexity of the outcome, it is not possible to calculate the volume of the droplets ejected below the mesh, therefore the liquid penetration V ˜ is simplified to
V ˜ = V 0 V c a p = 4 3 π r 3 π h 2 r c h 3 ,
where, V 0 and V c a p are the initial volume of the droplet and the volume of the cap left above the mesh respectively, r c is the radius and h the height of the cap. In this case of complex droplet penetration, part of the liquid will be trapped within the wire mesh. To take account of this non-negligible percentage, the error was estimated as follows and reported in the graphs. Considering the base of the cap lying above the mesh being perfectly circular, the area of this base is be given by
A c a p = π r 2 .
The maximum percentage of trapped liquid is given by the base area multiplied by the thickness of the mesh and the Ratio of Open Area (ROA) of each mesh. This ratio is given by:
R O A = D p 2 ( D p + D w ) 2 .
Assuming that the thickness of the wire mesh will be equal to the double of the mesh wire diameter, the maximum volume of trapped liquid will be equal to
V t r a p p e d = A c a p R O A ( 2 D w ) .
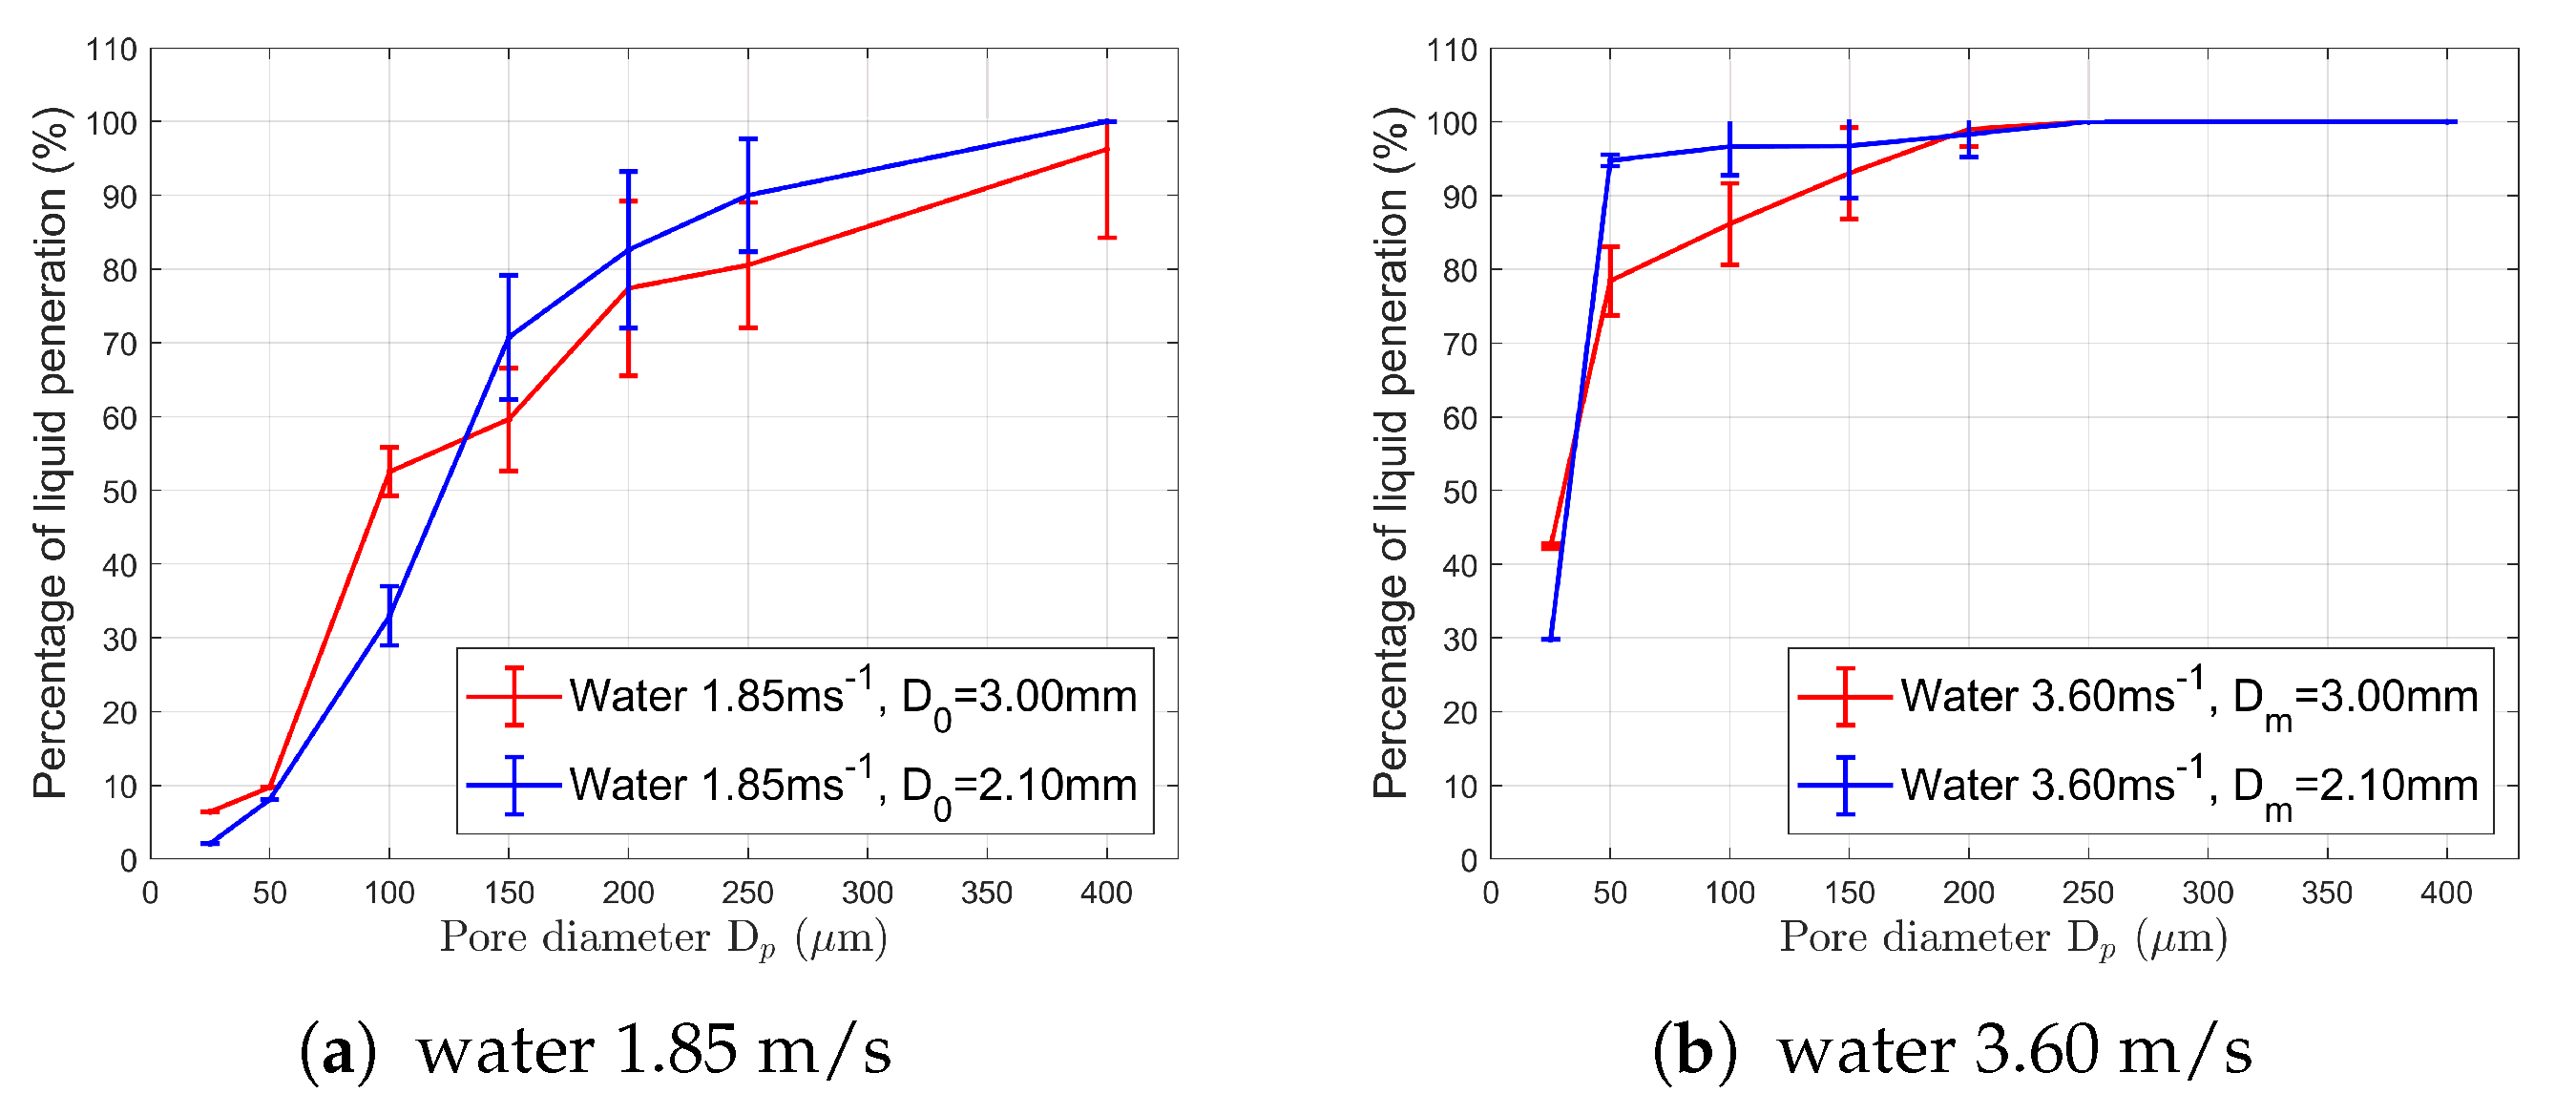
The general trend of liquid penetration for the three liquids with the associated error bar, as a function of pore size, liquid properties and impact velocity is shown in Figure 8. For all the liquids it is shown that increasing the pore size, the percentage of liquid penetration will also increase. At the same time, given the same pore size but increasing the impact velocity, the percentage of liquid penetration will be higher.
To verify whether the vertical movement of the mesh due to the impact can have an influence on the percentage of penetration or the outcome, some of the experiments were repeated using a 21-gauge needle with water, acetone and W&G on surfaces with pore sizes of 25, 200, and 400 μ m . To suspend a portion of the mesh two different ring sizes were used, respectively, with a diameter of 15 m m and 25 m m to verify if the amplitude of the oscillation can influence the outcome. No significant difference was observed in terms of outcome and percentage penetration for any of the considered liquids (Table 3, Table 4 and Table 5). It is possible to conclude that the movement of the mesh has no relevant effect on the nature of the outcome.
Figure 9 shows the trends of liquid penetration for the three liquids at the same impact velocity. In Figure 9a, which corresponds to an impact velocity of 1.85 m s 1 , it is shown that, given the same pore size and velocity, increasing the viscosity, reduces the liquid penetration. At the same time, for a lower surface tension, as for the case of acetone, given the same pore size and velocity, the percentage of penetration is higher.
The effect of liquid properties becomes less critical with increasing impact velocity. In fact, observing Figure 9b,c, which correspond respectively to impact velocities of 2.70 m s 1 and 3.60 m s 1 , the difference in percentage of liquid penetration for water, acetone and water-glycerol is smaller.
Figure 10a, shows the trend of liquid penetration for a droplet of water, at the same impact velocity but with a different initial diameter. According to the study of Xu et al. [32], who analysed water droplet impact on meshes with different pores sizes, it is not possible to define a number N ˜ given by the ratio of the shadow area of the droplet over the single pore area
N ˜ = A s A u = π D 2 4 1 ( D p + D w ) 2 .
Increasing the value of N ˜ , the value of the impact velocity, necessary to eject part of the droplet below the surface, will be lower. In our experiments, it is shown that, given the same impact velocity, the percentage of liquid penetration of a droplet with a mean diameter equal to D m = 3.0   m m will be higher than the one for a droplet of D m = 2.1   m m , which means that for a smaller droplet of water, the impact velocity necessary to get the same liquid through the pore must be higher. However, increasing the size of the pore, specifically for a pore diameter larger than 100 μ m , the percentage of liquid penetration at lower velocity will be higher in the case of droplets of water with a smaller diameter.
When increasing the impact velocity the effect of initial droplet diameter on the percentage of liquid penetration becomes small (Figure 10b). Xu et al. [32] pointed out that, for a wide range of pore dimensions, it is not appropriate to refer to a constant coefficient to predict the impact velocity for which penetration will occur. This assumption is valid just considering a single mesh geometry and without varying liquid properties. In fact, the experiment shows that varying liquid properties, for example in the case of water and water-glycerol, given the same droplet initial diameter and mesh geometry, penetration will occur at a different impact velocity. Consequently, the coefficient N ˜ is not sufficient to estimate the velocity for which penetration will occur.

4.2. Numerical Investigation

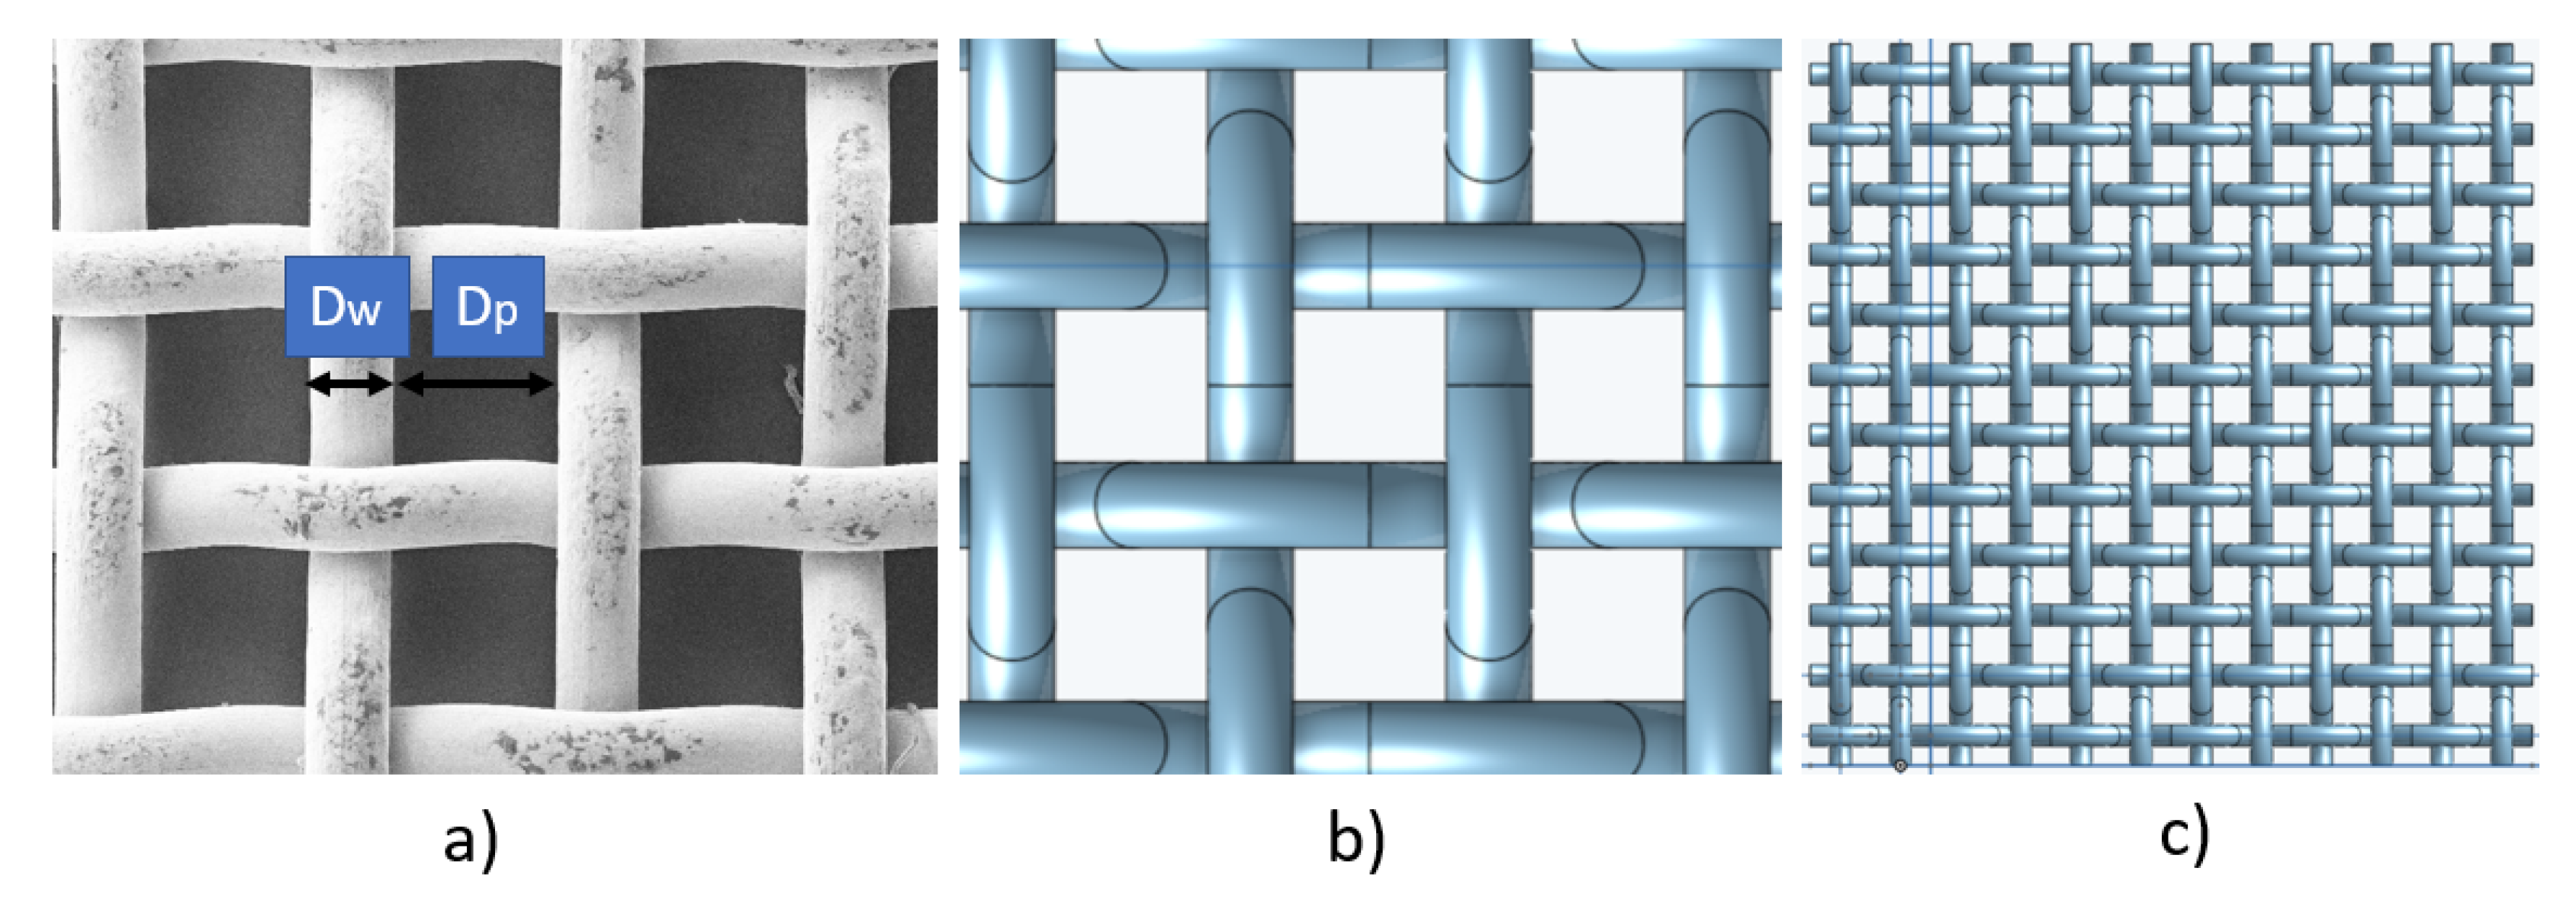
Numerical simulations of one of the metallic meshes presented in the previous section are performed for the case D p = 400   μ m and D w = 220   μ m and compared with the experiment. The corresponding experimental conditions are summarised in Table 6. The numerical results are presented and analysed in order to provide new insights into the resulting phenomenon providing quantitative details for the droplet impact and penetration characteristics. For the generation of the geometry of the metallic mesh, the CAD cloud software Onshape® is used. In Figure 11 the actual metallic mesh geometry from the experiments and the corresponding CAD model, are depicted. For the grid (mesh) generation, the snappyHexMesh (sHM) utility of OpenFOAM is utilised. In Figure 12 the computational domain, the boundary conditions as well as the metallic mesh position after using the snappyHexMesh utility is illustrated. For reducing the total number of cells and hence the computational time and cost, one-fourth of the total 3D domain with symmetry planes is simulated.
As can be seen from Figure 12 in total four cell refinement levels were applied for numerical cases I and III with minimum cell size 12.5 μ m in the region where the metallic mesh is located and maximum size 200 μ m , close to the edges of the computational domain. In cases II and IV, three refinement levels with minimum cell size 25 μ m and maximum cell size 200 μ m , close to the computational domain edges, were used. Therefore, the computational domain for all cases consisted of a hybrid grid with high number of hexahedral cells and a small number of polyhedral cells, which were applied only close to curved walls of the wires.
Two separate cases are considered to study the sensitivity of the initial position of the droplet relative to the mesh (Figure 12f,g). The droplet is centered above two wires for cases I and II, while for cases III and IV the droplet is centered above one wire. The overall differences between these four numerical simulation set-ups are summarised in Table 7 and are further described in the following paragraphs.

4.3. Numerical Simulation Results for Droplet Impact on Metallic Meshes

All simulations presented in this sub-section refer to the same experimental conditions (as shown in Table 6). The differences related to the domain dimensions, the total number of cells, the overall levels of refinement and the initial position of the droplet can be found in Table 7.
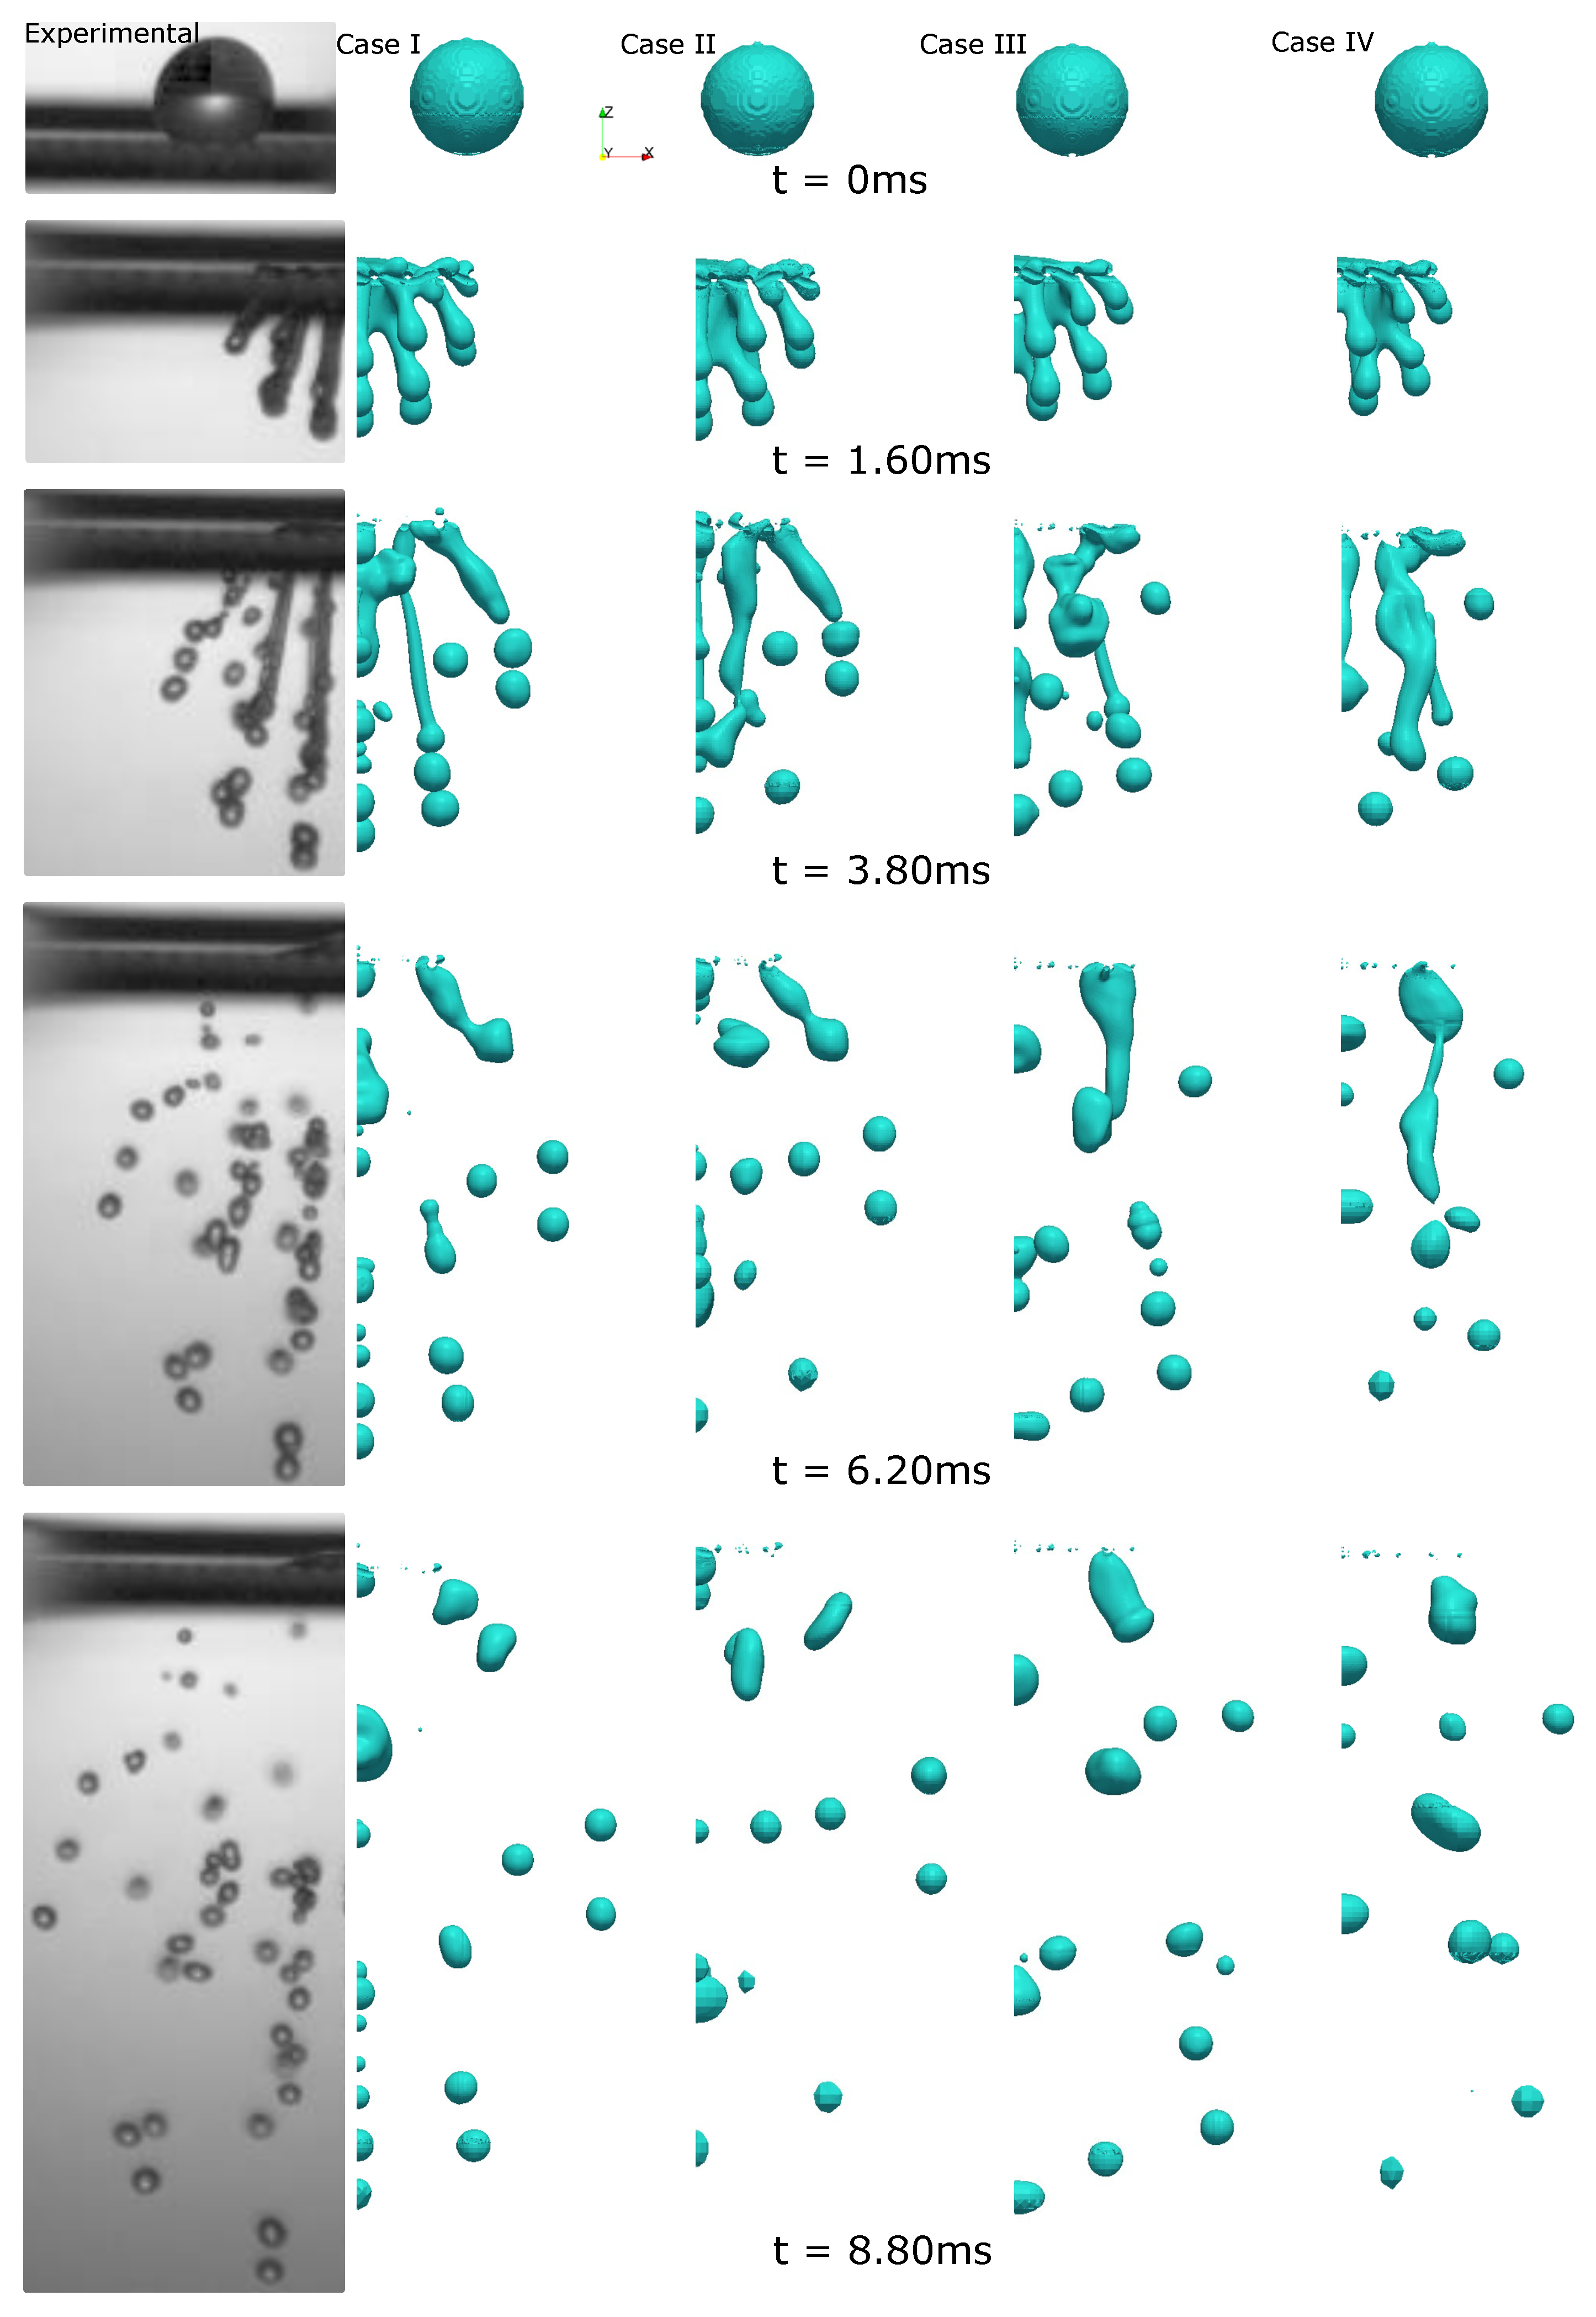
A macroscopic/qualitative comparison of the numerical predictions with the experimental measurements are shown in Figure 13. As it can be observed, all four numerical simulations show a good overall agreement with the experimental data. Specifically, during the advancing phase of the droplet, both experimentally and numerically, the liquid crosses the metallic mesh generating a number of fingers which become thinner and longer as time passes. It can be seen that both high and lower resolution numerical simulations show good agreement with the experimental data. During the receding phase, in the experimental data the fingers are thinner compared to the numerical cases, where the fingers are thicker and fewer in number. Subsequently, during the receding phase, the disintegration of the first droplets occurs at time t = 2.50   m s for numerical case I and t = 2.60   m s for case II, while in the experiment the first disintegration occurs at t = 2.40   m s . Accordingly, the first disintegration of droplets for cases III and IV occurs at t = 2.50   m s and t = 2.70   m s , respectively. This suggests that the disintegration of the first droplet occurs at a time period which is not related to the droplet impact position relative to the mesh. Additionally, comparing numerical simulations I and II, the disintegration of the first droplet is delayed only by 0.10 m s in the simulation of 4M cells. Hence, it can be concluded that the lower number of cells does not affect significantly the results, up to that time instant. For later time periods, in both experimental and numerical cases, daughter droplets occur from the breakup of the previously formed fingers. From the numerical results it can be observed that there is no difference between the two cases regarding the diameters of the disintegrated droplets. However, a small difference in the thickness of the fingers can be observed (Figure 13). This is due to the fact that the numerical cases with 4M cells cannot capture the thin fingers of the experimental results due to the coarser mesh. Conversely, higher resolution cases can better capture this phenomenon.
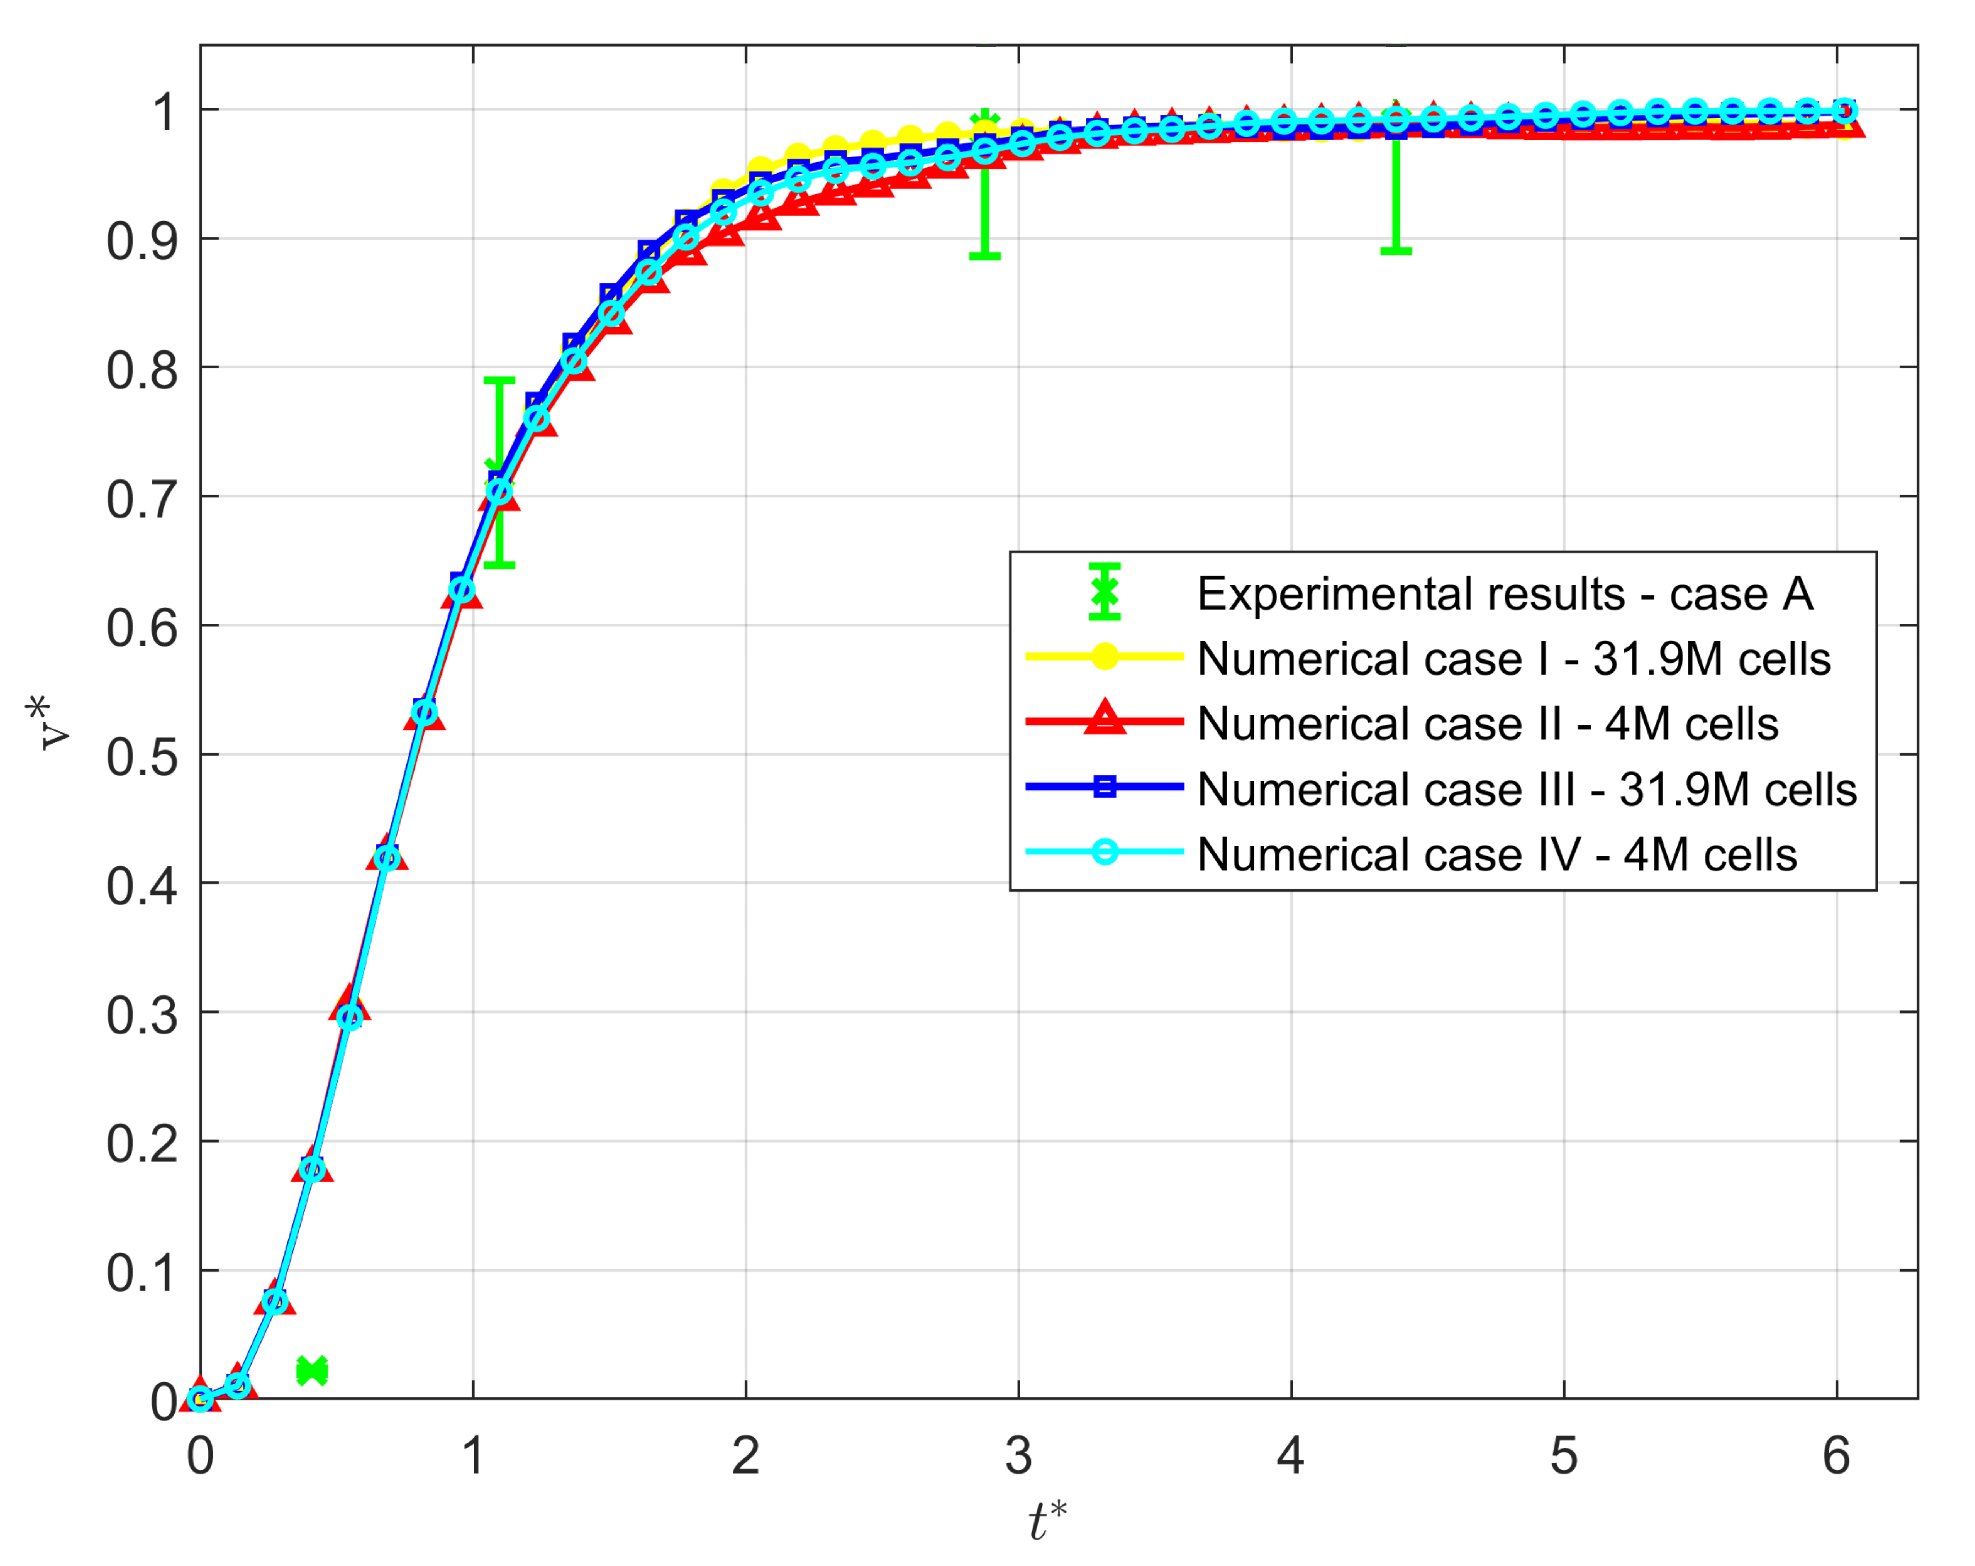
Since the main aim of the numerical investigation is to quantify the volume of liquid retained within the metallic mesh, the resolution of the 4M cells (case II) domain in the vicinity of the mesh can be considered adequate to capture this phenomenon. However, if the focus is to predict the diameter of the daughter droplets after impact and droplet penetration through the metallic mesh, then more dense cells should be added at these regions. This conclusion can also be observed quantitatively, in Figure 14, by comparing the dimensionless volume v = V t / V 0 of liquid that passes below the metallic mesh (where V t is the volume of liquid at each specific time period) over the dimensionless time t ( t = t U 0 / D 0 ). As it can be seen the first measurement point in the experiment, differs significantly from all numerical cases. This is because the results from the experiments are limited by the fact that it is not possible to visualise the droplets captured by the wire mesh, while in the numerical cases this liquid volume is accounted for. As a result the percentage of liquid penetration is underestimated by the experiment, due to the fact that during the spreading a larger portion of the mesh will be covered by the liquid phase, and consequently a higher percentage of the droplet will be entrapped in the wires. It should be mentioned that an error bar of 10% in each value of the experimental results has been added. Comparing now the numerical cases only, a good agreement can be observed between the 4M cells cases (case II and case IV) and the 31.9M cells cases (case I, case III). The maximum differences are in the order of 5%. This further justifies quantitatively the previous qualitative conclusion. Therefore, for the parametric numerical simulations of the article, case II is selected as the most appropriate computational set-up, considering that it provides adequate accuracy in the prediction of the liquid amount that passes below the metallic mesh while requiring a lower computational cost.

5. Parametric Numerical Simulations

Numerical simulations of “virtual liquid” droplets impacting on metallic meshes are presented in the present section. “Virtual liquid” in this context refers to liquids where only one property is changed with respect to water (e.g., viscosity) while all the other fluid properties remain unchanged. These simulations are performed to better understand the effect of the considered parameter, as this is something that cannot be performed with laboratory experiments. Particular attention is given to the effect of the varied parameter on droplet penetration characteristics, which is evaluated as the dimensionless volume of liquid that remains attached to the metallic mesh region with respect to time.
The case for the parametric analysis, uses the same numerical parameters as shown in case II Table 7 as well as the same conditions as in Table 6. The details of each numerical simulation performed in the proposed parametric analysis are summarised in Table 8. Additional results of case II can be seen in Figure 15, where useful information that can be easily extracted from the numerical model (e.g., velocity, relative pressure) are depicted. Particularly, in Figure 15a,b a 3D representation of the drop and the volume fraction, can be seen. From these figures the fast crossing of the droplet during the advancing phase is clearly visible, since approximately 90% of the liquid has crossed the mesh within 3.0 m s , after the impact. Figure 15c shows the relative pressure, which is concentrated on the wires, where the contact with the liquid is, and decreases as the drop passes through the mesh. The corresponding velocity magnitude (U) is shown in Figure 15d. Here, after the droplet reaches a velocity of 0 m s 1 on the mesh, a velocity increase on the liquid, below the mesh, is seen.

5.1. Influence of Reynolds Number

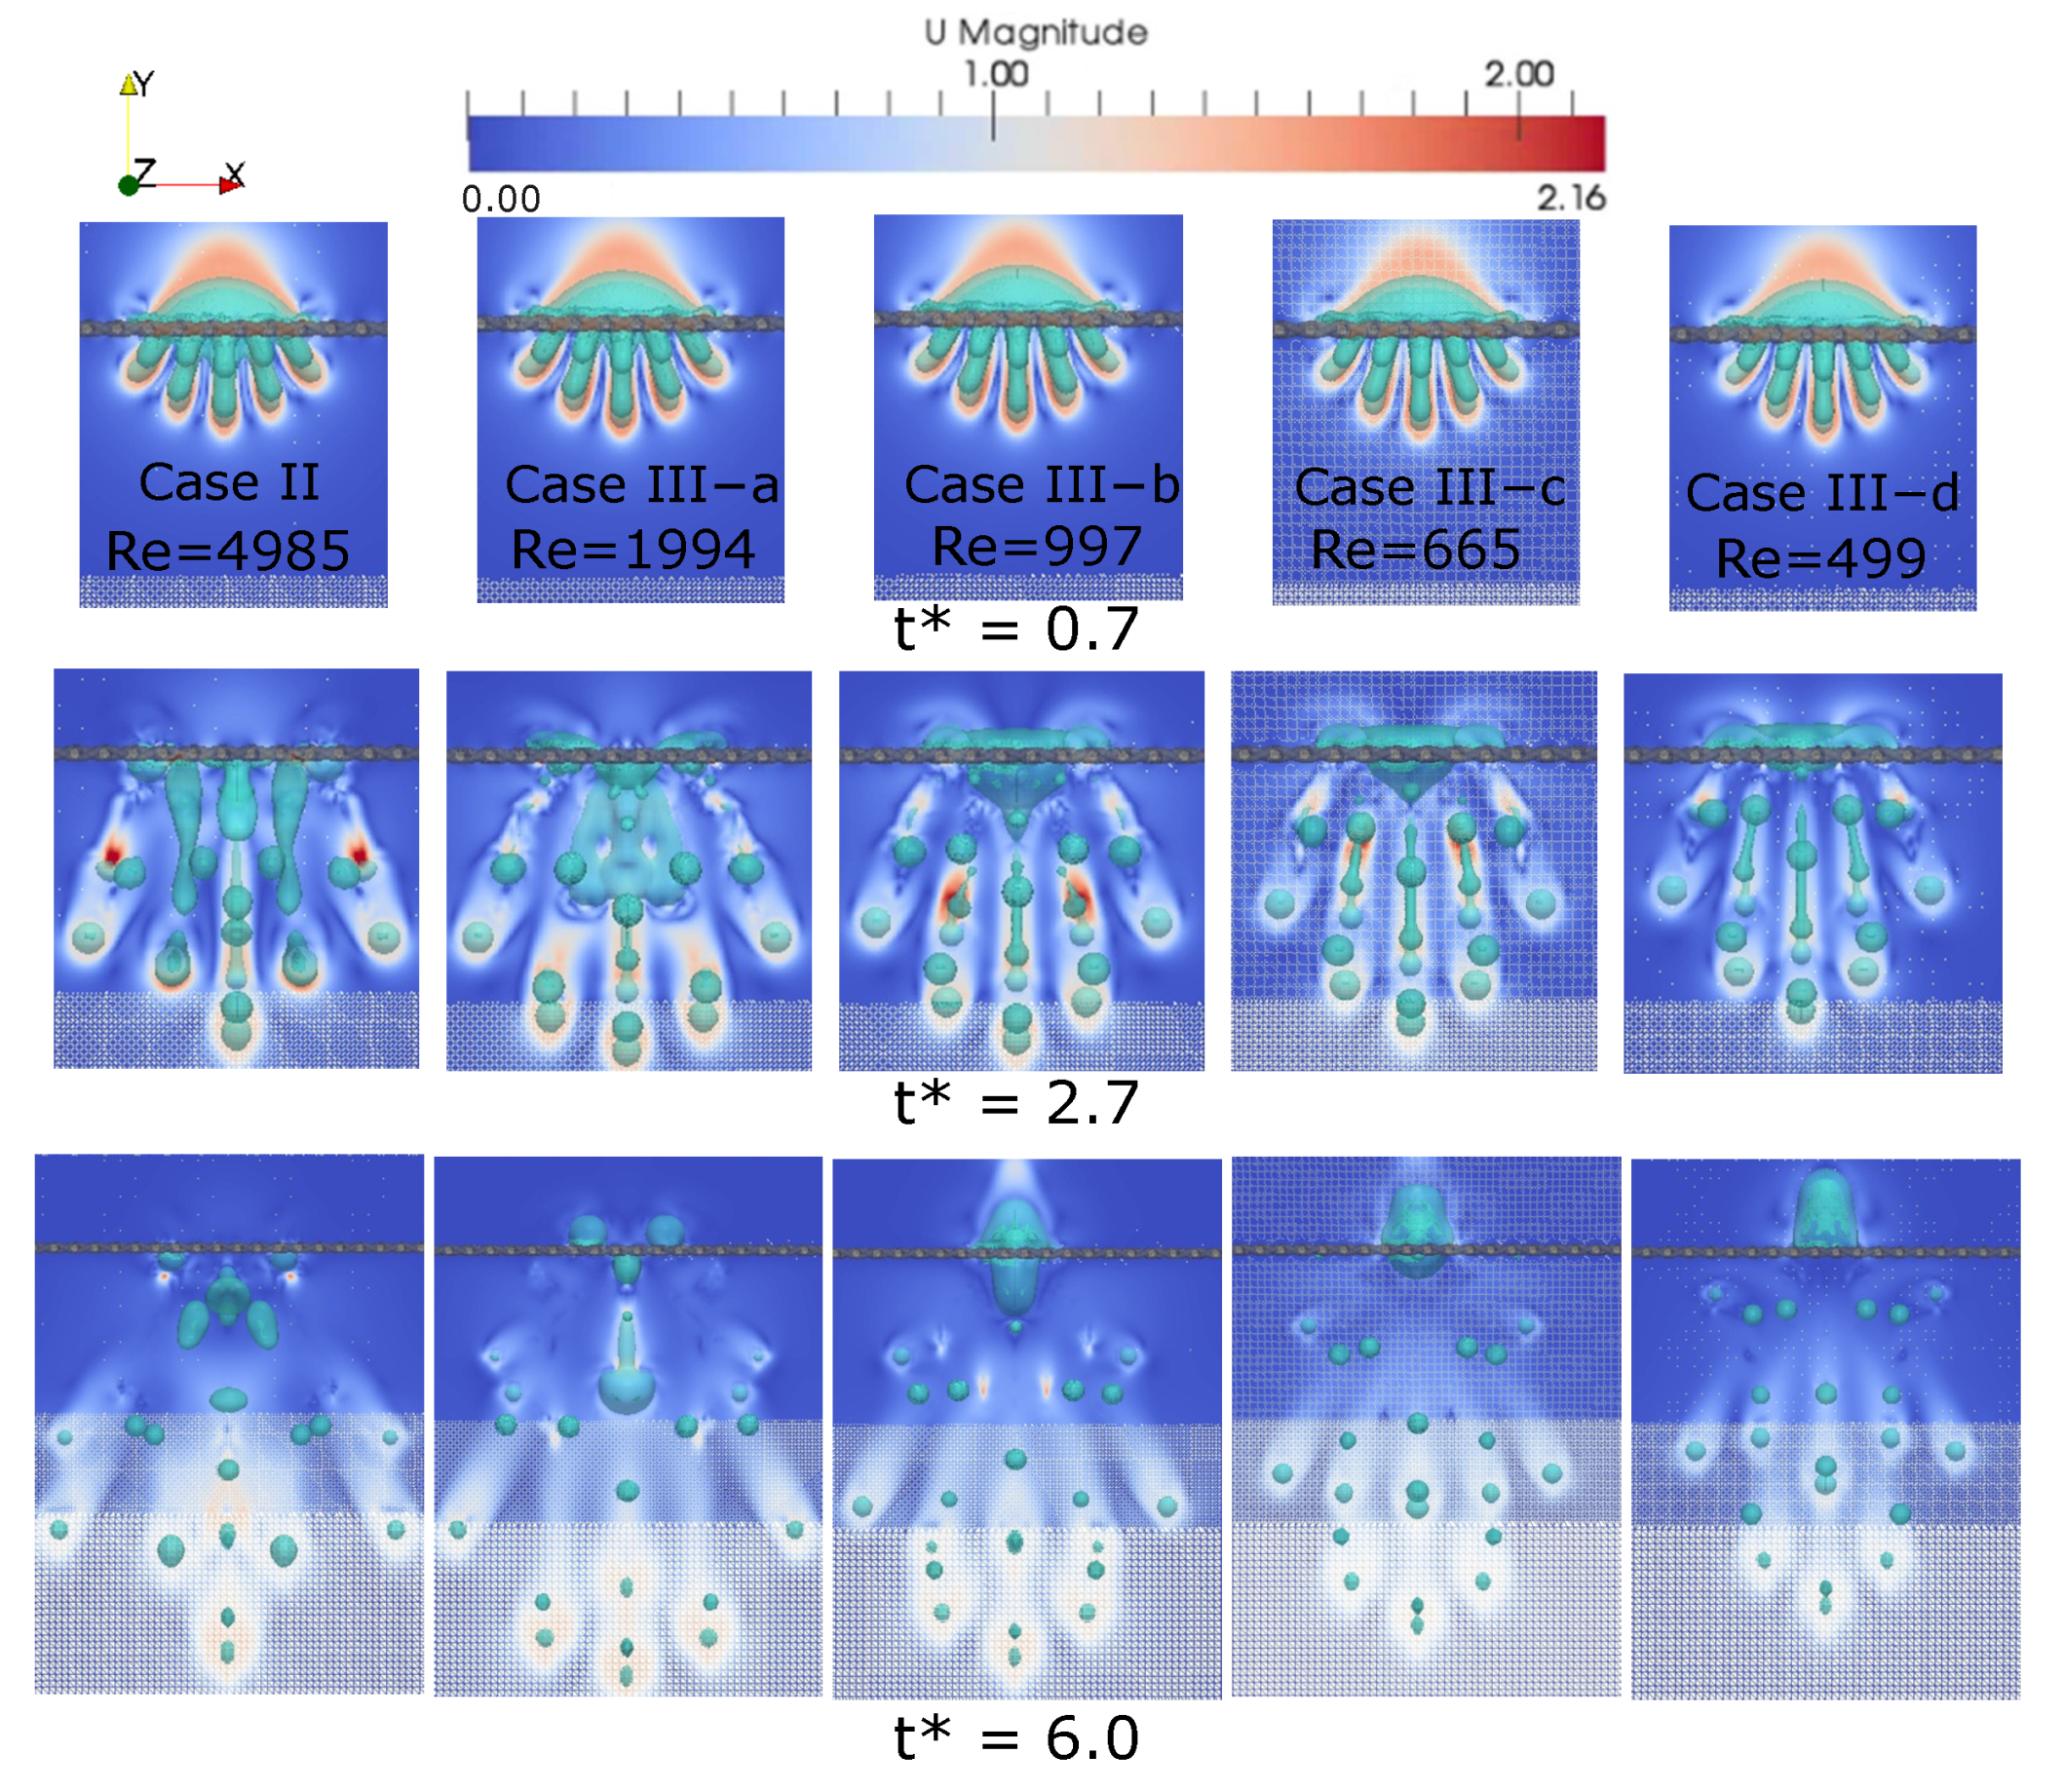
First, the influence of the Reynolds number on the droplet impact on metallic meshes is investigated by performing numerical simulations of droplets with various viscosities ( μ ). Four different numerical simulations are conducted (numerical cases III a–d), with the viscosity value increasing by a factor of 2.5 in each case.
The effect of R e at three different time instants can be seen in Figure 16, where case II is compared with cases III a–d. Qualitatively, during the advancing phase and particularly at t = 0.7 it can be observed that there is no significant difference between the cases, apart from the fact that the cases with higher viscosity have higher maximum contact diameter compared to case II. However, other factors such as the length as well as the thickness of the fingers which are formed below the mesh, are the same in all cases. Subsequently, the effects of the R e number and the resulting differences between the cases are more significant. Particularly, for t = 2.7 , it is obvious that the gradual decrease of R e causes a corresponding decrease in the amount of liquid that has penetrated below the metallic mesh structure. This is evident from the higher quantity of liquid traced above the metallic mesh structure, as well as from the fact that the detached small droplets below the metallic mesh have travelled a progressively smaller distance with respect to the vertical axis. This is also apparent at t = 6.0 . Furthermore, observing all cases it is evident that the gradual decrease of R e causes the part of the droplet that stays above the metallic mesh structure to recoil faster. Especially in the case of the lowest R e , no hanging droplet volume can be traced below the metallic mesh which indicates an almost complete droplet recoil. Focusing now on the number and size of the disintegrated daughter droplets after the penetration, no significant effect due to the gradual increase of R e , can be observed. Therefore, it can be concluded that R e , and hence, the liquid viscosity mainly affects the adhesion characteristics of the impacting droplet to the metallic mesh structure and not the droplet break-up characteristics in the amount of liquid that penetrates through.
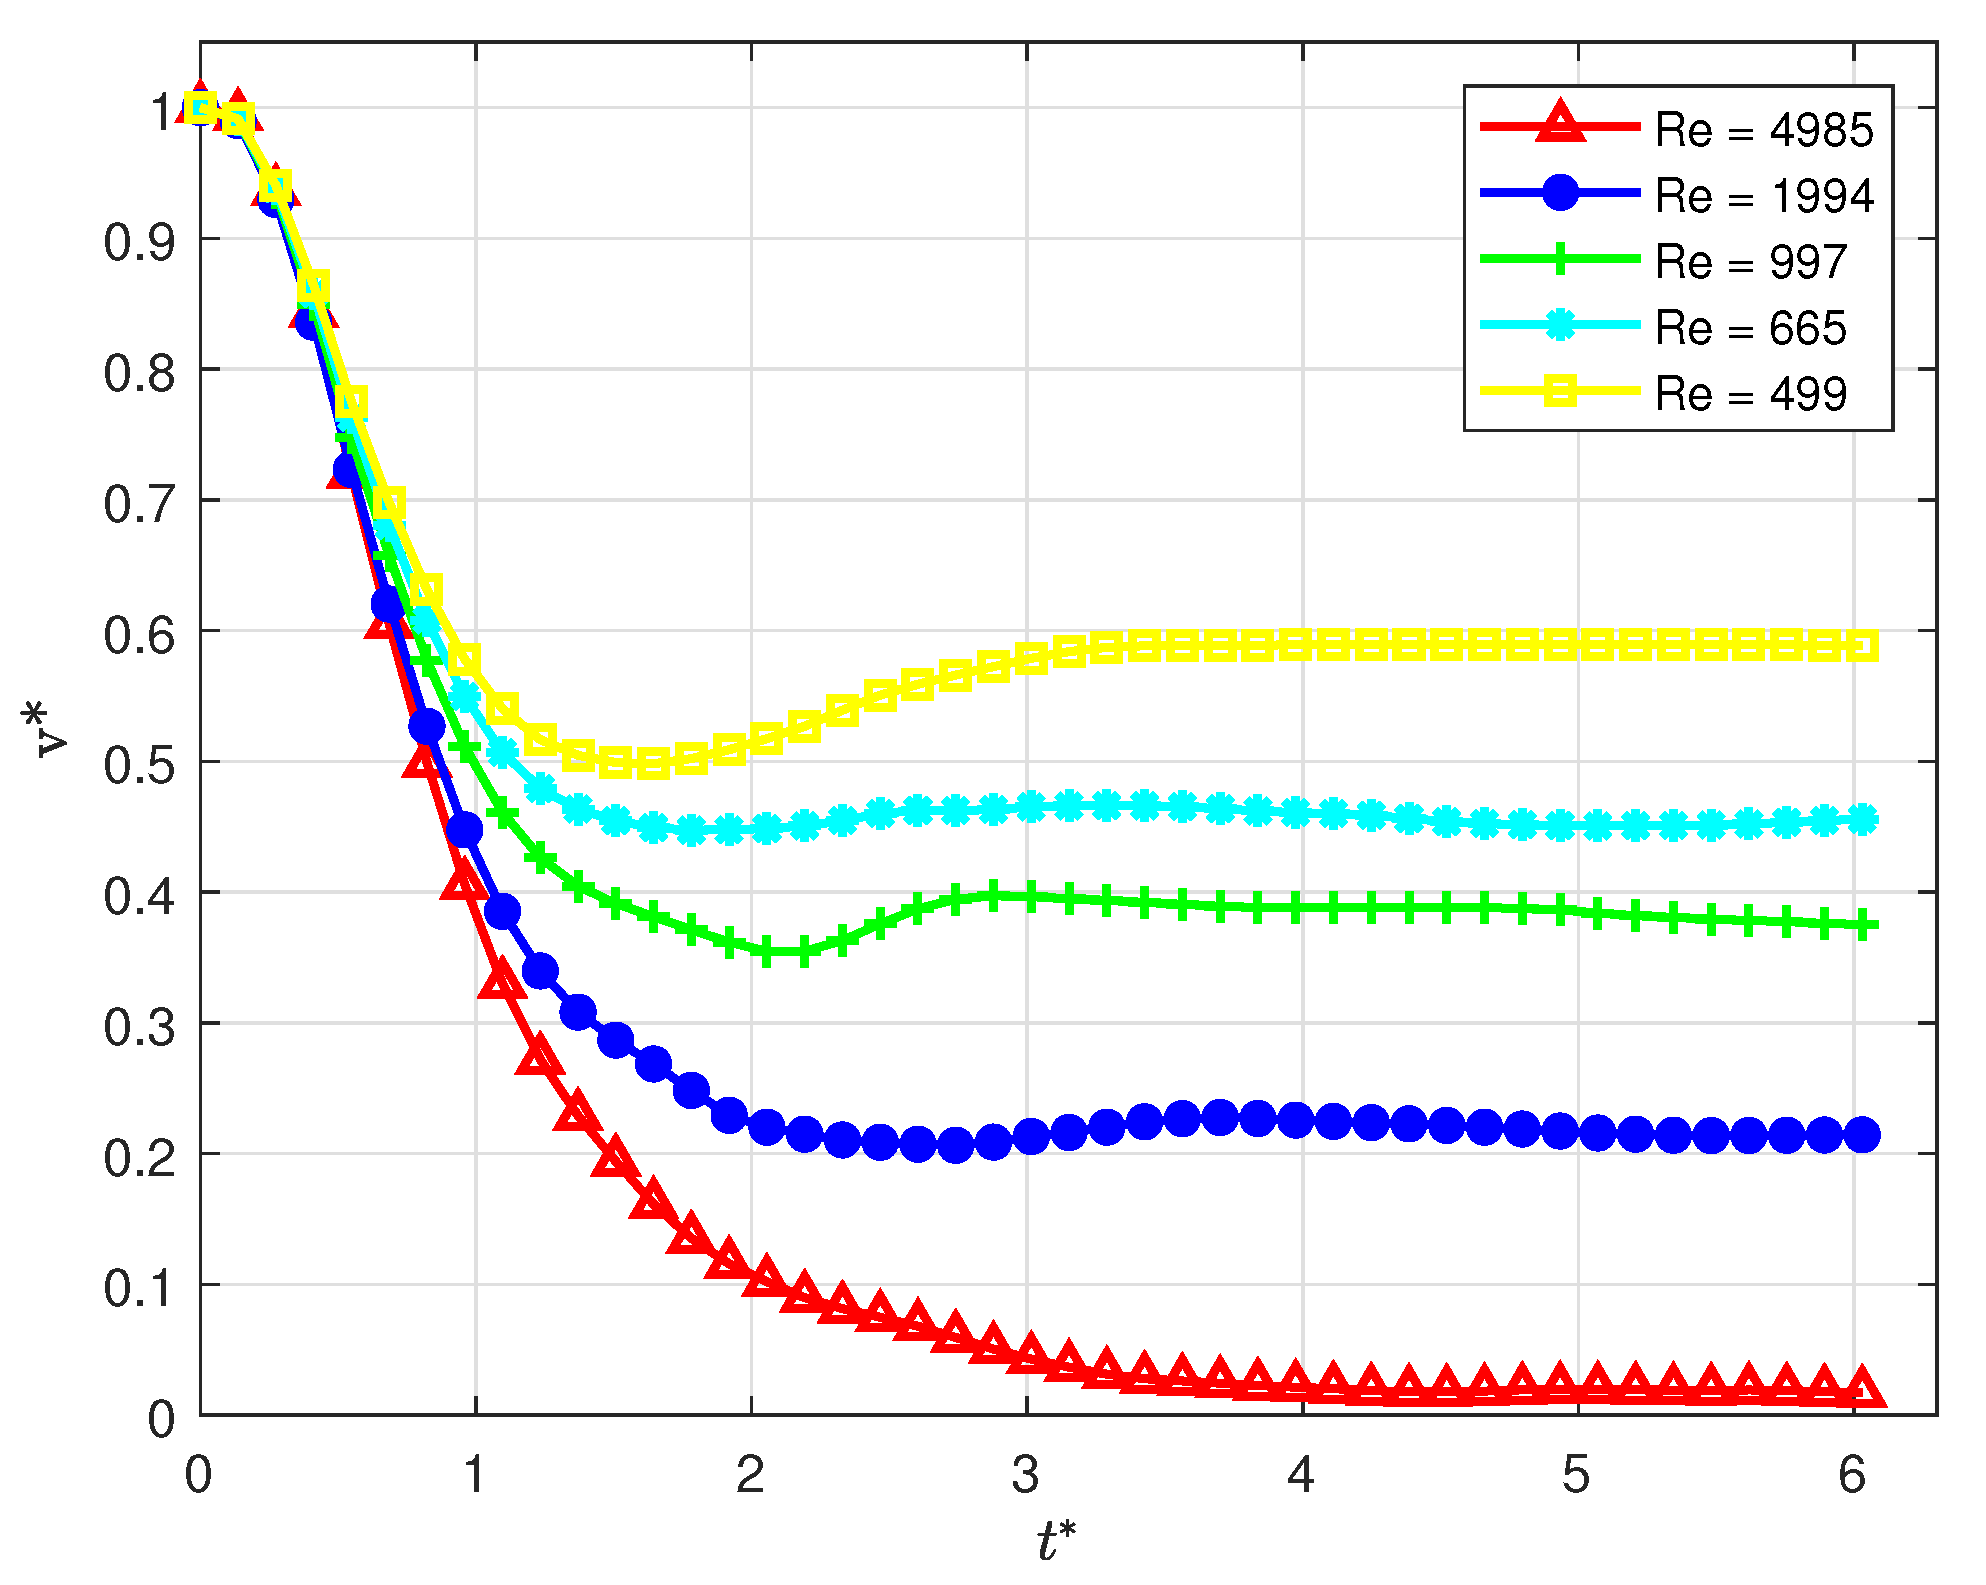
In order to conduct a more quantitative comparison of the effect of R e number, the dimensionless volume of liquid that remains above the metallic mesh is plotted with respect to time for all five cases in Figure 17. It is shown that, as R e decreases the final droplet percentage that remains above the metallic mesh increases progressively from almost 0% (case II) to approximately 20%, 40%, 45%, and 60% for cases III-a, III-b, III-c and III-d, respectively. From the same figure, it is also characteristic that for the four examined cases during the recoiling phase, an increase of the liquid located above the metallic mesh is observed before the value of volume is finally stabilised. This is because the liquid that hangs below the mesh structure, and earlier disintegrated into smaller droplets, is sucked back into the recoiling mother droplet located above the mesh. Additionally, it can be seen that there is a threshold of R e above which a total penetration of the liquid is observed. However, further numerical investigation with different pore size is required in order to have clearer insight on this.
The results for the liquid volume above the metallic mesh can be related to the dimensionless Ohnesorge number ( O h = W e / R e ). The Ohnesorge number in case II is O h = 2.26 × 10 3 , while the virtual fluid of case III-d has a value of O h = 2.26 × 10 2 . This value is very close to the critical value O h = 3 × 10 2 , where according to Blanchette & Bigioni [33], viscosity plays an important role in the behaviour of the droplet, for example, for droplet merging [34].
The capillary number ( C a = μ U 0 / σ ) represents the ratio of the viscous and surface tension forces, and is linked to the Ohnesorge number by the relation C a = O h W e . In this case, the capillary forces ( C a = 0.25 ) are negligible, compared to the viscous forces which are dominant. A value of less than C a = 10 5 , would be needed for the flow to be dominated by capillary forces [35].

5.2. Influence of Weber Number

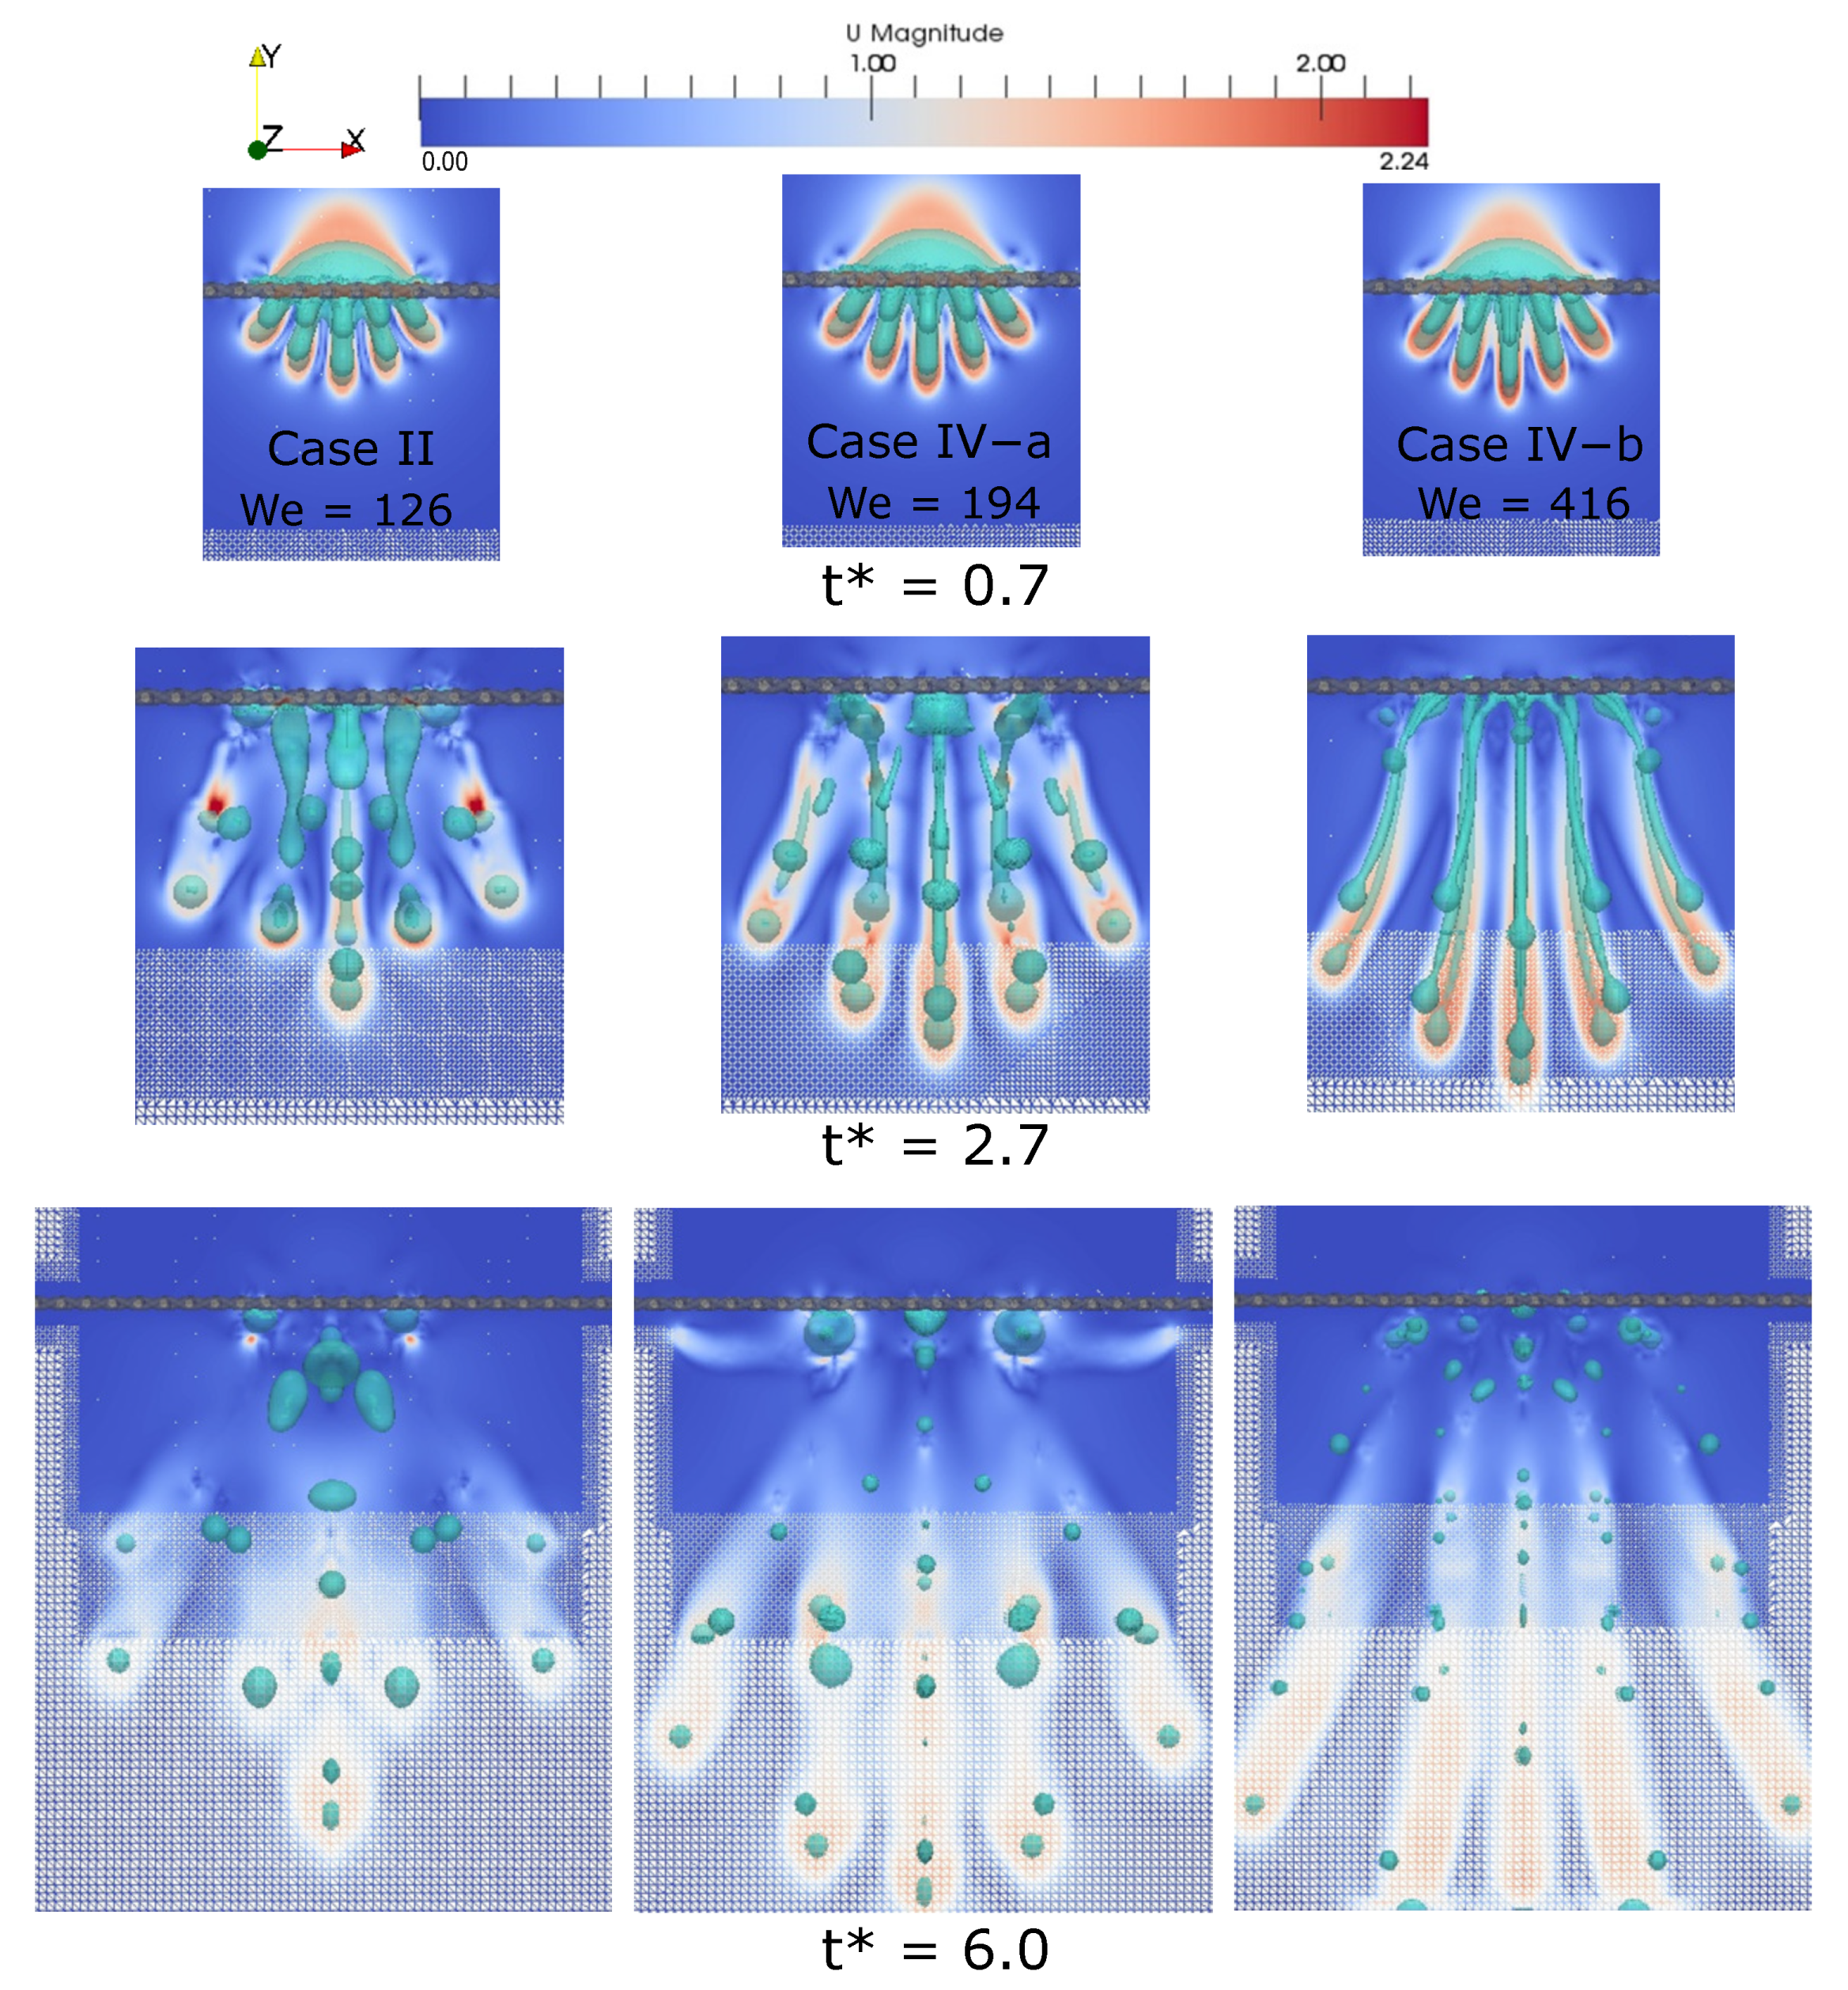
In order to have better understanding of the effect of the Weber number on the resulting phenomenon, two numerical simulations were conducted with approximately one-third and two-thirds of the surface tension value of case II. The values of W e for cases IV-a and IV-b are 416 and 194, respectively. Both cases are compared with the results of the base case II where W e = 126 .
From the qualitative (Figure 18) and quantitative (Figure 19) comparison in this series of parametric numerical experiments, it is obvious that the decrease of the W e number has almost no effect in the amount of water that penetrates the metallic mesh, but it has a significant effect in the droplet break-up characteristics below the metallic mesh structure. In particular, as can be seen from Figure 18, the qualitative comparison of cases IV-a and IV-b with case II demonstrates that for the early stages of the impact (up to t = 2.7 ) higher values of W e lead to the generation of more fingers that are longer and thinner. Furthermore, the lower the W e number the slower the disintegration of the fingers into smaller daughter droplets.
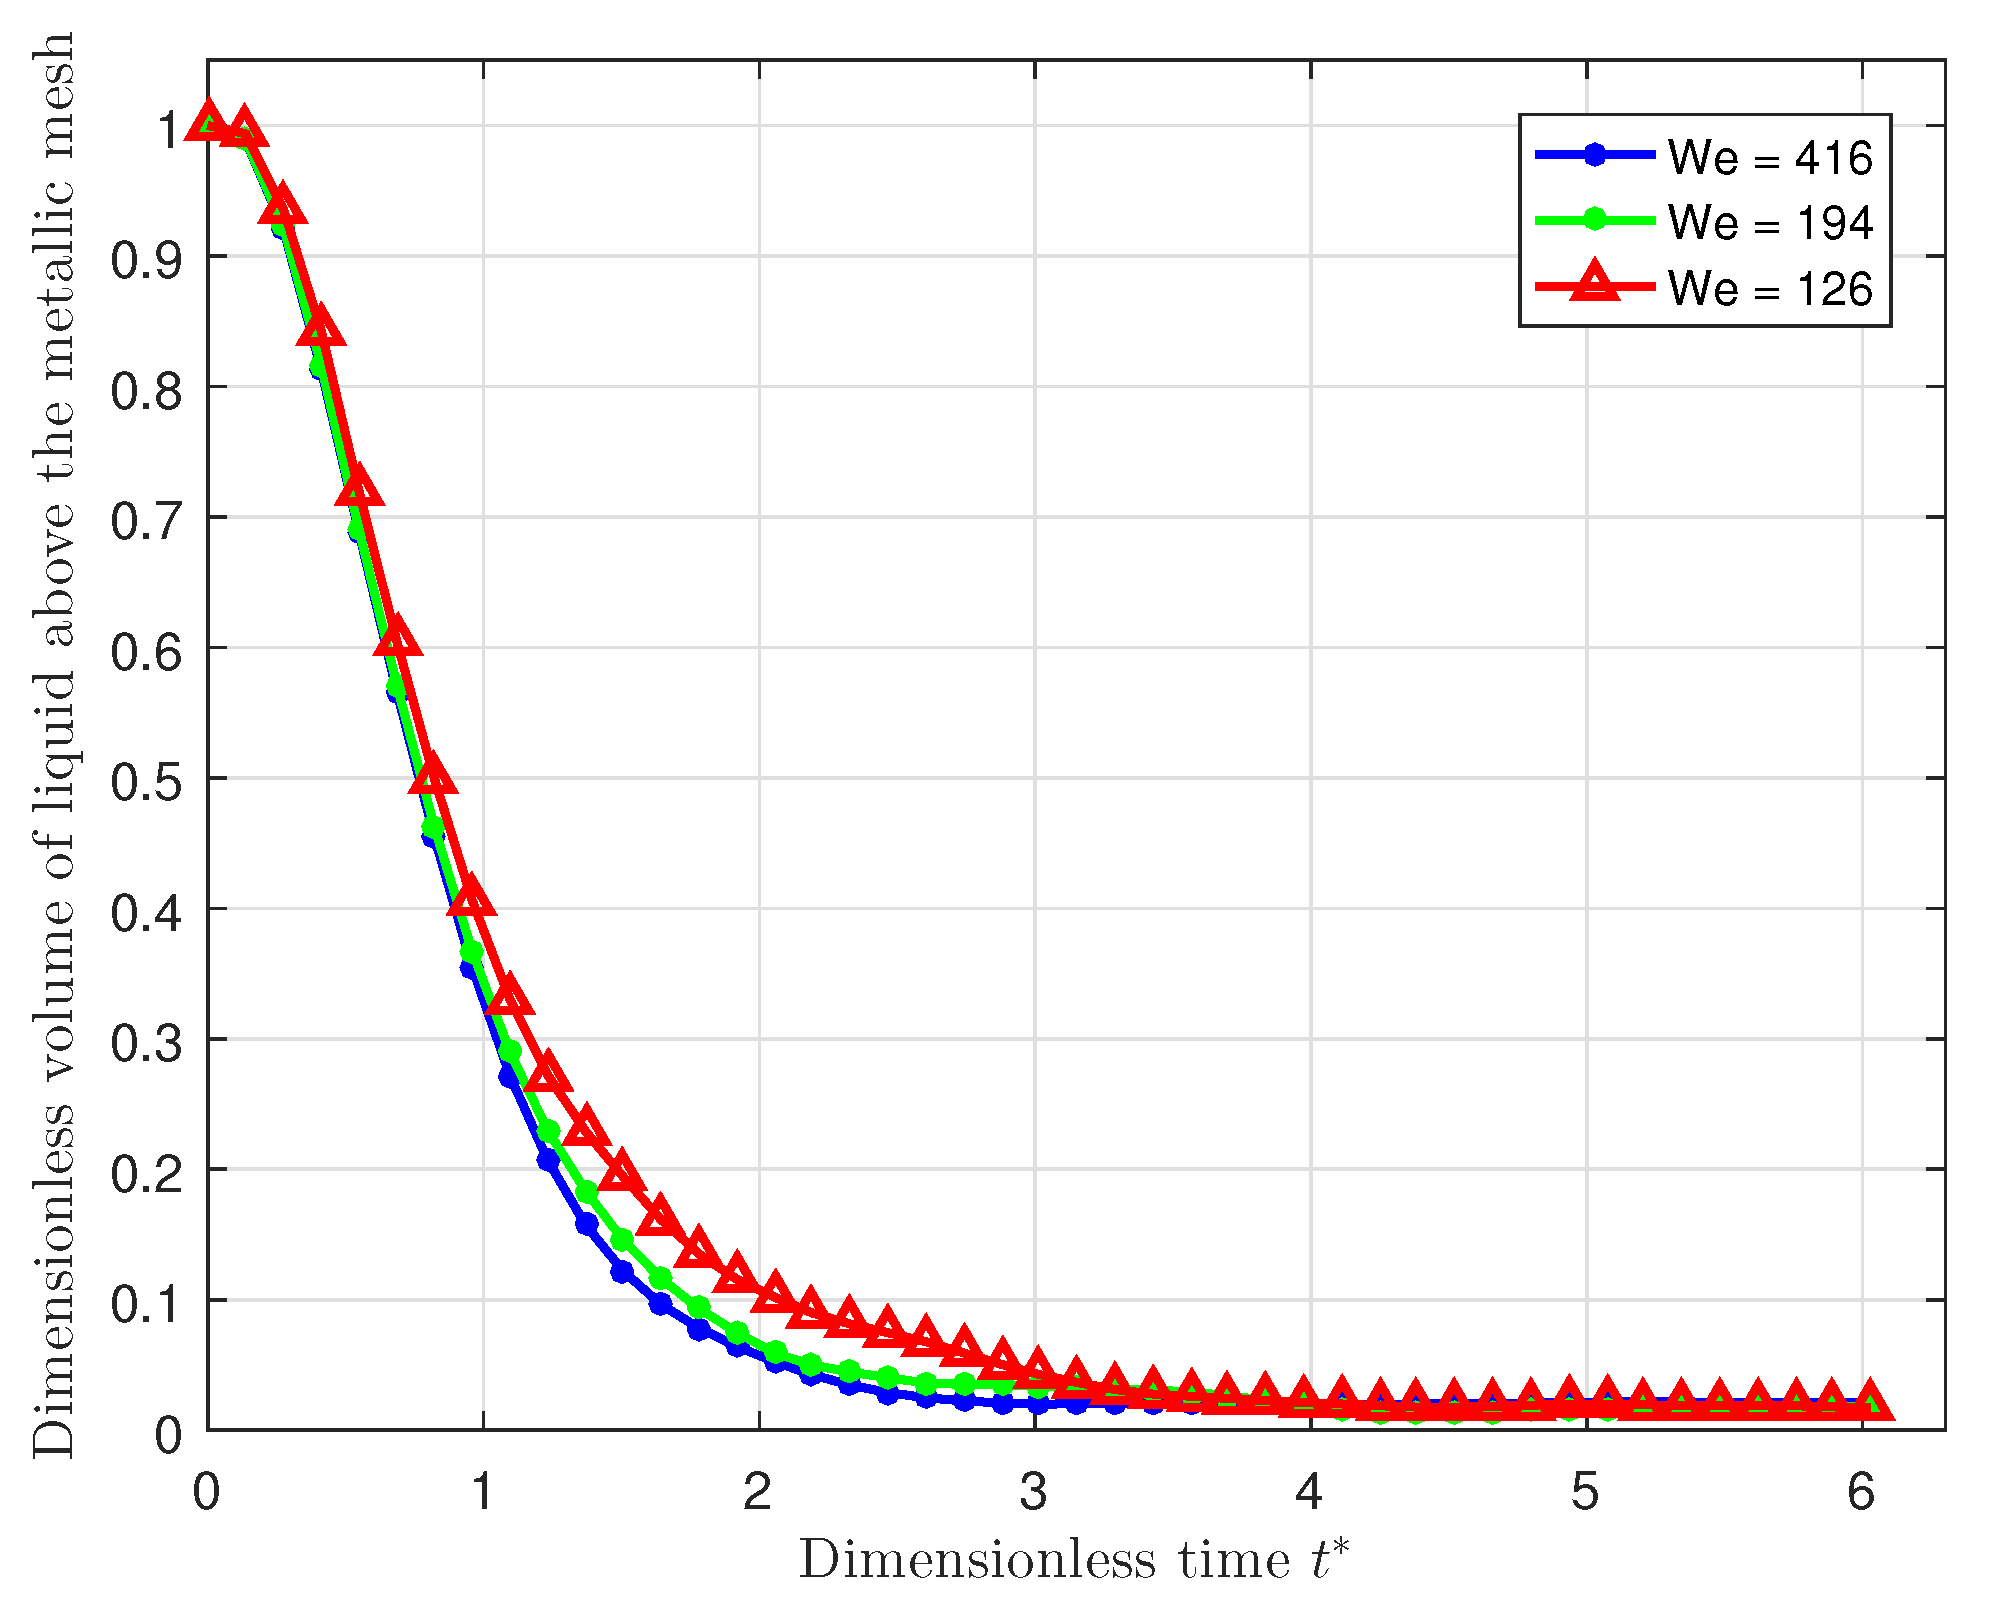
Quantitatively, from the diagram illustrated in Figure 19 it can be seen that increasing the W e number results in an early stage ( t < 3 ), faster crossing of the liquid through the metallic mesh. This agrees with the investigation conducted by Malla et al. [36], where they concluded that lower surface tension, or higher W e values promote faster droplet spreading velocity. However, even though faster crossing is observed for the cases with higher surface tension, the amount of liquid that finally remains above and entrapped within the metallic mesh is similar for all cases. It can be also observed that the fastest penetration of the liquid takes place during the advancing phase and particularly from t = 0.55 up to t = 1.1 , where 4–6% less water compared to case II, has remained above the mesh. At t = 2.05 , more than 96% of the liquid has crossed the mesh. The exact values of the liquid that remained above the mesh are presented in Table 9.
From all the above, it can be concluded that the W e number has a negligible effect on the amount of the liquid that penetrates the metallic mesh, but it has a significant effect in the finger formation and break-up characteristics, below the metallic mesh.

5.3. Influence of Wettability

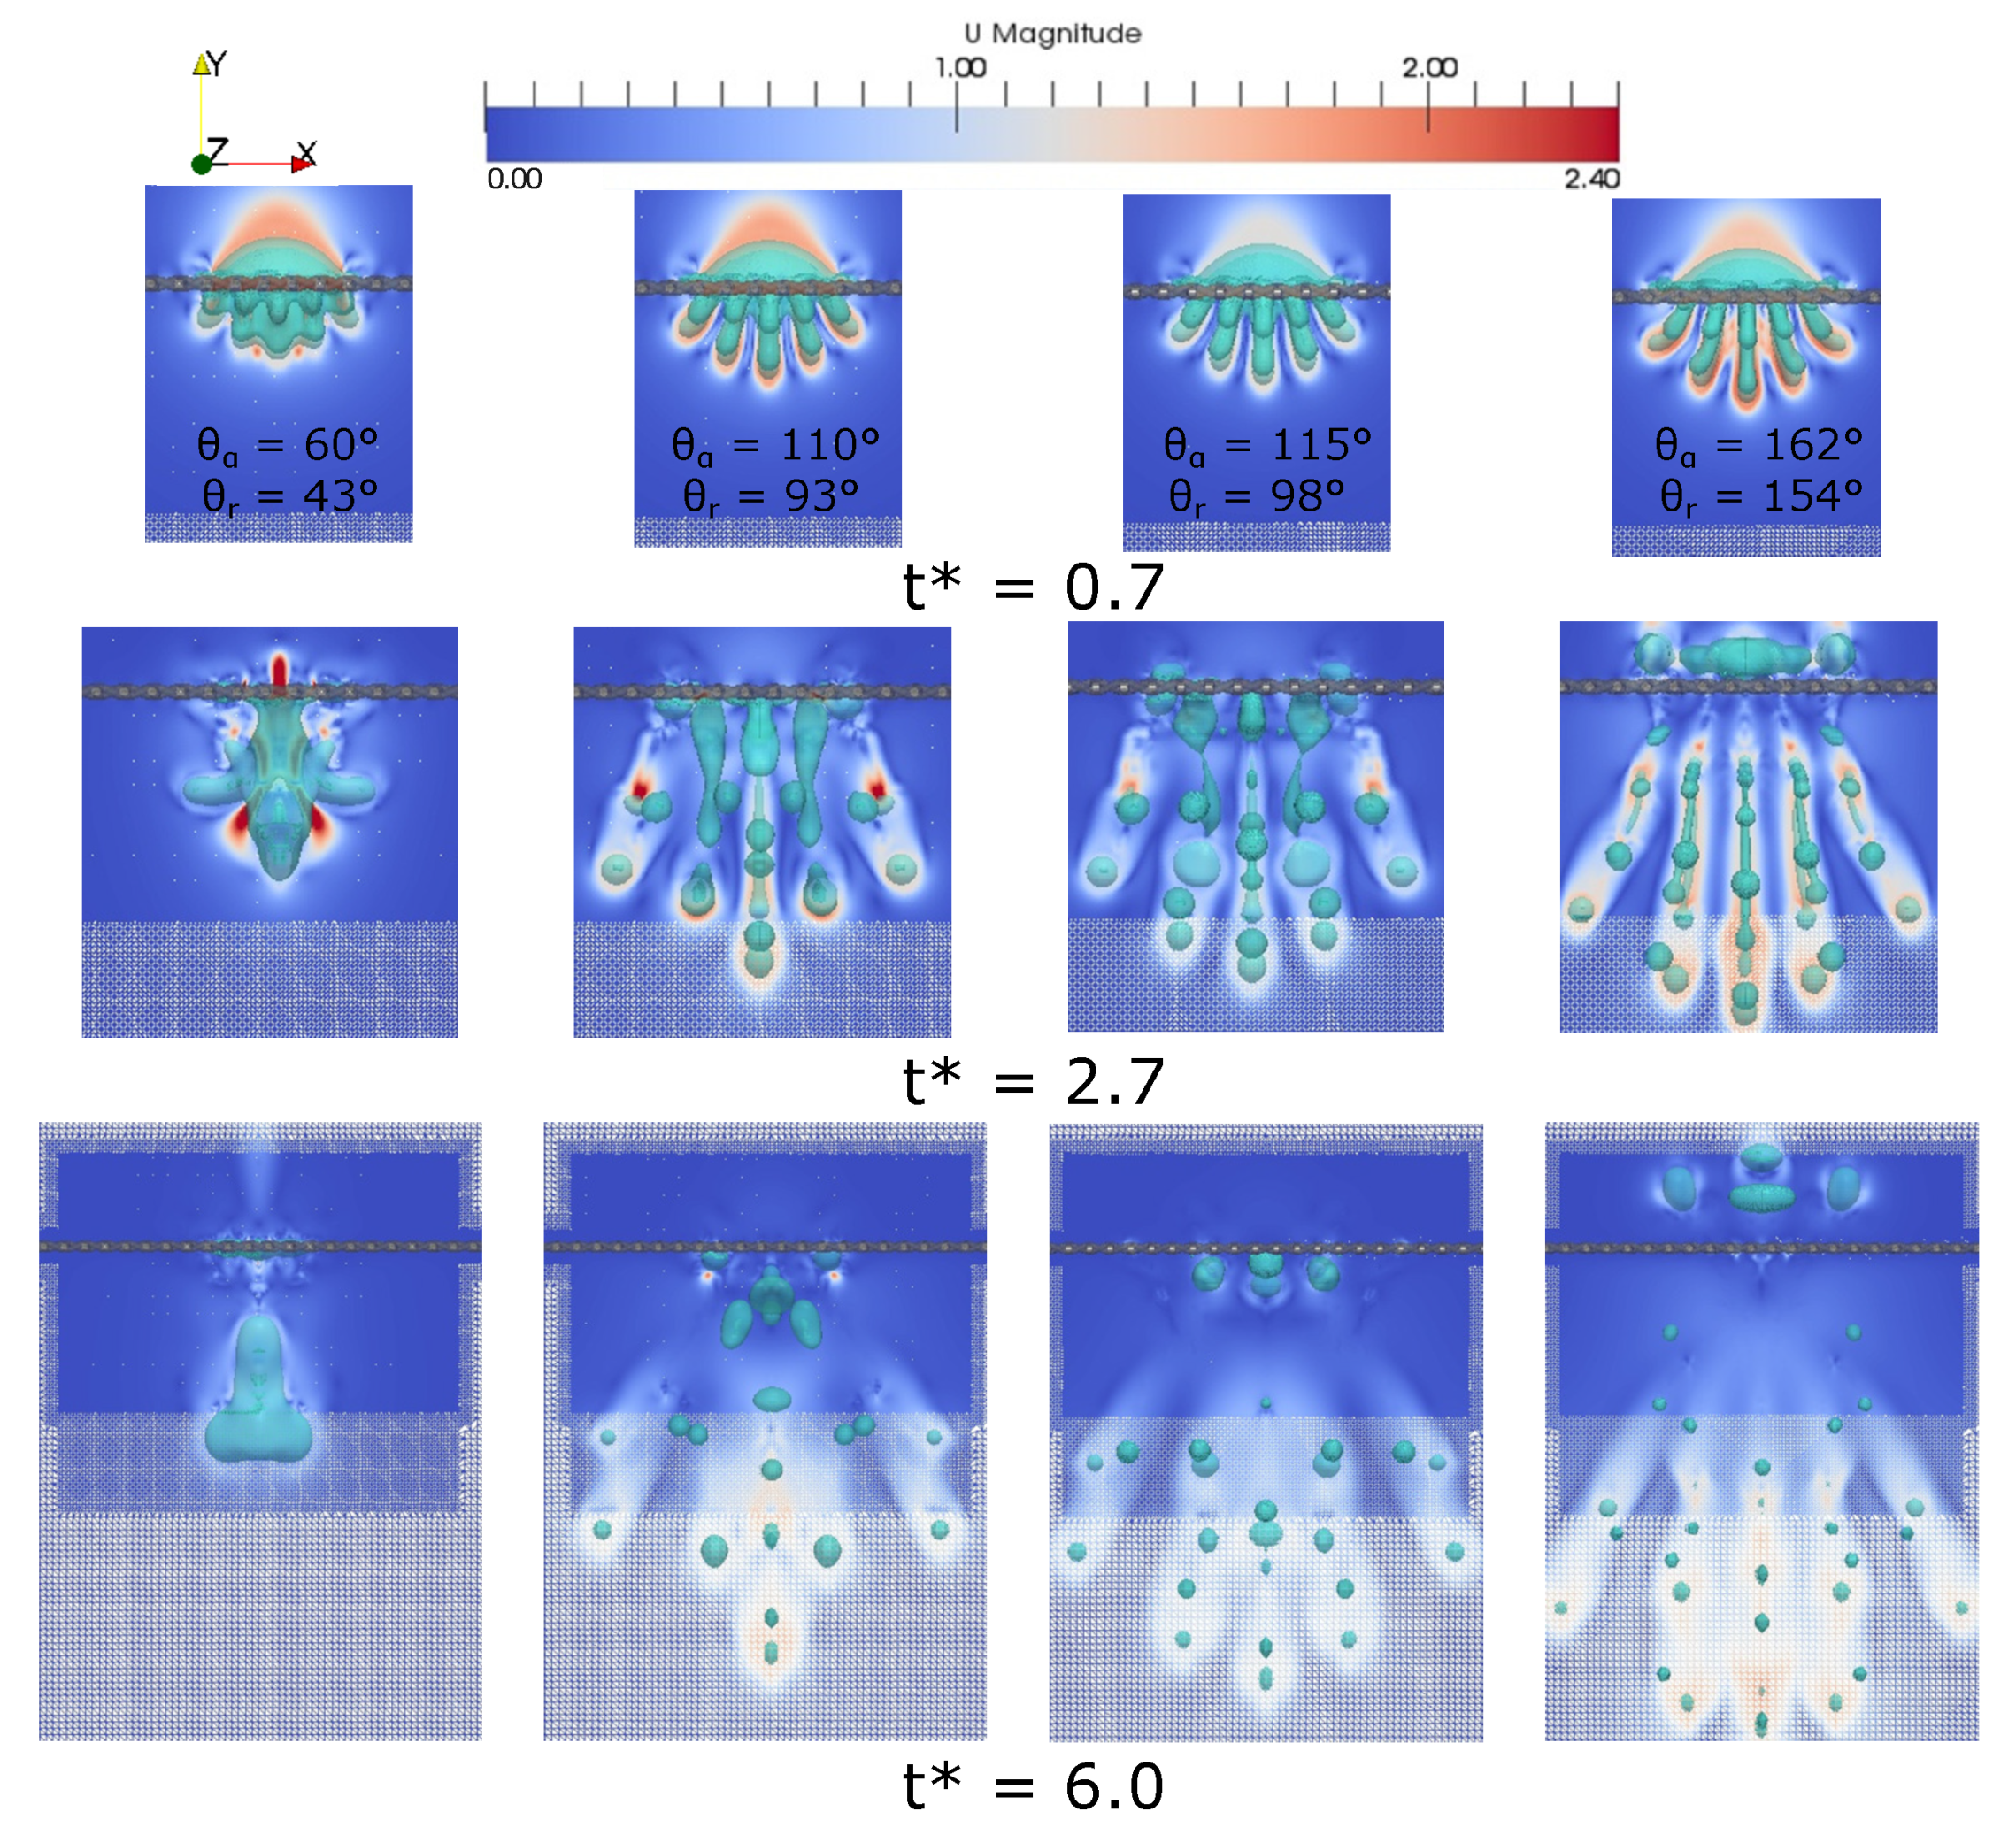
In order to investigate the effect of wettability, three additional numerical simulations are performed, where the only parameters that vary are the advancing θ a and receding θ r contact angles. For a clearer interpretation, these three simulations correspond to hydrophilic, hydrophobic and superhydrophobic surfaces.
The values of θ a and θ r for the hydrophilic surface (case V-a) are 60° and 43°, respectively (50° less than the base case), while for the hydrophobic surface (case V-b) θ a and θ r are 115° and 98° (5° higher than the base case). The reason of performing case V-b, for which the contact angles are really close to the case II, was mainly to observe the sensitivity to small angle changes.
Cases II, V-a and V-b, have the same contact angle hysteresis CAH ( Δ θ = θ a θ r ) Δ θ = 17 ° . Lastly, case V-c which corresponds to a superhydrophobic surface, where θ a and θ r is 162° and 154° respectively, and Δ θ = 8 ° . This agrees with the definition of superhydrophobic surface [8], where θ a and θ r should be above 150°, and Δ θ should be lower than 10°.
From the qualitative comparison of Figure 20, it is clear that during the advancing phase and particularly at t = 0.7 the small difference in the advancing and receding contact angle values between the two hydrophobic cases, has not affected the shape of the droplet. However, there are significant differences between the hydrophilic and the superhydrophobic cases. For the hydrophilic case ( θ a = 60 ° and θ r = 43 ° ), which has the lowest contact angles, the main difference is that the lengths of the fingers, below the mesh, are smaller. On the other hand, for the superhydrophobic case ( θ a = 162 ° and θ r = 154 ° ), the fingers are longer and thinner. At non-dimensional time instant t = 2.7 , the hydrophilic surface is the only case where there is not any disintegration of the droplet. The case with θ a = 115 ° , θ r = 98 ° shows the closest results to the base case, however the increment of the contact angles has resulted in a faster breakup of the fingers as well as larger diameters of daughter droplets. Conversely, the daughter droplets are smaller for the superhydrophobic surface case. Furthermore, the high contact angles of the superhydrophobic surface have resulted in a total rebound of the droplet segments that have remained above the mesh. For the same case, at t = 6.0 , the rebound of the droplets is continued, while below the mesh the droplets are smaller in diameter and some of them have even reached the downstream boundary of the computational domain.
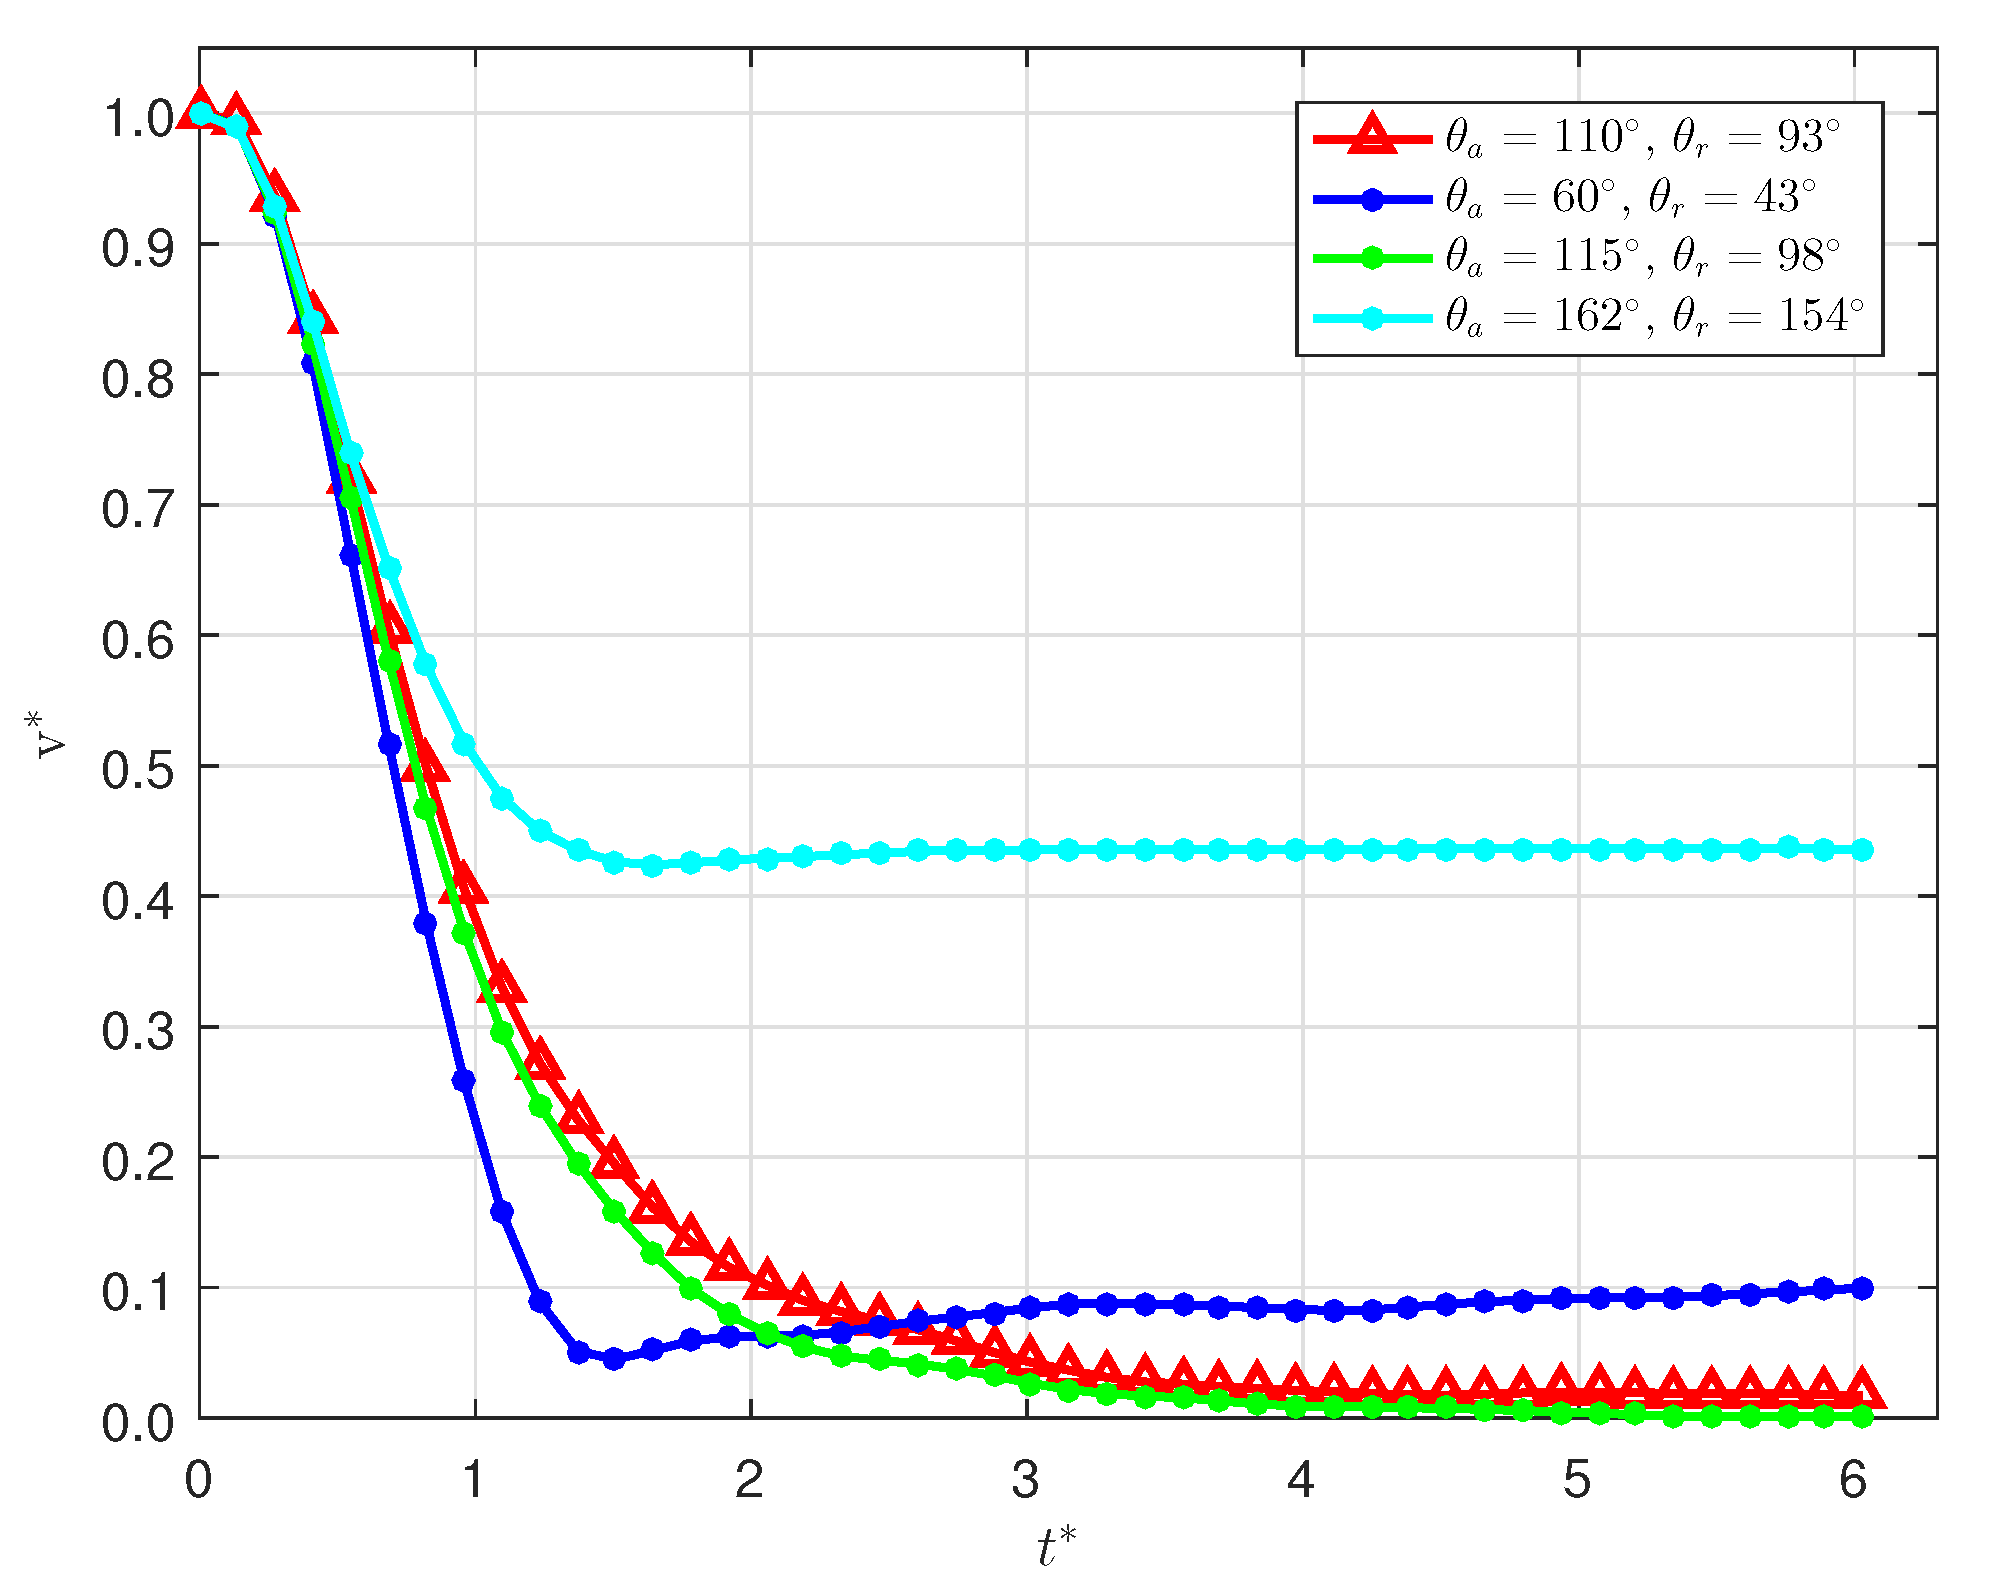
From the qualitative comparison it seems that the superhydrophobic surface during the advancing phase of the droplet, is the case with the fastest crossing of the liquid due to the longer fingers, however, from the quantitative comparison, as shown in Figure 21, it can be seen that the hydrophilic surface has the highest rate of liquid crossing the mesh after the impact, during the advancing phase. Additionally, in the hydrophilic case, the recoiling phase begins at t = 0.15 prior to the base case. The case of the hydrophilic surface is found to be the case with the least amount of liquid above the mesh. Particularly, as it can be seen in Table 9 more than 84% of the total amount of the liquid is already located below the mesh within the first 1.1 m s ( t = 0.75 ), and makes it the case with the fastest crossing rate of liquid through the mesh during the advancing phase. However, from t = 1.5 up to the last available time period, a gradual increase of the dimensionless volume of liquid is observed.
As mentioned previously the two hydrophobic surfaces show the closest results, both from a quantitative and a qualitative point of view. This was expected, since the difference of the advancing and receding contact angles between the two cases is 5°. However, even though the difference of contact angles is small, overall faster crossing of the liquid is observed for the case with higher contact angles ( θ a = 115 ° and θ r = 98 ° , case V-b ). On the other hand, for the superhydrophobic surface case, different behaviour of the droplet as well as faster crossing of the liquid can be seen. In more detail, the end of the advancing phase of the droplet is at t = 1.5 , which is 0.6 later than that of case II. When the receding phase begins, the volume of the liquid above and below the mesh starts being stable until t = 2.0 , where there is no connection between the drops above the mesh and the drops below the mesh. Moreover, since a complete rebound of the droplet is taking place above the mesh, the volume of liquid which is in contact with the metallic mesh, is close to zero. At the last available non-dimensional time period t = 6.0 significant differences between the cases can be seen regarding the volume of water above the mesh. Specifically, the hydrophobic case with the high contact angles (case V-b) has only 0.13% of the liquid above the metallic mesh, which makes it the case with the least liquid entrapped. The hydrophilic case is the second in the row with the least percentage of liquid above the mesh, since only 1% of the liquid has remained above the mesh. On the other hand, 43% of the liquid of the superhydrophobic surface case remains above the mesh, however the superhydrophobic properties of the surface has caused a complete rebound of the droplet, resulting in almost zero amount of liquid being in contact with the metallic mesh.

6. Conclusions

The development of porous materials has attracted the attention of the research communities over the past decades. Porosity characteristics have specific impacts on material properties, and materials are applied in several areas such as painting and ink-jet printing. In this study, a numerical investigation of droplet impact phenomena on suspended metallic meshes was conducted to identify and quantify the effects of fundamental controlling parameters on the penetration characteristics of the droplets as they pass through the metallic mesh structure, and to give further insights into the experimental measurements presented in this study. For this purpose, an enhanced VOF based numerical simulation framework was utilised. Initially, additional validation studies of droplets impacting onto solid substrates were conducted. Then, a specific experiment of droplet impacting on a suspended metallic mesh was performed numerically with satisfactory agreement with the experimental data. It has been illustrated that the proposed numerical simulation allows to quantify, in detail, parameters difficult to be reached experimentally. Subsequently, three different series of parametric numerical investigations were conducted in order to isolate, identify, and quantify the individual effects of the Reynolds ( R e ) and Weber ( W e ) numbers, as well as the metallic mesh surface wettability characteristics. From the overall analysis of the numerical predictions the following conclusions can be drawn—(1) This VOF-based numerical simulation framework can provide accurate predictions for high W e number droplet impacts on flat surfaces. (2) The VOF-based numerical framework can predict relatively well more complex droplet impact phenomena such as droplets that impact on suspended metallic meshes. (3) From the parametric numerical investigation it is evident that the Reynolds number has a quite significant effect on the adhesion characteristics of the impacting drops to the metallic mesh structure, but plays only a minor role on the break-up characteristics of the liquid volume that passes through. (4) In comparison, the value of the W e number has a negligible effect on the amount of liquid that penetrates the metallic mesh structure but it has a quite significant effect on the droplet break-up characteristics, below the metallic mesh structure. (5) Finally, it has been shown that the wettability characteristics of the metallic surface in the mesh structure has a profound effect both on the liquid penetration characteristics as well as on the break-up characteristics, affecting significantly the diameter and the total number of the daughter droplets that are created below the mesh.
For further investigations, the VOF-based numerical framework needs to be further improved by implementing a dynamic/adaptive mesh refinement technique, in order to significantly reduce the currently prohibitive computational cost for mesh-independent 3D numerical solutions. This will enable the proposed numerical simulation framework to be used effectively in order to complement the experimentally-derived droplet impact regime maps, for such complex droplet impact investigations, by providing data points that are difficult or even impossible to be obtained experimentally, due to the limitations in operating conditions and laboratory measuring techniques.

Author Contributions

Conceptualization A.G. and J.H.W.; methodology, A.G. and J.H.W.; software, K.V., A.G. and M.A.; validation, K.V., C.B. and M.A.; writing K.V., C.B.; review and editing M.A., A.G., C.C., J.H.W. and M.M.; supervision J.H.W., A.G., M.A., C.C. and M.M.; funding acquisition A.G., C.C. and M.M. All authors have read and agreed to the published version of the manuscript.

Funding

European Union’s Horizon 2020 research and innovation programme (Marie Skłodowska Curie grant agreement No 801604), European Space Agency projects MAP INWIP and ENCOM 3, and UK’s EPSRC grant EPP0131121.

Acknowledgments

This research was partially funded through the European Union’s Horizon 2020 research and innovation programme (Marie Skłodowska Curie grant agreement No 801604), the UK’s Engineering and Physical Science Research Council (grant EP/P013112/1), and the European Space Agency (MAP projects INWIP and ENCOM 3).

Conflicts of Interest

The authors declare no conflict of interest.

References

  1. Josserand, C.; Thoroddsen, S. Drop Impact on a Solid Surface. Annu. Rev. Fluid Mech. 2016, 48, 365–391. [Google Scholar] [CrossRef] [Green Version]
  2. Rioboo, R.; Tropea, C.; Marengo, M. Outcomes from drop impact on solid surfaces. At. Spray 2001, 11, 155–165. [Google Scholar] [CrossRef]
  3. Rioboo, R.; Marengo, M.; Tropea, C. Time evolution of liquid drop impact onto solid, dry surfaces. Exp. Fluids 2002, 33, 112–124. [Google Scholar] [CrossRef]
  4. Kim, H.Y.; Chun, J.H. The recoiling of liquid droplets upon collision with solid surfaces. Phys. Fluids 2001, 13, 643–659. [Google Scholar] [CrossRef]
  5. Roisman, I.V.; Opfer, L.; Tropea, C.; Raessi, M.; Mostaghimi, J.; Chandra, S. Drop impact onto a dry surface: Role of the dynamic contact angle. Colloids Surf. A Physicochem. Eng. Asp. 2008, 322, 183–191. [Google Scholar] [CrossRef]
  6. Malgarinos, I.; Nikolopoulos, N.; Marengo, M.; Antonini, C.; Gavaises, M. VOF simulations of the contact angle dynamics during the drop spreading: Standard models and a new wetting force model. Adv. Colloid Interface Sci. 2014, 212, 1–20. [Google Scholar] [CrossRef] [Green Version]
  7. Vadillo, D.C.; Soucemarianadin, A.; Delattre, C.; Roux, D.C.D. Dynamic contact angle effects onto the maximum drop impact spreading on solid surfaces. Phys. Fluids 2009, 21, 1–8. [Google Scholar] [CrossRef]
  8. Antonini, C.; Amirfazli, A.; Marengo, M. Drop impact and wettability: From hydrophilic to superhydrophobic surfaces. Phys. Fluids 2013, 24, 102104. [Google Scholar] [CrossRef]
  9. Pasandideh-Fard, M.; Qiao, Y.M.; Chandra, S.; Mostaghimi, J. Capillary effects during droplet impact on a solid surface. Phys. Fluids 1996, 8, 650–659. [Google Scholar] [CrossRef]
  10. Šikalo, Š.; Marengo, M.; Tropea, C.; Ganić, E.N. Analysis of impact of droplets on horizontal surfaces. Exp. Therm. Fluid Sci. 2002, 25, 503–510. [Google Scholar] [CrossRef]
  11. Yarin, A.L. Drop Impact Dynamics: Splashing, Spreading, Receding, Bouncing …. Annu. Rev. Fluid Mech. 2006, 38, 160–192. [Google Scholar] [CrossRef]
  12. Antonini, C.; Innocenti, M.; Horn, T.; Marengo, M.; Amirfazli, A. Understanding the effect of superhydrophobic coatings on energy reduction in anti-icing systems. Cold Regions Sci. Technol. 2011, 67, 58–67. [Google Scholar] [CrossRef]
  13. Patil, N.D.; Gada, V.H.; Sharma, A.; Bhardwaj, R. On dual-grid level-set method for contact line modeling during impact of a droplet on hydrophobic and superhydrophobic surfaces. Int. J. Multiph. Flow 2016, 81, 54–66. [Google Scholar] [CrossRef]
  14. Yokoi, K.; Vadillo, D.; Hinch, J.; Hutchings, I. Numerical studies of the influence of the dynamic contact angle on a droplet impacting on a dry surface. Phys. Fluids 2009, 21, 1–12. [Google Scholar] [CrossRef] [Green Version]
  15. Šikalo, Š.; Wilhelm, H.D.; Roisman, I.V.; Jakirlić, S.; Tropea, C. Dynamic contact angle of spreading droplets: Experiments and simulations. Phys. Fluids 2013, 17, 1–13. [Google Scholar] [CrossRef]
  16. Bussmann, M.; Chandra, S.; Mostaghimi, J. Modeling the spash of a droplet impacting a solid surface. Phys. Fluids 2000, 12, 3121–3132. [Google Scholar] [CrossRef]
  17. Hapgood, K.P.; Litster, J.D.; Biggs, S.R.; Howes, T. Drop penetration into porous powder beds. J. Colloid Interface Sci. 2002, 253, 353–366. [Google Scholar] [CrossRef]
  18. Clarke, A.; Blake, T.D.; Carruthers, K.; Woodward, A. Spreading and Imbibition of Liquid Droplets on Porous Surfaces. Langmuir 2002, 18, 2980–2984. [Google Scholar] [CrossRef]
  19. Alam, P.; Toivakka, M.; Backfolk, K.; Sirviö, P. Impact spreading and absorption of Newtonian droplets on topographically irregular porous materials. Chem. Eng. Sci. 2007, 62, 3142–3158. [Google Scholar] [CrossRef]
  20. Ryu, S.; Sen, P.; Nam, Y.; Lee, C. Water Penetration through a Superhydrophobic Mesh during a Drop Impact. Phys. Rev. Lett. 2017, 118, 1–5. [Google Scholar] [CrossRef]
  21. Reis, N.C.; Griffiths, R.F.; Santos, J.M. Parametric study of liquid droplets impinging on porous surfaces. Appl. Math. Model. 2008, 32, 341–361. [Google Scholar] [CrossRef]
  22. Fu, F.; Li, P.; Wang, K.; Wu, R. Numerical Simulation of Sessile Droplet Spreading and Penetration on Porous Substrates. Langmuir 2019, 35, 2917–2924. [Google Scholar] [CrossRef] [PubMed]
  23. Liwei, W.; Xiao, W.; Weijie, Y.; Pengfei, H.; Feng, H.; Xiwen, Z. Numerical study of droplet fragmentation during impact on mesh screens. Microfluid. Nanofluid. 2019, 23, 1–14. [Google Scholar] [CrossRef]
  24. Georgoulas, A.; Koukouvinis, P.; Gavaises, M.; Marengo, M. Numerical investigation of quasi-static bubble growth and detachment from submerged orifices in isothermal liquid pools: The effect of varying fluid properties and gravity levels. Int. J. Multiph. Flow 2015, 74, 59–78. [Google Scholar] [CrossRef] [Green Version]
  25. Vontas, K.; Andredaki, M.; Georgoulas, A.; Nikas, K.S.; Marengo, M. Numerical Investigation of Droplet Impact on Smooth Surfaces with Different Wettability Characteristics: Implementation of a dynamic contact angle treatment in OpenFOAM. In Proceedings of the ILASS–Europe 2017, 28th Conference on Liquid Atomization and Spray Systems, Valencia, Spain, 6–8 September 2017. [Google Scholar] [CrossRef] [Green Version]
  26. Brackbill, J.U.; Kothe, D.B.; Zemach, C. A continuum method for modeling surface tension. J. Comput. Phys. 1992, 100, 335–354. [Google Scholar] [CrossRef]
  27. Hoang, D.A.; van Steijn, V.; Portela, L.M.; Kreutzer, M.T.; Kleijn, C.R. Benchmark numerical simulations of segmented two-phase flows in microchannels using the Volume of Fluid method. Comput. Fluids 2013, 86, 28–36. [Google Scholar] [CrossRef]
  28. Kistler, S.F. Hydrodynamics of Wetting. Wettability 1993, 311–429. Available online: https://scholar.google.com/scholar?cluster=18337677993544788386&hl=en&as_sdt=0,5 (accessed on 3 March 2020).
  29. Antonini, C.; Carmona, F.J.; Pierce, E.; Marengo, M.; Amirfazli, A. General methodology for evaluating the adhesion force of drops and bubbles on solid surfaces. Langmuir 2009, 25, 6143–6154. [Google Scholar] [CrossRef]
  30. Blake, T.D.; Bracke, M.; Shikhmurzaev, Y.D. Experimental evidence of non local hydrodynamic influence on the dynamic contact angle. Phys. Fluids 1999, 11, 1995–2007. [Google Scholar] [CrossRef]
  31. Boscariol, C.; Chandra, S.; Sarker, D.; Crua, C.; Marengo, M. Drop impact onto attached metallic meshes: Liquid penetration and spreading. Exp. Fluids 2018, 59, 1–13. [Google Scholar] [CrossRef]
  32. Xu, J.; Xie, J.; He, X.; Cheng, Y.; Liu, Q. Water drop impacts on a single-layer of mesh screen membrane: Effect of water hammer pressure and advancing contact angles. Exp. Therm. Fluid Sci. 2017, 82, 83–93. [Google Scholar] [CrossRef]
  33. Blanchette, F.; Bigioni, T.P. Partial coalescence of drops at liquid interfaces. Nat. Phys. 2006, 2, 254–257. [Google Scholar] [CrossRef]
  34. Berthier, J. EWOD Microsystems. In Micro-Drops and Digital Microfluidics, 2nd ed.; William Andrew Publishing: Norwich, NY, USA, 2013; pp. 225–301. [Google Scholar] [CrossRef]
  35. Ding, M.; Kantzas, A. Capillary number correlations for gas-liquid systems. J. Can. Pet. Technol. 2007, 46, 27–32. [Google Scholar] [CrossRef]
  36. Malla, L.K.; Patil, N.D.; Bhardwaj, R.; Neild, A. Droplet Bouncing and Breakup during Impact on a Microgrooved Surface. Langmuir 2017, 33, 9620–9631. [Google Scholar] [CrossRef] [PubMed] [Green Version]
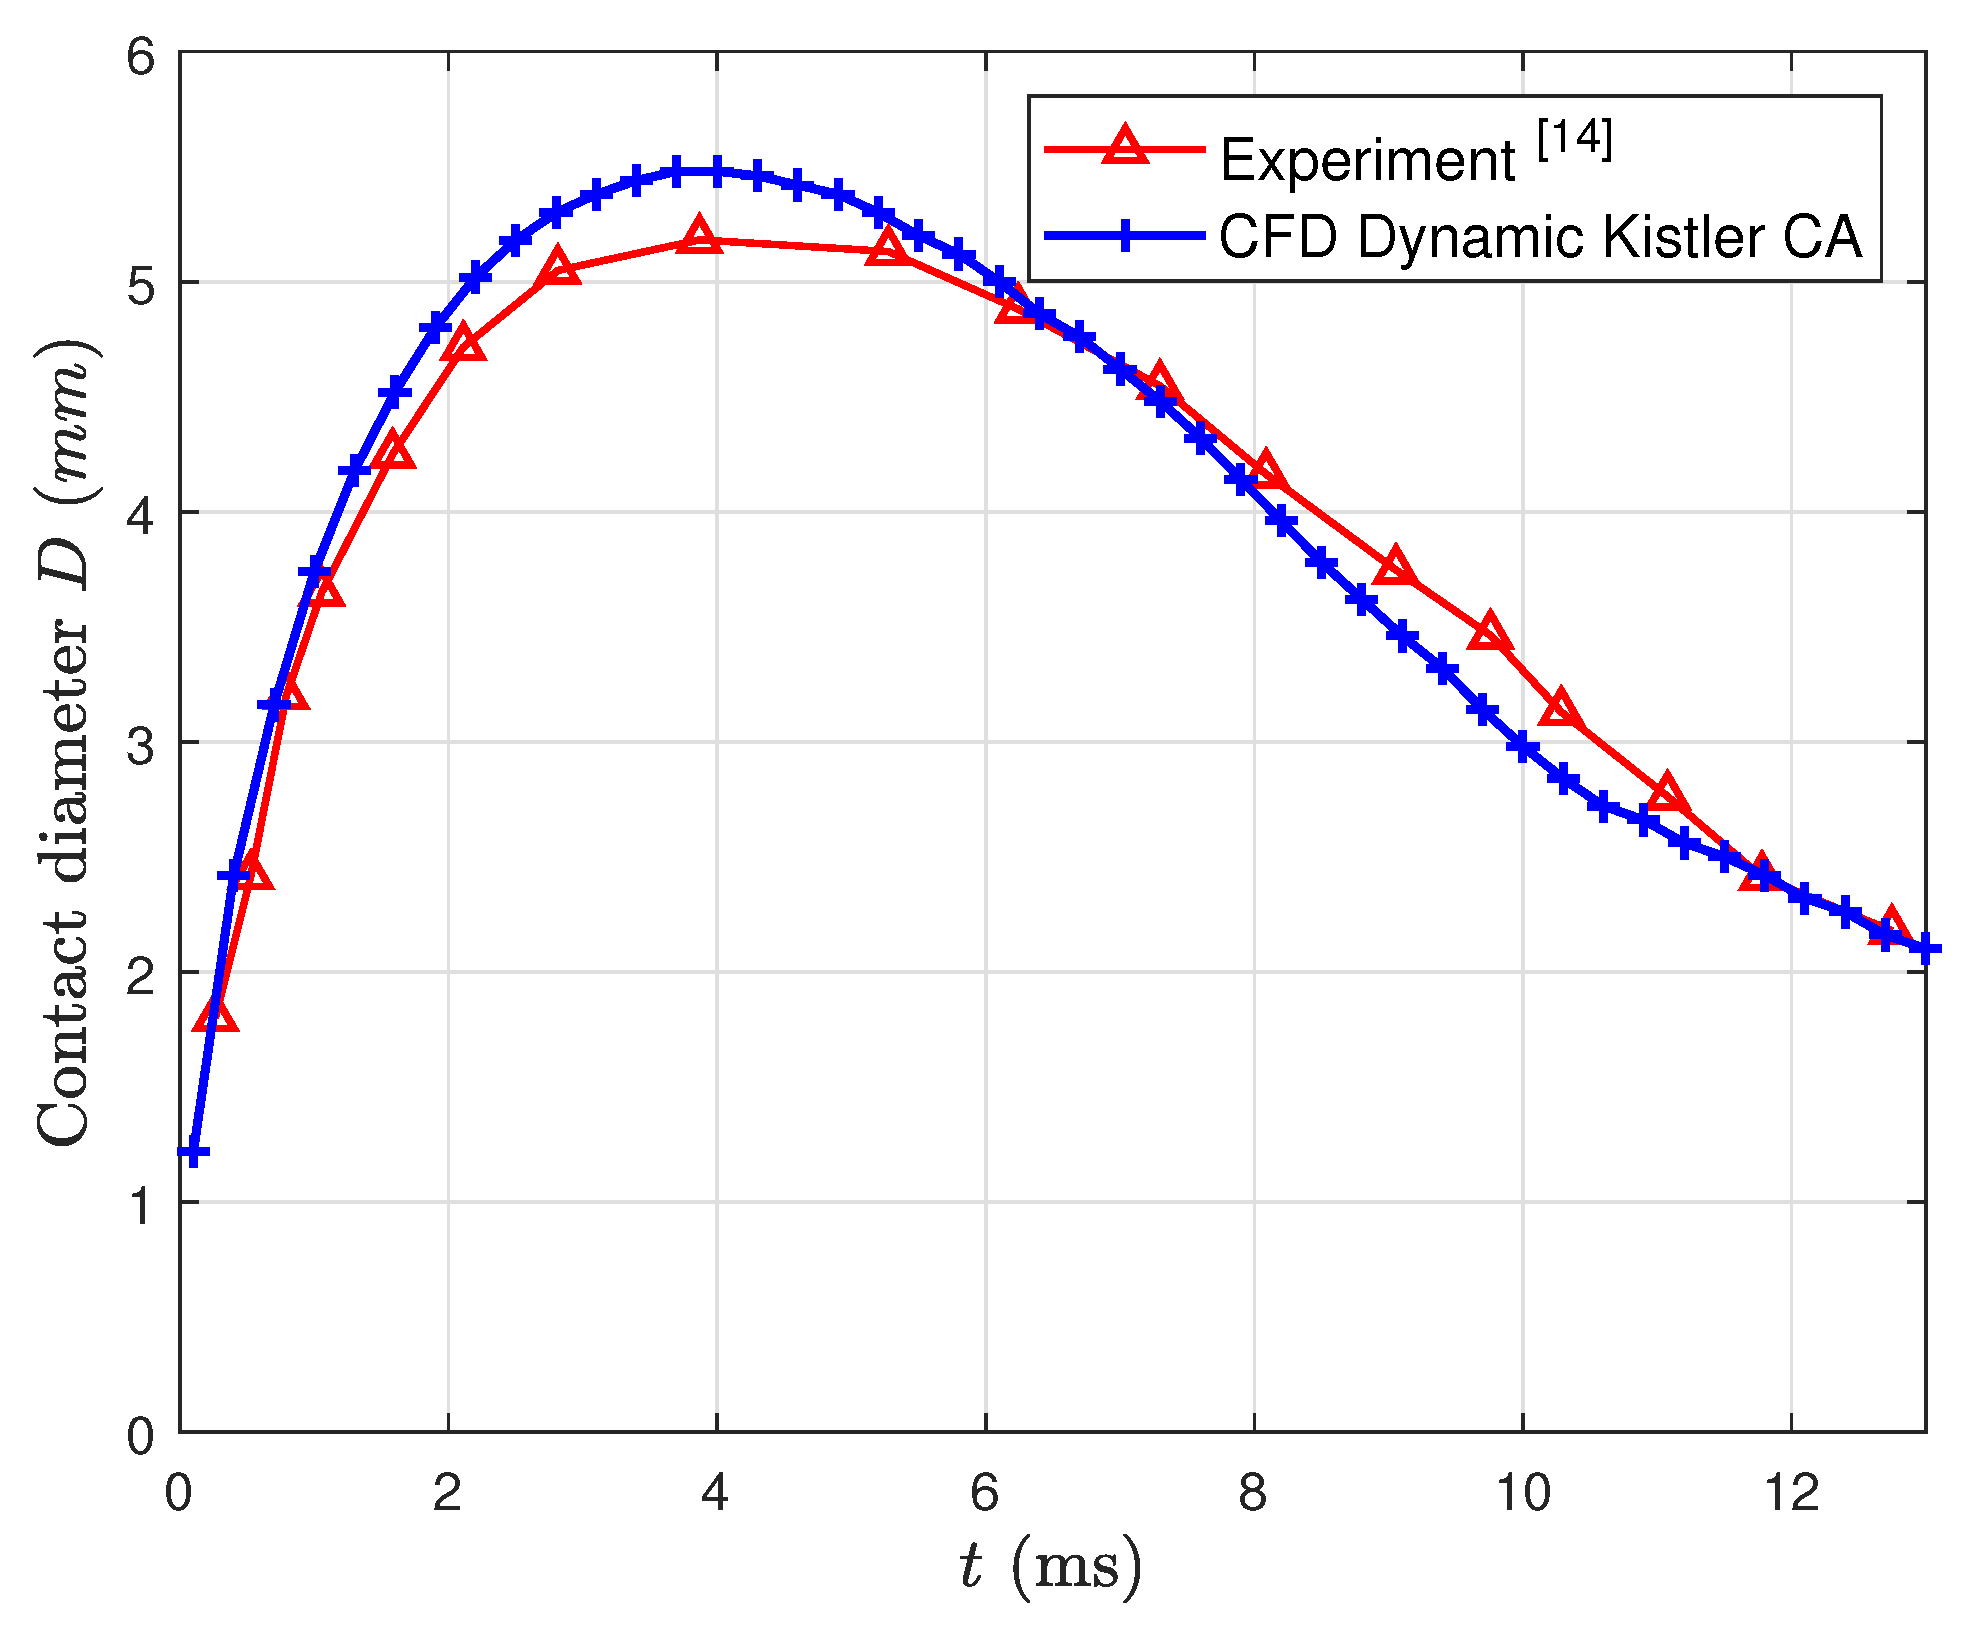
Figure 1. Comparison of the numerical results obtained using the Kistler dynamic contact angle (DCA) model with experimental data from the work of Yokoi et al. [14].
Fluids 05 00081 g001
Figure 2. 2D computational domain, boundary conditions and mesh details.
Fluids 05 00081 g002
Figure 3. Qualitative comparison of the results of the 2D ( 5 μ m ) and 3D numerical simulation results with experimental snapshots [15].
Fluids 05 00081 g003
Figure 4. Comparison of the evolution of the contact diameter (D) of experimental data [15] with the 2D axisymmetric and 3D numerical simulation results over time.
Fluids 05 00081 g004
Figure 5. Sketch of the experimental setup, consisting of an LED light source and high-speed camera. A top view of the mesh is shown on the bottom of the figure. The velocity of the droplet impact is adjusted by changing the height of the needle from which the droplets are released.
Fluids 05 00081 g005
Figure 6. (a) Deposition outcome; water & glycerol, R e = 5030 (b) Partial imbibition outcome; water, R e = 5030 (c) Partial imbibition outcome; water, R e = 10,778 (d) Partial imbibition outcome; water, R e = 5209 (e) Penetration outcome; water, R e = 10,419.
Fluids 05 00081 g006
Figure 7. Liquid penetration on the suspended meshes of water droplets. For case (a) D p = 25   μ m and D w = 25   μ m , for case (b) D p = 400   μ m , D w = 220   μ m .
Fluids 05 00081 g007
Figure 8. Percentage of liquid penetration as a function of pore size consisting different values of impact velocity, for three different liquids.
Fluids 05 00081 g008
Figure 9. Percentage of liquid penetration as a function of pore size given different range of impact velocity.
Fluids 05 00081 g009
Figure 10. Percentage of liquid penetration of water droplet with different initial diameter and impact velocity.
Fluids 05 00081 g010
Figure 11. Metallic mesh for the considered case ( D p = 400   μ m and D w = 220   μ m . (a) microscopic view of the metallic mesh, (b) zoomed view of the metallic mesh generated in Onshape CAD, (c) 1 / 4 t h of the total solid domain of the metallic mesh used for the simulations as generated in CAD.
Fluids 05 00081 g011
Figure 12. Computational geometry with pore and wire diameter 400 and 220 μ m respectively, mesh and boundary conditions for the 3D domain (one-fourth of the total 3D domain) of all simulation cases I–IV. (a) Case I domain. (b) Case II domain. The details of the mesh of case I are shown in (d,e). The boundary conditions of the numerical cases can be seen in figure (b,c). Finally, in figure (f) release droplet position for cases I and II and (g) release droplet position of cases III and IV can be seen.
Fluids 05 00081 g012
Figure 13. Side view comparison of experimental snapshots of droplet impacting on metallic mesh ( D 0 = 2.70 m s , U 0 = 1.85 m s ) and numerical simulations I–IV, at different time stages.
Fluids 05 00081 g013
Figure 14. Dimensionless volume ( v ) of liquid positioned below the metallic mesh as a function of dimensionless time ( t ) for the numerical cases I–IV and corresponding experiment. An error bar of 10% of the dimensionless volume value in the experimental results have been added due to the limited estimation of the experimental results volume values.
Fluids 05 00081 g014
Figure 15. Case II: Droplet details after impact at t = 0.2   m s , t = 1.6   m s , and t = 3.0   m s . (a) 3D representation of the droplet; (b) volume fraction; (c) pressure; (d) velocity magnitude.
Fluids 05 00081 g015
Figure 16. Comparison of droplet impact output for different Reynolds numbers, for instance t = 0.7 , 2.7 , 6.0 , magnitude U is shown in m s 1 .
Fluids 05 00081 g016
Figure 17. Dimensionless liquid volume above the metallic mesh versus the dimensionless time t for different Reynolds numbers.
Fluids 05 00081 g017
Figure 18. Qualitative comparison of droplet impact output for different W e number values, at times t = 0.7 , t = 2.7 , t = 6.0 , magnitude U is shown in m s 1 .
Fluids 05 00081 g018
Figure 19. Weber number effects: The numerical case II is compared with virtual cases IV-a and IV-b which has surface tension of approximately one-third and two-thirds surface tension value of case II. The graph depicts the dimensionless volume of liquid ( v ) above the mesh over the dimensionless time ( t ).
Fluids 05 00081 g019
Figure 20. Comparison of droplet impact of different wettability values for time periods t = 0.7 , t = 2.7 , t = 6.0 . The velocity magnitude (U) is also shown in m s 1 . The investigated contact angles are: θ a = 60 ° , θ r = 43 ° (case V-a-hydrophilic surface), θ a = 110 ° , θ r = 93 ° (case II-hydrophobic surface), θ a = 115 ° , θ r = 98 ° (case V-b-hydrophobic surface) and θ a = 162 ° and θ r = 154 ° (case V-c-superhydrophobic surface).
Fluids 05 00081 g020
Figure 21. Investigation of wettability effects on the droplet’s behaviour, by altering the advancing θ a and receding θ r contact angles. The graph is showing the dimensionless volume of liquid ( v ) above the mesh over the dimensionless time t .
Fluids 05 00081 g021
Table 1. Liquid properties, R e and W e numbers ranges used in the experiments.
Liquid ρ
(kg m 3 )
μ
× 10 3
(Pa s)
σ
(N m 1 )
Re
Range
(-)
We
Range
(-)
Water996.01.00.0733501.1–9924.483.9–499.8
Acetone793.00.30.0237835.9–19,518.3179.3–890.1
Water and Glycerol1118.610.00.067448.2–1042.5120.0–560.3
Table 2. Mean droplet diameter.
LiquidNeedle 21
(mm)
Needle 26 s
(mm)
Water3.01.9
Acetone2.01.7
Water and Glycerol2.91.5
Table 3. Percentage of liquid penetration of water for different ring size.
Pore Size
( μ m)
Impact
Velocity U 0
(m s 1 )
% Liquid
Penetration
Size: 1.5 cm
% Liquid
Penetration
Size: 2.0 cm
% Liquid
Penetration
Size: 2.5 cm
251.867.010.07.0
252.7013.011.014.0
253.6046.042.043.0
2001.8679.076.077.0
2002.7090.088.095.0
2003.60100.098.099.0
4001.8696.094.096.0
4002.70100.0100.0100.0
4003.60100.0100.0100.0
Table 4. Percentage of liquid penetration of acetone for different ring size.
Pore Size
( μ m)
Impact
Velocity U 0
(m s 1 )
% Liquid
Penetration
Size: 1.5 cm
% Liquid
Penetration
Size: 2.0 cm
% Liquid
Penetration
Size: 2.5 cm
251.850.00.00.0
252.7021.118.619.4
253.651.256.954.3
2001.85100.0100.0100.0
2002.70100.0100.0100.0
2003.6100.0100.0100.0
4001.85100.0100.0100.0
4002.70100.0100.0100.0
4003.6100.0100.0100.0
Table 5. Percentage of liquid penetration of water and glycerol for different ring size.
Pore Size
( μ m)
Impact
Velocity U 0
(m s 1 )
% Liquid
Penetration
Size: 1.5 cm
% Liquid
Penetration
Size: 2.0 cm
% Liquid
Penetration
Size: 2.5 cm
251.850.00.00.0
252.700.04.70.0
253.600.010.00.0
2001.8558.457.660.0
2002.7091.294.487.3
2003.6095.497.197.0
4001.8586.489.983. 3
4002.70100.0100.0100.0
4003.60100.0100.0100.0
Table 6. Initial droplet parameters and characteristics for the considered experiment, at t = 00   m s . Initial droplet diameter D 0 , impact velocity U 0 , W e , R e numbers and advancing θ a and receding θ r contact angles of the droplet.
D 0
(mm)
U 0
(m s 1 )
We
(-)
Re
(-)
θ a
( )
θ r
( )
2.701.85126495311093
Table 7. Computational parameters of the four numerical simulation cases considered. The mesh generation used the snappyHexMesh (sHM) and topoSet utilities of OpenFOAM.
Numerical
Case
Droplet
Centering
at t = 0 ms
Computational
Domain
(mm)
Total no.
of Cells
(Millions)
Levels of
Refinement
Iabove two wires(8.00 8.00 25.00)31.94
IIabove two wires(7.54 7.54 20.00)4.03
IIIabove one wire(8.00 8.00 25.00)31.94
IVabove one wire(7.54 7.54 20.00)4.03
Table 8. Numerical cases performed for investigating the effects of dynamic viscosity ( μ ), surface tension ( σ ), and wettability ( θ a and θ r ). The parameter that is changed in each case is indicated in bold. Case II corresponds to the base case.
Case μ
× 10 3
(Pa s)
σ
(N m 1 )
θ a
( )
θ r
( )
We
(-)
Re
(-)
II10.073110931264985
III-a2.50.073110931261994
III-b5.00.07311093126997
III-c7.50.07311093126665
III-d10.00.07311093126499
IV-a1.00.022110934164985
IV-b1.00.048110931944985
V-a1.00.07360431264985
V-b1.00.073115981264985
V-c1.00.0731621541264985
Table 9. Percentage of liquid that remained above and entrapped within the metallic mesh at different time periods.
Case t =
0.80 ms
t =
1.6 ms
t =
2.40 ms
t =
4.40 ms
t =
6.60 ms
t =
8.80 ms
II72.033.016.14.31.81.7
III-a72.338.526.921.322.221.4
III-b74.846.138.139.638.837.5
III-c76.350.744.946.545.445.6
III-d77.554.049.857.958.958.9
IV-a68.827.29.62.02.82.2
IV-b69.129.011.63.41.41.9
V-a66.215.75.28.58.71.0
V-b70.429.612.62.70.70.1
V-c73.947.642.043.543.643.6