1. Introduction
The petroleum industry is continually searching for faster tools to model and optimize field development methods. We developed a streamline simulator based on complex analysis methods (CAM) that is grid-less and therefore, can give instantaneous streamline solutions for flow tubes resulting from certain constant and/or variable well rates. Time-dependent flows can be modeled by time-stepping tracer particles through instantaneous velocity field solutions at different times. The method uses an Eulerian solution schedule for spatial velocity computations and time-tracking of fluid particle displacement. The Eulerian particle tracking method was first combined with CAM models by Weijermars [
1]. The code was subsequently expanded to model the time of flight and sweep patterns in hydrocarbon reservoirs with vertical injection and producer wells, first in unbounded reservoirs [
2], and then was adapted for fault-bounded reservoirs [
3].
The CAM code became particularly powerful by the derivation of a new algorithm capable of modeling the flow near high-conductivity channels such as natural fractures embedded in a lower permeability matrix [
4]. The superimposition of interval sources and sinks can account for the interference of fluid flow patterns between hydraulic fractures [
5]. The method also is well-suited to compute the drained rock volume (DRV) in hydraulically fractured wells, with and without natural fractures [
6,
7,
8]. The hydraulic fractures may be perfectly subparallel and normal to the wellbore [
9,
10], or bifurcate, which has been modeled with a fractal formulation based on the Lindenmayer system [
11].
Recent studies based on CAM flow simulations have confirmed earlier contentions [
12] that object-based upscaling of flow through fractured porous media is inaccurate, and that flow-based upscaling of the equivalent permeability is to be preferred [
13]. For the upscaling of real field reservoirs with a large number of natural fractures, a newly proposed upscaling procedure first reduces the number of fractures by object-based upscaling, and next determines the equivalent permeability tensor based on flow-based upscaling [
14].
Because of the strides made with the grid-less CAM code based on algorithms that are relatively new and developed by only our one research group, verification of the CAM results will help overcome the skepticism of practitioners and critics who are still unfamiliar with this modeling tool. Many reviewers of our prior work have expressed early disbelief that such advanced results could be obtained by superimposing flows that are completely governed by closed-form, analytical solutions. Of course, the superimposition of the linear equations due to the closed-form approach results in very intricate expressions that can only be solved with computerized numerical iteration schedules. However, the grid-less (and mesh-less) nature of the solution method is preserved throughout the coding schedule and leads to accurate solutions with infinite resolution (for any reservoir model with a certain initial state and chosen set of boundary conditions).
This paper briefly reviews some earlier key CAM results with particular emphasis on their verification with independent, currently accepted methods for modeling flow in hydrocarbon reservoirs. First, a brief review of the key algorithms used in this paper is given (
Section 2), followed by a verification of convective time of flight models (
Section 3), and diffusive time of flight models (
Section 4). Brief examples are given of the visualization of the drained rock volume in hydraulically fractured wells, with and without natural fractures (
Section 5). The strengths, limitations, and future potential of the CAM approach are discussed in some detail (
Section 6), followed by conclusions (
Section 7). The mathematical details (
Section 2) of the method are only briefly stated in this concise review paper, to enable a discourse that focuses on the visual matches of the results, limiting assumptions, and future potential of the CAM approach. For an in-depth discussion of the key algorithms used, the reader is encouraged to consult our previous studies [
1,
2,
4,
15].
2. Brief Overview of CAM Methodology and Algorithms
The algorithms and background on CAM-based flow models have been extensively documented in our prior studies [
4,
9]; only a brief section, with major equations, suffices here. The instantaneous fluid particle paths of any 2D flow can be determined by integrating the system of ordinary differential equations [
16,
17]:
The challenge is to find the analytical function that adequately describes the vector field. A helpful step is to identify a valid complex potential, for which there exists a related analytical function, , the conjugate of which solves the velocity field, , in every location, . The flow paths can be solved from the parameterized solution of z(t).
Numerous complex analytical functions which describe different physical flows have been discussed in our prior studies [
18]. The real part of the time-dependent complex potential, Ω(
z,
t), yields the potential function, and the imaginary part represents the stream function. The velocity field vector
V(
z,
t) for a flow element can be obtained by differentiating the complex potential Ω(
z,
t) with respect to the relative position of fluid particles in the space (
z). For this paper, the functions describing the flows in vertical production wells (point sinks) and injectors (point sources); and through natural fractures (areal doublets), are relevant. The complex potential for a source/sink flow of strength,
m(
t) [m
2·s
−1], centered about an arbitrary location,
zd, is:
The source and sink flows are characterized by a positive and a negative value of the strength
m(
t), respectively. Strength
m(
t), for a well with productivity of
q(
t) (m
3·s
−1) with a reservoir height of
h (m), and reservoir porosity
n, is:
where
m,
h,
Rs,
B and
n are the time dependent strength, the thickness of the reservoir, the residual oil saturation, the formation volume factor and the porosity respectively.
Similarly, the complex potential for a natural fracture element represented by an areal doublet is [
4]:
where
υ(
t)(m
4·s) is the strength of the natural fracture,
L,
W and
h (m) are the length, width and height of the natural fracture, respectively,
n is porosity,
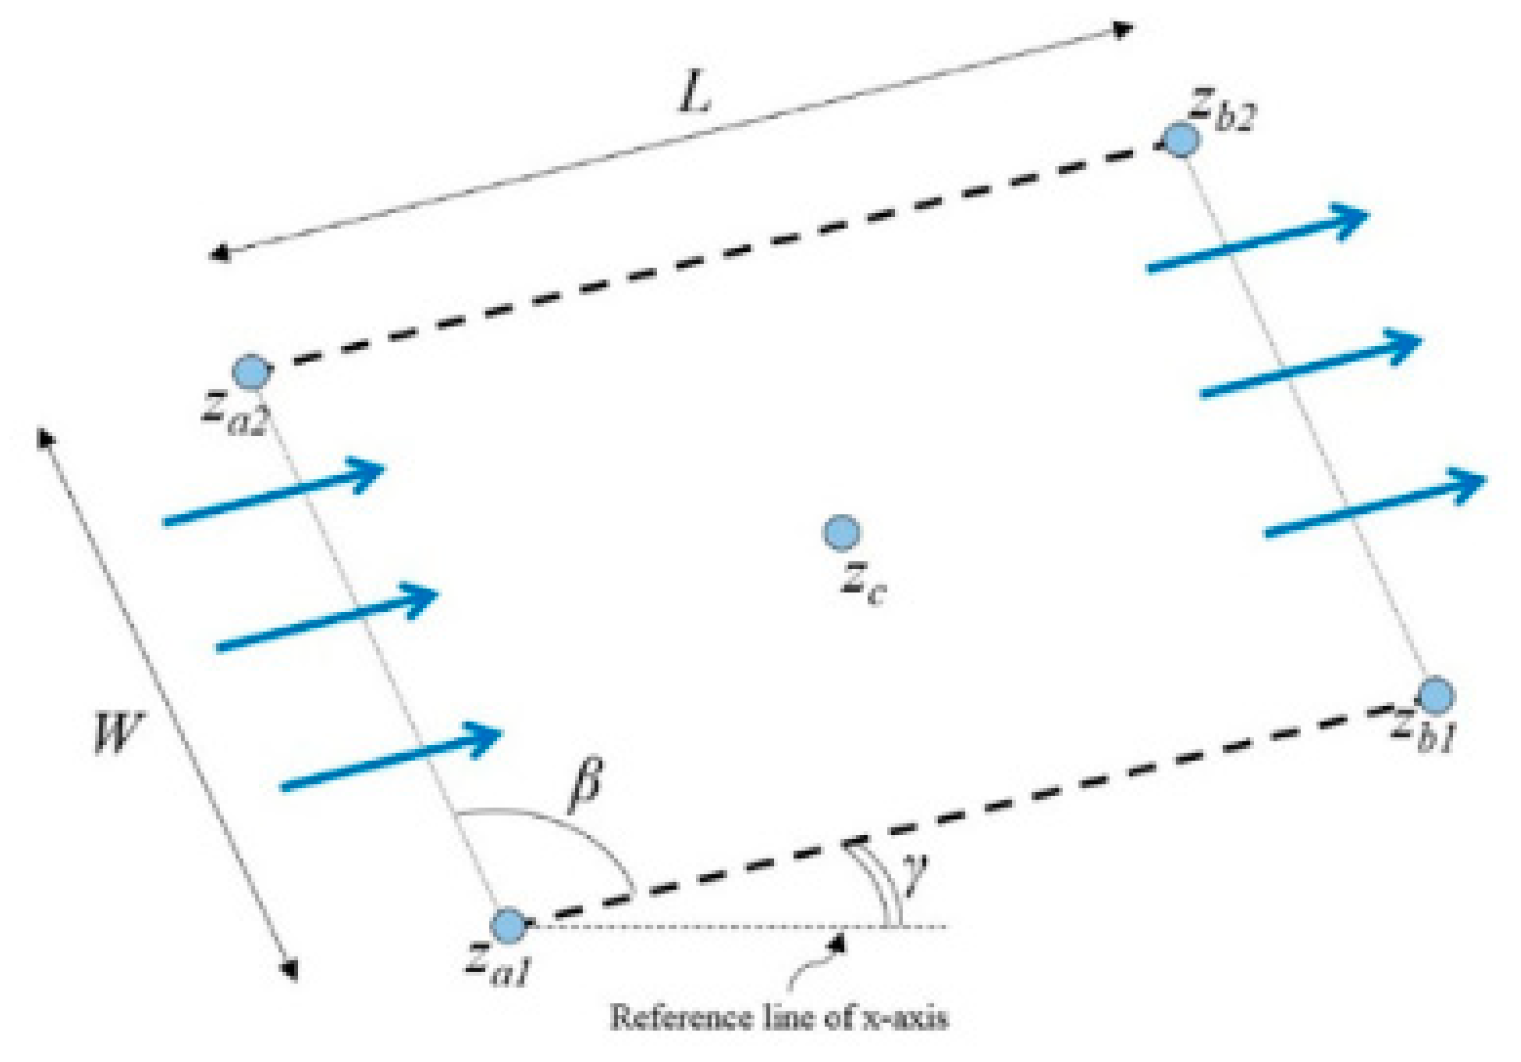
γ is the tilt angle of the natural fracture as shown in
Figure 1. The corner points of the natural fracture domain are given by
za1,
za2,
zb1, and
zb2.
The velocity fields for each of the analytical elements, represented by complex potentials in Equations (2) and (4), can be obtained by differentiating with respect to
z. The corresponding generalized velocity potential,
V(
z,
t), for a point source/sink (well entry) and areal doublets (natural fractures), are given in Equations (5) and (6) respectively:
The CAM model developed in our study uses particle paths and time of flight contours (TOFC) generated by an Eulerian particle tracking method (
). This method integrates the time-dependent flows by superimposing closed-form solutions for each state separated by a small-time increment. The selection of an appropriate time-step is a crucial decision in this method. An overly coarse time step in combination with sharply curving streamline will result in displacement vectors of the particles overshooting the actual path, resulting in an inaccurate particle path. However, if time steps are chosen sufficiently small, the solutions are highly accurate. A number of key examples is included in the present study. The velocities (
vx,
vy) of the fluid particles are mapped throughout the 2D flow plane using the real and imaginary parts of the complex potential:
Further details and derivation for Equation (7) are given in a previous study [
9]. Equation (7) can be used to calculate the velocity field solutions from specific velocity field expressions defined for producer/injector and natural fracture, (Equations (5) and (6)). Tracing a particle path is accomplished by first choosing an initial position,
z0, at time
t0 = 0 and calculating the local velocity. By choosing an appropriate time-step, Δ
t, the position
of the tracer at time
t1 =
t0 + Δ
t is:
The position
of the tracer at any other time
tj is:
The particle paths are generated by tracking a sufficient number of particles for a certain flow period. The time of flight contour (TOFC) are next determined by plotting the location of all the tracers for a specific time step.
3. Flow Paths and Convective Time of Flight
The particle tracking using a formulation based on CAM can be used to contour both the advancing front of fluids injected into the reservoir, or reversely, trace the fluid withdrawal pattern by producer wells. The latter generally makes use of the principle of flow reversal, where fluid is injected back into the reservoir at the same rate as produced. Both applications have been modeled in detail, as briefly reviewed below with new detail added. Flood studies, including water cut quantification, and closed-loop optimization of the well rates are outlined in
Section 3.1. CAM applications to model the flow in reservoirs with discrete fractures (both hydraulic and natural) are reviewed in
Section 3.2. All the models below are based on computation of the convective time of flight for tracer particles. A complementary approach models the diffusive time of flight, which gives the pressure field solution as separately shown in
Section 4.
3.1. Application in Flood Studies
The added value of water injection can be three-fold: (1) the volume of oil produced per time unit is accelerated, (2) the recovery factor is increased (because some residual oil that would otherwise not leave the reservoir is mobilized), and (3) well pressure is maintained which also contributes to an enhanced recovery factor. Optimization of the flood front arrival in producer wells is aimed at improving the sweep to ensure the maximum recovery factor is realized.
Improved oil recovery aimed for in water-flooding projects will commonly benefit from models predicting the rate of flood advance and water saturation in the production wells. Such models are even more useful when well rates can be adjusted to achieve the fastest sweep of the reservoir when none of the producer wells waters out prematurely. The optimum sweep will prevent premature decline of the oil saturation in the produced liquid. Fast affordable tools are currently limited to so-called capacitance resistance models (CRM), which provide a proxy for production optimization [
19].
Models based on CAM present a fast alternative for the optimization of water injection programs. Eulerian solutions of the velocity field can track the water flood advance from injector wells to producer wells. Time-of-flight contours visualize the flood advance toward producers. Water cuts of each individual producer well for a given pump schedule can be predicted.
Our new approach may be particularly useful for application in smaller fields and in stripper-well operations. Without much financial room for any detailed data acquisition and analysis, water injection programs in stripper well fields often proceed without the support of any reservoir model or streamline simulation. Frequently, such operations cannot afford, due to little or limited subsurface data and low production margins, the development of advanced reservoir simulations. Many commercial reservoir simulators require filling fine-grid cells with well-defined reservoir properties and come at considerable expense due to time-consuming computations, dense input data requirement and in-depth reservoir modeling expertise. An alternative flood modeling method uses CAM, which can fill this technology gap. The linearity of the underlying algorithms makes grids redundant and allows fast and affordable streamline models to test various reservoir development strategies.
3.1.1. Case A—Sweep Patterns and Water Cut Ratios
A CAM model for the Quitman field has been presented in detail in a companion study [
3]. The study revisited a classical waterflood simulation for an East Texas oil field [
20]. The Quitman Field is situated in an 18 ft thick reservoir section of Harris sand inter-fingered with shales from the transgressive Eagle Ford formation [
21]. All strata essentially can be modeled as sub-horizontal sheets, because the Quitman field is hosted on the southern flank of an extremely gentle dipping anticline (less than 3°; [
22]). The reservoir is assumed bound by impenetrable formations below and above, and laterally by the fault offsets terminating the permeable sands against impermeable rocks. Normal faults strike parallel to the northeasterly trending axis of the anticlinal structure, which is caused by gentle doming above a salt pillow [
23,
24]. The well locations for the 8 producers and 4 injectors used in our flood model are confined to the Harris sand of the Eagle Ford [
20].
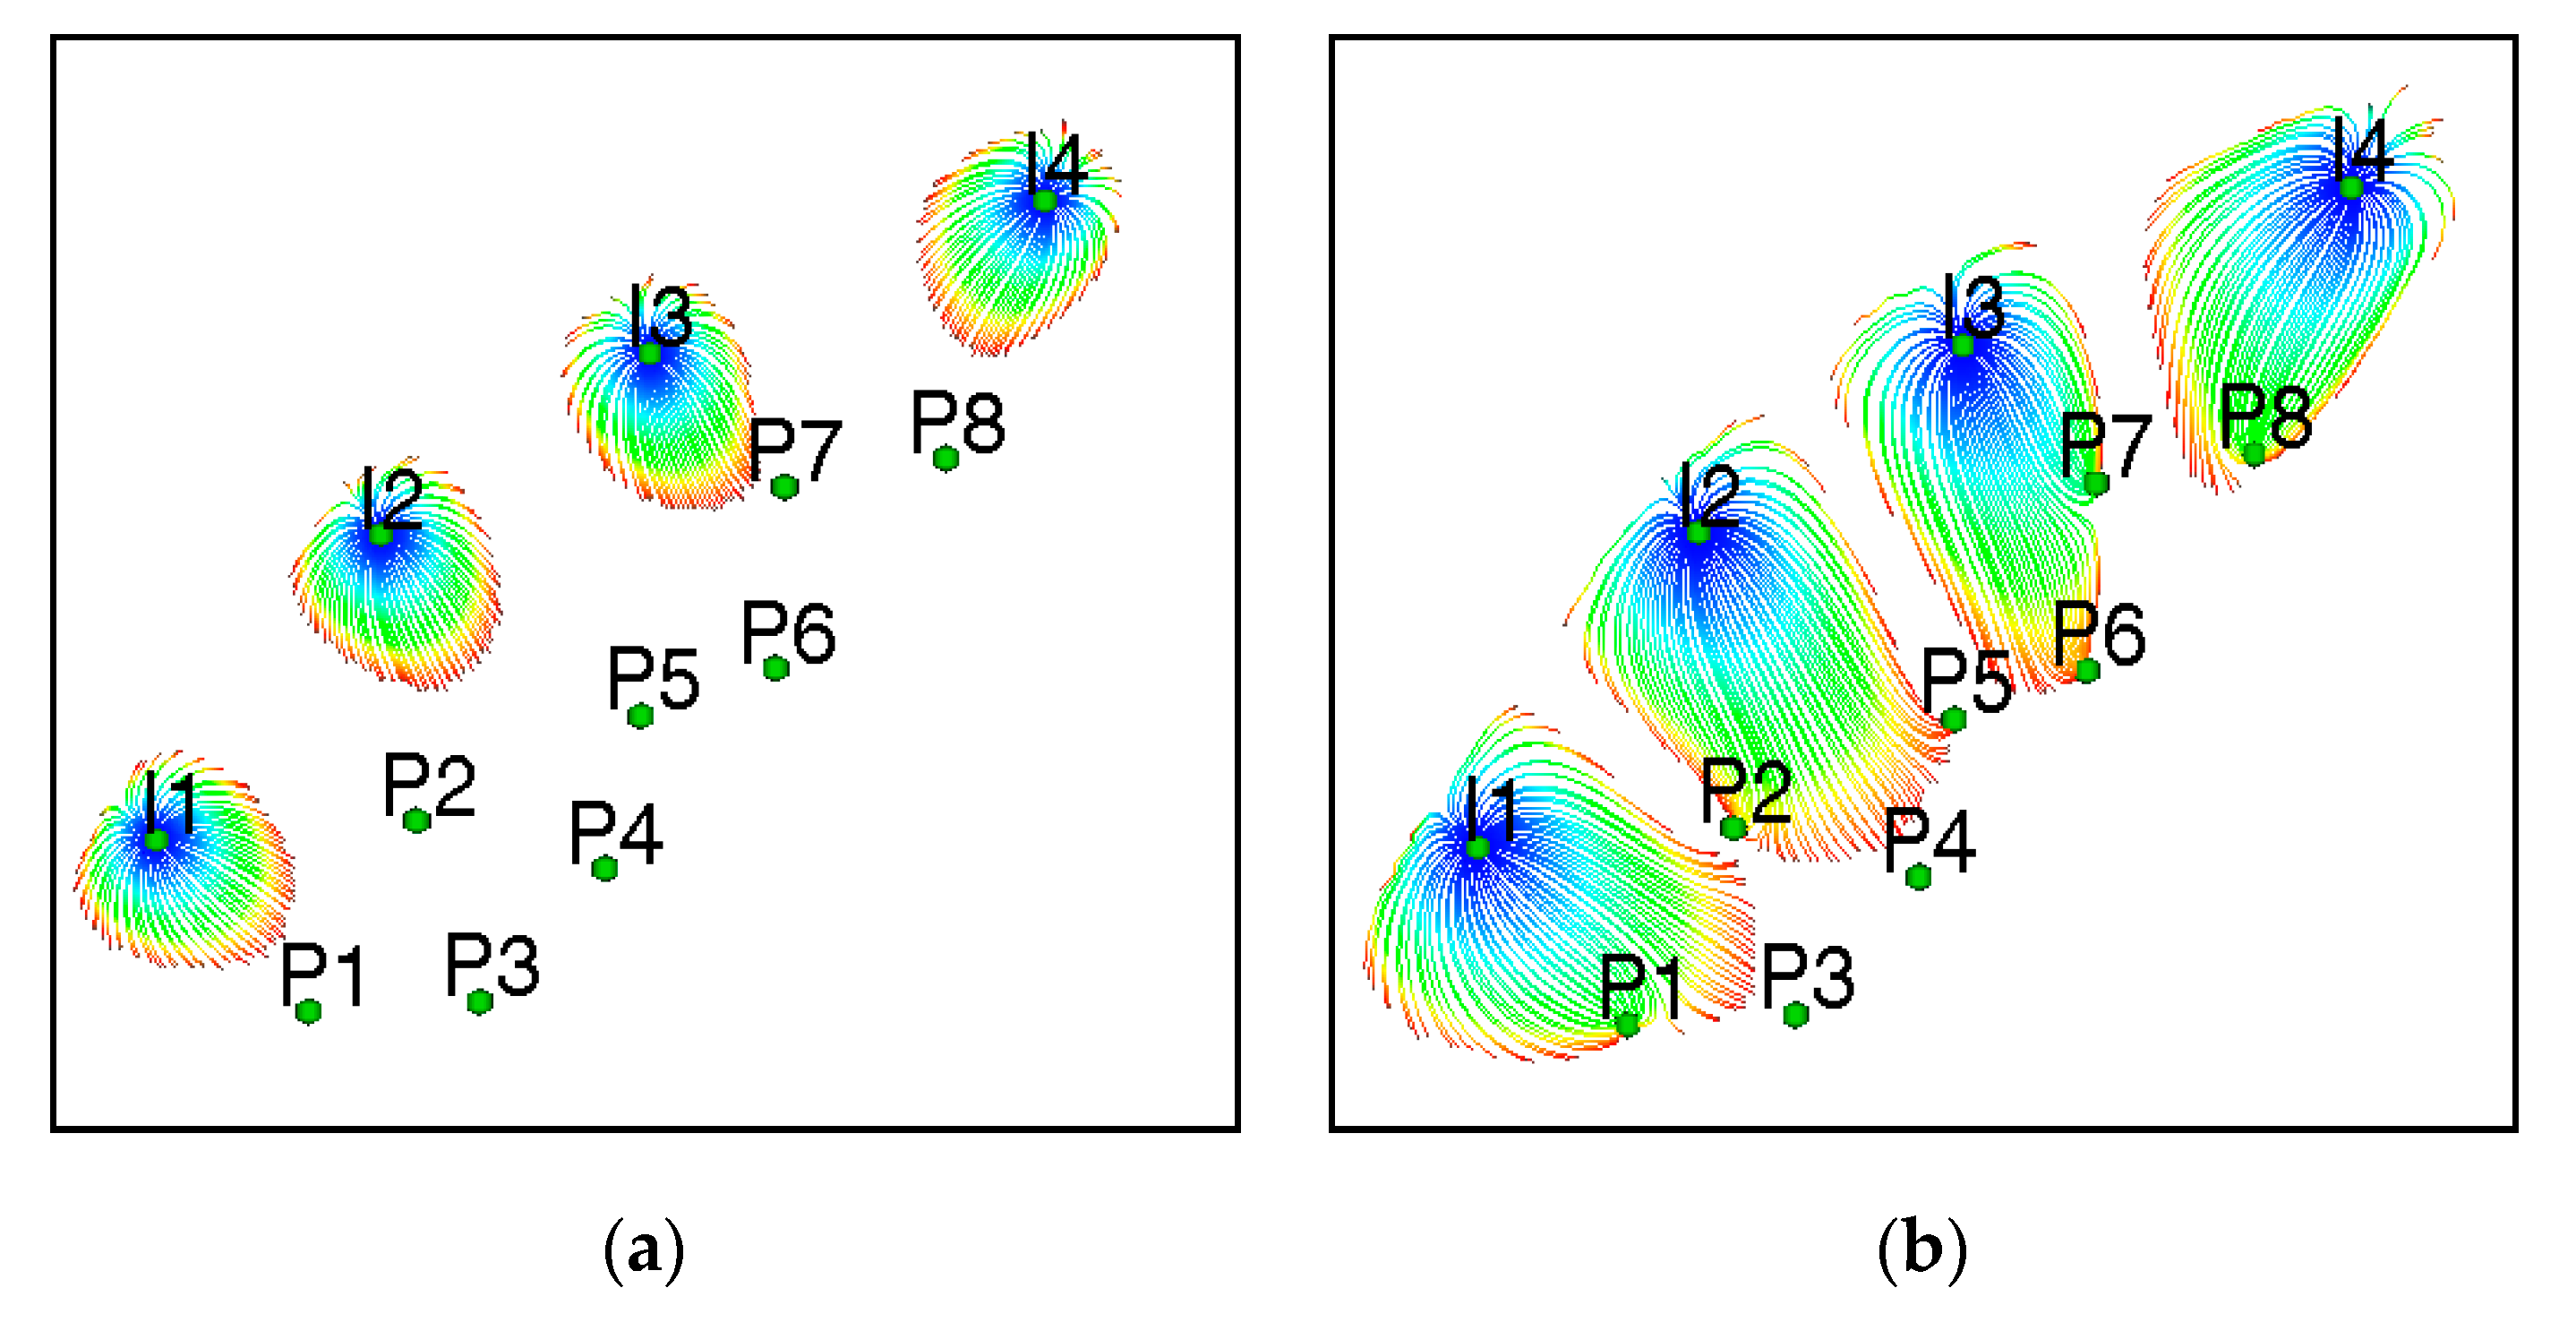
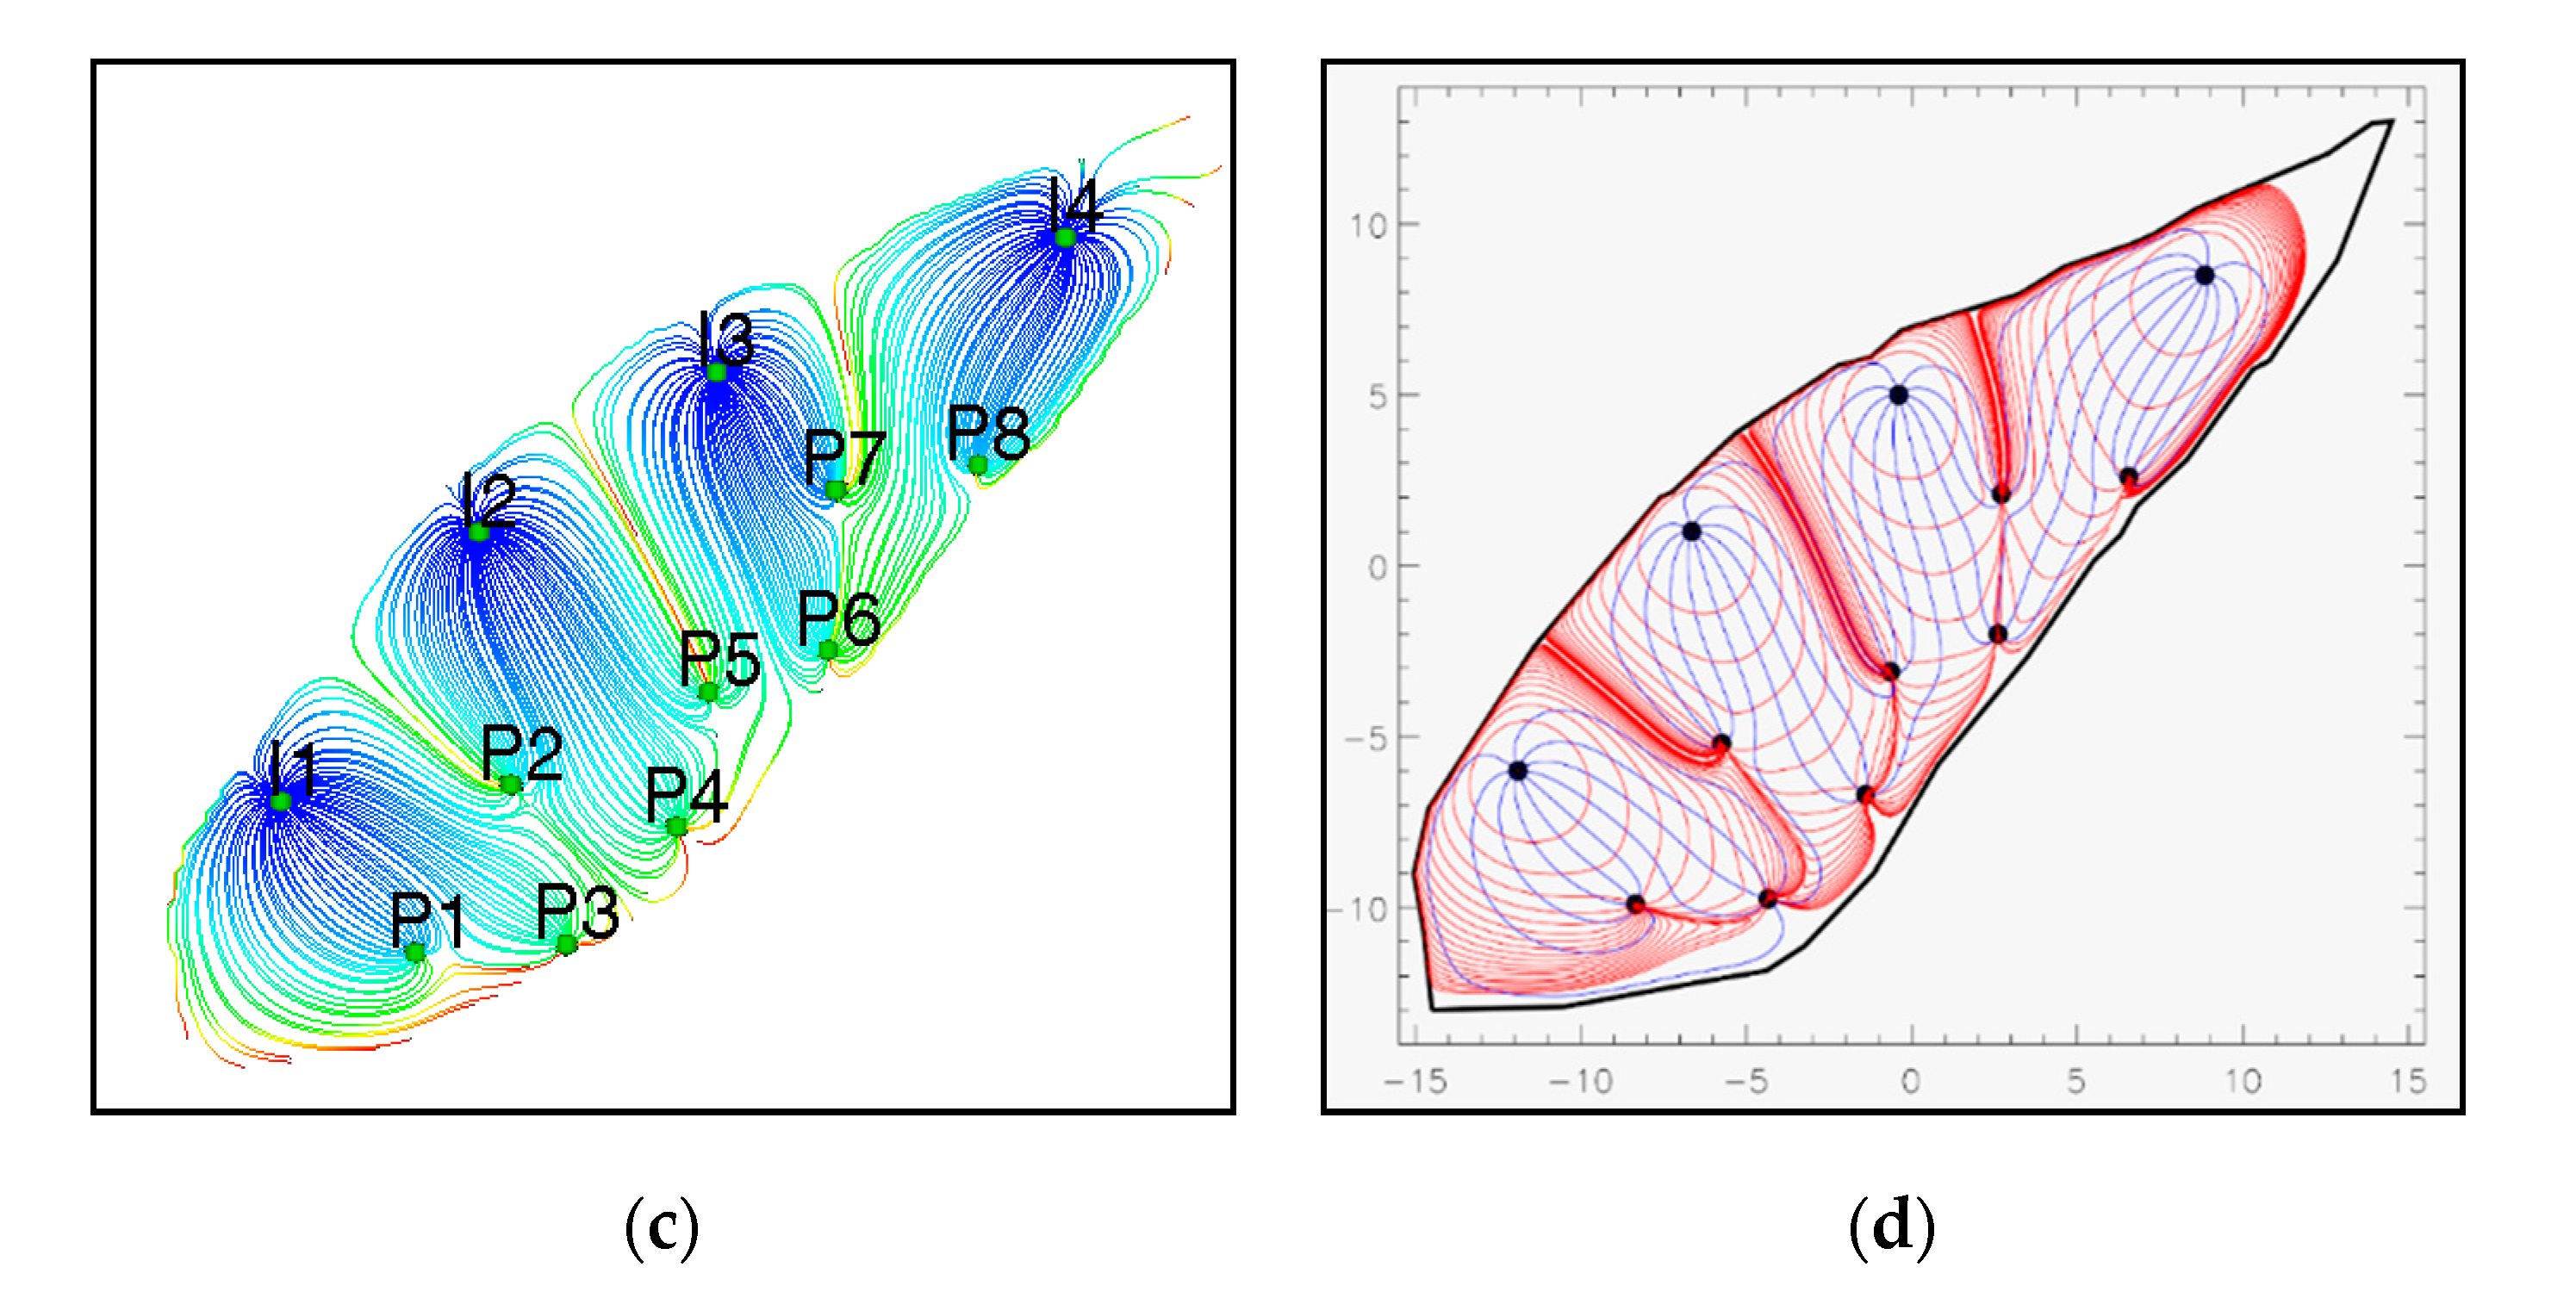
The fluid transport in the bounded reservoir is controlled by the individual rates of injectors and producers. The particle paths in the fault bounded reservoir were modeled using Eulerian FRONTSIM Eclipse (
Figure 2a–c) and compared with CAM (
Figure 2d) solutions. Close matches were obtained for both the streamline patterns and the convective time of flight contours of the two methods (CAM and Eclipse). This type of verification refers to the accuracy of the solution of our computational models, according to the differentiation made between verification and validation in computational fluid dynamics [
25]. After verification of a modeling code, one may proceed to verify the results with real world data, before one may claim a certain predictive capability of the model. Our aim in the present mini-review is to focus mostly on the verification of our results, while real world validation and forecasting of well productivity based on flow behavior in fractured porous media remain an integral part of our on-going research efforts.
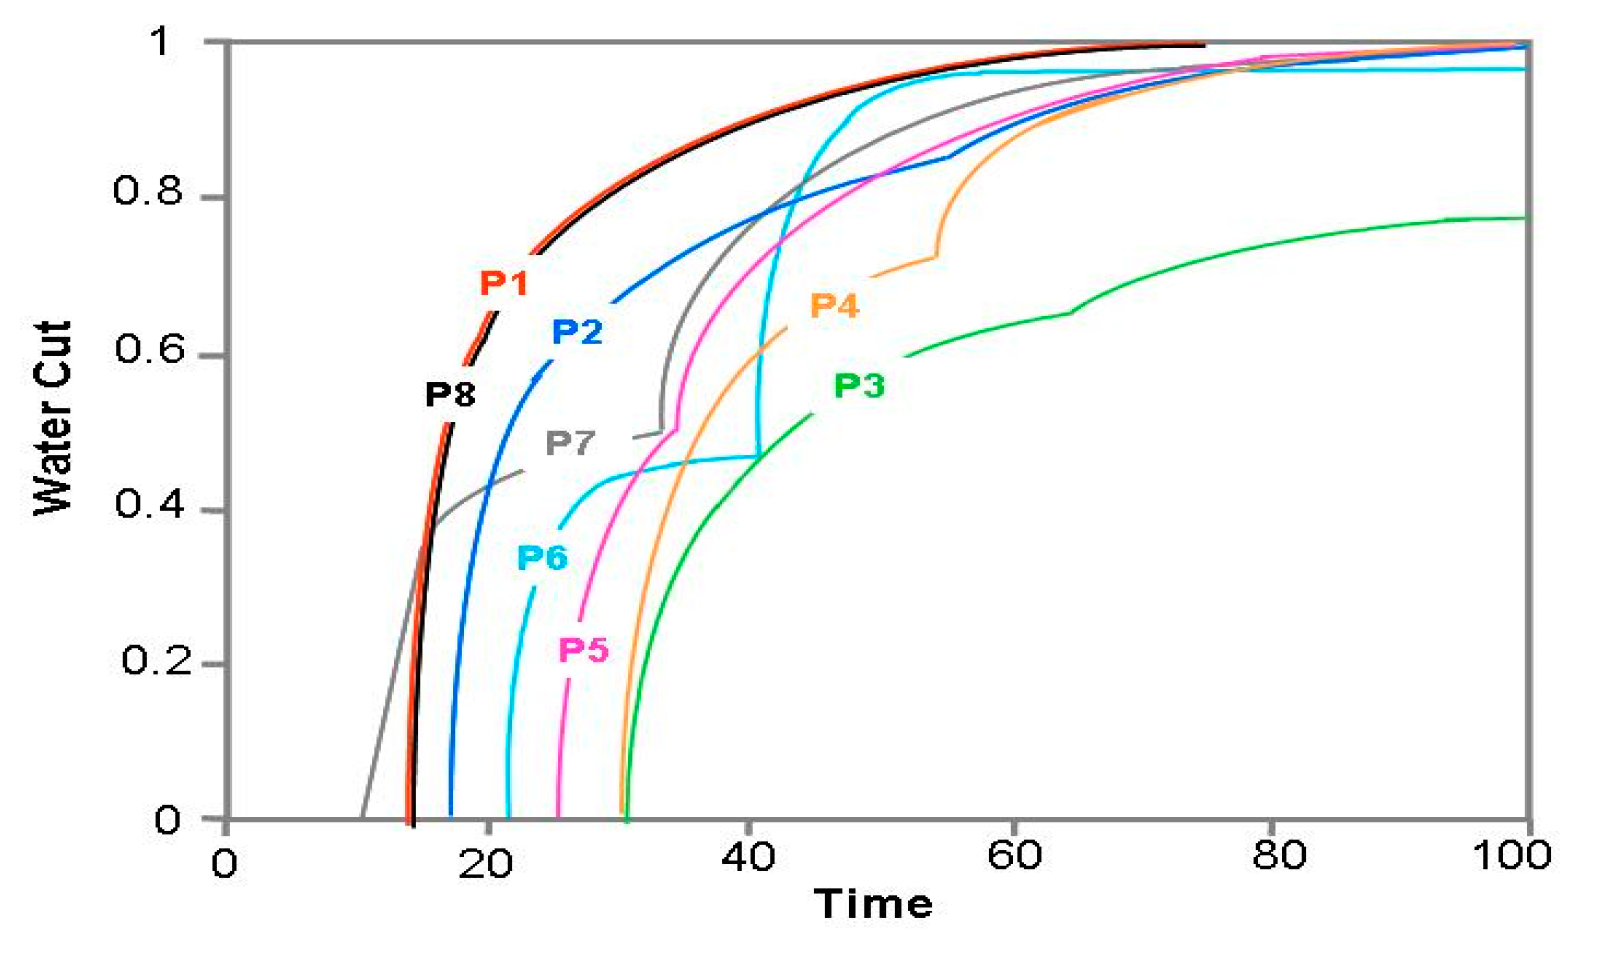
As a result of the existing well placement, a production schedule with all four injectors flooding the field at the same rate, and all eight producers producing at the half the injector rate (for mass balance) will lead to premature water breakthrough in some of the wells. The CAM model for flood front tracking is capable of accurately predicting the first arrival of the flood front from a connected injector and quantifies the increasing water cut in each production well over time (
Figure 3). For example, producers P1 and P2 have identical water cuts and are the first to completely water out at about
t * = 70. Well P3 will be last to water out, and much later so than all other wells.
Some important conclusions can be drawn from the CAM flood model. For example, the shapes of the water-cut profiles appear to be diagnostic for how many injectors communicate with a particular producer. Producers P6 and P7 show marked kinks in their water cut curves (
Figure 3). Such kinks mark the moment in time when the stream tubes connected to the well start to receive water from a second injector. The arrival of water from a second injector in the producer well will further increase the well’s water cut, and the water cut curves may show a rapid increase of water cut over a relatively short time. Producer wells P2 to P5 show only gentle kinks in their water-cut curves, but such kinks are equally diagnostic for the connectivity to a second injection well. The kink angles in the water cut curves also reveal how significant is the contribution of the second injection well for water supply to a producer. A gentle kink means the water cut in the producer (P2 to P5) due to the second injection well will only increase slowly (
Figure 3). In contrast, a more pronounced, sharp kink in the water-cut curve (P6 and P7 in
Figure 2) means that the water cut due to the second injection well will rapidly increase (
Figure 3). If there is no kink in the curve of water ratio versus time of the producer well (P1 and P8), then such wells are connected to only one injector well.
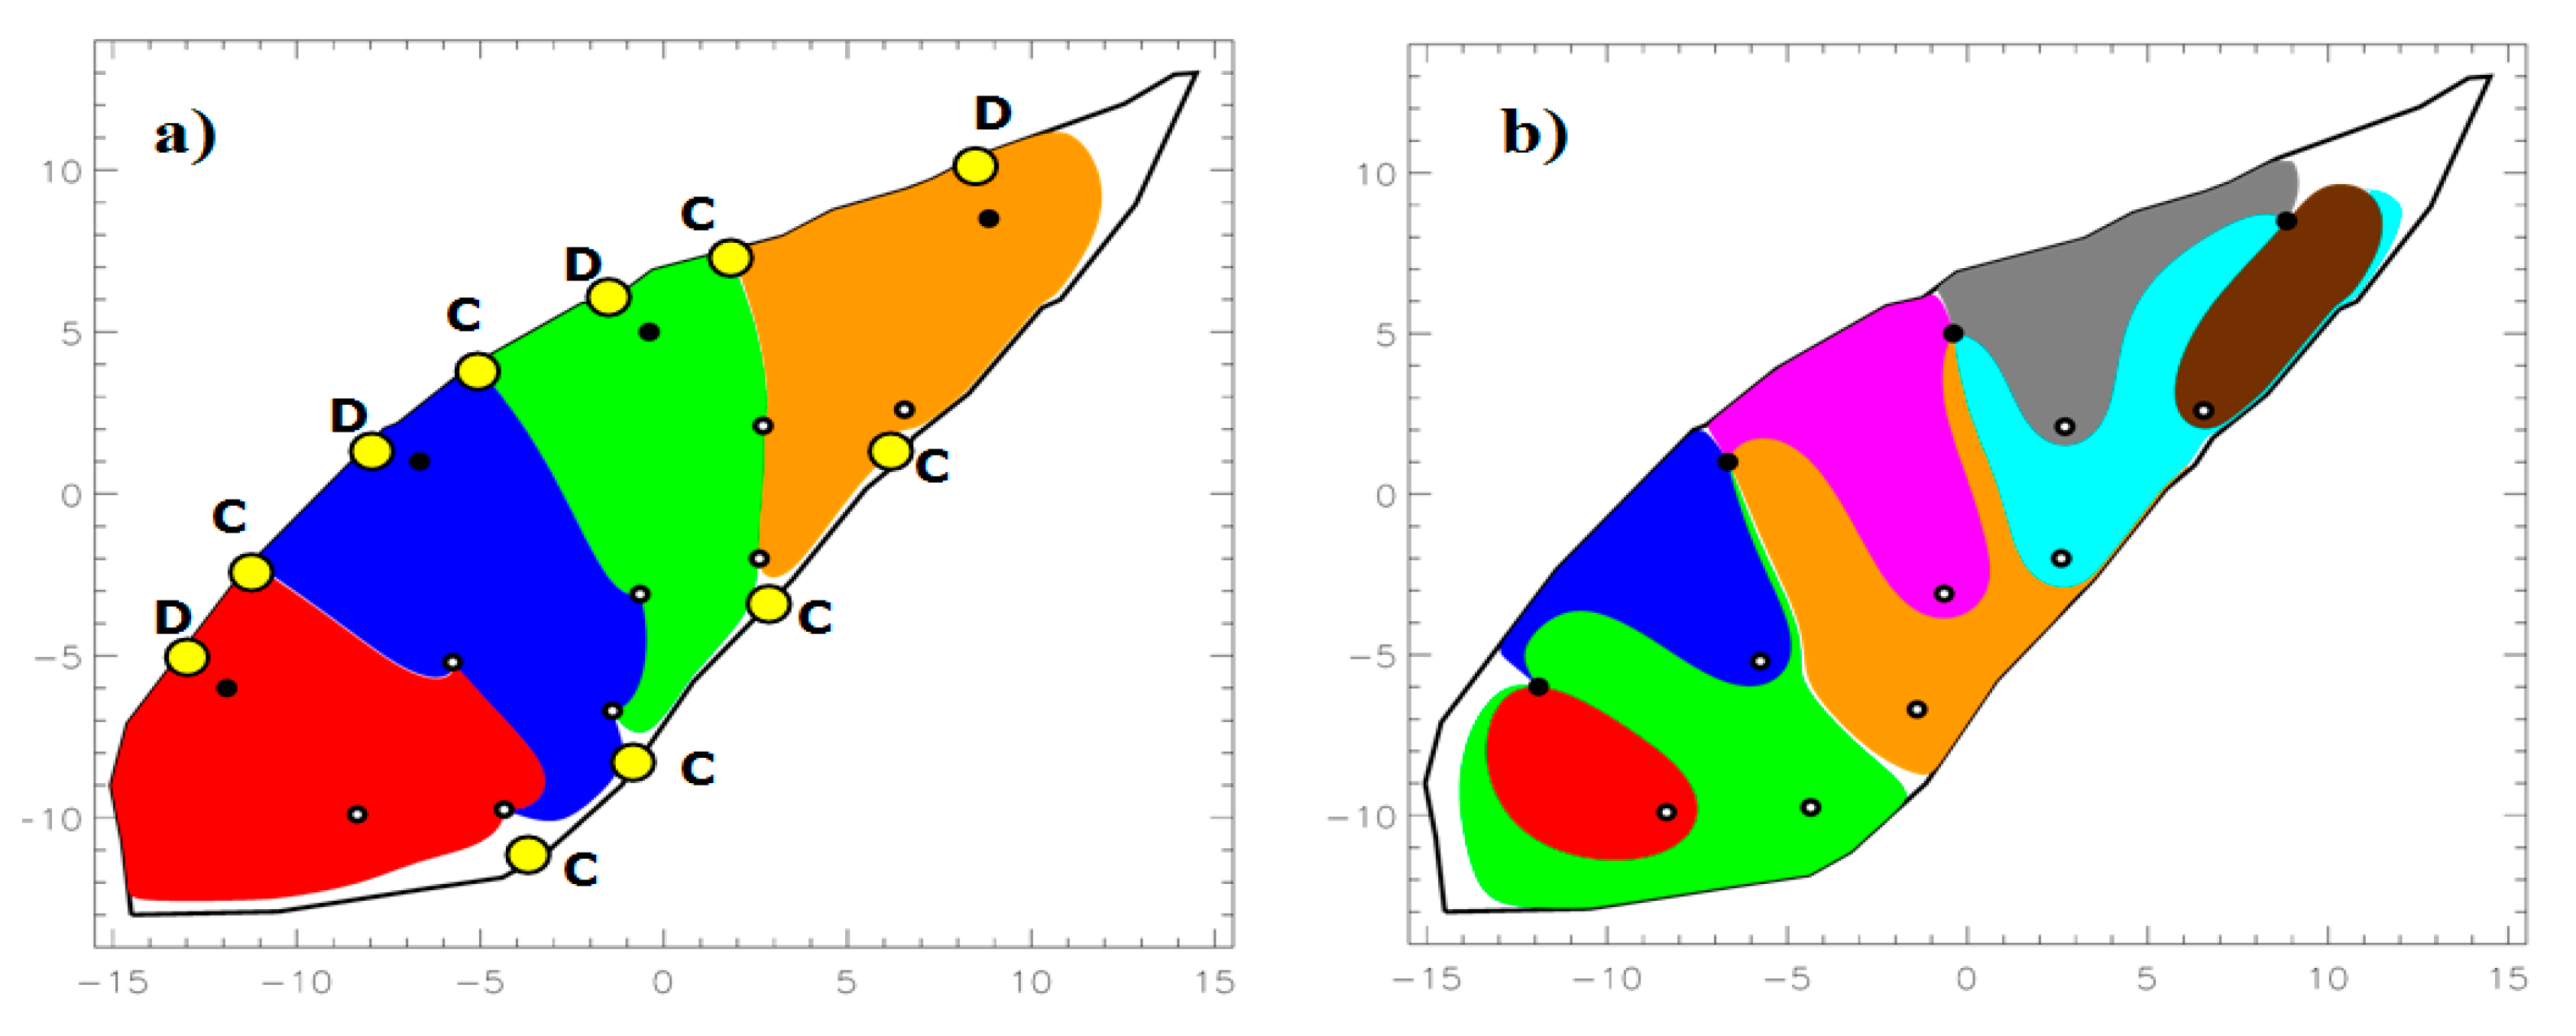
In addition to the above results, the flooding compartments attributable to individual injectors (
Figure 4a) and their complementary drainage patterns (
Figure 4b) can be quantified and visualized with our new method. The only required inputs are the well rates. The Quitman Field example assumes fixed well rates, but rates may be transient, and the model results will still be accurate. For scaling of the dimensional time of the flood arrivals, additional inputs required are reservoir thickness, initial water saturation and porosity. With these few inputs all models in our original study were produced, and could accurately predict the resulting flood patterns and complementary drainage patterns and their evolution history [
3].
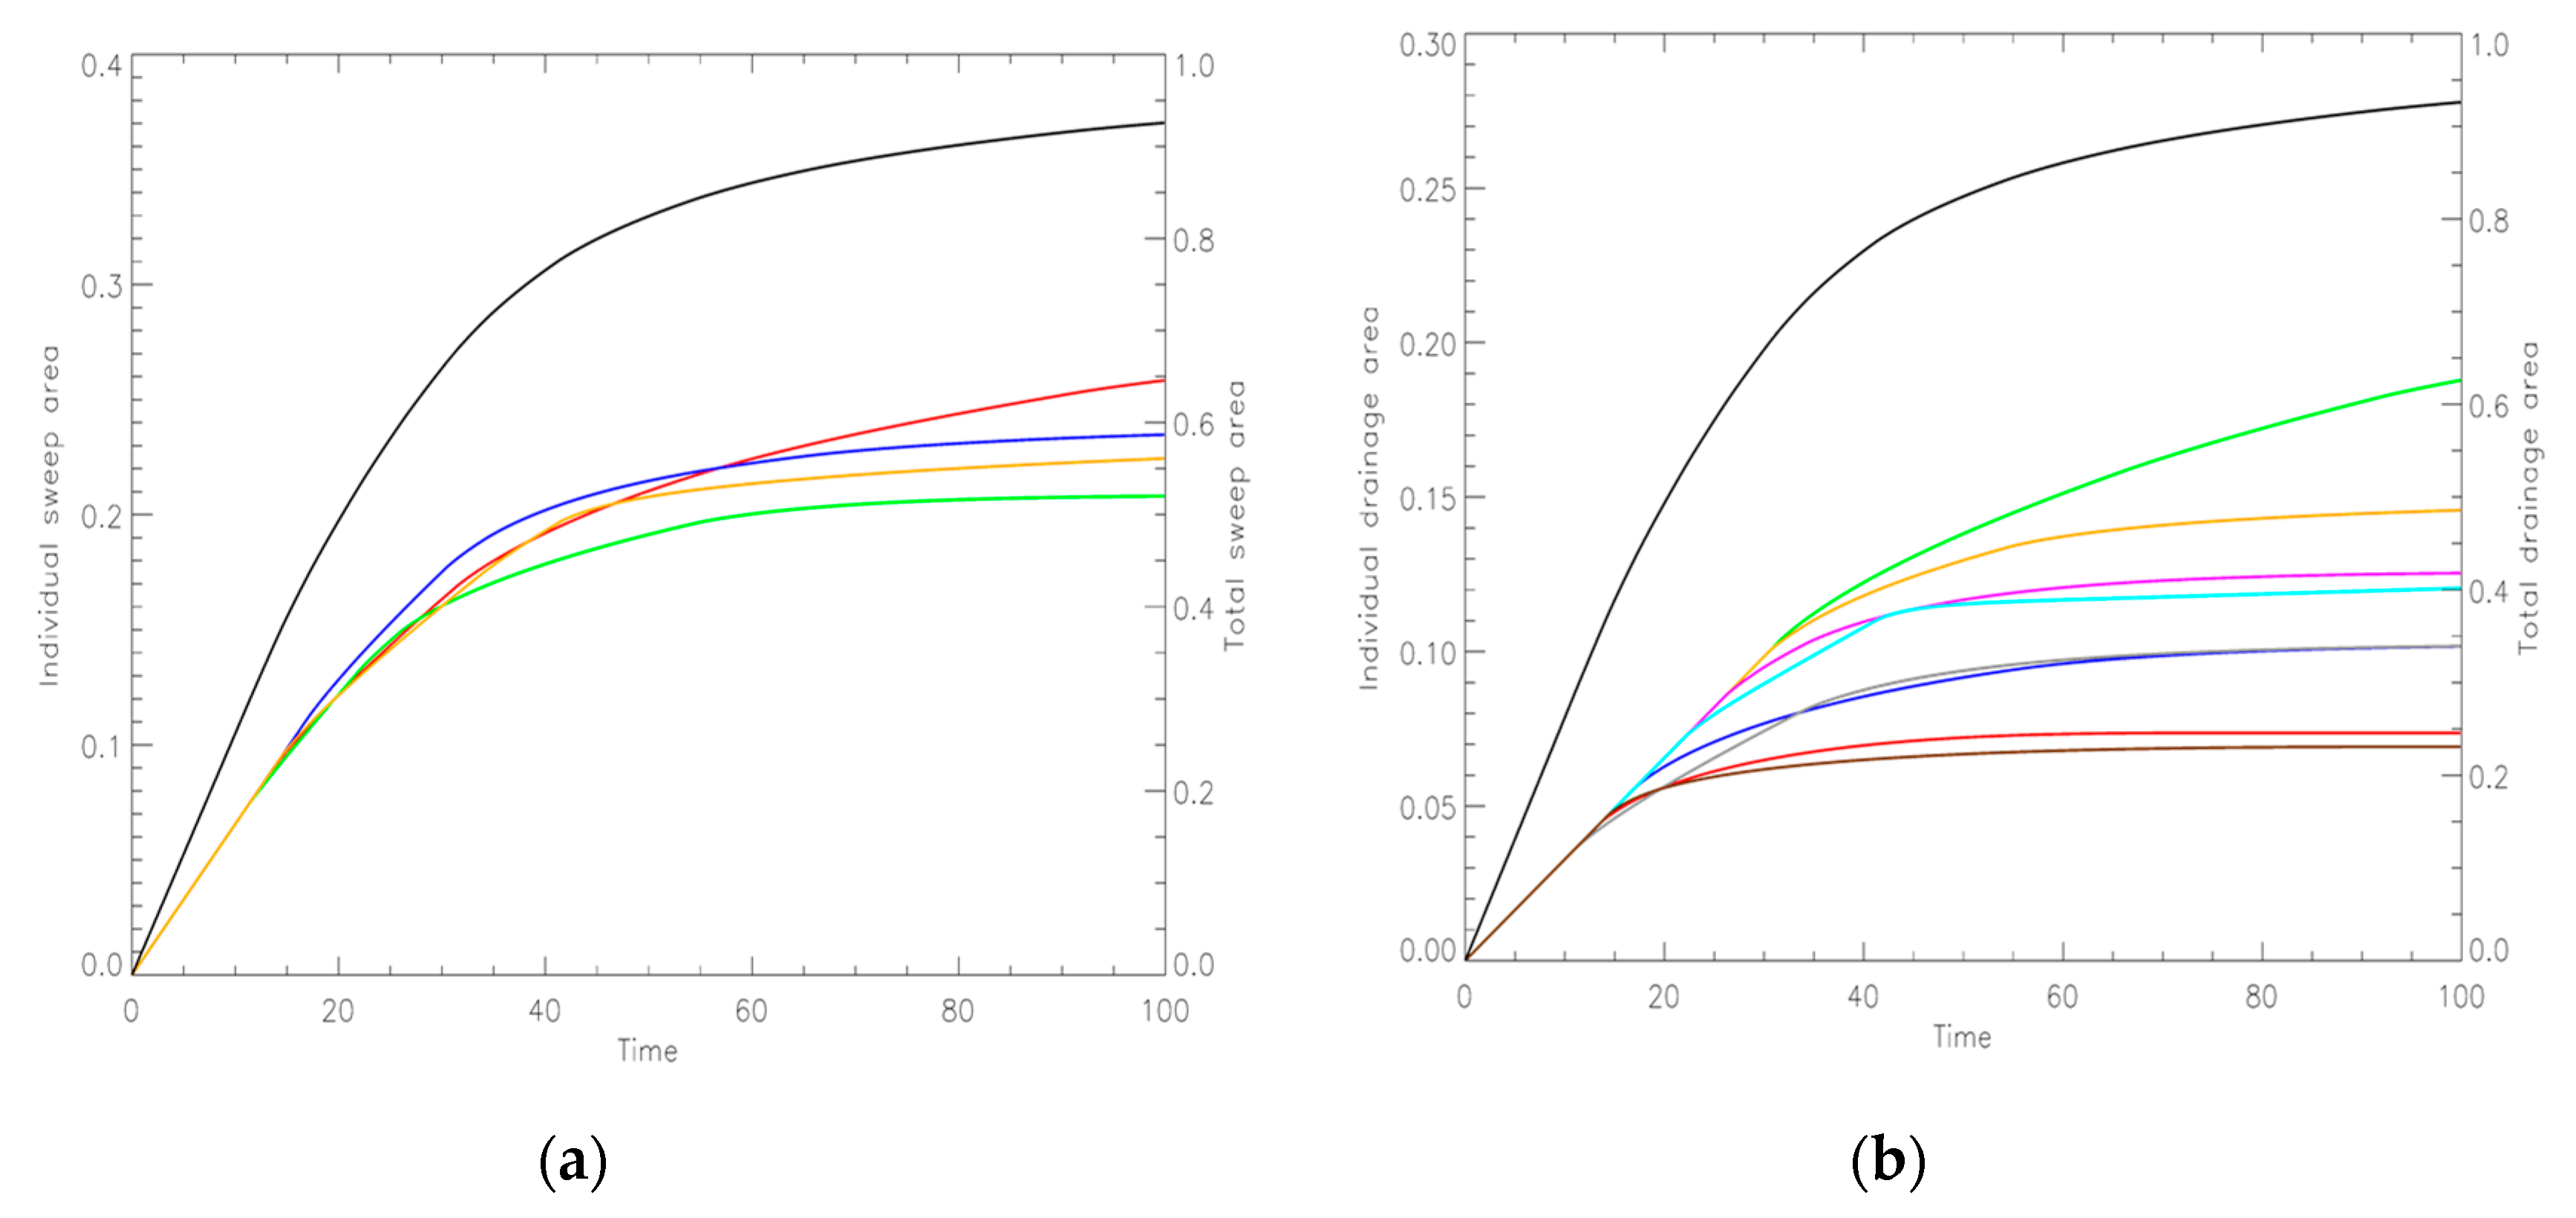
A more comprehensive view of the sweep and drainage development is obtained by additionally plotting the evolution of the sweep area versus non-dimensional time (
Figure 5a), and likewise, of the drainage area versus non-dimensional time (
Figure 5b). The color codes of the sweep and drainage curves correspond to those used in
Figure 4a,b. The sweep curves of individual injectors (
Figure 5a) are bundling closely together and confirm their fairly uniform sweep areas (
Figure 4a). In contrast, the drainage curves for individual producers (
Figure 5b) show a much larger spread, indicating a fairly non-uniform drainage area (
Figure 4b). Early in the flood program (
t * = 15), the drainage curves for each producer still coincide (
Figure 5b), but these start to diverge after
t * = 15, due to the onset of premature water breakthrough of some wells, beginning with P7 and then cascading into water breakthrough in other wells (
Figure 3).
The following observation rules are relevant for water saturation studies in any water flood program (
Figure 4a): (1) Stagnation points near producer wells are always convergent (C), whereas stagnation points along the periphery of the bounded domain near the injection wells are alternating convergent (C) and divergent (D) (
Figure 4a). (2) Producers (P) connected to only one stagnation point (either D as for P1, or C as for P8 in
Figure 4a,b, compare with
Figure 2d), will receive water from only one injector. (3) Two producers (P) connected to two adjacent stagnation points (D, as valid for producers P2 to P7 in
Figure 4), will receive water from two injectors.
3.1.2. Case B—Closed-Loop Injection Rate Optimization
A great advantage of instantaneous streamline solutions in CAM models is that optimization of well rates for a certain waterflood injection pattern can be obtained after only a few time steps in the model. This is unlike gridded methods, where the full particle paths are only known after solving the flux from one grid cell to the next, which corresponds to real field times of months (or even years) and every iterative for optimization means the changed settings are only known for simulation times corresponding to later in the well life.
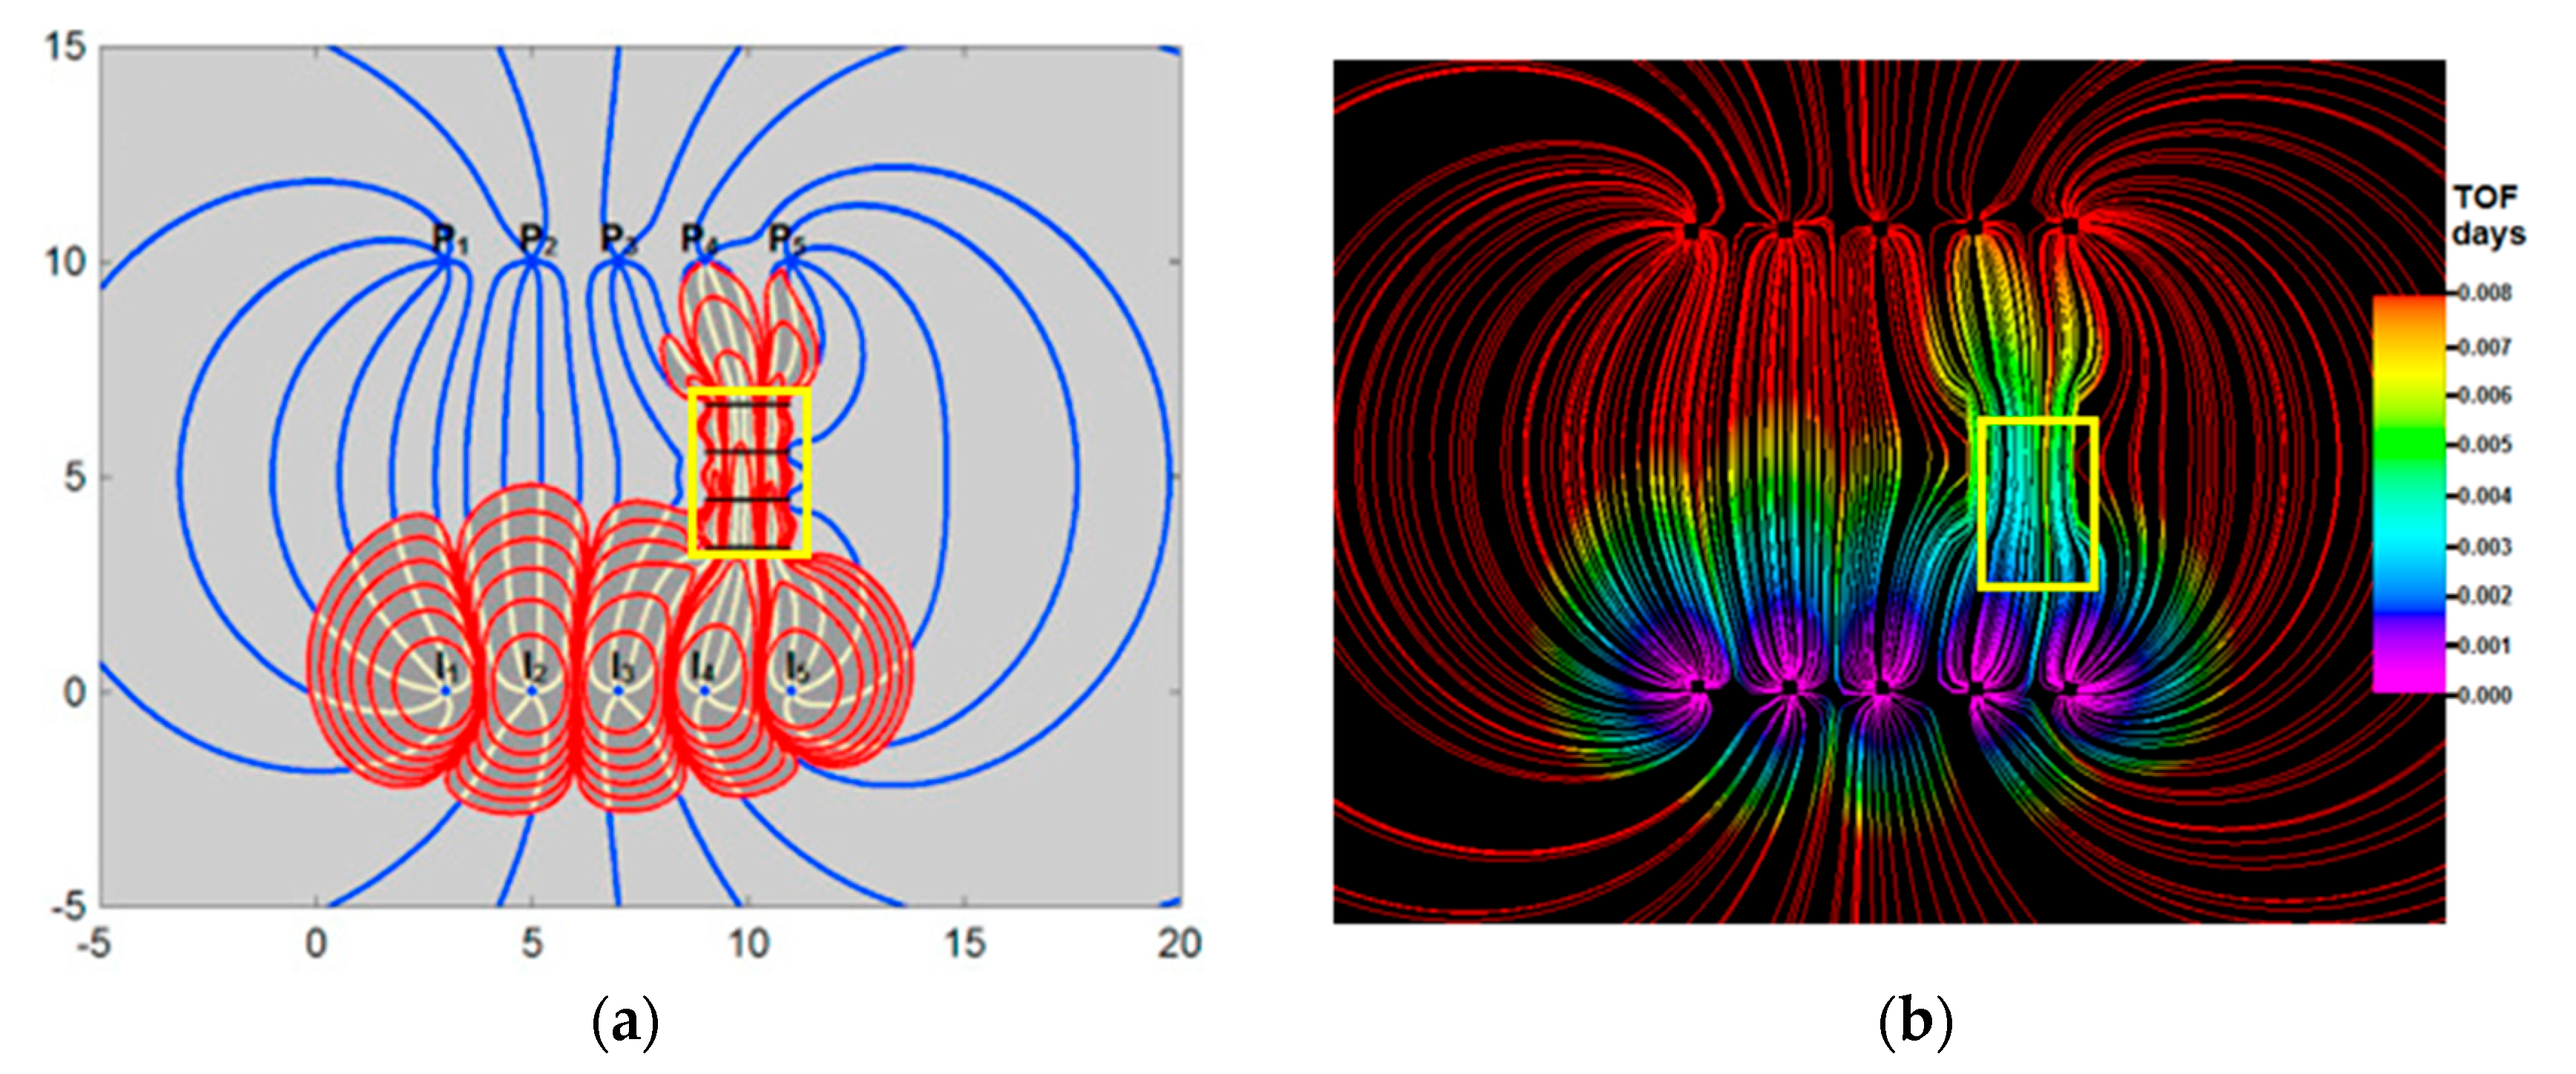
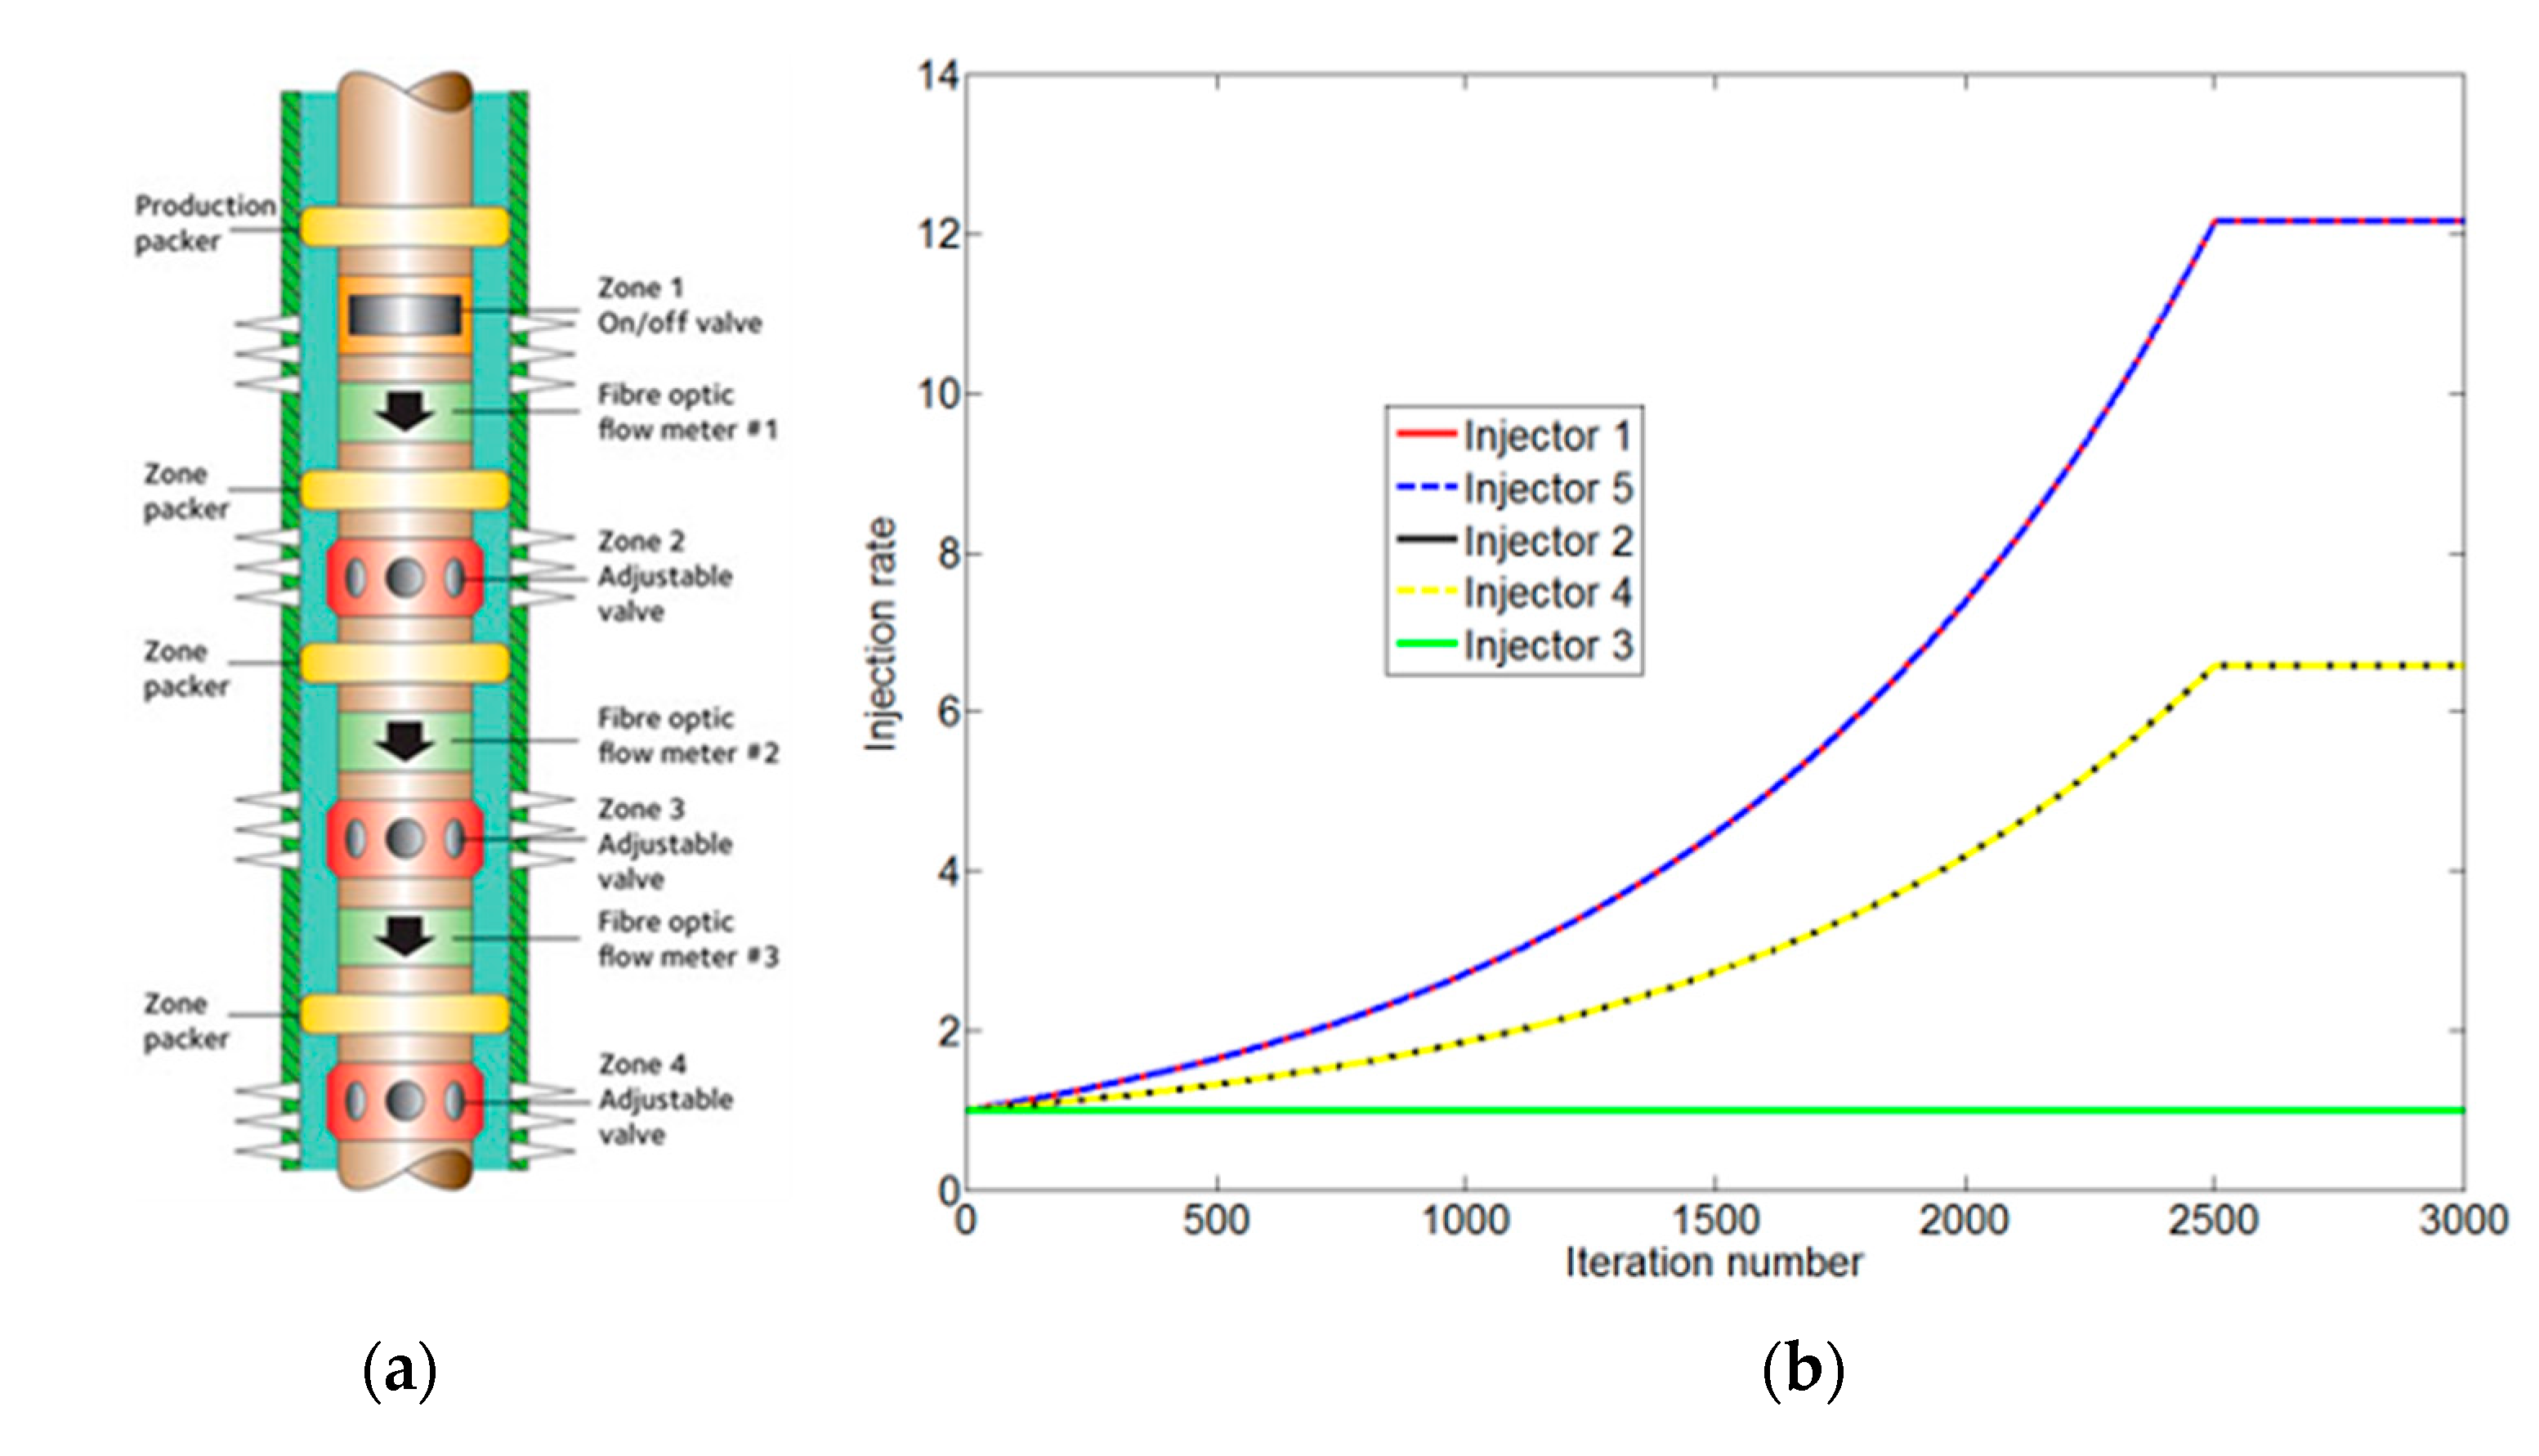
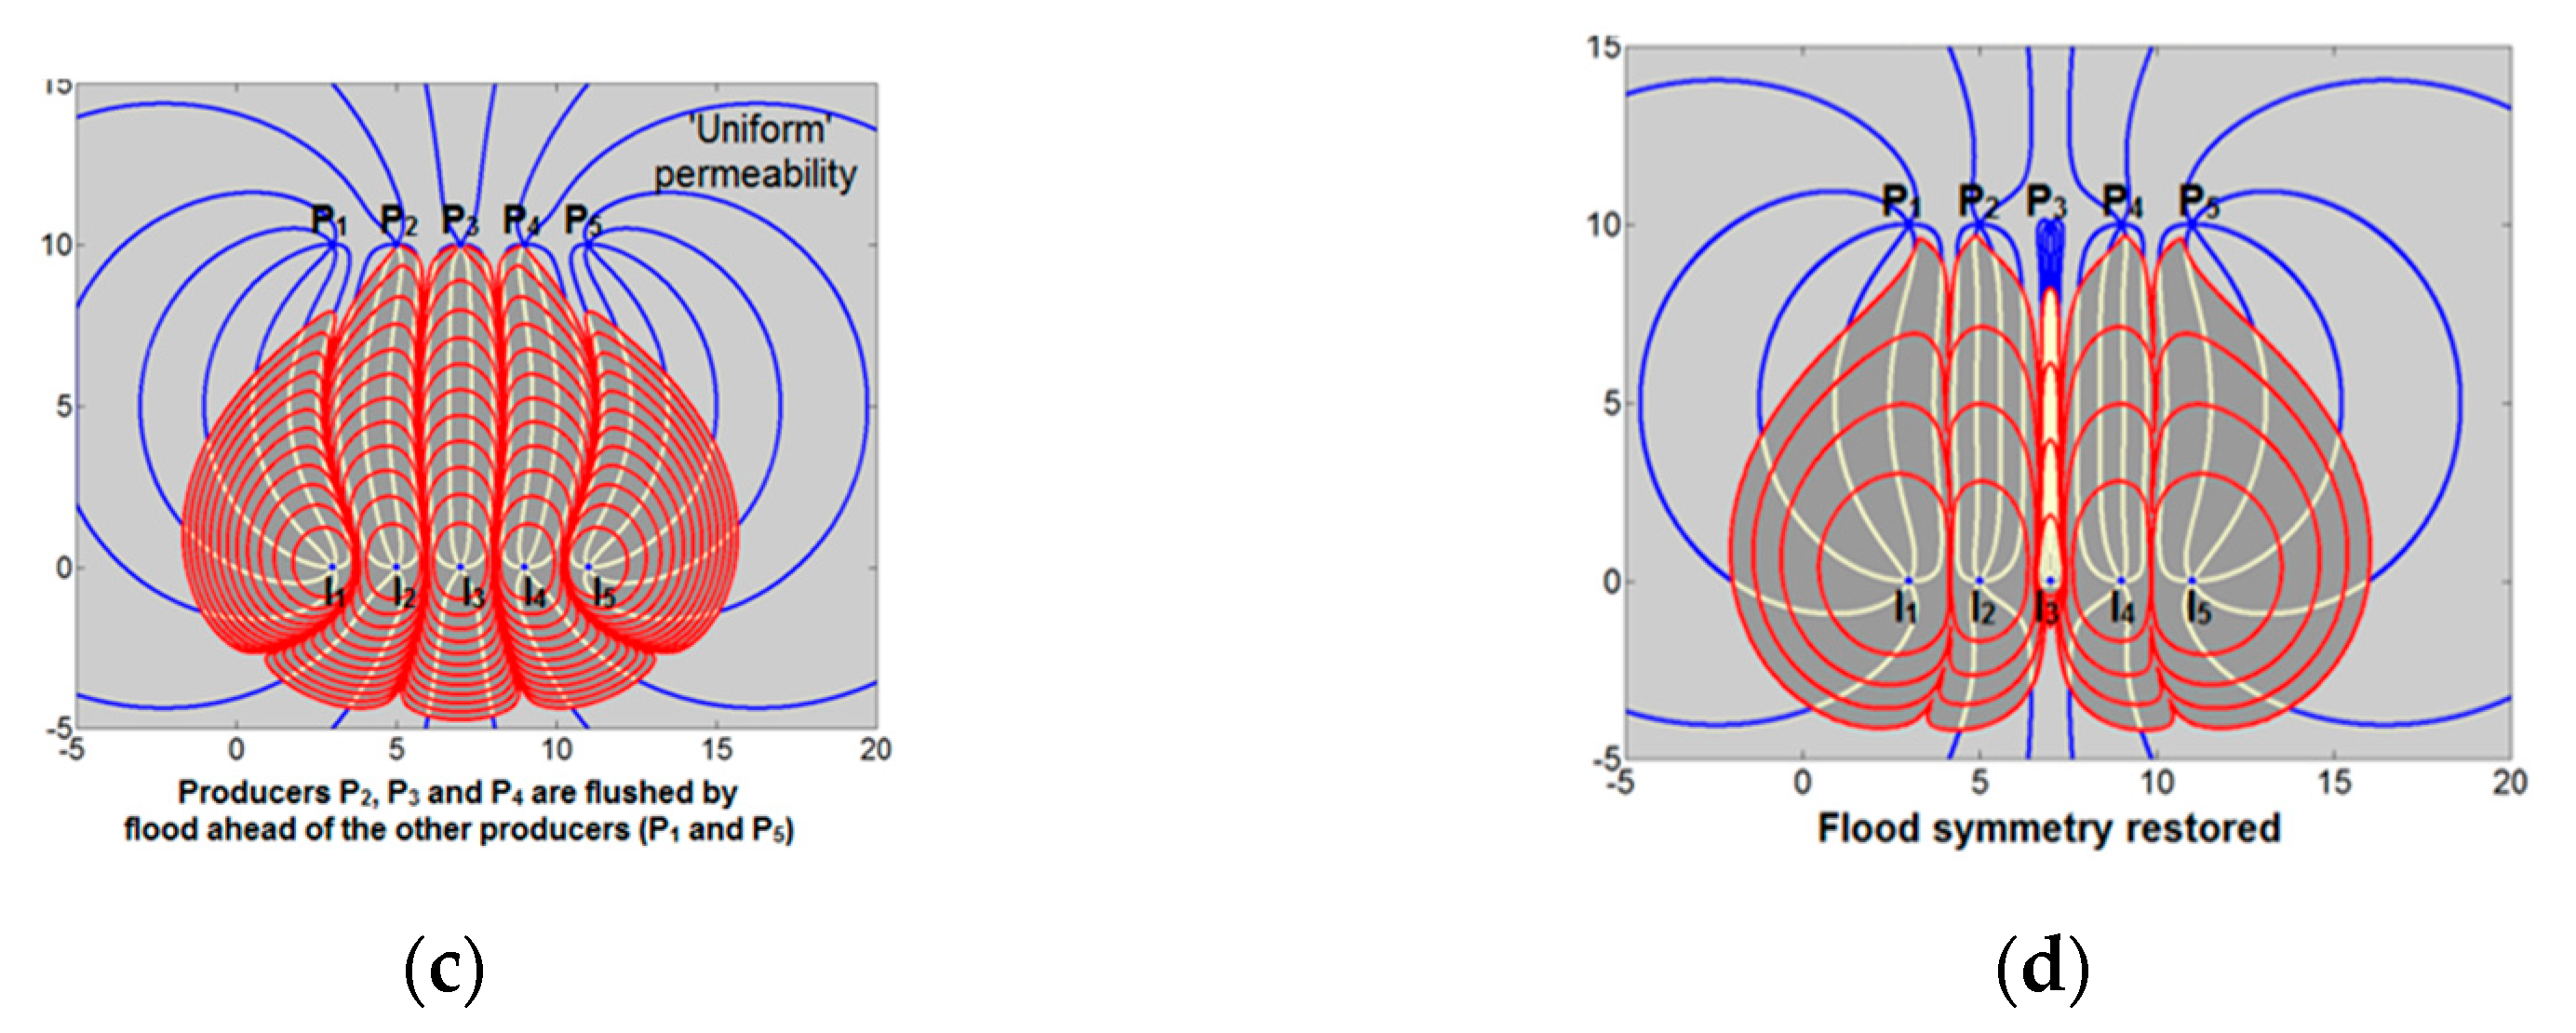
The principle of closed-loop optimization of injector well rates was demonstrated using CAM in synthetic models of a direct line drive with five injectors and five producers (
Figure 6). The presence of heterogeneities, such as a region of enhanced reservoir permeability, will deflect the flood paths and result in water breakthrough times different from those originally anticipated (based on computations with limited information and homogeneous reservoir assumptions). Model pressures (as shown below) near the producer wells give sufficient information to readjust the well rates to improve the sweep in such heterogeneous reservoirs. Equal bottomhole pressures in free-flowing wells will give equal times for water–breakthrough in each well, which means that history matching of well pressures in the field is adequate to adjust the model to such well rates and prescribe adjustments to the well rates such that the field will be flooded with an optimized sweep pattern.
A closed-loop adjustment of each of the five injector well rates based on an objective function that equalized pressures near all five producer wells can be quickly obtained in the CAM model (
Figure 7). The optimized injection rates obtained with CAM ensured equal arrival times of the waterflood in the producer wells (
Figure 6c). A grid-based Eclipse simulator does not allow for quick optimization based on pressure differentials near the producer wells. The optimized well rates obtained with CAM closed-loop optimization were fed into the Eclipse model. The latter used a streamline tracing algorithm developed to compute streamline trajectories and time of flight values using the methodology [
27]. Finally, Eclipse results were imported into Petrel to visualize the particle paths and TOFC’s and compare them with the CAM results. The CAM based simulations (
Figure 6a,c) match closely with the Eclipse-based streamline simulations (
Figure 6b,d). A very close match was obtained for both the streamline patterns and the convective time of flight contours of the waterflood front. The scaling rules that ensure kinematic similarity between the CAM and Eclipse model were detailed in an earlier study [
26]. Note that an in-house developed streamline tracing algorithm was used in the Eclipse model instead of a commercial package (e.g., FRONTSIM) for better transparency when comparing the two models.
3.2. Application to Fractured Reservoirs
Reservoir space may be heterogeneous and more often than not includes natural fractures that may deflect and impact the flow. In the present analysis a fracture is considered a domain bound by discrete linear, sub-parallel boundaries, forming so-called simple interfaces (cf., [
28]), across which the permeability of the matrix abruptly changes. Fractures may consist of a void space (fully open cracks saturated with fluid) [
29], and when very narrow, the hydraulic conductivity follows from a cubic law according to Boussinesq’s solution of viscous flow through a narrow slot [
30]. In many naturally fractured rocks, the fracture space may be containing rubble, mineralization of a mixture of gaps and altered rock fabric (partially open cracks) [
29], in which case the fractures can be represented by lineaments of altered permeability relative to the matrix.
CAM simulations can accurately account for discrete fractures with a range of permeability. A new benchmark is included below for CAM versus Eclipse using the direct line drive model of
Figure 6, but now with a high permeability fracture zone between the injector and producer wells (Case A). Examples of flow diversion in CAM models with impermeable faults are also included (Case B).
3.2.1. Case A—Permeable Fractures
Flow simulations based on finite difference volume discretization need to resort to time-consuming grid refinements and unstructured grids when modeling flow near fractures. The grid-less nature of CAM sidesteps such time-consuming gridding. What made the method extremely powerful for modeling flow in reservoirs with high permeability flow channels (such as natural fractures) was the development of a new algorithm to enable insertion of discrete natural fractures with higher permeability than the matrix [
4].
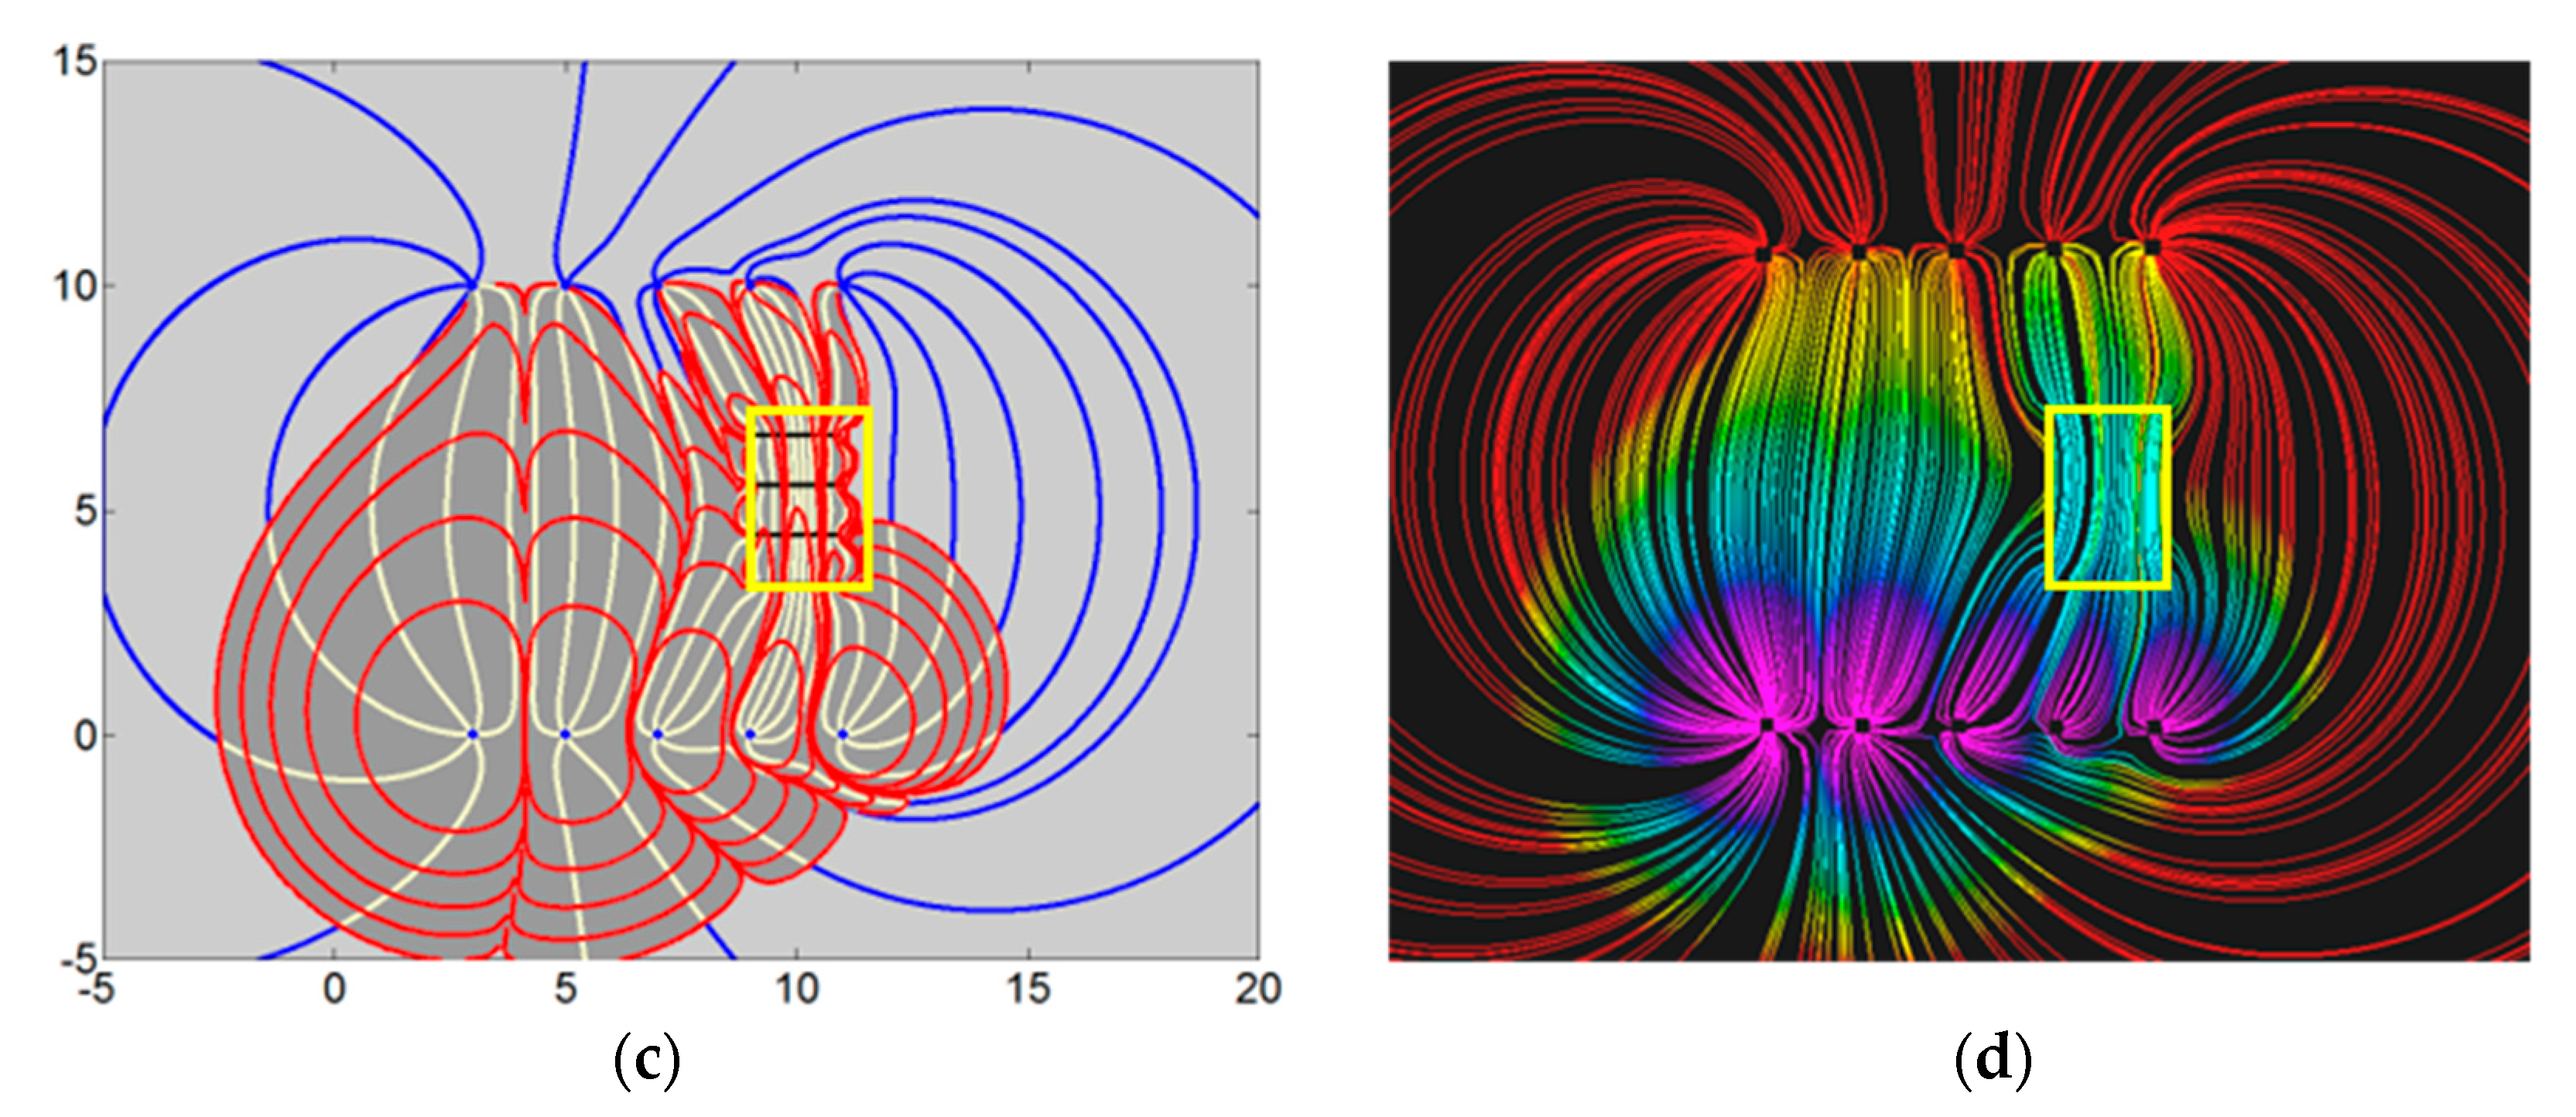
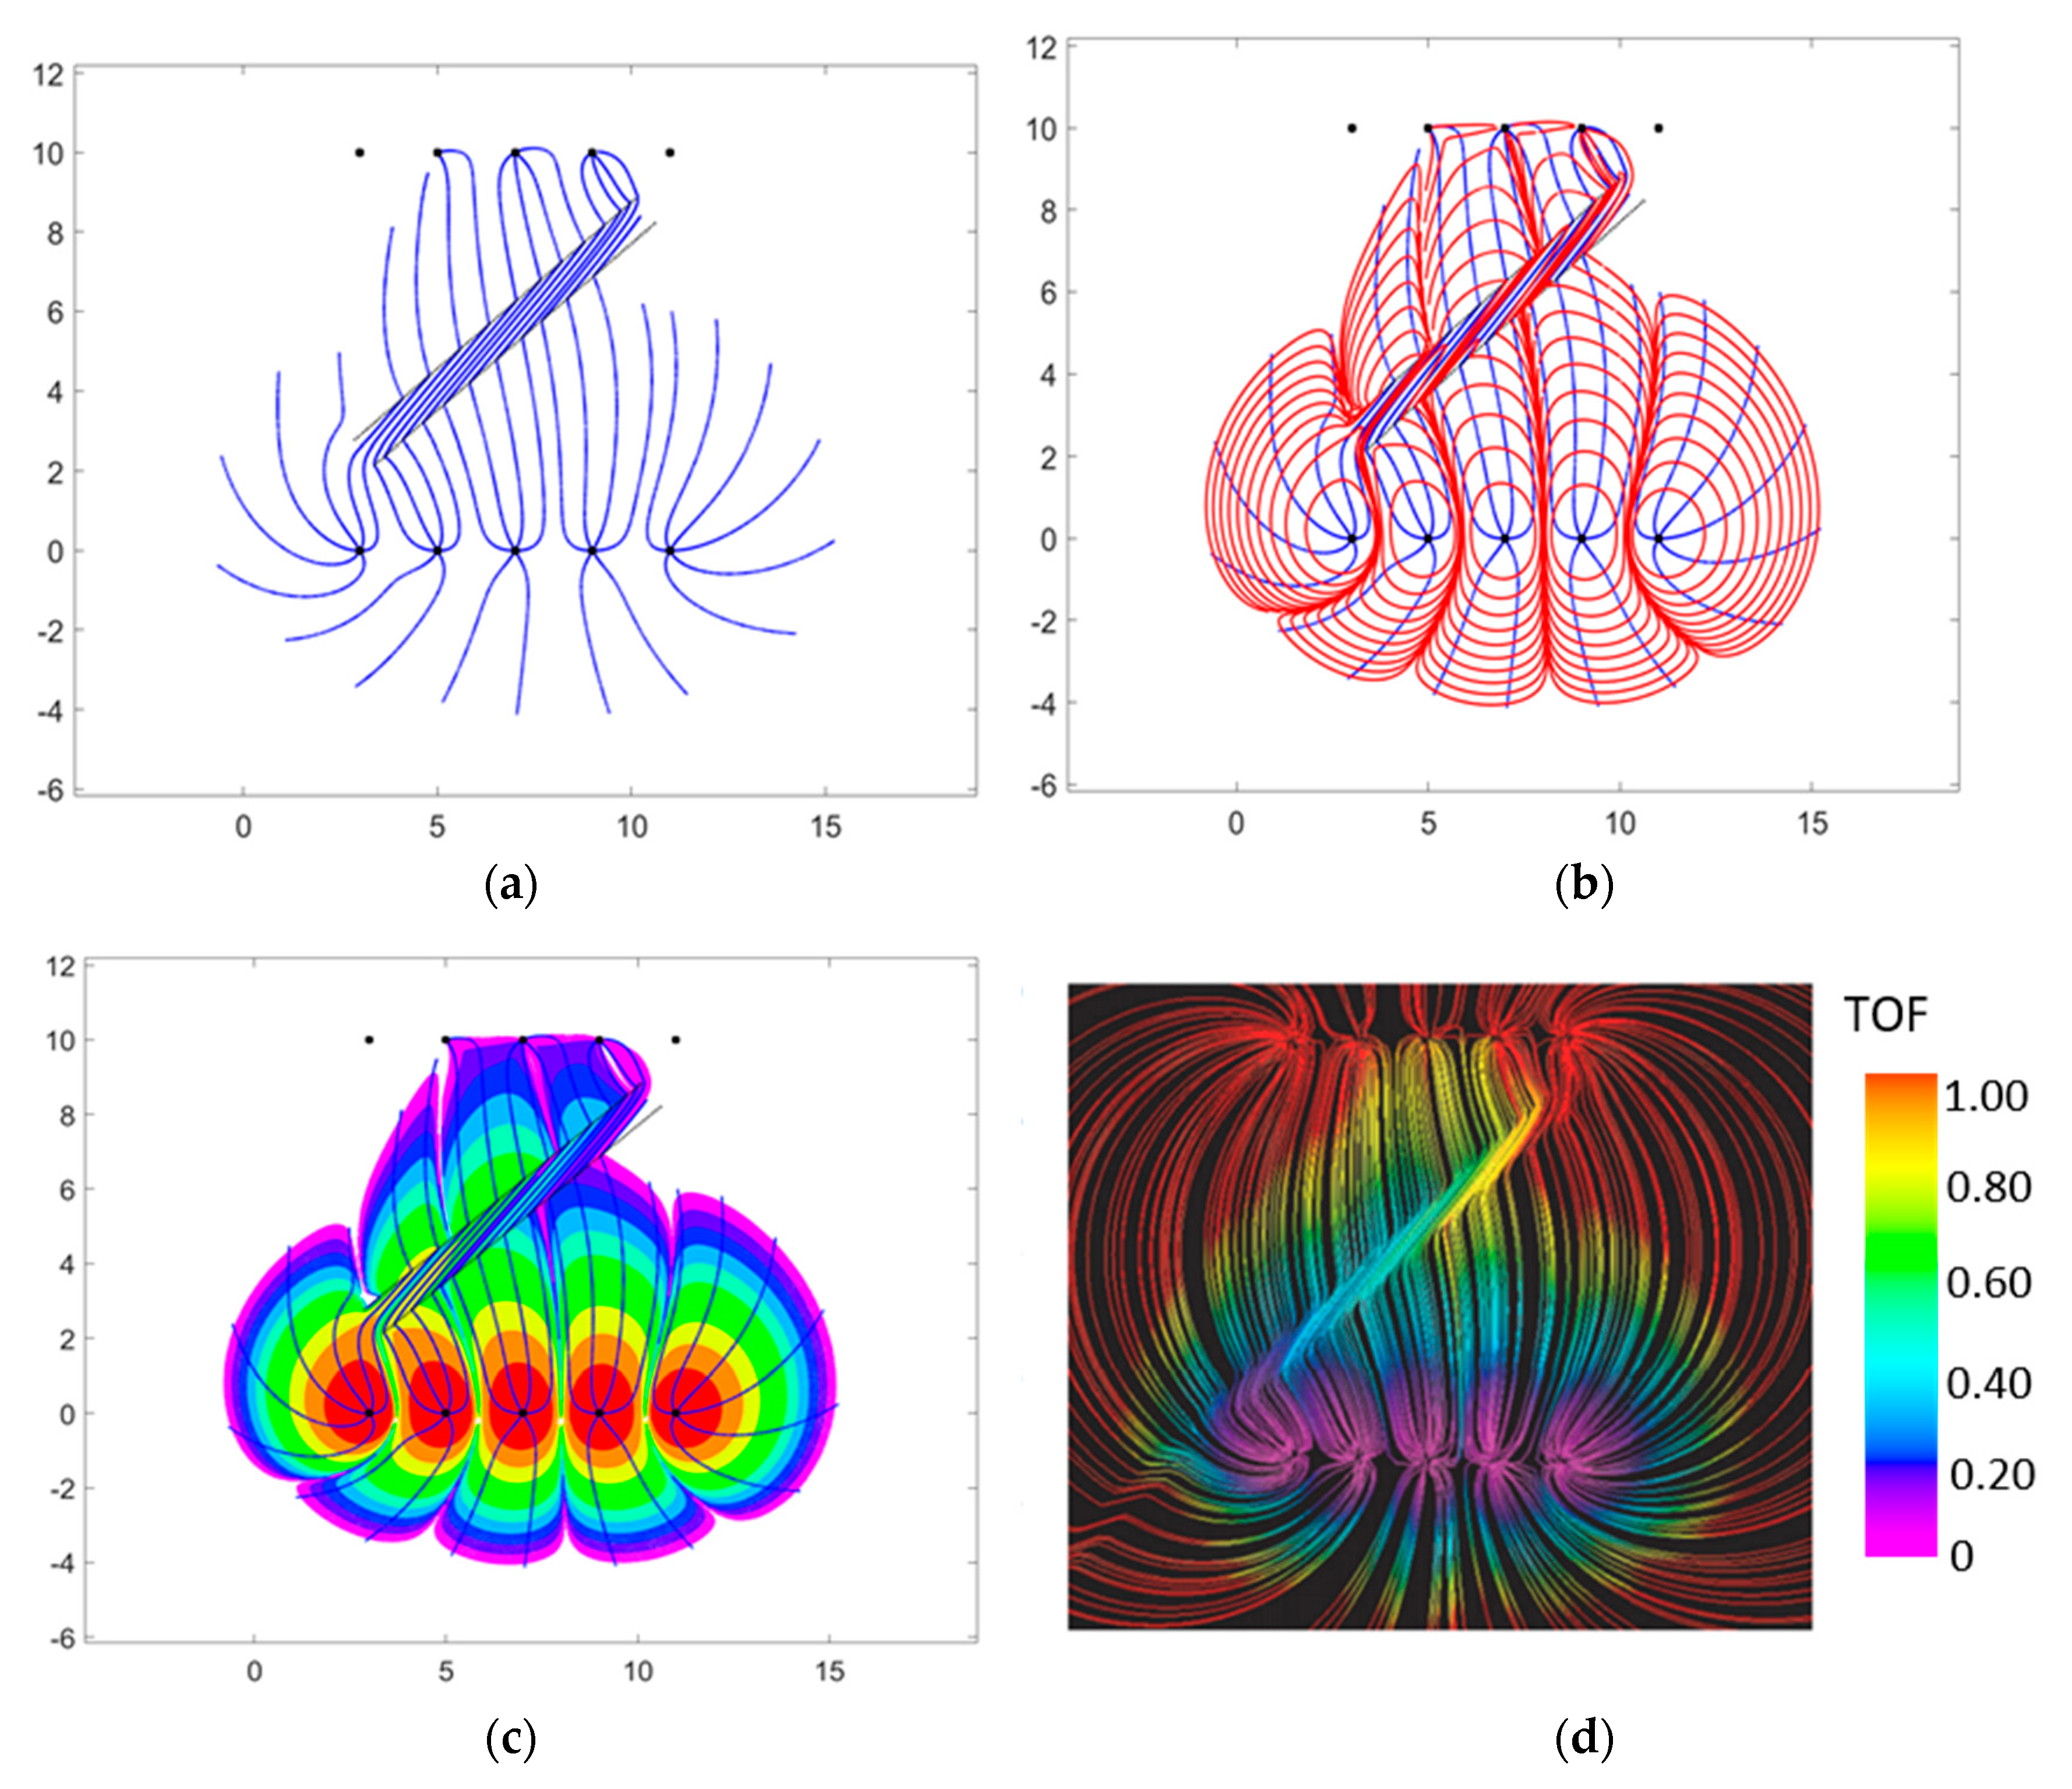
Figure 8a–c show the CAM models of a high permeability zone (a natural fracture zone due to shear with an increased permeability) placed in the model of the direct line drive. Instead of the high permeability zone (
Figure 6a), a fracture zone is placed obliquely between the injector and producer arrays (
Figure 6a,b). The exaggerated finite width of the fracture zone helps to visualize the redirection of the particle paths in the high permeability zone as predicted by the Law of Streamline Refraction [
31,
32]. The same flow and flooding patterns are reproduced in an Eclipse model after much cumbersome gridding (
Figure 8d). Close inspection of the two results reveals excellent matches between the streamline paths and the convective time of flight obtained by Eulerian tracking of tracer particles. Although the main focus of our brief review is on CAM results and capacity, we acknowledge that there are recent developments in the grid-based community that reduce the degree of cumbersome gridding [
33,
34,
35]
. 3.2.2. Case B—Impervious Fractures
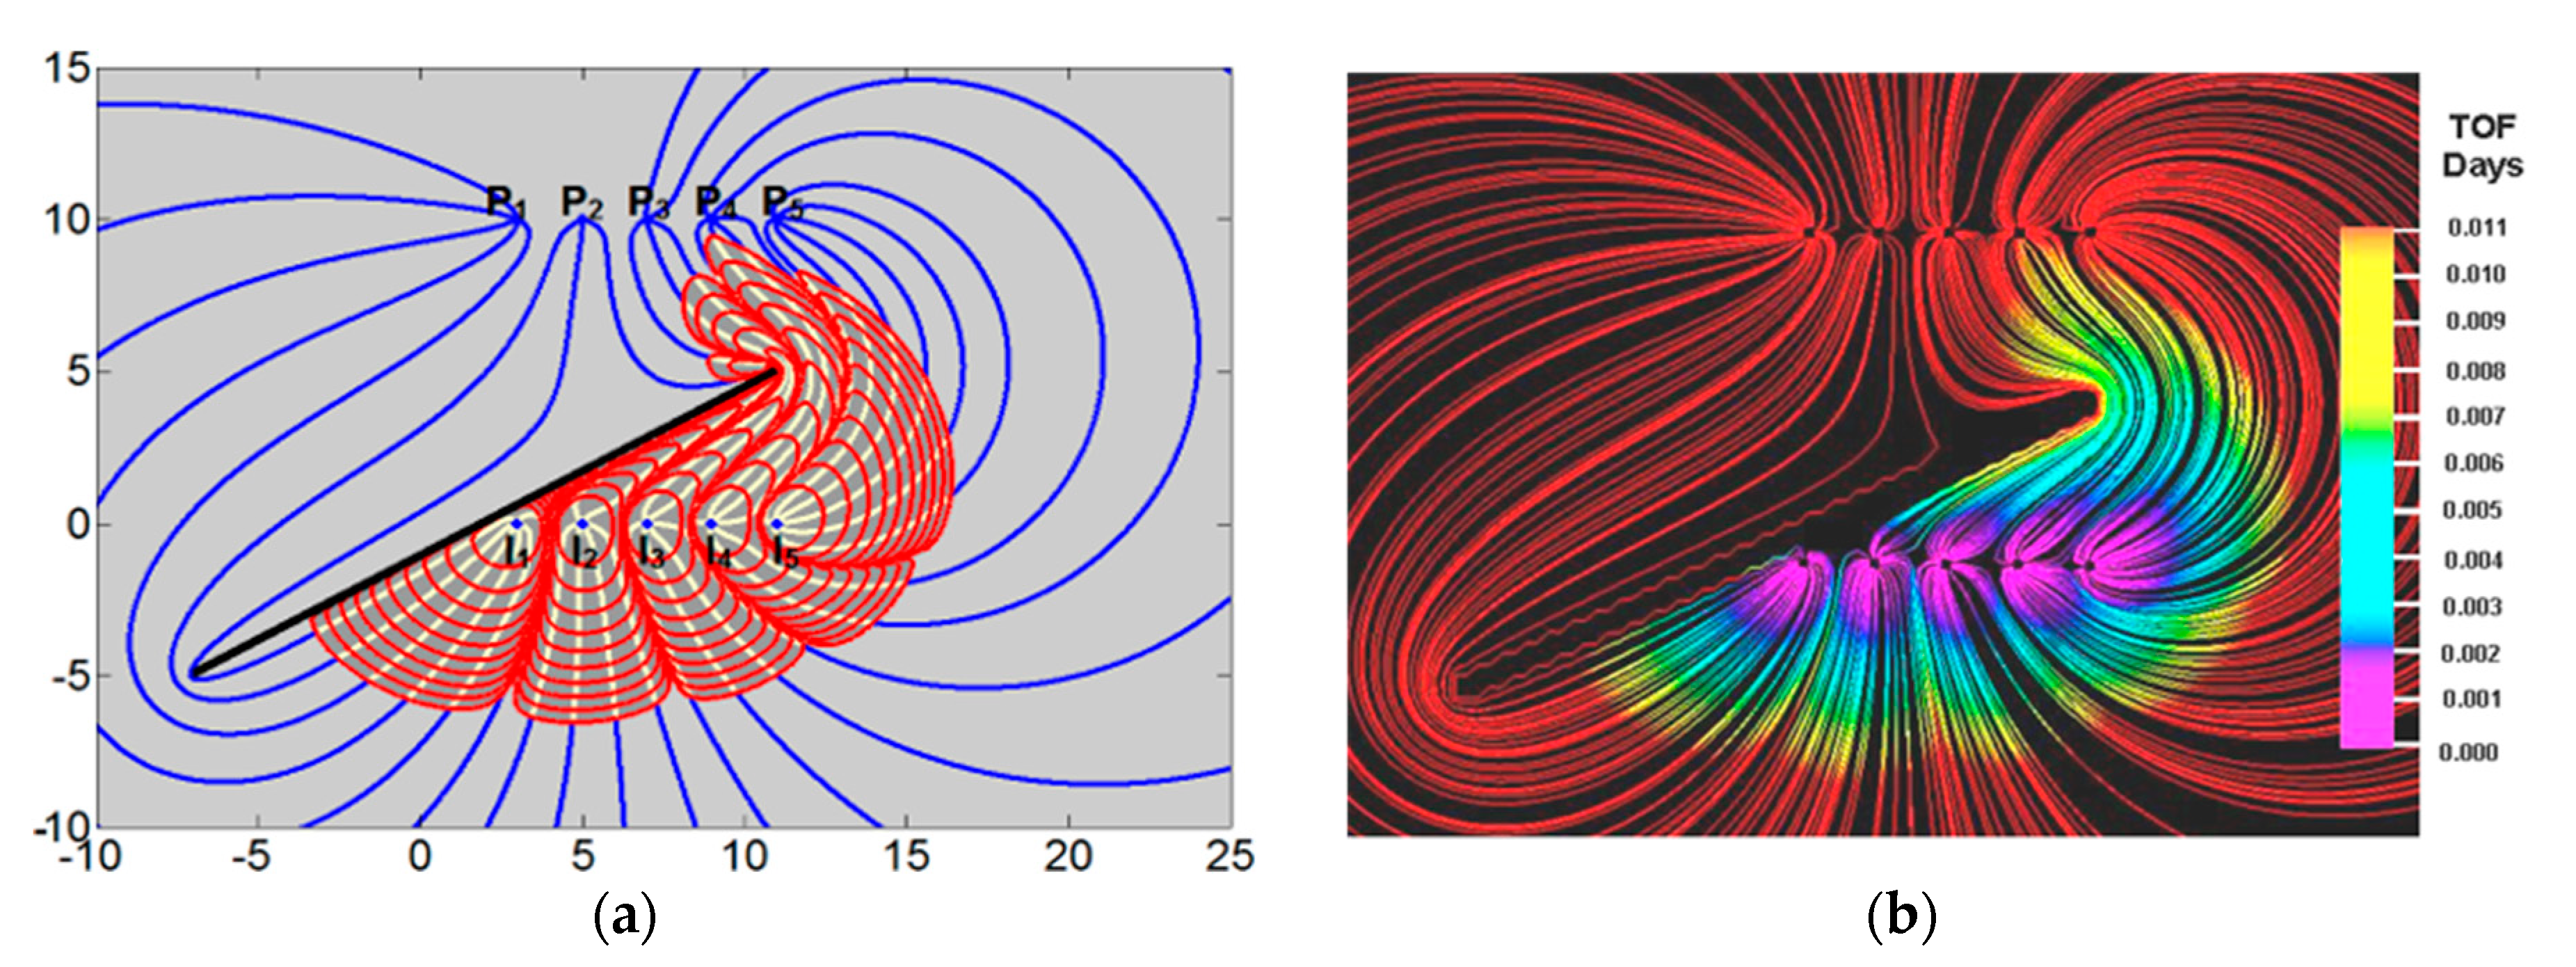
Impermeable fractures can be modeled most accurately by including images of no-flow boundaries using a Schwartz-Christoffel transformation (
Figure 9a). When an impermeable fracture blocks the flow in the reservoir it turned out to be impossible to adjust well injection rates to achieve equal water breakthrough in all producers [
26]. New producer wells would need to be drilled in the region that experiences stranded oil at the downstream side of the blocking fracture. Both the streamline paths and convective time of flight contours of the CAM model (
Figure 9a) and Eclipse model (
Figure 9b) are virtually identical. Additional CAM models for a large range of well patterns with impermeable fractures have been given in our earlier study [
2].
4. Benchmarking Pressure Field Solutions
The pressures in CAM models are obtained by solving and scaling the potential function due to all superposed flow elements [
5]. We compare the results from a CAM model to the results obtained from a discrete finite volume model. The MATLAB Reservoir Simulation Toolkit [
36,
37,
38,
39] was used to design simple examples of pressure deviations near a limited number of natural fractures. A fully resolved grid was first adopted where each fracture and matrix grid block are assigned a unique permeability. A fully resolved grid is more accurate than a dual porosity model to represent flow in naturally fractured reservoirs [
40,
41,
42]. However, a fully resolved technique is computationally intensive, and careful gridding is required in order to match the reported dimensions of the natural fracture(s). Thus, an embedded discrete fracture model (EDFM) with two-point flux approximation (TPFA) was implemented (after first verifying fully resolved pressure plot and EDFM, which gave perfect matches).
EDFM represents the fractures explicitly by defining the fracture and matrix grids independently, which allows for intricate fracture networks without the need for complex matrix grid conformal with each fracture for fully resolved solution [
39]. The complex fractures can be implemented in the conventionally structured grids without the need for a local grid refinement (LGR) around the fractures [
43]. The LGR is computationally efficient only to represent hydraulic fractures, but is resource intensive to represent numerous discrete elements such as the natural fractures [
44,
45,
46]. EDFM is based on a hybrid approach, where the dual-porosity model is used for the smaller fractures, and discrete fracture for the larger fractures [
47]. Initially developed for planar 2D cases, EDFM has been recently expanded for 3D models with obliquely dipping fractures [
48], for simulating the stimulated reservoir volume (SRV) to reduce the computational cost associated with LGR [
49,
50], and for assisted history matching in unconventional reservoirs [
51]. Thus, efficient modeling of fluid flow in the natural fractures is possible with EDFM, using a limited number of cells for the pressure field benchmark cases (
Figure 10a–c, top row).
The pressure field solutions obtained with the fast CAM approach (
Figure 10b,d,f, bottom row) closely match those obtained with EDFM. Although the pressures can be solved at infinite resolution by CAM, contouring of the pressures is fastest when gridded in our MATLAB code. The pattern of the pressure contours is nearly identical to those obtained by the independent EDFM method. Some minor mismatches of pressure occur at the fracture tips, which are artifacts of choices made about the spatial placement of branch cuts for integral solutions [
18].
5. Application to Hydraulically Fractured Wells
The previous sections we believe conclusively verified the accuracy of fast CAM solutions for modeling fluid flow in hydrocarbon reservoirs. The method is particularly powerful for modeling, in considerable detail, the drained rock volume (DRV) in hydraulically fractured wells, with and without natural fractures. The convergence of particle paths due to discrete natural fractures with high permeability can be modeled by CAM using field-based well rates with both assumed natural fractures [
8,
13,
18,
52] as well as fractures based on fracture diagnostics [
14].
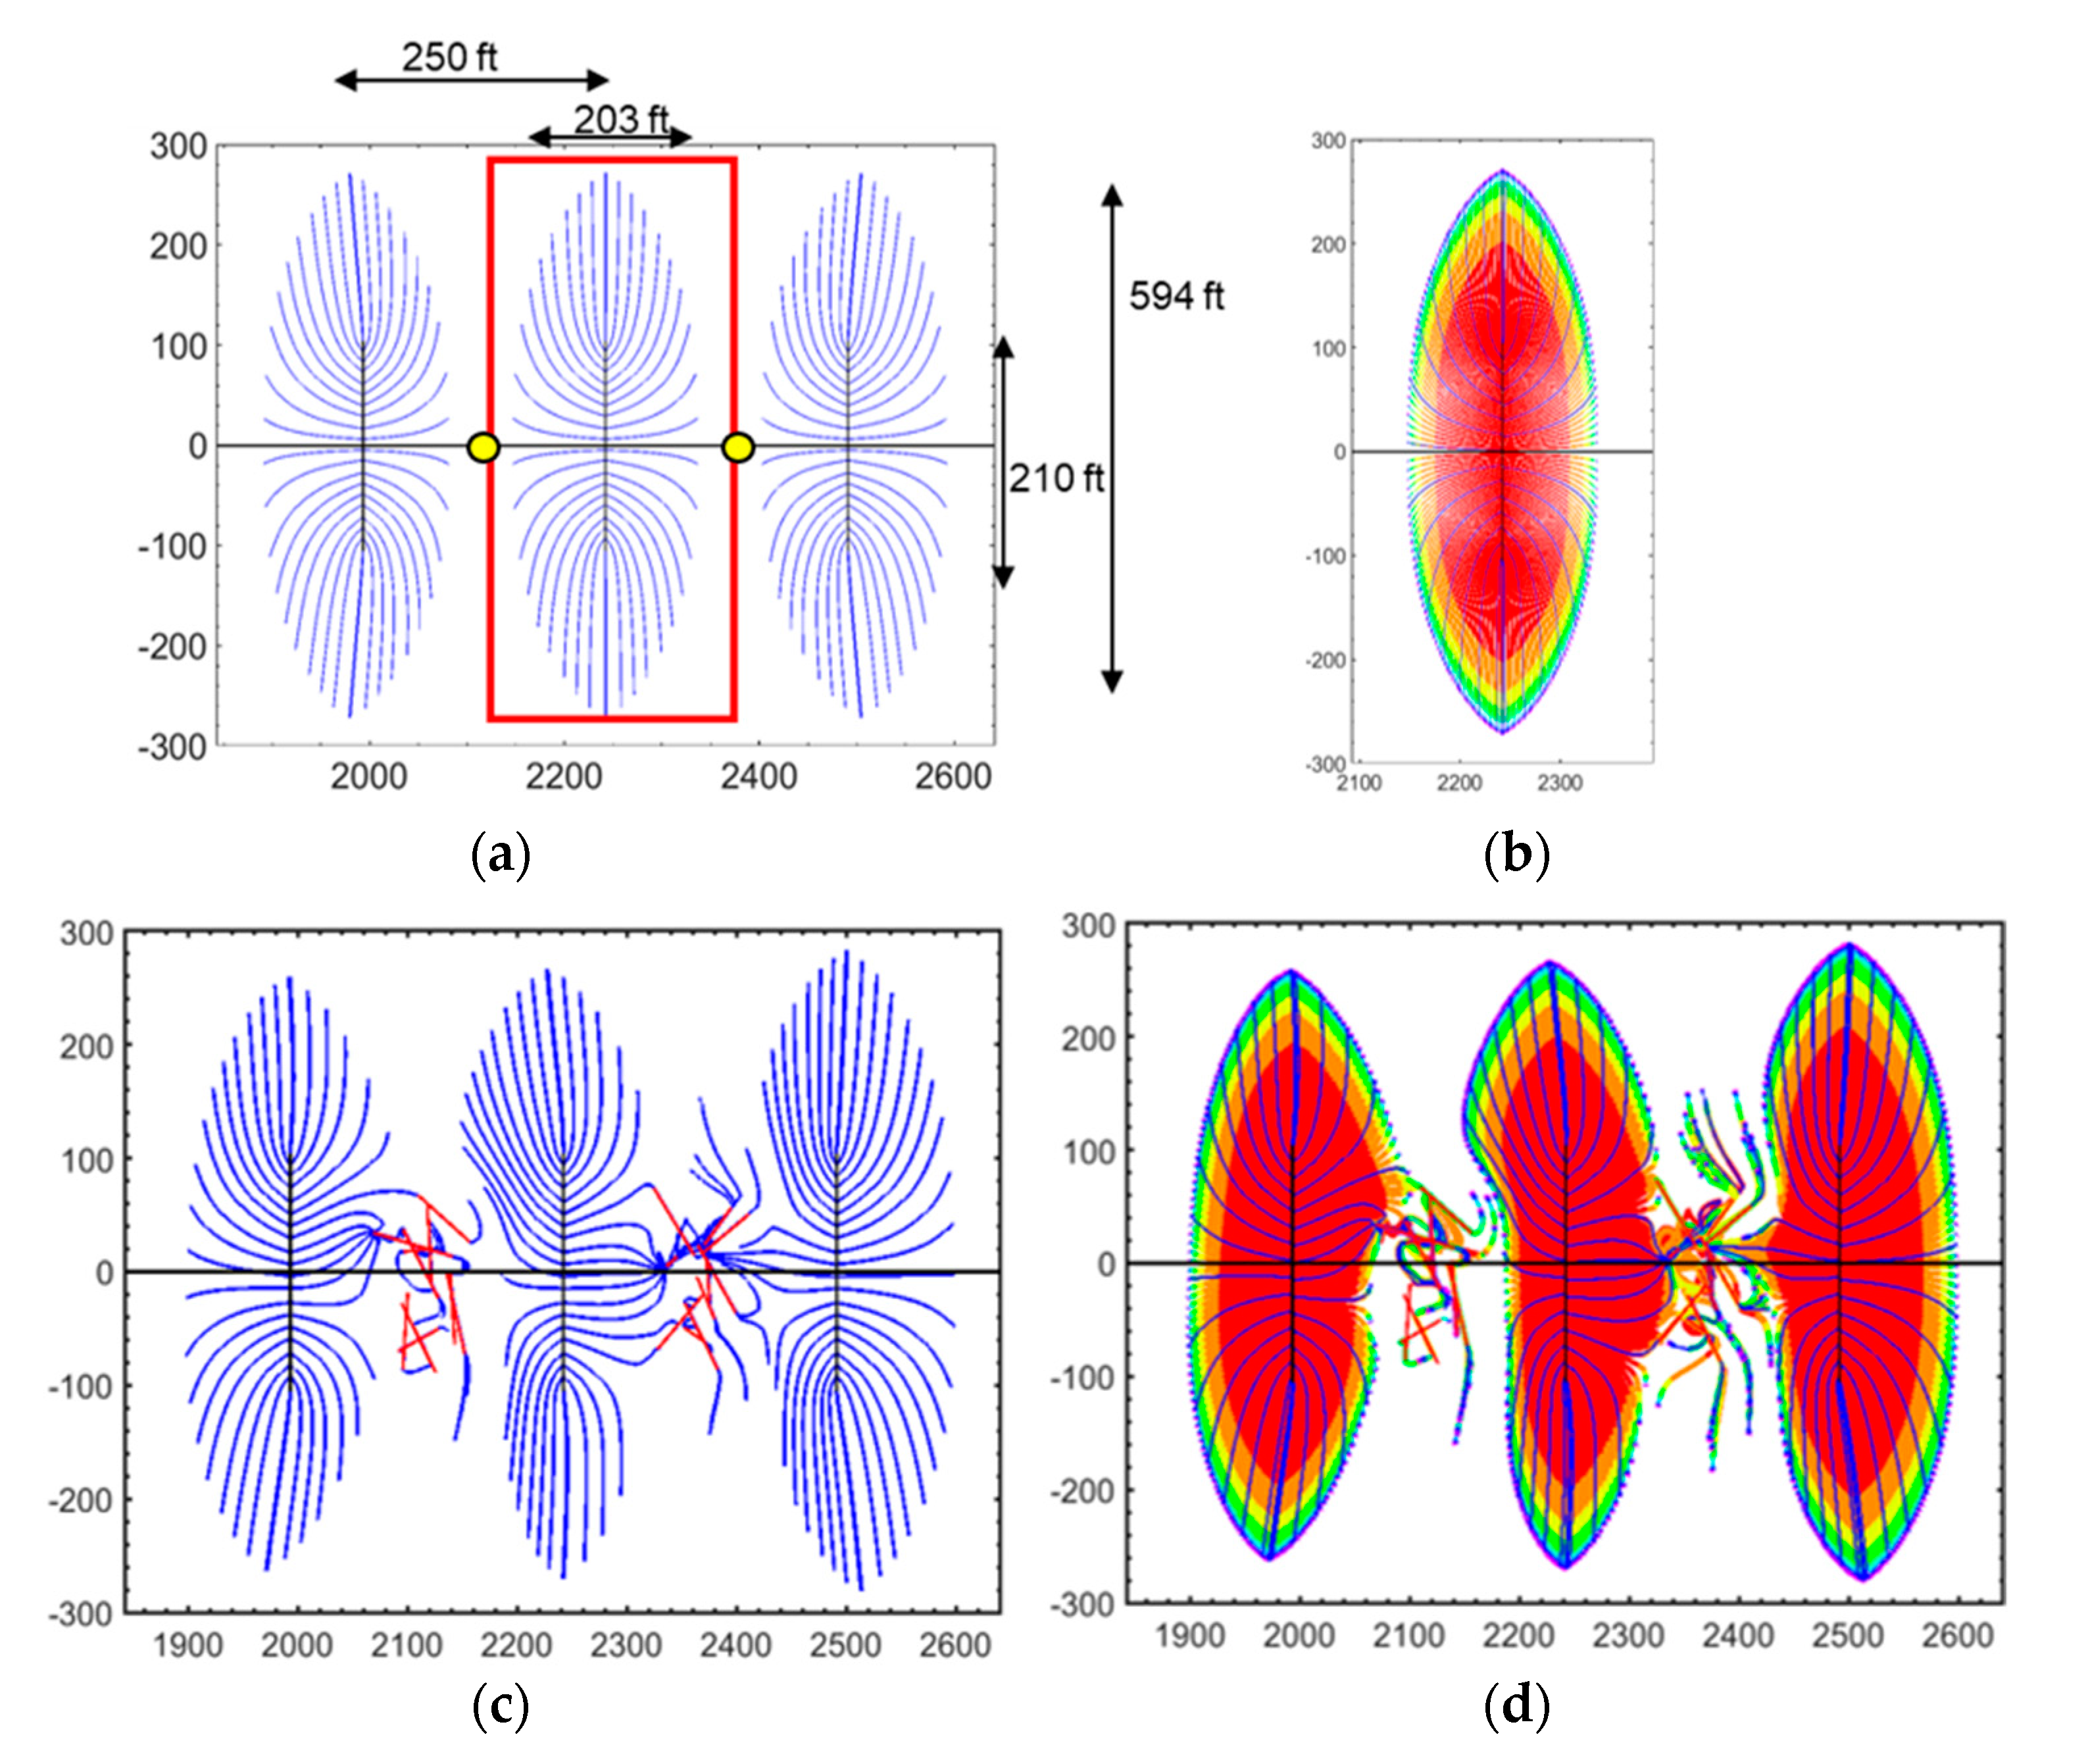
Figure 11a–d show detailed examples of fluid withdrawal envelopes around hydraulic fractures constructed by computing the convective time of flight along each streamline. The well modeled (using public data of the Texas Railroad Commission) is Autobahn 34–117 1 H (Delaware Basin, West Texas), which has 17 fracture stages with a spacing of 250 ft and lateral well length of 4235 ft [
53]. The individual hydraulic fractures have rates allocated by the history matched decline curve of the well.
Figure 11a shows the migration path of hydrocarbons toward three central hydraulic fractures placed transverse to the horizontal well. Flow stagnation points occur between the fractures (yellow dots). The flow separation surfaces have been studied in detail elsewhere [
5]. The DRV around the central fracture is given in
Figure 11b. Much of the DRV region is drained in the first three years (red shaded region). The peripheral zones are drained much slower due to the rapid decline of the well (see decline curve details [
53]).
The CAM models in
Figure 11b,c show the impact if natural fractures were to occur near the fracture stages. Two clusters of natural fractures (red) are assumed in between the hydraulic fractures each comprising 10 discrete fractures. Particle paths (blue) are for 30 years of simulation. The TOFC are marked by color bands, each representing a 3-year production increment. The impact of natural fractures on both the flow paths (
Figure 11c) and DRV (
Figure 11d) can be compared to those in
Figure 11a,b, which assumed no natural fractures are present in the reservoir. The presence of natural fractures shifts the DRV and results in hydraulic fracture interference (
Figure 11d) as compared to the result without natural fractures (
Figure 11b).
The conclusion is that high conductivity natural fractures will increase flow interference between hydraulic fractures. Likewise, natural fractures between adjacent wells will not only cause pressure communication [
51], but also cause the DRV shape and location to shift [
8,
14].
6. Discussion
Previously, the potential of CAM models (which are based on potentiometric theory) was first explored in streamline application to oil fields [
54], which were then computerized in the 1970s in several studies [
20,
55], and later in other studies [
16,
17]. The prior studies never unlocked the full potential of CAM due to (1) lack of computing power, and (2) no coupling of CAM with Eulerian particle tracking. The pairing of CAM with Eulerian particle tracking was first realized by Weijermars [
1]. In addition, the introduction of new algorithms to model flow in natural fractures [
4], solution of certain branch cut effects [
18], and scaling of permeability contrast [
13] provided crucial steps that are the basis of our current modeling capacity.
6.1. Model Strengths and Limitations
Obvious strengths of the CAM model for flow simulations are time gains due to (1) no need for gridding, and (2) high computational speed, while preserving the high resolution of closed–form solutions. The codes developed by our research group are as of yet proprietary, but may be made public at some time in the future. The method makes a number of simplifying assumptions. For example, fluid is assumed incompressible in the reservoir (but not in the fluid allocation based on well rates, where compressibility is actually accounted for) and remains in single phase flow.
Capillary effects are not accounted for neither are bubble point effects for highly saturated oil. Multiphase flow is inherently non-linear, which the linear superposition of CAM cannot account for unless some drastic localized scaling of flow would manage to correctly capture the pore-scale flow effects well enough to allow a verifiable globalized flow model. Initial efforts for study of two-phase flow and capillary effects with CAM were made to suggest that domainal oscillation functions may provide the required average velocity (or fluxes) in the pore-network model for use in a continuum model [
56]. The oscillation function would need to be scaled on the basis of micro-fluidic pore network models or other physical models of the natural system to validate the results.
Prior limitations of CAM included the impossibility to account for heterogeneity, which we conclusively solved by developing new algorithms (
Figure 6,
Figure 8,
Figure 9,
Figure 10 and
Figure 11). The method works fastest in unbounded reservoir space, but can be adapted to account for finite reservoir space (
Figure 2). The particle tracking enables streamline studies and nearly instantaneous optimization of well rate due to lack of grid cells (
Figure 7). The convective time of flight contours can be constructed by connecting particles after certain flow periods (
Figure 2,
Figure 6,
Figure 7,
Figure 8,
Figure 9,
Figure 10 and
Figure 11). The visualization of drained rock volume around hydraulically fractured wells has revealed the importance of focusing on the convective time of flight. Pressure depletion plots alone (such as provided by CAM in addition to DRV) and as used in fast marching methods [
57] cannot show the DRV.
Pressure depletion models are representative for the diffusive time of flight, but hydrocarbon molecules moving in the reservoir space outside the DRV will never reach the well [
58]. The lag between the tracer time of flight and the diffusive time of flight has been noted before [
27], but visualization of the DRV is first enabled by CAM. No other method has visualized the DRV before. The strength of CAM is that it allows visualization of the DRV at high resolution without any gridding effort.
One major limitation is that CAM models hitherto are limited to 2D flows. Quasi-3D flow solutions are possible by collocating 2D flow planes into 3D envelopes of the DRV [
59]. Full 3D expansion of 2D complex potentials is theoretically possible but becomes intricate and the computational time gains over gridded methods will likely vanish, but 3D CAM should not be prematurely be dismissed.
6.2. Future Model Strengths and Limitations
CAM models are only in a nascent stage of their development, yet are capable of modeling flow in fractured porous media with high accuracy and speed, while saving cumbersome gridding time. Visualization of the DRV became possible by formulating hydraulic fracture strengths that are indexed to proppant concentration. One of our studies used fracture treatment pump rates from a field case (Wolfcamp well, Midland Basin) to history match with a fracture propagation simulator the hydraulic conductivity of the created hydraulic fractures [
59]. The latter study partitioned discrete segments of the hydraulic fractures corresponding to the hydraulic conductivity obtained by the fracture treatment history match. However, a continuous formulation is possible, which we are currently developing.
