Article

Bulbous Pier: An Alternative to Bridge Pier Extensions as a Countermeasure against Bridge Deck Splashing

by
Moses Karakouzian
1,
Amilcar Chavez
1,
Donald Hayes
2 and
Mohammad Nazari-Sharabian
1,*
1
Department of Civil and Environmental Engineering and Construction, University of Nevada Las Vegas, Las Vegas, NV 89154, USA
2
U.S. Army Engineer Research and Development Center, Vicksburg, MS 39180, USA
*
Author to whom correspondence should be addressed.
Fluids 2019, 4(3), 140; https://doi.org/10.3390/fluids4030140
Submission received: 27 June 2019 / Revised: 16 July 2019 / Accepted: 22 July 2019 / Published: 24 July 2019

Abstract

:
Bridge deck splashing causes deterioration to a bridge’s structure and renders the bridge unsafe for motorists and pedestrians. The traditional countermeasure for bridge deck splashing has been pier extension. Pier extensions move the pier wave and the associated splash away from the bridge deck, but retrofitting existing bridges with pier extensions is costly. This research evaluates the use of a bulbous added to the pier as an alternative to pier extension. A bulb placed on the upstream side of a bridge pier affects the splashing. The energy in the passing water is redirected from the impact by streamlining the flow. This study proposes a mathematical model for bulbous pier design, based on a model used for a mono-hull ship. Under the mono-hull model, the bulb length extends, reaching the region where viscous resistance is dominant. Unlike wave-making resistance, which is achieved through modeling, the proposed model does not require modeling to calculate pier wave reduction.

1. Introduction

The interaction of supercritical water flow with a pier nose creates a pier wave, which might cause the flowing water to be projected onto the bridge deck. This phenomenon is called bridge deck splashing, and can endanger motorists and pedestrians on the bridge. A solution to this problem is the structural modification of the pier by extending the pier in front of the bridge structure; however, this method is costly. Stonestreet et al. (1994) provided an overview of the extensive physical model studies of the Los Angeles and Rio Hondo rivers [1]. The authors focused on innovative designs that significantly increased the capacity of existing bridges subject to discharges greater than the design discharge. The idea was to extend bridge piers upstream, thereby causing the flow to pass through critical as it accelerates within the pier constriction. Figure 1 illustrates the general profile of the water-surface response to extension of the bridge piers. Illustrations of the effectiveness of these pier extensions are provided in the pictures in Figure 2. The pictures from Hite et al. (1993) are photographs of the 1:50-scale model of the Rio Hondo River [2]. Clearly, the pier extensions eliminated the runup and splash on the bridge deck.
In ships, a bulbous bow is used to mitigate ship deck splashing and reduce propulsion power. A bulbous bow is a flow-modifying feature on a ship’s bow, which is considered a countermeasure against ship deck splashing [4]. It creates a wave system that interferes with the ship’s natural wave system (Figure 3), which leads to a near-zero wave at the hull-bulb intersection. The water waves created by a moving ship are similar to the water movement around a partially submerged bridge pier. Therefore, the concept of a bulbous bow can reduce the energy available for a pier wave, and as a result, can work as a countermeasure against bridge deck splashing.
The study of bulbous bows for high-speed ships has been documented for ship speeds up to 55 knots (92.83 ft./sec.). In the following, the literature review focuses on studies that investigated the effect of bulbous bows in ships with speeds similar to the water velocity in open channels under supercritical conditions. In 1978, Kracht studied the effect of a bulb in relation to ship movement, and concluded that the power required to move a ship is directly related to the total hull resistance [5]. He also showed that the bulb creates a wave system that interferes with the hull wave system. The bulb produces a water system with smaller wave heights, which results in a smaller wave-making resistance, and consequently, in smaller total resistance (Rt). The wave-making resistance is defined as the resistance caused by waves while the ship is moving, while the wave resistance is caused by ocean waves hitting the hull [6]. A ship’s speed, however, plays an important role in measuring the total resistance. The United States Naval Academy (2015) describes a ship’s total resistance components in relation to the ship’s speed, where the wave-making resistance (Rw) becomes more relevant as the ship’s speed increases [7].
For a multi-pier bridge, it is important to determine if a bulb concept is viable, as in similar ship-related cases. The ship hull closest resembling a multi-pier bridge is a catamaran. Yun and Bliault (2012) studied the Small Water Plane Twin Hull Catamaran (SWATH), which is able to reach supercritical flow velocities. The authors found that for these ships, Rt marginally decreases when the ship is equipped with a bulbous bow [8]. The marginal Rt reduction is a consequence of two competing forces: viscous resistance (Rv) increases, while Rw decreases, due to the increase in bulb length. Moreover, Ghani and Wilson (2009) correlated the cross-section of a bulb (ABT) to the bulb’s wave horizontal size, a bulb’s length (LPR) to the bulb’s wave phase in relation to the hull wave, and the volume of a bulb to the wave’s amplitude (Table 1) [9]. Their findings provide guidance in sizing a bulbous pier.
The previous studies on ship bulbs concluded that a bulbous bow reduces the Rt under similar conditions as a pier in an open channel. A long bulbous bow reduces a ship’s non-dimensional maximum wave height (Hnd). The reduction of Hnd can be compared to a pier’s wave ratio. Therefore, the bulb that causes more reduction in Hnd will be considered as the basis to determine initial bulbous pier geometry. This study focuses on pier wave height and splash reduction using a bulb attached to a bridge pier. The specific objectives of this research are as follows:
  • Performing experiments in order to understand the impact of a bulbous on pier wave height;
  • Developing an analytical model that predicts the effects of a bulbous pier on pier wave height based on the bulb’s geometry and location.

2. Materials and Methods

2.1. Theoretical Formulation

A bulb wave (Bw) is the difference between non-bulb (PLnb) and bulbous (PLbb) pier water levels (Figure 4). A bulb can be analyzed as a standalone ship, where the bulb hull resistance is proportional to Bw. The addition of a bulb to a pier reduces pier wave height by removing energy from the water, thus making this energy unavailable to contribute to PLbb.
A ship moving through water is similar to a pier in an open channel. They both create waves as the water moves around them. According to ship wave theory, the energy in a wave is proportional to the square of the wave height [10]. Therefore, if the wave height doubles, the energy required for wave-making becomes four-fold (Equation (7)). This is the reason that wave-making is the main component of a ship’s total resistance.
In ship design, Rw becomes more important than the Rv when a ship’s wavelength reaches a value equal to the ship’s length. The bulb wavelength (Lw) is defined by Equation (8) [10]:
R w = f ( C w , v 4 )
L w = 2 π v 2 g
where v is the flow velocity, g is the gravity acceleration, and Cw is the wave-making coefficient. Since Bw is a consequence of a bulb’s total resistance, an increase in the magnitude of Bw will be directly related to a decrease of the PLbb and, as a consequence, to a decrease in deck splashing. The power required to move a ship is directly related to the total hull resistance; the hull resistance is the force that the ship experiences opposite to the motion of the ship as it moves. The total hull resistance (Rt) has three main components:
R t = R v + R w + R a
where Rt is the total resistance (in pound force), Rv is the viscous resistance, Rw is wave-making resistance, and Ra is the air resistance. In piers, the air resistance is negligible; thus, Equation (9) can be rewritten as:
R t = R v + R w
The total bulb resistance can be calculated as:
R t = 0.5 ρ BB as ( C v + C w ) v 2
where BBas is the submerged bulb area, and Ct is the total resistance coefficient (Ct = Cv + Cw). Moreover, Cvt can be defined as:
C vt = 0.075 log 10 ( Re 2 ) 2
where Cvt is the viscous resistance tangential to the bulb, and Re is the Reynolds number.
Re = vL bbs k
where Lbbs is the submerged bulb’s length, and k is the kinematic viscosity (1.2260*10−5 ft2/s for fresh water). Therefore, Cv will be:
C v = C vt + C vt k n
where kn is the viscous perpendicular resistance coefficient, and is defined as:
k n = 12 ( V bb Y s B d L bbs )
where Vbb is the bulb’s volume, Bd is the bulb’s diameter, and Ys is the bulb’s submerged depth. For the same testing conditions (flume flow and flume slope), attaching the bulb to a pier changes the water’s velocity. The PLnb can be calculated using Equation (16) (total energy equation). Equation (16) assumes that the water’s energy will be transferred to the pier wave and then into PLnb.
PL nb _ calc = E = y h + V 2 2 g
where E is the total energy, Yh is the hydraulic depth in ft., v is the water velocity, and g is gravity acceleration.
Since Bw is a function of Rt, it shall have two components:
B w = B wv + B ww
where Bwv is the viscous bulb wave, and Bww is the wave-making bulb wave. Since the bulb takes energy from the flow, the flow velocity at the end of the bulb will be less than the channel flow velocity. This reduced velocity is responsible for Bwv and Bww. The practical bulbous lengths are not long enough to reach the bulb’s wavelength values, making the viscous resistance the dominant component. To transfer the bulbous pier model’s dimensions into a full-size bulbous pier, the following rules apply:
  • The Froude number of the model (Frm) is the same as the Froude number of the flow around the pier (Frp).
  • The wave-making coefficient of the bulb model (Cw) and the bulb (Cwp) are the same.

Viscous Resistance Error

In a ship, the use of the Froude number to scale the model to a full-size bulb introduces a great deal of error—mostly regarding viscous resistance—due to the fact that the water density cannot be scaled [11]. The theory on viscous resistance error mitigation in ships assumes that the force applied to the hull is parallel to the ship’s waterline. This is not the case in bulbous piers, where the pier under the bulb creates forces perpendicular to the bulb, and in the opposite direction to the water flow. One method to mitigate the viscous resistance error is to increase the model’s surface roughness. In this study, in the bulb model, the surface roughness was increased in a 3D-printed model, with layers perpendicular to the flow. The proposed full-size bulb was built out of commercial steel pipe with a Manning’s roughness coefficient of 0.012 because the closest material to the 3D-printed model was a corrugated pipe with a Manning’s roughness coefficient of 0.022.

2.2. Bridge Selection

Since splashing was observed in the Broadbent Boulevard box culvert at Duck Creek, Las Vegas, during flash floods, this bridge was selected to evaluate the applicability of the bulbous pier concept (Figure 5). Table 2 shows some information on the flow, pier, and channel geometry provided by the Clark County Regional Flood Control District [12].
A comparison between the water velocity around Duck Creek Bridge pier and that of high-speed ships indicated that a bulbous pier falls into the speed ranges used for a bulbous bow. Table 3 compares speeds and Froude number values for high-speed ships and the water velocity around Duck Creek Bridge pier in Las Vegas, Nevada.

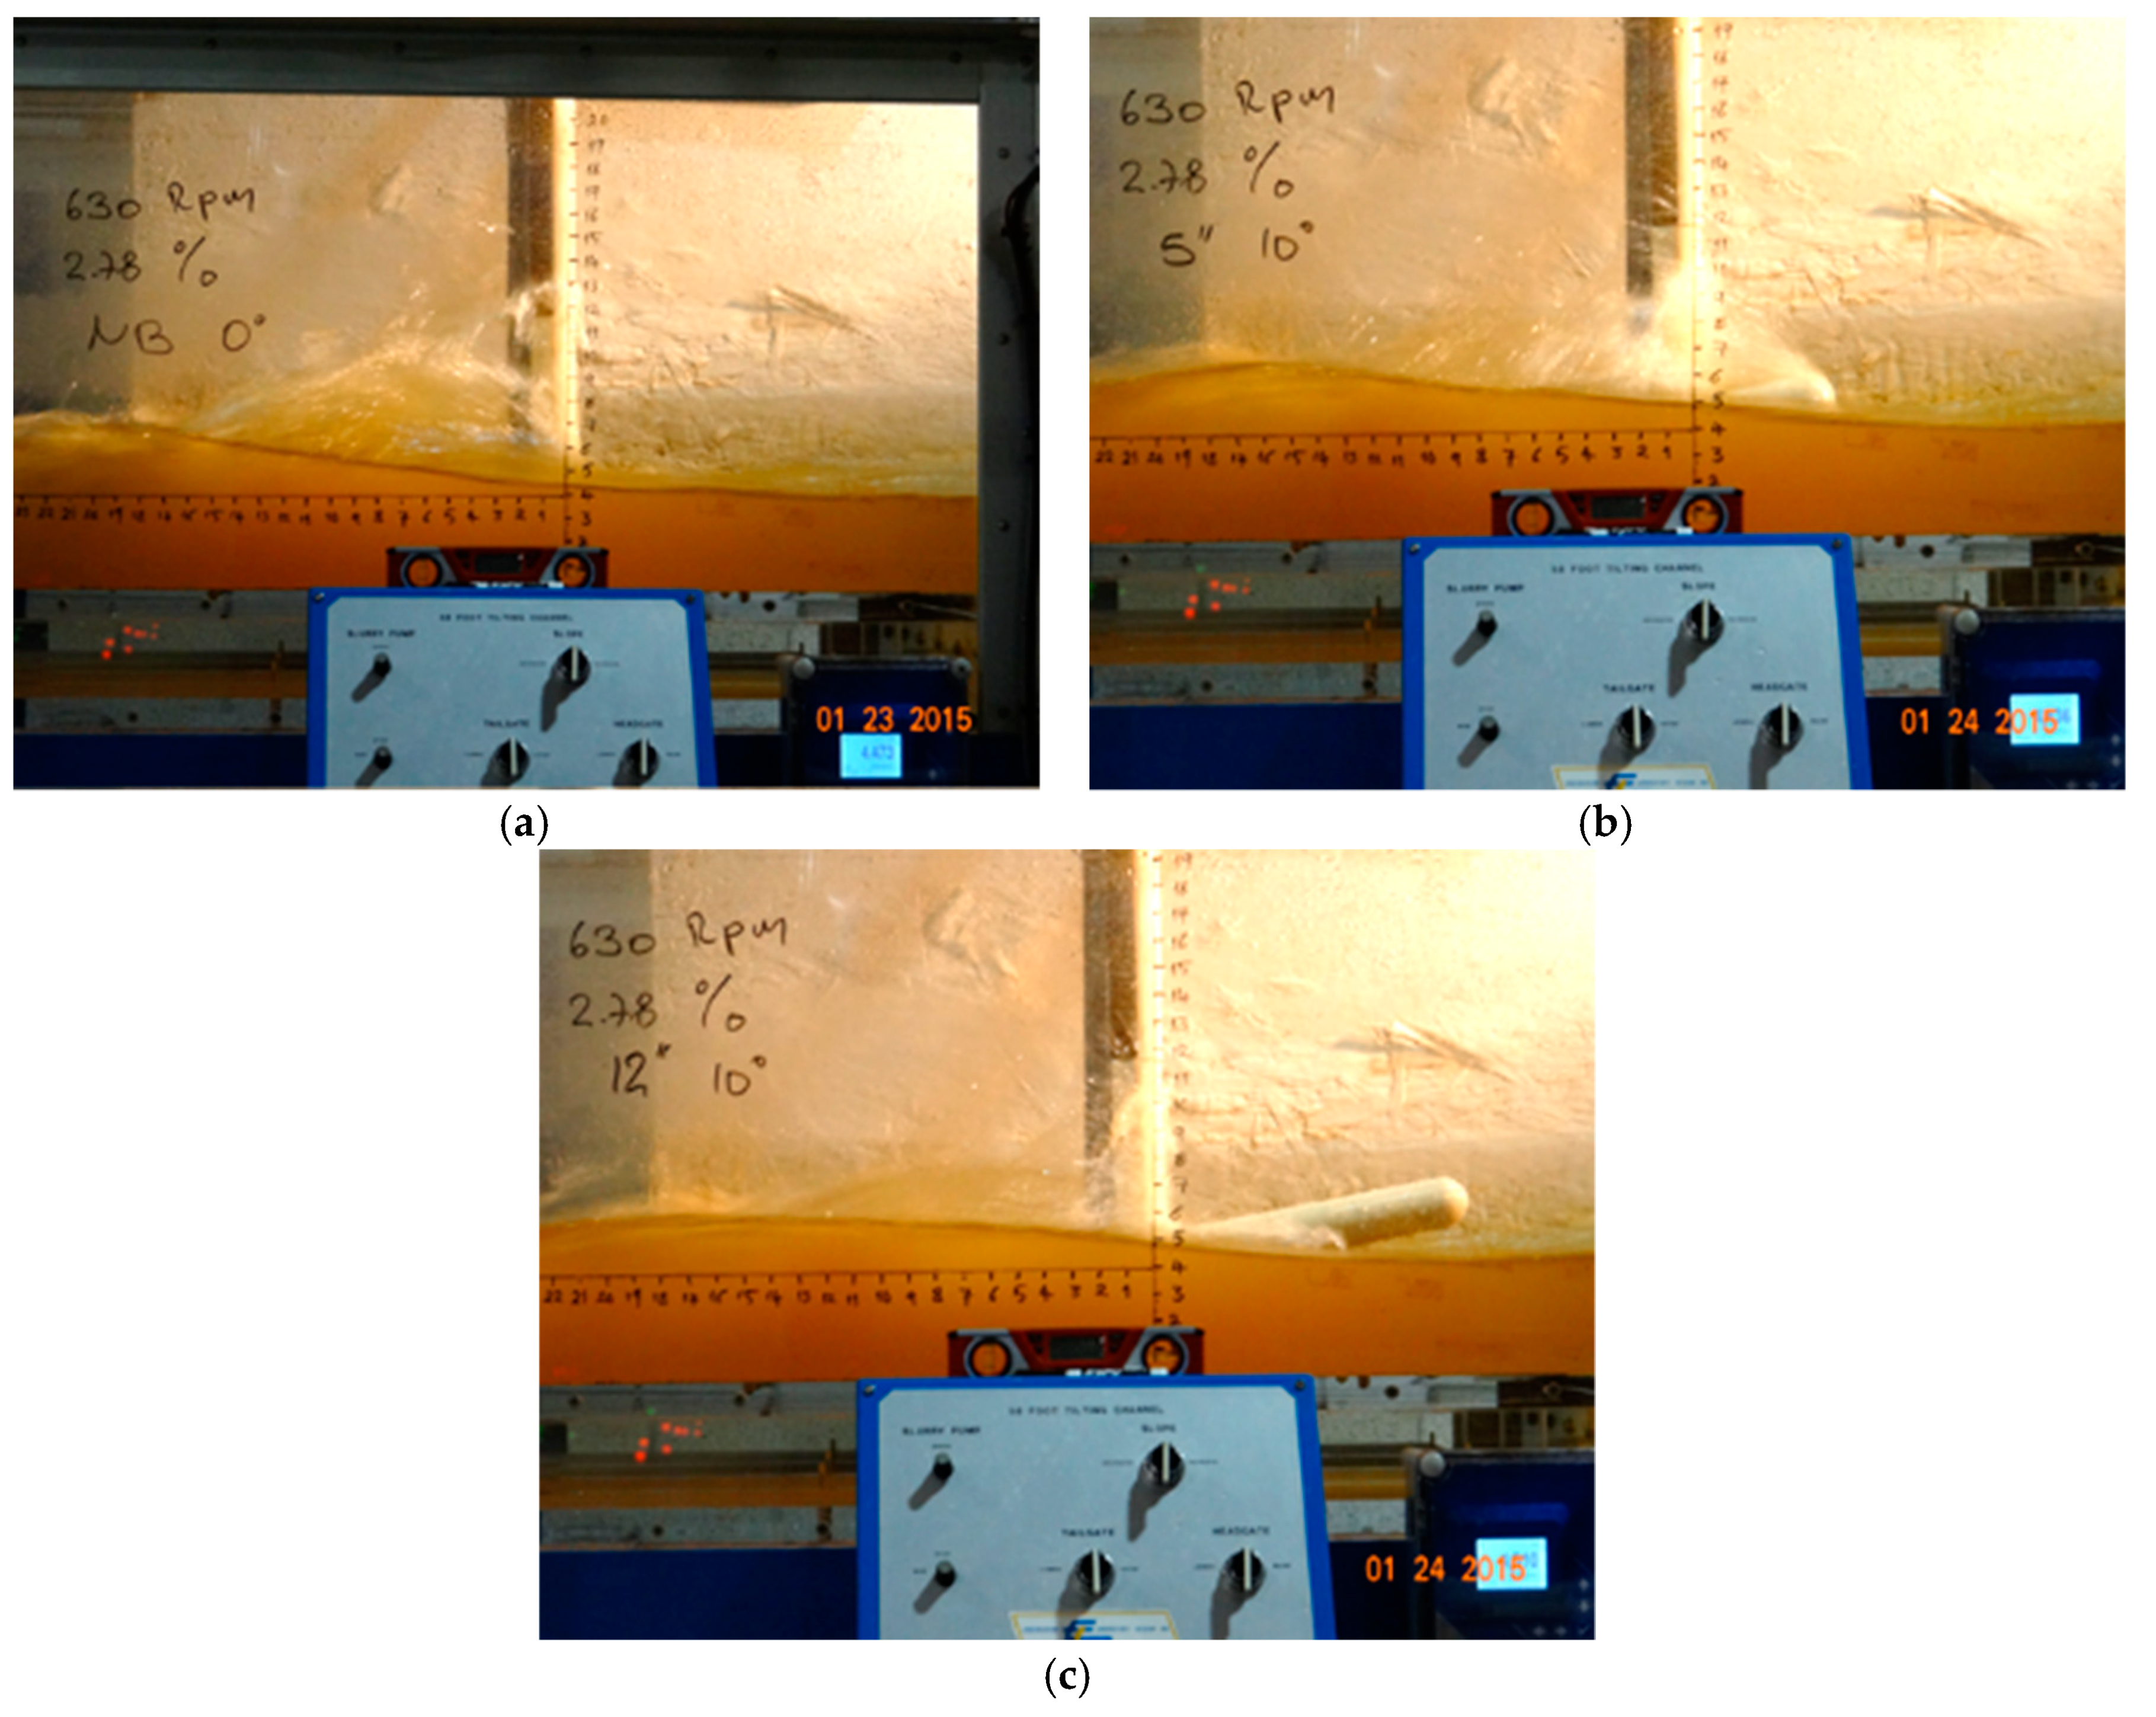
2.3. Flume Testing Plan

The experimental tests were performed in a flume at the University of Nevada Las Vegas (UNLV), and the test plan consisted of the following phases:
  • Verifying the flume Manning’s roughness coefficient
  • Obtaining the bulb optimal submerged depth
  • Testing twelve bulb models for eight steady-state conditions in the flume (slope and the pump RPM), with the maximum hydraulic depth (Yh) of 0.375′
The UNLV flume instrumentation consisted of a pump RPM meter, a flume slope meter, and a magnetic flow meter located in the pipe feeding the flume. For the bulbous pier testing, new instrumentations were added to the flume:
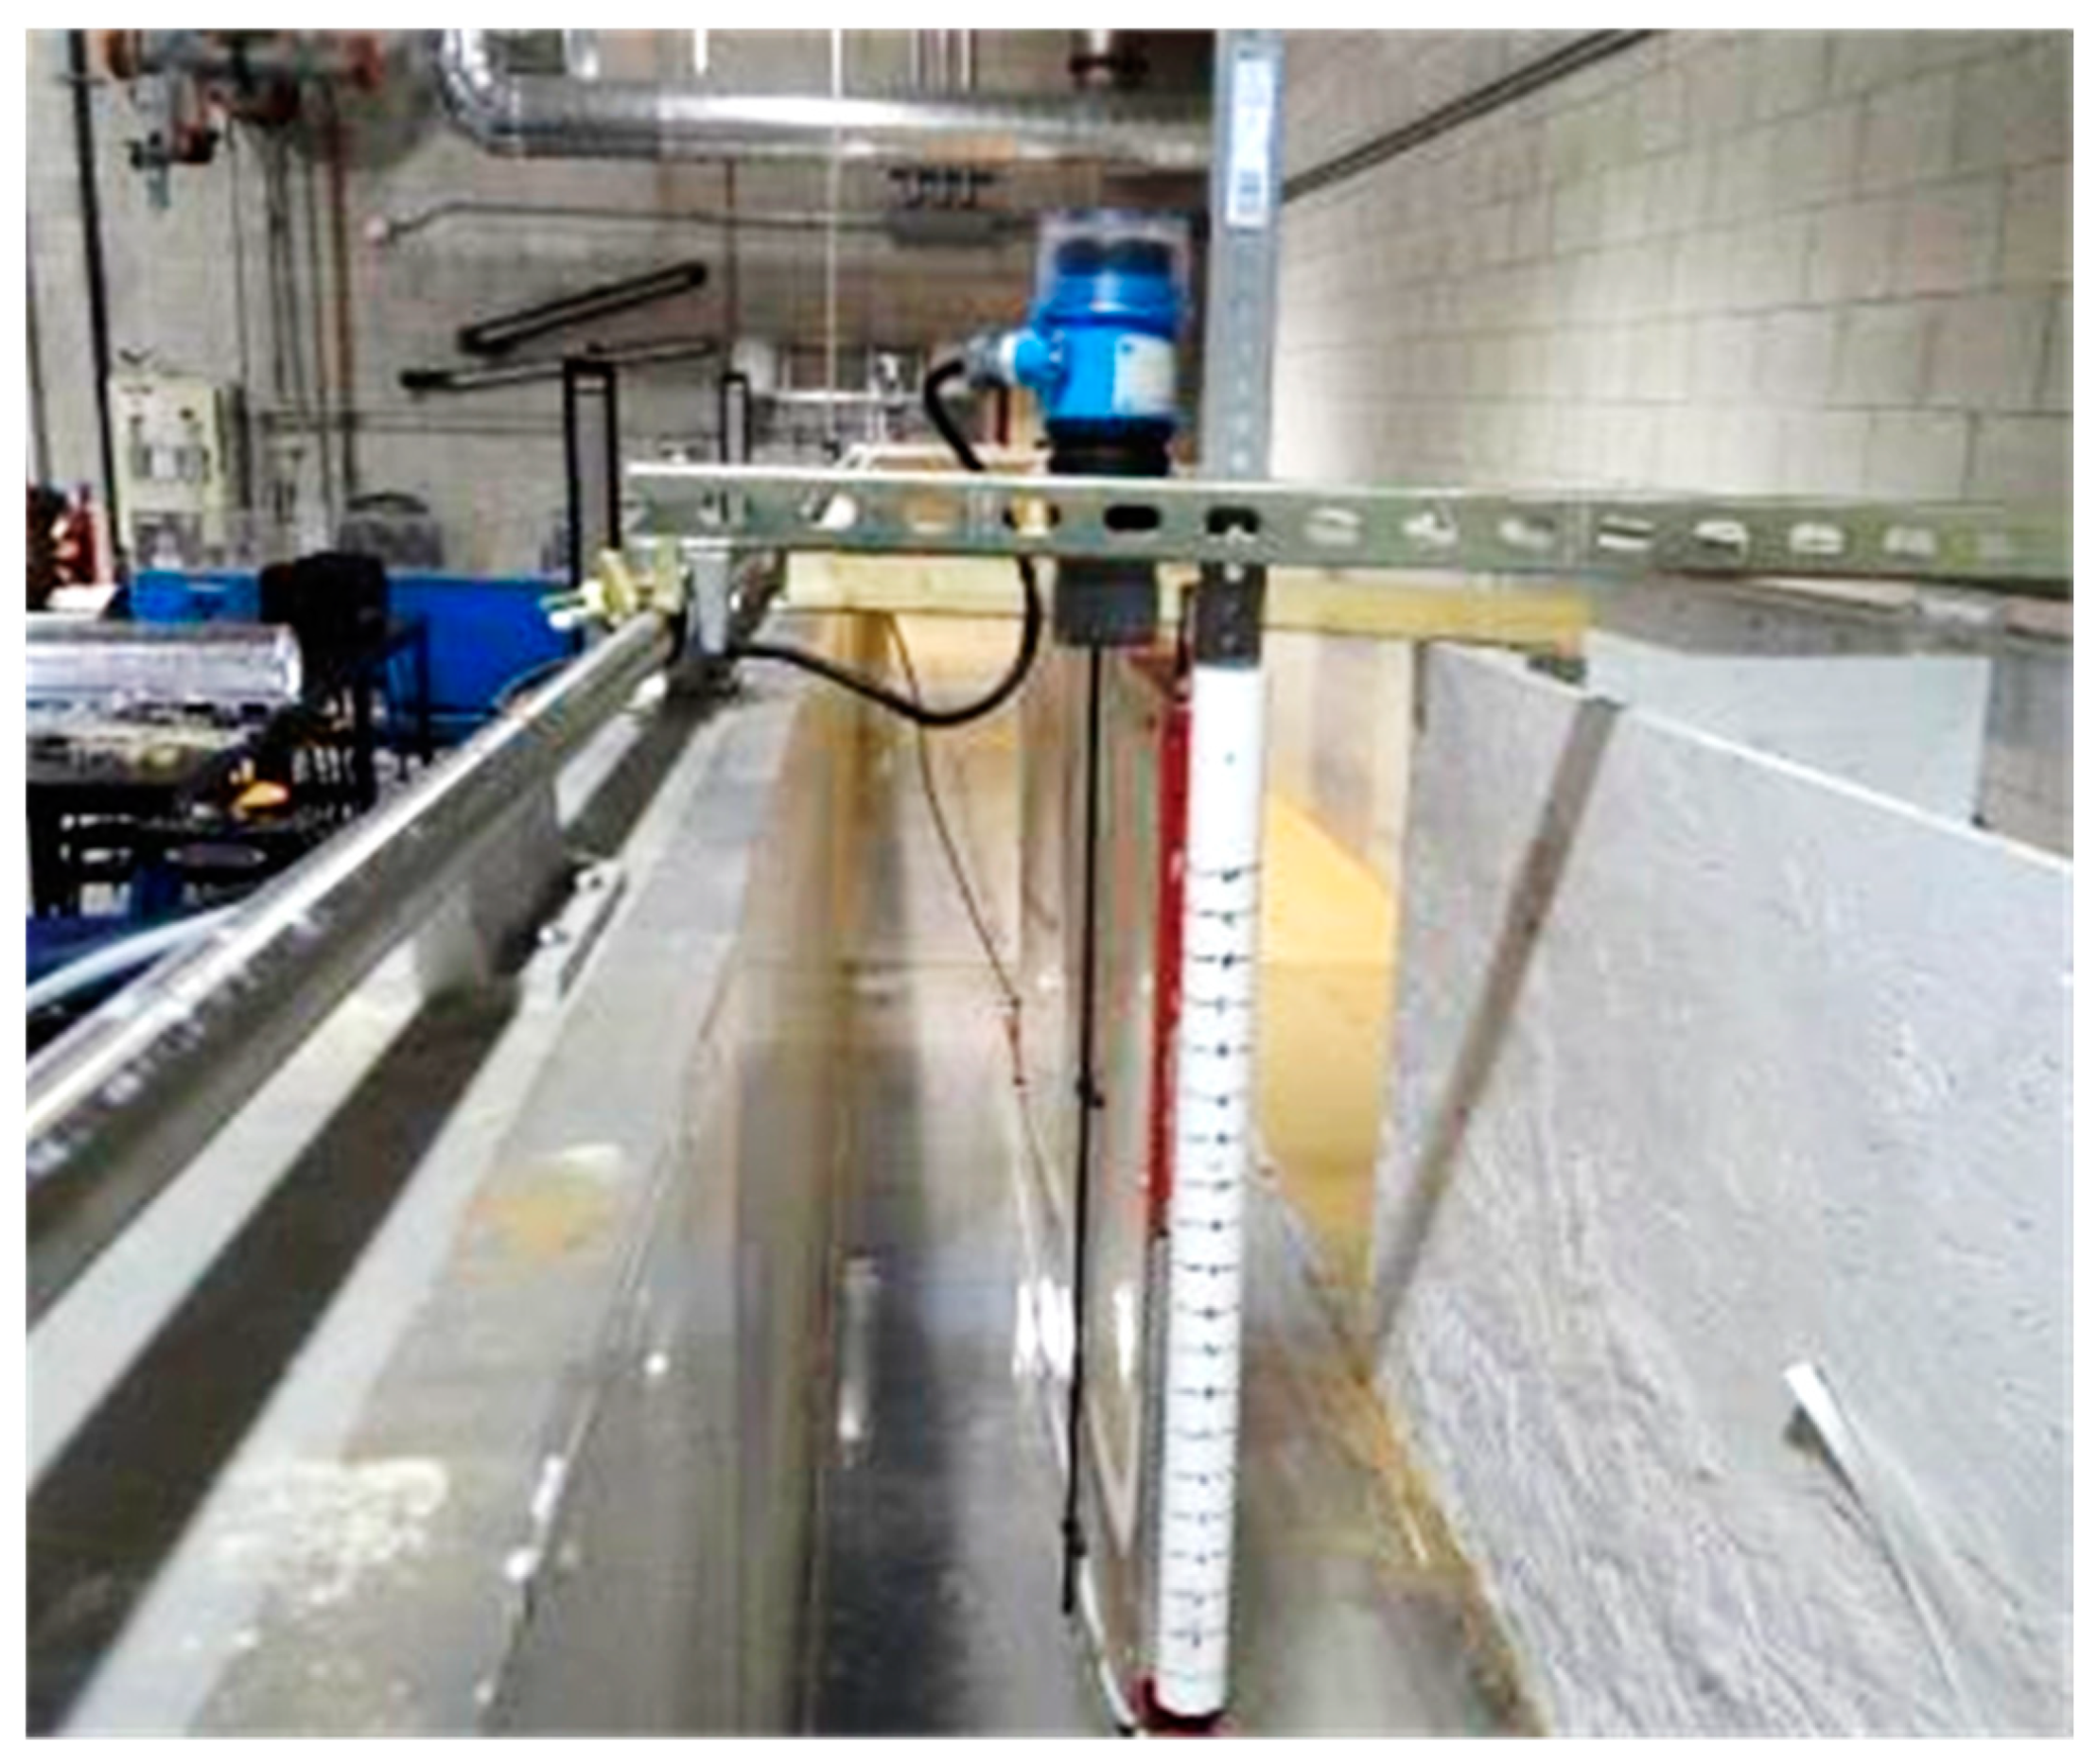
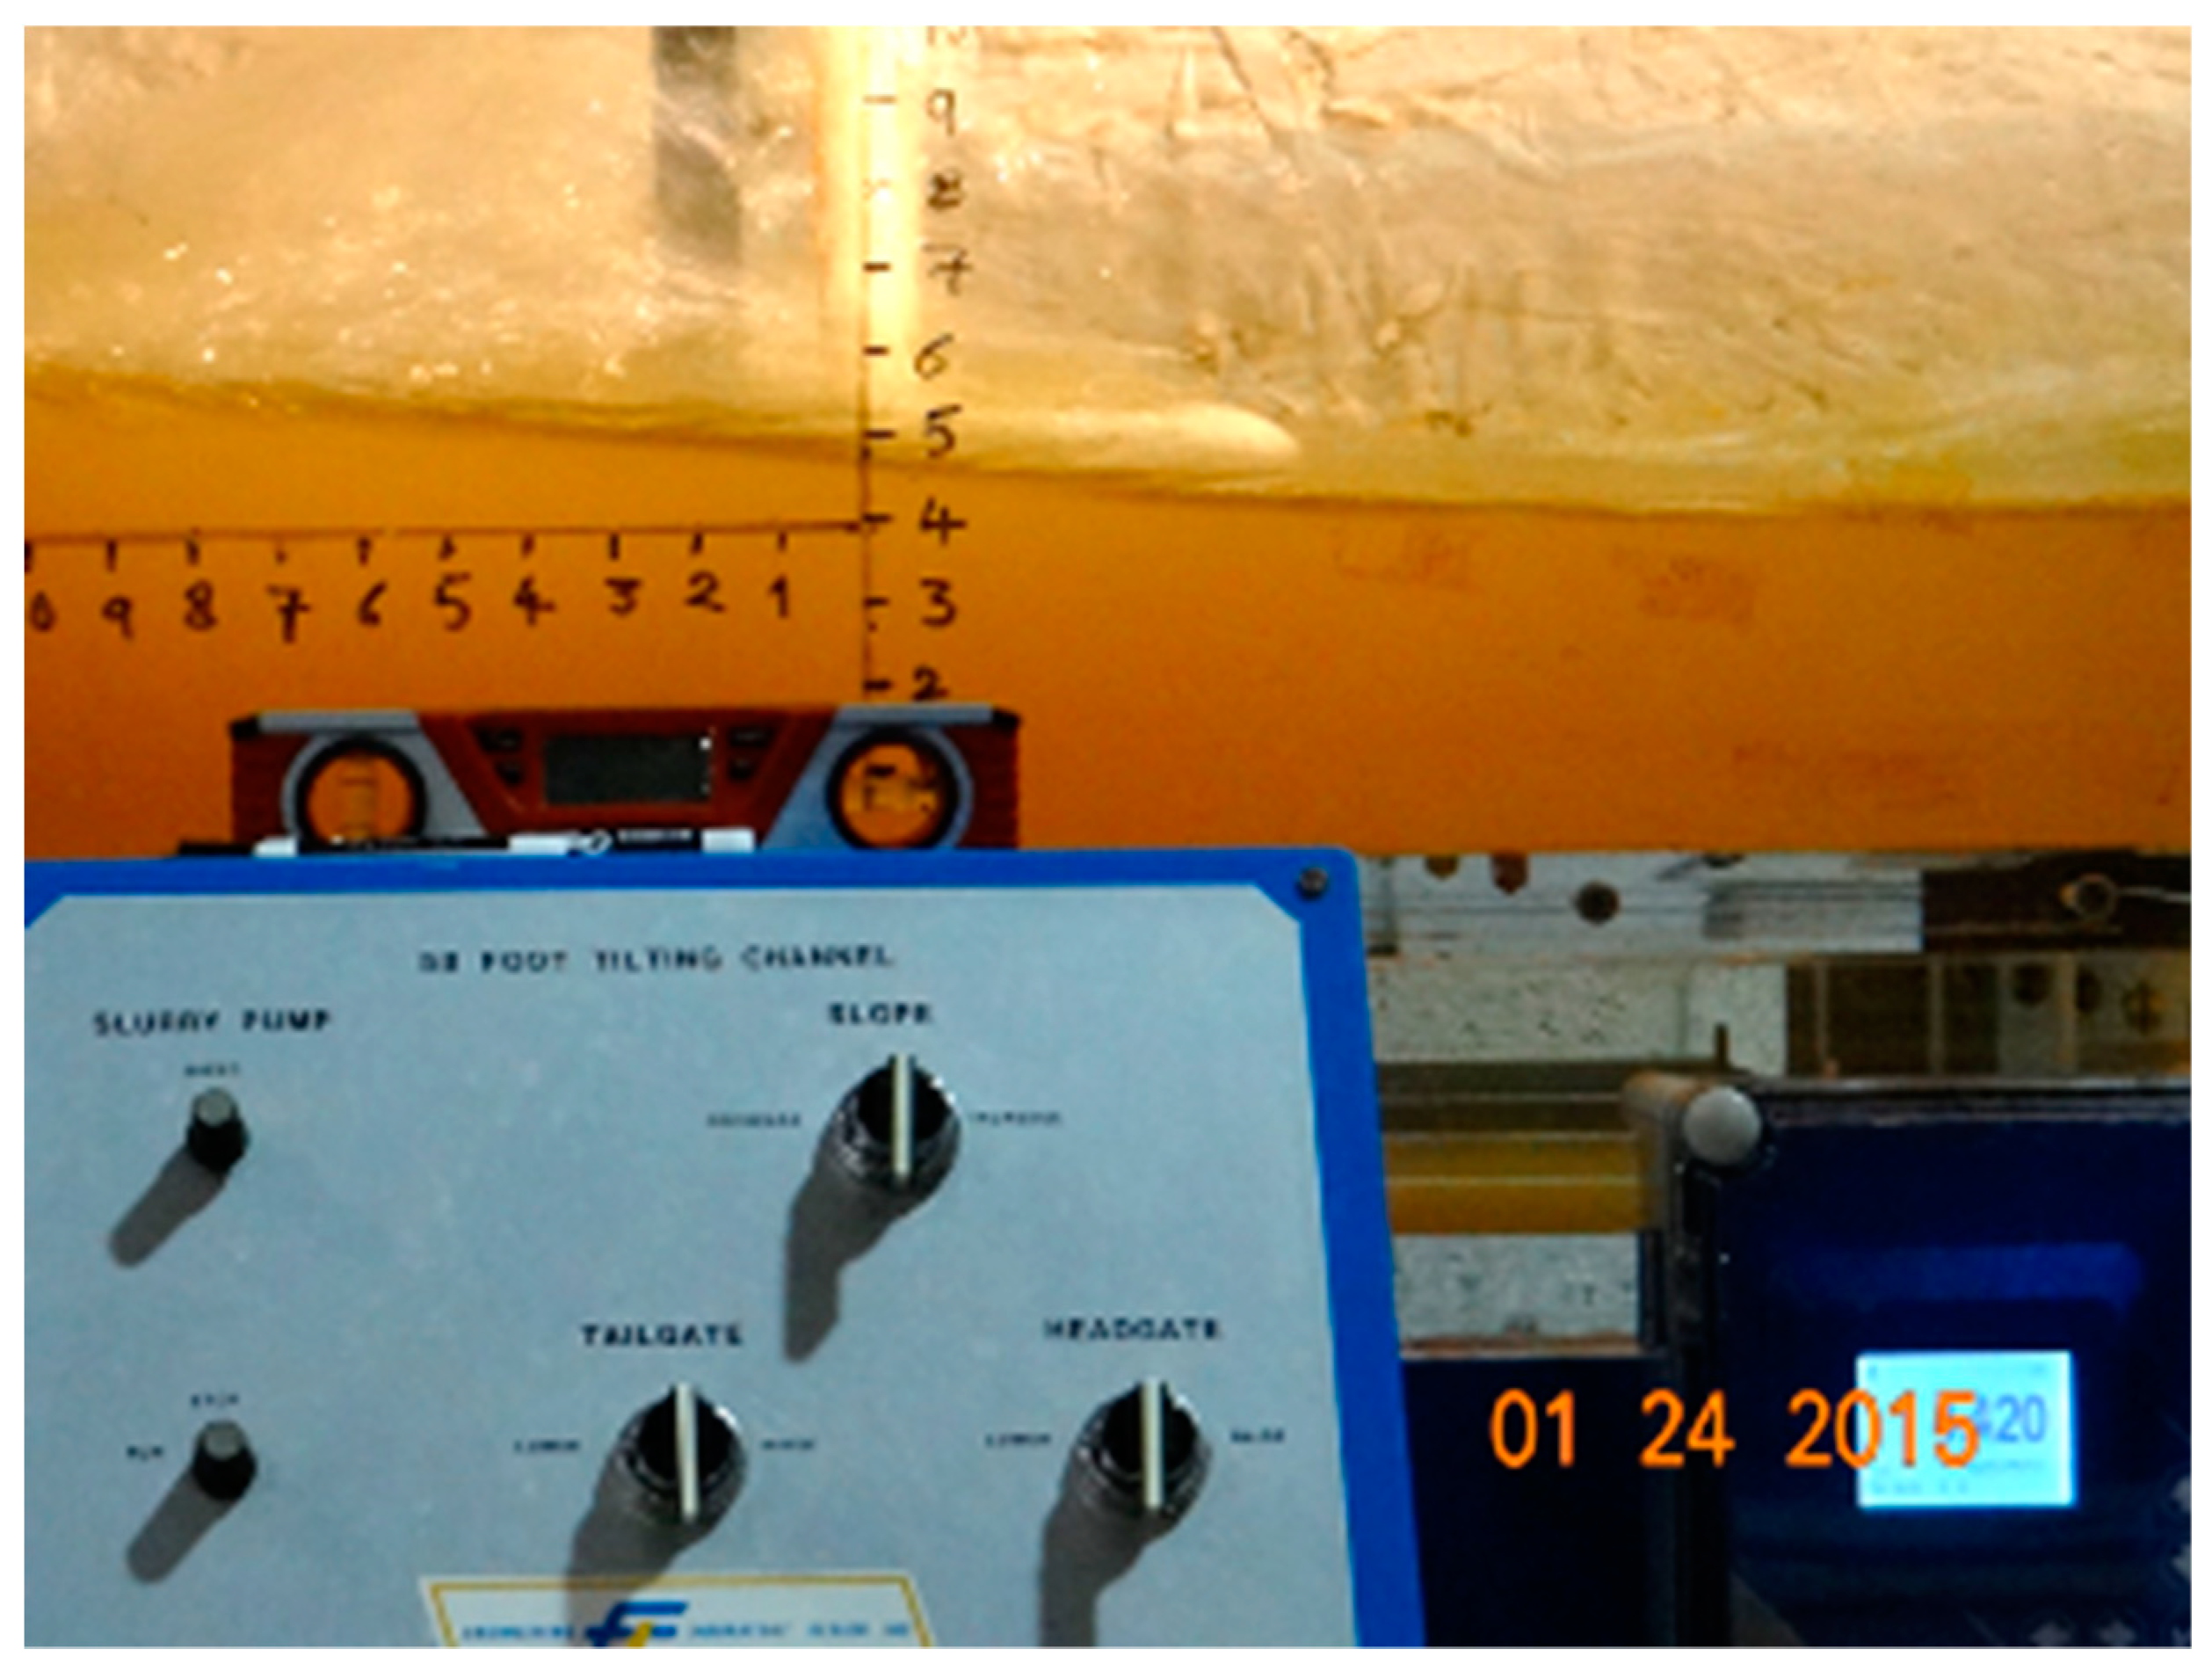
  • An Endress + Hauser Liquicap capacitive level meter Liquidcap T FMI21; this equipment measured the pier level (PLnb, PLbb) (Figure 6).
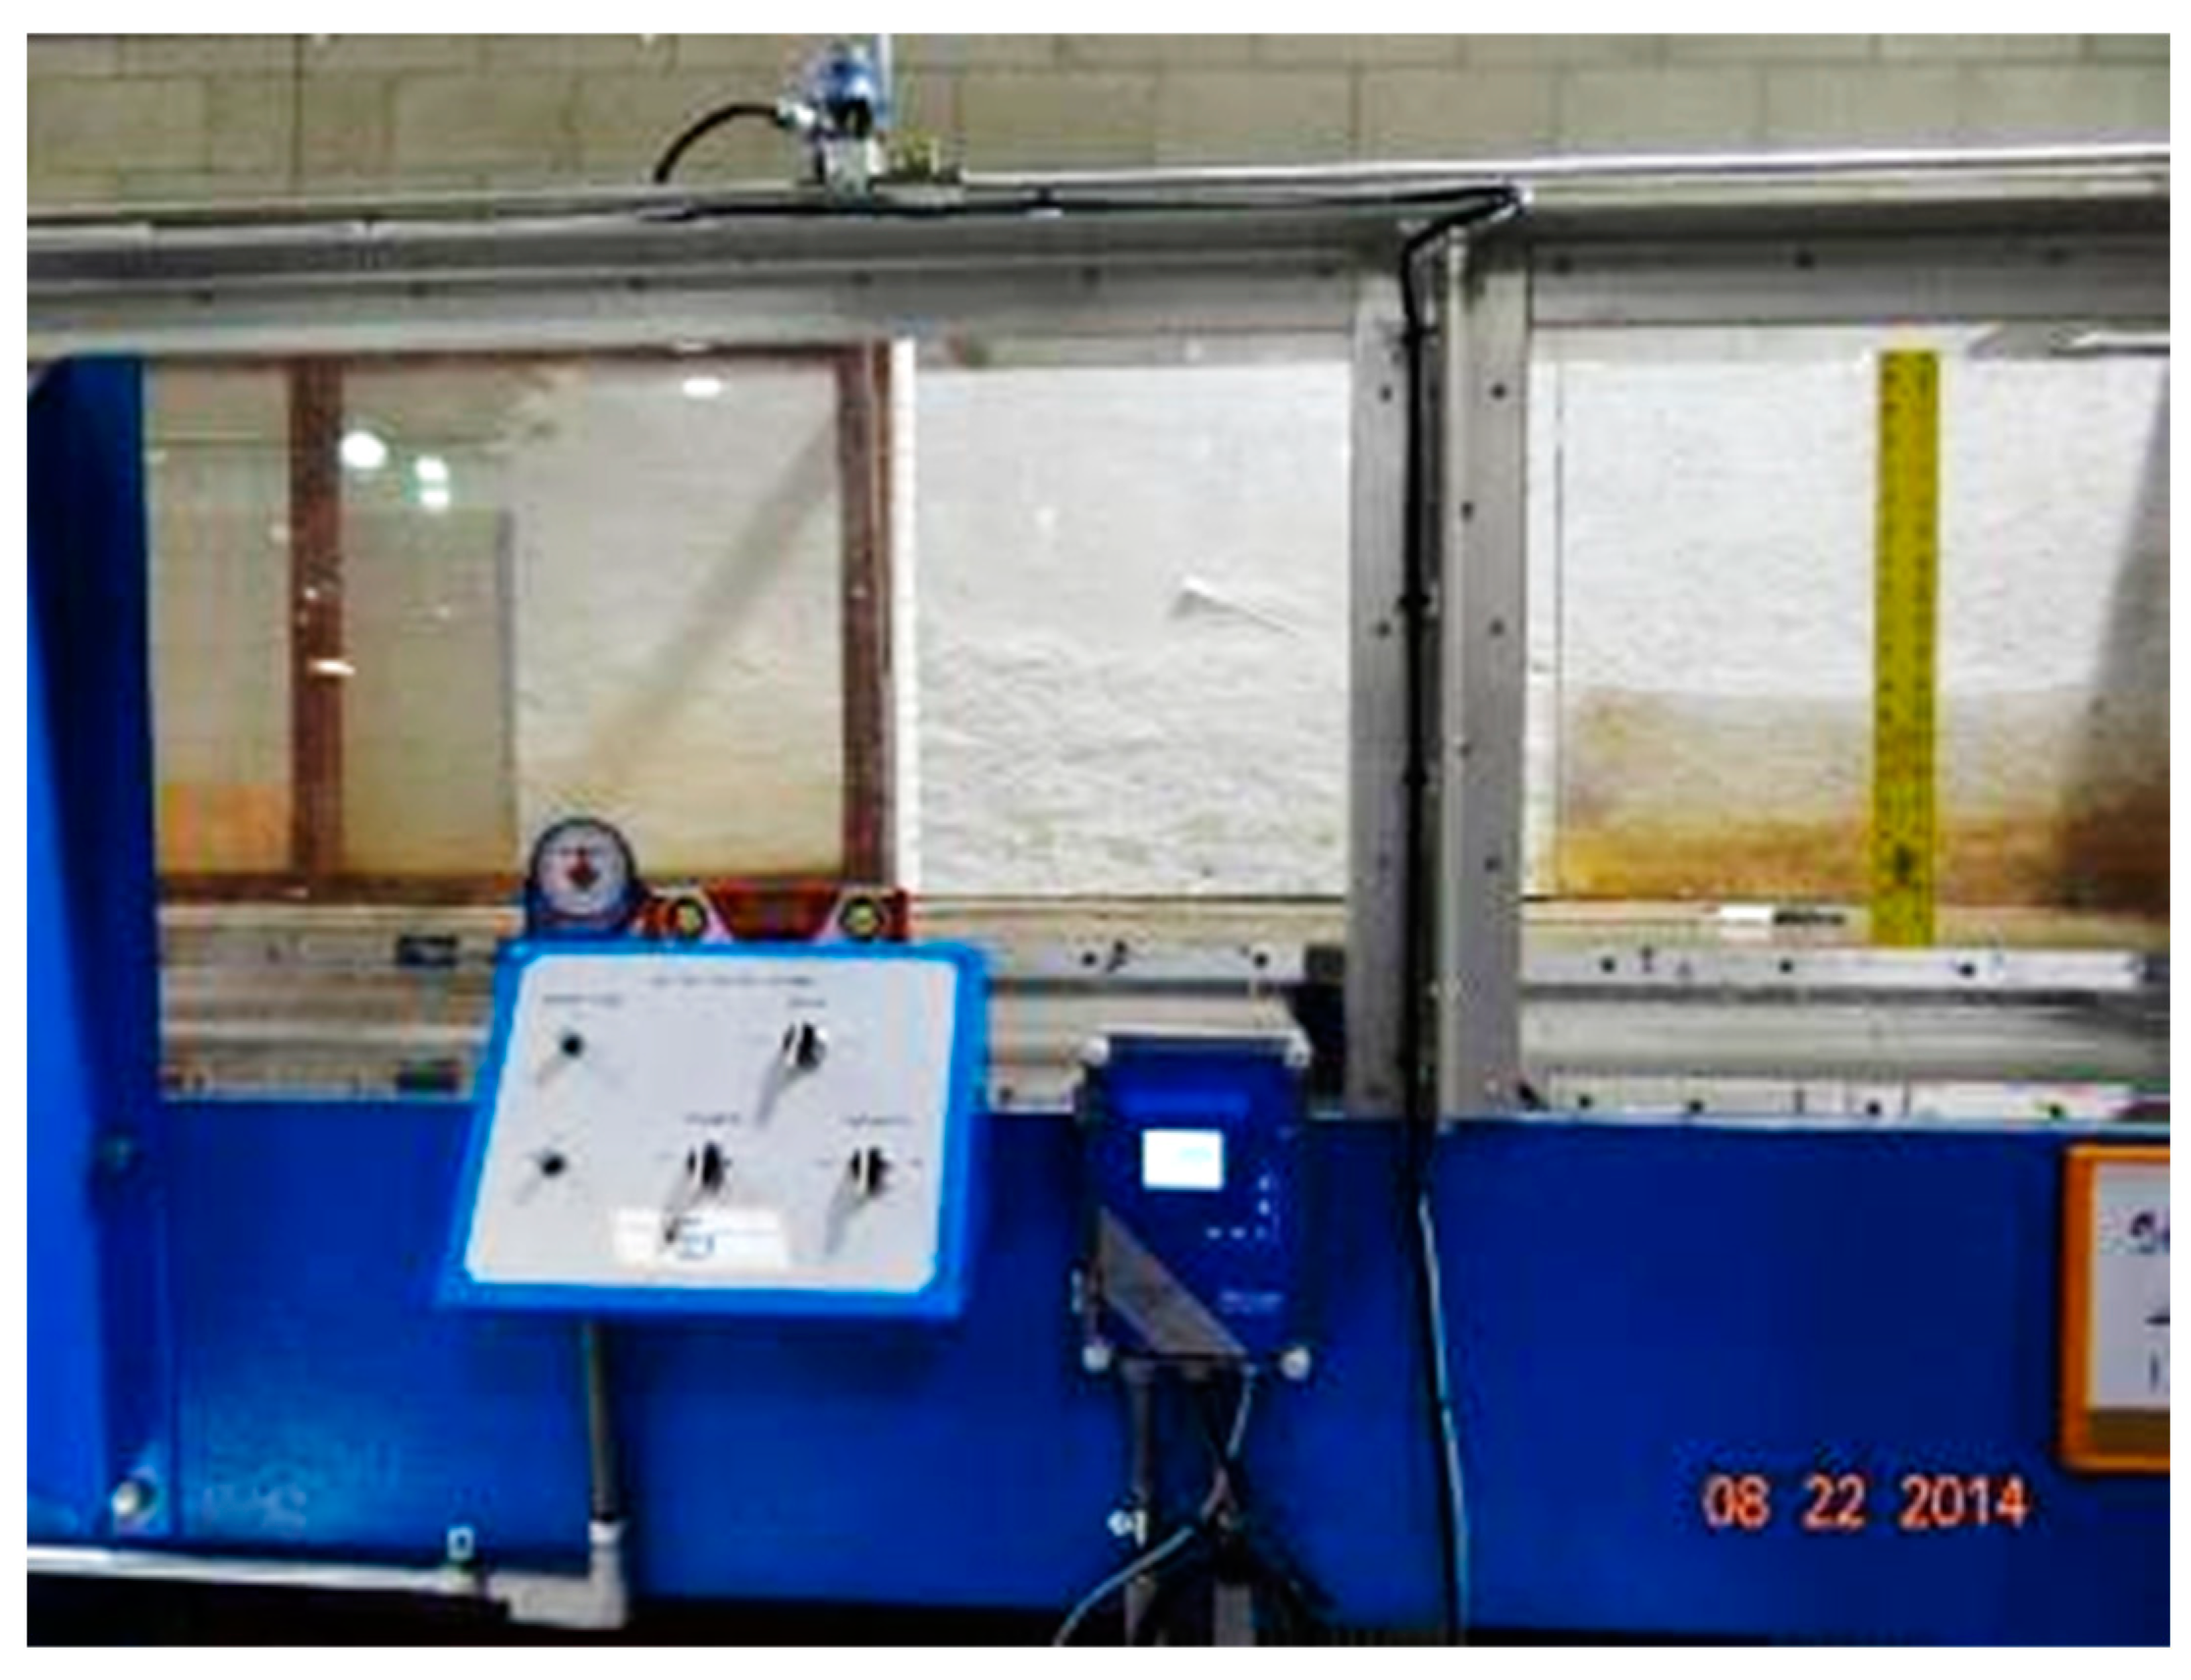
  • A Greyline area velocity flow meter, model AVFM 5.0; this equipment measured the flume flow rate (Q), velocity (v), and hydraulic depth (Yh). The instrument was located at the bottom of the flume in front of the pier nose, a few inches away from the bulb (Figure 7).
  • A Measurement Computer USB-1608G Data Logger; this data logger collected the data coming from the pipe flow meter and level meter, as well as the three outputs from the AVFM 5.0: water velocity, water level, and flow rate.
  • To scale, display, and record the data collected by the data logger, the Measurement Computer DasyLab application was used, and the data collected were stored in Excel CSV format.
Froude number, bulb submerged length, bulb submerged area, and other values were calculated in an MS Access database.

2.3.1. Verifying the Manning’s Roughness Coefficient

For any flow condition in the flume, the Manning’s roughness coefficient converged to a single number of n = 0.010.

2.3.2. Optimal Bulb Submerged Depth

From the literature review, the optimal bulb submerged depth (Ys) was determined by running the flume at maximum flow and changing Ys. Preliminary tests showed that optimum Ys occurred when half of the bulb’s diameter was submerged.

2.3.3. Steady-State Test Matrix

In order to evaluate the pier water level reduction produced by the bulb, a pier model was placed into a hydraulic flume and tested. Two sets of data were collected: one from the pier, and the other for the pier with the bulb. The flume running at a predetermined Yh is called steady-state in this paper. This is different from the actual behavior of open channels, where Yh changes as flow conditions change. The test matrix (Table 4) contains eight flume set points (slope and the RPM), where Yh = 0.375′. Twelve bulb models were selected for each flume set point. The bulb models were divided into four lengths and three angles. Bulb length was measured at the upper side of the bulb. The bulb angle was the angle between the bottom of the flume and the bottom of the bulb.

2.4. Flume Capabilities

Table 5 shows the flume characteristics used at UNLV.

2.5. Dimensional Analysis

For a flume with its width restricted to 1.5′ and running at Fr = 1.59, the Yh is equal to 0.58′. The model was scaled down using the Froude number, and a model scale factor of 0.12 was obtained. For the experimental flume runs, a Yh equal to 0.375′ was selected to allow for a larger number of supercritical set points. This hydraulic depth also provided room for the expected increase in Yh due to the introduction of the bulb. The result of the dimensional analysis is shown in Table 6. Since the pier height does not have any significance in the equation governing bulb design, it was increased to 2′ to accommodate the necessary instrumentation.

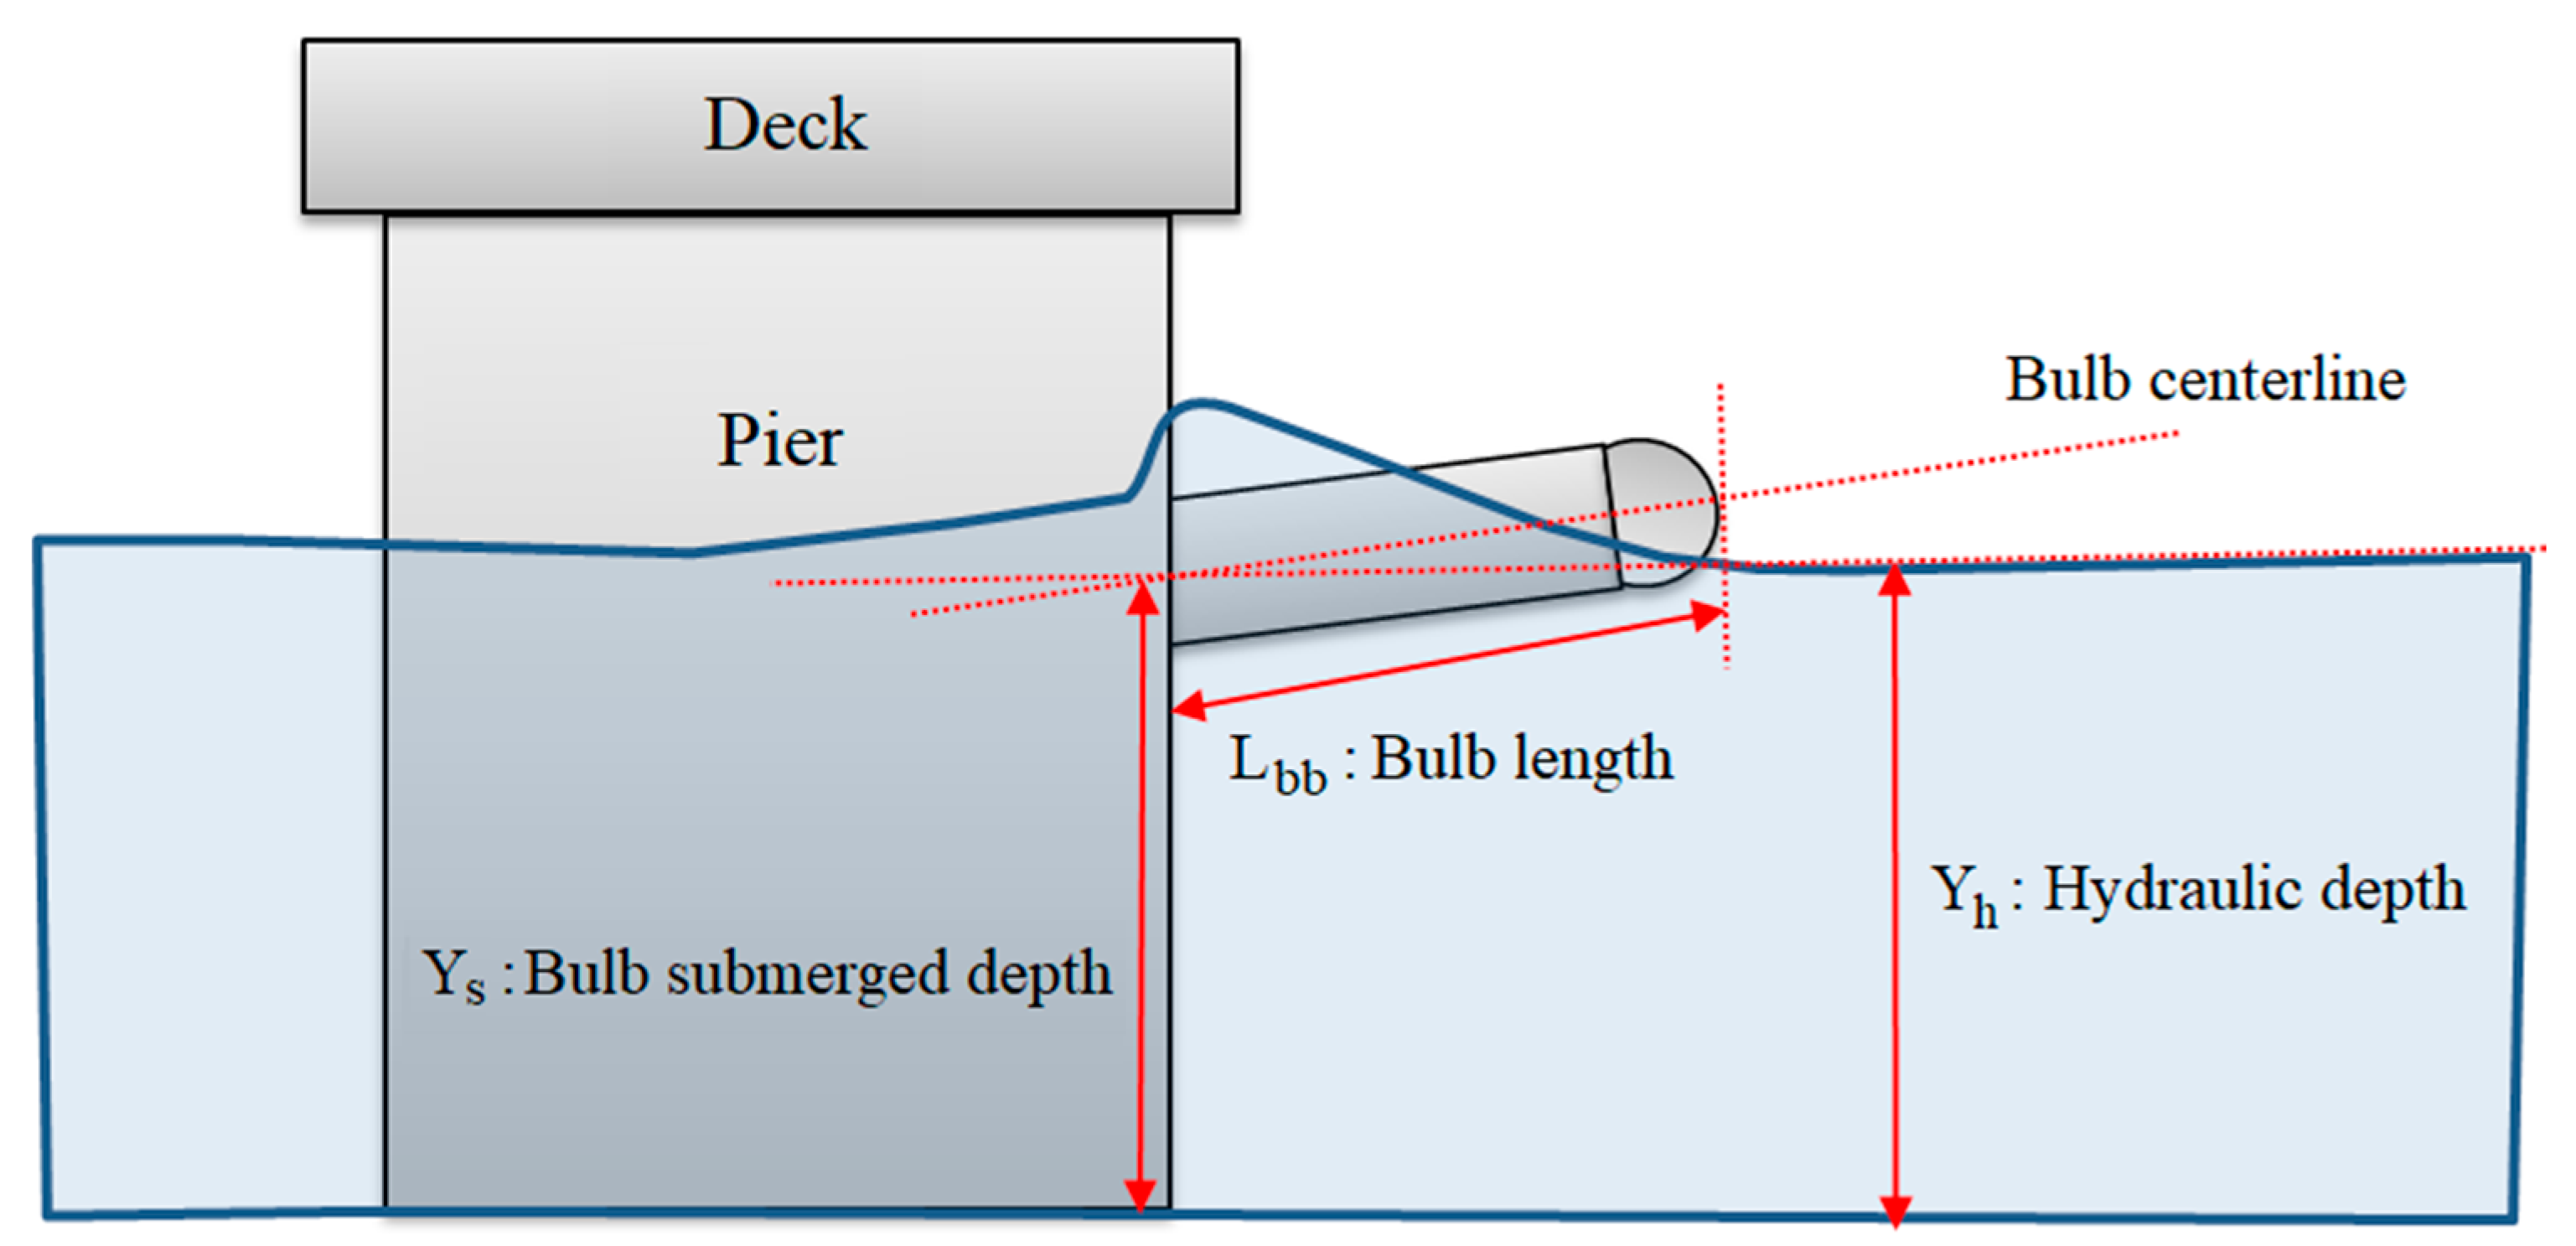
2.6. Bulbous Pier Geometry

The pier model dimensions were selected using suggested values for bulb dimensions from Ghani (2009) [9]. The width of the bulb was set to be the same as the pier width. Table 7 shows the bulbous pier geometric characteristics.

3. Results and Discussion

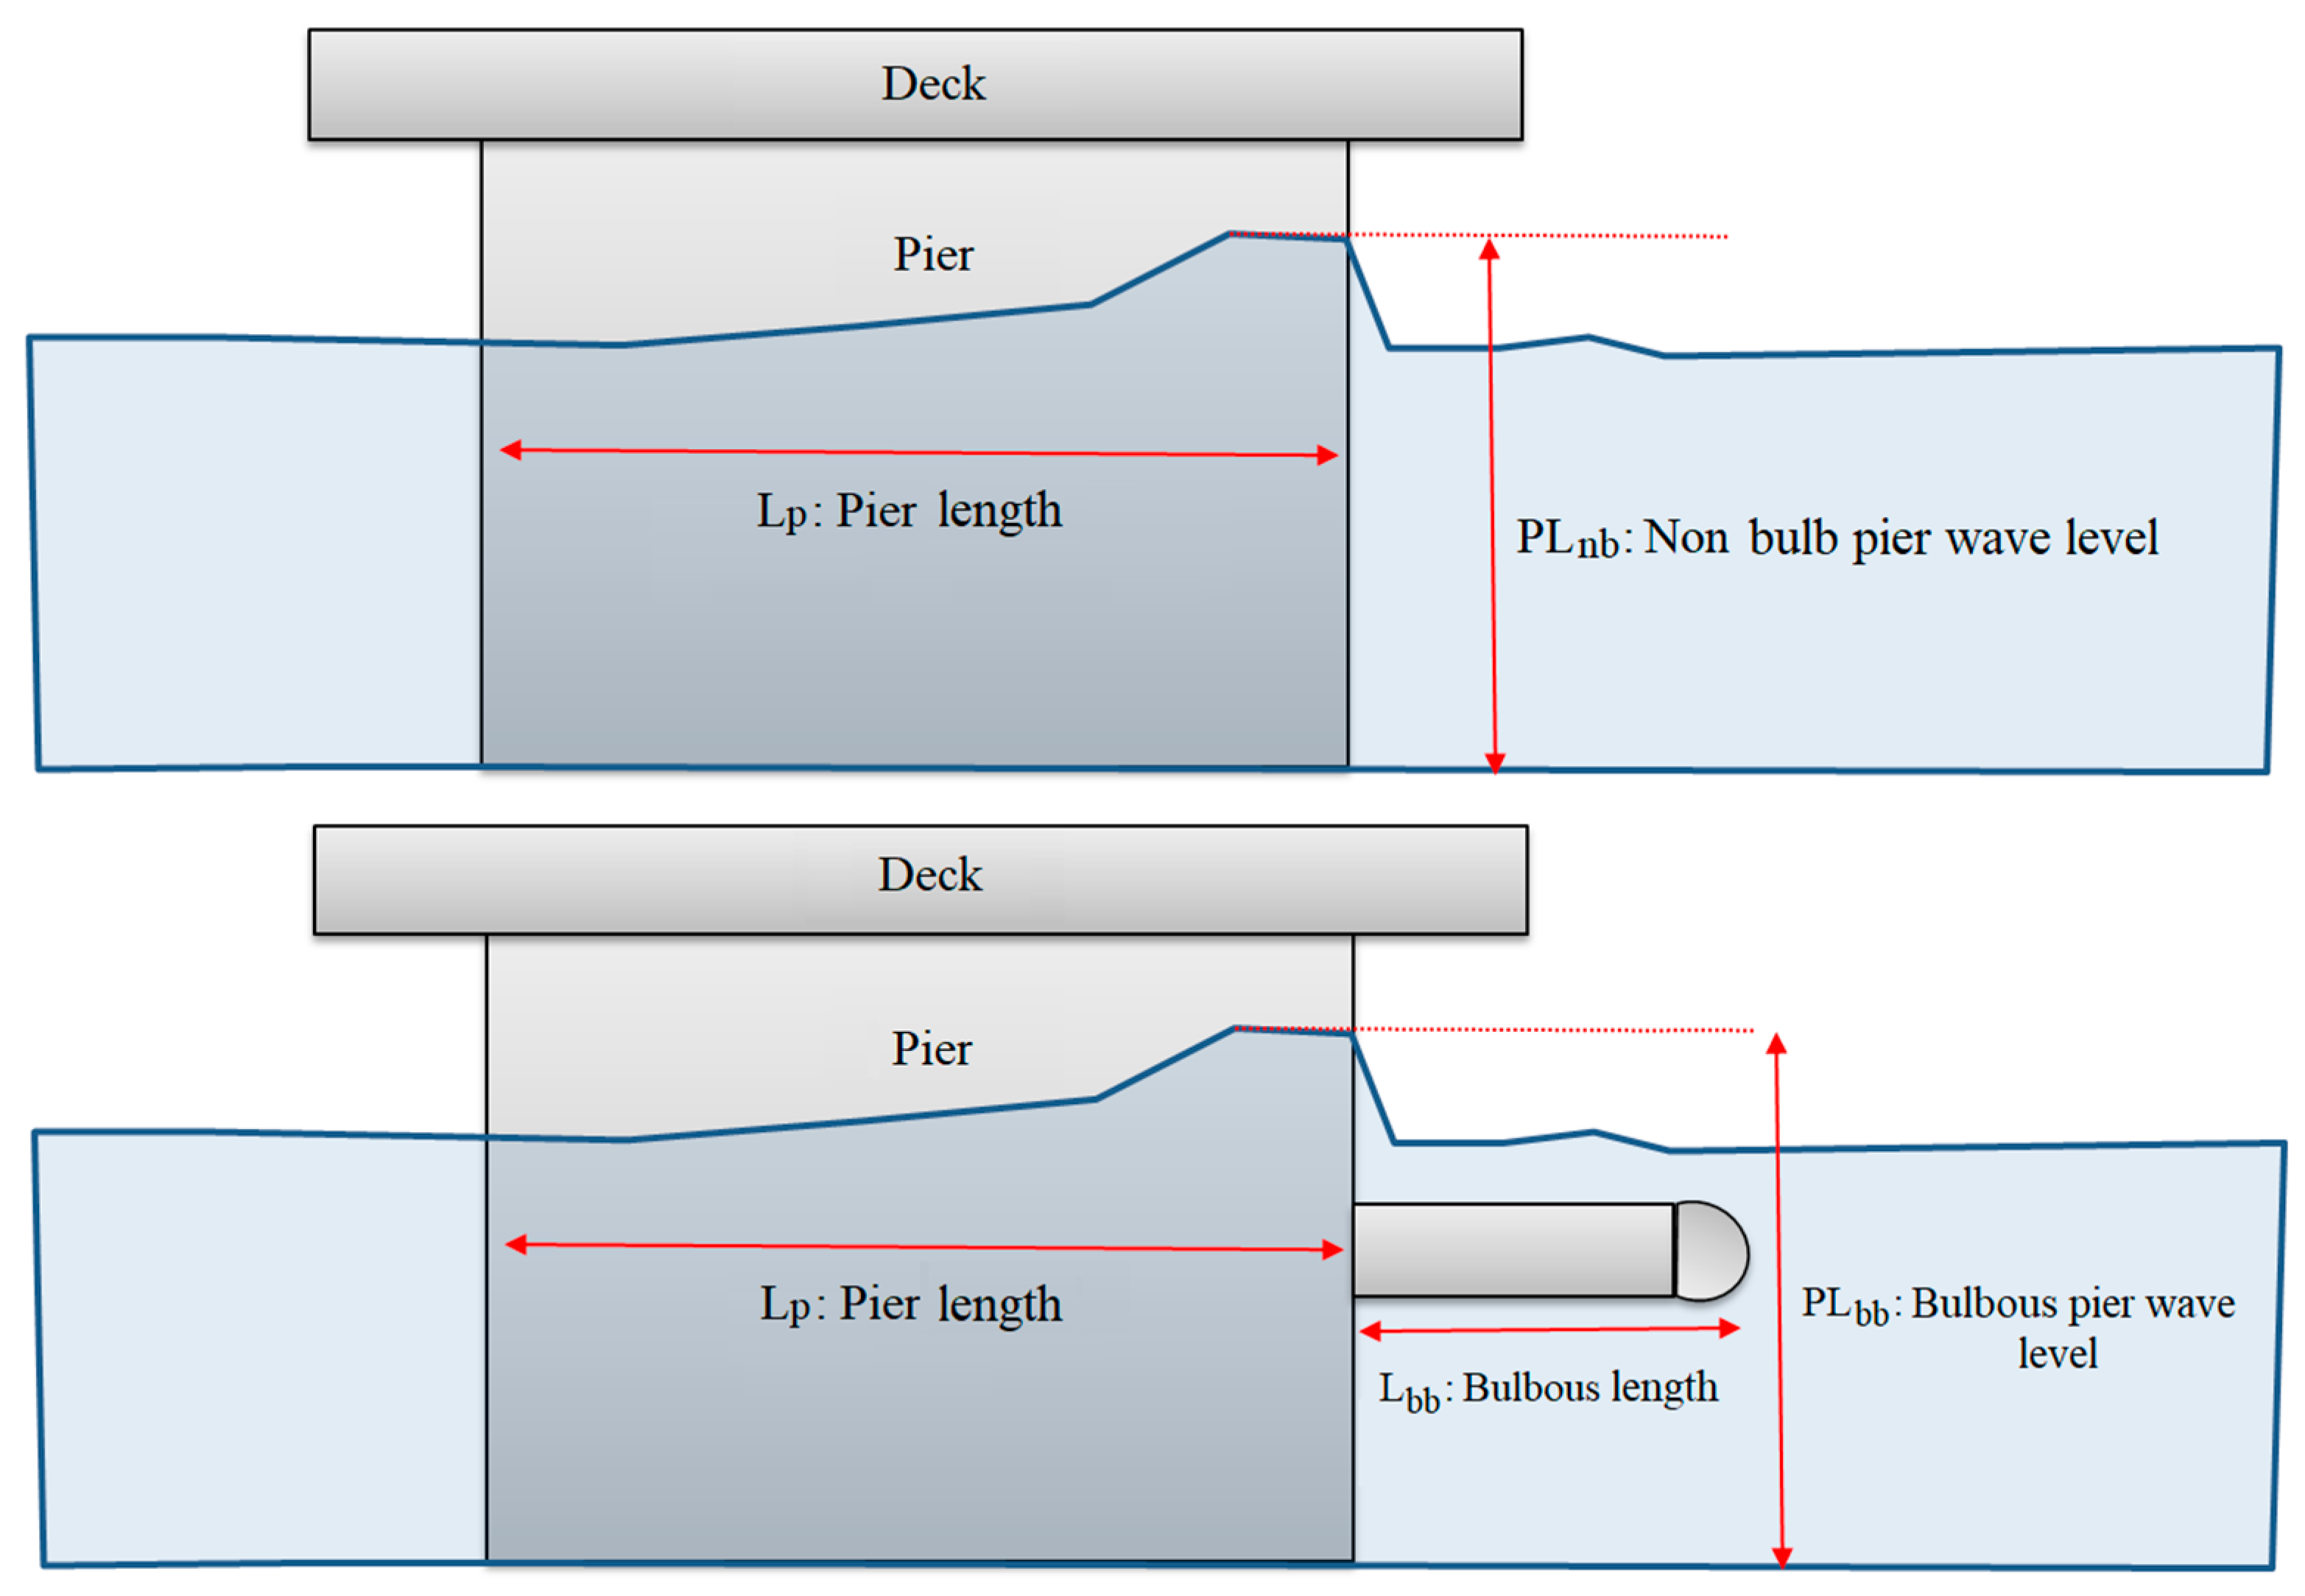
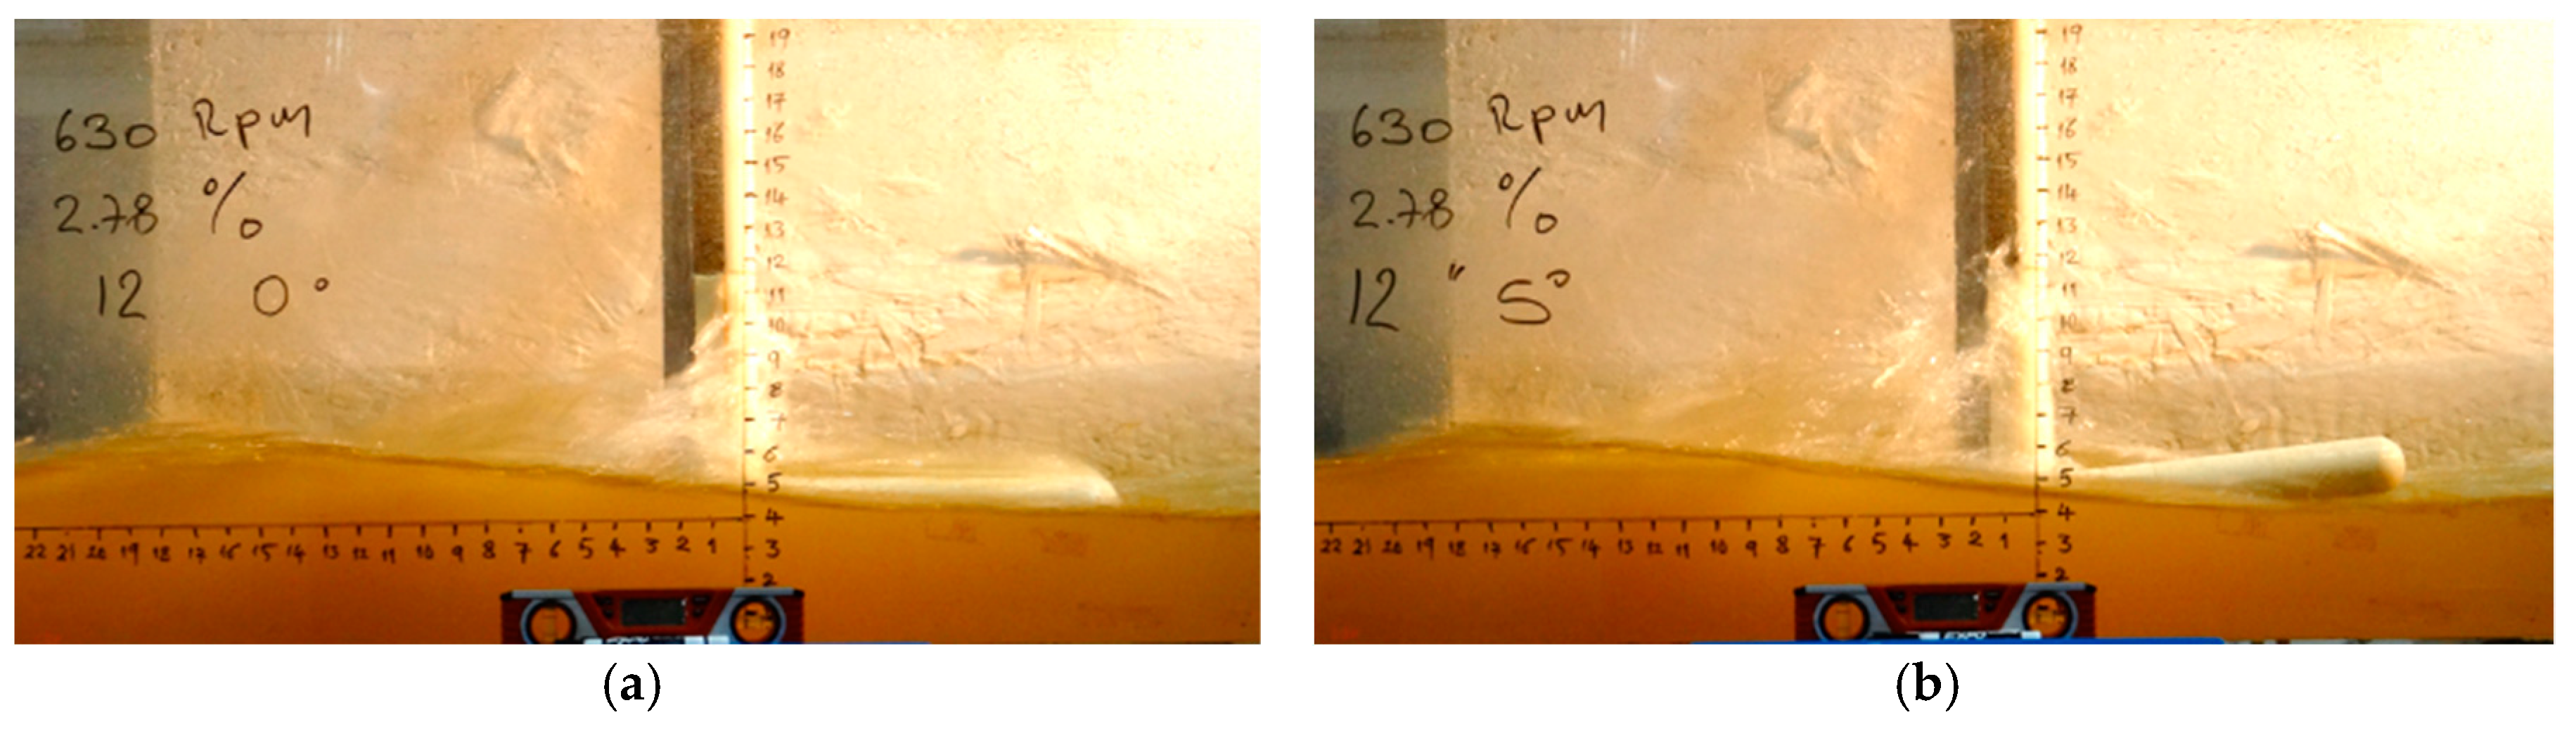
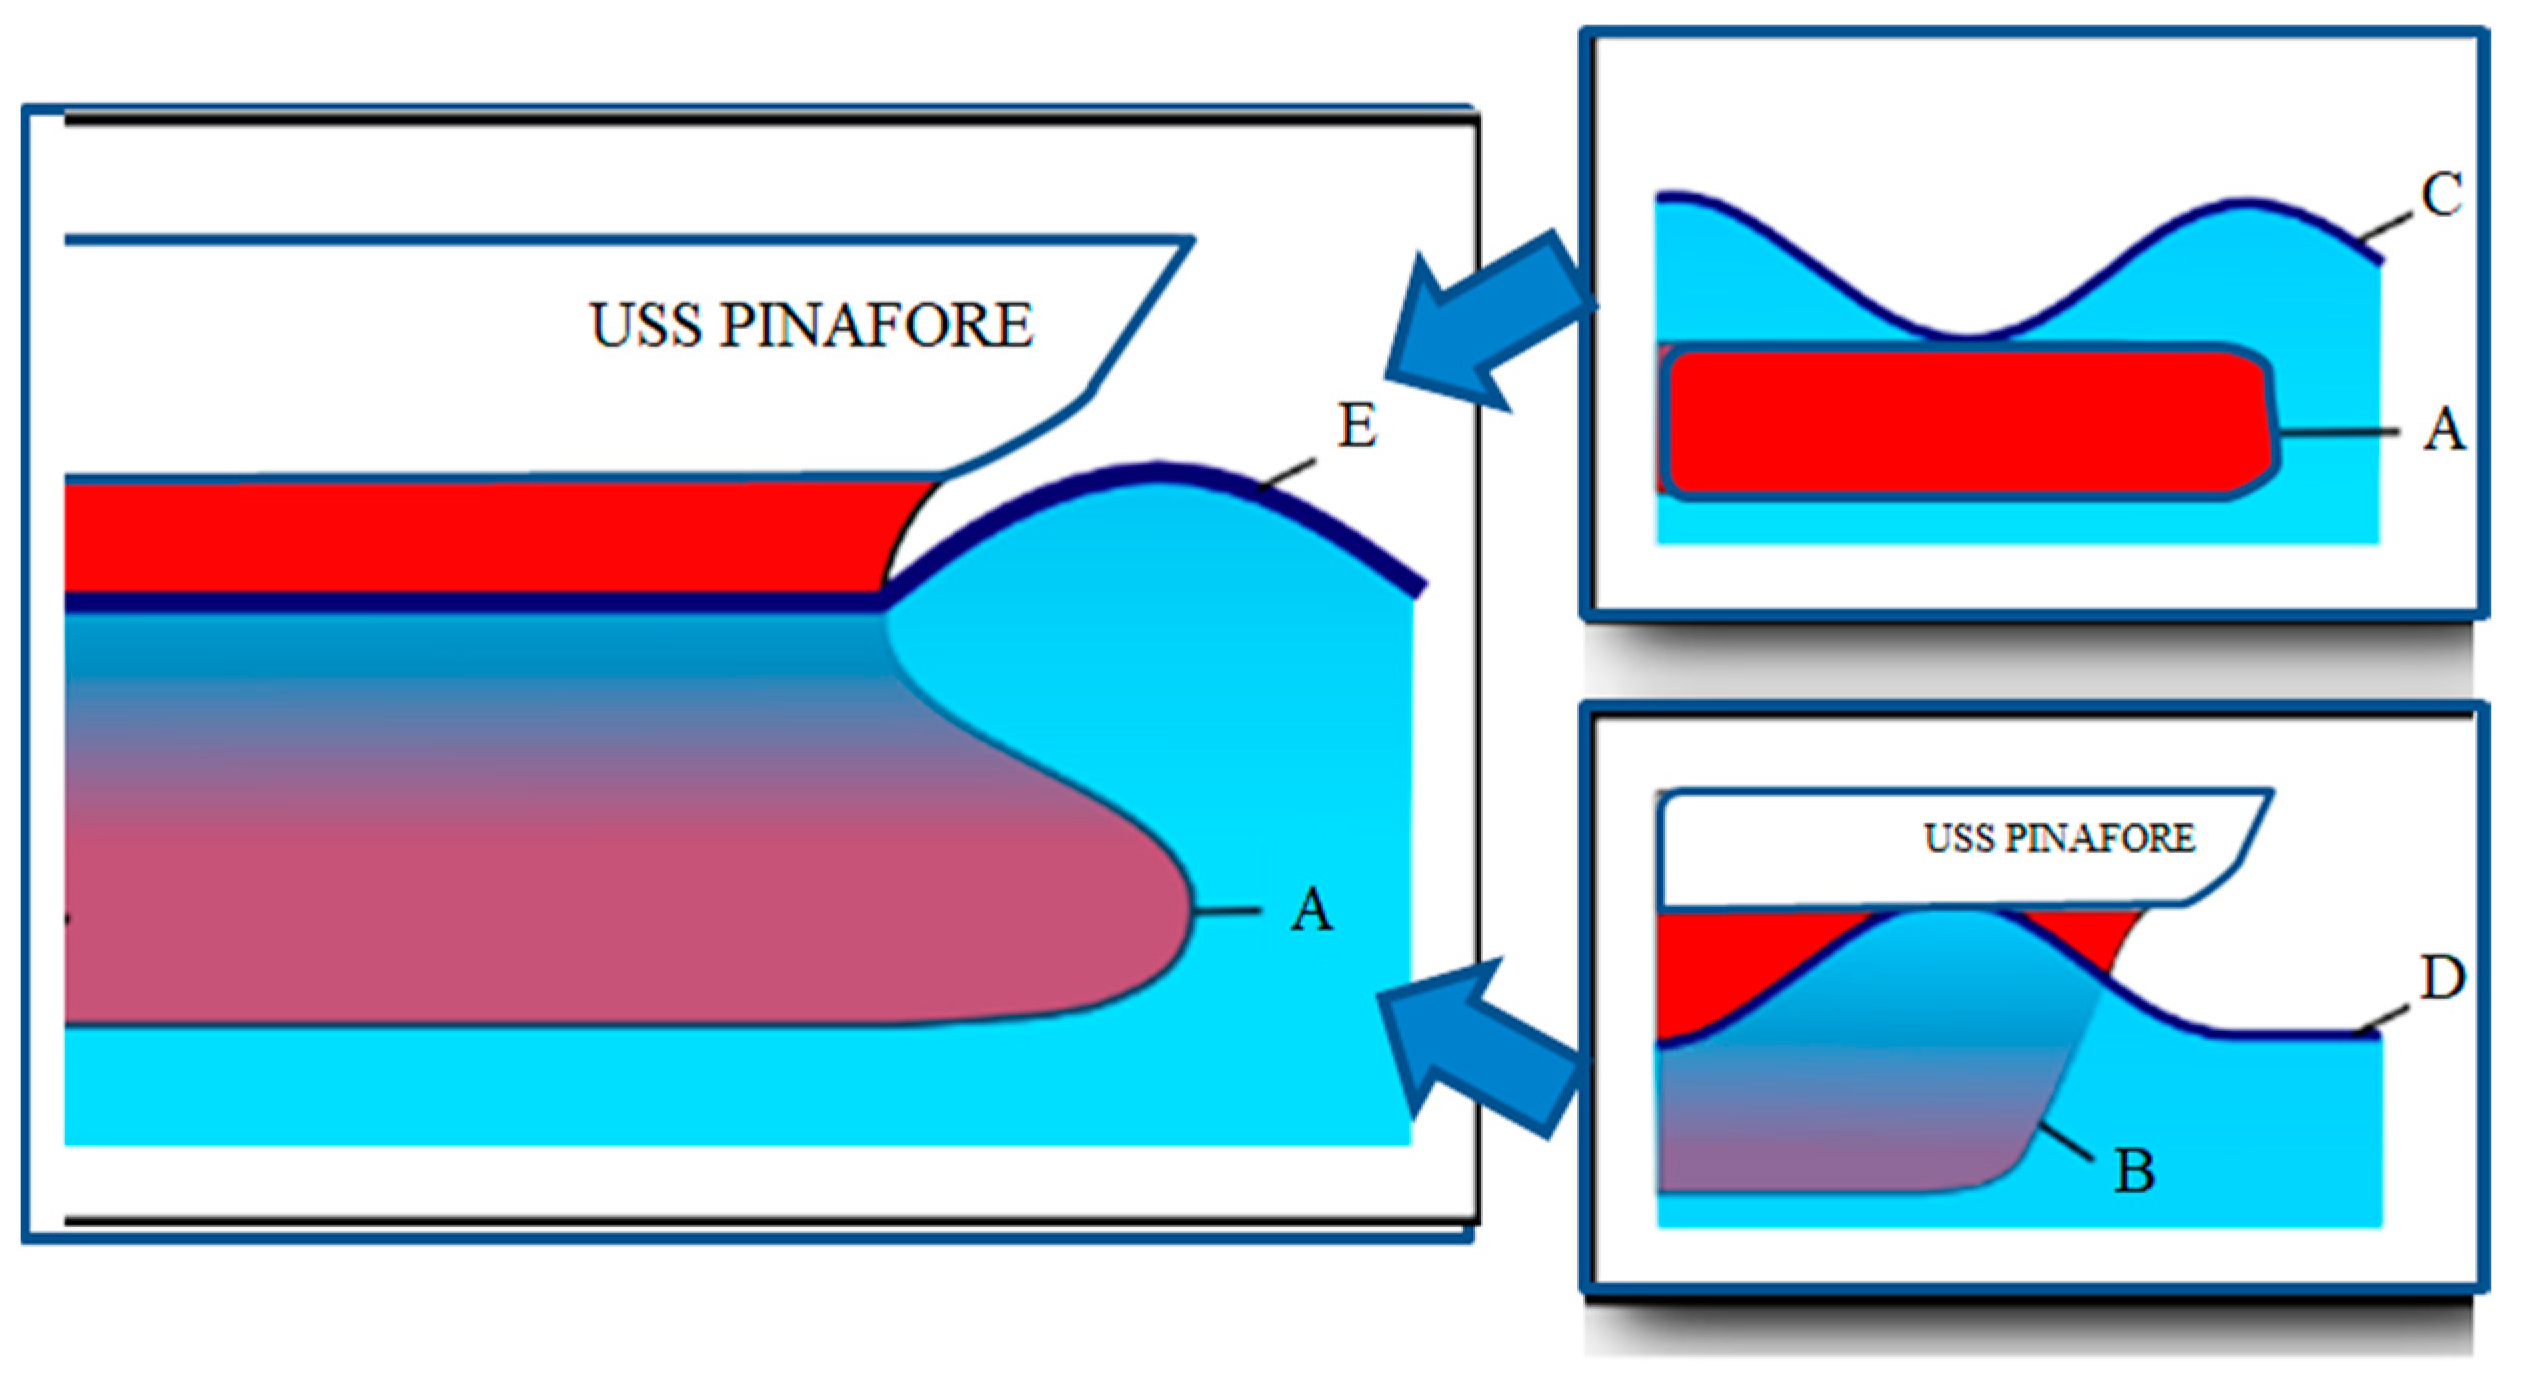
3.1. Pier Water Level and Bulbous Pier Water Level

The experimental results showed that the bulb decreased the pier’s water level. The two-sample t-tests, for PLnb and PLbb, showed that the bulbous pier’s average water level was less than the non-bulb pier (see Appendix A).

3.2. Initial Assumptions

The initial bulb length (Lbb) values, derived from Ghani’s (2009) design parameter values, proved to be insufficient to produce a significant reduction in the pier wave ratio (PWR). The short bulb with a 0° pitch angle had a spraying problem. Water over the bulb tip detached from the flow and sprayed over the pier (Figure 8). To avoid this problem, the Lbb would have to be extended to lengths not suitable for construction, somewhere between 10′ and 12′. The initial assumption that the Lbb is directly related to the PWR was confirmed (Figure 9). A higher PWR indicated that the PLbb was lesser than the PLnb.
To correct the spraying problem, the bulbous pitch angle was increased to 5° and 10°. The pitch angle is defined as the angle between the bulb’s horizontal axis and the bottom of the flume. The selection of the pitch angle was based on the CZB value, used by Ghani and Wilson (2009), and Table 8 [9]. A CZB = 0.329 is between a 5° and 10° offset between the tip of the bulb and the top of the bulb (Figure 10), depending on the length of the bulb.
The increase in the pitch angle was accomplished by rotating the 0° bulb, having the upper part of the bulb-pier intersection as a fixed point. The introduction of the pitch angle corrected the spraying problem and increased the PWR for the bulb with the same upper horizontal length (Figure 11). The results also showed that an increase in the pitch angle reduced the PLbb by eliminating the flow over the bulb (Figure 12).
For the bulbs with 5° and 10° pitch angles, the bulbous submerged length was the bulbous length at the waterline level (Lbbs). The reduction in Lbbs due to the introduction of the pitch angle decreased PLbb (Figure 13), but provided the opportunity to brace the bulb tip to the pier once the tip cleared the water line. The 0° pitch angle bulb was discarded because of the large Lbbs required to eliminate the spraying problem.

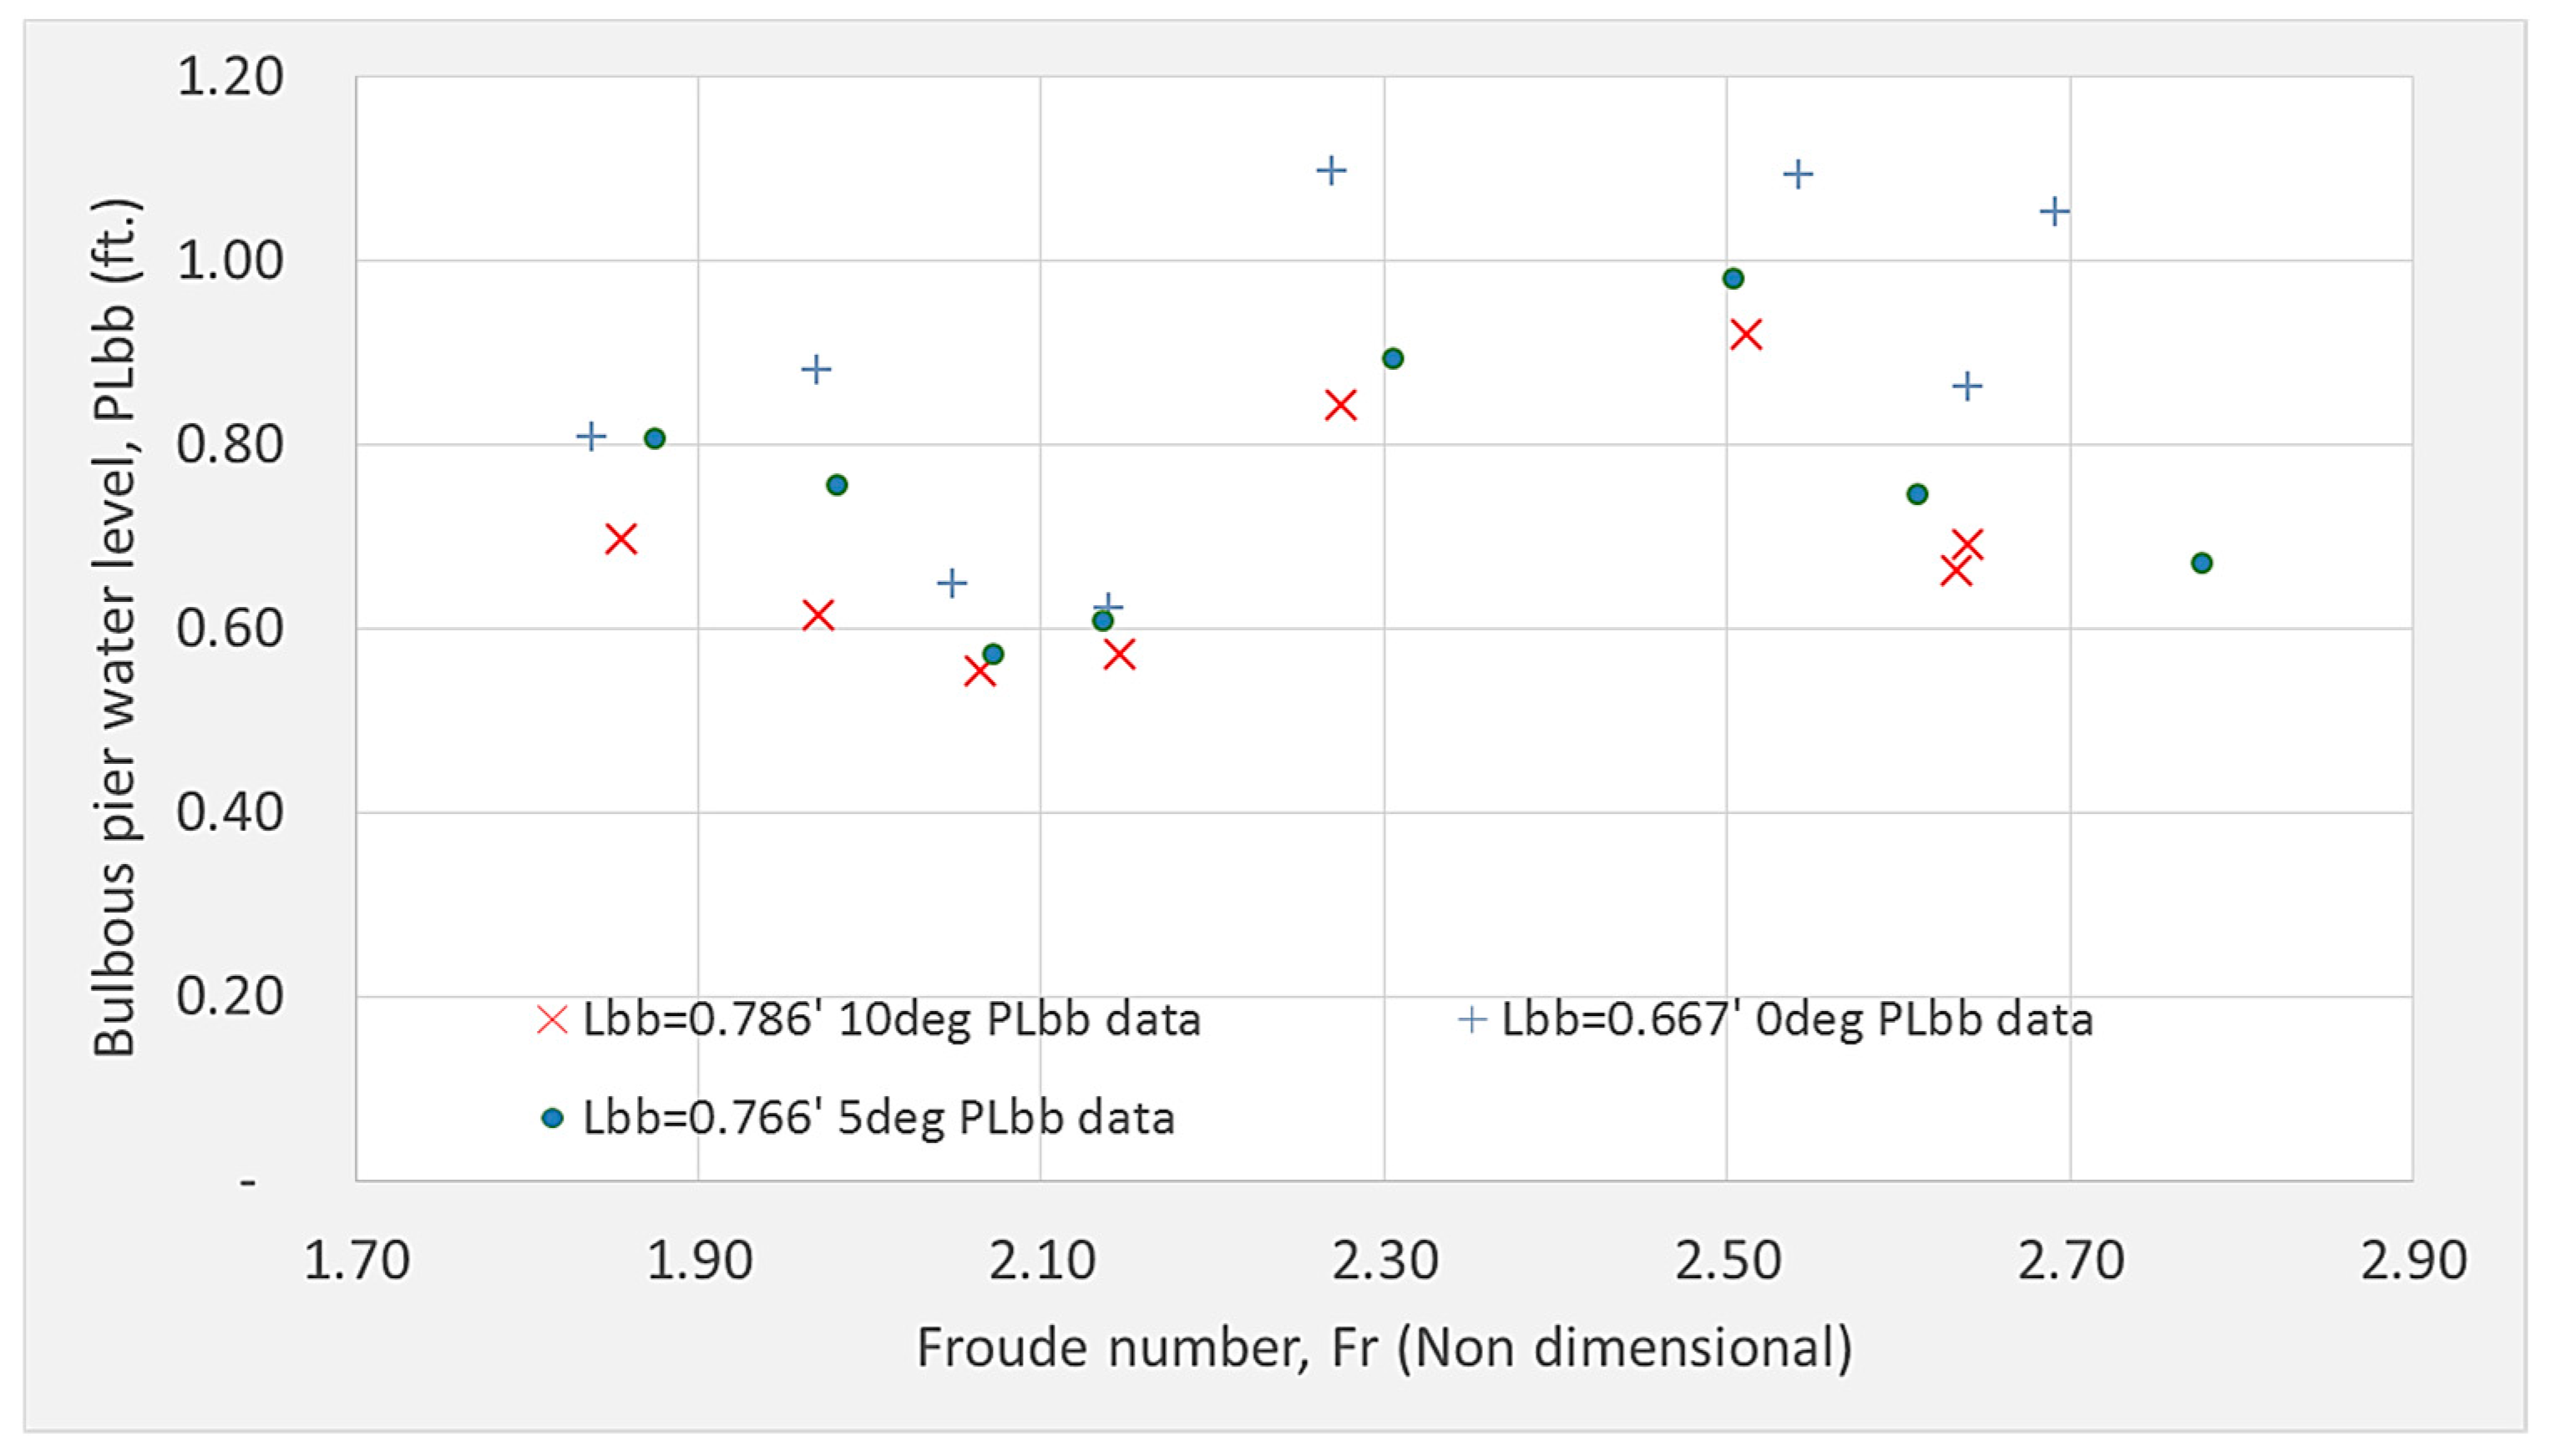
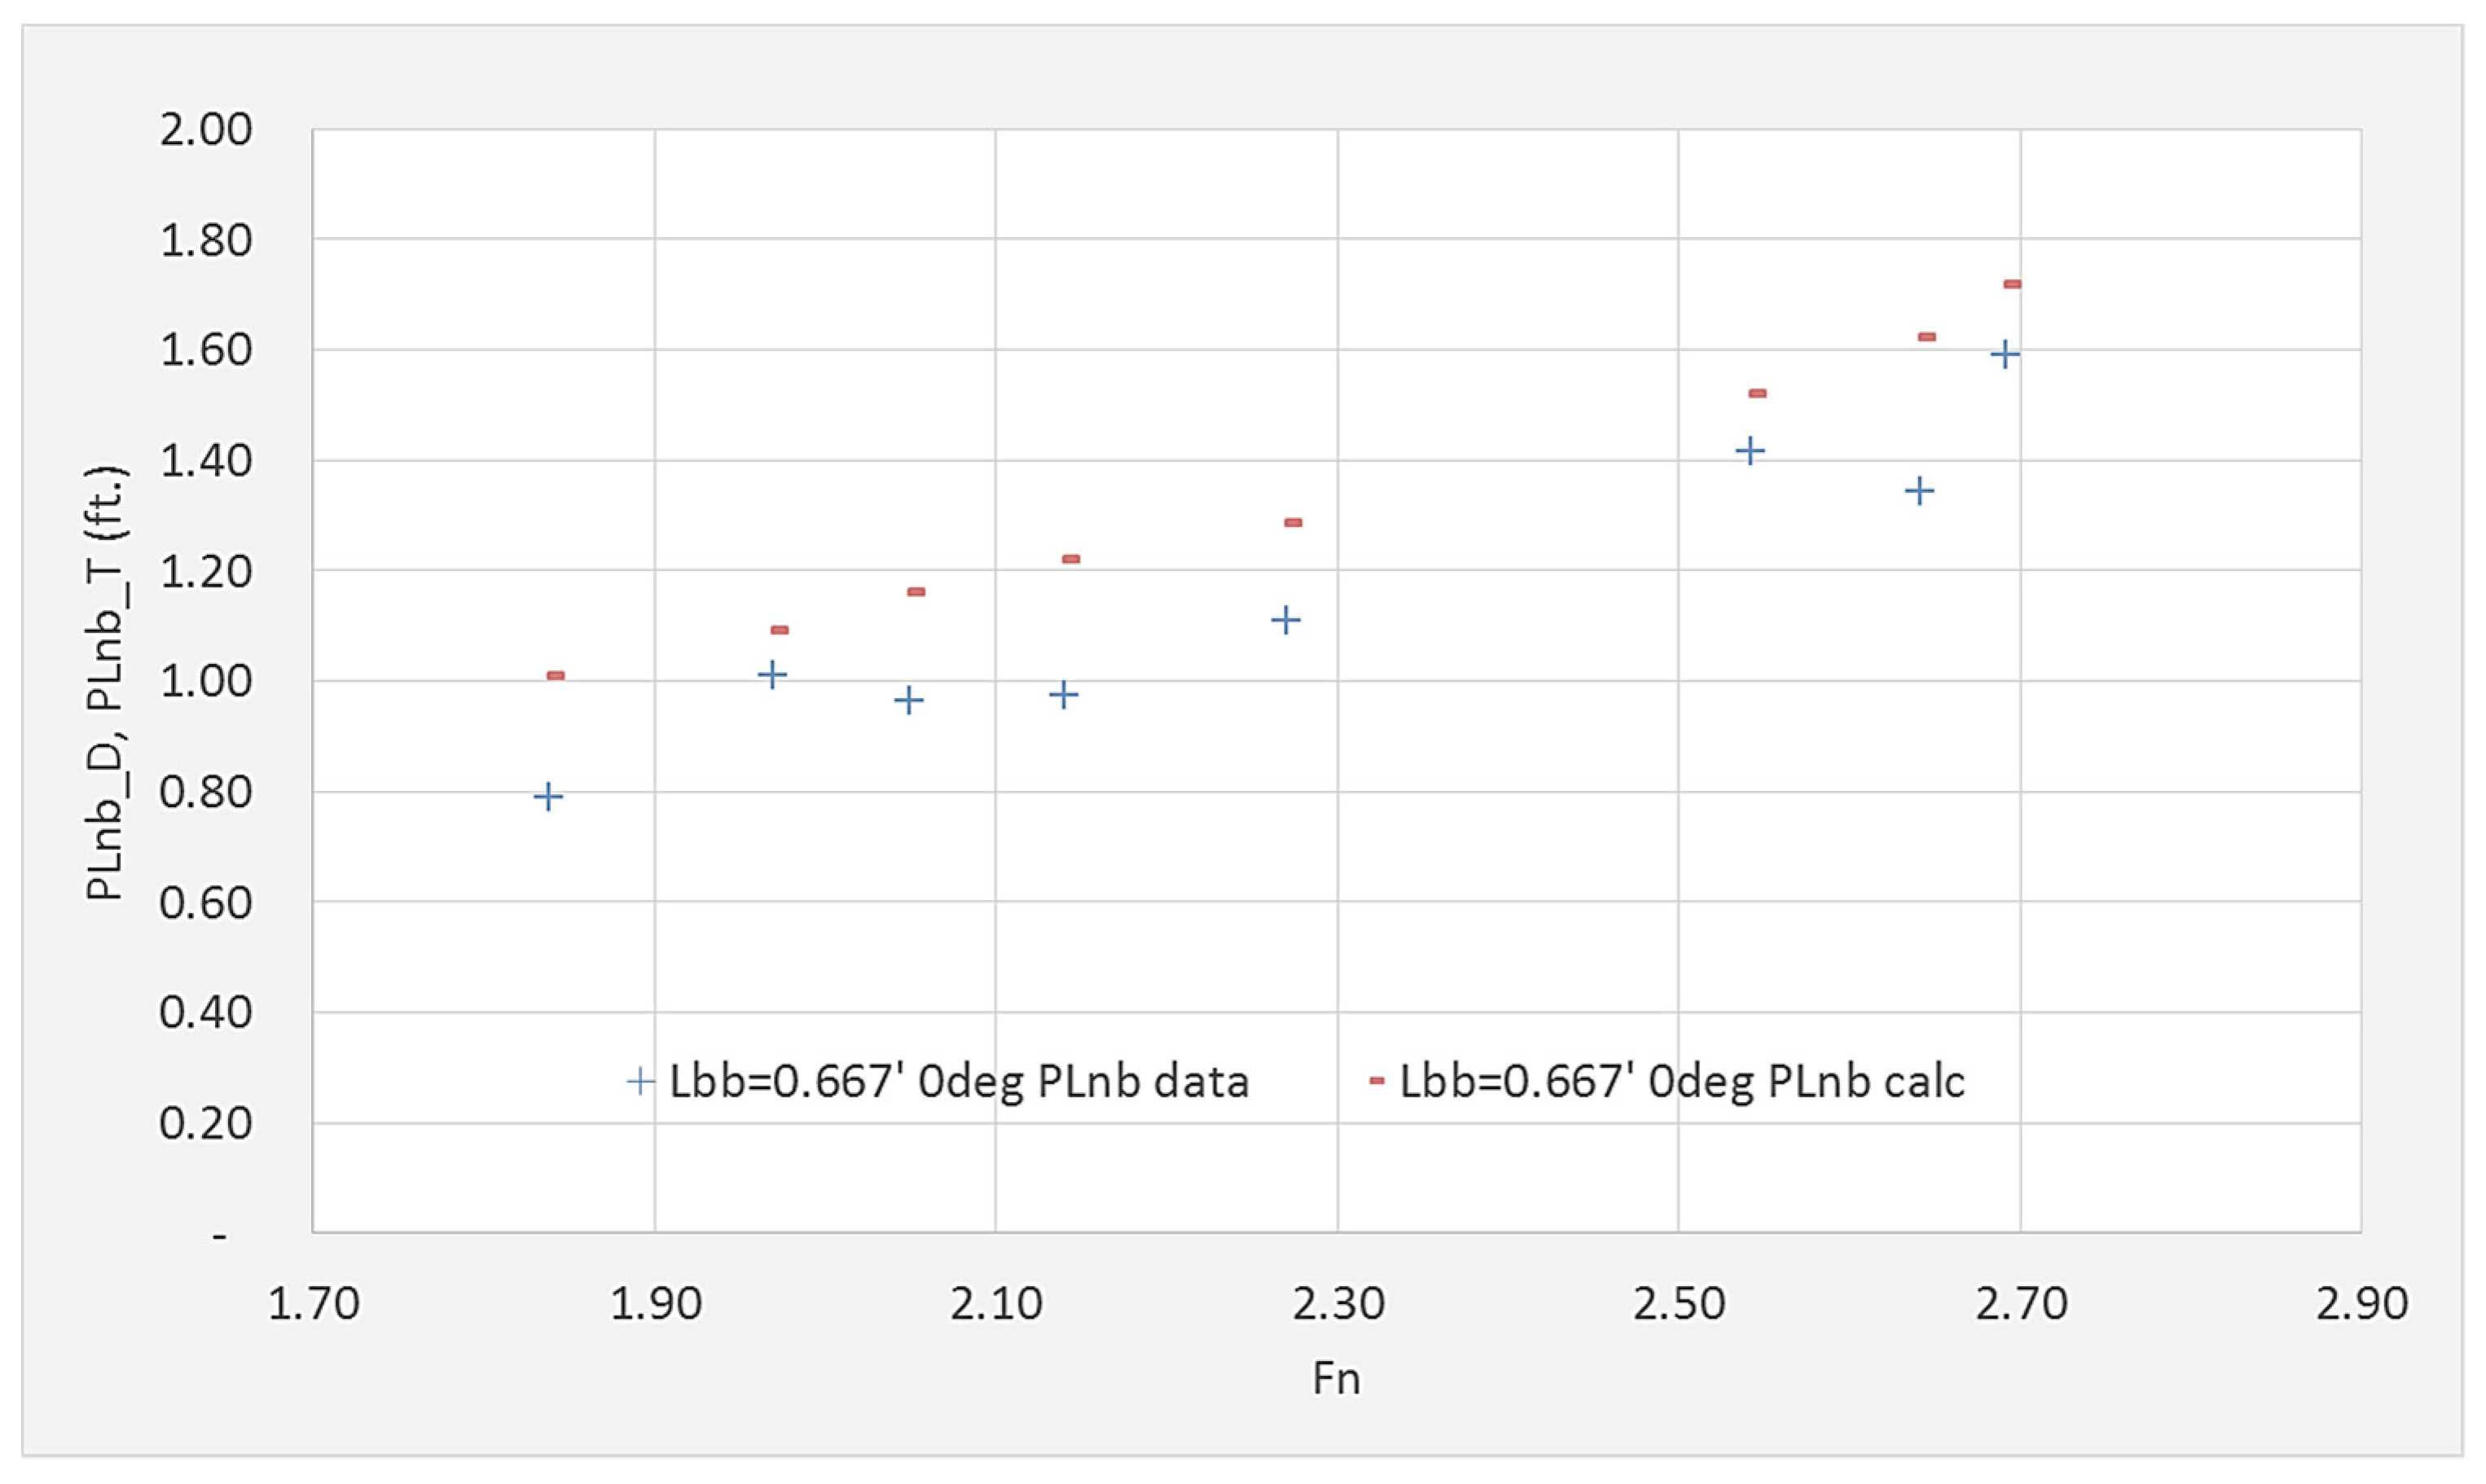
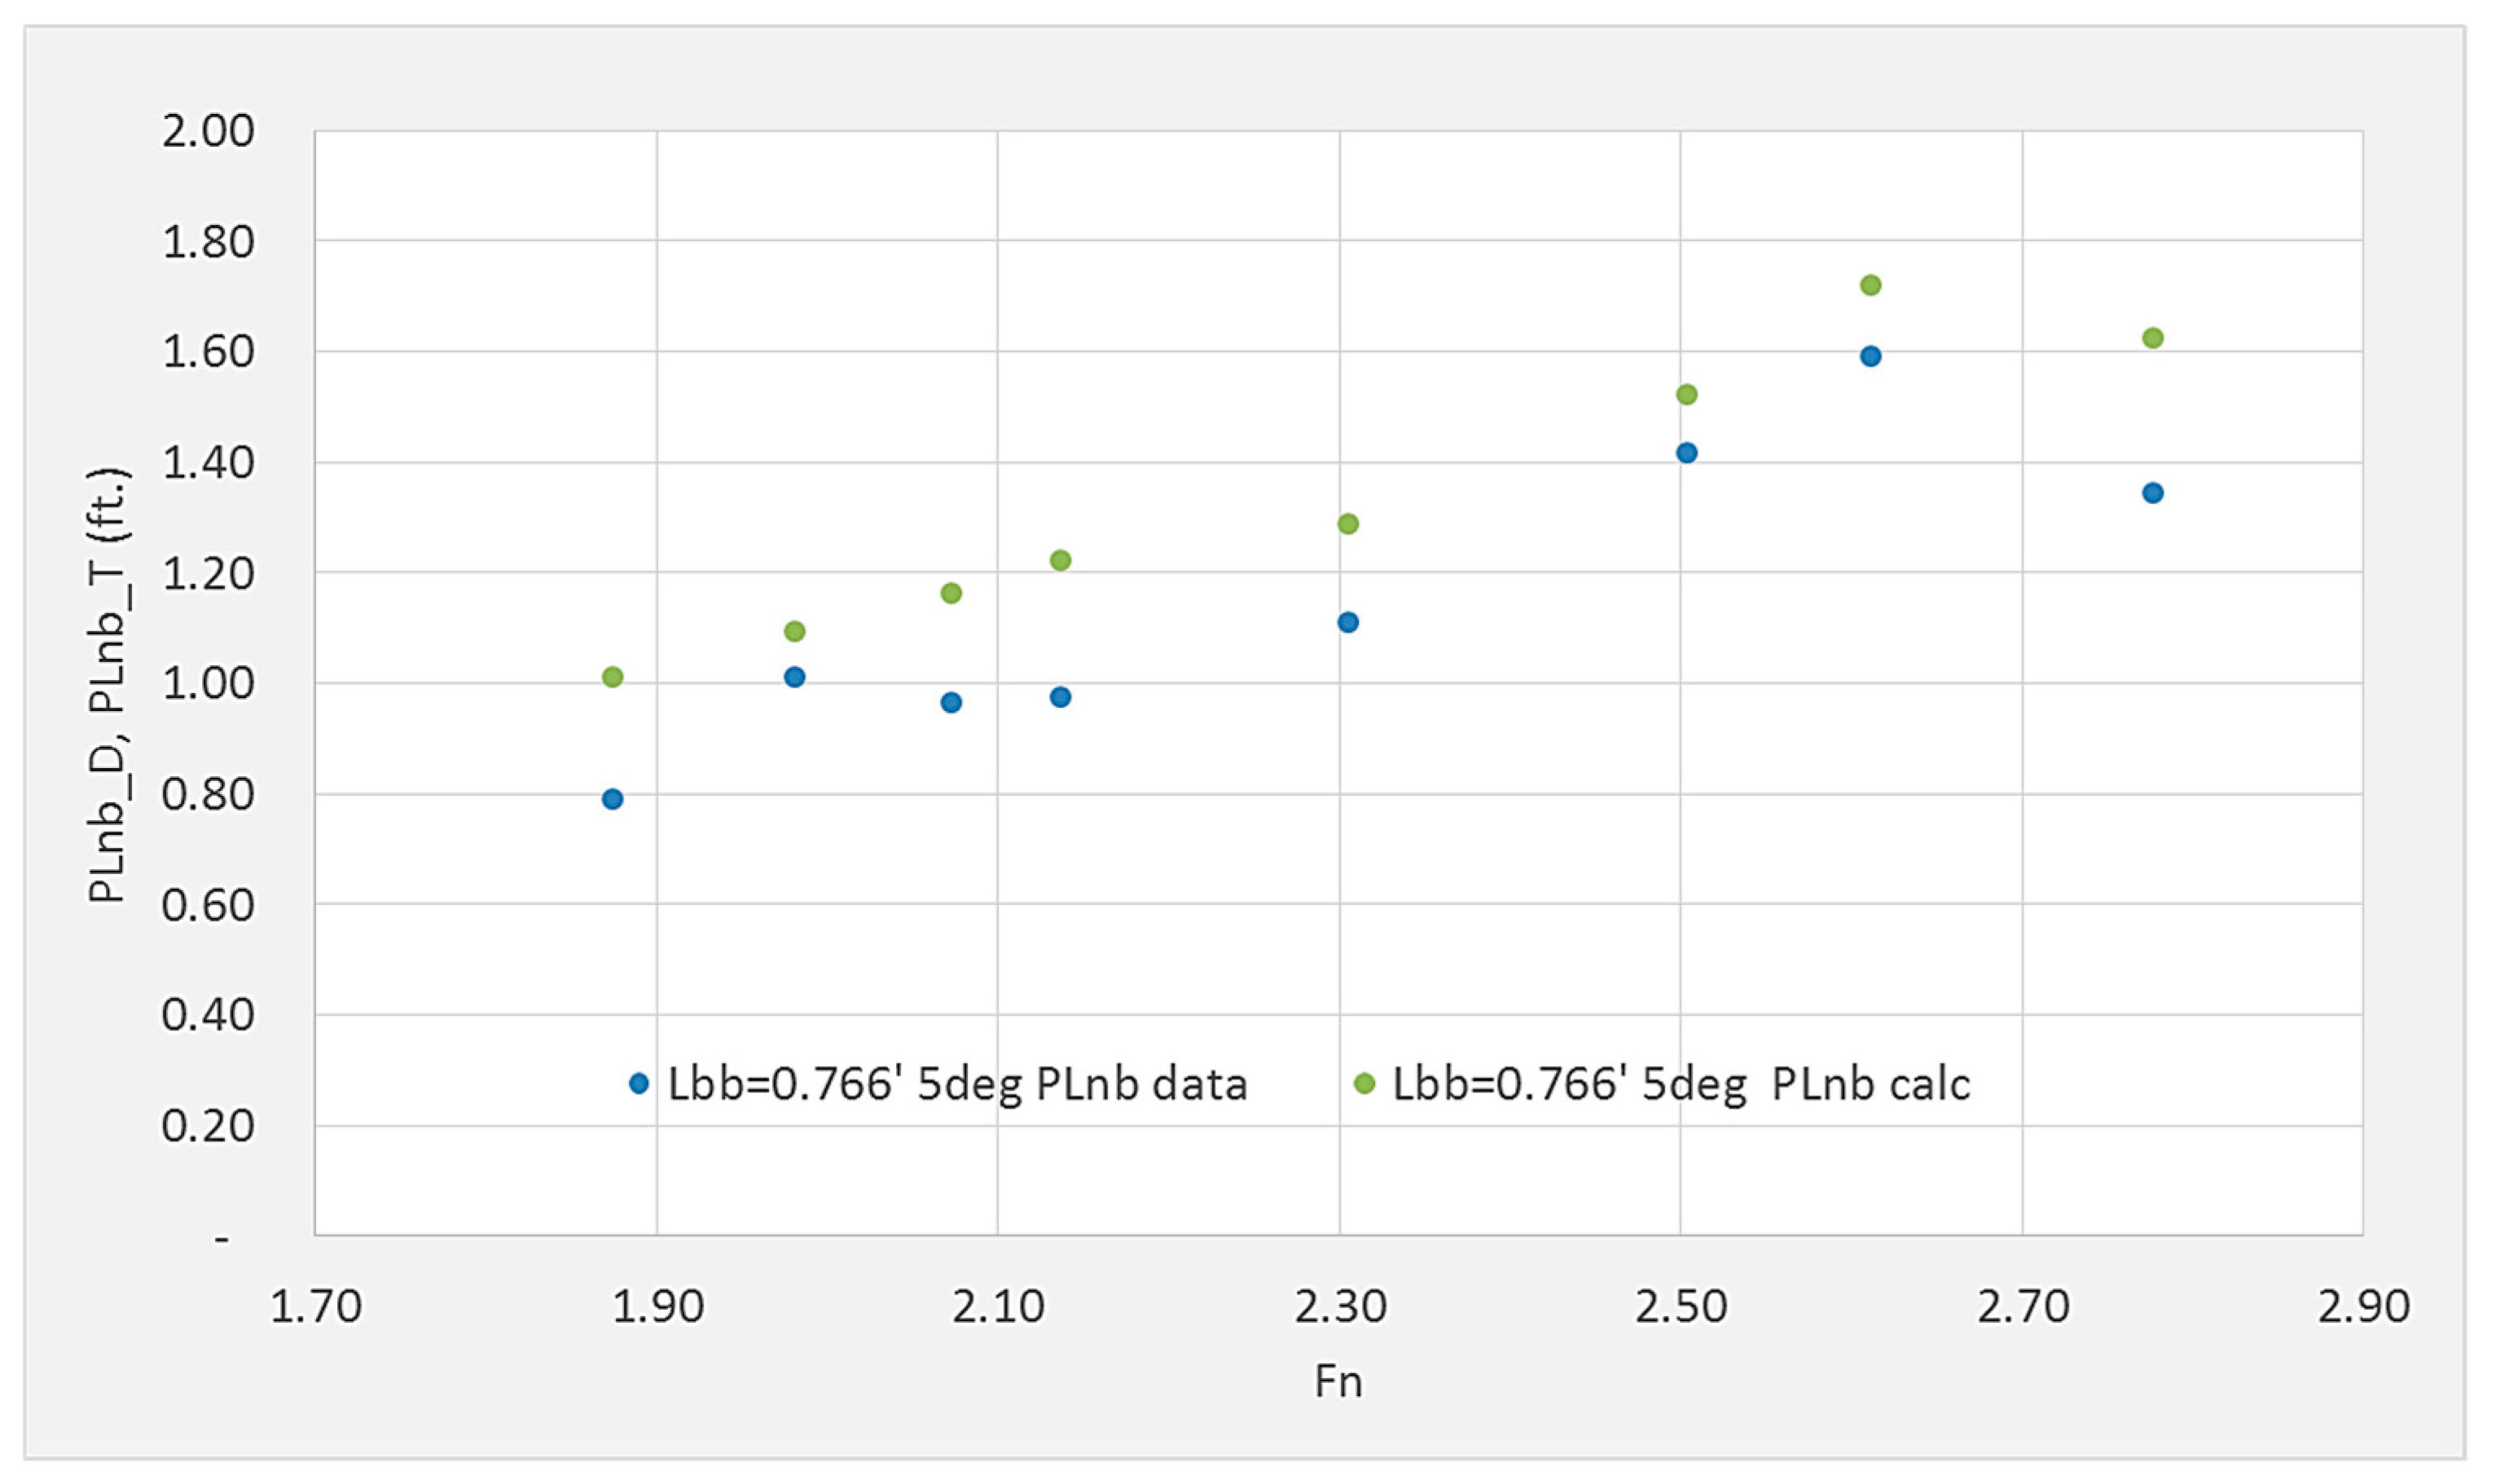
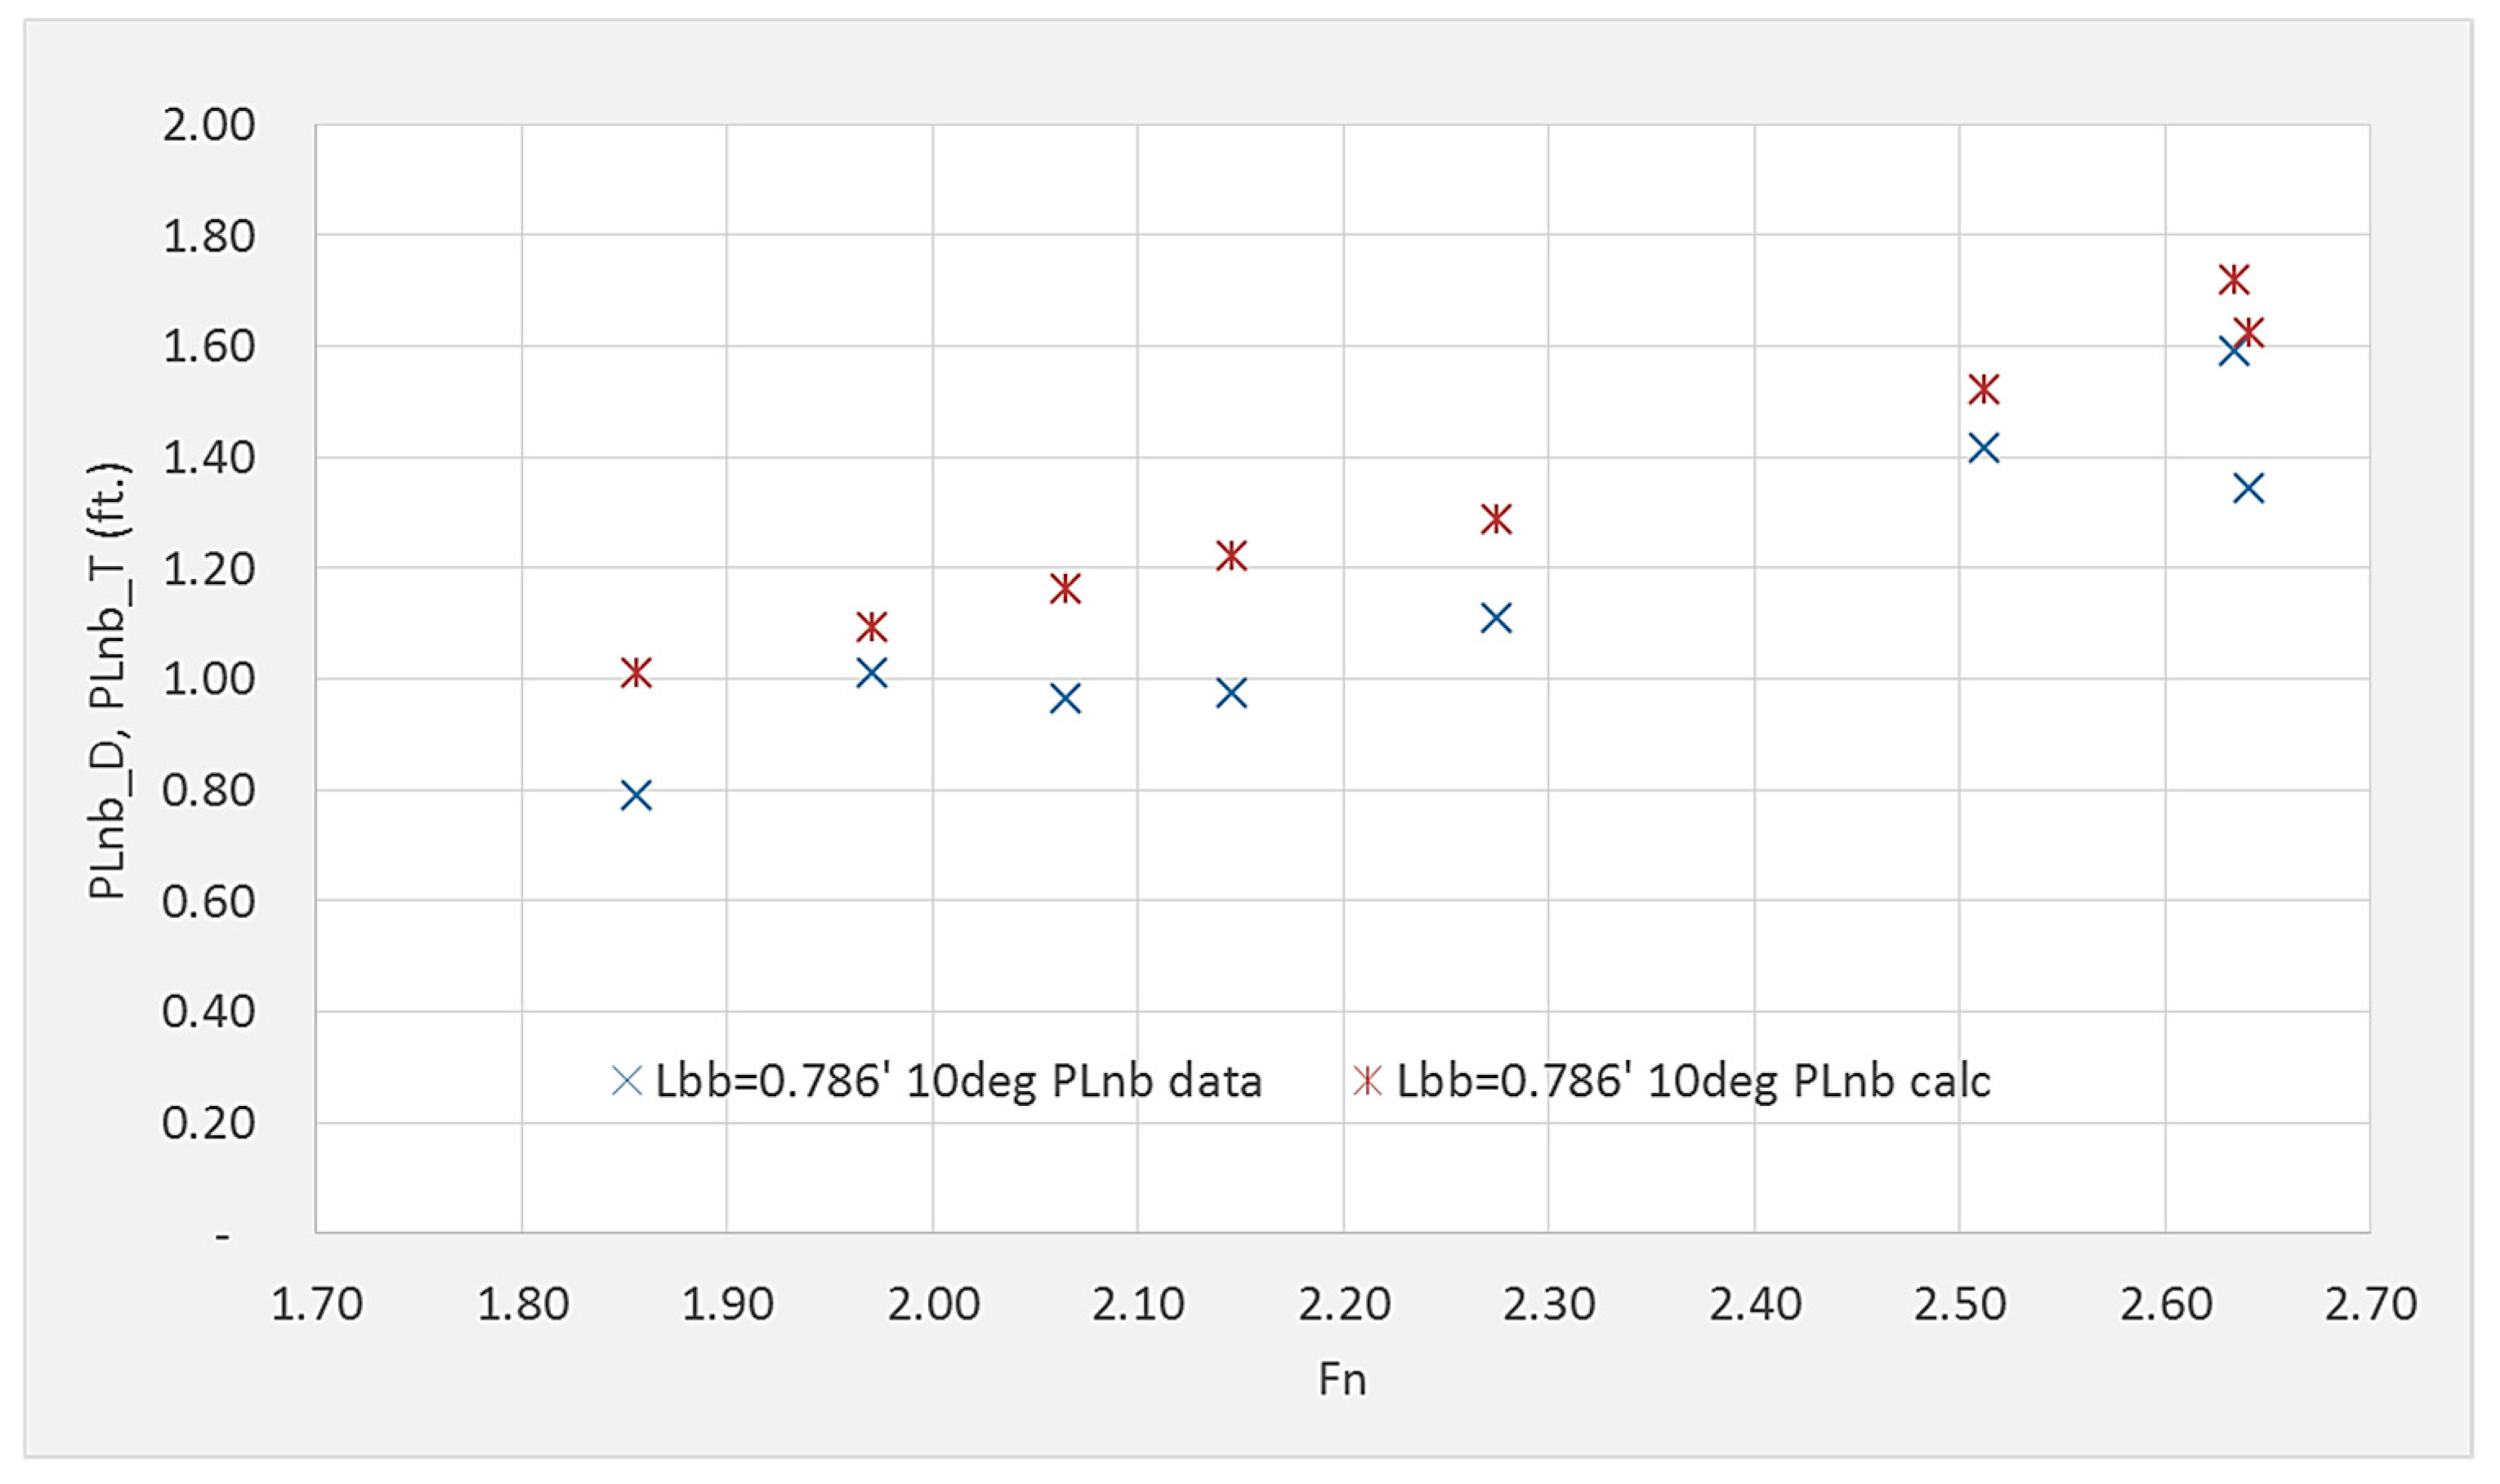
3.3. Bulbous Pier Water Level
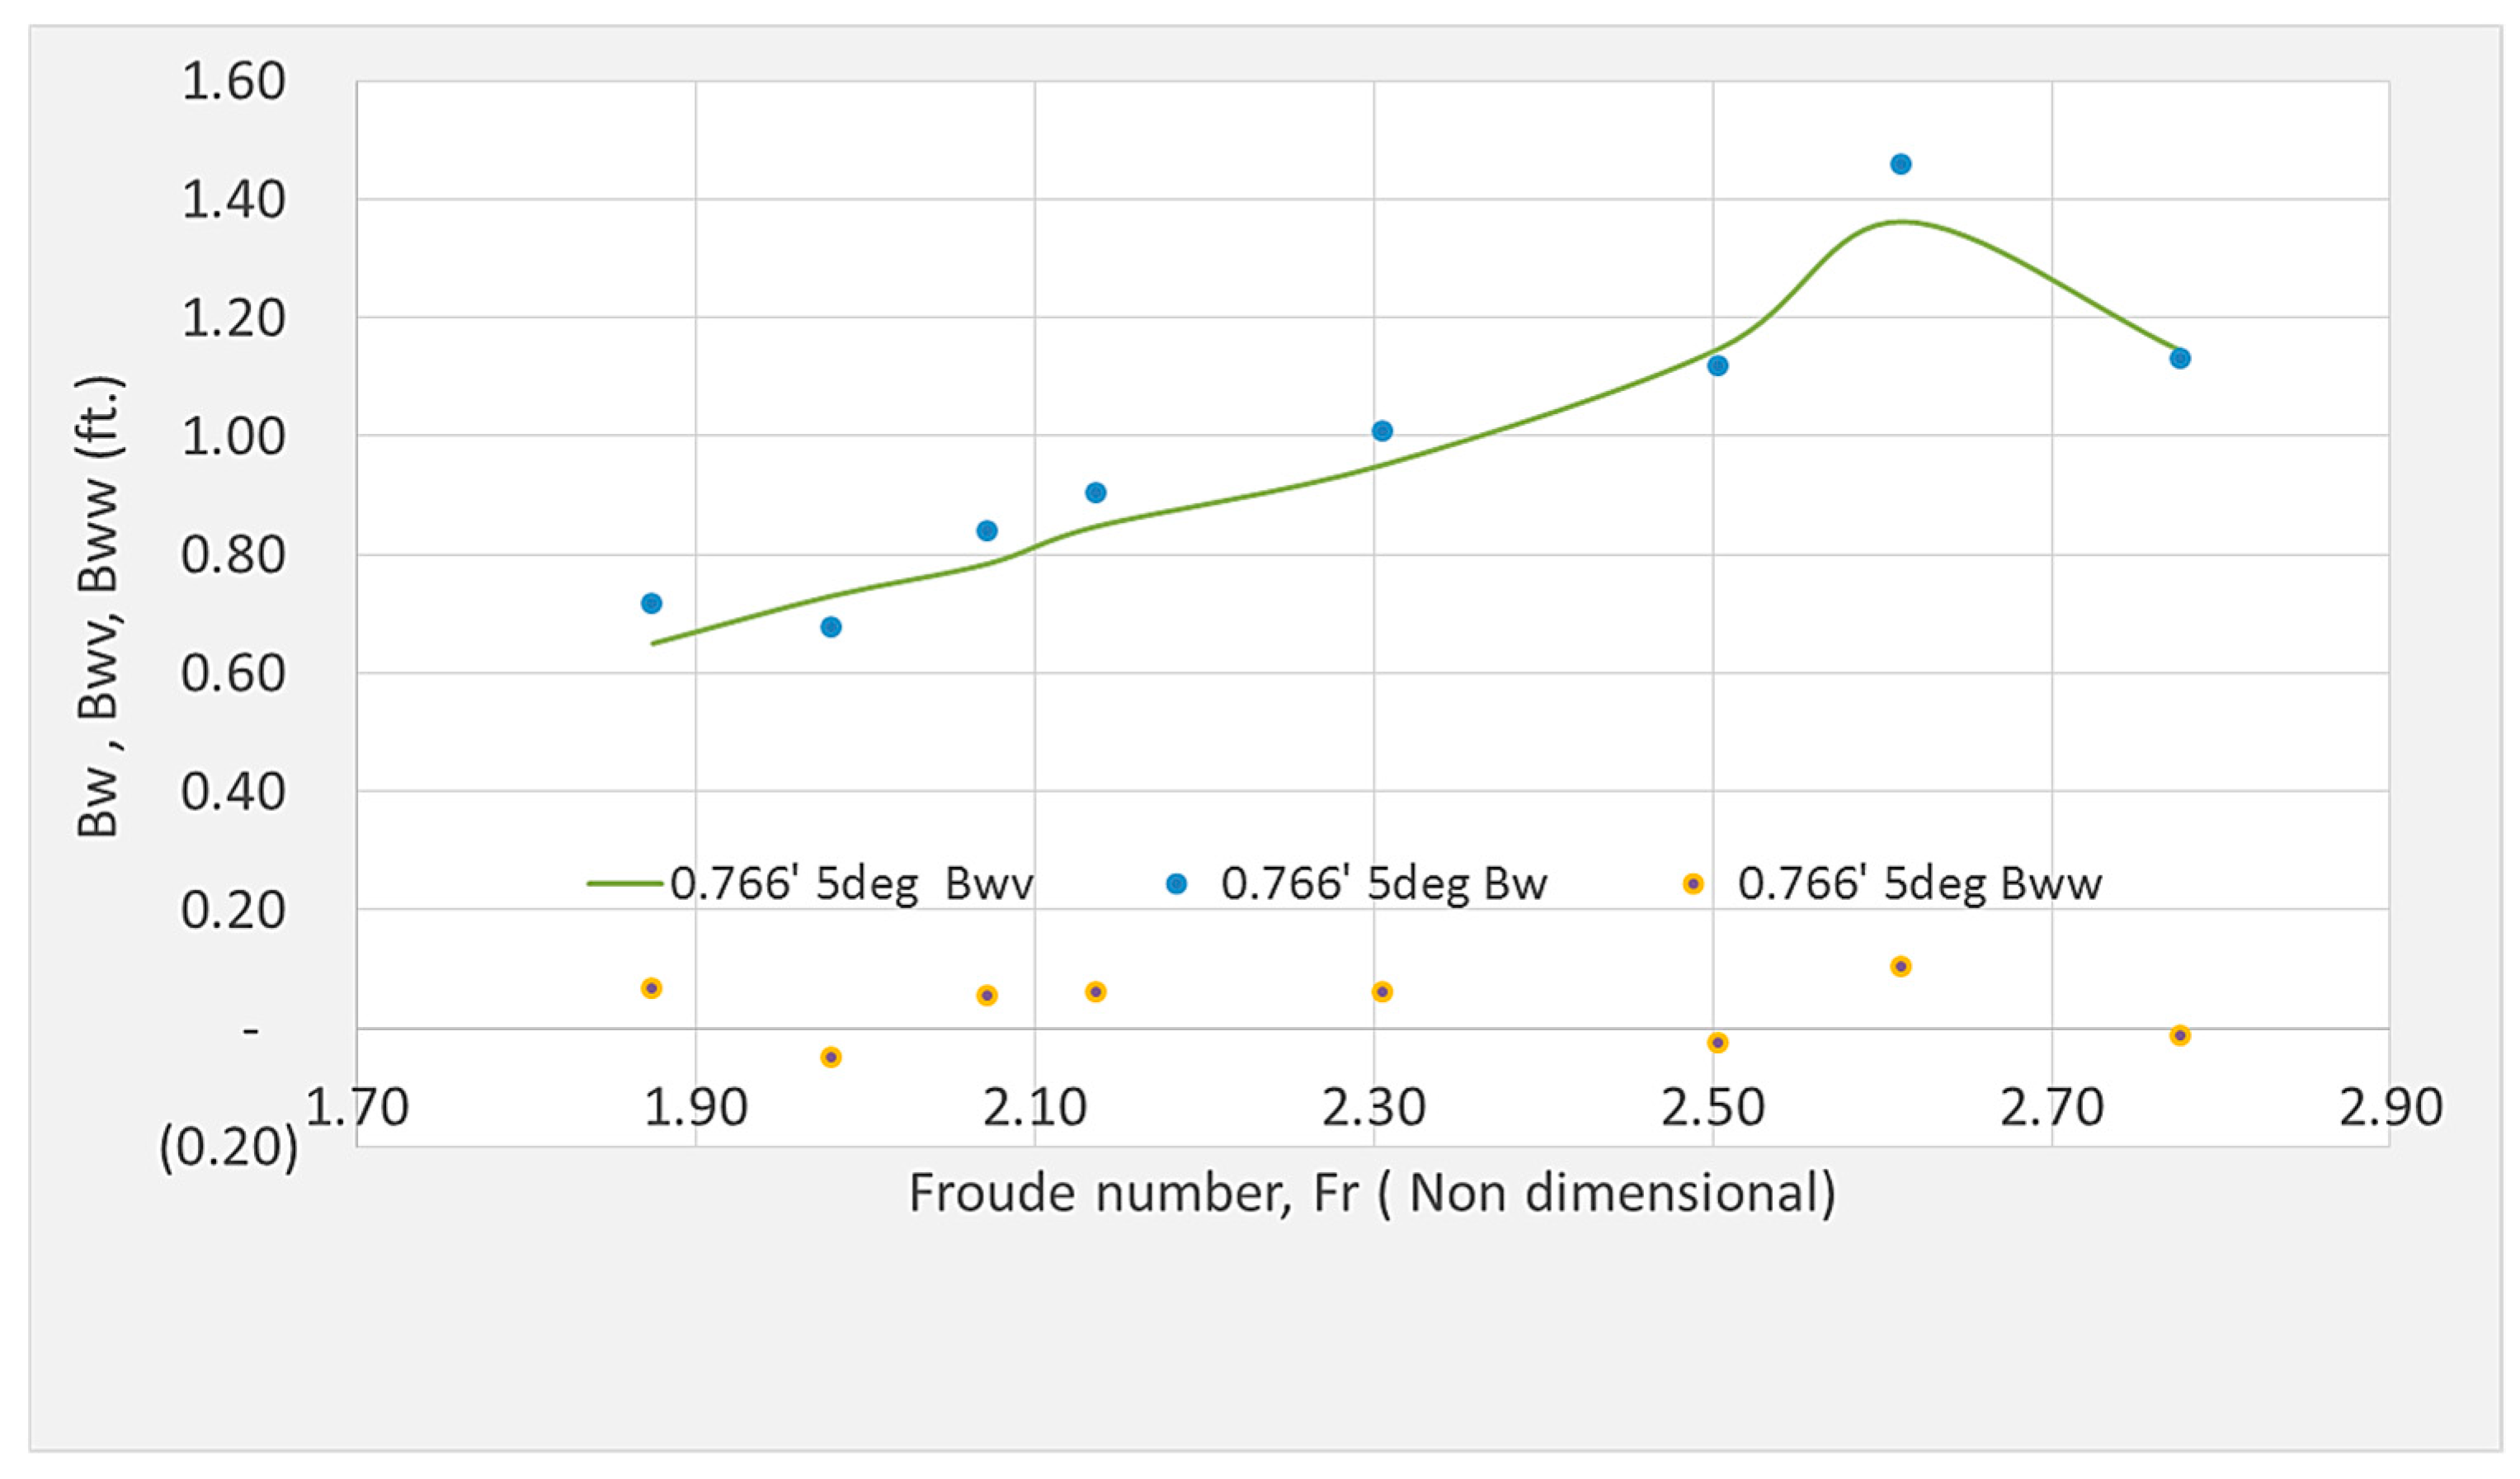
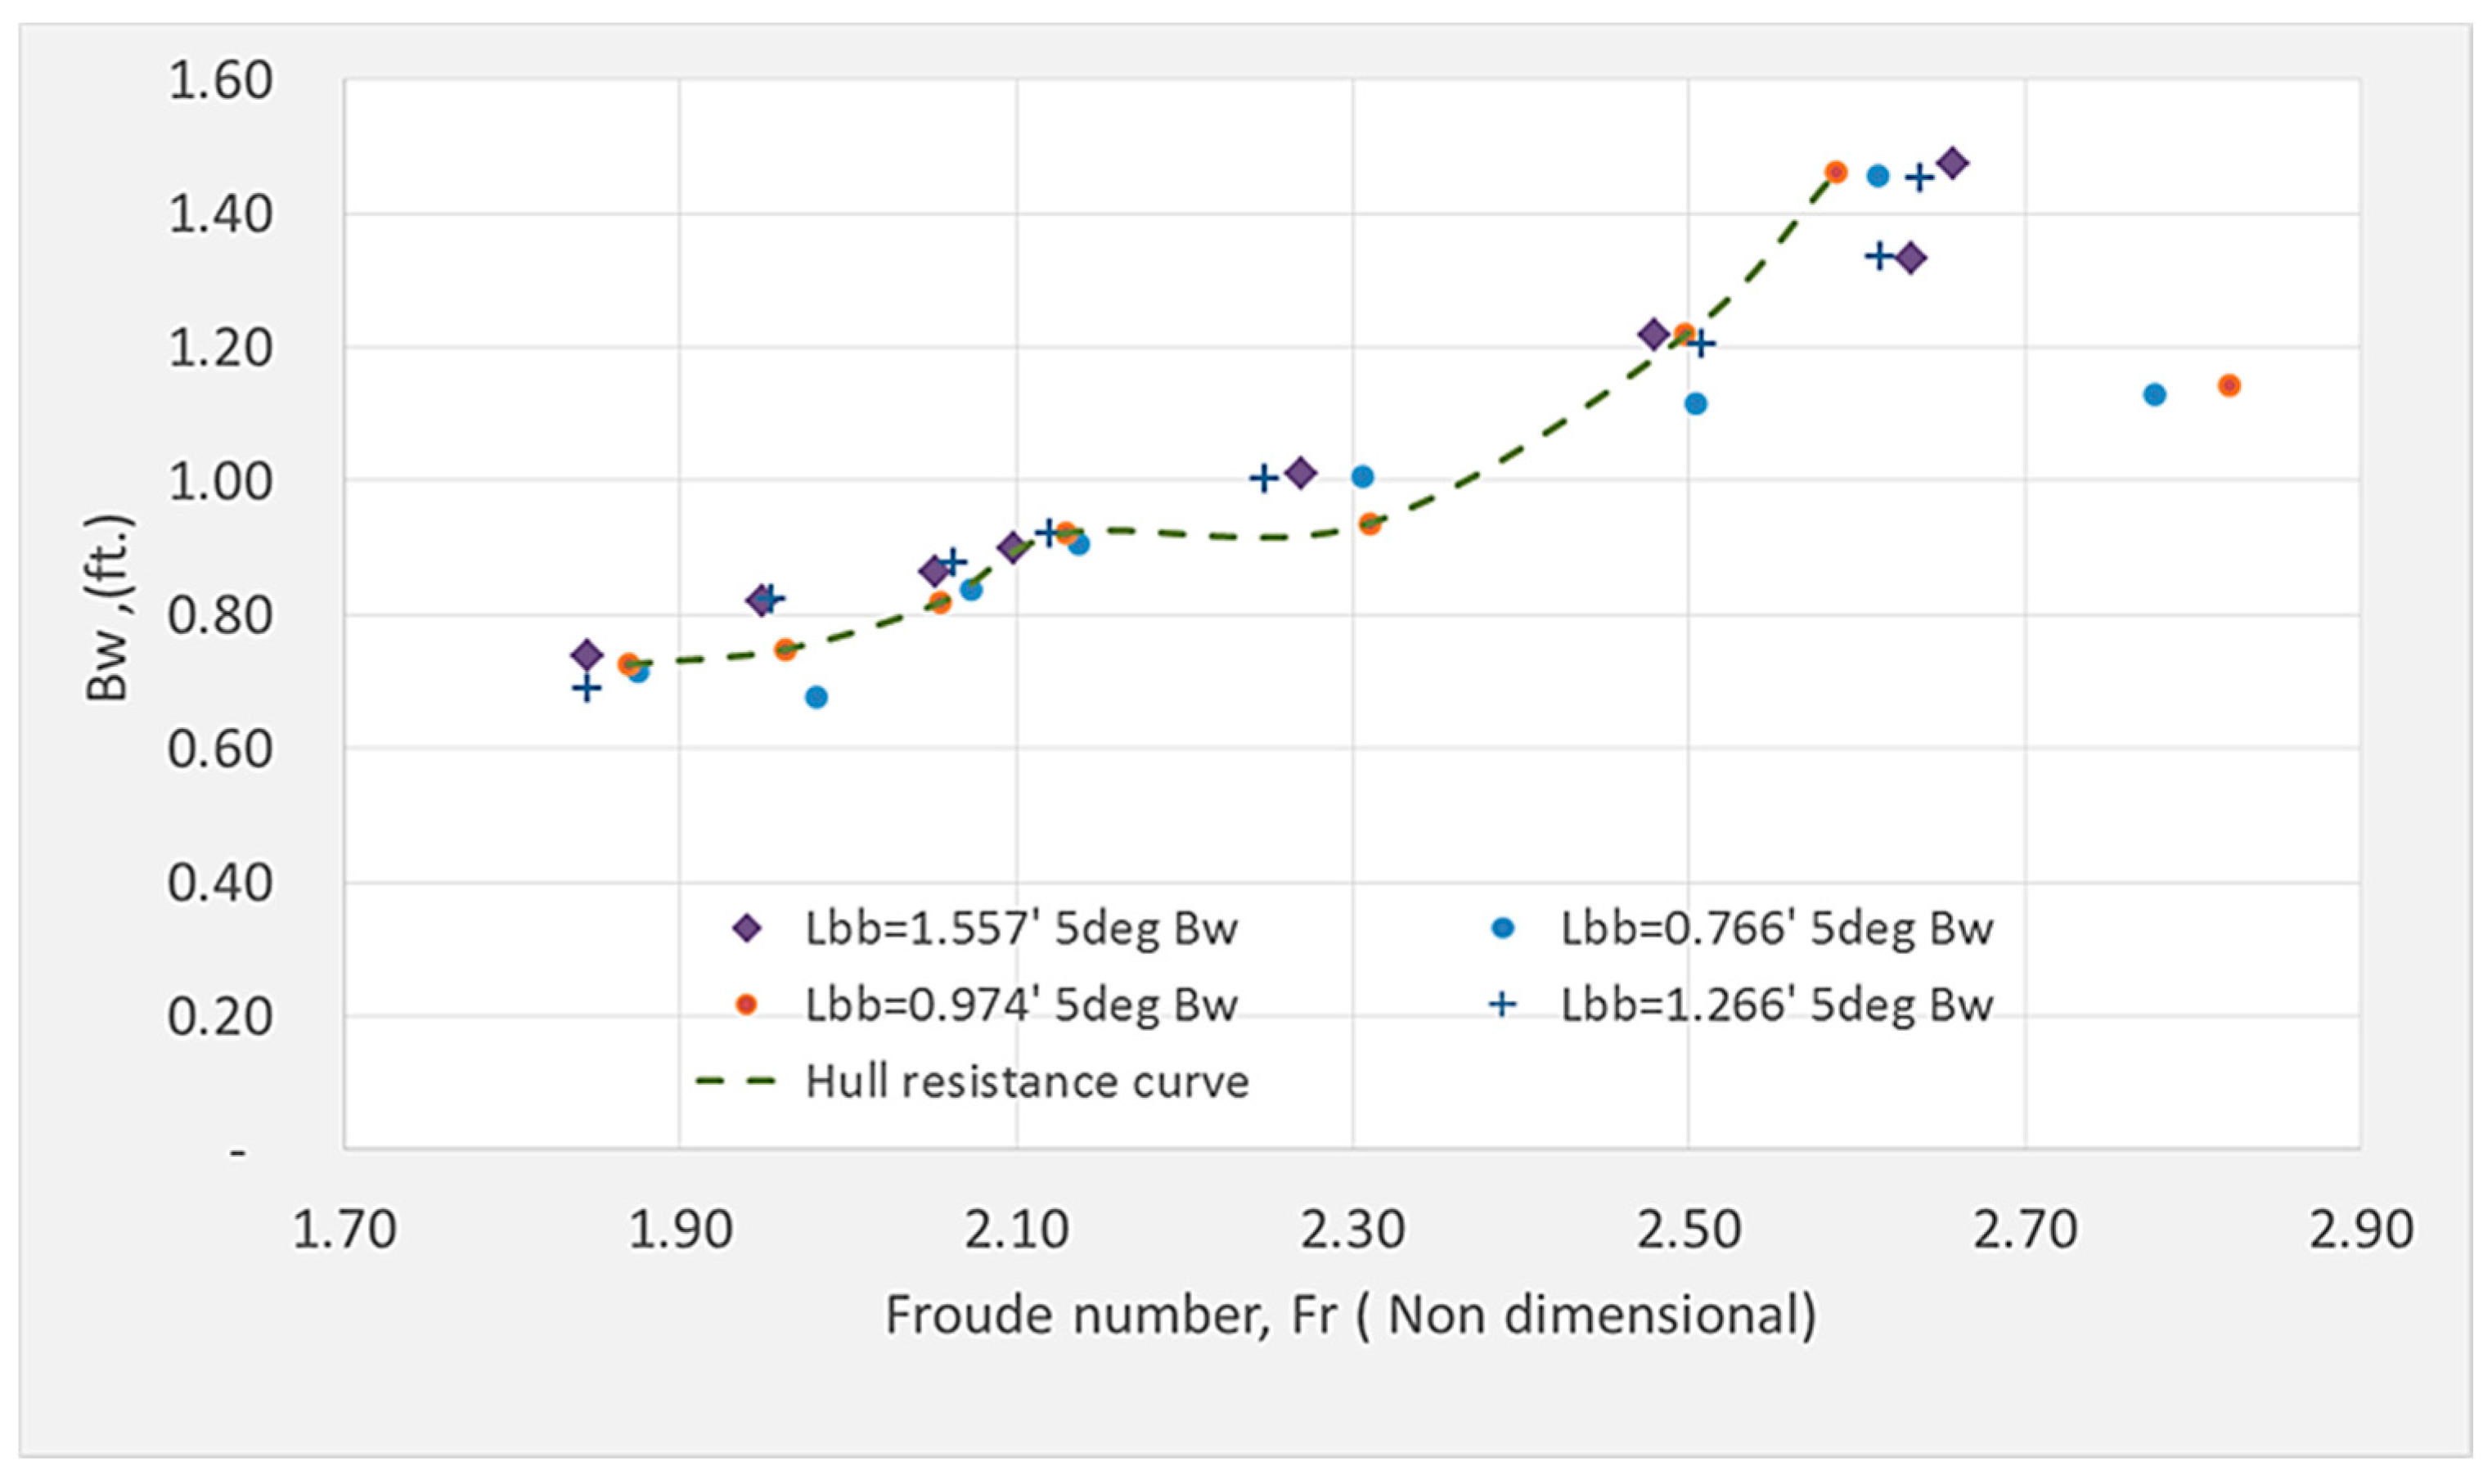
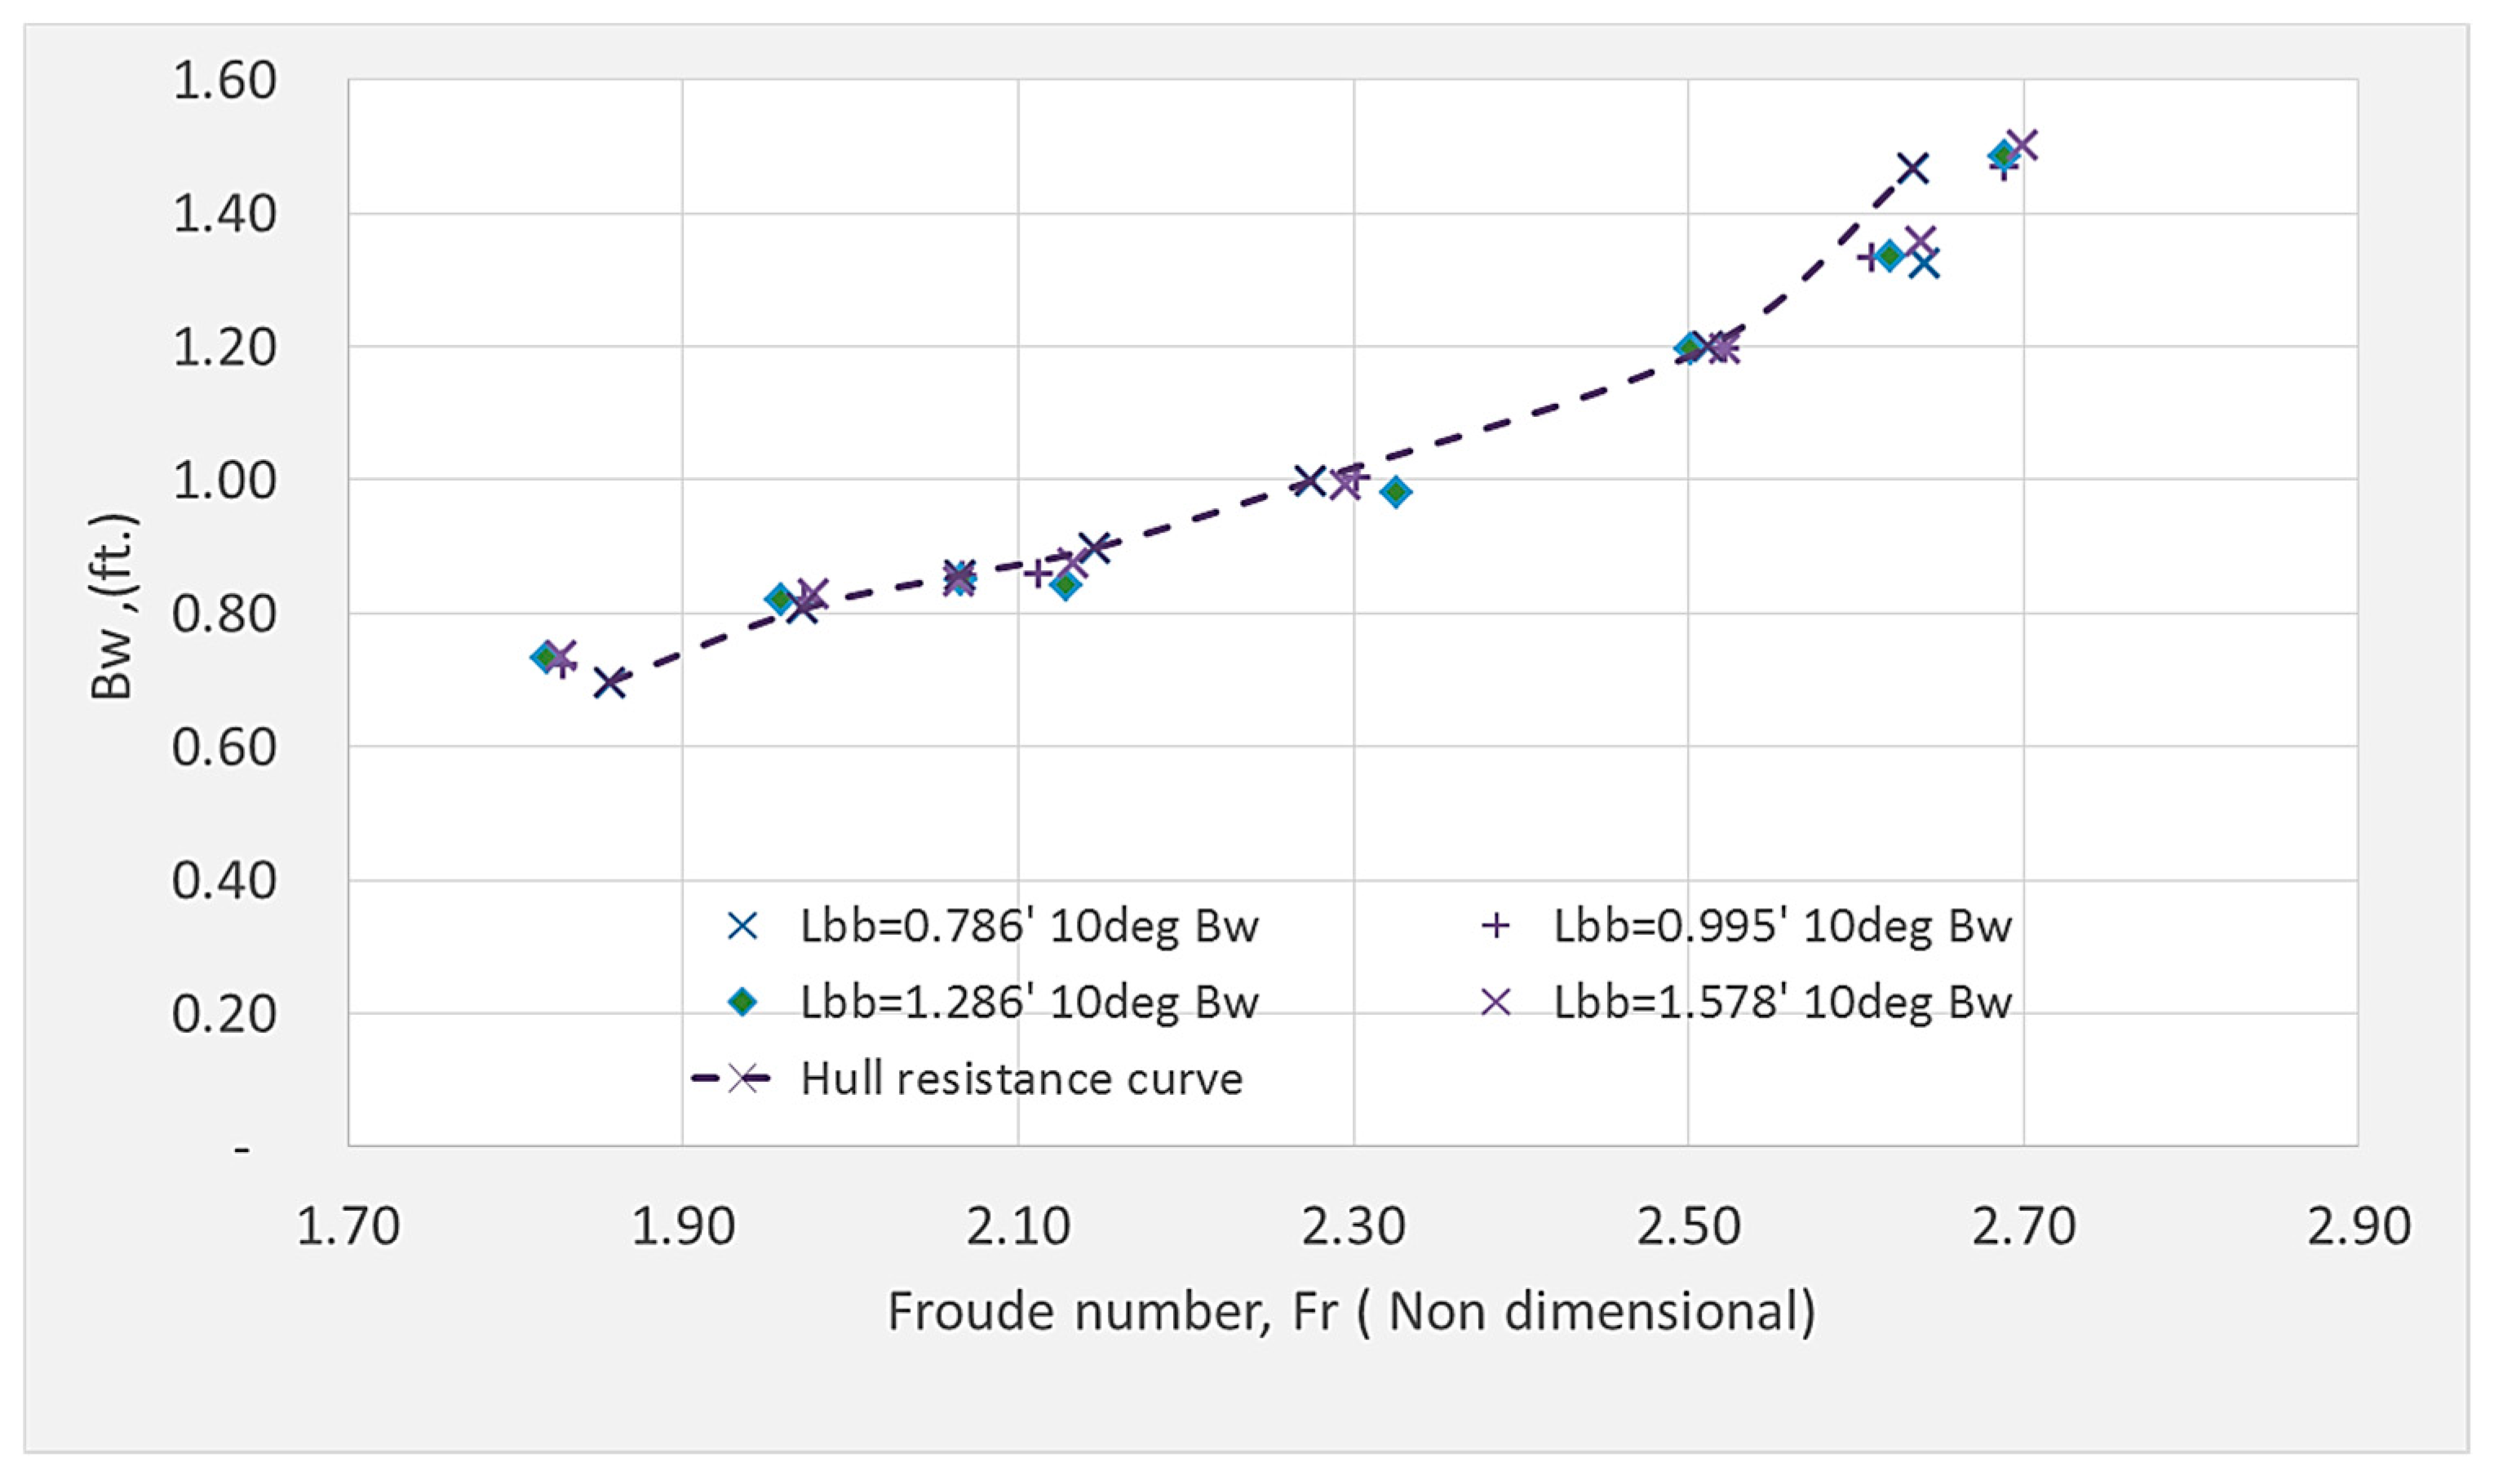
According to Figure 14, Figure 15 and Figure 16, the use of Equation (16) overestimates the value of the calculated non-bulb pier water level (PLnb_calc) vs. the data collected for the non-bulb pier water level (PLnb_data). This error propagates to the calculation of the theoretical bulbous pier water level (PLbb_calc). The overestimation is a consequence of energy losses due to frictional losses at the pier nose, and the air-water interactions ignored by Equation (16).

3.4. Bulb Wave

Bw follows the form of the hull resistance curve as predicted (Figure 17 and Figure 18). Consequently, Rv, and Rw can be calculated using the proposed set of equations for PLbb.
For the 10° bulbous with an Lbb over 0.995′, the Lbb is meaningless; since once the bulbous tip is above the water, there is no contribution to the Lbbs. Reading the PLbb using the capacitive level meter had a large standard deviation, as a consequence of the turbulent nature of the pier wave. To simplify the mathematical analysis, the PLbb maximum was selected to calculate the Bw. This assumption was in line with the goal of preventing deck splashing.

3.5. Bulbous Viscous and Wave-Making Resistance

The Yh in the flume changed constantly due to the turbulent nature of the flow. Changes in the Yh affect the calculation of the BBas, and attempts to reduce the flow turbulence, while maintaining high water velocity, were unsuccessful. The data recording system stored over 3000 points for the test case; therefore, a narrow range of Yh (4.4 < Yh < 4.6 in.) was selected to obtain a statistically significant number of readings per test case (n > 30).
From Figure 19, Figure 20 and Figure 21, it is clear that the viscous resistance was the main component of the Bw. According to ship hull design theory, the wave-making resistance becomes dominant when the Lbbs is equal or greater than the Lw. For the 0° pitch angle bulb, the submerged length was always less than the bulb wavelength (see Equation (18) and Figure 19). Consequently, Equation (17) was modified to include only the viscous component (Equation (19)). This assumption underestimates the value of the Bw at lower Fr numbers, where the bulb wavelength is closer to the Lbbs.
L b = L w = 2 π v 2 g
B w = B wv .
This approach will eliminate the need for modeling each bulbous pier to obtain the Bww. The cost of modeling a bulbous pier in a flume can easily exceed the cost of building a pier extension.

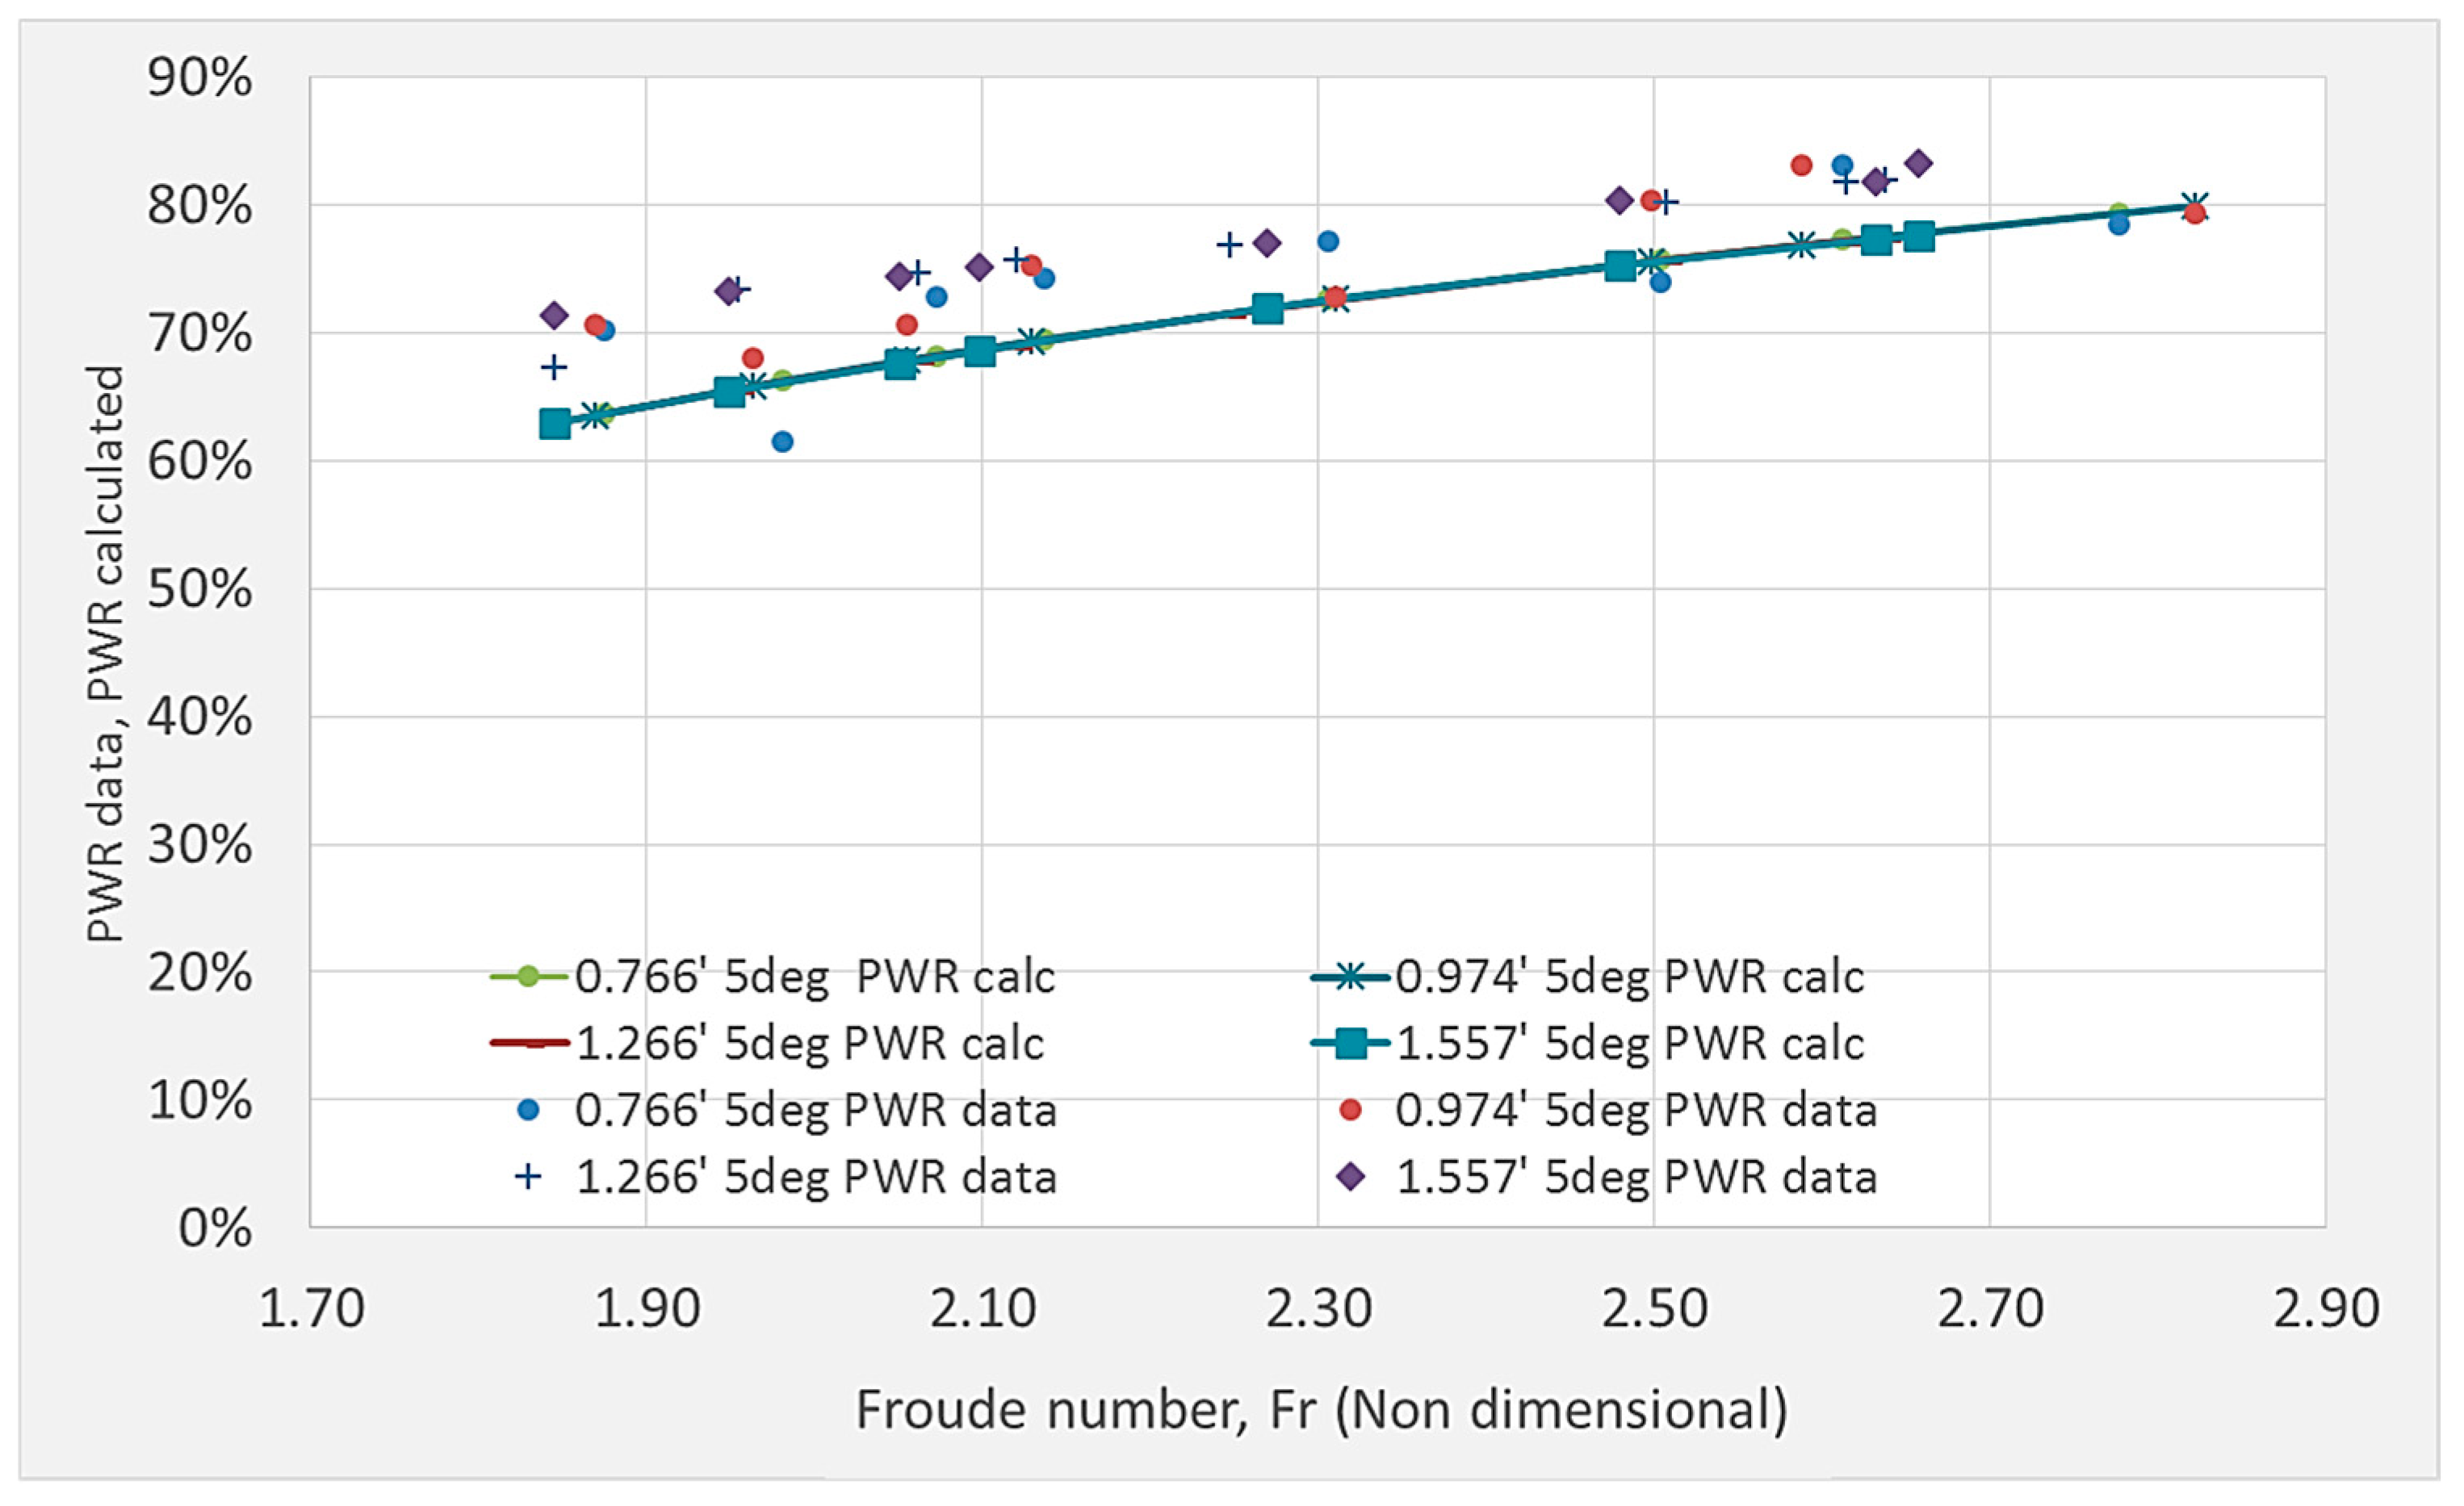
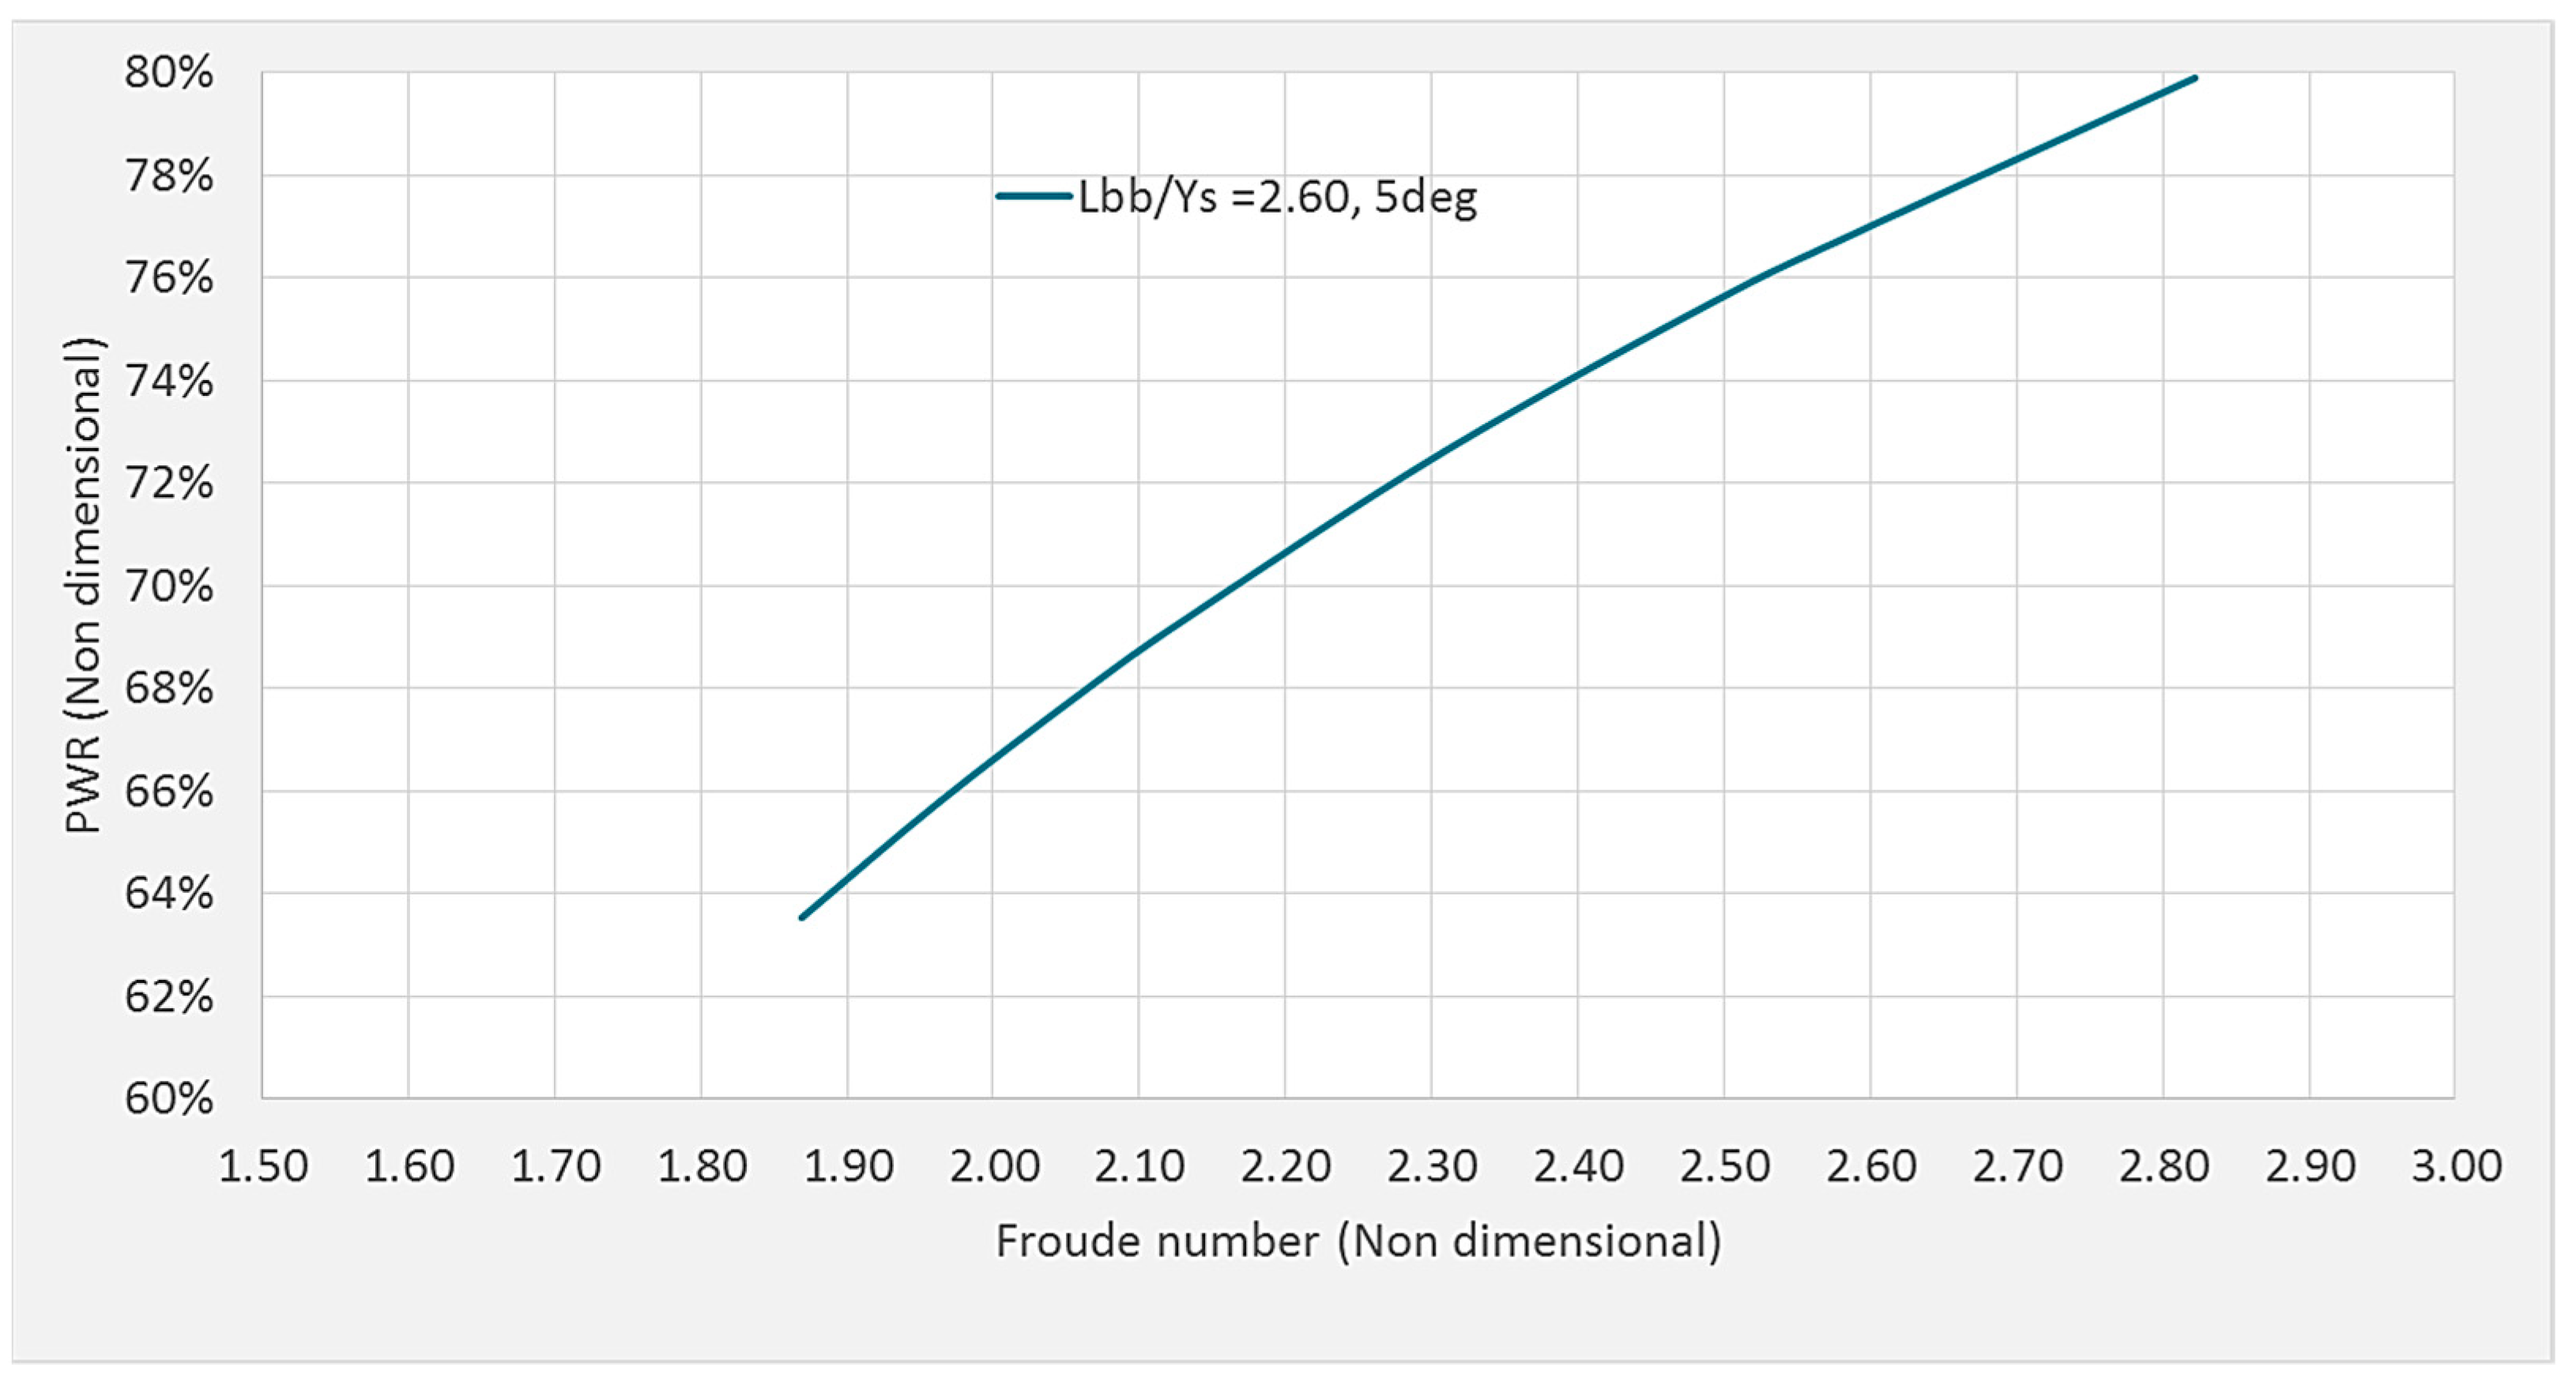
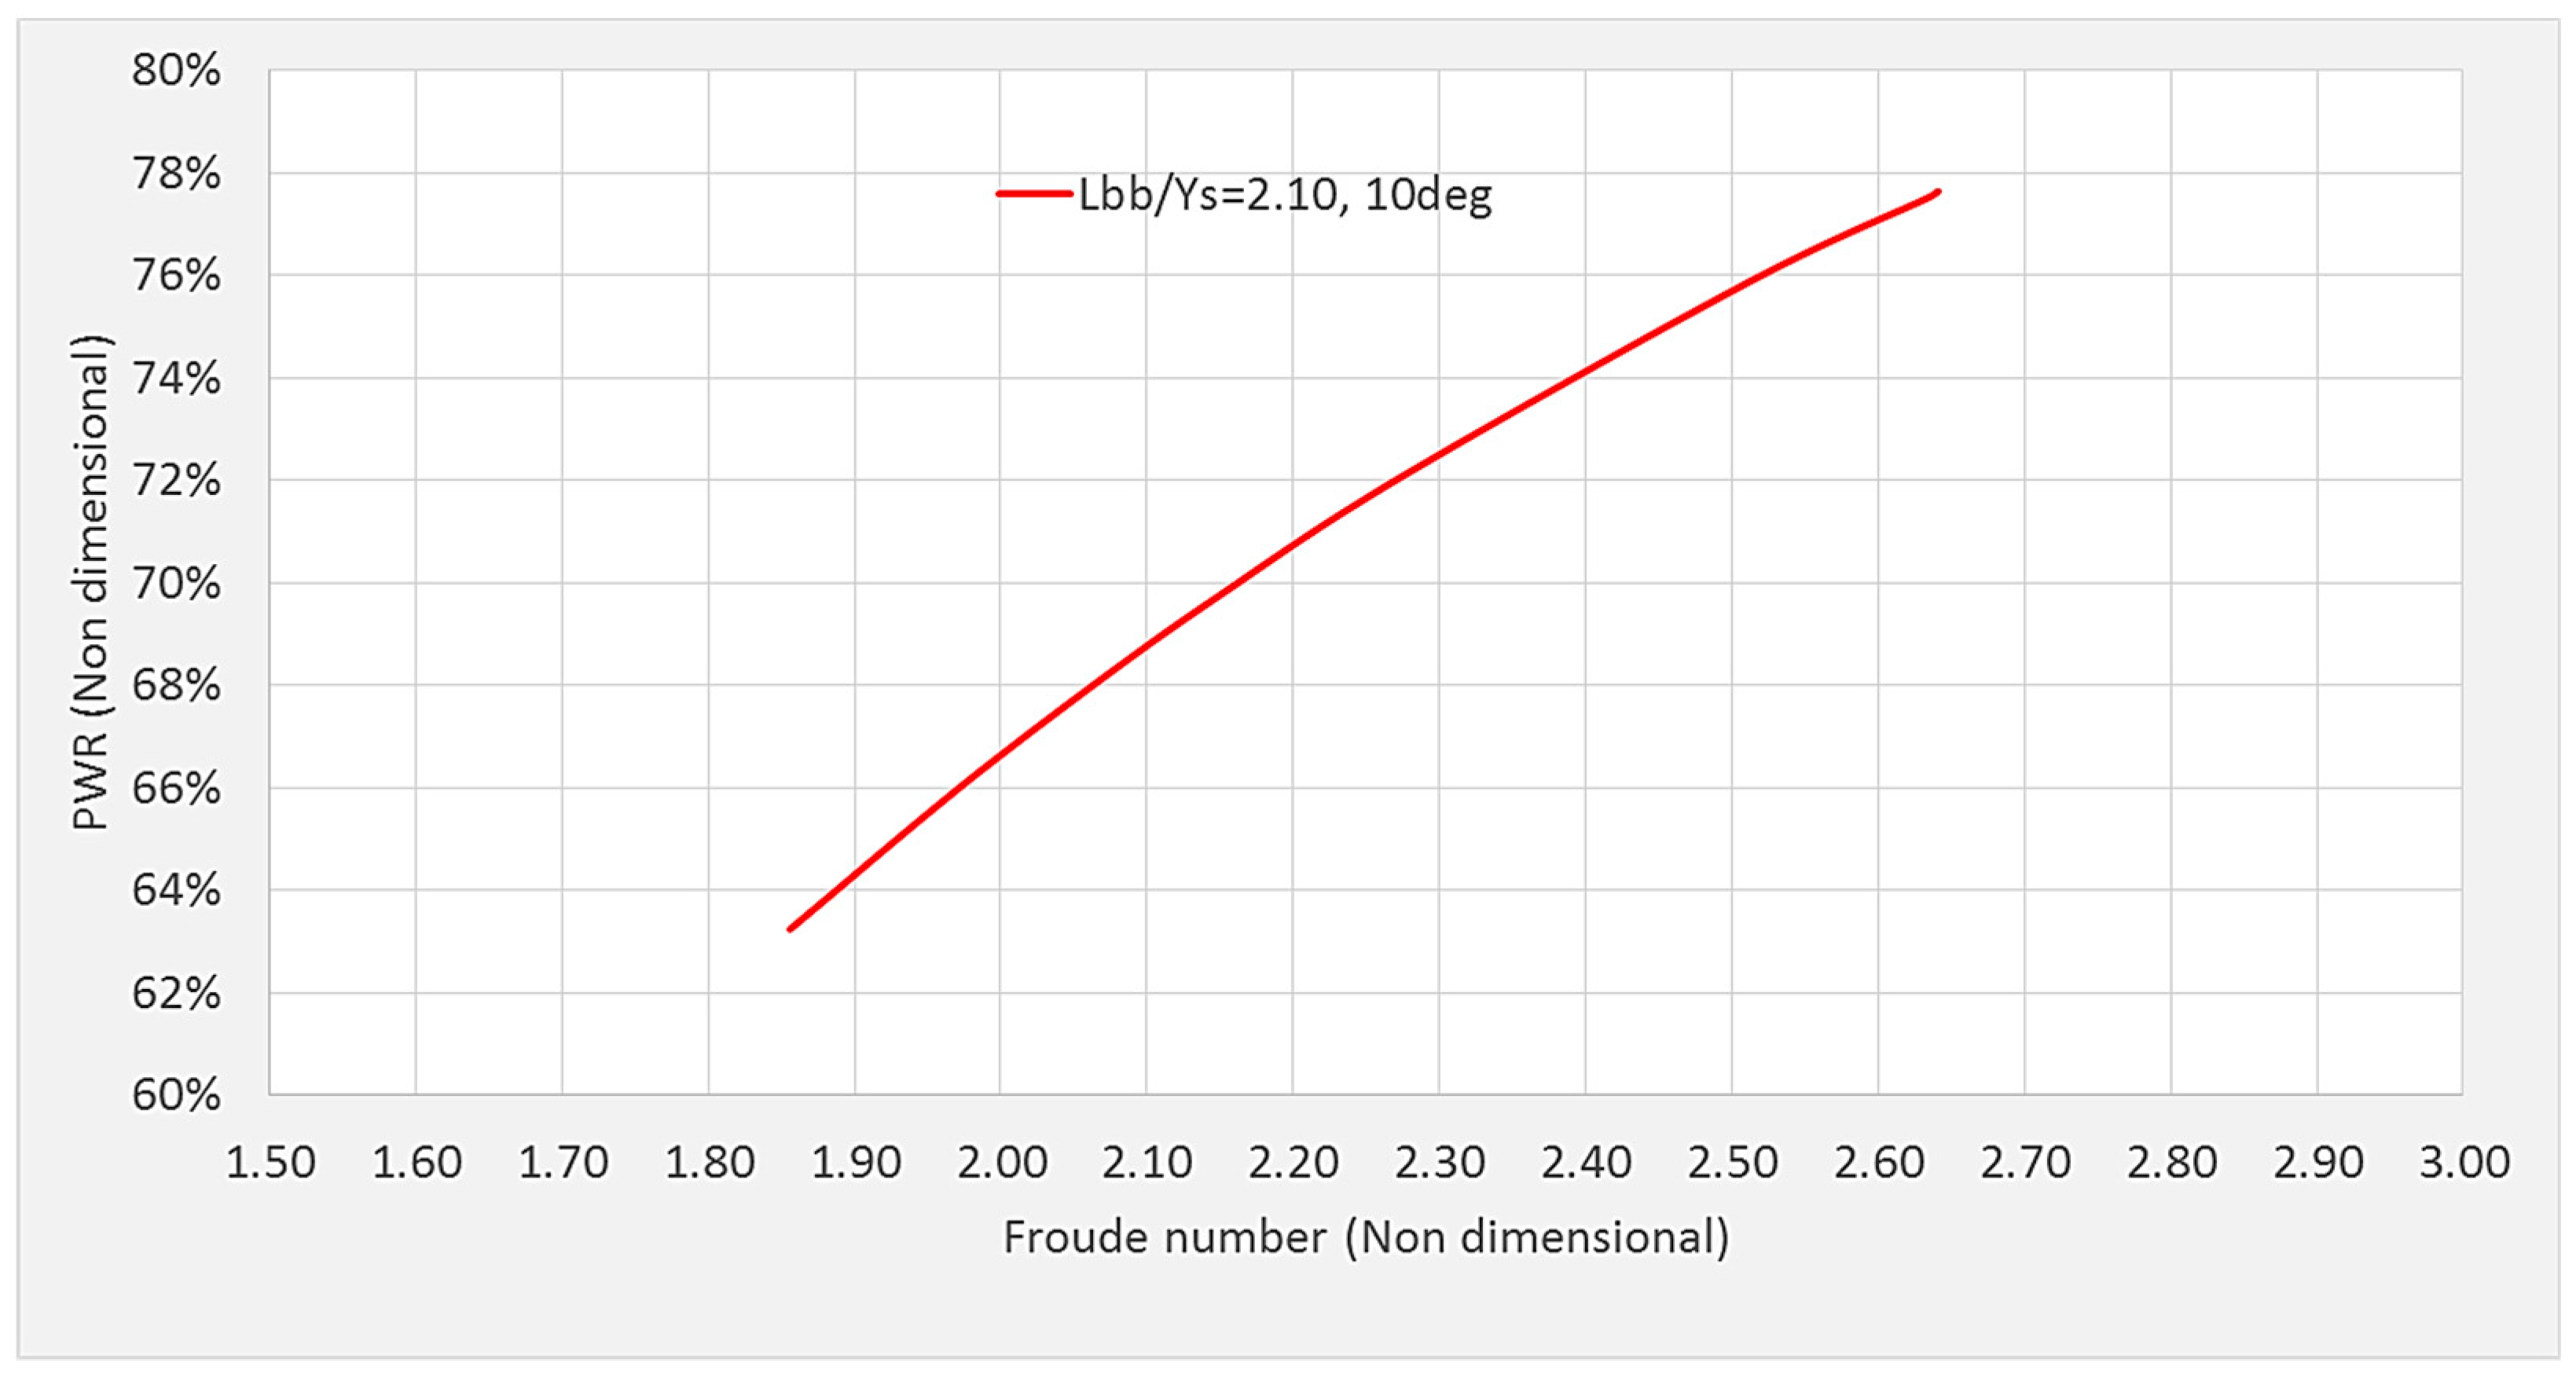
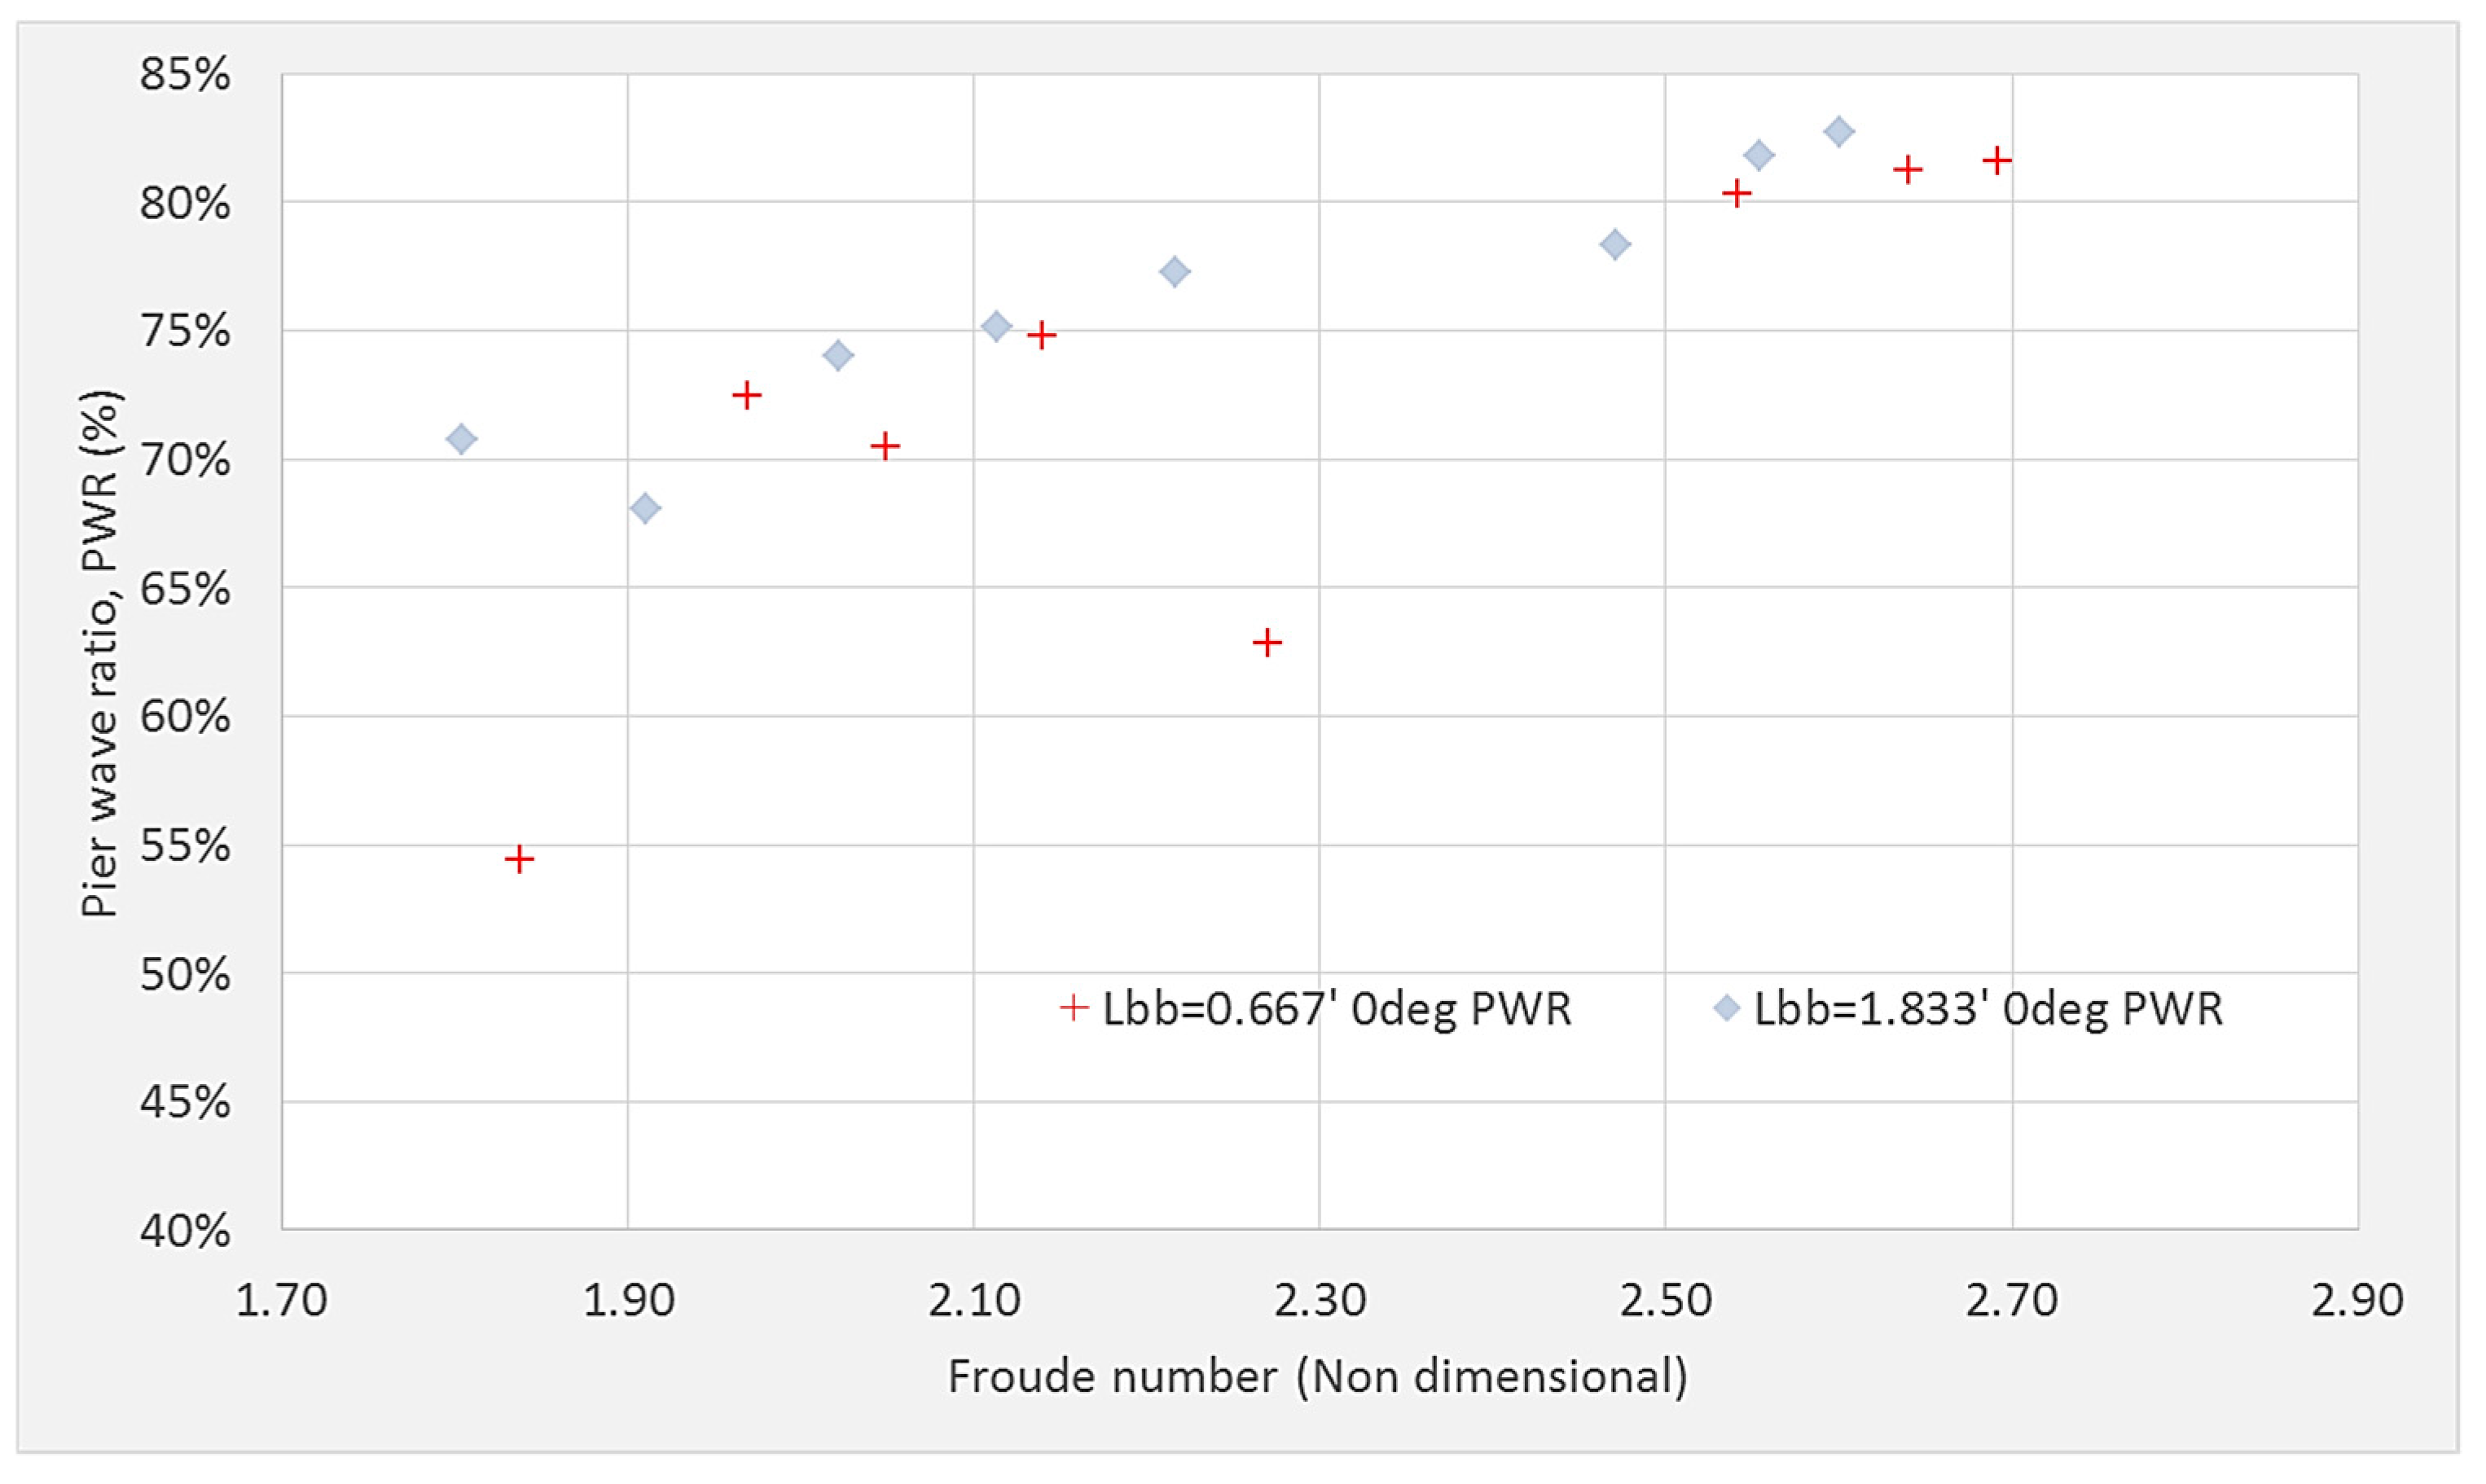
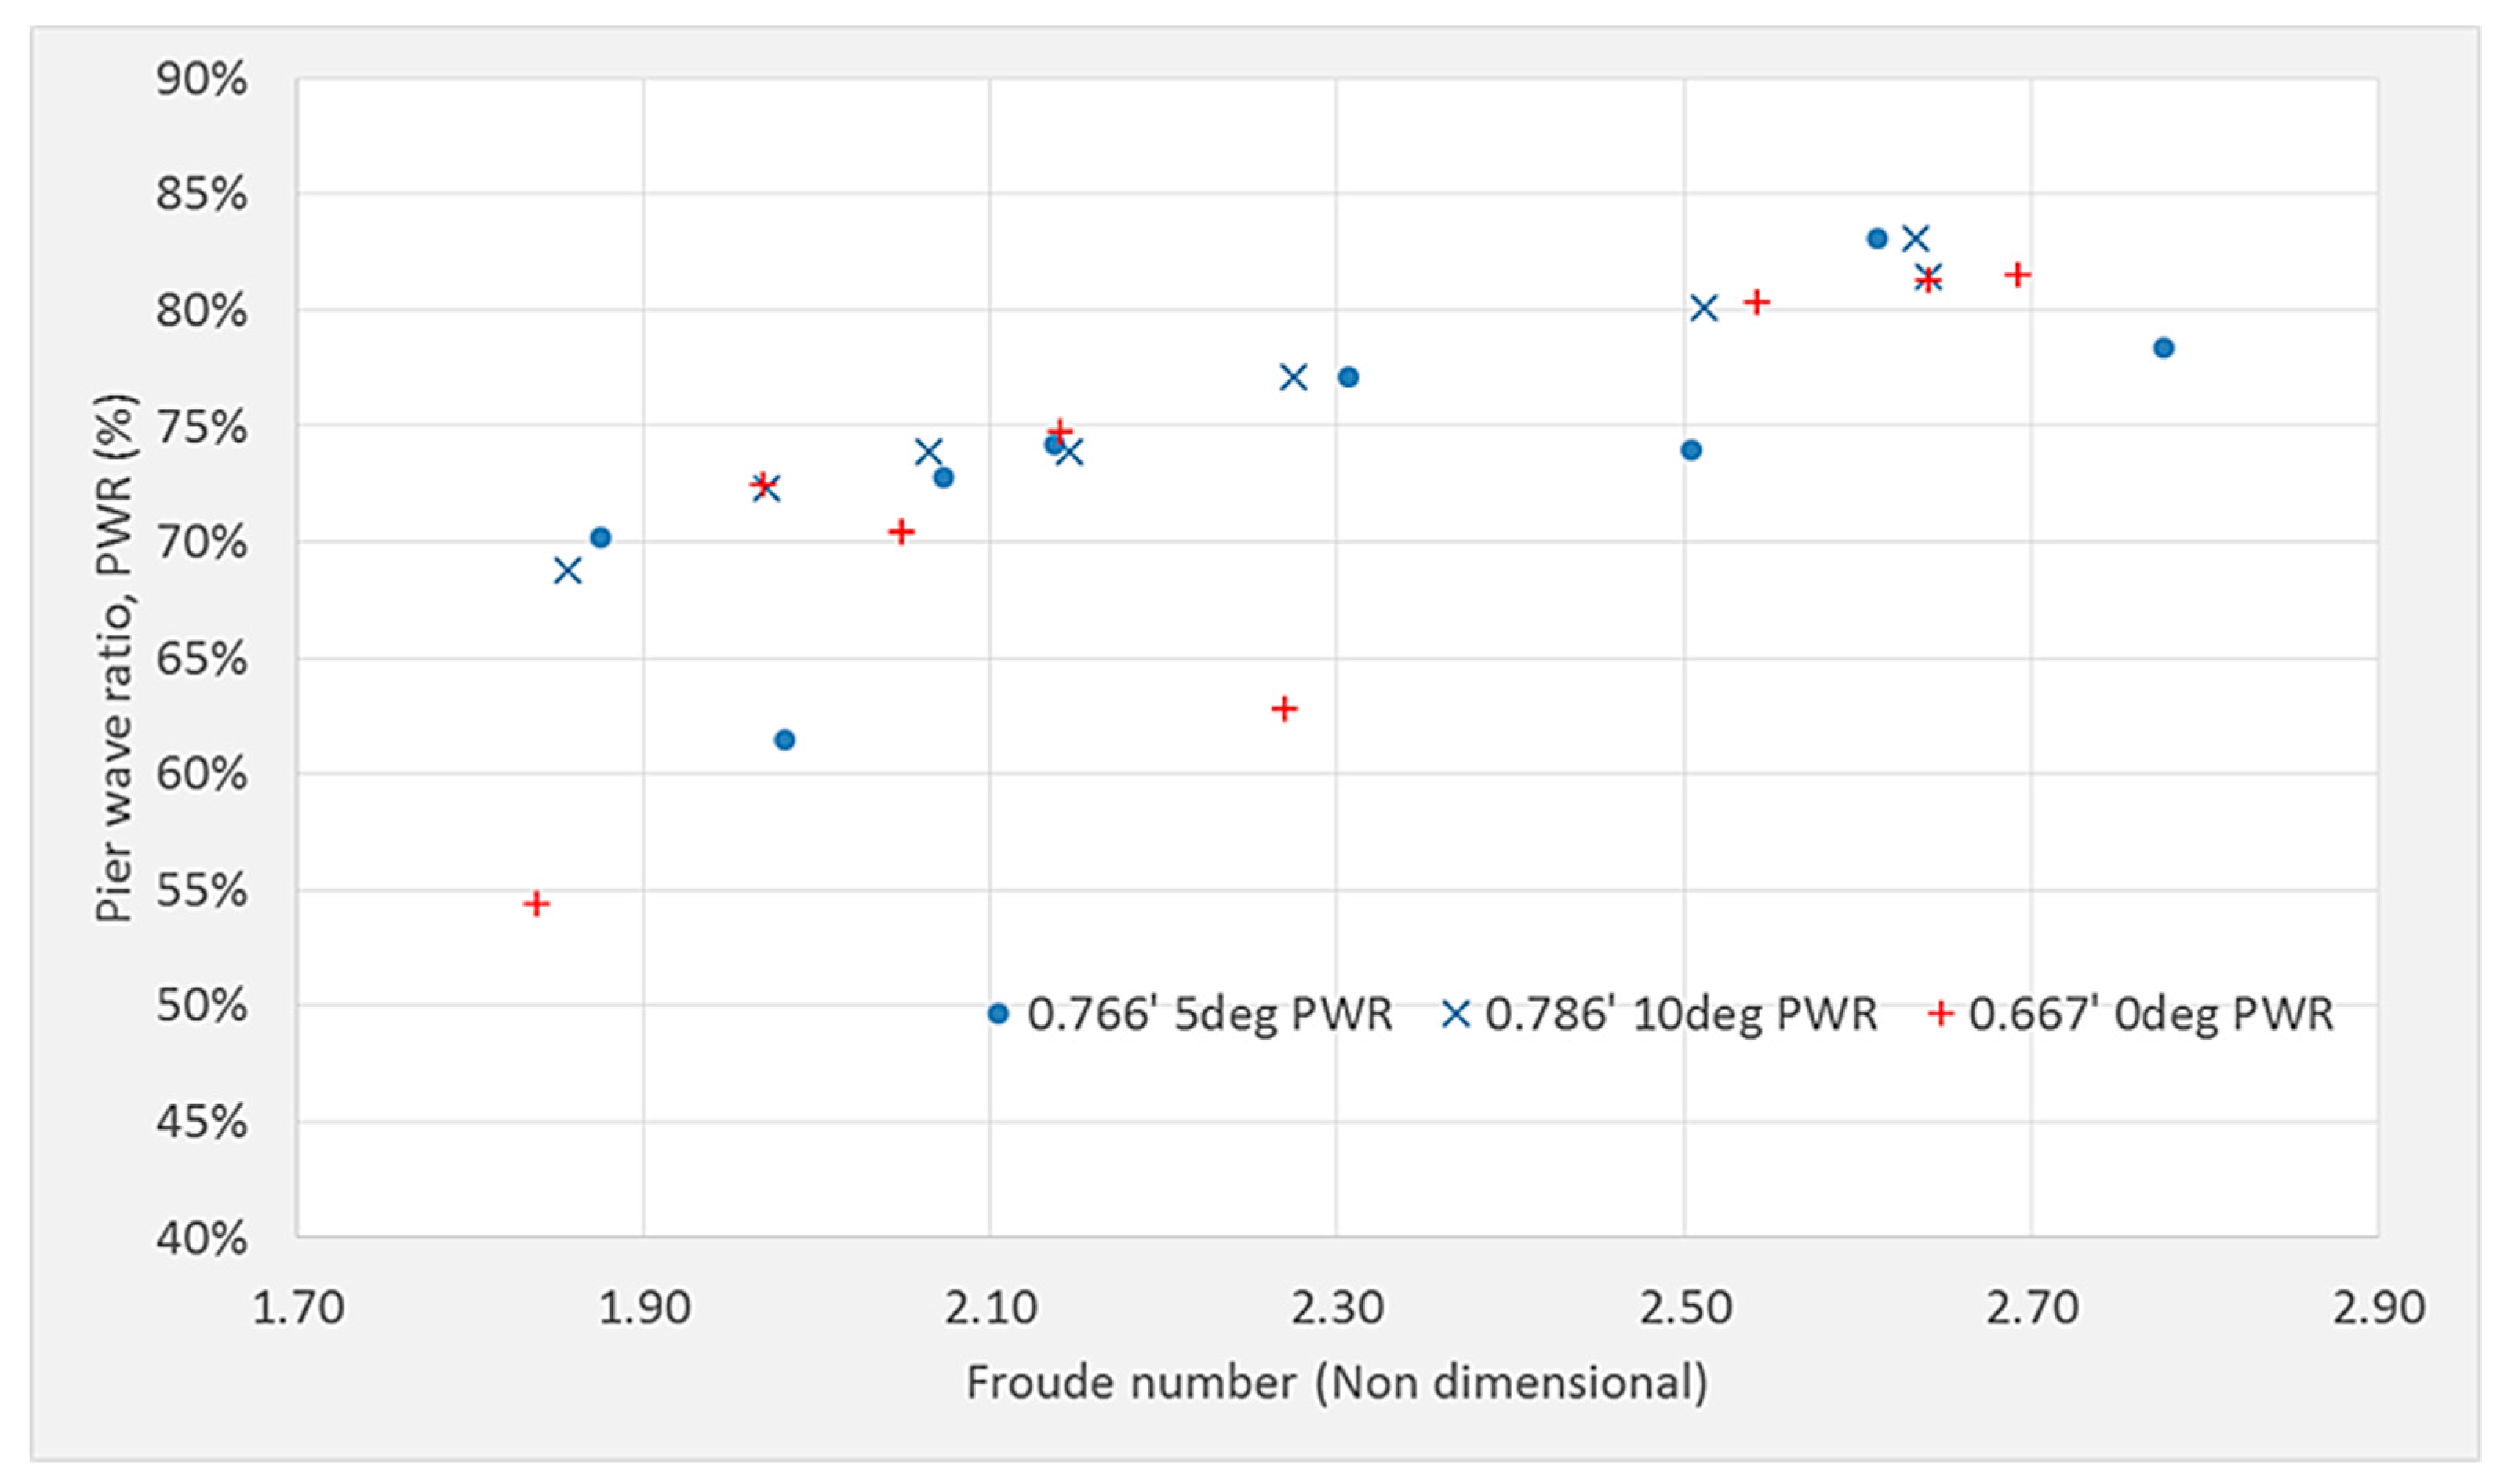
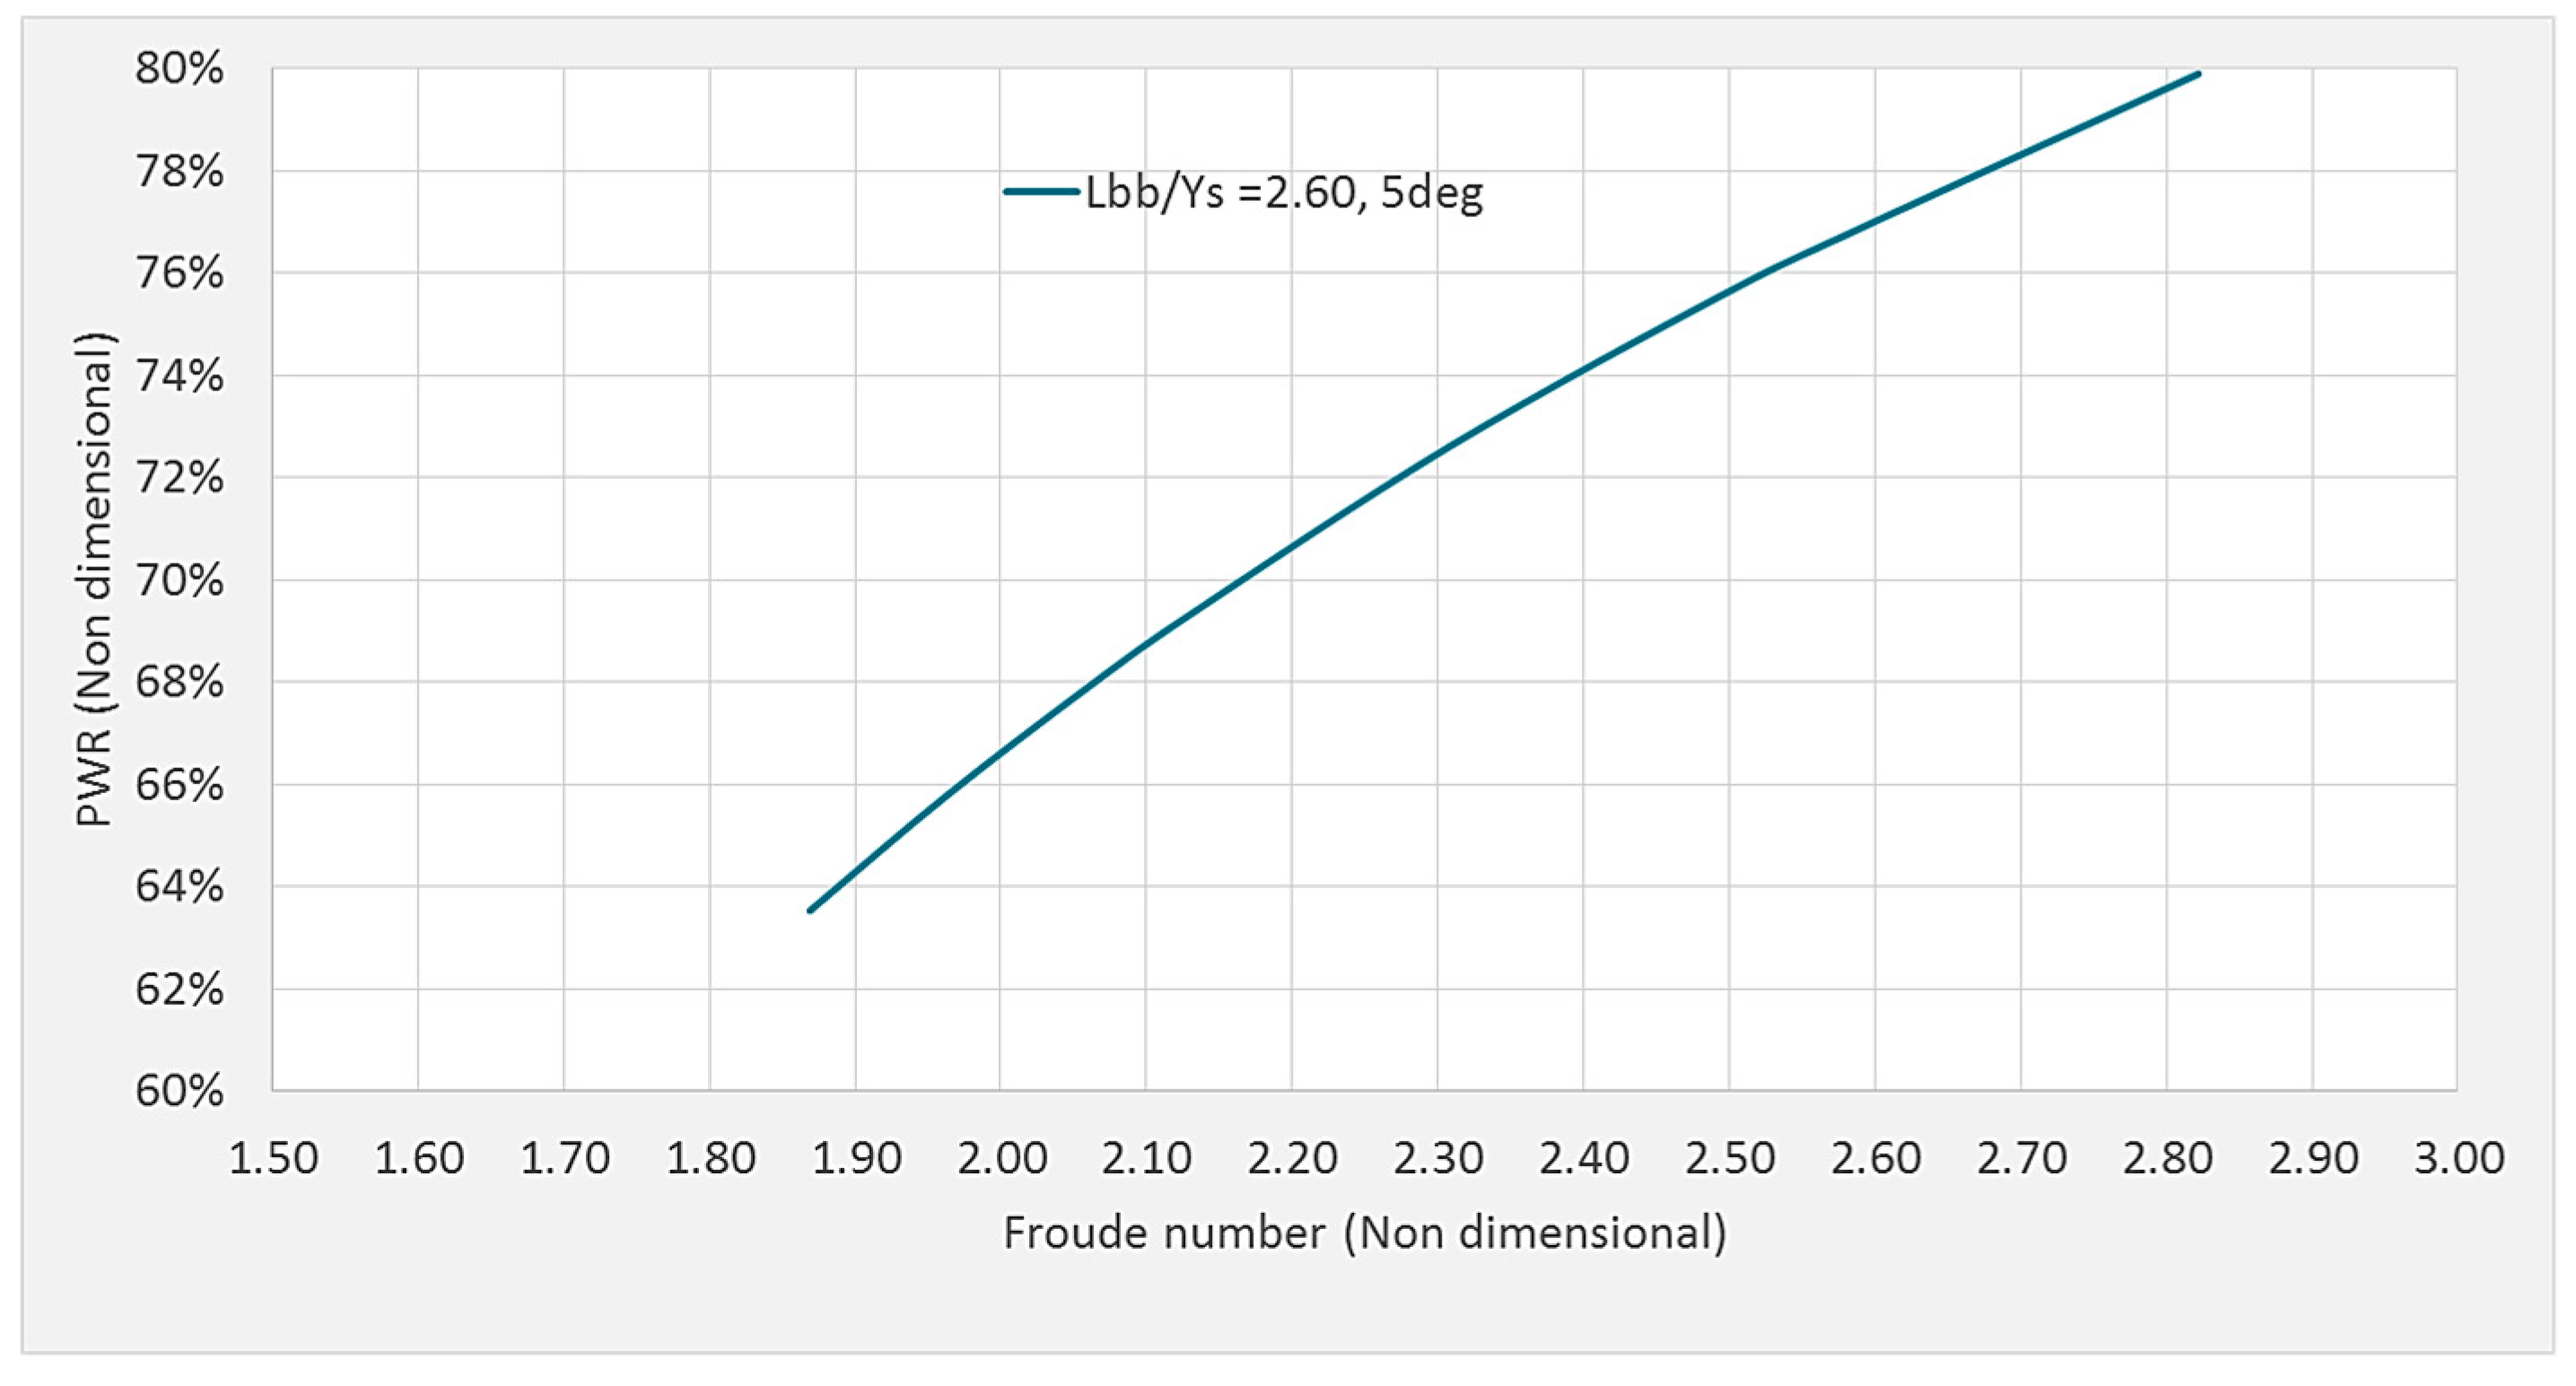
3.6. Pier Wave Level Ratio (PWR)

The proposed equation to calculate the pier wave ratio (PWRcalc) closely matches the experimental values (PWRdata). Figure 22 and Figure 23 compare the values of PWRdata vs. PWRcalc. The PWRcalc is more accurate for the bulbs with pitch angles of 5° and 10°; this is a consequence of the elimination of the water flowing over the bulbous for the 0° pitch bulb.

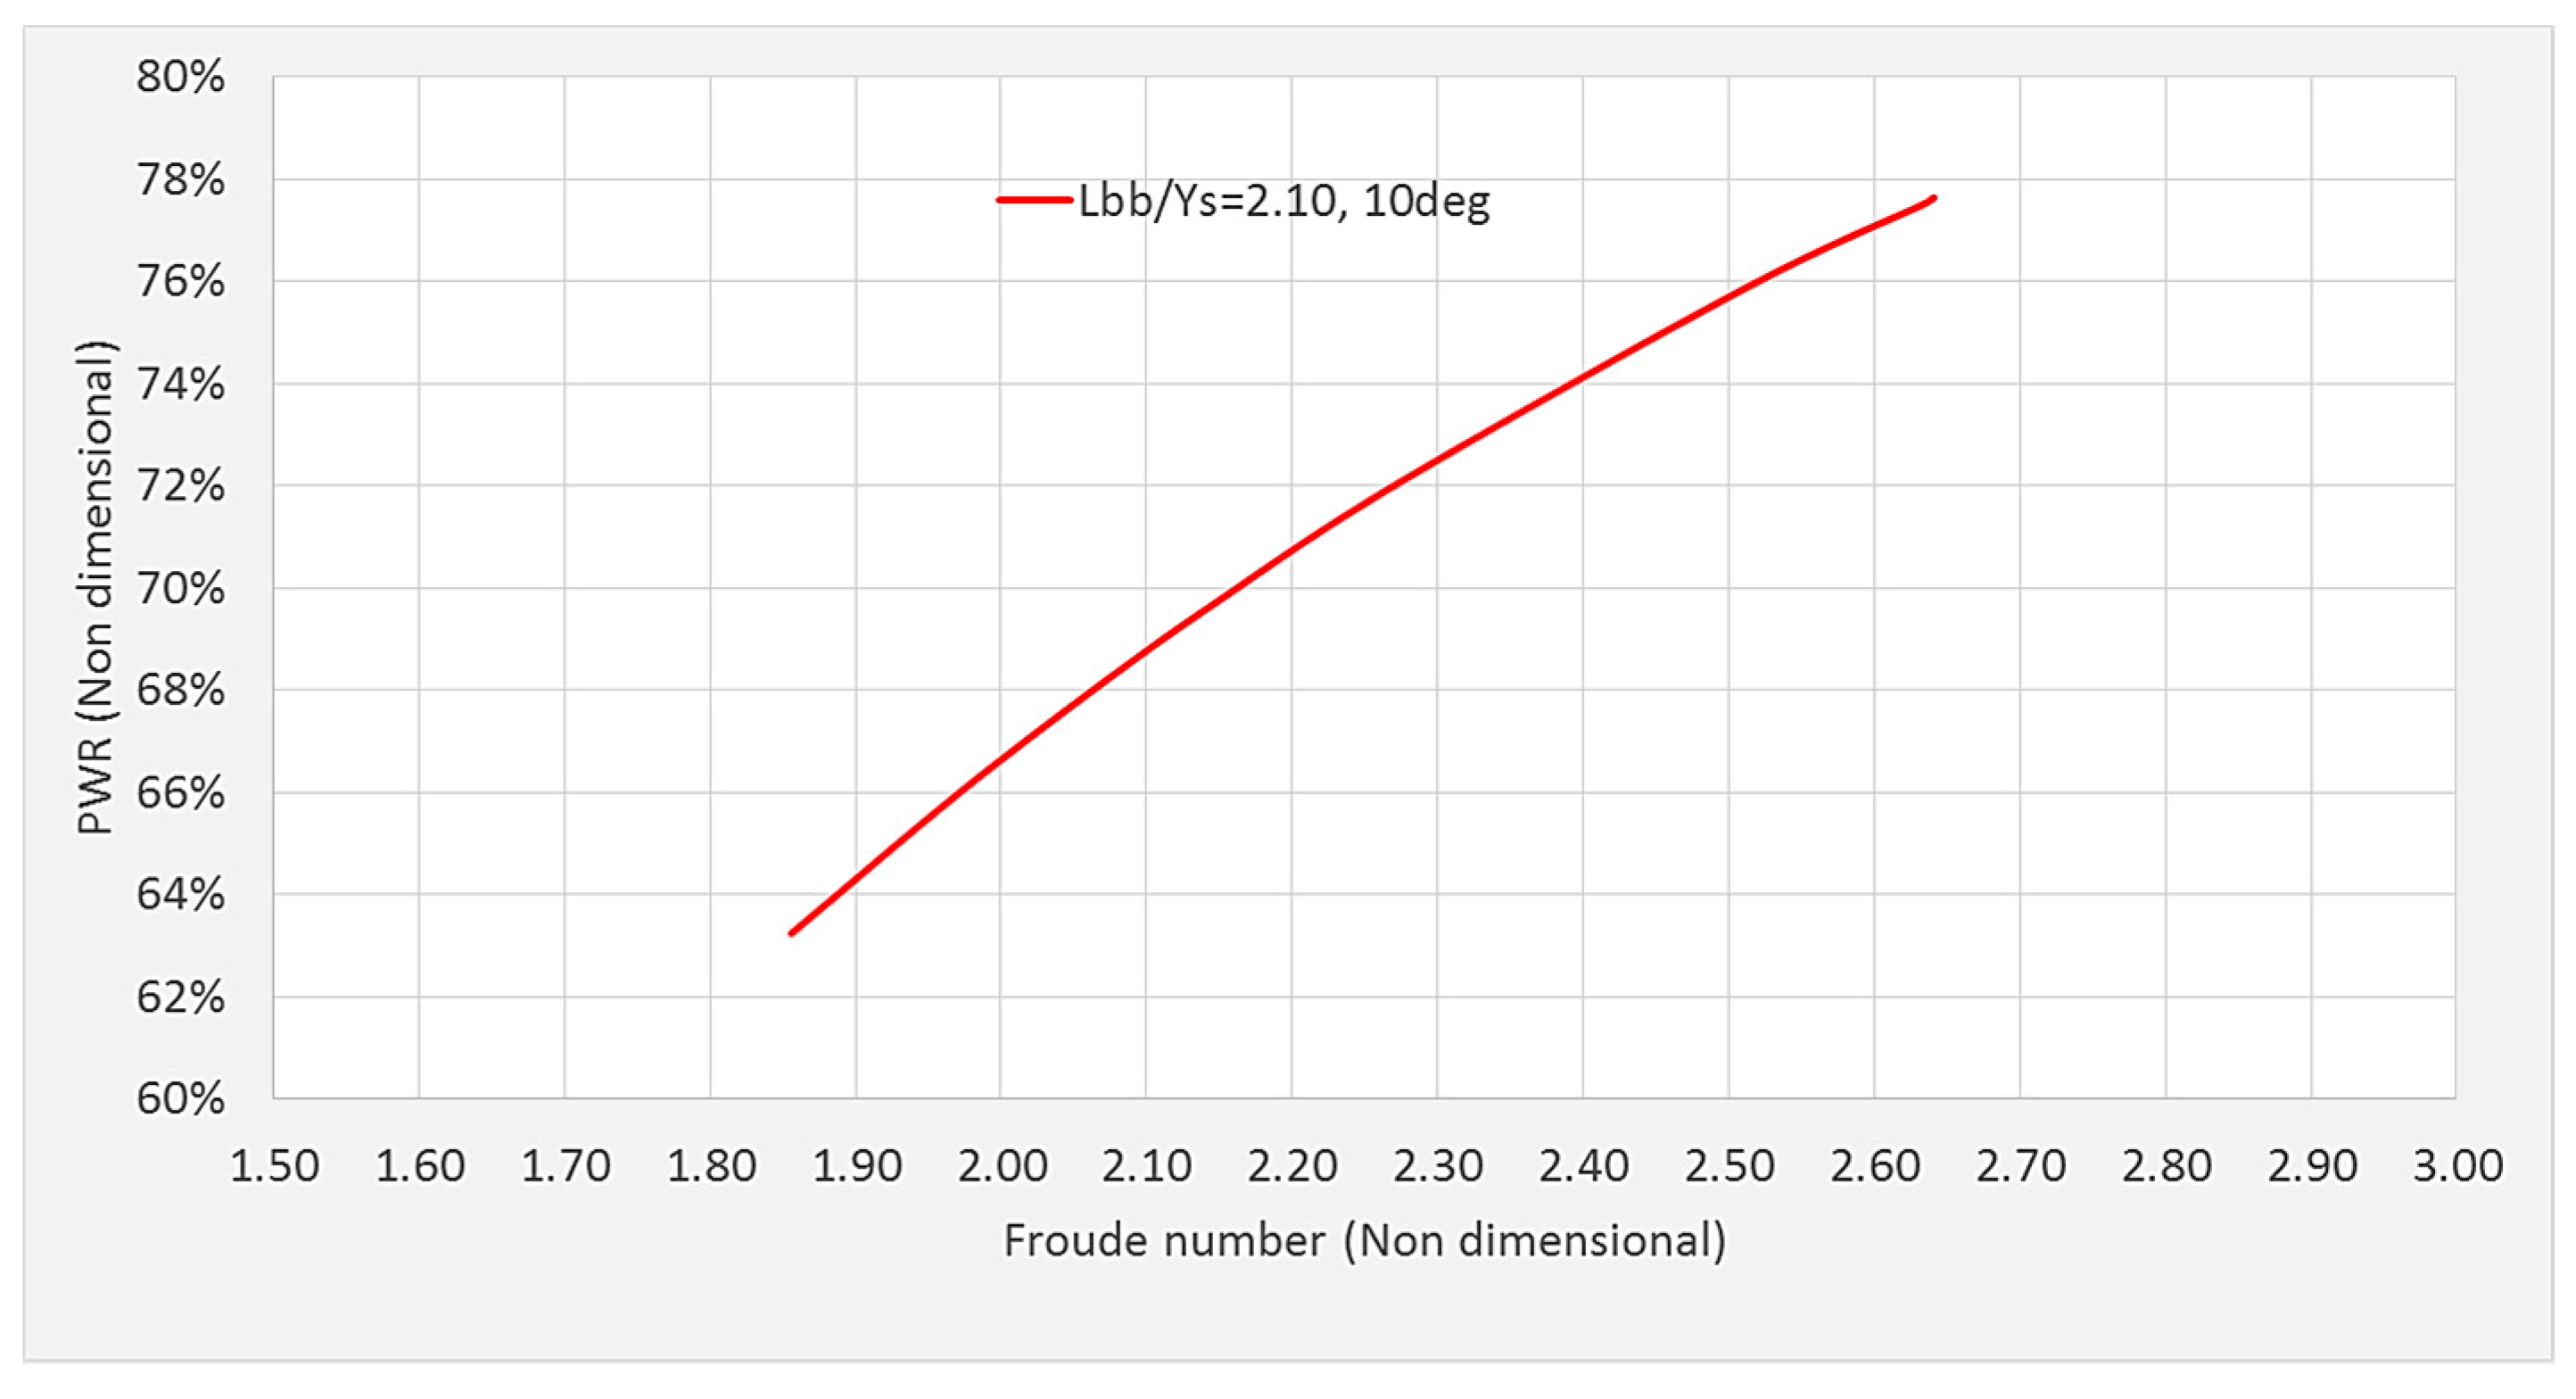
3.7. Design Curves for Pier Wave Reduction

The experimental results showed that the bulb’s tip should be above the water level to prevent deck spraying. Consequently, Lbb < 0.9′ should be ignored. For Lbb > 1.2′, an additional bulb length, above the water level, does not contribute to the PWR. Only two bulbs met these restrictions: Lbb = 0.974′ at 5°, and Lbb = 0.786′ at 10°. In order to translate the experimental results into a full-size bulb, the Lbb in the PWR vs. the Froude number charts, is normalized by dividing the Lbb by the Ys; Figure 24 shows how the Lbb and YS are measured in a bulb. The Ys is based on the condition that the bulb will only be submerged up to the bulb’s longitudinal centerline.
The decision between using the 5° or the 10° bulb requires full-size testing to evaluate the residual spaying problem detected in the 10° bulb, and the deflection problem associated with a long bulbous (5°). Figure 25 and Figure 26 show the normalized relations for the two bulbs.

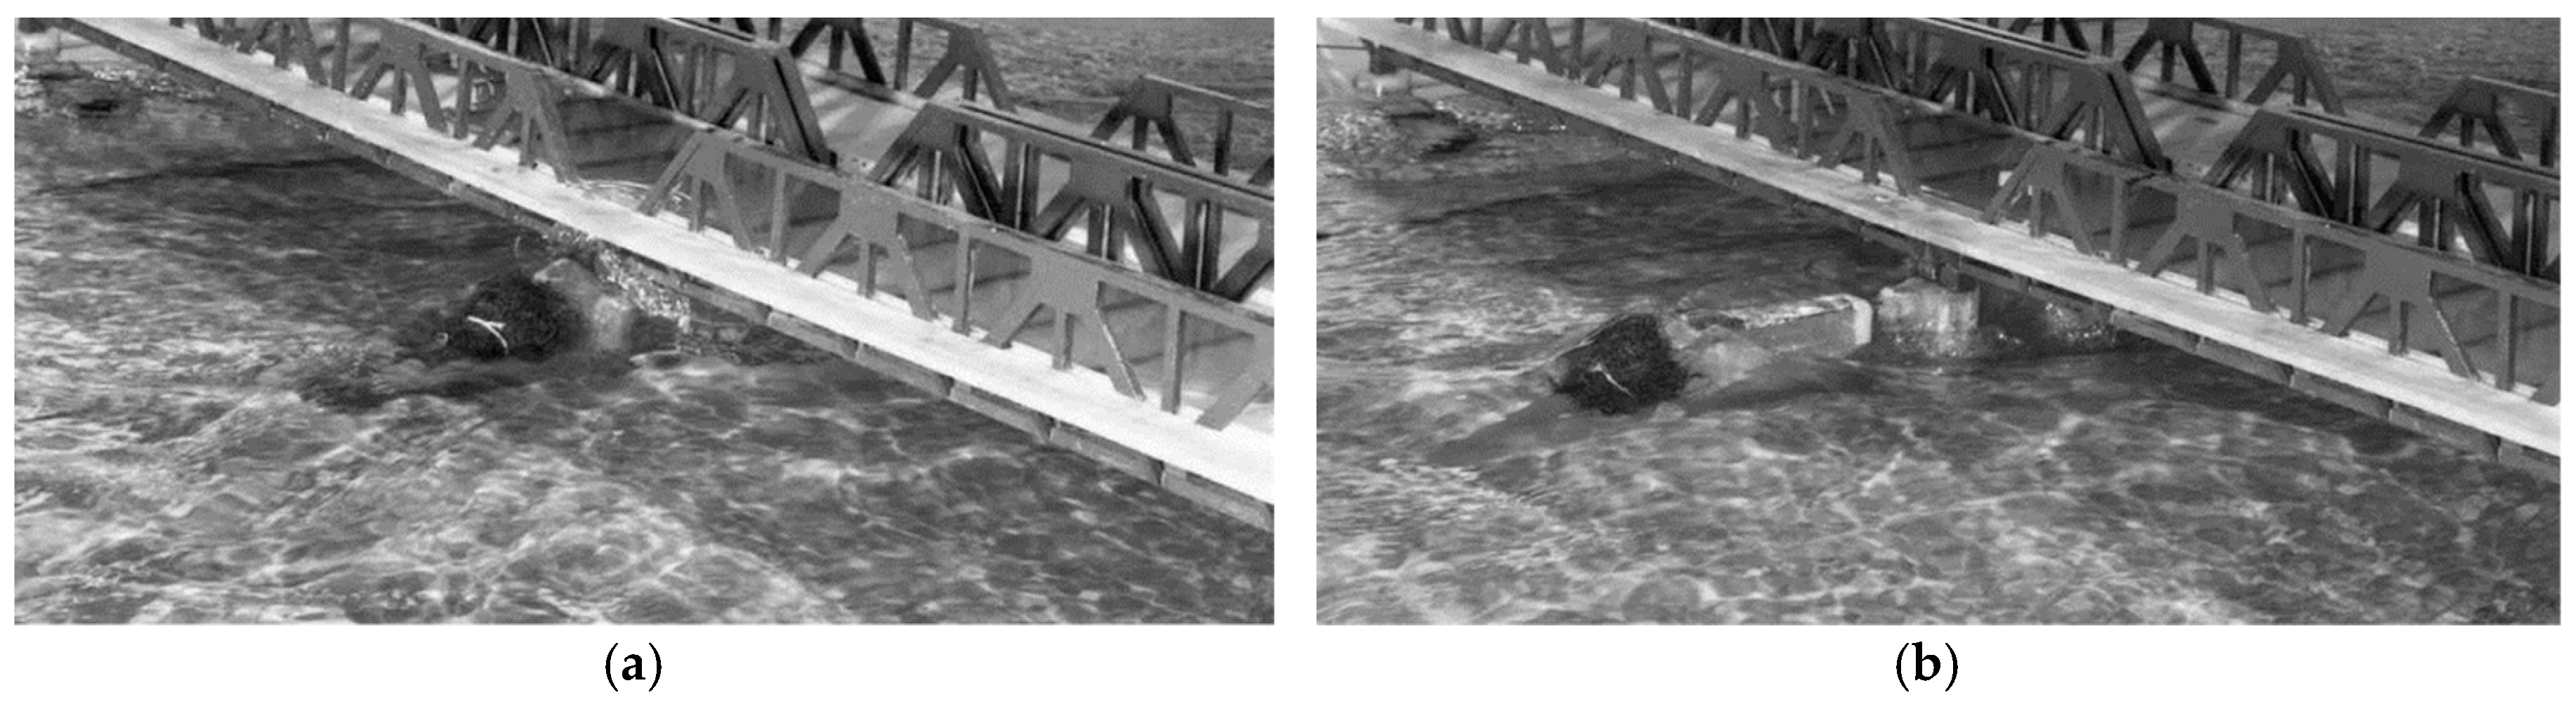
3.8. Flow Behavior After the Pier-Bulb Intersection

The analysis of the water level after the bulb-pier intersection was not the subject of this research, but the reduction of the water level for the bulbous pier case is a factor to consider in the selection of bulbous pier length. Table 9 illustrates the changes in the flume water levels after the bulbs were added. For most cases, the addition of a bulb reduces the water level for Froude numbers under 2.5, and maintains the flume water level for Froude numbers larger than 2.5. This can be attributed to a reduction in the water turbulence produced by the bulb (Figure 27).

3.9. The Bulbous Pier vs. the Pier Extension

A pier extension is designed and built for a specific range of flow conditions. If the open channel network is modified and the flow conditions change, the pier extension needs to be modified, most likely increased in length. The increase of length in a pier extension is not a desirable outcome because every square foot of pier extension increases the energy subtracted from the flow. This energy subtraction may transform the flow from supercritical to subcritical, and have undesirable outcomes. A bulbous pier’s smaller area subtracts less energy from the flow, allowing a wider set of flow conditions.

4. Proposed Pier Bulbous Design Method

For a given open channel with a pier, the following method is proposed:
  • Determine the open channel water depth (Yh) via field data or open channel equations;
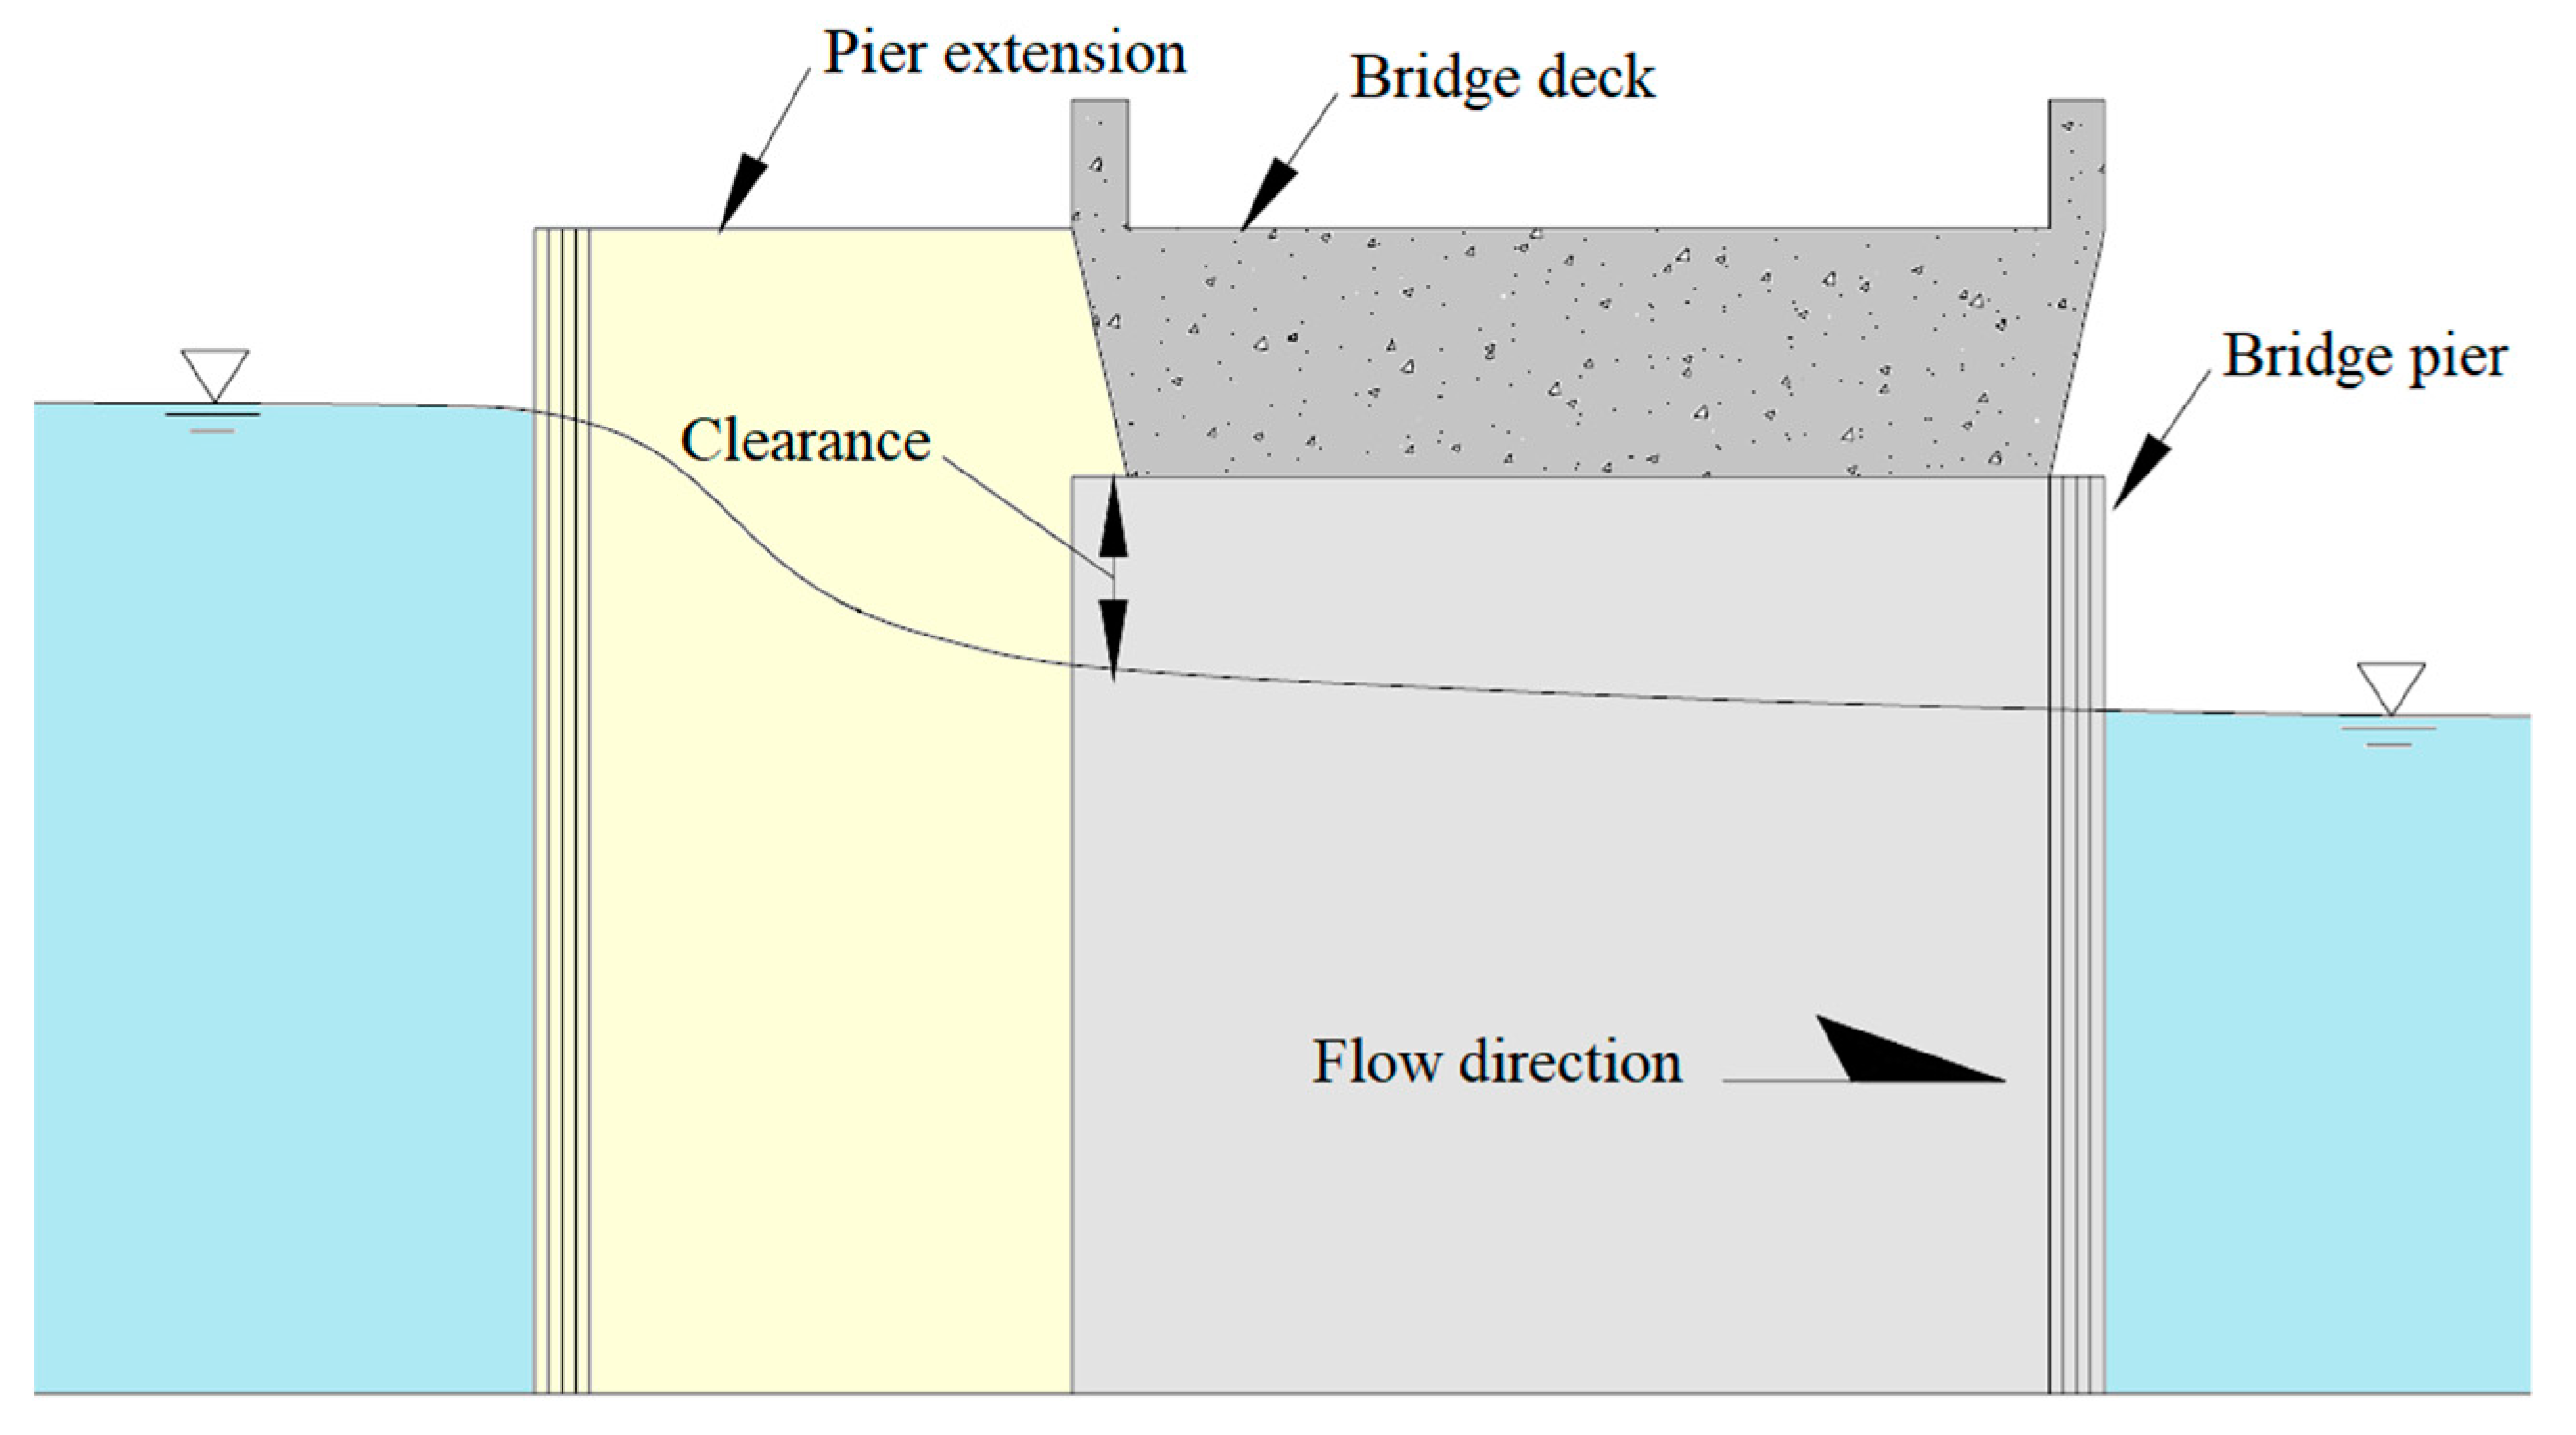
  • The optimal bulb submerged depth (Ys) is equivalent to the maximum hydraulic depth (Yh) at bulb centerline, see Figure 28;
  • The bulb diameter shall be equal to the pier width;
  • Determine the non-bulb pier wave height using the following equation or field value:
    PL nb   calc = E = y h + V 2 2 g
  • Calculate the open channel Froude number (Fr);
  • Using Figure 29 or Figure 30, determine the Lbb/Ys for the Froude number calculated in the previous step;
  • Calculate the bulb length using Ys equal to Yh;
  • Verify whether the PWR reduces the pier wave to an acceptable level; if not the cylindrical bulbous is not a solution. In order to increase the PWR, the bulb submerged area needs to be increased, which leads to a different bulb shape, which is a subject of further research.

5. Conclusions and Recommendations

The following are the main findings of this study:
  • Experimental values show that a bulbous pier reduces the pier wave height by subtracting energy from the water flow.
  • The viscous resistance is the main component in the PLbb; this is due to the bulb length being less than the bulb wavelength.
  • A zero-degree pitch angle bulbous pier is too long for practical applications; to achieve pier reduction in the order of 0.4, the bulb length should be above 10′.
  • The introduction of the pitch angle in a bulb reduces the length of the bulb at the water line by eliminating the flow over the bulb; This modification addresses the constructability problem of a long bulbous.
  • The non-bulbous pier water level (PLnb_calc) overestimates the water height in comparison with the experimental data (PLnb_data).
  • Making the viscous resistance the only force in the calculation of Bw underestimates it.
  • For practical applications, PWRcalc provides a good approximation to the expected reduction in the pier wave level.

Recommendations

  • Full-size model trials are recommended before using a pier bulbous in lieu of pier extensions.
  • A cylindrical bulbous was selected based on the literature review, but it is possible that other bulb shapes could outperform a cylindrical bulb; research is needed in this area.
  • The narrow channel effect, documented in the literature review, may be responsible for the distinct bulb wave found in the 0.958′ and 0.974′; research is needed in this area.
  • The pitch angles used in this research are extrapolations of the parameters used for bulbous bows on boats; determining the optimum bulb pitch angle for piers requires additional research.
  • Research can be conducted on how the cantilever bulb is going to affect the structural response of the pier.

Author Contributions

Conceptualization, A.C.; methodology, A.C., M.K. and D.H.; writing—original draft preparation, M.N.-S.; writing—review and editing, M.N.-S.; supervision, M.K., D.H.

Funding

This research was funded by the Clark County Regional Flood Control District (CCRFCD).

Acknowledgments

The authors acknowledge the invaluable contribution of Mr. Peter Faught in setting up the experiments for this research.

Conflicts of Interest

The authors declare no conflict of interest.

Appendix A

Table A1. Hypothesis testing: PLnb vs. PLbb.
Two-Sample T-Test and CI: PLnb_T, PLbb_D, Lbb = 0.667′ Pitch Angle = 0°
Two-sample T for PLnb_T vs. PLbb_D
N Mean StDev SE Mean
PLnb_T 32000 1.323 0.239 0.0013
PLbb_D 32000 0.679 0.153 0.00085
Difference = μ (PLnb_T) − μ (PLbb_D)
Estimate for difference: 0.64407
95% lower bound for difference: 0.64146
T-Test of difference = 0.7 (vs. >): T-value = −35.33 p-value = 1.000 DF = 63998
Both use Pooled StDev = 0.2003
p-value > 0.05 => DO NOT REJECT H0
Minitab 17 report
Two-Sample T-Test and CI: PLnb_T, PLbb_D, Lbb = 0.958′ Pitch Angle = 0°
Two-sample T for PLnb_T vs. PLbb_D
N Mean StDev SE Mean
PLnb_T 32000 1.325 0.236 0.0013
PLbb_D 32000 0.636 0.142 0.00079
Difference = μ (PLnb_T) − μ (PLbb_D)
Estimate for difference: 0.68873
95% lower bound for difference: 0.68619
T-Test of difference = 0.7 (vs. >): T-value = −7.31 p-value = 1.000 DF = 63998
Both use Pooled StDev = 0.1949
p-value > 0.05 => DO NOT REJECT H0
Minitab 17 report
Two-Sample T-Test and CI: PLnb_T, PLbb_D, Lbb = 1.25′ Pitch Angle = 0°
Two-sample T for PLnb_T vs. PLbb_D
N Mean StDev SE Mean
PLnb_T 32000 1.327 0.238 0.0013
PLbb_D 32000 0.617 0.132 0.00074
Difference = μ (PLnb_T) − μ (PLbb_D)
Estimate for difference: 0.71021
95% lower bound for difference: 0.70771
T-Test of difference = 0.8 (vs. >): T-value = −58.96 p-value = 1.000 DF = 63998
Both use Pooled StDev = 0.1926
p-value > 0.05 => DO NOT REJECT H0
Minitab 17 report
Two-Sample T-Test and CI: PLnb_T, PLbb_D, Lbb = 1.542′ Pitch Angle = 0°
Two-sample T for PLnb_T vs. PLbb_D
N Mean StDev SE Mean
PLnb_T 32000 1.330 0.237 0.0013
PLbb_D 32000 0.590 0.129 0.00072
Difference = μ (PLnb_T) − μ (PLbb_D)
Estimate for difference: 0.73990
95% lower bound for difference: 0.73742
T-Test of difference = 0.8 (vs. >): T-value = −39.86 p-value = 1.000 DF = 49433
p-value > 0.05 => DO NOT REJECT H0
Minitab 17 report
Two-Sample T-Test and CI: PLnb_T, PLbb_D, Lbb = 1.542′ Pitch Angle = 0°
Two-sample T for PLnb_T vs. PLbb_D
N Mean StDev SE Mean
PLnb_T 32000 1.330 0.236 0.0013
PLbb_D 32000 0.584 0.123 0.00069
Difference = μ (PLnb_T) − μ (PLbb_D)
Estimate for difference: 0.74570
95% lower bound for difference: 0.74326
T-Test of difference = 0.8 (vs. >): T-value = −36.51 p-value = 1.000 DF = 48
p-value > 0.05 => DO NOT REJECT H0
Minitab 17 report
Two-Sample T-Test and CI: PLnb_T, PLbb_D, Lbb = 0.766′ Pitch Angle = 5°
Two-sample T for PLnb_T vs. PLbb_D
N Mean StDev SE Mean
PLnb_T 16000 1.311 0.228 0.0018
PLbb_D 16000 0.625 0.123 0.00097
Difference = μ (PLnb_T) − μ (PLbb_D)
Estimate for difference: 0.68658
95% lower bound for difference: 0.68321
T-Test of difference = 0.8 (vs. >): T-value = −55.44 p-value = 1.000 DF = 24612
p-value > 0.05 => DO NOT REJECT H0
Minitab 17 report
Two-Sample T-Test and CI: PLnb_T, PLbb_D, Lbb = 0.974′ Pitch Angle = 5°
Two-sample T for PLnb_T vs. PLbb_D
N Mean StDev SE Mean
PLnb_T 16000 1.315 0.228 0.0018
PLbb_D 16000 0.569 0.125 0.00099
Difference = μ (PLnb_T) − μ (PLbb_D)
Estimate for difference: 0.74627
95% lower bound for difference: 0.74288
T-Test of difference = 0.8 (vs. >): T-Value = −26.09 p-value = 1.000 DF = 24860
p-value > 0.05 => DO NOT REJECT H0
Minitab 17 report
Two-Sample T-Test and CI: PLnb_T, PLbb_D, Lbb = 1.266′ Pitch Angle = 5°
Two-sample T for PLnb_T vs. PLbb_D
N Mean StDev SE Mean
PLnb_T 16000 1.342 0.247 0.0020
PLbb_D 16000 0.4907 0.0874 0.00069
Difference = μ (PLnb_T) − μ (PLbb_D)
Estimate for difference: 0.85145
95% lower bound for difference: 0.84805
T-Test of difference = 0.9 (vs. >): T-Value = −23.46 p-value = 1.000 DF = 19951
p-value > 0.05 => DO NOT REJECT H0
Minitab 17 report
Two-Sample T-Test and CI: PLnb_T, PLbb_D, Lbb = 1.557′ Pitch Angle = 5°
Two-sample T for PLnb_T vs. PLbb_D
N Mean StDev SE Mean
PLnb_T 16000 1.340 0.246 0.0019
PLbb_D 16000 0.4778 0.0962 0.00076
Difference = μ (PLnb_T) − μ (PLbb_D)
Estimate for difference: 0.86229
95% lower bound for difference: 0.85886
T-Test of difference = 0.9 (vs. >): T-value = −18.08 p-value = 1.000 DF = 20790
p-value > 0.05 => DO NOT REJECT H0
Minitab 17 report
Two-Sample T-Test and CI: PLnb_T, PLbb_D, Lbb =0.787′ Pitch Angle = 10°
Two-sample T for PLnb_T vs. PLbb_D
N Mean StDev SE Mean
PLnb_T 16000 1.335 0.248 0.0020
PLbb_D 16000 0.571 0.112 0.00088
Difference = μ (PLnb_T) − μ (PLbb_D)
Estimate for difference: 0.76362
95% lower bound for difference: 0.76008
T-Test of difference = 0.9 (vs. >): T-Value = 221263.44 p-value = 1.000 DF = 22258
p-value > 0.05 => DO NOT REJECT H0
Minitab 17 report
Two-Sample T-Test and CI: PLnb_T, PLbb_D, Lbb =0.995′ Pitch Angle = 10°
Two-sample T for PLnb_T vs. PLbb_D
N Mean StDev SE Mean
PLnb_T 16000 1.334 0.249 0.0020
PLbb_D 16000 0.5207 0.0961 0.00076
Difference = μ (PLnb_T) − μ (PLbb_D)
Estimate for difference: 0.81298
95% lower bound for difference: 0.80951
T-Test of difference = 0.9 (vs. >): T-Value = −41.27 p-value = 1.000 DF = 20666
p-value > 0.05 => DO NOT REJECT H0
Minitab 17 report
Two-Sample T-Test and CI: PLnb_T, PLbb_D, Lbb = 1.286′ Pitch Angle = 10°
Two-sample T for PLnb_T vs. PLbb_D
N Mean StDev SE Mean
PLnb_T 16000 1.336 0.255 0.0020
PLbb_D 16000 0.5211 0.0909 0.00072
Difference = μ (PLnb_T) − μ (PLbb_D)
Estimate for difference: 0.81494
95% lower bound for difference: 0.81141
T-Test of difference = 0.9 (vs. >): T-Value = −39.71 p-value = 1.000 DF = 19993
p-value > 0.05 => DO NOT REJECT H0
Minitab 17 report
Two-Sample T-Test and CI: PLnb_T, PLbb_D, Lbb = 1.578′ Pitch Angle = 10°
Two-sample T for PLnb_T vs. PLbb_D
N Mean StDev SE Mean
PLnb_T 16000 1.340 0.259 0.0020
PLbb_D 16000 0.522 0.108 0.00086
Difference = μ (PLnb_T) − μ (PLbb_D)
Estimate for difference: 0.81776
95% lower bound for difference: 0.81411
T-Test of difference = 0.9 (vs. >): T-Value = −37.08 p-value = 1.000 DF = 21448
p-value > 0.05 => DO NOT REJECT H0
Minitab 17 report

References

  1. Stonestreet, S.E.; Mulvihill, M.E.; Hite, J.E. Revised hydraulic design of the Rio Hondo Flood Control Channel. In Proceedings of the ASCE Proceeding National Conference Hydraulic, Engineering, Buffalo, NY, USA, 1–5 August 1994; pp. 401–405. [Google Scholar]
  2. Hite, J.E.; Stonestreet, S.E.; Mulvihill, M.E. Model study of Rio Hondo Flood Control Channel, Los Angeles, California. In Proceedings of the ASCE Proceedings National Conference on Hydraulic Engineering, San Francisco, CA, USA, 25–30 July 1993; pp. 1695–1700. [Google Scholar]
  3. Stockstill, R.L. Hydraulic Design of Channels Conveying Supercritical Flow. Available online: https://www.researchgate.net/publication/235103810_Hydraulic_Design_of_Channels_Conveying_Supercritical_Flow/related (accessed on 13 July 2019).
  4. Bulbous Bow Design and Construction. Available online: http://www.mar.ist.utl.pt/mventura/Projecto-Navios-I/EN/SD-1.5.4-Bulbous%20Bow%20Design.pdf (accessed on 6 March 2018).
  5. Kracht, A.M. Design of Bulbous Bows. SNAME 1978, 86, 197–217. [Google Scholar]
  6. Havelock, T.H. The Wave-Making Resistance of Ships: A Study of Certain Series of Model Experiments. Proc. R. Soc. Lond. Ser. A Contain. Papers Math. Phys. Character 1910, 84, 197–208. [Google Scholar]
  7. US Naval Academy: Resistance and Powering of Ships. Available online: http://www.usna.edu/NAOE/_files/documents/en400/TEXT%20%202011/12Chapter%207%20Text%202011.pdf (accessed on 6 March 2018).
  8. Yun, L.; Bliault, A. High Performance Marine Vessels; Springer: Boston, MA, USA, 2012. [Google Scholar]
  9. Ghani, M.A.; Wilson, P. Experimental Analysis of Catamarans Forms with Bulbous Operating in Shallow Waters. Int. Shipbuild. Prog. 2009, 2, 29–57. [Google Scholar]
  10. Sorensen, R.M. Basic Coastal Engineering, 3rd ed.; Springer: Boston, MA, USA, 2006. [Google Scholar]
  11. Karakouzian, M.; Karami, M.; Nazari-Sharabian, M.; Ahmad, S. Flow-Induced Stresses and Displacements in Jointed Concrete Pipes Installed by Pipe Jacking Method. Fluids 2019, 4, 34. [Google Scholar] [CrossRef]
  12. Clark County Regional Flood Control District. Available online: http://www.ccrfcd.org/ (accessed on 6 March 2018).
Figure 1. Bridge with pier extension.
Fluids 04 00140 g001
Figure 2. (a) Flow conditions in 1:50-scale model of the Rio Hondo River, debris on bridge pier, (b) Flow conditions in 1:50-scale model of the Rio Hondo River, debris on extended bridge pier [3].
Fluids 04 00140 g002
Figure 3. Bulb wave interference principle (A) bulb; (B) bow; (C) bulb wave; (D) bow wave; (E) combined wave = bow wave − bulb wave.
Fluids 04 00140 g003
Figure 4. Pier with and without a bulb.
Fluids 04 00140 g004
Figure 5. Duck Creek flood channel, Las Vegas metropolitan area.
Fluids 04 00140 g005
Figure 6. Level meter location in the flume.
Fluids 04 00140 g006
Figure 7. Greyline AVFM 5.0 installed on the flume.
Fluids 04 00140 g007
Figure 8. Bulbous pier spraying problem.
Fluids 04 00140 g008
Figure 9. Pier wave ratio for 0° pitch angle bulb, Lbb = 0.667′ and 1.833′.
Fluids 04 00140 g009
Figure 10. Bulb CZB interpretation.
Fluids 04 00140 g010
Figure 11. PWR for bulbs with different pitch angles.
Fluids 04 00140 g011
Figure 12. Bulbs spraying problem, at (a) 0°, and (b) 5° pitch angles.
Fluids 04 00140 g012
Figure 13. PLbb with similar horizontal upper length, at 0°, 5°, and 10° pitch angles.
Fluids 04 00140 g013
Figure 14. PLnb_data and PLnb_calc for bulbs with 0° pitch angle.
Fluids 04 00140 g014
Figure 15. PLbb_data and PLbb_calc for bulbs with 5° pitch angle.
Fluids 04 00140 g015
Figure 16. PLbb_data and PLbb_calc for bulbs with 10° pitch angle.
Fluids 04 00140 g016
Figure 17. Bw for 5° pitch angle.
Fluids 04 00140 g017
Figure 18. Bw for 10° pitch angle.
Fluids 04 00140 g018
Figure 19. Lbbs and Lw, at 5° pitch angle.
Fluids 04 00140 g019
Figure 20. Bw, Bwv and Bww for the bulbous pier with 5° pitch angle.
Fluids 04 00140 g020
Figure 21. Bwv and Bww for the bulbous pier with 10° pitch angle.
Fluids 04 00140 g021
Figure 22. PWRdata vs. PWRcalc, bulbous pier with 5° pitch angle.
Fluids 04 00140 g022
Figure 23. PWRdata and PWRcalc vs. Froude number (Fr), bulbous pier with 10° pitch angle.
Fluids 04 00140 g023
Figure 24. Normalized parameters’ description.
Fluids 04 00140 g024
Figure 25. Proposed PWR approximation using normalized bulb length, 5° pitch angle, Lbb = 0.974′, Ys = 0.375′.
Fluids 04 00140 g025
Figure 26. Proposed PWR approximation using normalize bulb length, 10° pitch angle, Lbb = 0.786′, Ys = 0.375.
Fluids 04 00140 g026
Figure 27. Water level after the pier-bulb intersection for (a) non-bulb pier, (b) bulbous pier with Lbb = 5″ and at 10° pitch angle, and (c) bulbous pier with Lbb = 12″ and at 10° pitch angle.
Fluids 04 00140 g027
Figure 28. Definition of the bulb submerged depth and bulbous length.
Fluids 04 00140 g028
Figure 29. Proposed PWR approximation using normalized bulb length, and 5° pitch angle.
Fluids 04 00140 g029
Figure 30. Proposed PWR approximation using normalized bulb length, and 10° pitch angle.
Fluids 04 00140 g030
Table 1. Bulb geometry parameters.
C BB = B B / B MS (1) Fluids 04 00140 i001
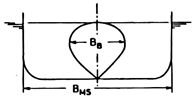
Breadth parameter (CBB): The maximum breadth (maximum width of a bulb - BB) of bulb area (ABT) at the forward perpendicular, divided by the beam of a ship at amidships (BMS).
C LPR = L PR / L PP (2) Fluids 04 00140 i002
Length parameter (CLPR): The protruding length (LPR) divided by the length between perpendiculars (LPP) of a ship.
C ZB = Z B / T FP (3) Fluids 04 00140 i003
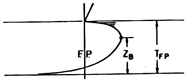
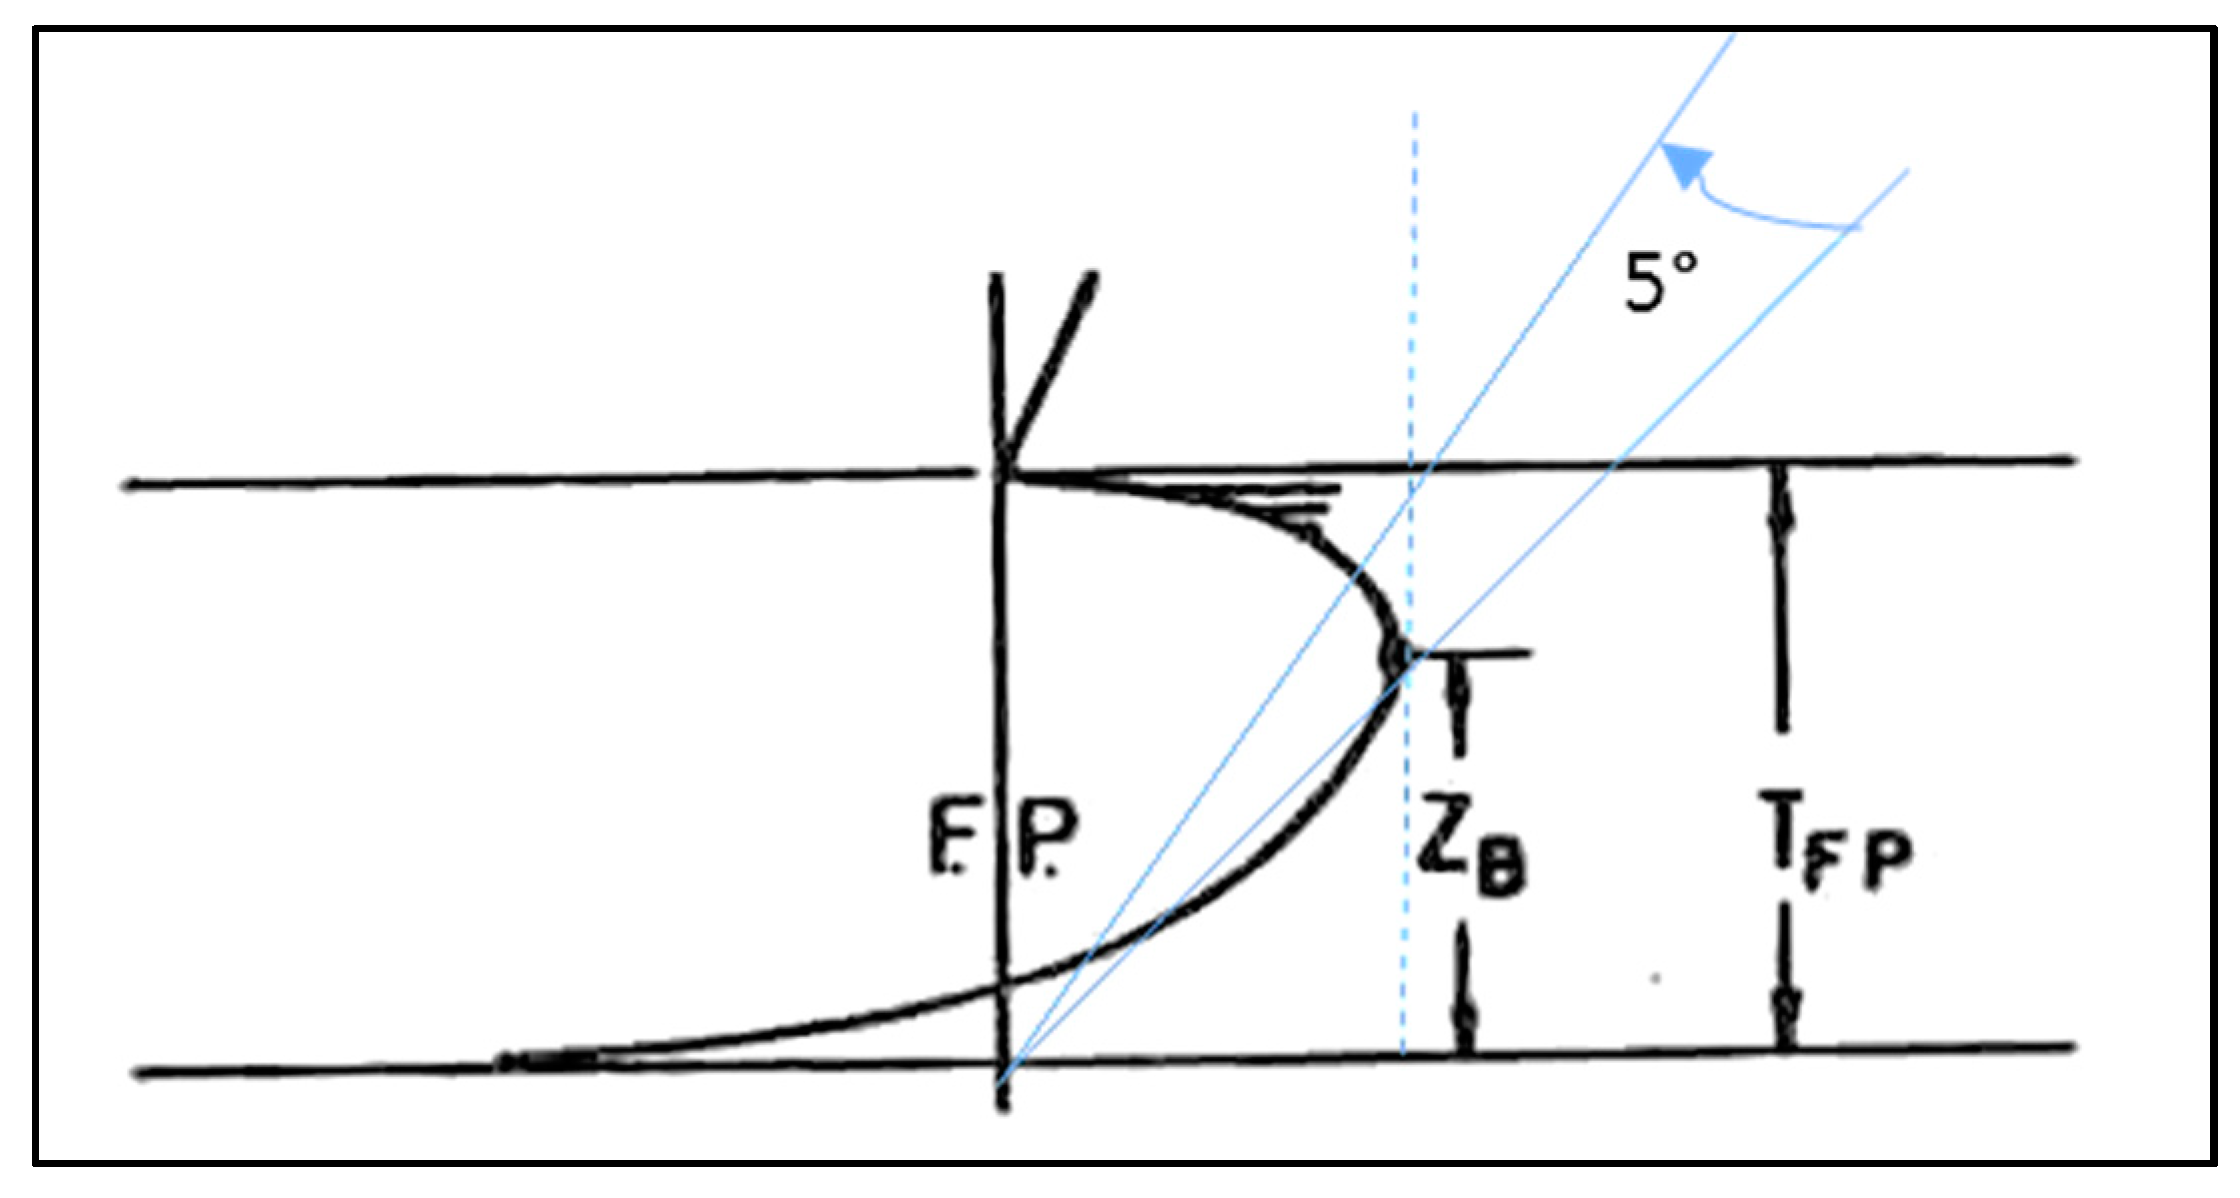
Depth parameter (CZB): The height (ZB) of the foremost point of a bulb over the baseline divided by the draft (TFP) at the forward perpendicular.
C ABT = A BT / A MS (4) Fluids 04 00140 i004
Cross-section parameter (CABT): The cross-sectional area (ABT) of a bulbous bow at the forward perpendicular divided by a ship’s midship section area (AMS).
C ABL = A BL / A MS (5) Fluids 04 00140 i005
Lateral parameter (CABL): The area (ABL) of a protruding bulb in the longitudinal plane divided by the midship section area of a ship (AMS).
C VPR = PR / WL (6) Fluids 04 00140 i006
Volumetric parameter (CVPR): The volume ( PR) of the protruding part of a bulb divided by the volume of displacement ( WL) of the ship. NOTE: Protruding is used here to mean that part of a bulb which extends in front of the forward perpendicular.
Table 2. Duck Creek Channel and bridge dimensions.
Channel
ParameterValue
Width (ft.)118.00
Height (ft.)5.70
Length (ft.)500.00
Flow Velocity (ft./sec.)20.14
Submerged Height (ft.)5.00
Hydraulic Depth (ft.)5.00
Submerged Area (ft.2)590.00
Bridge
Pier Height (ft.)5.70
Pier Hydraulic Depth (ft.)5.00
Pier Length (ft.)152.43
Pier Width (ft.)1.50
Pier Nose Radius (ft.)1.50
Pier Submerged Area (ft.2)7.50
Table 3. Froude number calculation for high-speed ships and Duck Creek Bridge Pier in Las Vegas, Nevada.
Ships/BridgeFrv (ft./sec.)L (ft.)
USS Sea Fighter (FSF-1)1.0692.83239.5
USS Swift (HSV-2)0.7575.95321
USS Independence (LCS 2)0.6272.00418
Duck Creek Bridge Pier0.3122.00152
Table 4. The test matrix.
Independent VariablesValueUnitsCondition
Pump Speed, Flume Slope (eight cases, Yh = 0.375)(550, 1.24), (601, 1.59), (568, 1.99), (570, 2.38), (630, 2.78), (714, 3.16), (750, 3.59), and (765, 4.26) RPM, %Yh = 0.375
Bulbous Horizontal Upper Length0.67, 0.96, 1.25, 1.54, and 1.83ft.-
Table 5. Flume characteristics.
CharacteristicValuesUnit
Pump Nominal Speed1185RPM
Pump Nominal Flow3600GPM
Flume Pump Max. Speed980RPM
Manning’s Coefficient (n)0.010-
Flume Width1.5ft.
Flume Length58ft.
Flume Max. Slope4.1%
Flume Min. Slope0%
Table 6. Flume and pier model dimensions.
ParameterValue
FlumeWidth (ft.)1.50
Height (ft.)1.67
Length (ft.)25.00
Flow Velocity (ft./sec.)6.88
Submerged Height (ft.)0.58
Hydraulic Depth (ft.)0.58
Area (ft.2)2.50
Pier ModelPier Height (ft.)0.67
Pier Submerged Height (TFP) (ft.)0.58
Pier Length (LPP) (ft.)2.00
Pier Width (BMS) (ft.)0.17
Pier Submerged Area (AMS) (ft.2)0.10
Pier Height (VWL) (ft.)0.67
Table 7. The bulbous pier geometric characteristics.
ParameterMin.Max.UnitAbbreviation
Diameter0.170.17ft.BB
Length0.030.13ft.LPR
Area0.160.40ft.2-
Table 8. Pier model dimensions.
DimensionValueUnitScaleAbbreviation
Pier Height0.67 ft.0.12-
Pier Submerge Height0.58 ft.0.12TFP
Pier Length2.00 ft.0.12LPP
Pier Width0.17ft.0.12BMS
Pier Submerge Area0.10 ft.0.12AMS
Pier Height0.67 ft.0.12VWL
Table 9. Water level after the bulb.
Pump Speed (RPM)Flume Slope (%)Pitch Angle (deg.)Bulb Length (ft.)Froude NumberWater Level (in.)
5501.240-1.857.0
5501.2401.251.805.5
5501.2451.271.846.0
5501.24101.291.816.0
5681.990-2.055.5
5681.9901.252.035.0
5681.9951.272.065.0
5681.99101.292.065.0
5702.380-2.135.1
5702.3801.252.105.2
5702.3851.272.115.0
5702.38101.292.125.0
6011.590-1.978.0
6011.5901.251.947.5
6011.5951.271.957.0
6011.59101.291.956.8
6302.780-2.258
6302.7801.252.266.5
6302.7851.272.246.5
6302.78101.292.316.0
7143.160-2.496.0
7143.1601.252.526.0
7143.1651.272.506.0
7143.16101.292.496.0
7503.590-2.595.5
7503.5901.252.585.5
7503.5951.272.605.5
7503.59101.292.605.5
7654.260-2.704.5
7654.2601.252.635
7654.2651.272.634.5
7654.26101.292.684.5

