1. Introduction
The aim of this work is to study imbibition, i.e., the spontaneous capillary penetration of a viscous liquid into a homogeneous, thin, circular, dry porous medium to which has been imposed previously a temperature difference
along the radial direction,
r. Isothermal imbibition from an unlimited liquid reservoir has received attention due its important applications in paper chromatography [
1,
2], printing ink [
3], paper absorption [
1,
4,
5,
6], and aerosol research [
5,
7]. In the latter case, the spreading of liquid drops into a porous substrate is of much interest because it corresponds to radial imbibition from finite liquid volumes [
5,
7,
8].
Isothermal radial imbibition in horizontal porous samples has been studied, for example, in samples of paper [
1,
5,
6], in 3D cubical scaffold with cylindrical struts [
8], and in thin Hele-Shaw cells filled with granular material [
9]. Moreover, studies of radial imbibition in Hele-Shaw cells following a one-dimensional approach (without granular material) yield a similar equation for the advance front, as a function of time [
4,
10], as those reported for thin radial porous samples.
Imbibition under high temperature is very common during enhanced oil recovery [
11,
12,
13] and in soldering when non-reactive liquid metals are involved [
14]. Mean temperatures around 400 K are typical during enhanced oil recovery, while higher temperatures (450–2300 K) occur during welding with liquid metals. Temperature gradients also appear in both processes due to a non-uniform heating. However, during imbibition under temperature gradients, the viscous drag and the driven capillary force can change substantially because viscosity and surface tension are strongly dependent on temperature [
12,
14]. The main assumption in our treatment is that the temperature spatial variations (
, where
is the position vector), in the absorbing medium, affect dynamic viscosity
and surface tension
. Moreover, in many liquids, dynamic viscosity and surface tension decrease as temperature increases (
and
), and during imbibition under temperature gradients, both effects compete [
15]. The manner in which the wet region advances, in a radial geometry, as time proceeds is the main subject of this work.
To establish the temperature gradient on the circular porous samples of small thickness e, we have imposed a temperature difference between the internal perimeter of a central orifice and the external perimeter of a metal circular plate upon which the circular strips of paper rest. This procedure allows us to have very controlled temperature gradients on the paper, which is the porous medium of our work.
To reach our goals, this work is divided as follows. In the next section, we give the solution to the one-dimensional heat conduction problem in a solid impervious plate and in the absorbing medium. In
Section 3, by using the solution of the conduction problem, we treat the imbibition problem with temperature differences along a thin porous medium. There, the theoretical study of imbibition into porous media has been carried out by using the Darcy equation with viscosity dependent on temperature. In order to compare several cases, isotherm imbibition was also analyzed. In
Section 4, a set of experiments in commercial blotting paper sheets, under temperature gradients, are performed, and a good fit of the theoretical profiles was obtained. Finally,
Section 5 presents the main conclusions and remarks.
2. Temperature on Circular Plates
Lets us start with the description of the heat conduction problem to establish the temperature difference
in a horizontal, thin impervious metal plate through the use of cylindrical coordinates
. The origin of this system is located at the center of the circular plate, as shown in
Figure 1, which has an orifice of radius
. The temperatures were fixed as
in the inside perimeter of an orifice of radius
and
along the outer perimeter of the circular plate of radius
. This allows imposing a steady-state temperature distribution only dependent on the radial coordinate
,
, which can be obtained through the solution of the Laplace equation
under the boundary conditions
at
and
at
. The solution of the Laplace equation yields a temperature distribution of the form:
and the temperature gradient
is given by:
notice that the temperature gradient is a function of
r.
After the imposition of the temperature distribution on the horizontal metal plate, we place upon it, very close together, a thin, circular porous sample of radii
and
. Consequently, the porous medium acquires, by conduction, the same temperature distribution of the metal plate. Since the temperature difference
can be positive or negative, we have that the spatially-averaged temperature gradient,
, defined as:
can be positive if
(
, temperature increases when
r increases) or negative if
(
, temperature decreases when
r increases).
3. Imbibition into a Porous Medium
Isothermal imbibition into thin dry porous circular strips generates circular advance fronts of radius
, where
t is the elapsed time by the front to reach the radius
R. At short time lapses, the front evolves as
, which is the Washburn diffusive law [
16], and for long times, the imbibition front obeys a logarithmic relation, which will be discussed afterwards.
Imbibition into the thin circular porous samples under temperature gradients is studied here by assuming that the saturation of the porous medium under imbibition is full, which is a simple and realistic approximation for thin samples. In our study, we considered a sample of thin thickness
e, outer radius
, and an inner radius
, and it rested on the metal circular plate having a radial temperature difference
between their perimeters. Thus, the temperature distribution on paper was the same as that given by Equation (
1) for the metal plate. In porous media, typically, the Reynolds numbers during imbibition are low [
17]; thus, the use of the Darcy equation is adequate here. Experimental observations given in the next section let us assume that radial imbibition under homogeneous temperature gradients will maintain purely radial fronts. Therefore, the one-dimensional Darcy equation for the filtration velocity,
, takes the form:
where
d is the pore diameter,
is a lumped constant that involves the structure of the porous medium (in a general context, the permeability of the porous media met that
[
18]),
p is the pressure in the liquid, and the term
specifies that the dynamic viscosity changes point to point where the liquid is present because temperature is non-uniform.
When a liquid contacts a wettable porous medium, it is imbibed spontaneously due to the pressure drop,
, where
is the atmospheric pressure, assumed as zero in this work, and
is the capillary pressure defined just at the imbibition front located at
. The surface tension takes the value
because the existence of the temperature distribution in the porous medium yields, just on the front, a value that depends on temperature. Then, the pressure drop is the capillary pressure, which induces the liquid motion into the porous medium:
here, the new lumped constant
is related to the structure of the porous medium, the inter-fiber and intra-fiber pores [
19], and the contact angle between the liquid and the porous material, which is assumed as not dependent on temperature for many liquids [
20].
The integration of the Darcy Equation (
4) yields:
where we have considered that the dynamic viscosity is a function of the temperature itself and temperature is a function of
r.
When liquid loss due to evaporation from the porous media can be neglected, the mass conservation implies that
, from which it follows, through the use of Equations (
5) and (
6), that:
being
.
From the fundamental point of view of the dynamic viscosity and the surface tension depends on temperature in a non-linear form, computationally and experimentally, it has been proven that the use of linear approximations is valid in small ranges [
13,
14,
15]. It allows introducing linear laws for
and
such that
and
, where
and
are the values of dynamic viscosity and surface tension at a reference temperature,
, where
. The substitution of the temperature gradient given in Equation (
2) into the previous relations yields:
Using the linear relations (
8) and (
9) in Equation (
7) allows us to find the motion equation in the form:
Through the introduction of the dimensionless radius
, the dimensionless time
, with the characteristic time
defined as:
and the dimensionless parameters:
into Equation (
10), we found the dimensionless non-linear differential equation for the imbibition front in the porous medium under a temperature gradient:
which will be solved using the initial condition
at
. The solution of the differential Equation (
13) will be computed numerically in the following section.
In the context of the imbibition under temperature gradients, the physical parameters of the problem
(Equation (
11)) and
A and
B (Equation (
12)) have specific meanings:
is the viscous-capillary time indicating that the initial imbibition radius at
is finite [
8], and it also involves the structure of the porous medium through
d;
A is the non-dimensional relative variation of viscosity with temperature, and
B is the dimensionless relative variation of the surface tension with temperature. Later on, we will notice the dynamical changes produced by
A and
B.
If imbibition occurs at uniform temperature, we have that
. Clearly, the case of isothermal imbibition produces the dimensionless non-linear differential equation
, and its solution gives the non-dimensional imbibition front,
, as:
For a small dimensionless radius of imbibition (
, with
), the asymptotic imbibition front now is given by:
which is the Washburn law for radial isotherm imbibition [
6]. In the following section, we will discuss a set of experiments made in order to prove the validity of our model.
4. Experiments
The validity of our previous approach to dealing with the imbibition under temperature radial gradients will be analyzed here. To impose the gradients, we used a circular copper plate of
m in thickness, drilled at its center with an inner radius
m, and having an exterior radius
m. The central orifice was joined to a copper vertical pipe of radius slightly smaller than
m to get a good contact between the pipe and the plate (see
Figure 1). Additionally, the short pipe was brimful with dry sand, and it also was in contact with a copper reservoir, which was maintained at a temperature
. All these contacts allowed having a temperature
at
in the copper plate. The external rim of the disk was surrounded by a copper pipe through which water was recirculated to maintain the external perimeter of the disk at a uniform temperature
, just at
. This array lets us achieve controlled temperature gradients through the difference
between the internal and the external perimeters.
Once the steady temperature profile was reached on the copper disk, circular samples of blotting paper sheets of m inner radius and m outer radius were placed on the copper disk (having a hydrophobic coating to avoid wetting) in order to obtain by conduction exactly the same temperature profile as that of the disk itself; then, the imbibition was set in motion when the lower reservoir was filled with water, and it rose through the sand in the pipe up to the plate where sand, contacting circular samples of blotting paper by its inner rim, allowed the radial imbibition process.
To carry out the imbibition experiments, we have selected commercial blotting paper as the porous material because it is thin,
m average thickness. The nominal paper permeability in this case was 5 Darcy, and consequently, its average pore diameter was
m. When the dry blotting paper was placed on the copper disk, the heat was diffused through the paper thickness, allowing establishing the same temperature profile as that of the metal disk; this process involved a diffusion time given by
[
21], where
is the thermal diffusivity of dry paper, which had a value
m
/s [
22]; thus, the approximate time it takes the dry paper to reach the temperature of the metal disk was
s.
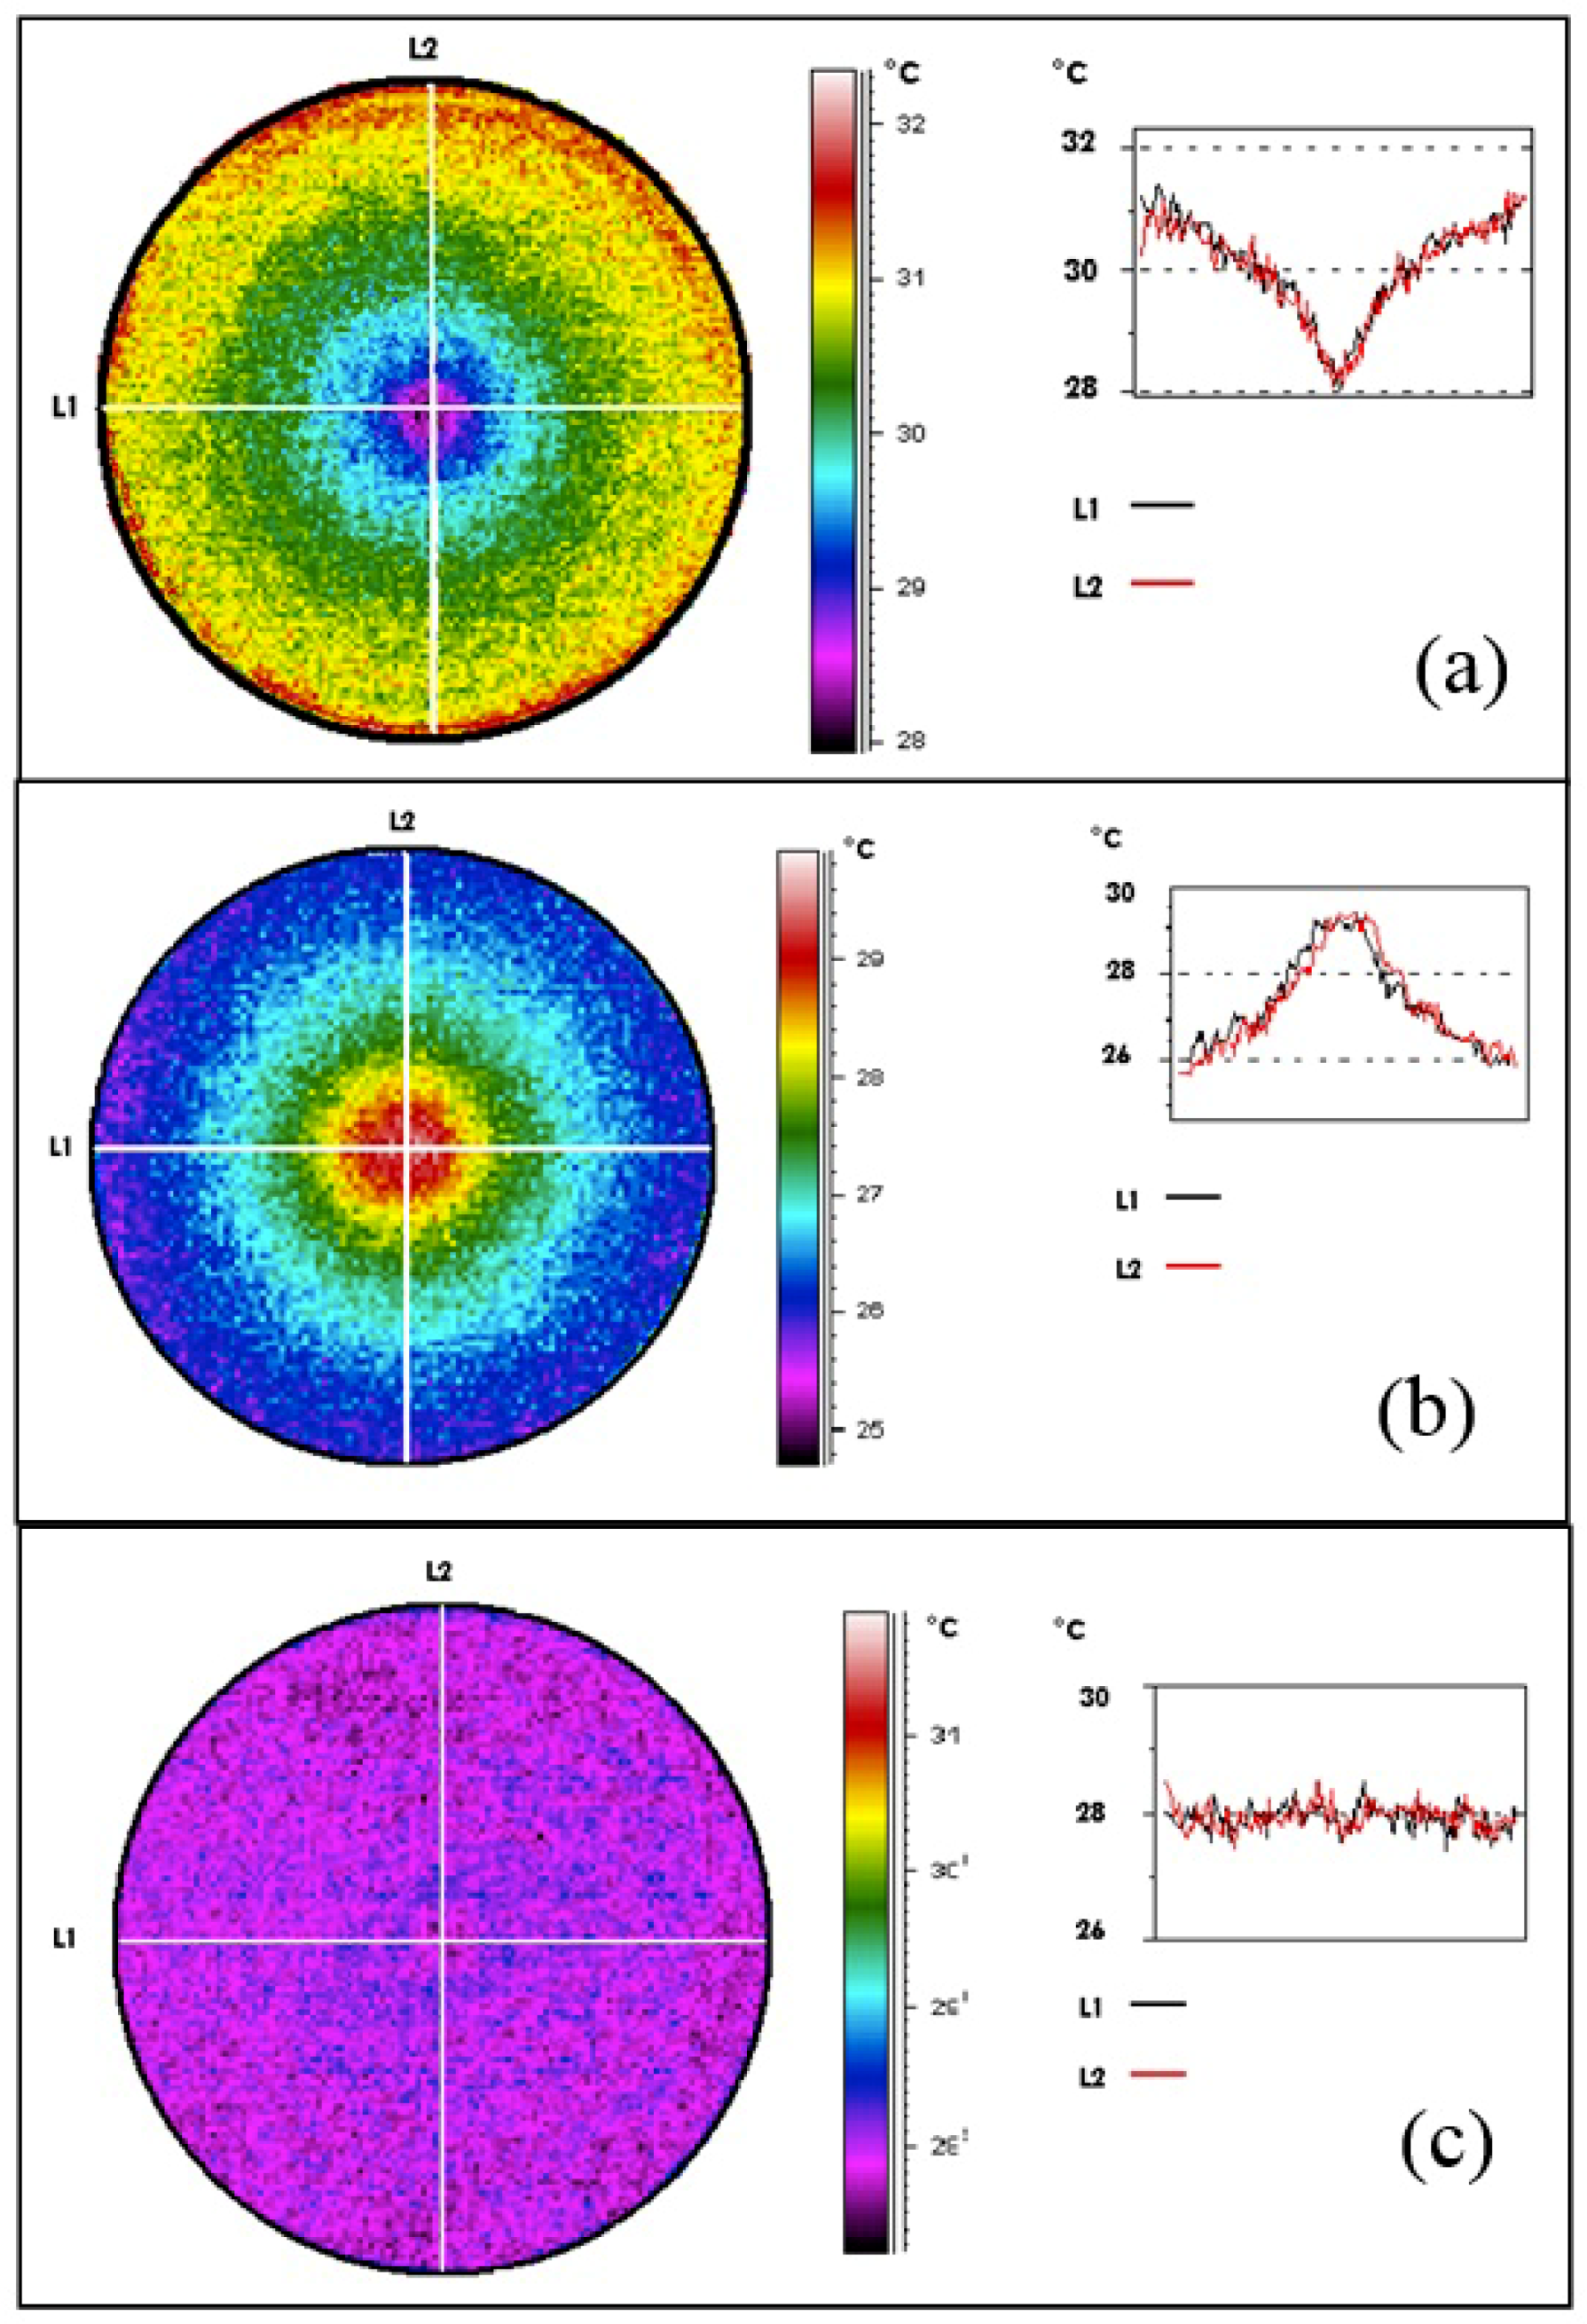
Three values for the mean gradients were attained: (a) the case of a positive mean temperature gradient
K (
C),
K (
C),
K/m; (b) the case of a negative gradient
K (
C),
K (
C),
K/m; and (c) the isotherm case with
and temperature
K (28
C). Note that we have chosen
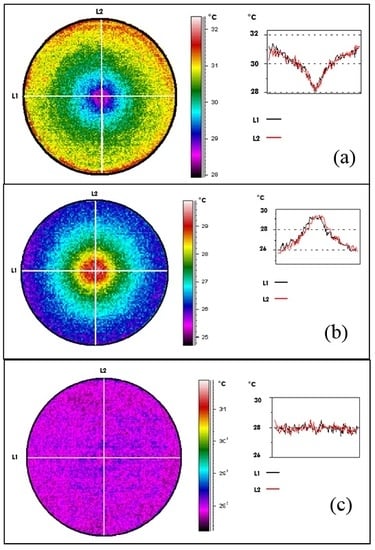
in order to have a direct comparison between cases with negative and positive gradients. The spatial temperature profiles were obtained by means of an infrared camera Model Thermacam Flir PM595, with
of error in the measurement. Several representative profiles on the dry paper are shown in
Figure 2. In this figure, the plots on the right-hand side show the temperature profiles, and their fluctuations are related to the measurement error, which in this case was around
C.
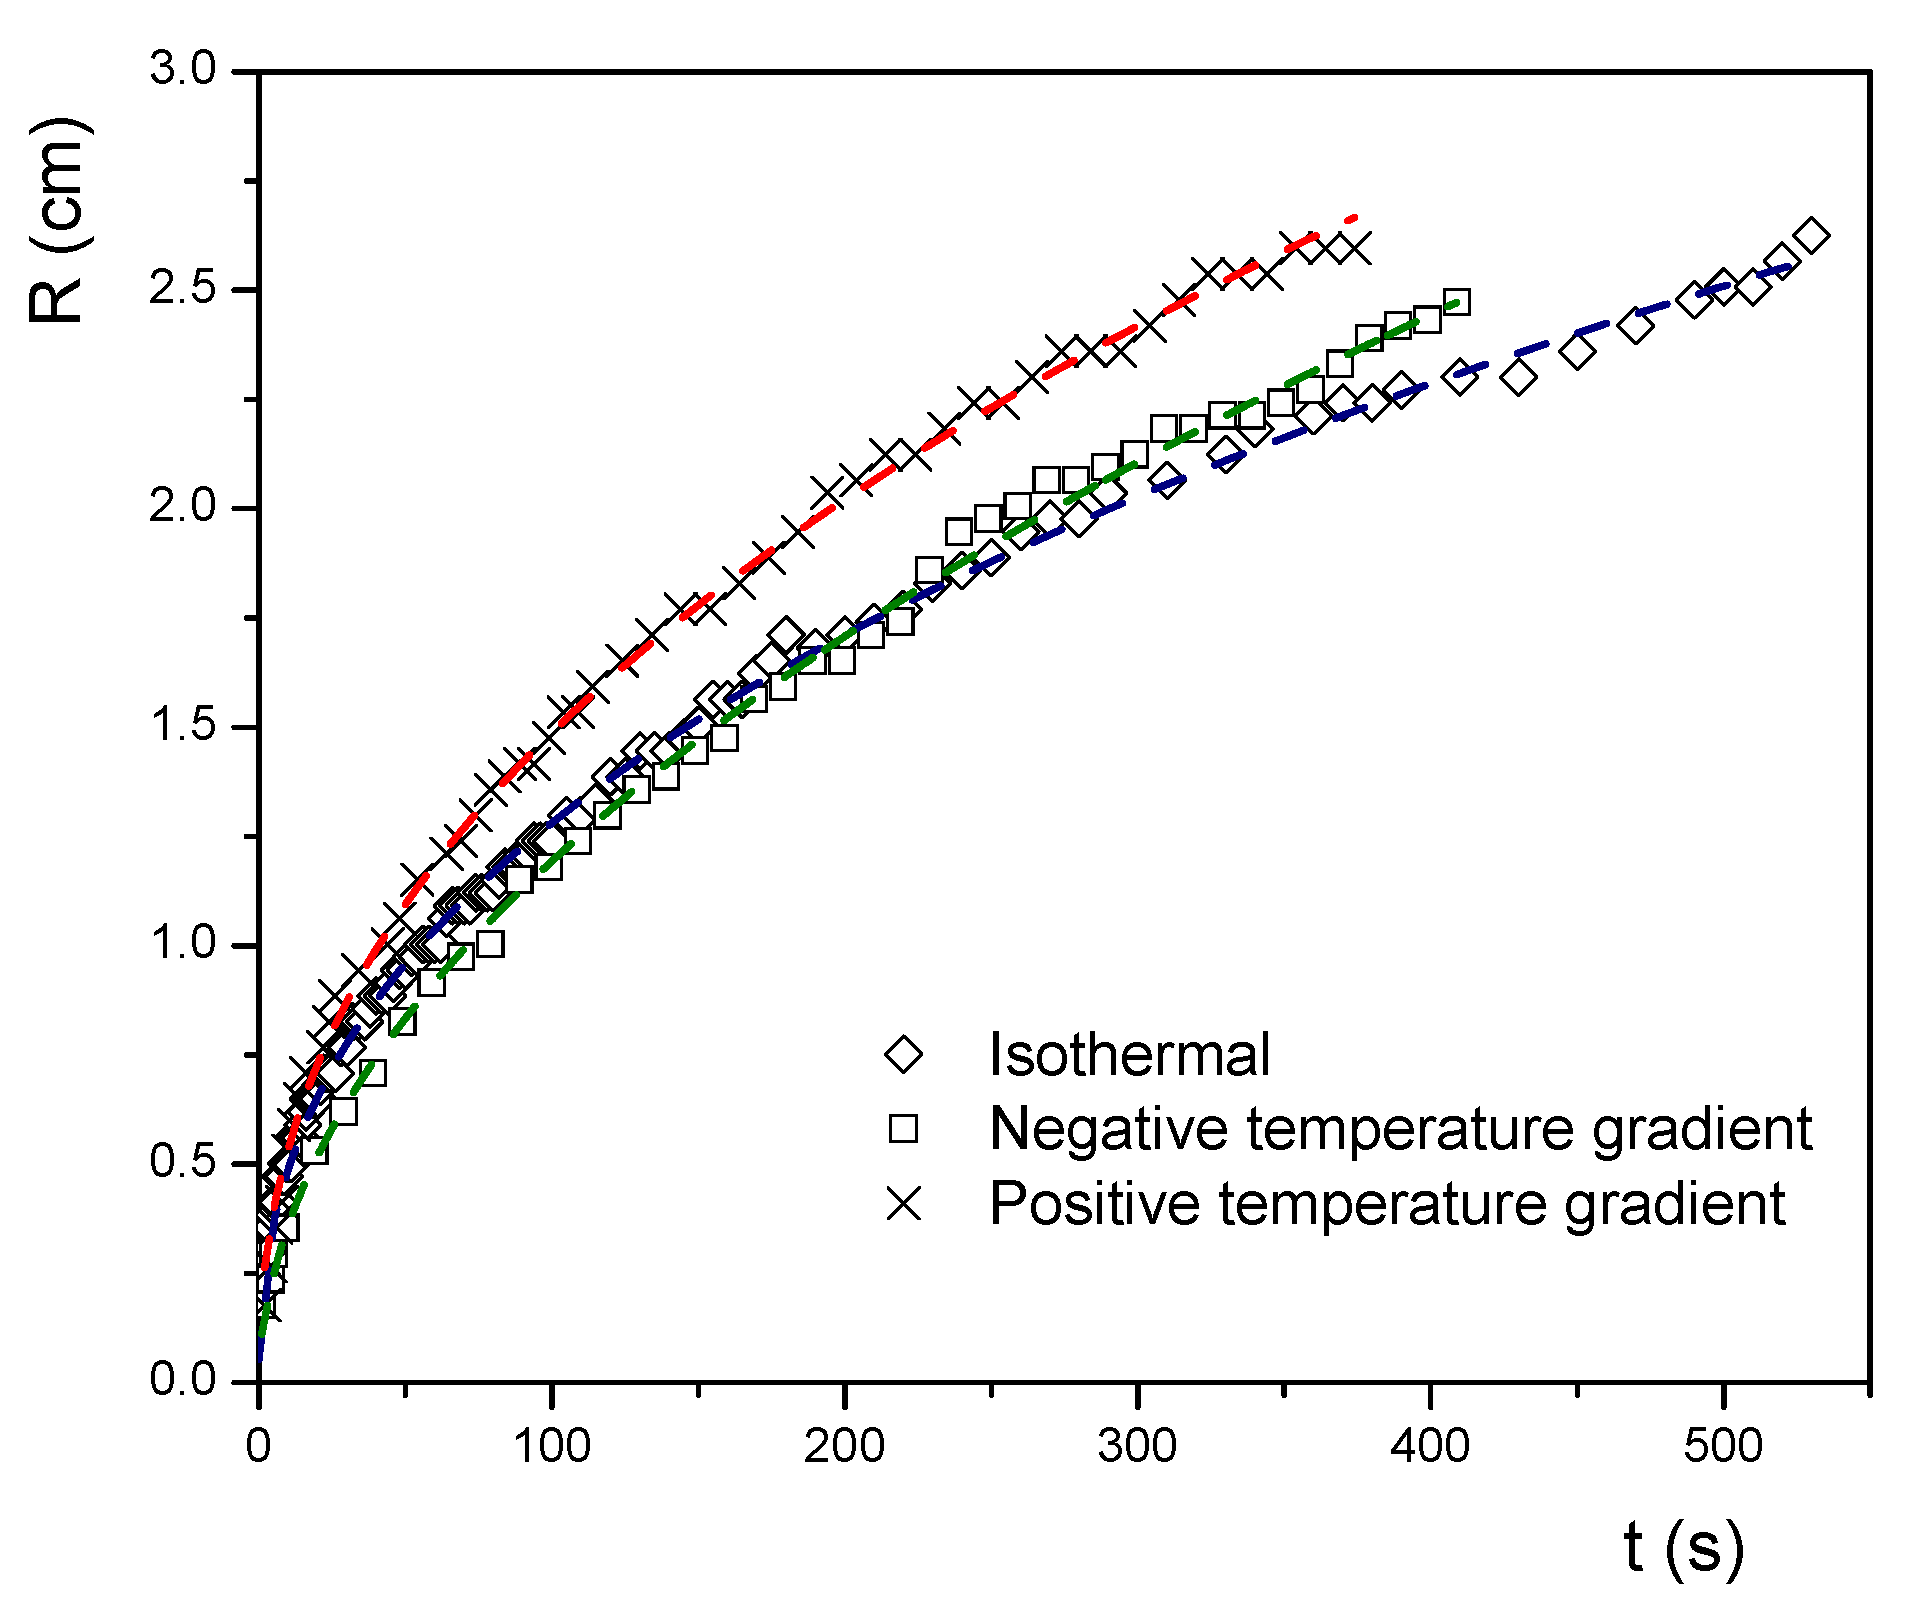
When the temperature profiles were imposed on the paper and the water imbibition occurred, we performed measurements of the radial imbibition fronts
R as a function of time,
t. In
Figure 3, the plot of
R vs.
t is shown for the three temperature distributions (symbols).
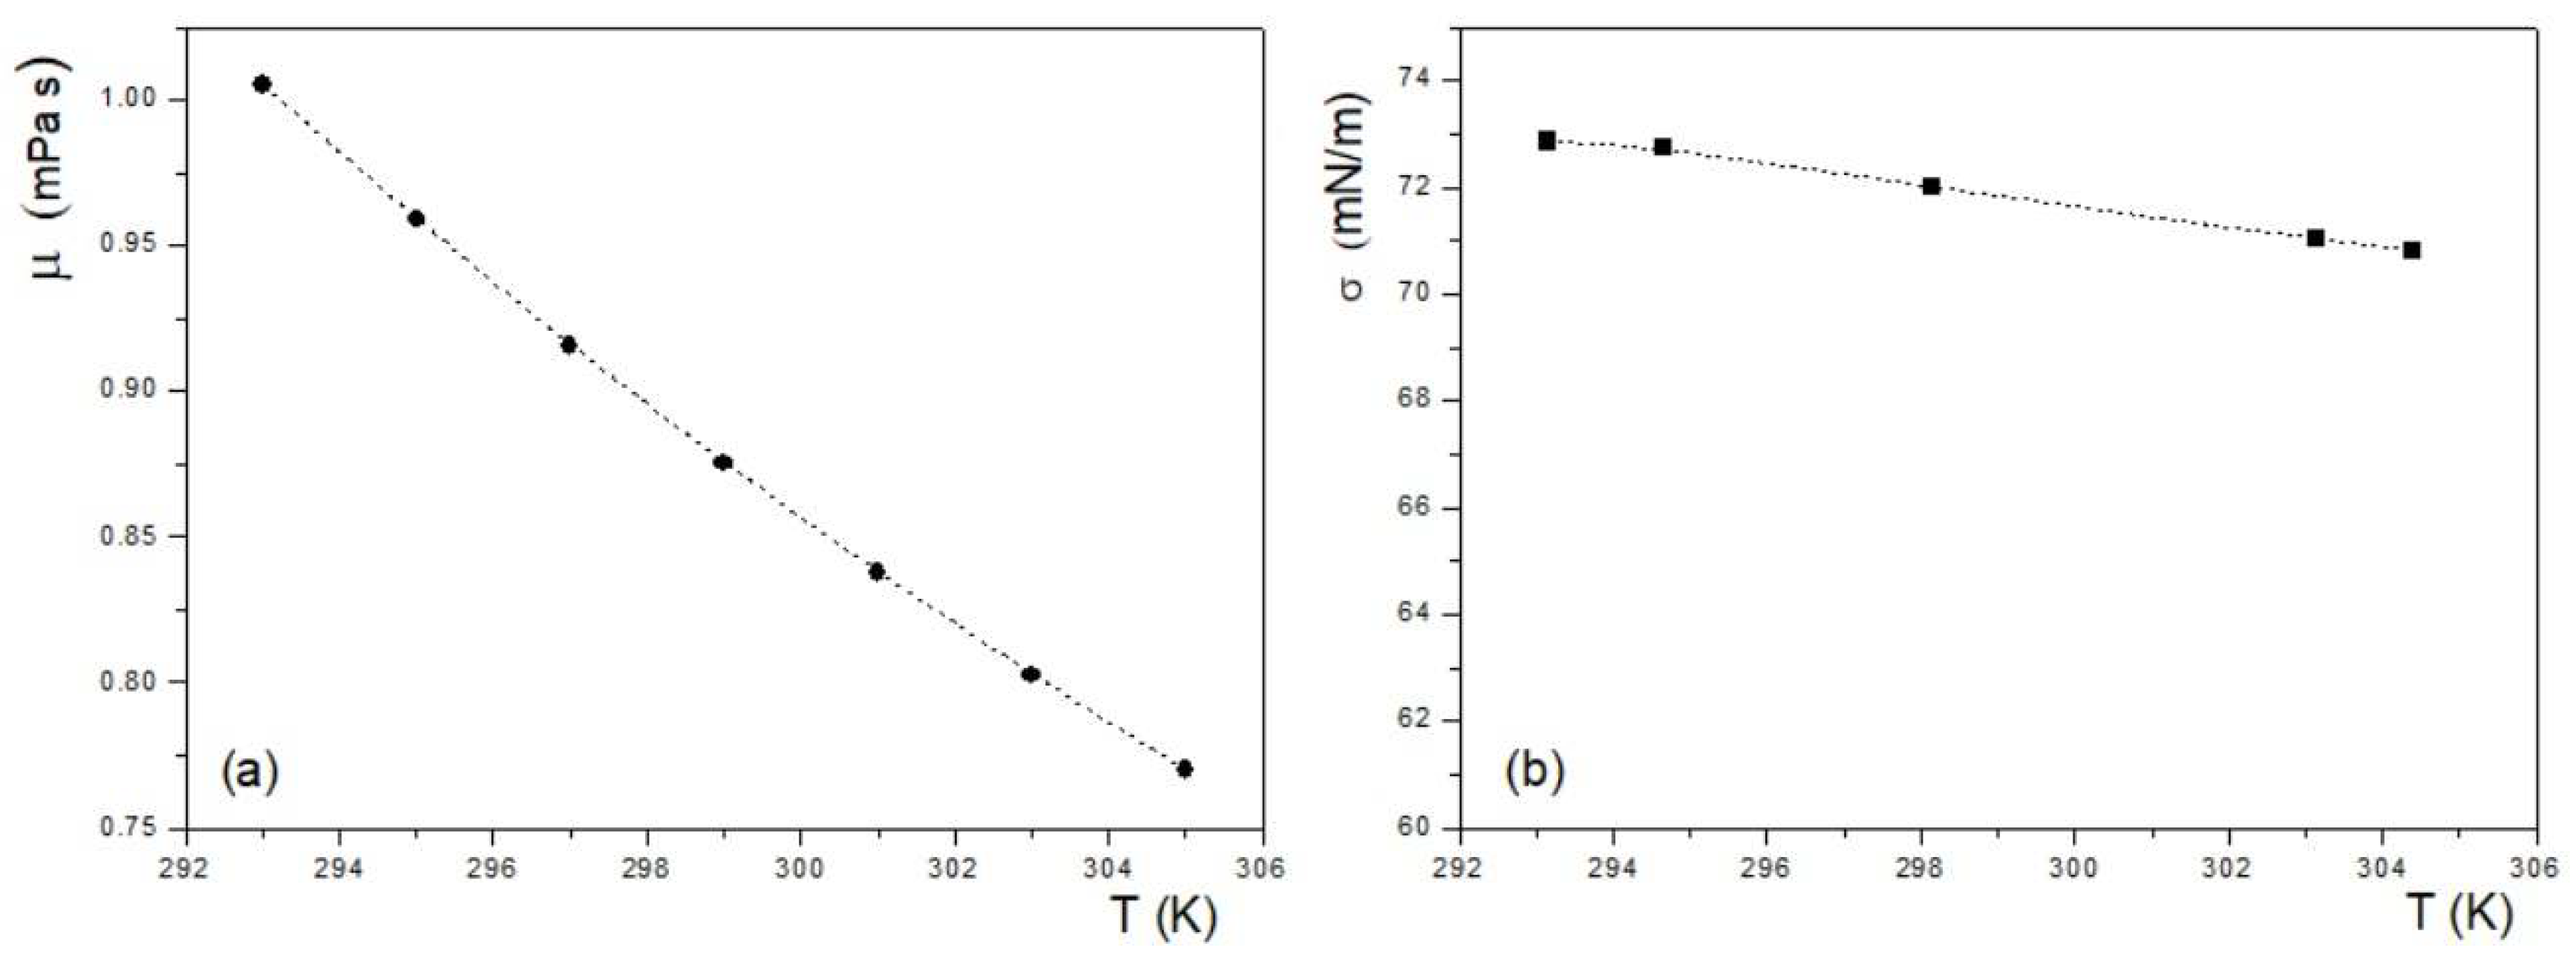
We can compute the dimensionless factors
A and
B, for each respective case, from data for viscosity and water-air surface tension given in the plots of
Figure 4 and the temperature distributions already established, and we obtained that
and
for positive average gradient and
and
for negative average gradient. Notice that
A is an order of magnitude larger than
B; this means that the viscosity variation will produce stronger effects on the evolution of the imbibition fronts as temperature changes.
The isotherm case is useful to show the effect of the temperature gradients on the evolution of the imbibition fronts, but also, this case lets us determine the value of the lumped constant
c as follows: the dimensional form of Equation (
15), which is valid for small radii
R, has the form:
by taking into account the corresponding experimental values of
,
,
,
d, and the time
t, in this formula, we can obtain the theoretical data for
. By correlating data for the theoretical
and the experimental data for
R, at short times, given in the plot of
Figure 3 for the isotherm case, we can obtain through the least squares method that the best value for
c is
. This value was used to compute the solution of Equation (
13) numerically for positive and negative mean gradients and to compute the overall imbibition front for the isothermal case.
The numerical profiles (curves) fit satisfactorily the experimental data, as is shown in
Figure 3. The non-linear differential equation was solved numerically using a fourth order Runge–Kutta method, under the initial conditions described before.
The temporal changes on the imbibition fronts for each value of
are related to the respective values of
A and
B. From
Figure 3, it is clear that, at short times, the three curves followed approximately a behavior
(Equation (
16)), but for later times, the curves were separated between themselves. A more detailed behavior of the imbibition fronts can be shown more clearly in
Figure 5, where we plot the mean velocity of fronts as a time function. There, it is easily appreciated that for intermediate times, the velocity of each front is different, but for larger times, again, they are similar, i.e., at intermediate times, the relative changes for negative and positive gradients play a different role between them, but at large times, these relative variations of viscosity and surface tension will vanish, because far from
, the local gradients are weakest.
Finally, it is important to comment that, generally speaking, the capillary penetration in the porous medium should be affected by the temperature, if the local temperature difference between the local bulk temperature of the liquid and the temperature of the most immediate grain or fiber can be neglected. This condition will be satisfied provided that the dimensionless relation
is valid [
21], where
is the liquid thermal diffusivity,
is the grain average diameter, and
d, as before, is the pore diameter. The quantity
is the Peclet number, and it compares the bulk transport of heat under forced convection (with velocity
) with respect to the heat transfer by conduction. Thus, a very small Peclet number refers to a very slow flow where heat conduction dominates. Due to
approximately in blotting paper, we have that the condition
must be maintained for imbibition under temperature gradients. Consequently, the imbibition model relies on these assumptions. In our case, experiments allowed to estimate that for the initial times, where the front velocities were large, the Peclet number was
, because for water,
cm
/s (at room conditions), and thus, our imbibition experiments fulfilled this criterion. At the end, when each experiment was completed, we verified that approximately the respective temperature profiles (as those thermographies given in
Figure 2 for dry paper) in the imbibed papers were the same; it occurred effectively.


