1. Introduction
Most of the experiences on CO
2 geological storage worldwide were conducted in rock formations with high permeability in the pore matrix, mainly in sandstones [
1,
2,
3], and in some cases in carbonates such as the AEP Mountaineer Project [
4,
5], Michigan and Williston Basin CO
2-Enhanced Oil Recovery (EOR) projects [
6,
7] in USA, IEAGHG Weyburn-Midale CO
2 project [
8] in Canada and the Uthmaniyah CO
2-EOR demonstration project [
9] in Saudi Arabia. Recently, promising investigations in carbonates have been carried out as CO
2 injections in fractured media, addressed in this article, and the role of isolated kerogen nanopores for CO
2 sequestration in organic-rich salts in EOR projects [
10].
The design of safe and efficient CO
2 injections in fractured carbonates and the understanding of the trapping mechanisms are challenging matters. To give a proper solution, it is necessary to study the hydrodynamic and mechanical effects induced by the CO
2 plume migration through the fractures, as well as the analysis of the geochemical reactivity produced by the acidification of the brine and the impacts on the reservoir permeability and seal integrity [
11].
Field-scale tests are being carried out at Hontomín Demo Pilot [
12] to analyze these effects, using an innovative method established in the Spanish Patent ES201500151 which is based on the alternative injection of brine and CO
2 [
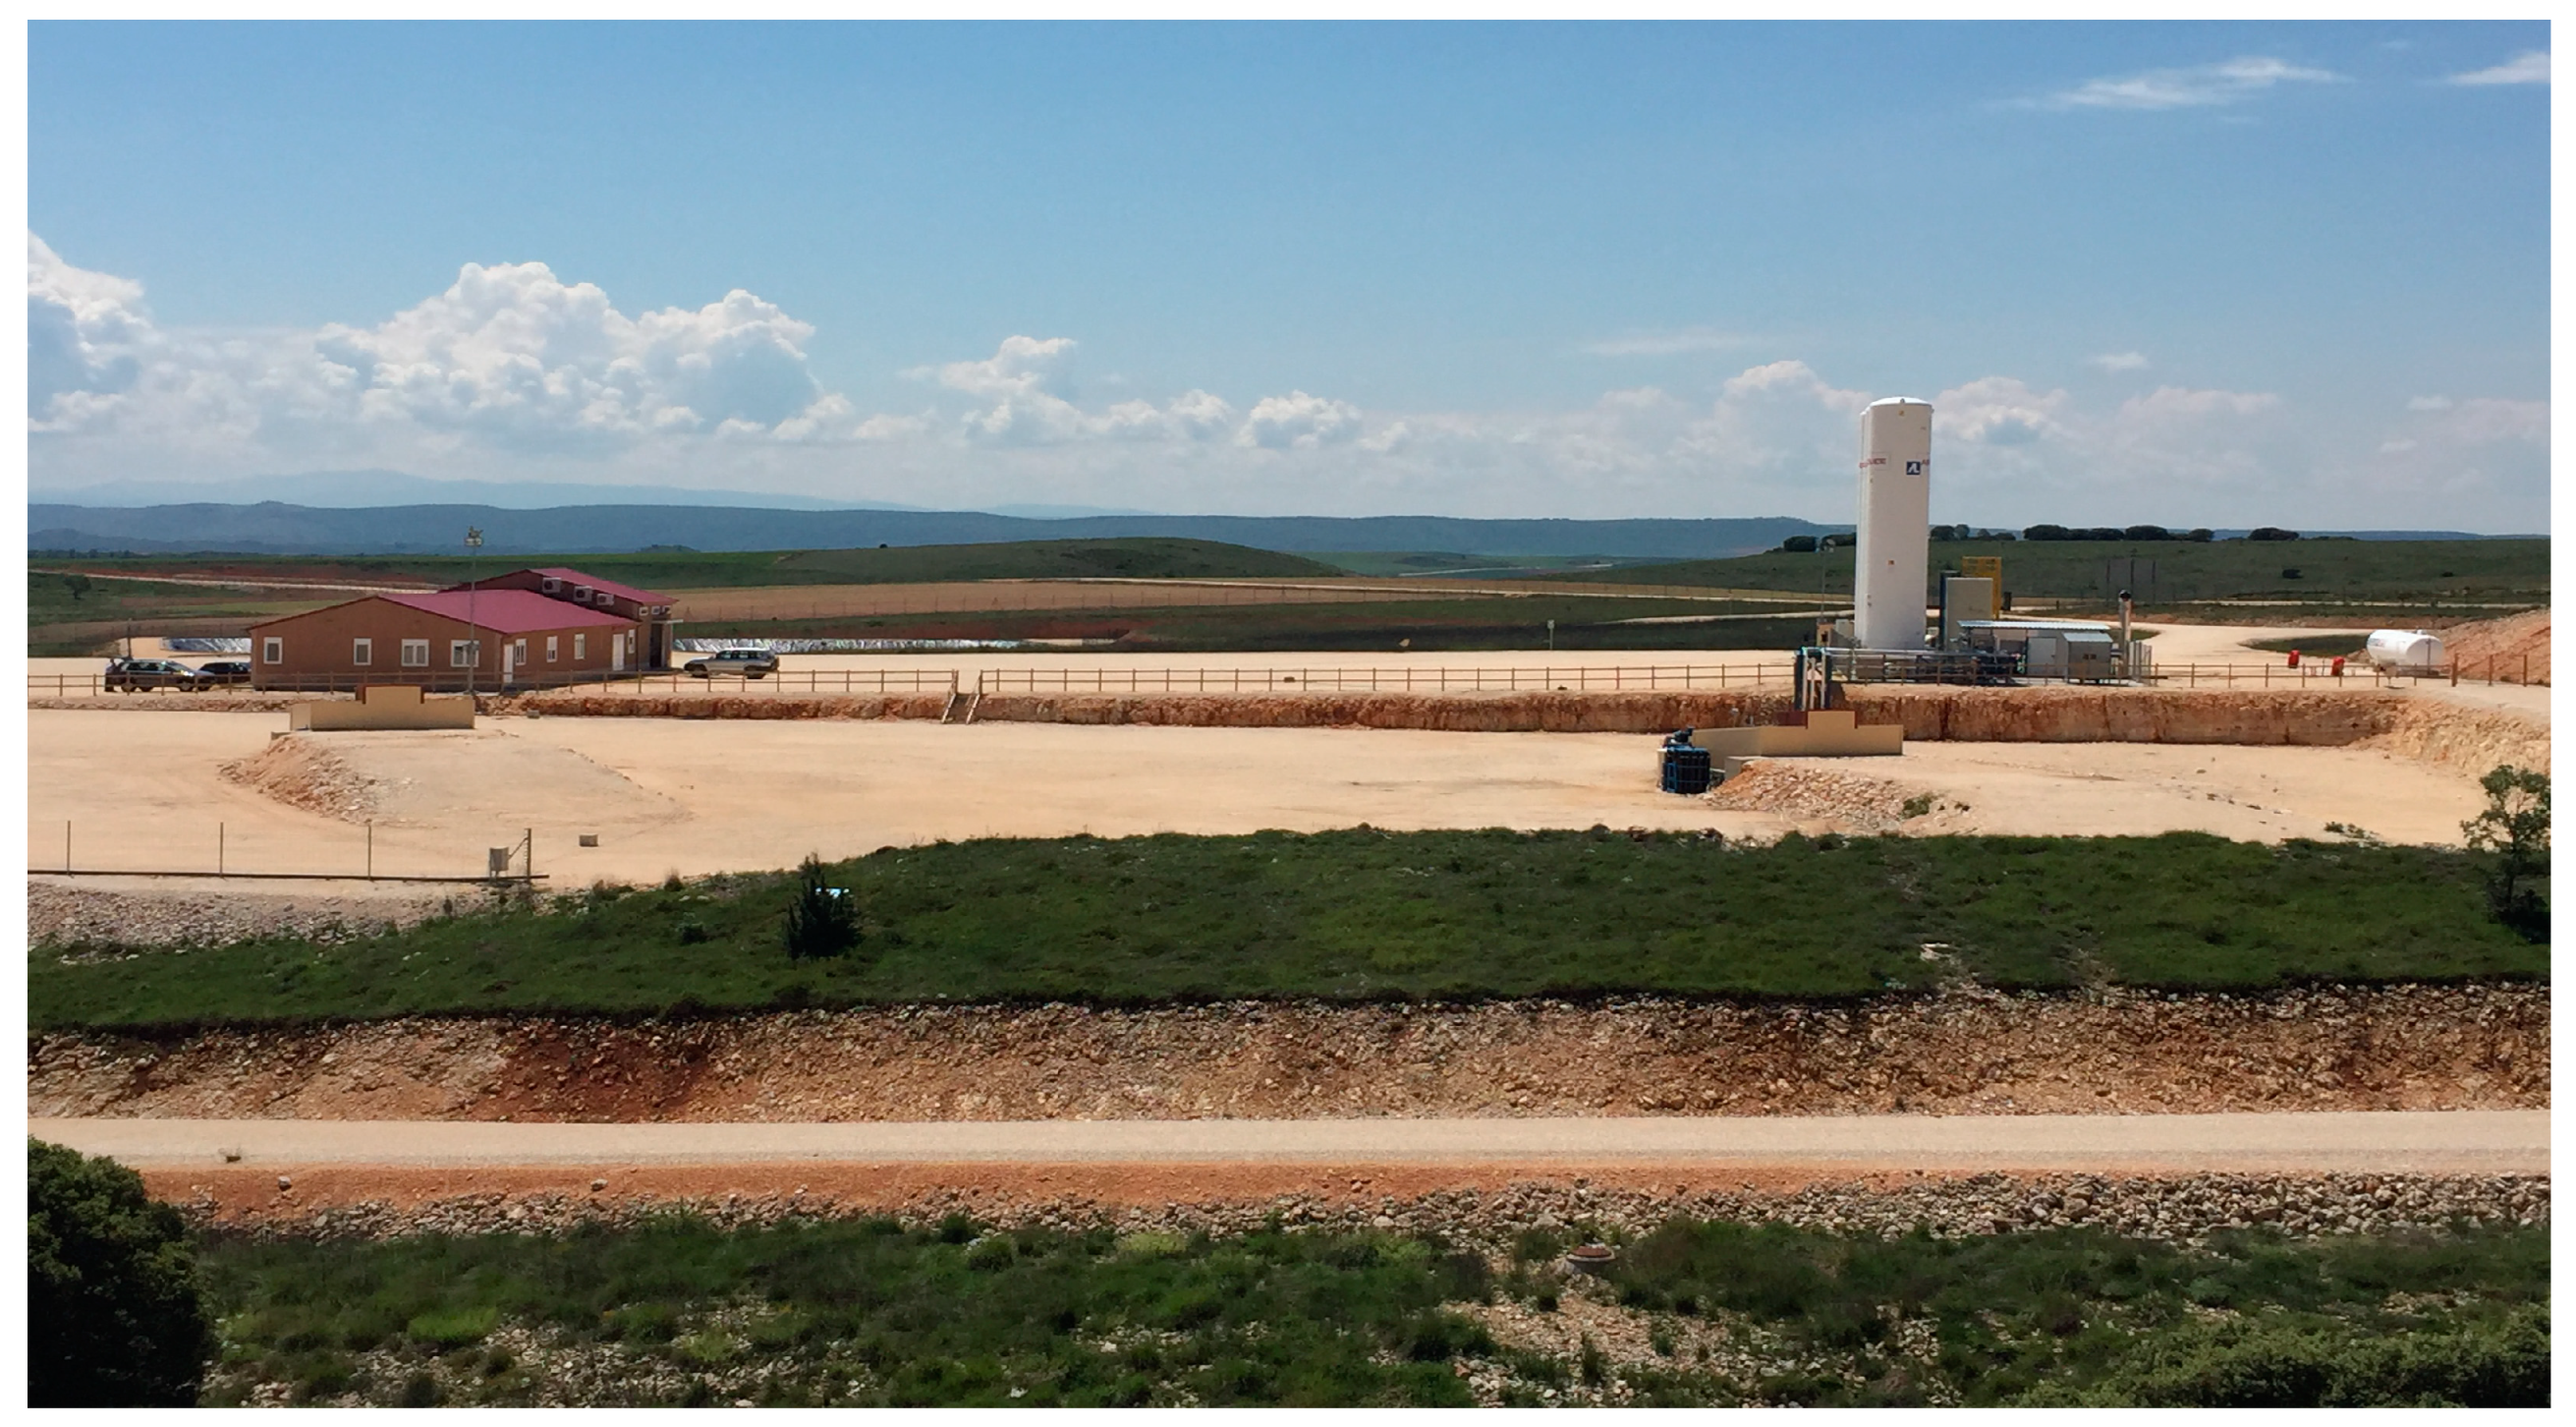
11]. Hontomín is the only current on-shore injection site in Europe for CO
2 geological storage, operated by Fundación Ciudad de la Energía (CIUDEN), and recognized by the European Parliament as a key test facility for CCS technology development [
13]. The pilot is located close to Burgos in Northern Spain, consisting of a naturally fractured carbonate reservoir with a poor matrix porosity [
14]. It is at the early injection phase, and therefore, all the long-term effects that condition the geological storage of CO
2 must be identified and analyzed. Hontomín is also the operational storage field site in the ENOS project, where planned research activities are focused to demonstrate innovative injection strategies to increase the confidence of operators in the safe management of these sites [
15]. The expected outcomes from the project are the increase in knowledge about the behavior of the injected CO
2 in fractured carbonates and the development of safe and efficient operational procedures [
16].
CO
2 injections in tight reservoirs with main fluid transmissivity through fractures, as in the Hontomín case, usually implies high-pressure values. This fact leads the hydrodynamic effects in the fracture network [
11] that produce changes of the injectivity and the mechanical factors such as overcoming the hydraulic fracture pressure that can put the seal integrity at risk [
17]. Both effects are analyzed in
Section 3 on the basis of the evolution of the bottom hole pressure and temperature (
BHP/T), and the flow rate during the injection. In addition to assessing the operating parameters during the injection, pressure recovery periods were also determined during the fall-off phase to study the hydrodynamic stability. The interpretation of the results from the first injections in ENOS conducted at Hontomín was essential to analyze the reservoir behavior, particularly to assess the fluid migration through fractures and to prove that the safe pressure threshold to preserve the seal integrity is not exceeded.
As mentioned above, the geochemical reactivity produced by the reservoir water acidification impacts the permeability of carbonates [
18]. The study of the short-term effects was carried out in previous works conducted during the hydraulic characterization phase [
11] and will be addressed in a later stage of the ENOS project.
As described in
Section 4, the initial geological model based upon a previous work [
19] was first improved with better characterization of the vertical and lateral heterogeneities. For this, an advanced workflow with the FracaFlow™ was used to model a Digital Fracture Network (DFN) [
20] around the injection well and to characterize the main properties of the fractures. CO
2 plume migration was modeled with GEM™, a commercial compositional dual media model which accounts for both temperature effects and multiphase flow hysteresis as liquid CO
2 and brine were alternately injected during the tests. Hence, the dynamic model was set up as a dual permeability and porosity media to account for the various operations and the geological context. An advanced automated history matching with CMOST™ tuned the flow model parameters to predict the evolution of pressure and temperature around the injection well.
The main findings of the works conducted so far in ENOS project are: on the one hand, the CO2 injection is performed in the liquid phase and the fluid transmissivity occurs through the fractures of the carbonates, in accordance with the data interpretation of operating parameters such as flow rate, well-head pressure (WHP), bottom hole pressure (BHP) and distributed temperature along the well tubing. On the other hand, the alternative injections of brine and CO2 involve multiphase flow hysteresis in the fracture network of the reservoir which produces relevant changes in the injectivity and in the pressure recovery during the fall off phase. Modeling results show that the bottom hole pressure match is quite satisfactory, nevertheless, updating and refinements are needed to develop an effective tool.
The operational strategies tested on site demonstrate the discontinuous injection that must be conducted due to the low injectivity in the reservoir or because the integrity of the seal is put at risk, can be performed in a safe and efficient manner, unlike the existing experiences that mostly correspond to continuous injections [
1,
4,
6,
7]. The approach is different and new because it was tested in carbonates with CO
2 migration dominated by the fractures, while most of the other works were performed mainly in sandstones [
2,
3] and in carbonates [
4,
5] with fluid transmissivity in the porous matrix. The motivation of the innovative method is to test different injection schemes needed for future storage operations at the commercial scale which may cause unexpected reservoir behavior or intermittent supply during CO
2 capture [
16]
2. Description of Pilot Plant
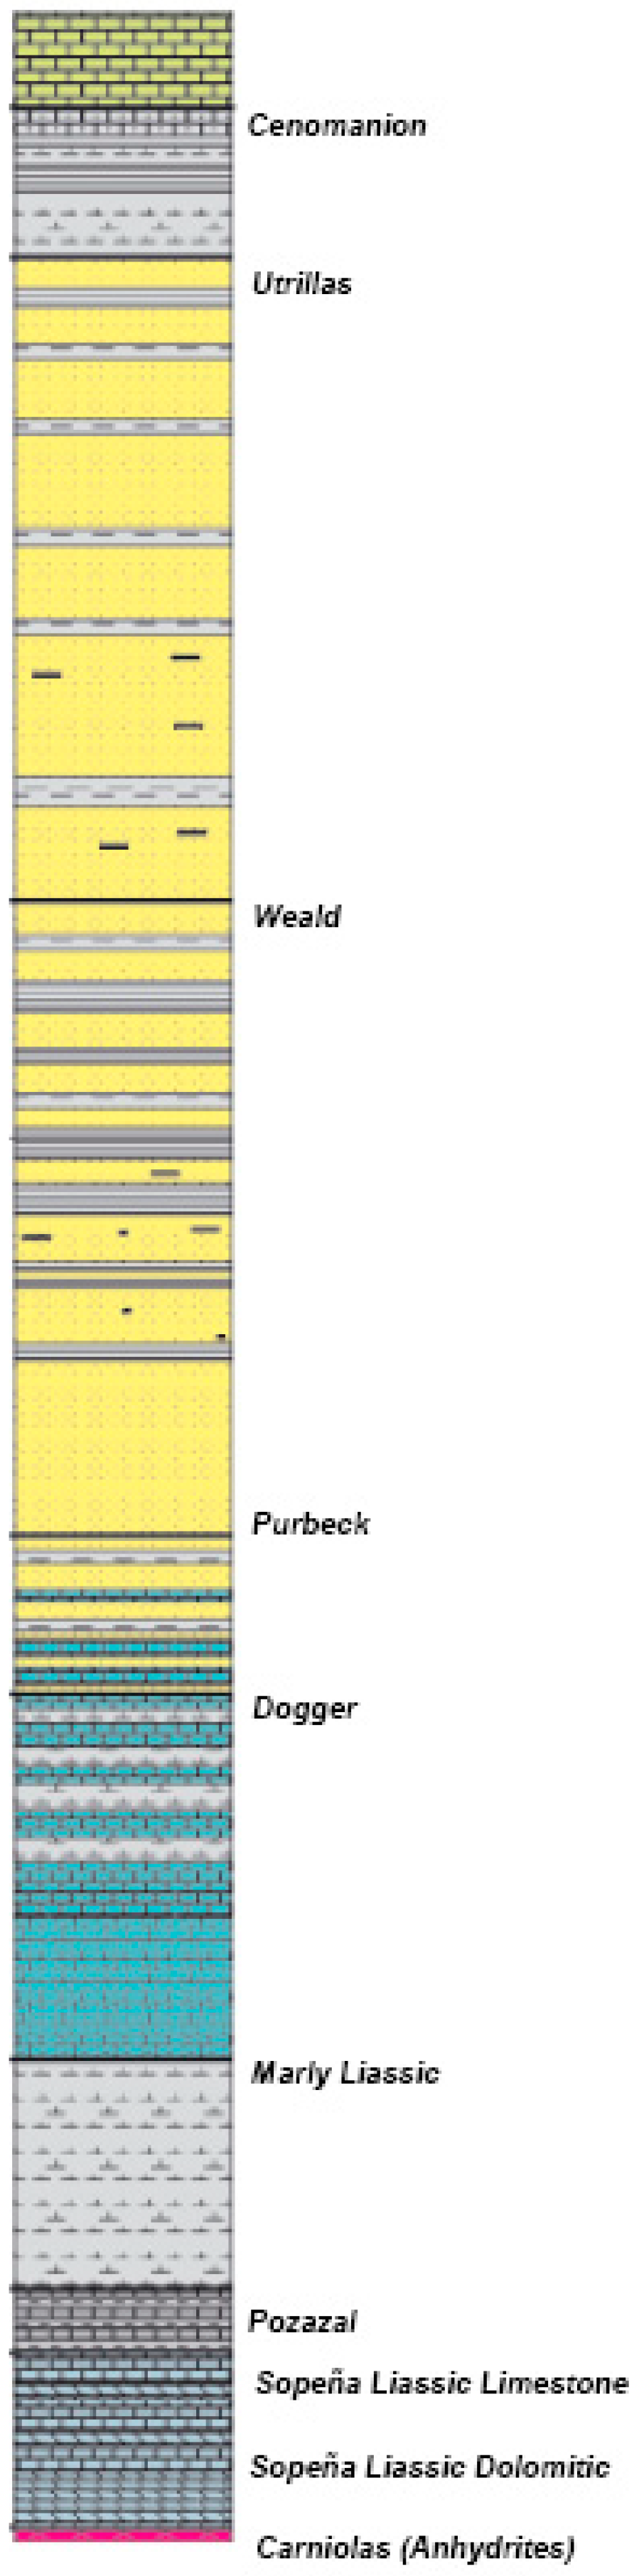
Hontomín represents a structural dome in which the pair seal-reservoir is located within Jurassic Formations (Marly Lias and Sopeña respectively). The overburden is formed by the Dogger, Purbeck and Weald Formations and the underlying seal is located at the Triassic Keuper, as Rubio et al. [
21] described in their study on gravimetric technique for the site characterization. The pair seal-reservoir is located at the depth of 900 m at the top of the dome and 1832 m in the flanks. The main seal is formed by the Marly Lias and Pozazal (160 m thick) Formations, which comprise of marls, shales, limestones and calcareous mudstones, where carbonates reach the average value of 50% of the total composition. The reservoir is the Sopeña Formation (120 m thick) comprised of limestones at its upper part and dolomites at the bottom, with a high level of fracturing in different geological blocks which does not affect the seal integrity, as detailed in the geological characterization study carried out by Kovács [
22].
Figure 1 shows the lithological column of Hontomín site.
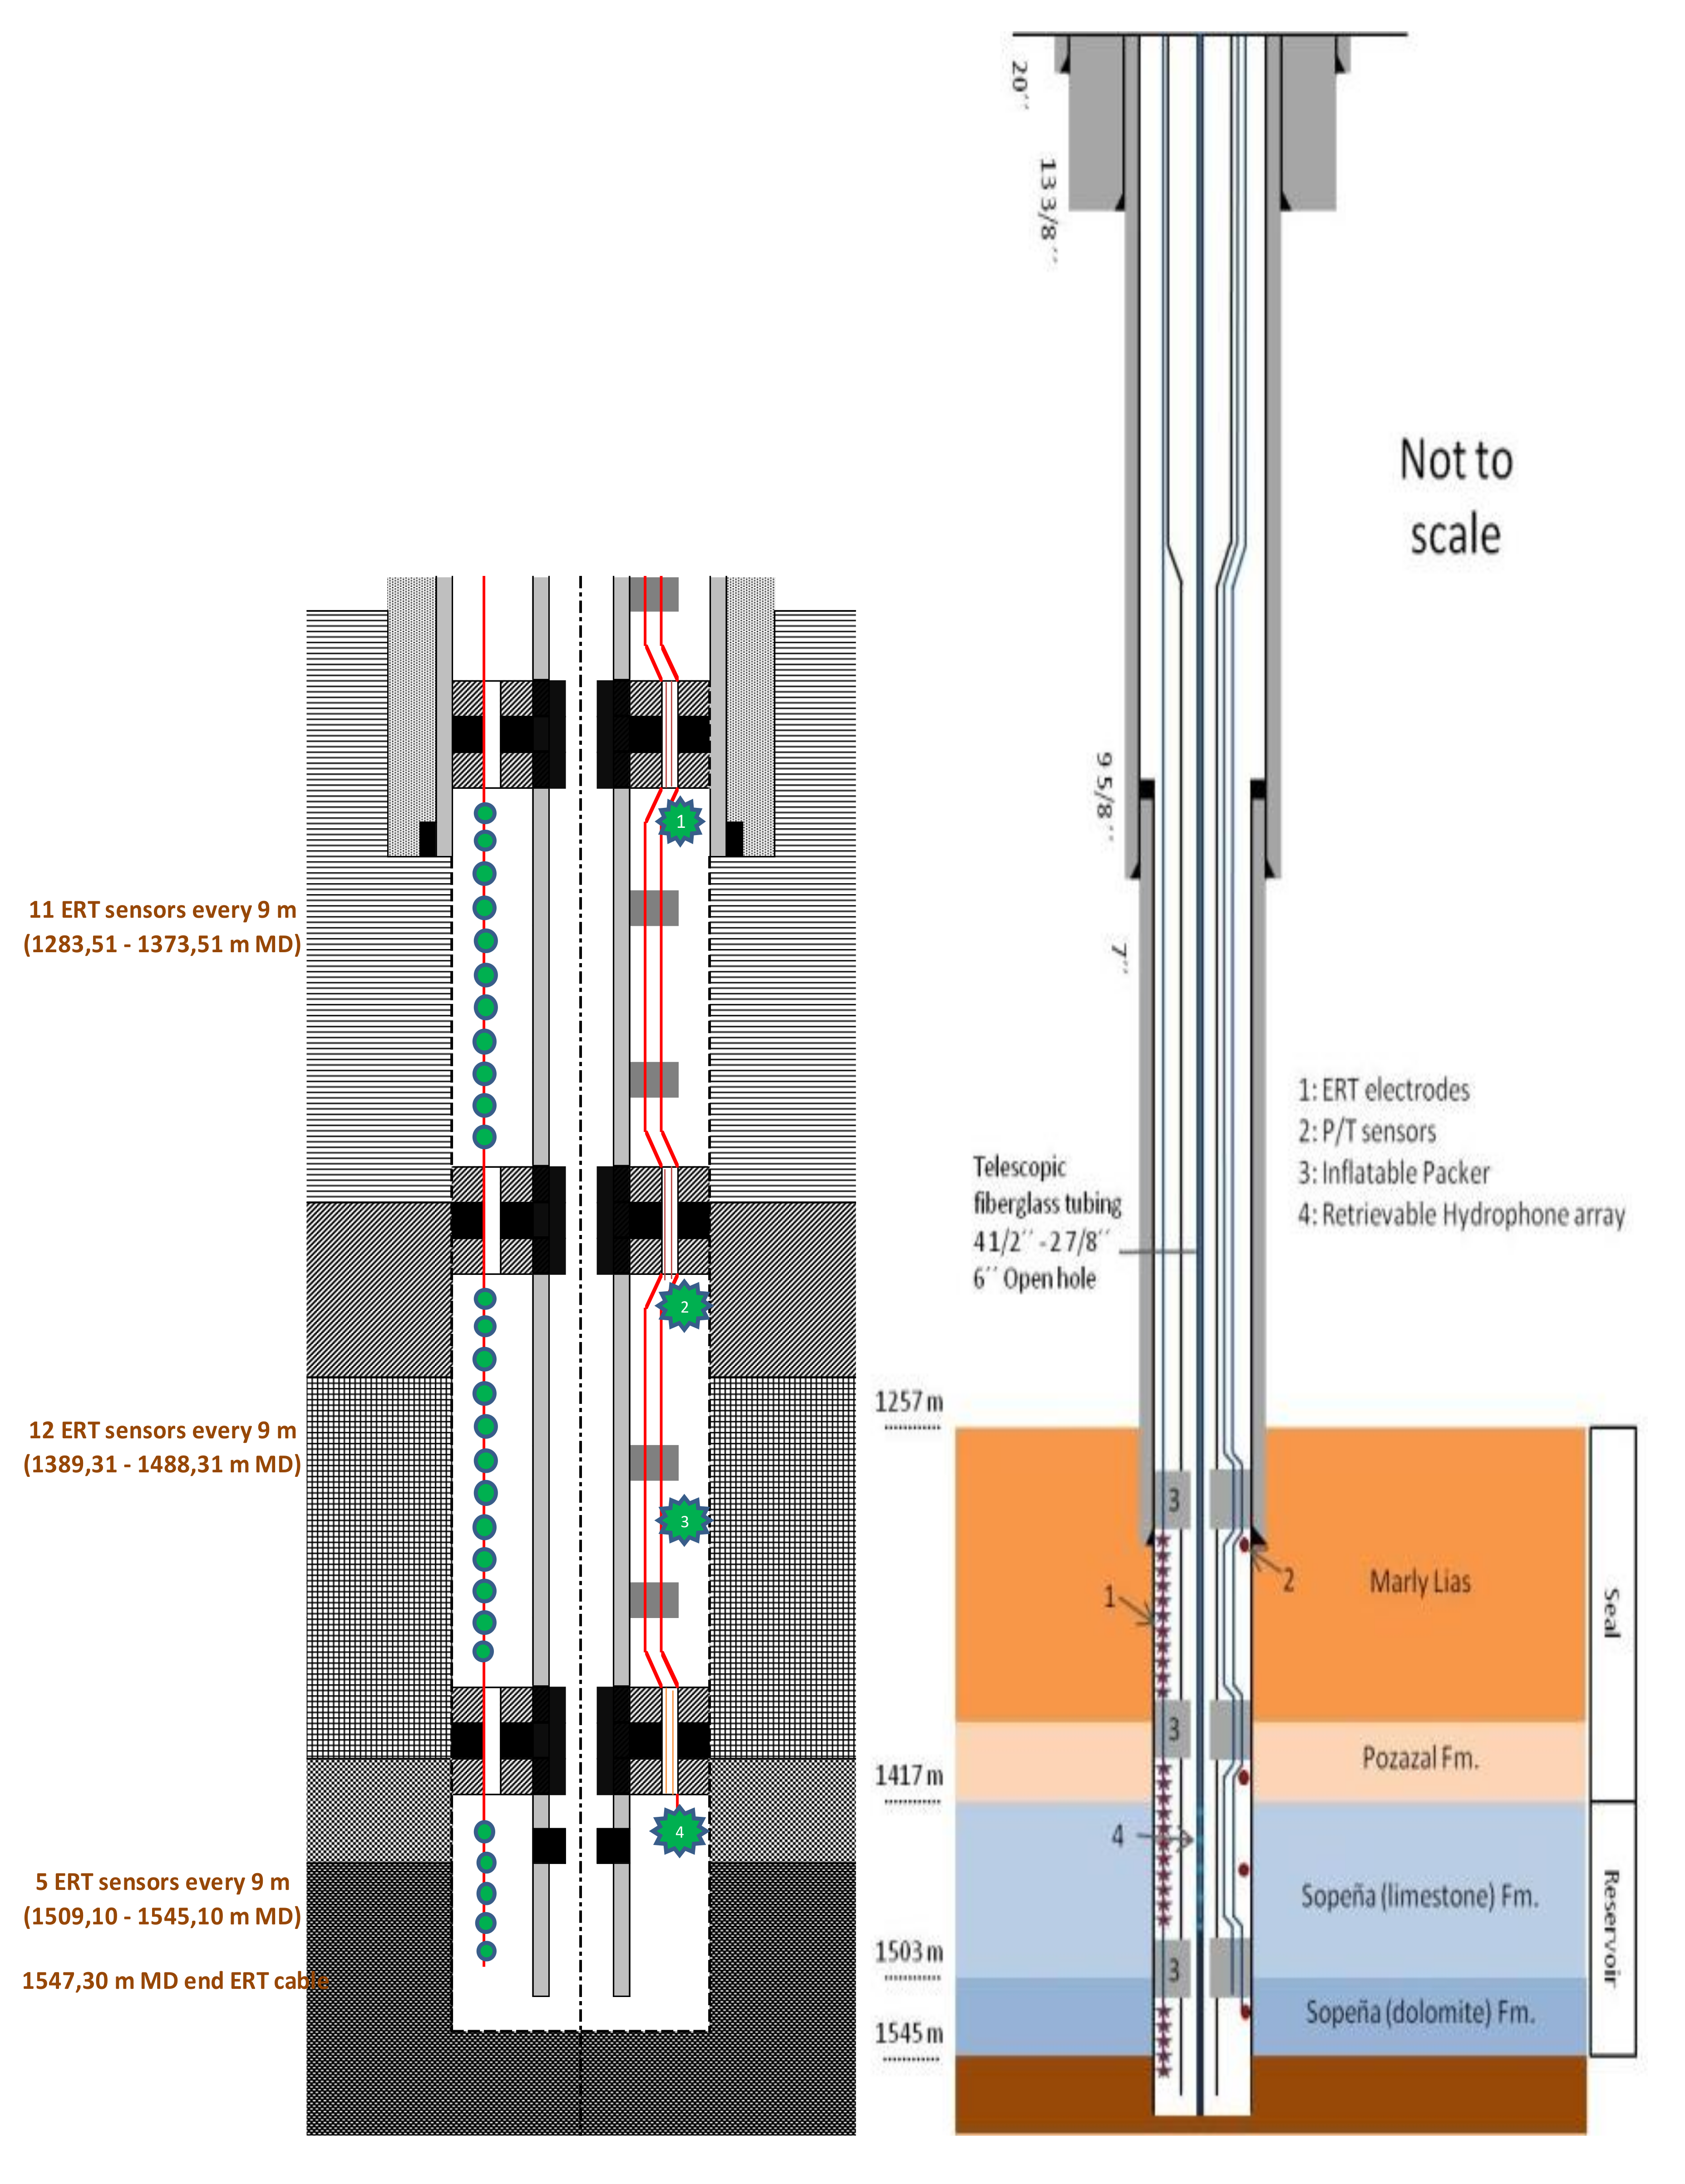
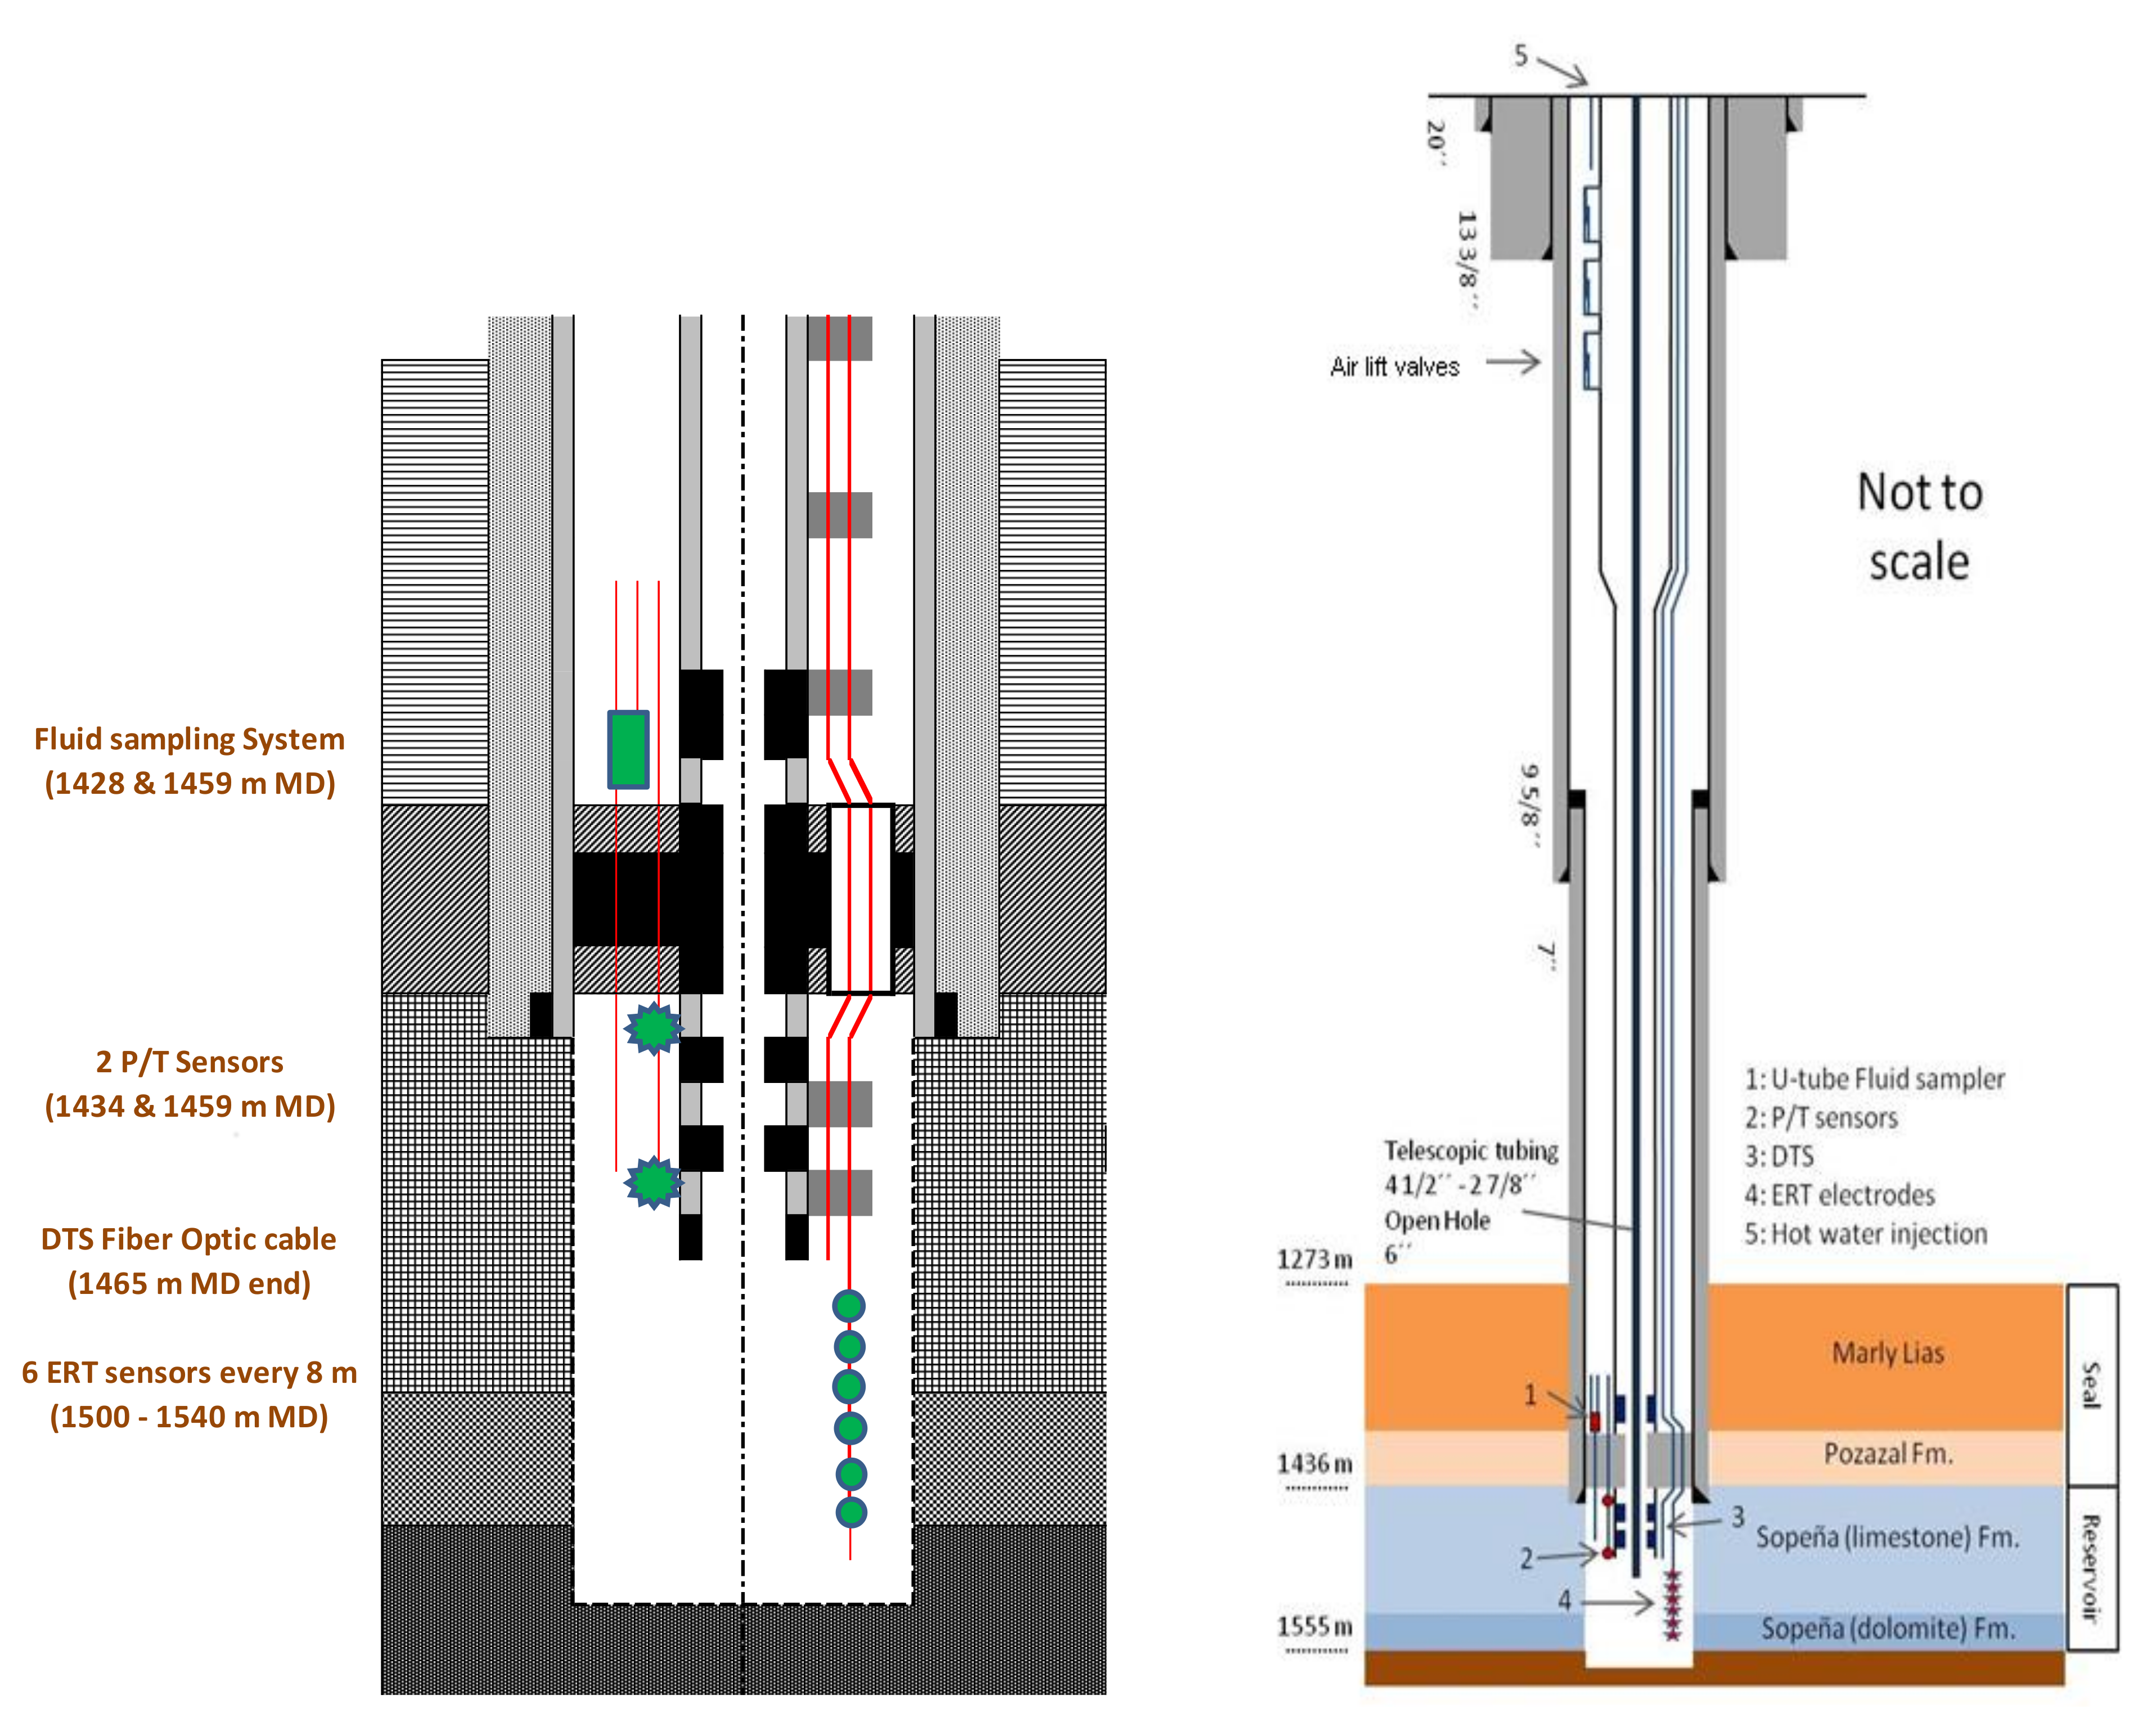
Two wells were drilled during the site construction reaching a depth of 1600 m, one for injection (HI) and other for observation (HA), as described in the study on the short-term effects of impurities in the CO
2 stream injected into fractured carbonates conducted by de Dios et al. [
23]. The HI well is equipped with super duplex tubing anchored to the liner by a hydraulic packer (1433 m MD), with two pressure/temperature sensors (P/T) below, both Distributed Temperature Sensing (DTS) and Distributed Acoustic Sensing (DAS) systems along the tubing, with six electrodes for electric resistivity tomography (ERT) and one deep-water sampling (U tube) installed in the bottom hole. The HA well is equipped with a fiberglass tubing anchored to the liner with three inflatable packers (1275 m, 1379 m and 1497 m MD) which distribute the open hole in intervals with different permeability, with 4 pressure/temperature (P/T) sensors and 28 ERT electrodes installed in the seal and reservoir. Both well schemes are shown in
Figure 2.
3. Innovative CO2 Injection
Aiming at better knowledge on the behavior of the Hontomín reservoir, it was planned to inject up to 10,000 metric tons of CO
2 during the period 2016–2020 on site within the ENOS project to demonstrate safe and environmentally sound storage for later industrial deployment. Therefore, the design of the CO
2 injection conducted in the project must be based on the criteria of efficiency and safety. Gale et al. [
24] concluded in their study about “The potential for geological storage of CO
2” that operating procedures must assure efficient energy consumption, maximizing the reservoir capacity and preserving the seal integrity.
As mentioned above, the CO2 injection in fractured carbonate reservoirs with low matrix permeability shows specific features that are different from injection in other porous mediums. As CO2 migration is dominated by the fracture network, parameters such as the evolution of flow rate, bottom hole pressure and temperature during the injection, and their influence in the seal integrity and reservoir behavior must be taken into account to properly design the injection. Furthermore, the periods of time for pressure recovery during the fall-off phase must be determined as they give valuable information about the hydrodynamic stability of the reservoir. On the other hand, the monitoring of the CO2 temperature evolution along the well tubing determines the fluid density at the bottom hole as an indicator of the operation efficiency.
Most of the existing experiences worldwide were based on the continuous flow rate of the CO
2 injection, as the study case in which Nordbotten et al. [
25] chose to develop an analytical solution to determine the CO
2 plume evolution in deep saline aquifers. Taking into account that unexpected effects may occur in future operations at the industrial scale in these types of reservoirs, such as high-pressure values that put the seal integrity at risk and/or low injectivity that conditions the operating process, not-continuous injection strategies must be tested at the field scale. Accordingly, the first injections conducted at Hontomín within ENOS were developed in a discontinuous process, injecting brine in some tests and CO
2 in others during periods of eight, twenty-four and forty-eight hours.
The use of brine and CO2 seeks to compare the results achieved with each fluid, with different properties such as density and viscosity. Before injecting CO2, some tests were conducted using brine in order to refine the design and performance of the subsequent CO2 injections.
High pressure is necessary to inject CO
2 in Hontomín, as de Dios et al. [
11] showed in the study on hydraulic characterization conducted on site, with longer pressure recovery periods than in the case of the medium with hydraulic transmissivity dominated by the matrix porosity. In this scenario, an unexpected reservoir behavior could take place during the injections planned in ENOS, as mentioned above, conditioned by the cumulative amount of CO
2 injected and the corresponding bottom hole pressure evolution. Therefore, the analysis of
flow rate and
BHP evolution plays a key role to predict anomalies that condition the safety and efficiency of the process.
3.1. Type of Tests
To address these goals, two types of tests were conducted using a CO
2 injection procedure with the following steps (Spanish Patent ES201500151): (1) well pressurization with brine, (2) CO
2 temperature conditioning, (3) CO
2 injection and (4) cleaning the tubing with brine, established by de Dios et al. [
11] in their study about Hontomín characterization. The mentioned tests are the injections performed in the pressure control mode and in the flow rate control mode.
For the injections monitored by pressure, the control parameter corresponds to the well-head pressure (WHP), which means that while WHP remains constant during the injection, the flow rate varies along the testing period. For CO2 injections in this type of tests, the WHP set-point is always equal or higher than 75 bar in order to assure the liquid phase injected on site, taking into account that the temperature at the well-head (WHT) is usually set in the range of 10–30 °C. On the other hand, for the tests where the flow rate is the control parameter, the set-point is set in the range of 1–2 kg/s. In these cases, the flow rate remains constant while WHP and BHP vary along the testing period.
The Hontomín operator has established a safe
BHP value of 180 bar to avoid the hydraulic fracture of the seal.
Table 1 summaries the control parameters, variables and set-points for each type of test.
As mentioned above, the injection tests are being analyzed from the hydraulic characterization phase with a compositional dual media model, which accounts for both the temperature effects and multiphase flow hysteresis to effectively simulate the alternating brine and CO
2 injection tests conducted on site, developed by Le Gallo et al. [
19].
3.2. Test Conducted in the Flow Rate Control Mode
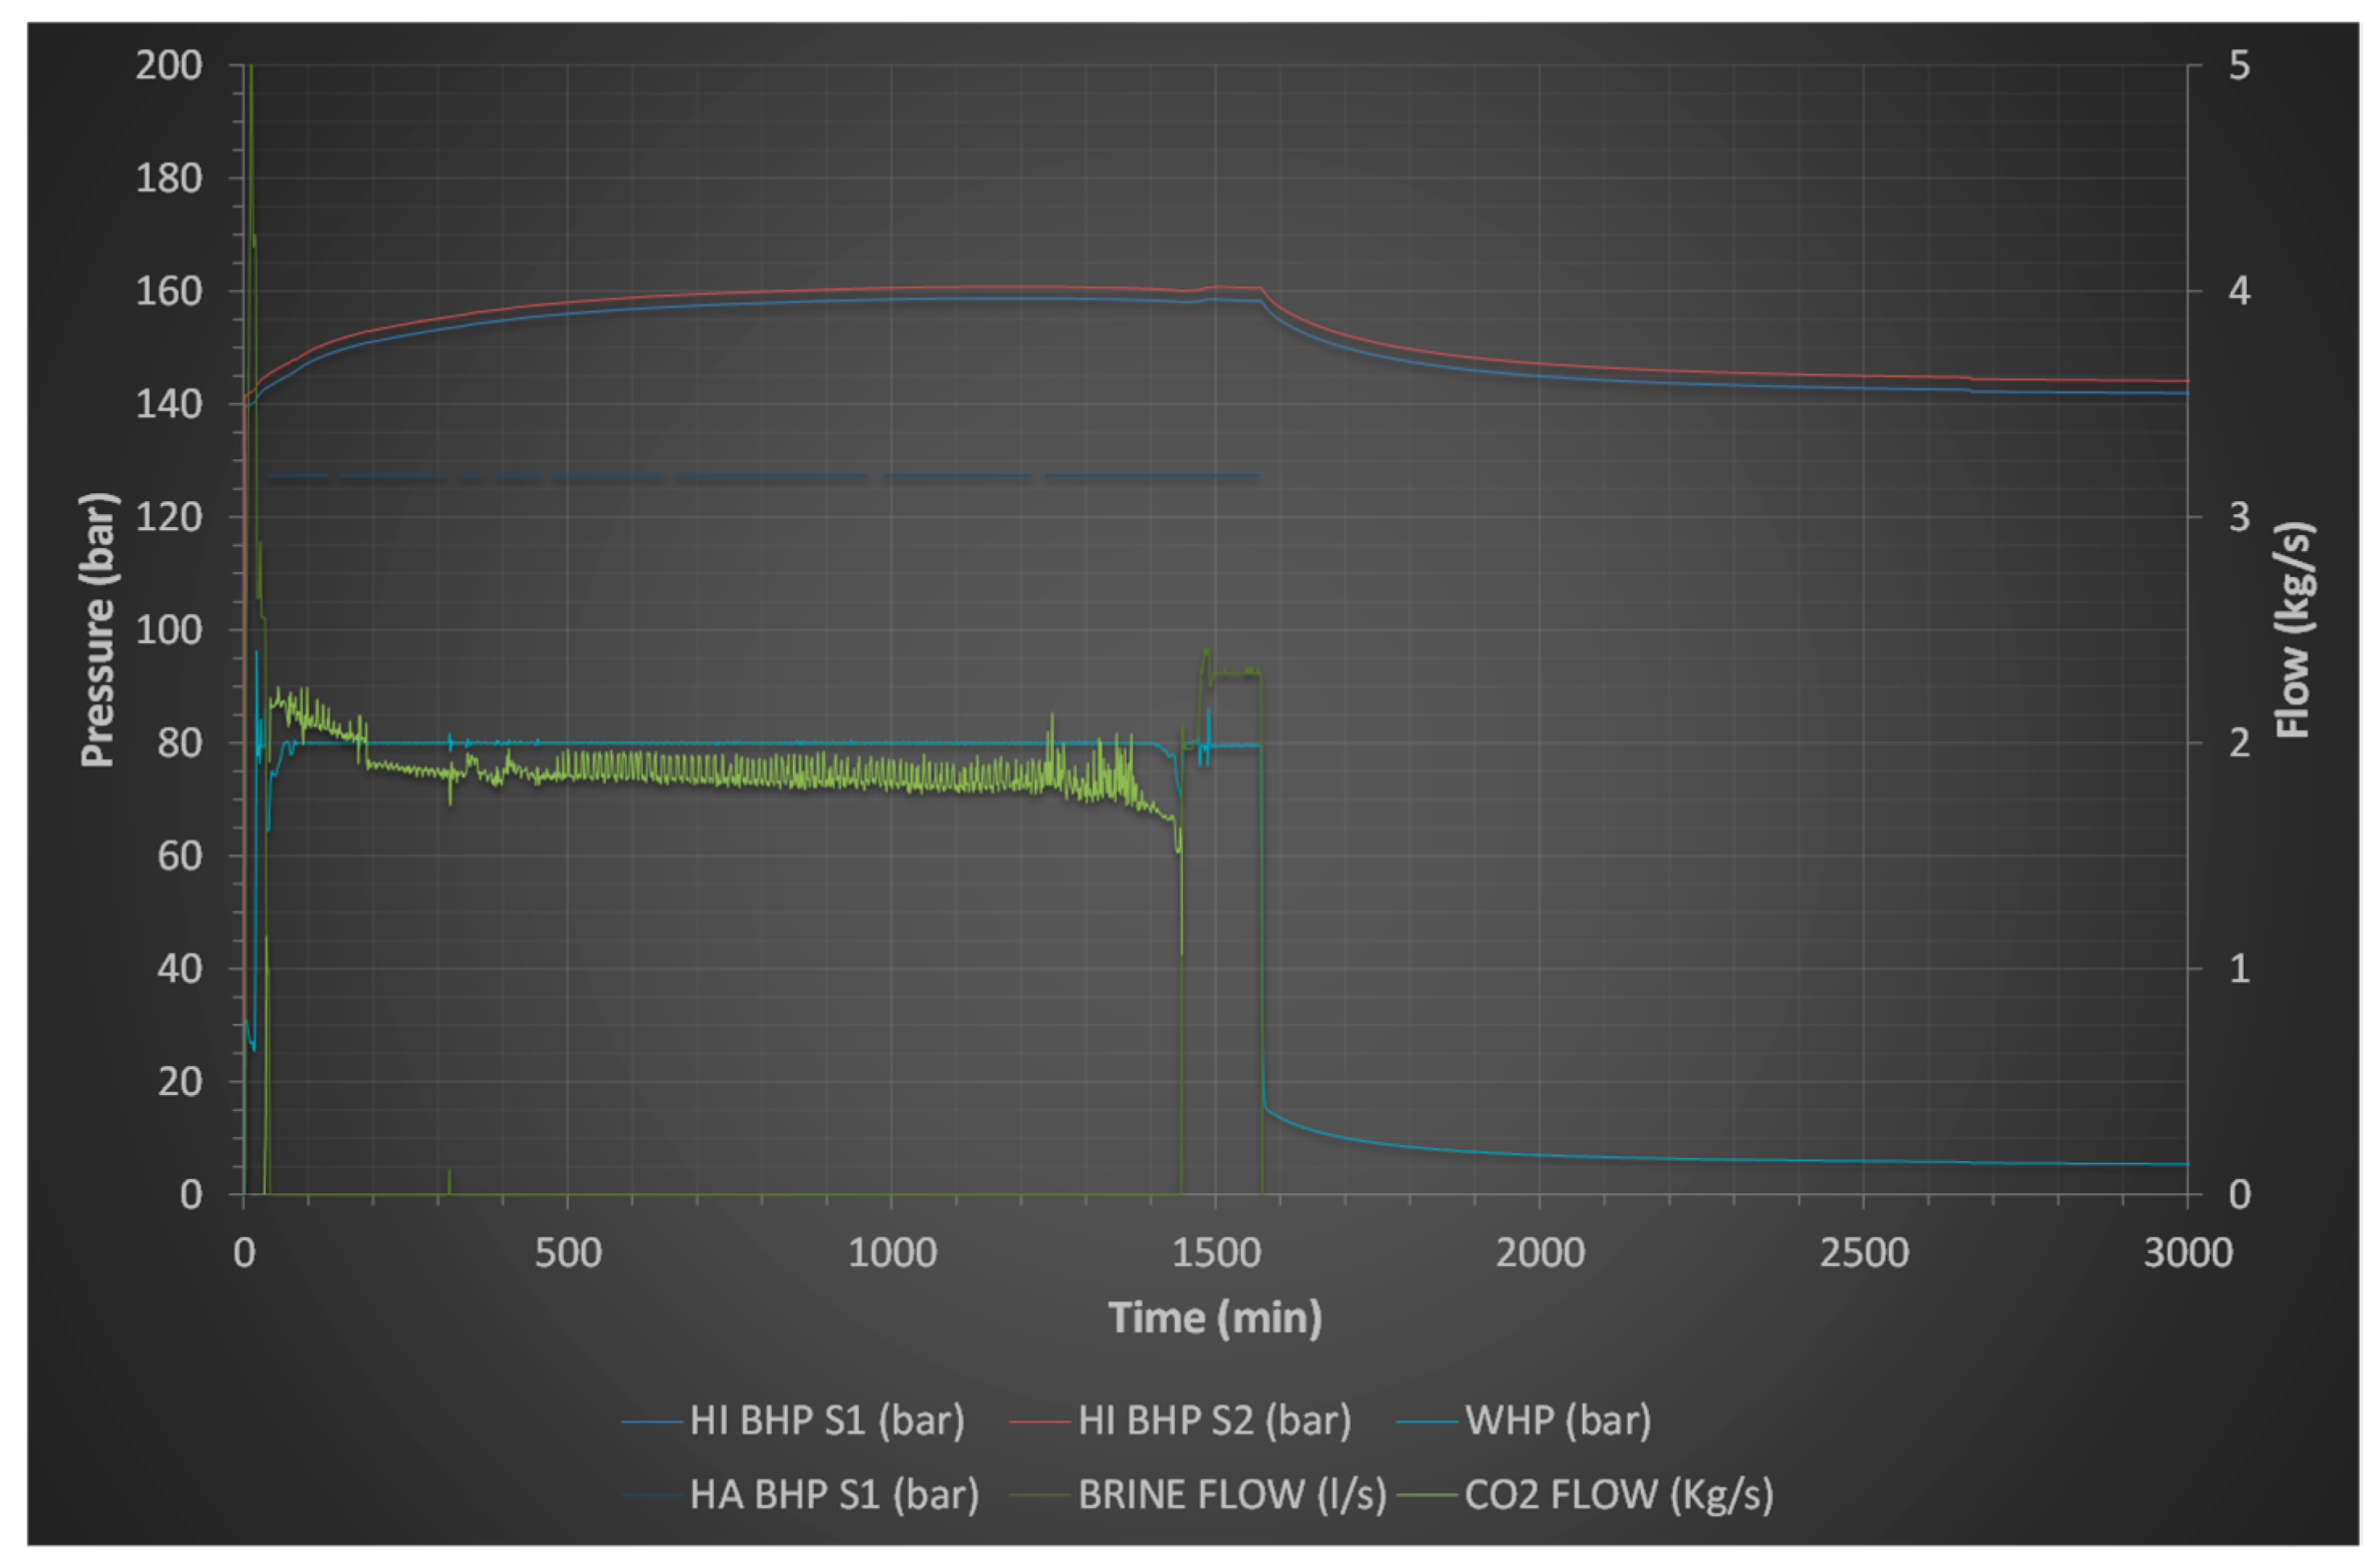
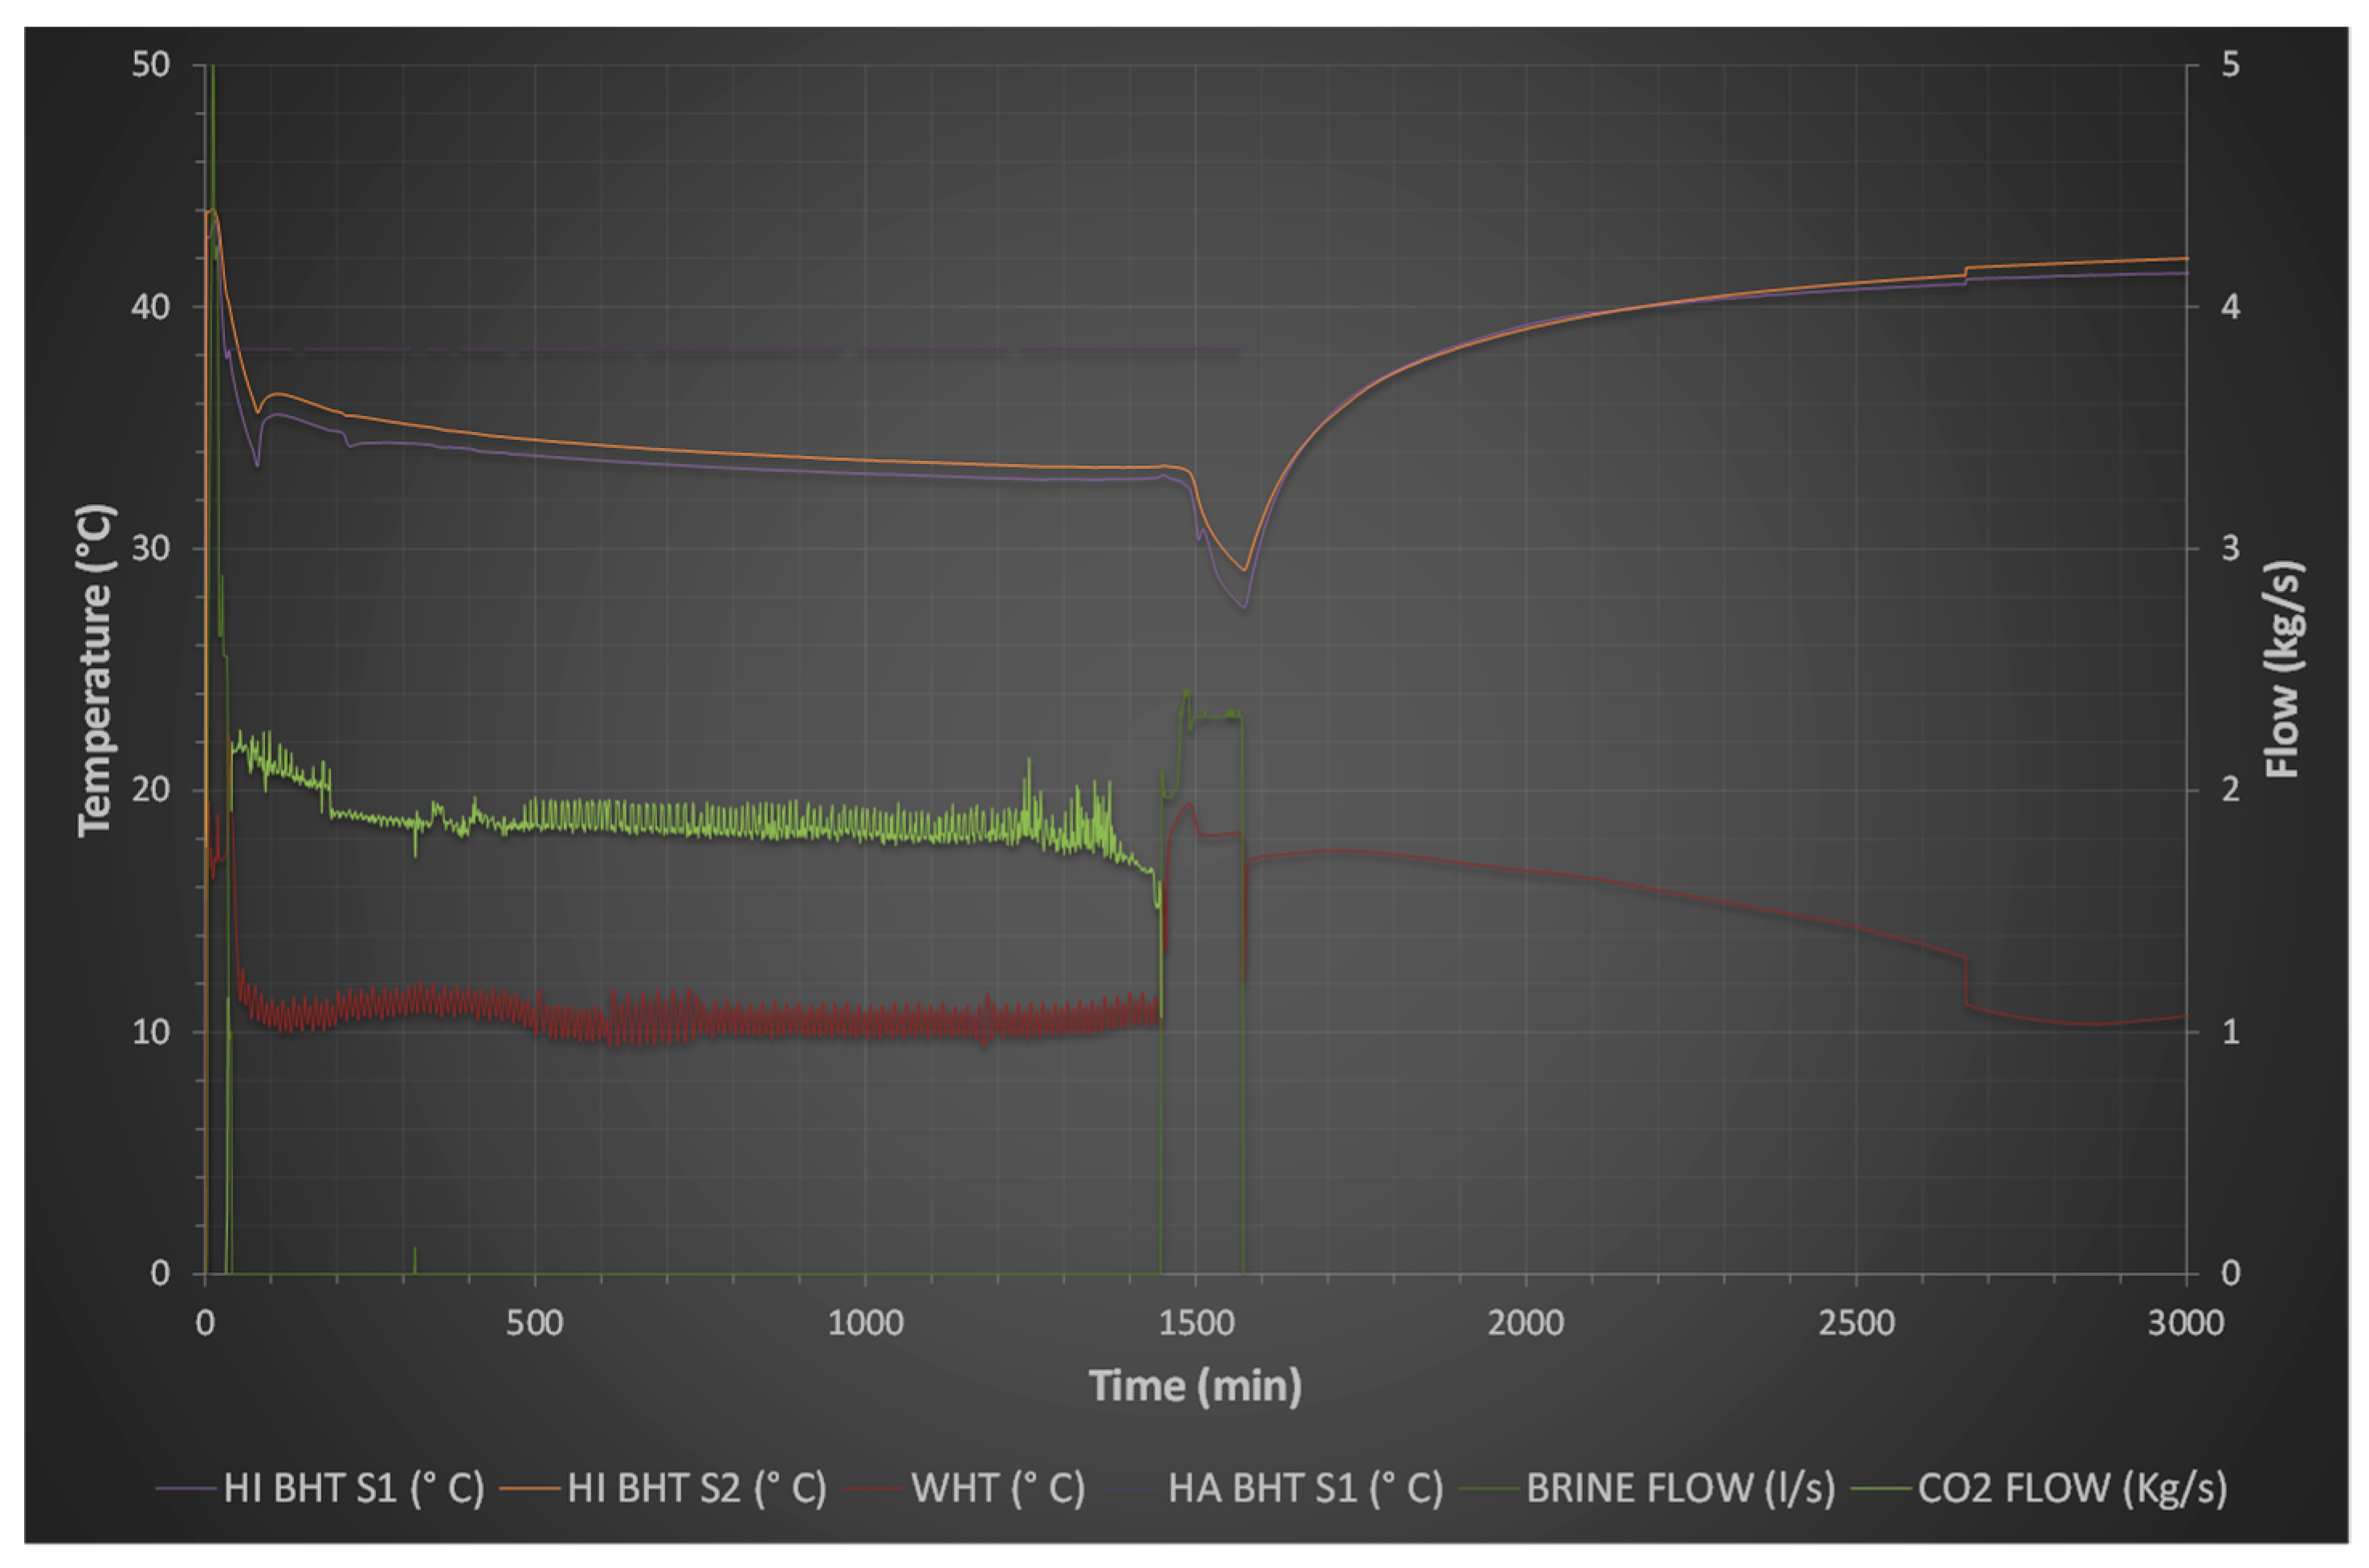
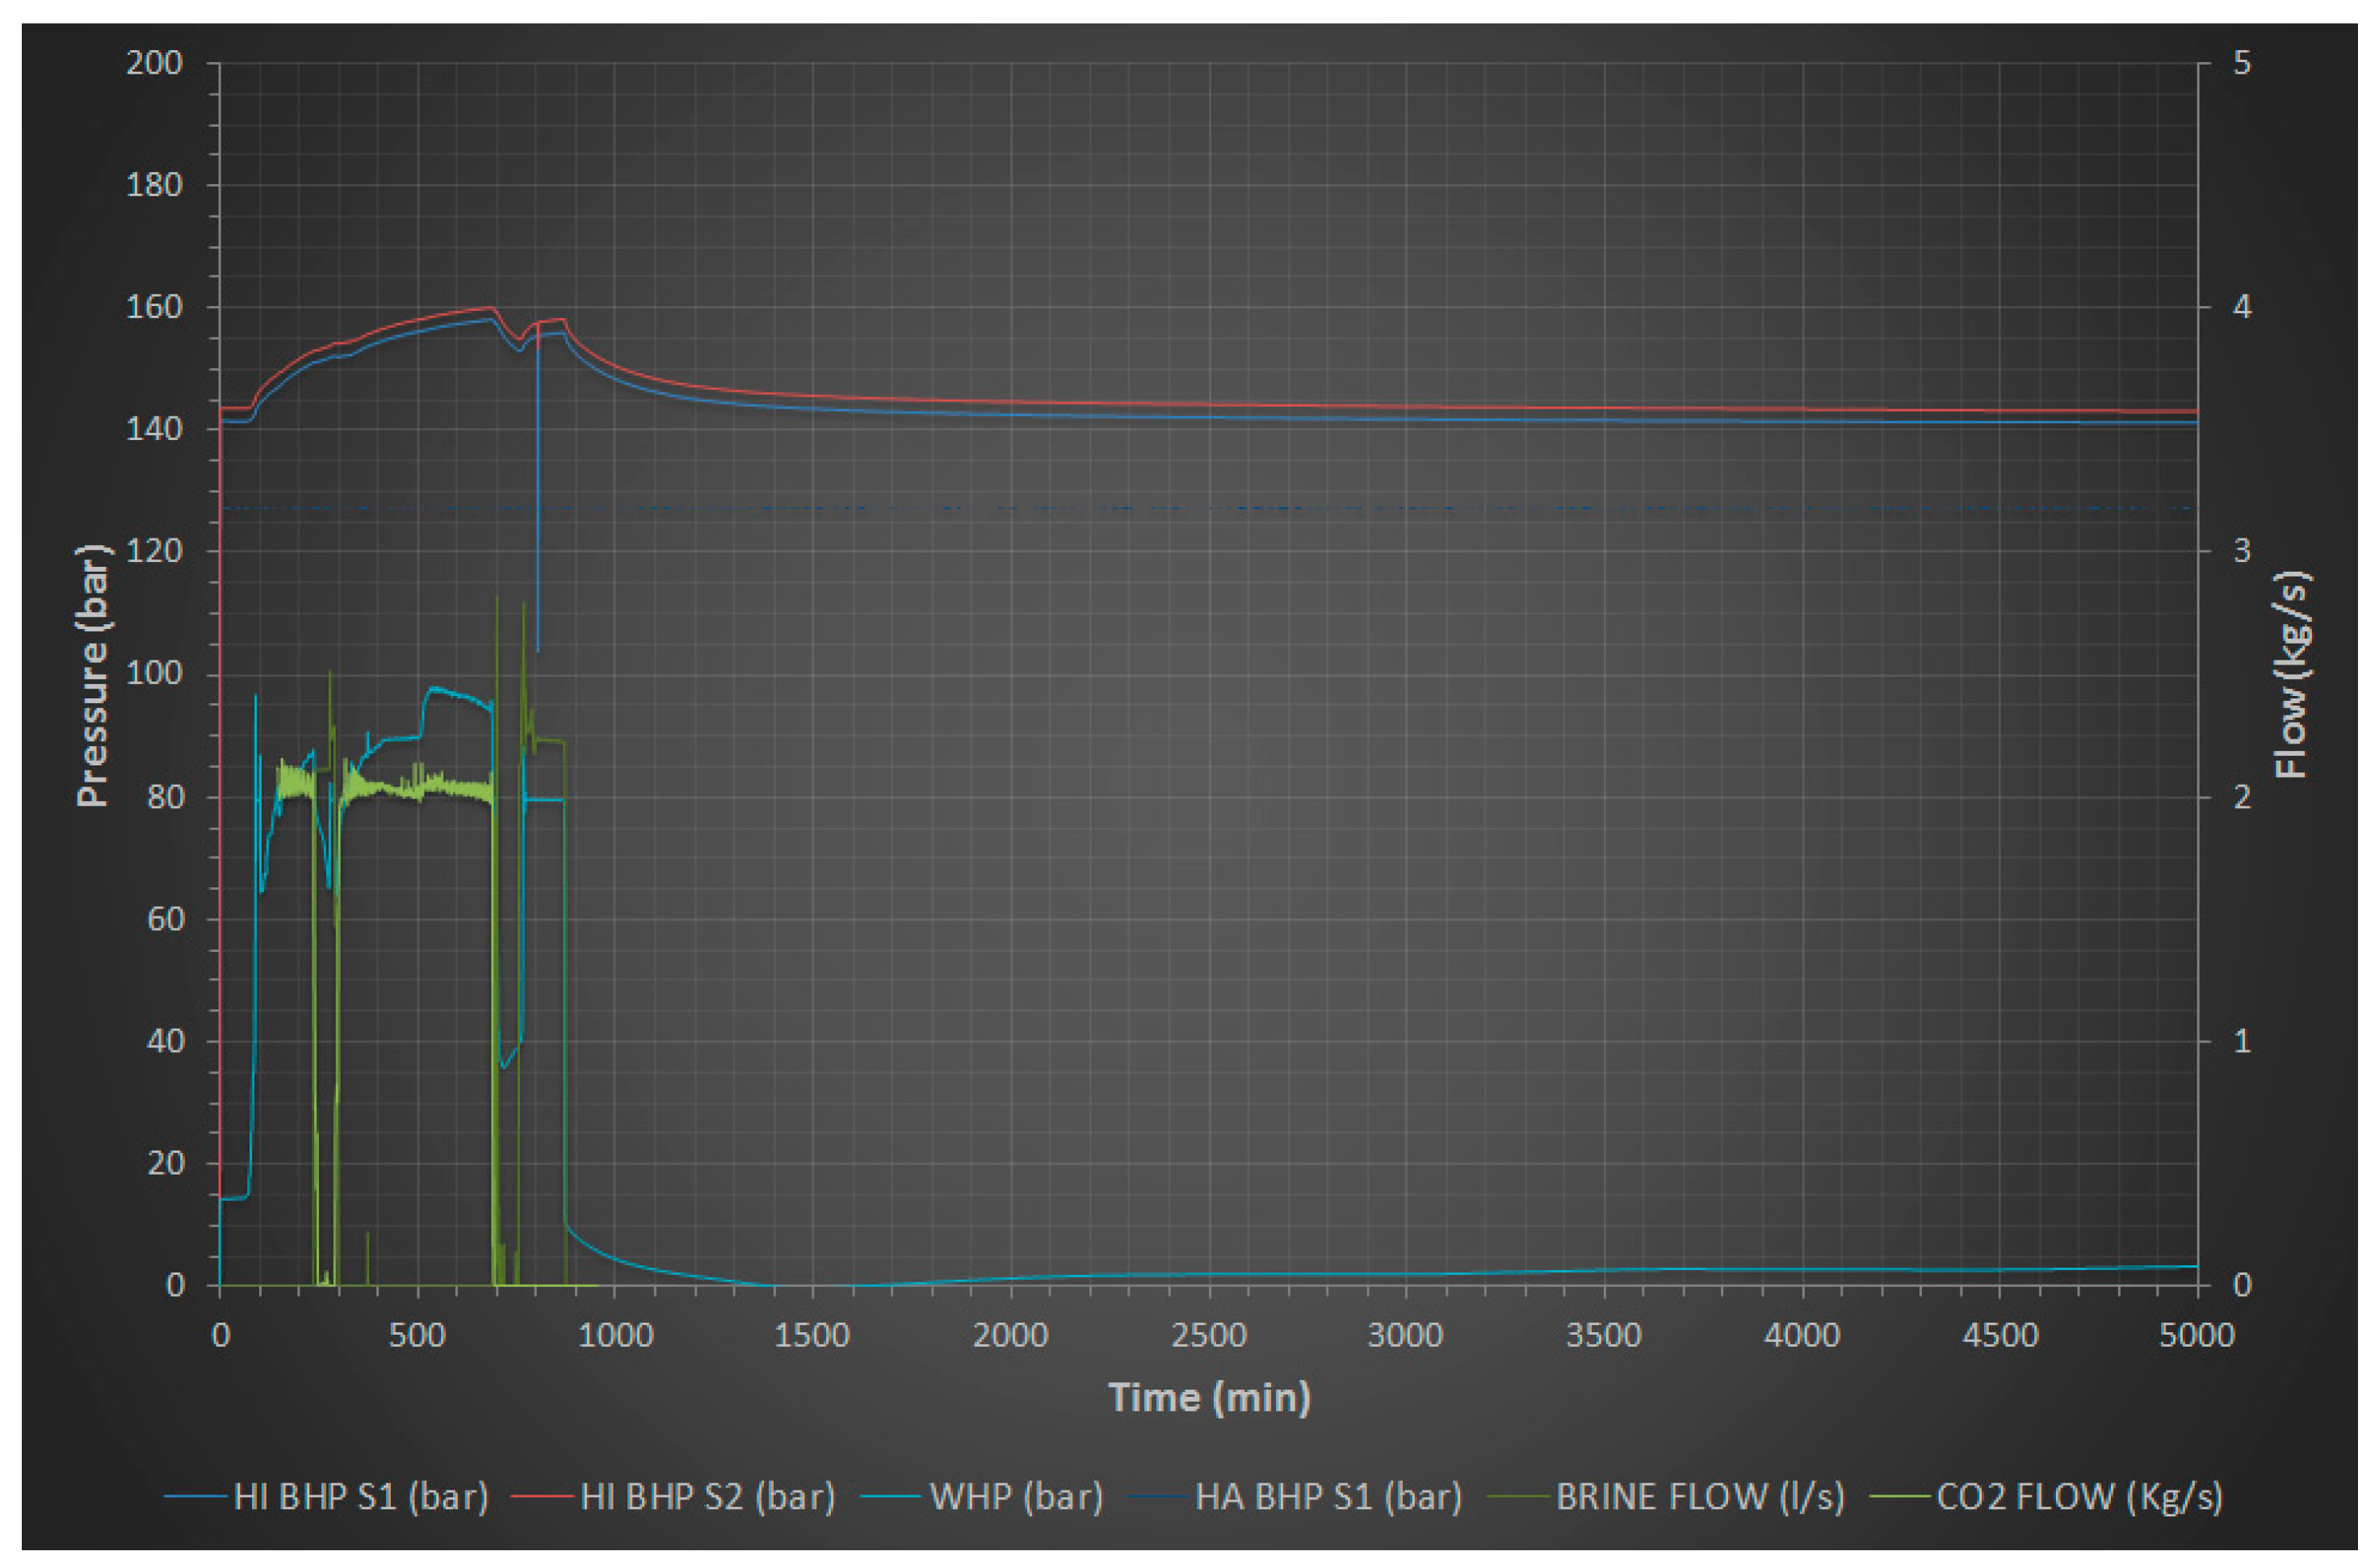
Figure 3 shows the evolution of the operating parameters of the CO
2 injection conducted during the eight hours in the flow rate control mode using a set-point of 2 kg/s.
BHP was recorded by two sensors located in the Sopeña Limestone Formation within the injection well, as shown in the top of
Figure 2. These parameters appear in the graphic as
HI BHP S1 and
HI BHP S2, S1 being the sensor located in the upper part of the open hole and S2 being the one located below (see
Figure 2). The
BHP value was recorded by a sensor located in the Marly Lias Formation (seal) within the observation well, as shown in the middle of
Figure 2 and it appears as
HA BHP S1 in the graphic. The rest of the parameters are
WHP and the
flow rate of brine and CO
2.
The brine
flow rate data correspond to the pre-injection phase of CO
2 for pressurizing the well to 75 bar later for a short halfway period (at 250 min from the test startup) due to a problem in the pumps taking place, which corresponds with the drop of the CO
2 flow rate and WHP while the brine injection was needed to hold the well in pressure and, finally, to clean up the tubing. Initial and final values of the referred parameters are shown in
Table 2. The
BHP in the HA well remained constant along the test what proves that there was no hydraulic transmissivity through the seal.
Despite being a short injection with an operating period of eight hours, as CO2 permeated and pushed the reservoir water through the fractures, an incremental of the well-head pressure close to 30% was necessary to hold the flow rate of 2 kg/s along the test. Therefore, future injections must prove whether the pressure evolution follows the trend showed in the short-term or not. For this, new tests must be conducted during long periods in similar conditions, taking into account the main goal is to assess if the BHP threshold (180 bar) that assures the seal integrity is reached and to determine the cumulative amount of CO2 when it occurs.
The test was the final of several eight-hour injections, with recovery periods during the fall-off phase in the range of 48–60 h (for pressure recovery, in the range of 95–100%). Upcoming tests will analyze how BHP recovery will be regarding the final pressure value reached and the cumulative amount of CO2 injected in the reservoir.
Finally, the
BHP incremental at the end of the test is not proportional to the
WHP increase. This is because of a drop pressure valve (choke) was installed in the HI well tubing to limit the pressure at the bottom hole during the injection and thus preserve the integrity of the pair seal-reservoir, as de Dios et al. [
11] analyzed in the Hontomín hydraulic characterization study.
3.3. Test Conducted in the Pressure Control Mode
Figure 4 shows the evolution of the operating parameters of the 24-h CO
2 injection in the pressure control mode, using a set-point of 80 bar at the well-head.
The initial and final values of the operating parameters for the injection are shown in
Table 3.
According to these data, the reservoir behavior was different depending on each phase of the injection. Thus, initially, a flow rate of 2.2 kg/s injected into the reservoir was needed to hold the WHP value at 80 bar. As CO2 filled the fractures, this value decreased up to 1.7 kg/s at the end of the test, what supposed 23% less than the initial flow rate. As happened during the test case conducted in flow rate control mode, it is necessary to conduct injections during long periods in similar conditions for checking whether the flow rate evolution follows the trend showed in the short-term or not, and if the BHP safety threshold (180 bar) is reached and when it occurs.
This test was the last one of several where 490 metric tons of CO2 were injected. A period of 15 days to recover 98% of the initial BHP value was necessary while, in similar tests conducted with brine, the recovery period was close to 10 days. This fact may be due to the fact that supercritical CO2 is a compressible fluid affected by the closure of fractures during the fall-off periods when the injection stops, which conditions the biphasic migration of CO2 and brine through the fracture network. On the other hand, as more CO2 is injected, the BHP increases and longer periods for pressure recovery are needed. New tests will provide additional information about how the pressure recovery periods will be for longer injections and how higher cumulative amounts of CO2 are stored on site.
3.4. Temperature Monitoring
The thermodynamic parameters along the injection well and the open-hole determine the injected CO
2 phase which conditions the operation efficiency and gives valuable information related to the thermal effects into the reservoir.
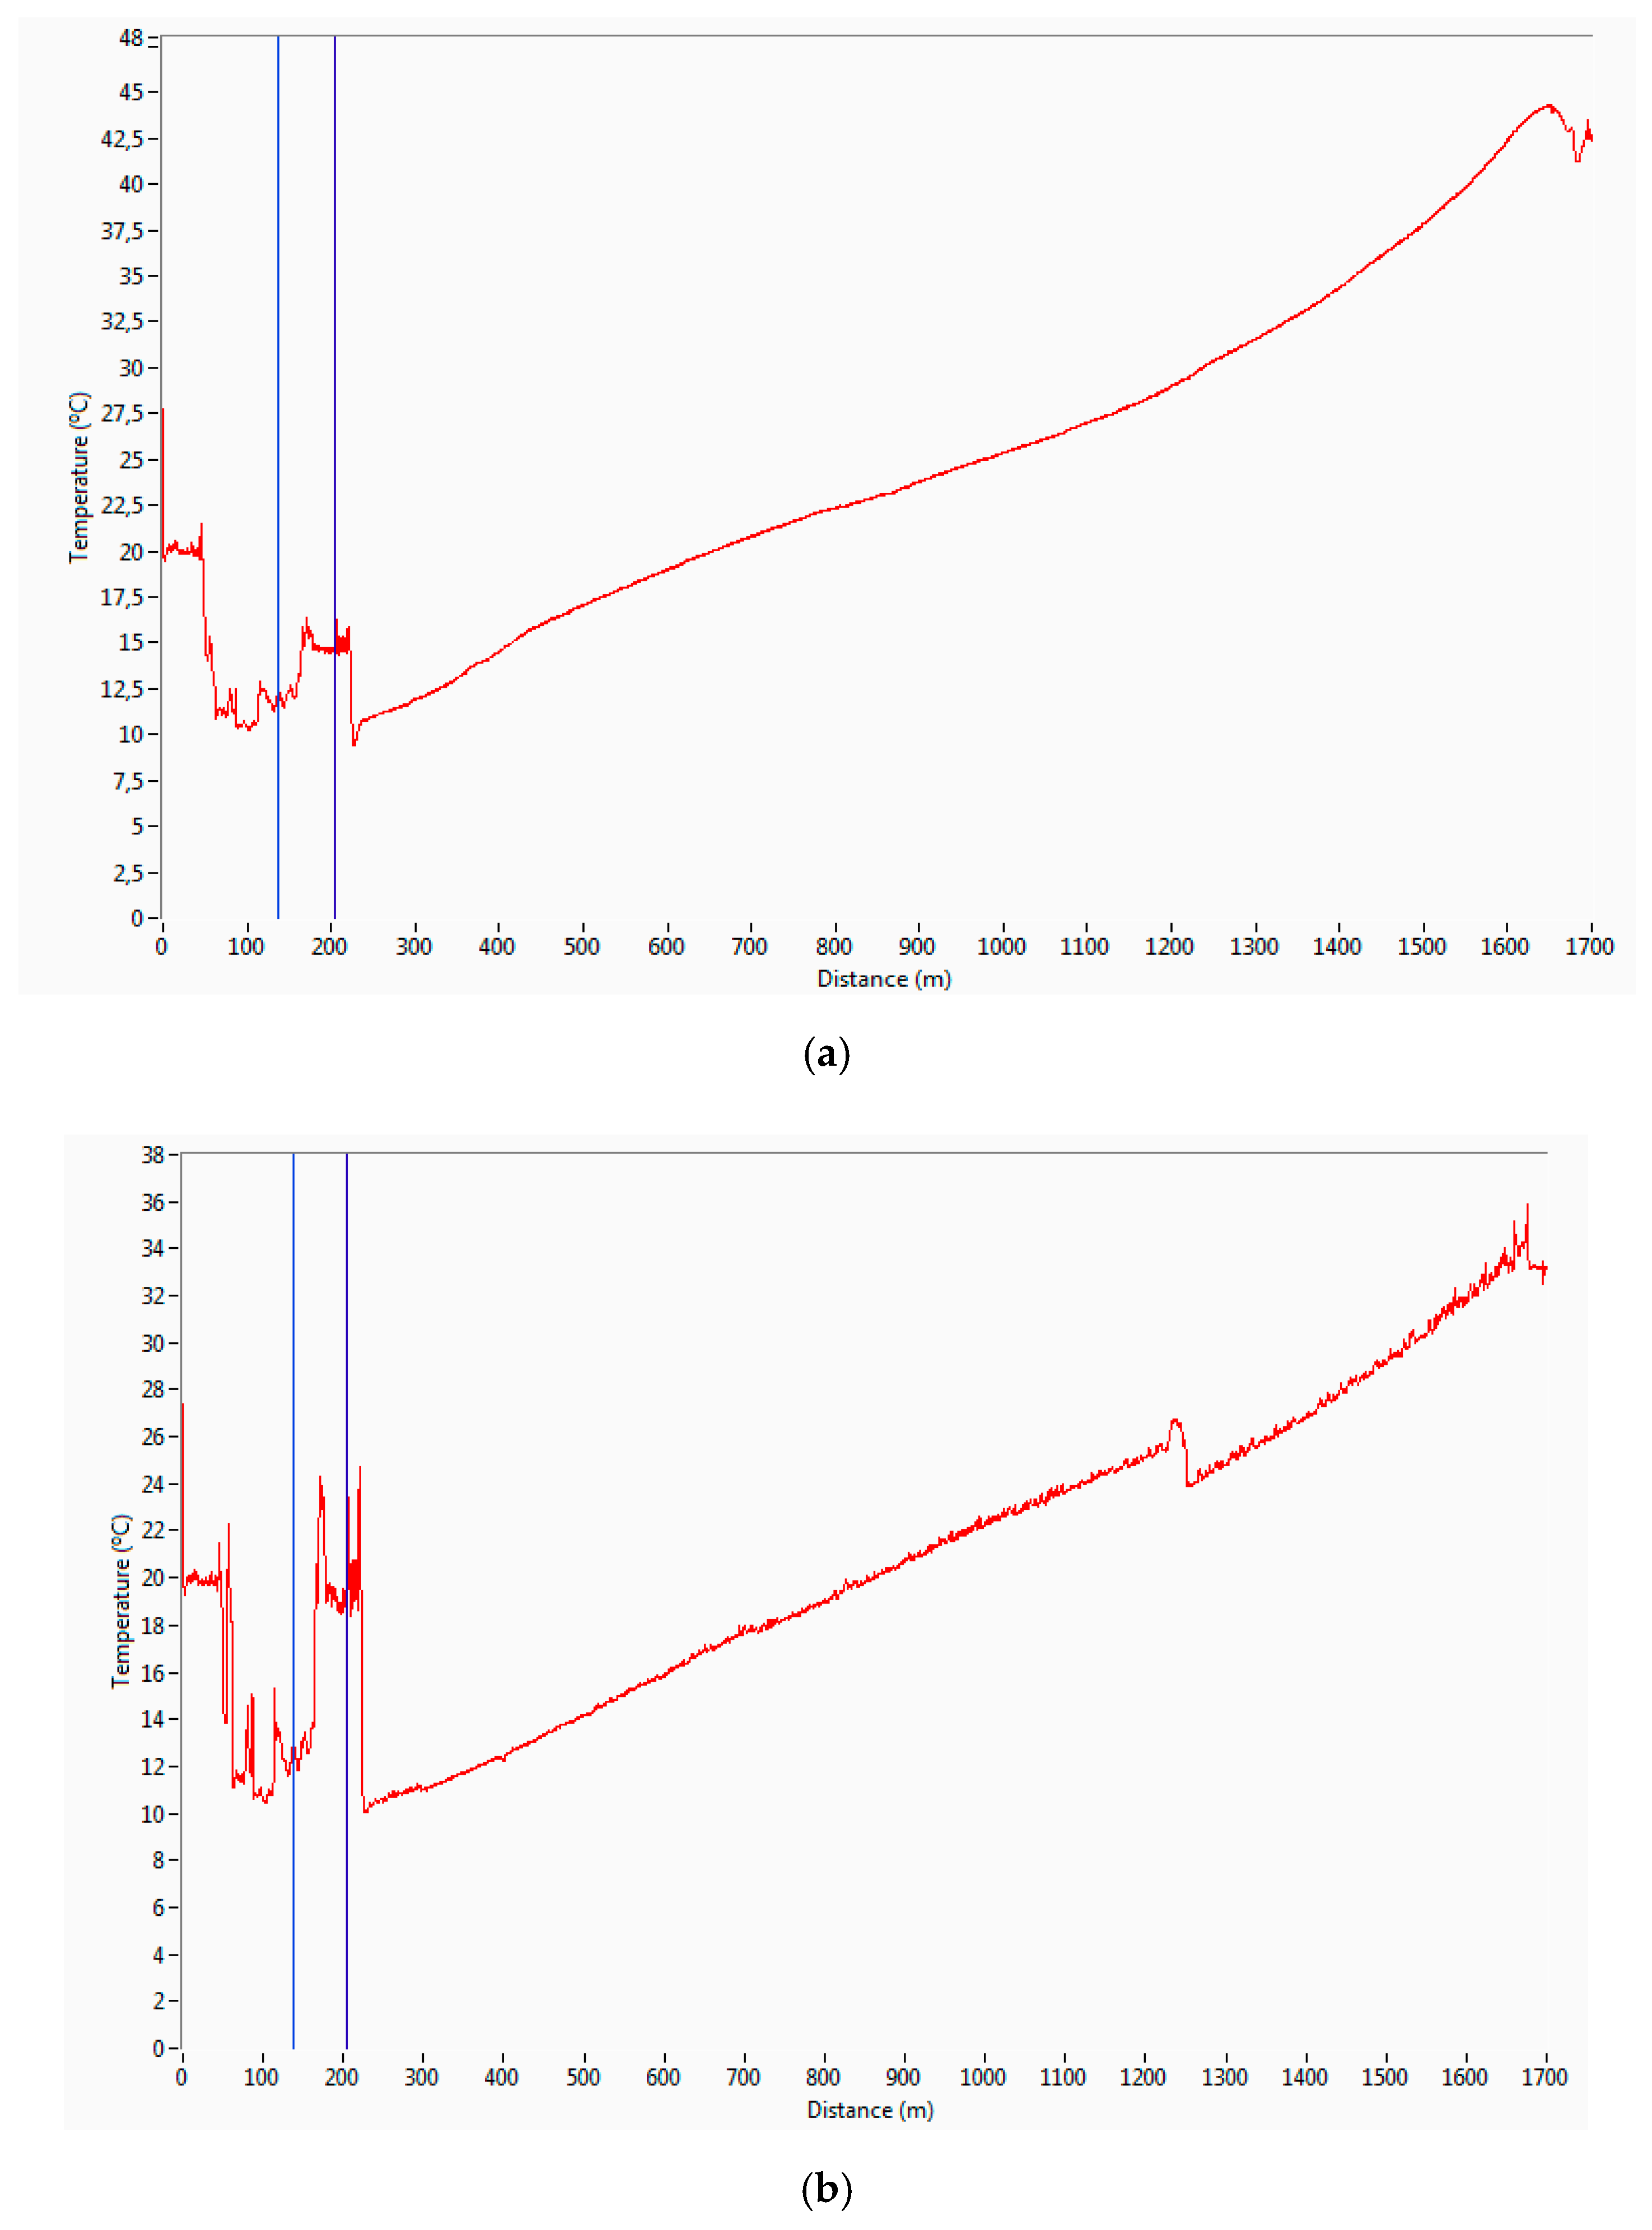
Figure 5a,b and
Figure 6 show the
thermal profile along the HI tubing and
BHT evolution, respectively, during the 24-h injection test conducted in the pressure control mode. The data were recorded by a Distributed Temperature Sensing system (DTS) anchored to the HI well tubing, as described in
Section 2 (see
Figure 2), whose characteristics and use were studied by Hilgersom et al. [
26] at the laboratory scale.
Figure 5a shows the temperature values along the HI well tubing prior to the CO
2 injection, and
Figure 5b shows the values recorded at the end of the test. The range of temperatures for the distance between 0 and 200 m belongs to the part of the DTS optic fiber buried close to the surface, which connects the control room with the HI well-head and, therefore, these data correspond to the environmental temperatures recorded on site, which must not be taken into account for the analysis. The temperature evolution in
Figure 5a reveals the homogeneous thermal gradient of the existing brine in the annular space between the tubing and the casing/liner, which may be quite similar to the geothermal gradient. The Hontomín reservoir is a “cold” formation that takes into account the fact that the BHT value is 44 °C prior to the CO
2 injection.
Figure 5b shows the temperature evolution along the tubing at 22 h from the start of the injection. The heating and subsequent cooling for the distance of 1200 m (1000 m MD depth in the HI well), correspond to the effects induced by the choke located in this position of the well tubing. Initially, the CO
2 heating was due to the friction between the fluid and the wall of the choke at the entrance and, finally, the cooling due to the Joule–Thomson effect produced by the CO
2 expansion at the exit.
A
BHP value of 160 bar (see
Figure 4) and temperature along the tubing (see
Figure 5b) confirm that the injection was performed with liquid CO
2, reaching a fluid
density at the bottom hole of 0.828 t/m
3 at the end of the test.
The thermal effect produced in the saline aquifer is shown in
Figure 6 in accordance with both the evolution of the temperature at the injection well-head and the bottom hole.
The gradual cooling of reservoir water was from 44 °C, that is, the
BHT initial value, to 33 °C, considering the well-head holds at an average temperature value of 10 °C during the CO
2 injection. As
Figure 6 shows, the relevant temperature decrease at the HI bottom hole occurred because of the brine injection, initially, to pressurize the well and, subsequently, to clean up the tubing when the CO
2 injection is finalized. The
BHT in the HA remained constant at the seal which proves its integrity.
4. Modeling of the CO2 Migration through Fractures
The injection tests were modeled with GEM™, a commercial compositional dual media model which accounts for both temperature effects and multiphase flow hysteresis, used by Nghiem et al. [
27] to simulate the modelling of the CO
2 storage in aquifers since liquid CO
2 and brine were alternately injected. Amongst other features, GEM™ is based upon the mass and energy balances for convective and diffusive multicomponent multiphase (oil, gas and brine) flow in porous media (see the findings gained by Nghiem et al. [
28] from the simulation of CO
2 storage in saline aquifers for details). A cubic Peng–Robinson Equation of State is used to model the fluid equilibrium as a function of pressure and temperature. The gas solubility in brine and the corresponding brine density changes are modeled by Henry’s law as detailed by Nghiem et al. [
29] in their article on the residual gas and solubility trapping of the CO
2 sequestration. The main characteristics of the dynamic model are summarized in
Table 4.
Based upon the initial geological model, a set of simulations developed by Le Gallo et al. [
19] were performed to identify the main parameters influencing the pressure responses during CO
2 and brine injection tests conducted at the hydraulic characterization phase, described by de Dios et al. [
11]. The initial geological model was first improved with better characterization of the vertical and lateral heterogeneities and served as the basis for the new simulations, in accordance with the description of the static modeling made by Le Gallo and de Dios [
30]. To reproduce the well pressure response of the model in the best way, a two-level grid refinement was implemented around the injection well, which refines the initial 50 m × 50 m reservoir grid to about 1.5 m × 1.5 m without changing the vertical layering (39 units) in the Sopeña formation [
30].
The geological model was further improved through advanced fracture modeling. The fracture network was first characterized by FracaFlow™, showing two main sets of fractures. A Discrete Fracture Network (DFN) was generated within FracaFlow™ around the injection well and matched to the interpretation of the injection tests, as described by Le Gallo and de Dios [
30]. The DFN was up-scaled into the reservoir grid, inducing an anisotropy of fracture permeability due to the orientation of the two sets of fractures.
In this approach, there are significant uncertainties regarding the various parameters of the fractures, such as the aperture and permeability which strongly influence the model response. Therefore, an advanced uncertainty workflow with CMOST™ was used to best tune the dynamic model response to the well pressure, temperature and flow rate conditions, as proposed by Yang et al. [
31] in their study on the modeling of uncertainty quantification. This approach solved the combinatorial optimization problem by using a hybrid multi-objective global optimization method that combines the experimental design, evolutionary algorithms and distributed computing techniques. In the context of model parameter tuning, the optimization process aims at minimizing the global history match error
Qglobal which is defined as follows (see Glober [
32] for the algorithm details):
where,
is the weight corresponding to measurement
j in well
i,
is the total number of wells,
N(
i) is the total number of measurements in well
i and
Qi is the history match error for well
i given by
where,
t(
s) is the time when measurement
j was performed,
is the total number of time for measurement
j for well
i,
and
are the simulated and measured results, respectively,
is the maximum change in measurement
j for well
i, and
is the error of measurement
j in well
i.
In the case of the Hontomìn site, the history matching was performed with respect to the bottom hole pressure (
BHP(Pa)) at the injection well HI, while assigning the injection flow rates (
,
). The measurement error
for the pressure gauge is negligible. Consequently, Equations (1) and (2) reduce to
where,
is the maximum change in the bottom-hole pressure during the test period and
is the total number of time units for pressure measurements (every minute during the test period). The distribution and ranges of variation of the selected parameters are defined by the user. The parameters of each simulation are drawn within the user-defined parameter space aiming at the minimization of the global history match error.
The modeling followed a sequential approach: first matching the single-phase parameters such as fracture permeability during the brine injection periods and then matching the two-phase parameters such as fracture relative permeability during the brine and CO2 injection periods.
To minimize the number of model parameters, and avoiding modeling the flow behavior within the well, the flow rates were modeled at the reservoir conditions aiming at matching the measured bottom hole pressure. The well parameters are acquired every minute and would consequently limit the simulation time-step. Thus, the well parameters are averaged on an hourly basis while ensuring the consistency of the mass balance and synchronicity of the model with well operations.
4.1. Modeling the Single-Phase Brine Injection Periods
Based on the previous modeling work, several single-phase parameters were considered within the CMOST™ uncertainty modeling workflow to best enable pressure matching. This is the case of the multiplier for fracture permeability in each of the 3 directions of the grid, which varies several orders of magnitude with a uniform distribution since the matrix permeability was previously matched. The multiplier for fracture porosity should also be considered, which varies 50% with the uniform distribution since the base model was previously matched. Additionally, the multiplier for the matrix porosity varies 50% with the uniform distribution since the base model was previously matched, as mentioned above. Finally, the compressibility values of the matrix and fracture medium need to be considered, which vary with several orders of magnitude with a uniform distribution to best improve the pressure response during the fall-off periods.
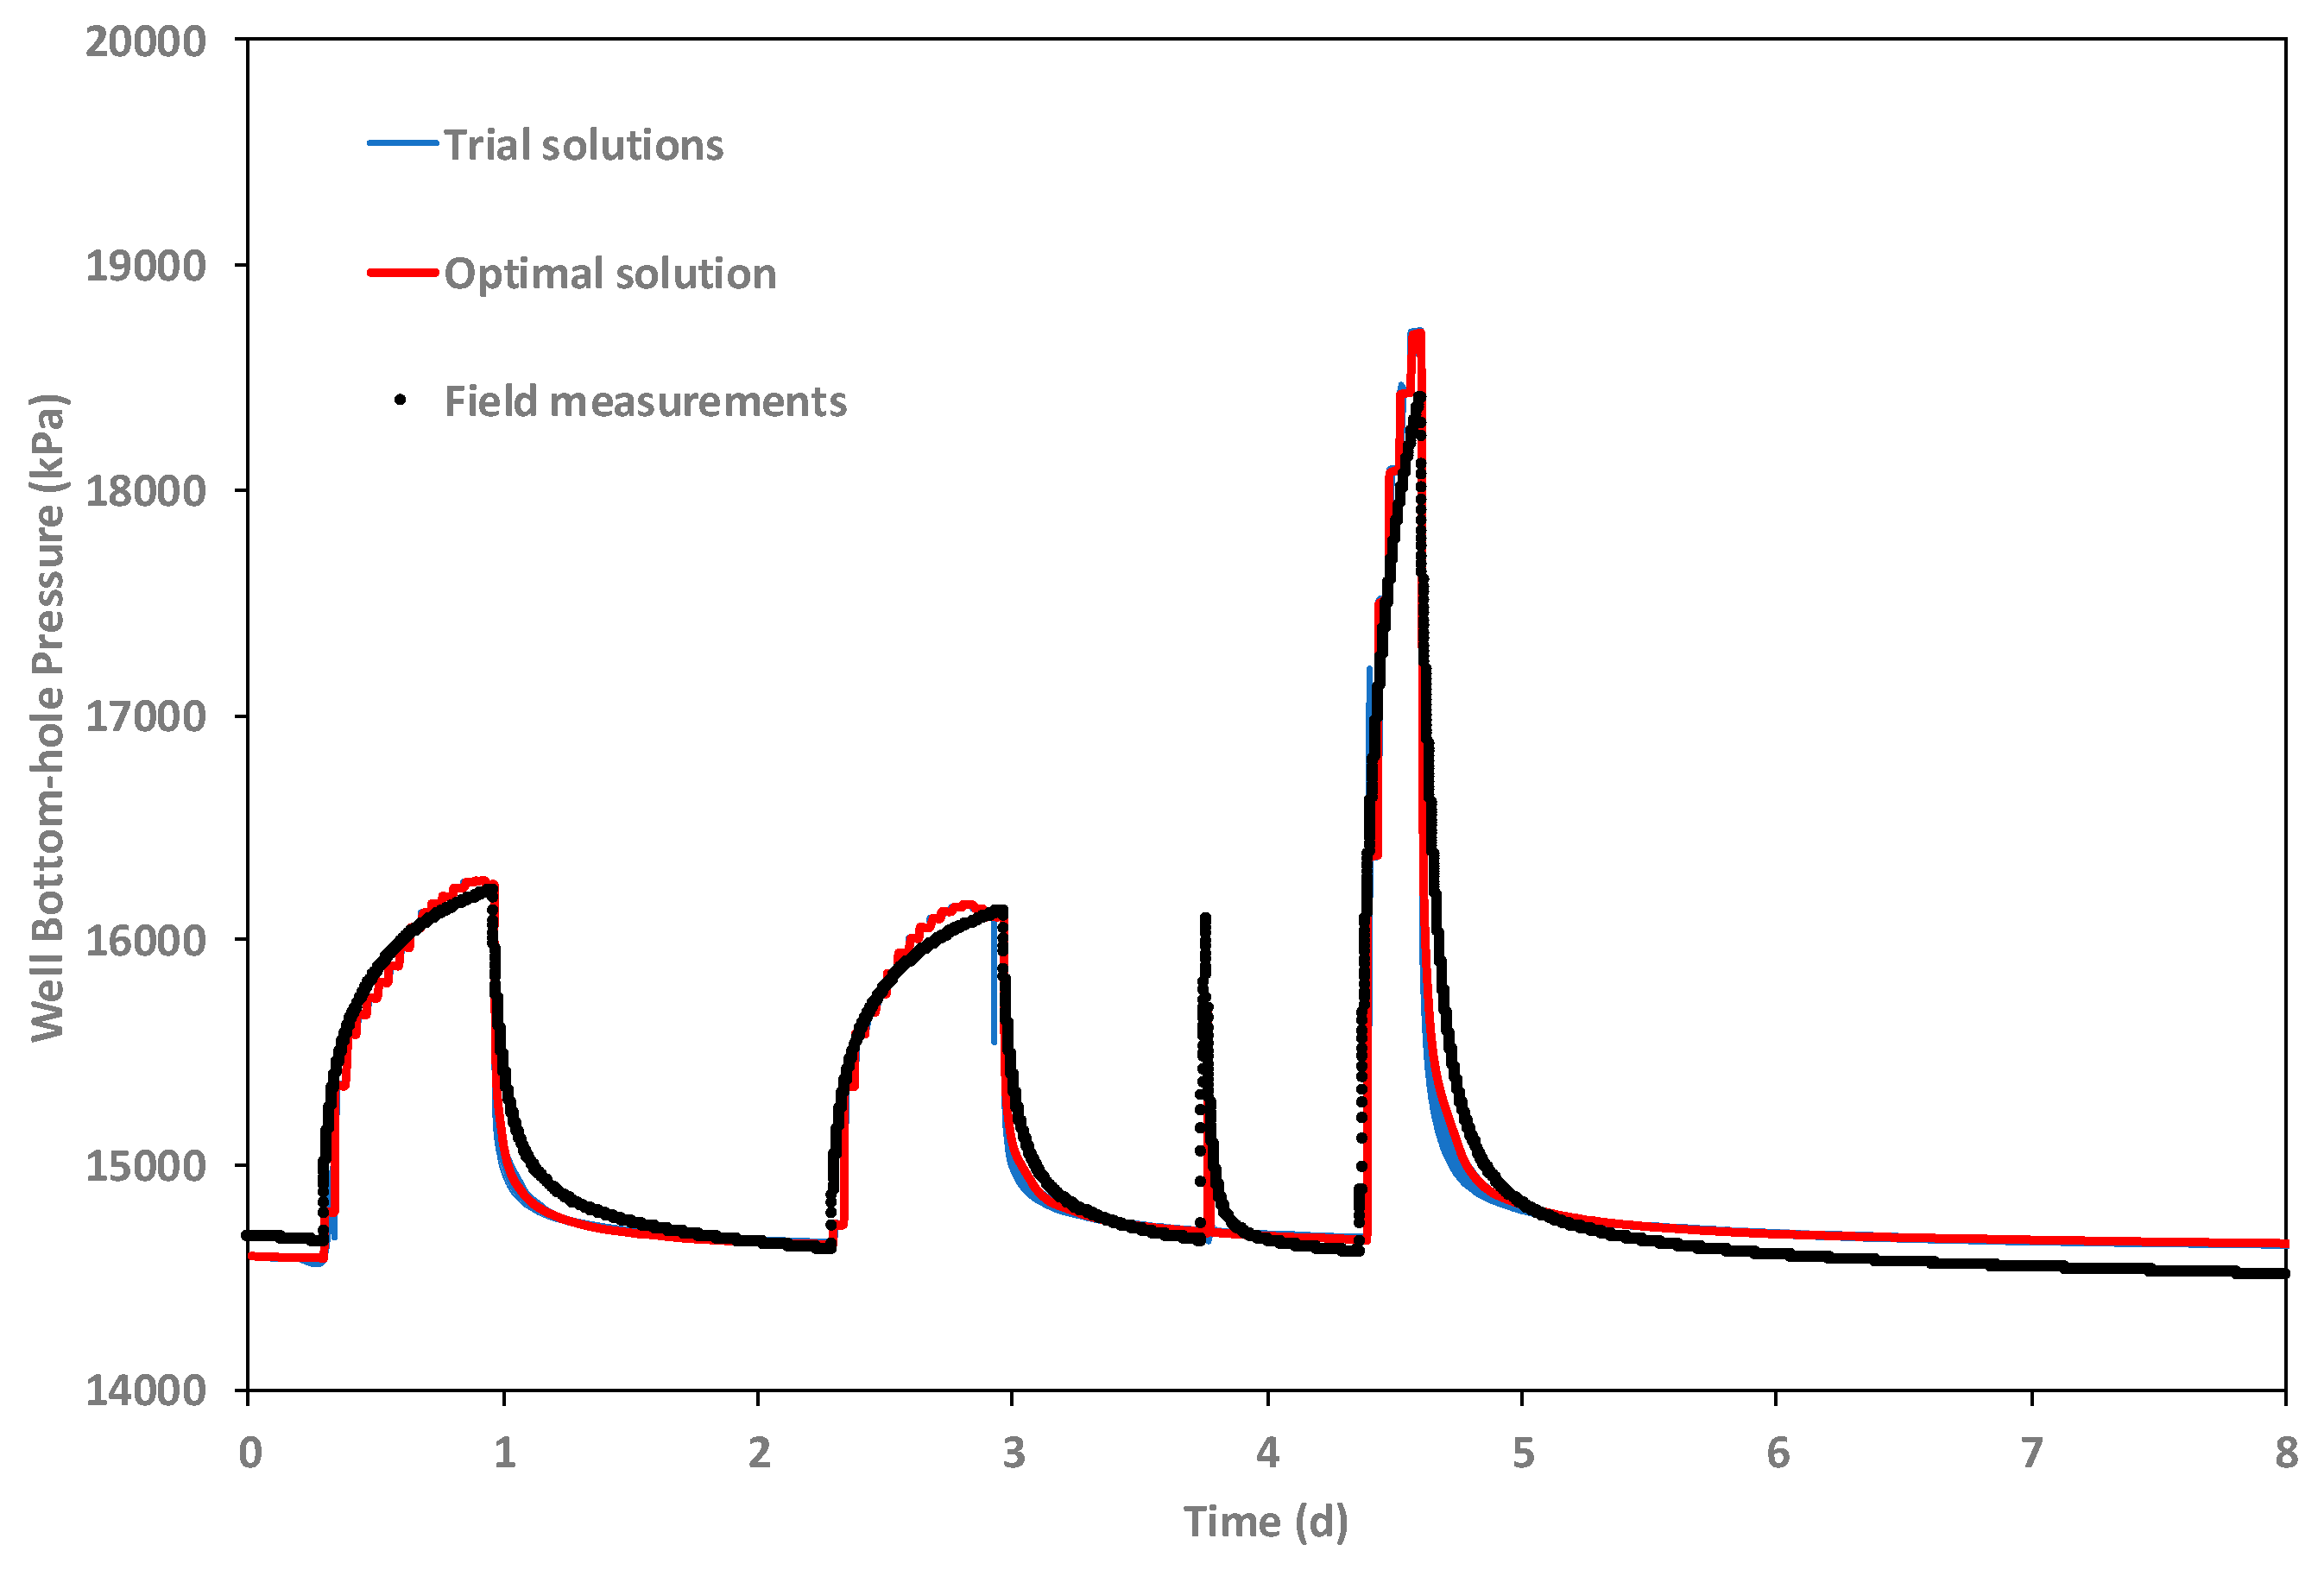
The uncertainty model CMOST™ investigates the parameter domain based upon a Latin Hypercube Sampling approach and converges towards its optimum after about 80 different simulations. Beyond the initial 100 simulations, no significant improvement of the match (the cumulative difference between the simulated and measured
BHP for HI well) is obtained and the residual relative error is about 7%, which mainly corresponds to the slight mismatches during the fall-off periods as shown in
Figure 7. The single-phase match is quite satisfactory and not sensitive to the selected parameters or their range of variations.
The influence of the various parameters was analyzed with variance-based methods, in which the variability or uncertainty associated with an important input parameter is propagated through the model, resulting in a large contribution to the overall output variability according to the study developed by Chan et al. [
33] for the sensitivity analysis of model output. The guiding philosophy of the variance-based methods is to determine the input factors that may be considered to have effects which are negligible, linear and additive or non-linear, or involved in interactions with other factors as Campolongo et al. [
34] proposed for the screening design in the sensitivity analysis.
The method of Sobol’ [
35] is a global- and model-independent method that is based on variance decomposition. It can handle non-linear and non-monotonic functions and models. Variance-based analysis methods aim to quantify the amount of variance that each parameter contributes to the unconditional variance of the model output. For the Sobol’ method, these amounts caused either by a single parameter or by the interaction of two or more parameters are expressed as Sobol’ indices. These indices represent the fractions of the unconditional model output variance.
Despite its high computational demand, this powerful analysis technique has recently become more popular because of its ability to incorporate parameter interactions and its relatively straightforward interpretation. The first order Sobol’ index is a measure for the variance contribution of the individual parameter to the total model variance. The impact on the model output variance of the interactions between parameters is given by second-order Sobol’ index, as Nossent et al. [
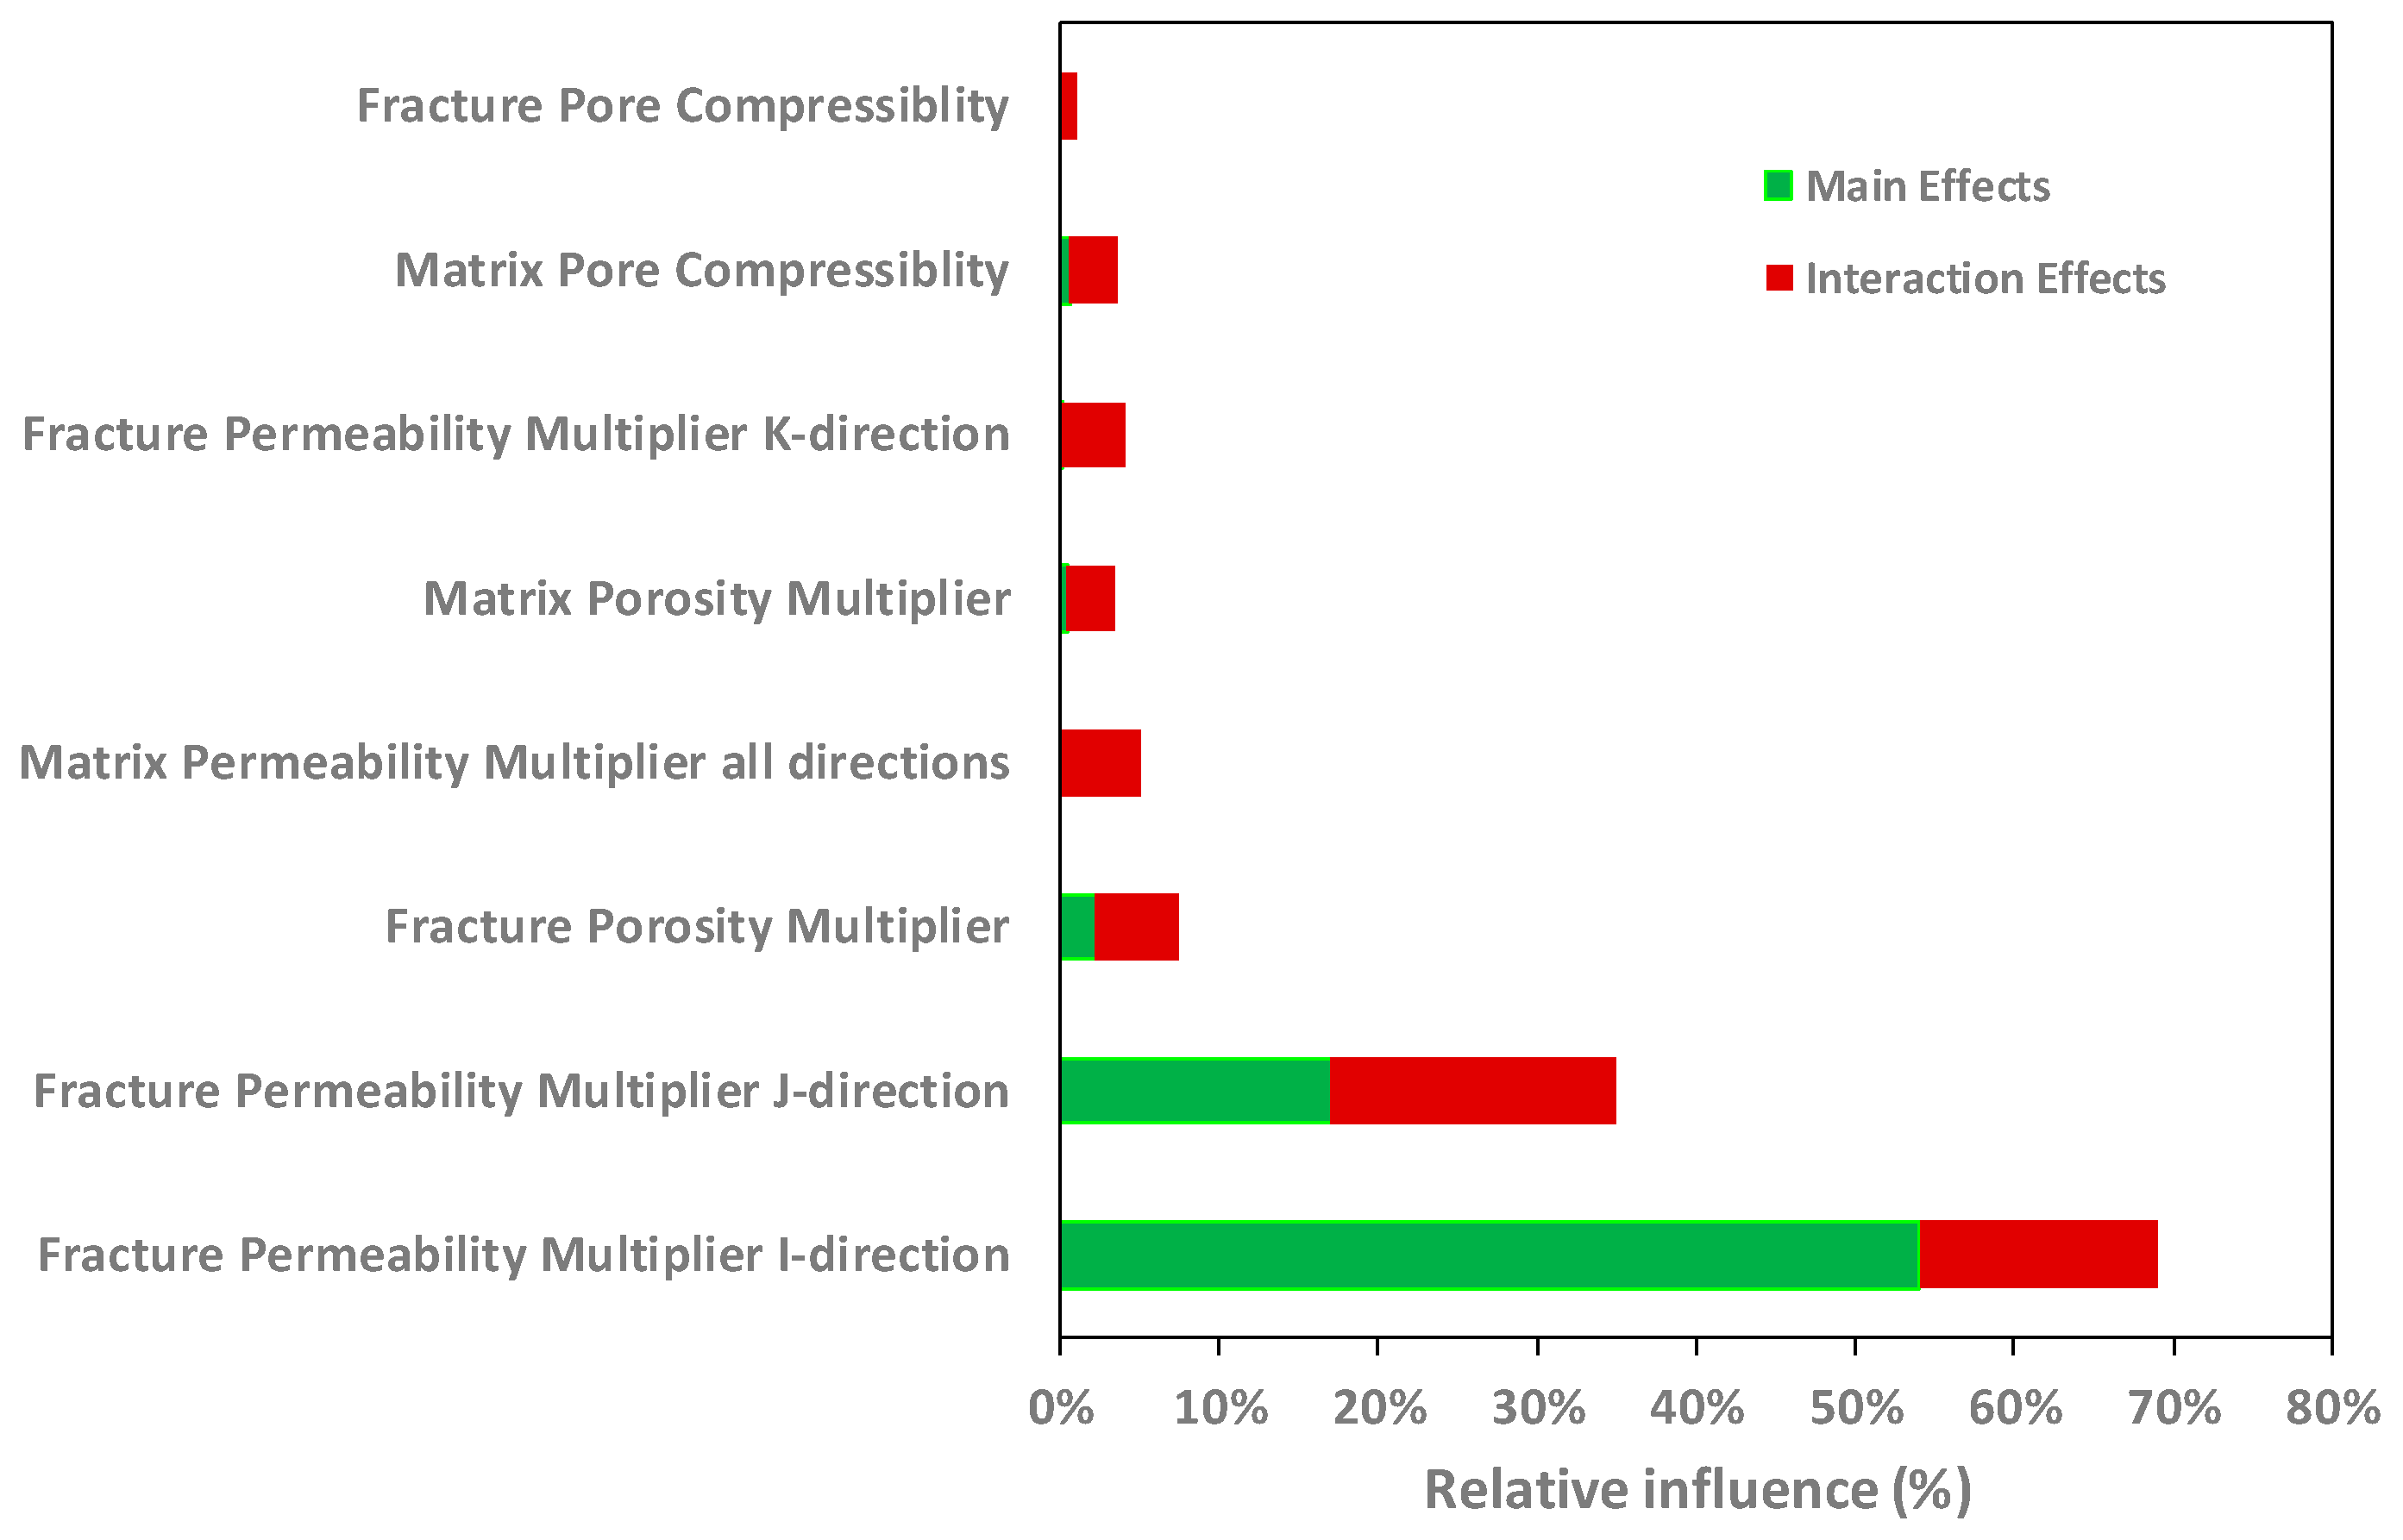
36] proposed in their study on the sensitivity analysis of a complex environmental model. The Total Sensitivity Index of a parameter is the sum of the two Sobol’ indices, linear (i.e., main effects) and non-linear (i.e., interaction effects), which are reported in
Figure 8 for all the uncertain parameters considered in the simulations. As shown in
Figure 8, the most influential parameters are the multiplier for fracture permeability in the x or
I direction (north-south), the multiplier for fracture permeability in the y or
J direction (east-west) and the multiplier for the fracture porosity.
The interaction contributions (
Figure 8), i.e., the non-linear effects due to the combined influence of two or more parameters, are important for all selected parameters. The different contributions to the interactions cannot be deciphered during the history matching stage but only through a specific sensitivity analysis.
The brine single-phase flow in the carbonate reservoir is mainly influenced by the fracture characteristics (permeability and porosity) and, to a lesser extent, by the matrix ones. The optimal match is used as a base case to model the two-phase CO
2 and brine injection periods described in
Section 4.2.
4.2. Modeling the Two-Phase Brine and CO2 Injection Period
Based upon the results from the field and laboratory injection tests conducted at the Hontomín hydraulic characterization phase, described and analyzed by de Dios et al. [
11], the CO
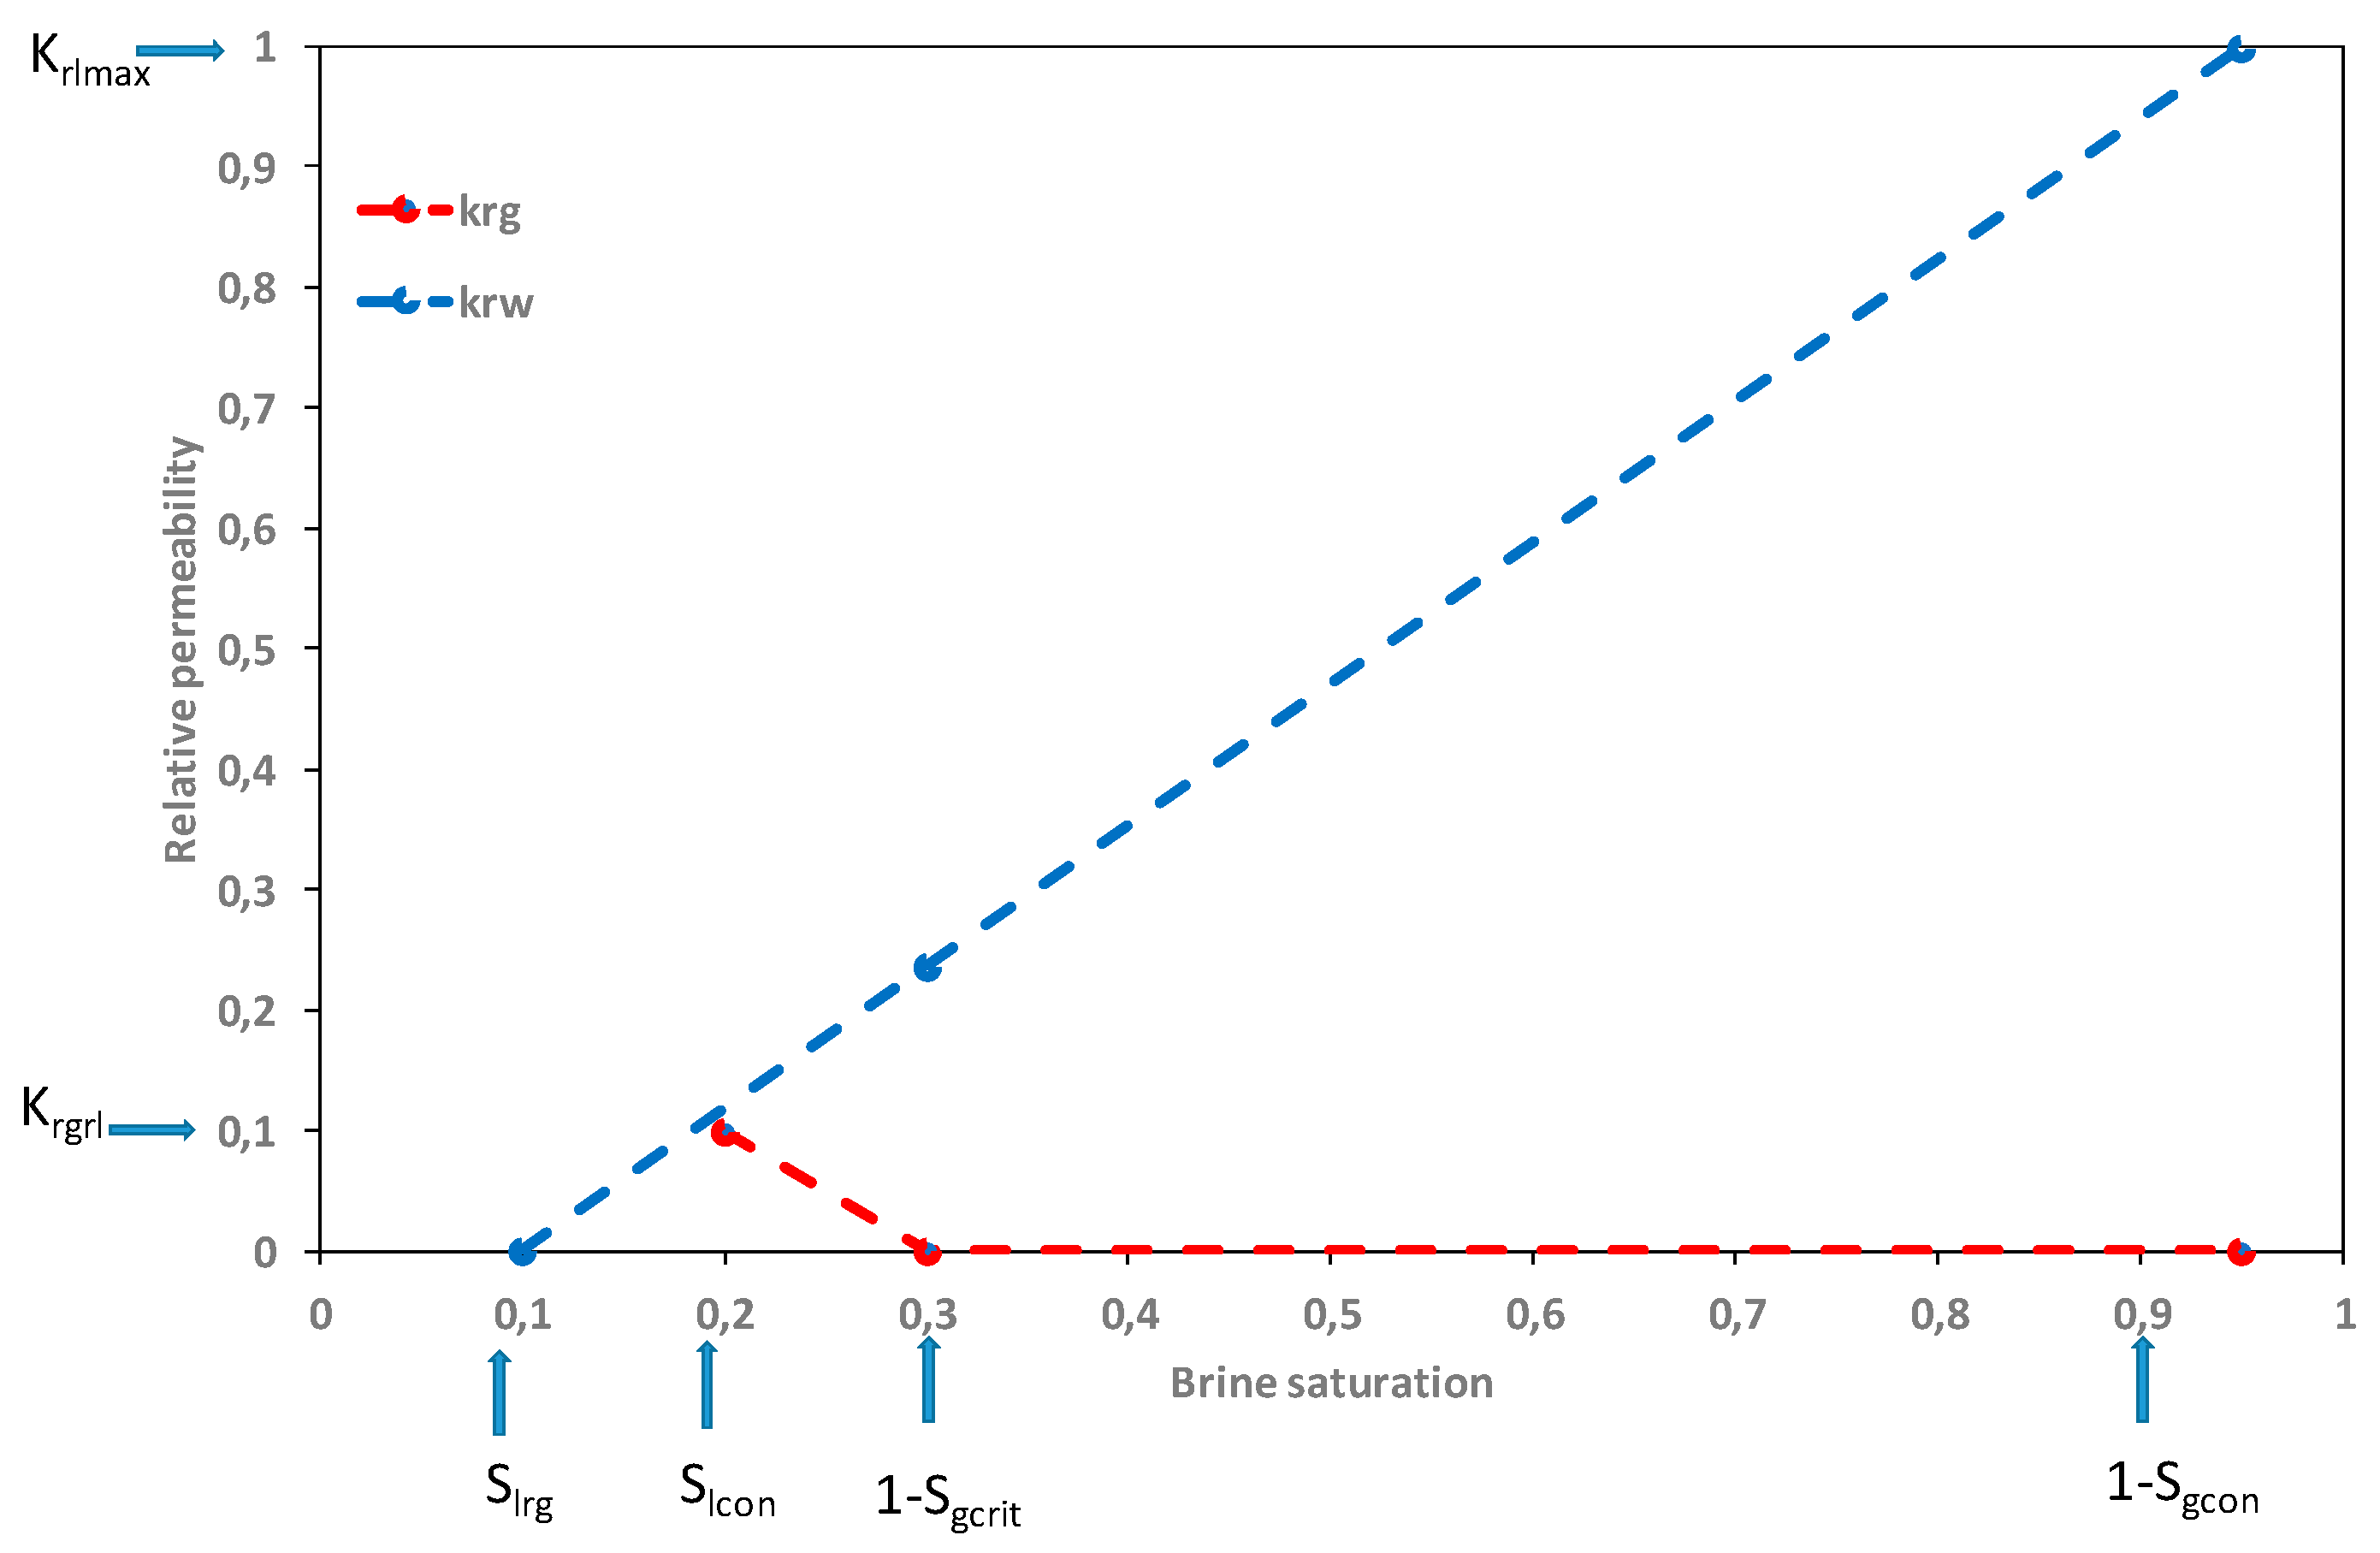
2 transmissivity dominated by the fracture network is proven in the naturally fractured carbonate reservoir of Hontomín. Consequently, the selected parameters of the two-phase flow are related to the fracture relative permeability for the CO
2 and brine injection, as shown in
Figure 9.
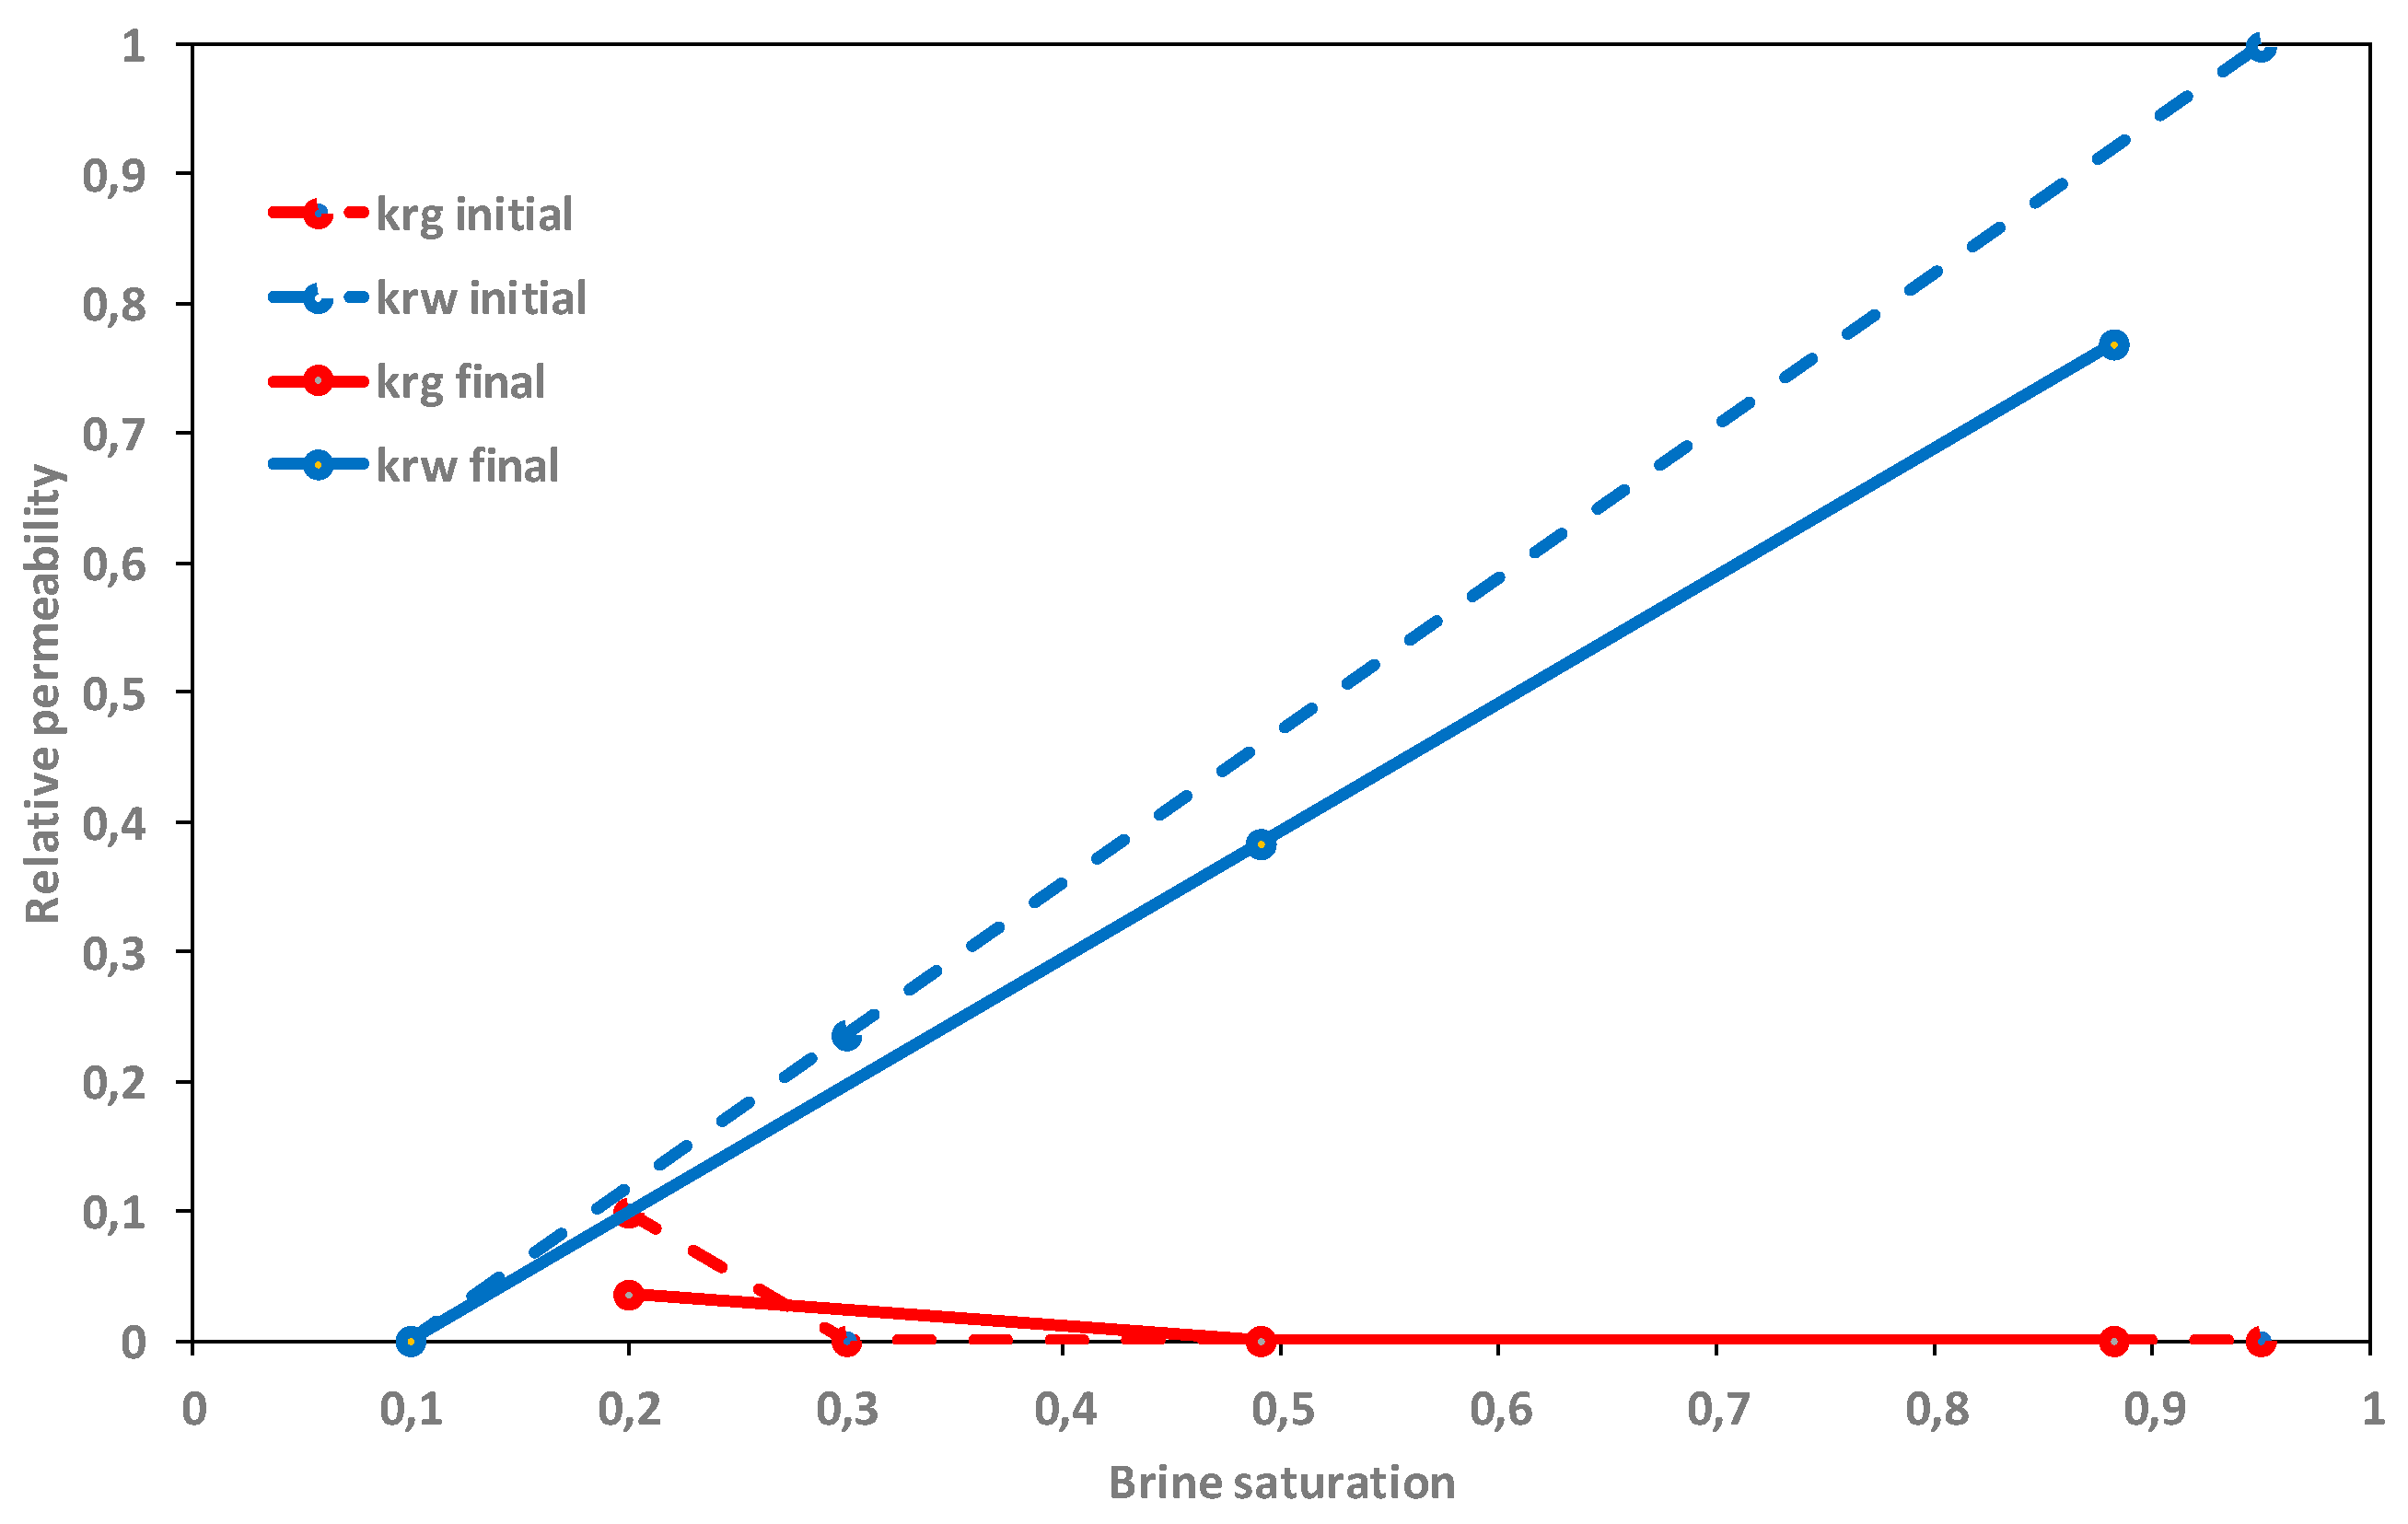
The two-phase parameters adjusted within the CMOST™ uncertainty modeling workflow are the following endpoints (see
Figure 9) of the relative permeability for the fractures: the maximum of the CO
2 relative permeability
Krgrl, which may vary between 0.01 and 1 with a uniform distribution; the maximum of the brine relative permeability
Krlmax, which may vary between 0.75 and 1 with a uniform distribution; the CO
2 critical saturation
OneminusSgcrit, which may vary between 0 and 0.5 with a uniform distribution; and the brine critical saturation
Slrg, which may vary between 0.1 and 0.25 with an uniform distribution.
The ranges of variation of these parameters were determined based upon the previous modeling work developed by Le Gallo et al. [
19]. Using the best results from single-phase modeling (base case in this workflow), the uncertainty model CMOST™ investigated the parameter domains based upon a Latin Hypercube Sampling approach and it converges towards its optimum after about 40 different simulations.
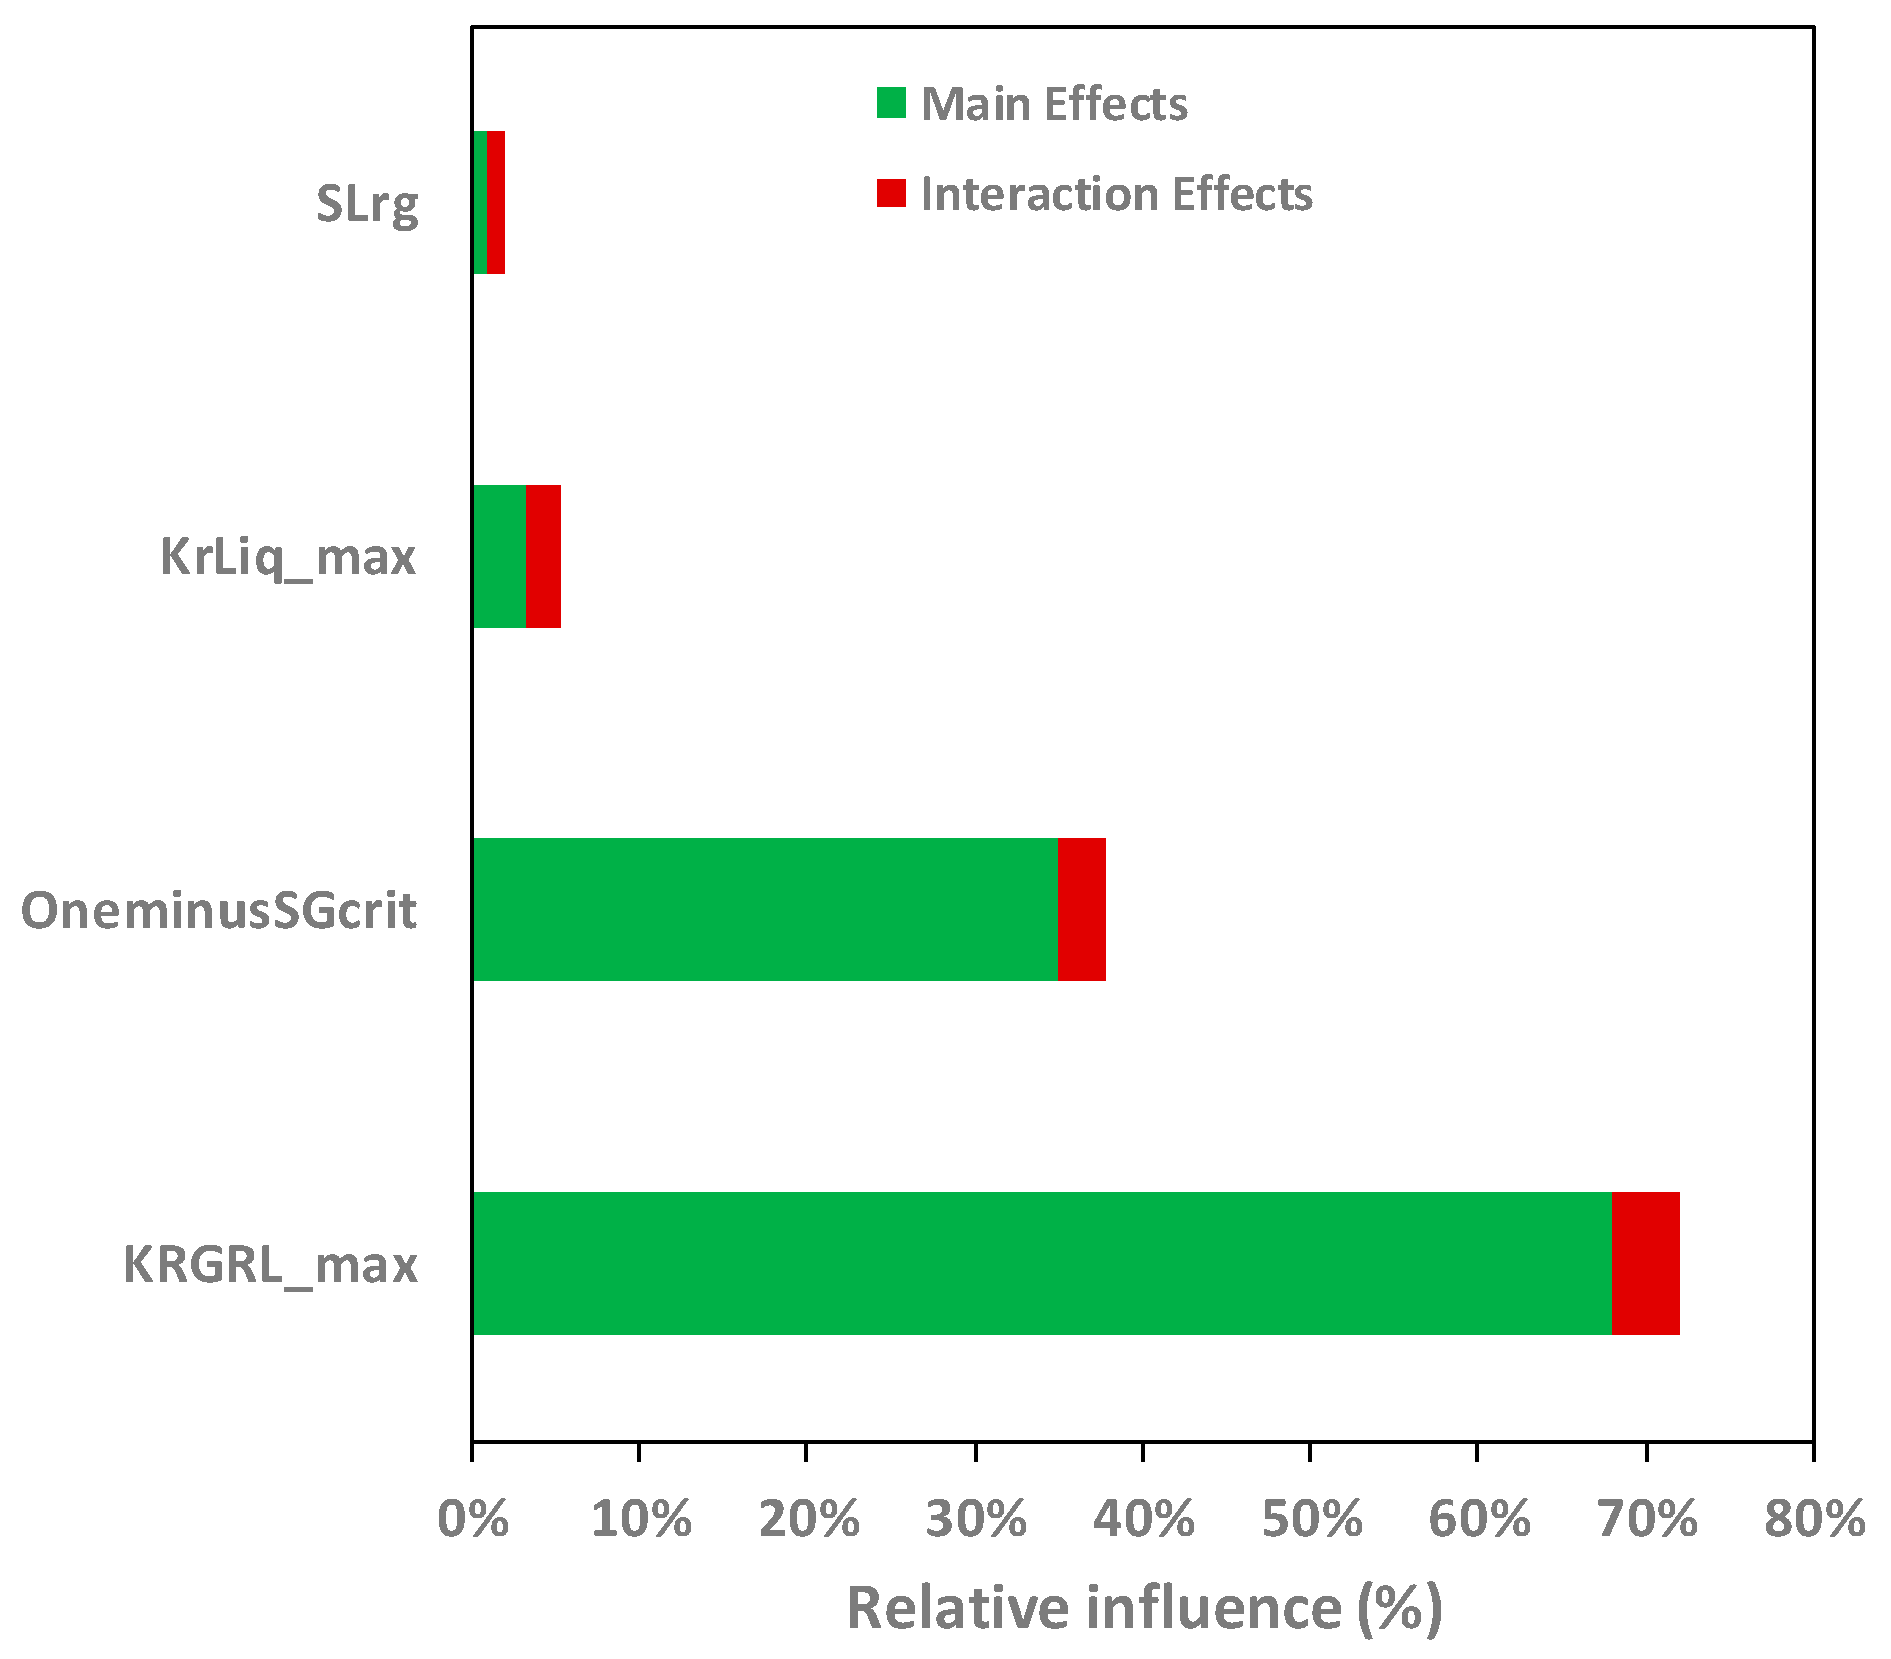
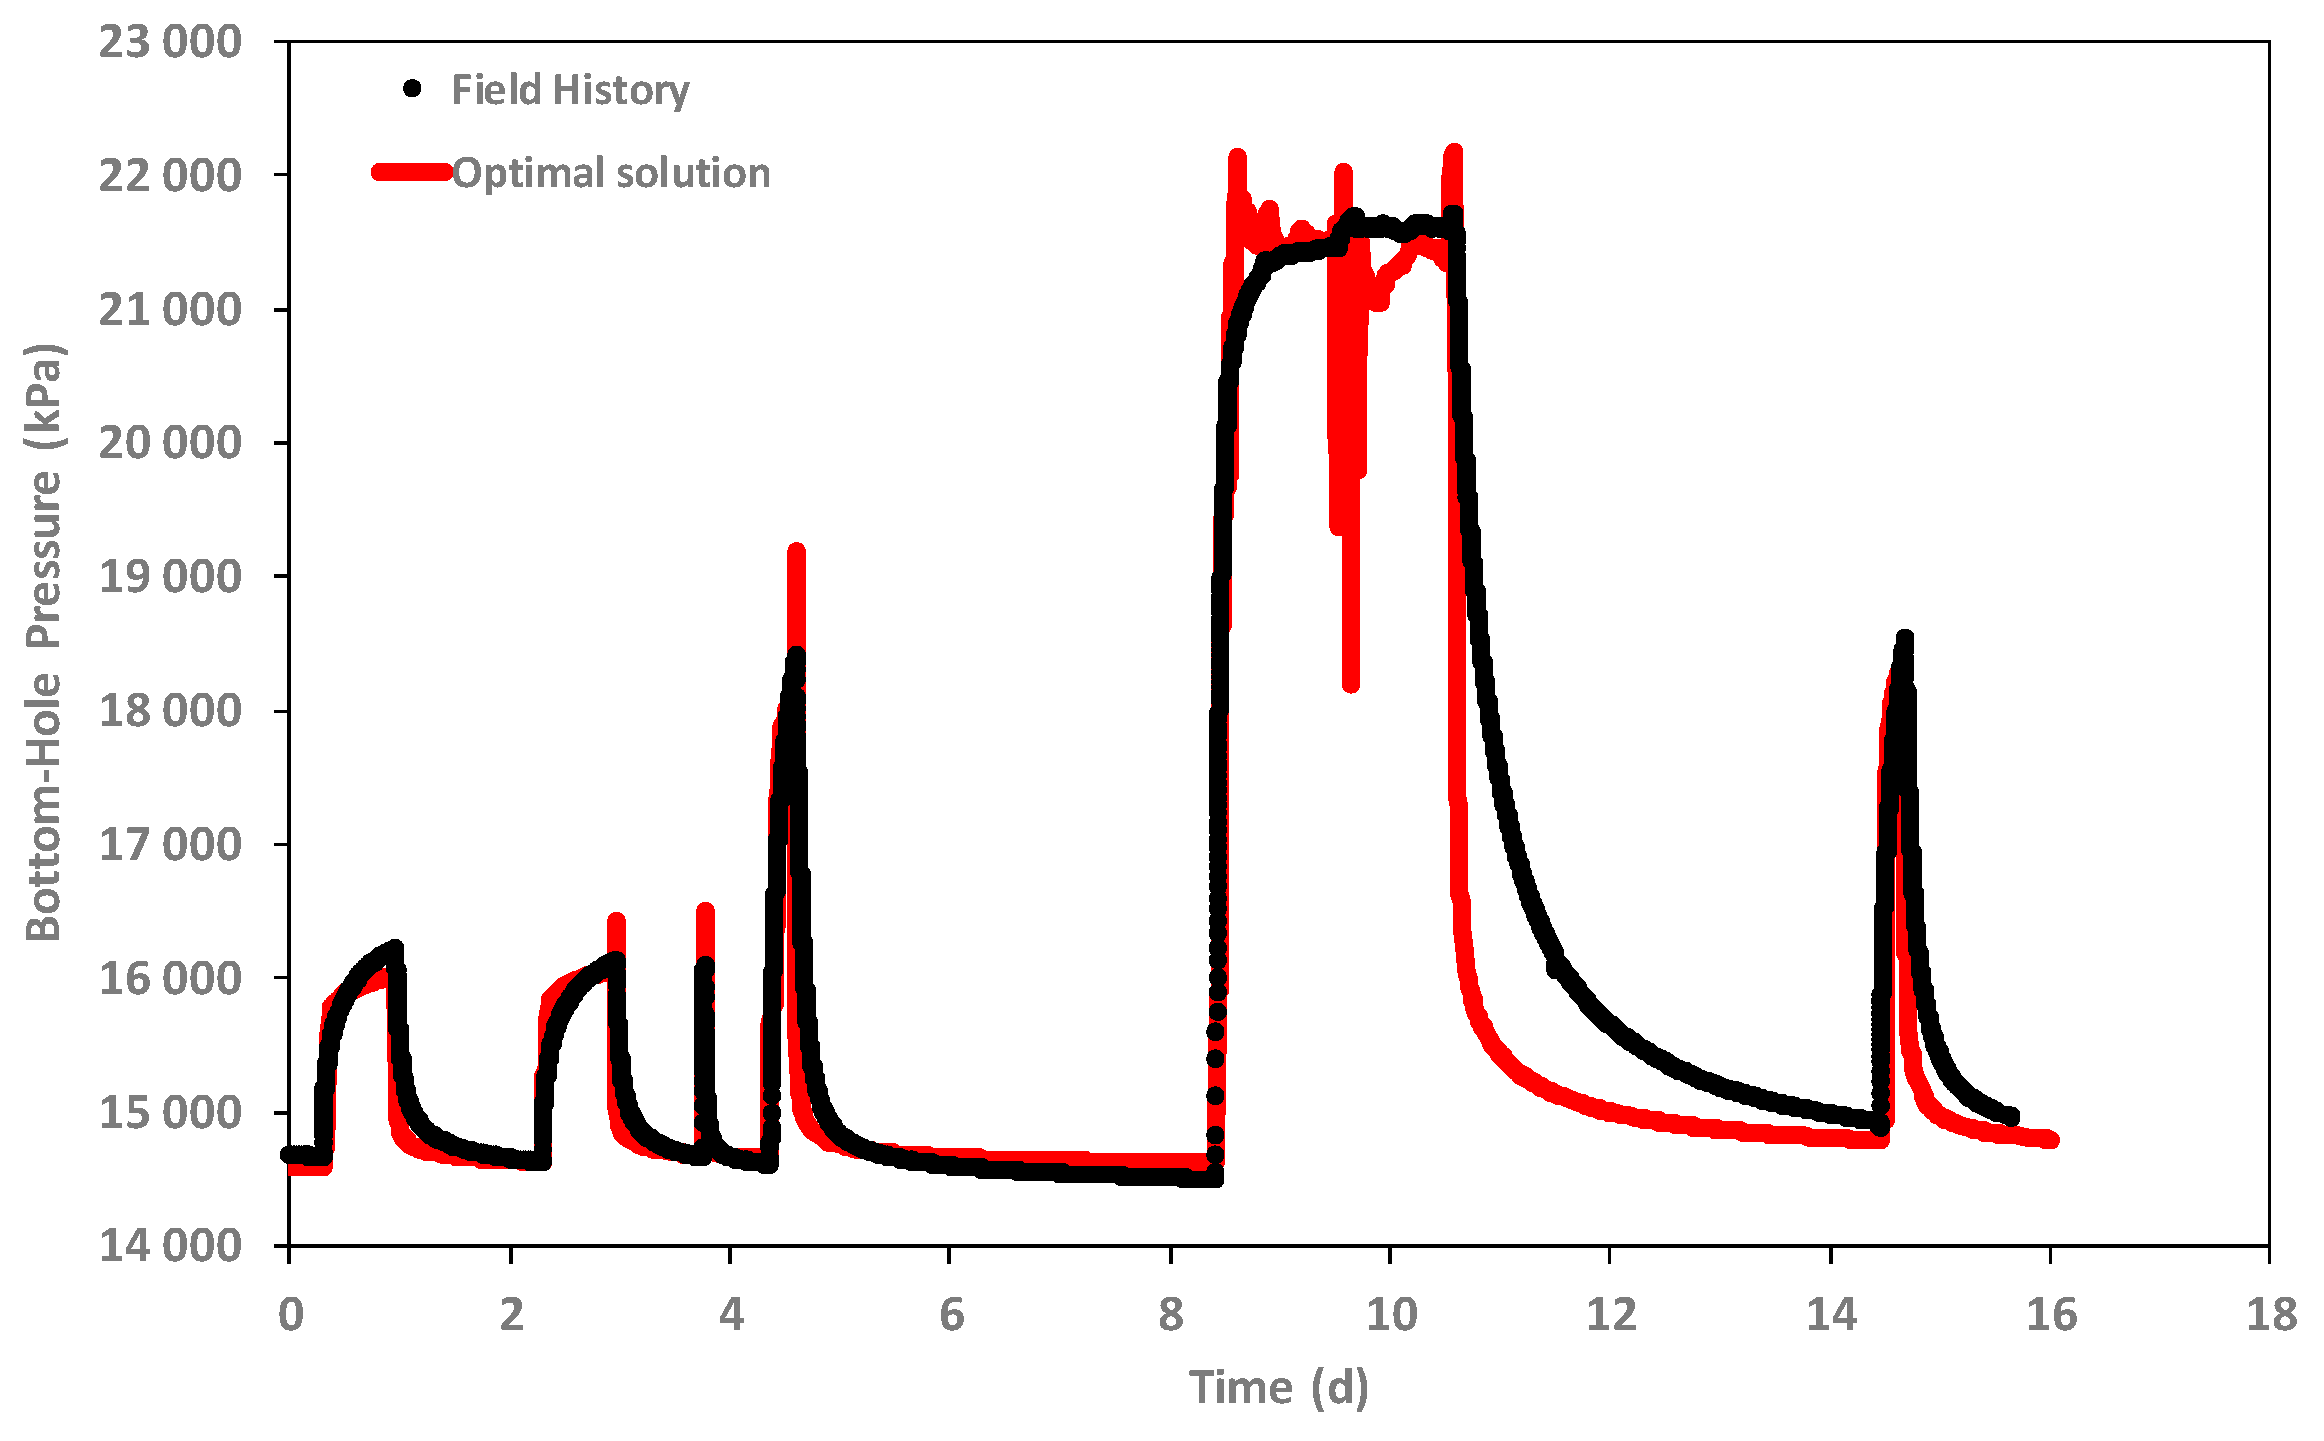
Beyond the initial 50 simulations, no significant improvement of the match is obtained and the residual relative error is about 4.5%, as shown in
Figure 10, which mainly corresponds to the mismatches during the fall-off periods. The two-phase match is quite satisfactory and the most influential parameters, shown in
Figure 11, are the following: the maximum of the CO
2 relative permeability
Krgrl, the optimum of which is about 0.035; the CO
2 critical saturation
OneminusSgcrit, the optimum of which is about 0.49; and, finally, the maximum of brine relative permeability
Krlmax, the optimum of which is about 0.769.
As shown in
Figure 10, the main mismatches between the field and simulations occur during the fall-off period as the simulated pressure always returns faster than the measured pressure to its base level. This mismatch is enhanced after the two-phase injection period. An attempt to mitigate this discrepancy was to account for the uncertainty to rock compressibility and to numerical dispersion due to grid size. However, the influence of the compressibility of the various rock facies is not significant, as shown in
Figure 8.
Figure 12 shows the evolution of the relative permeability between the initial values as obtained by Le Gallo et al. [
19] and the final values obtained after history matching.
5. Analysis of Modeling Results
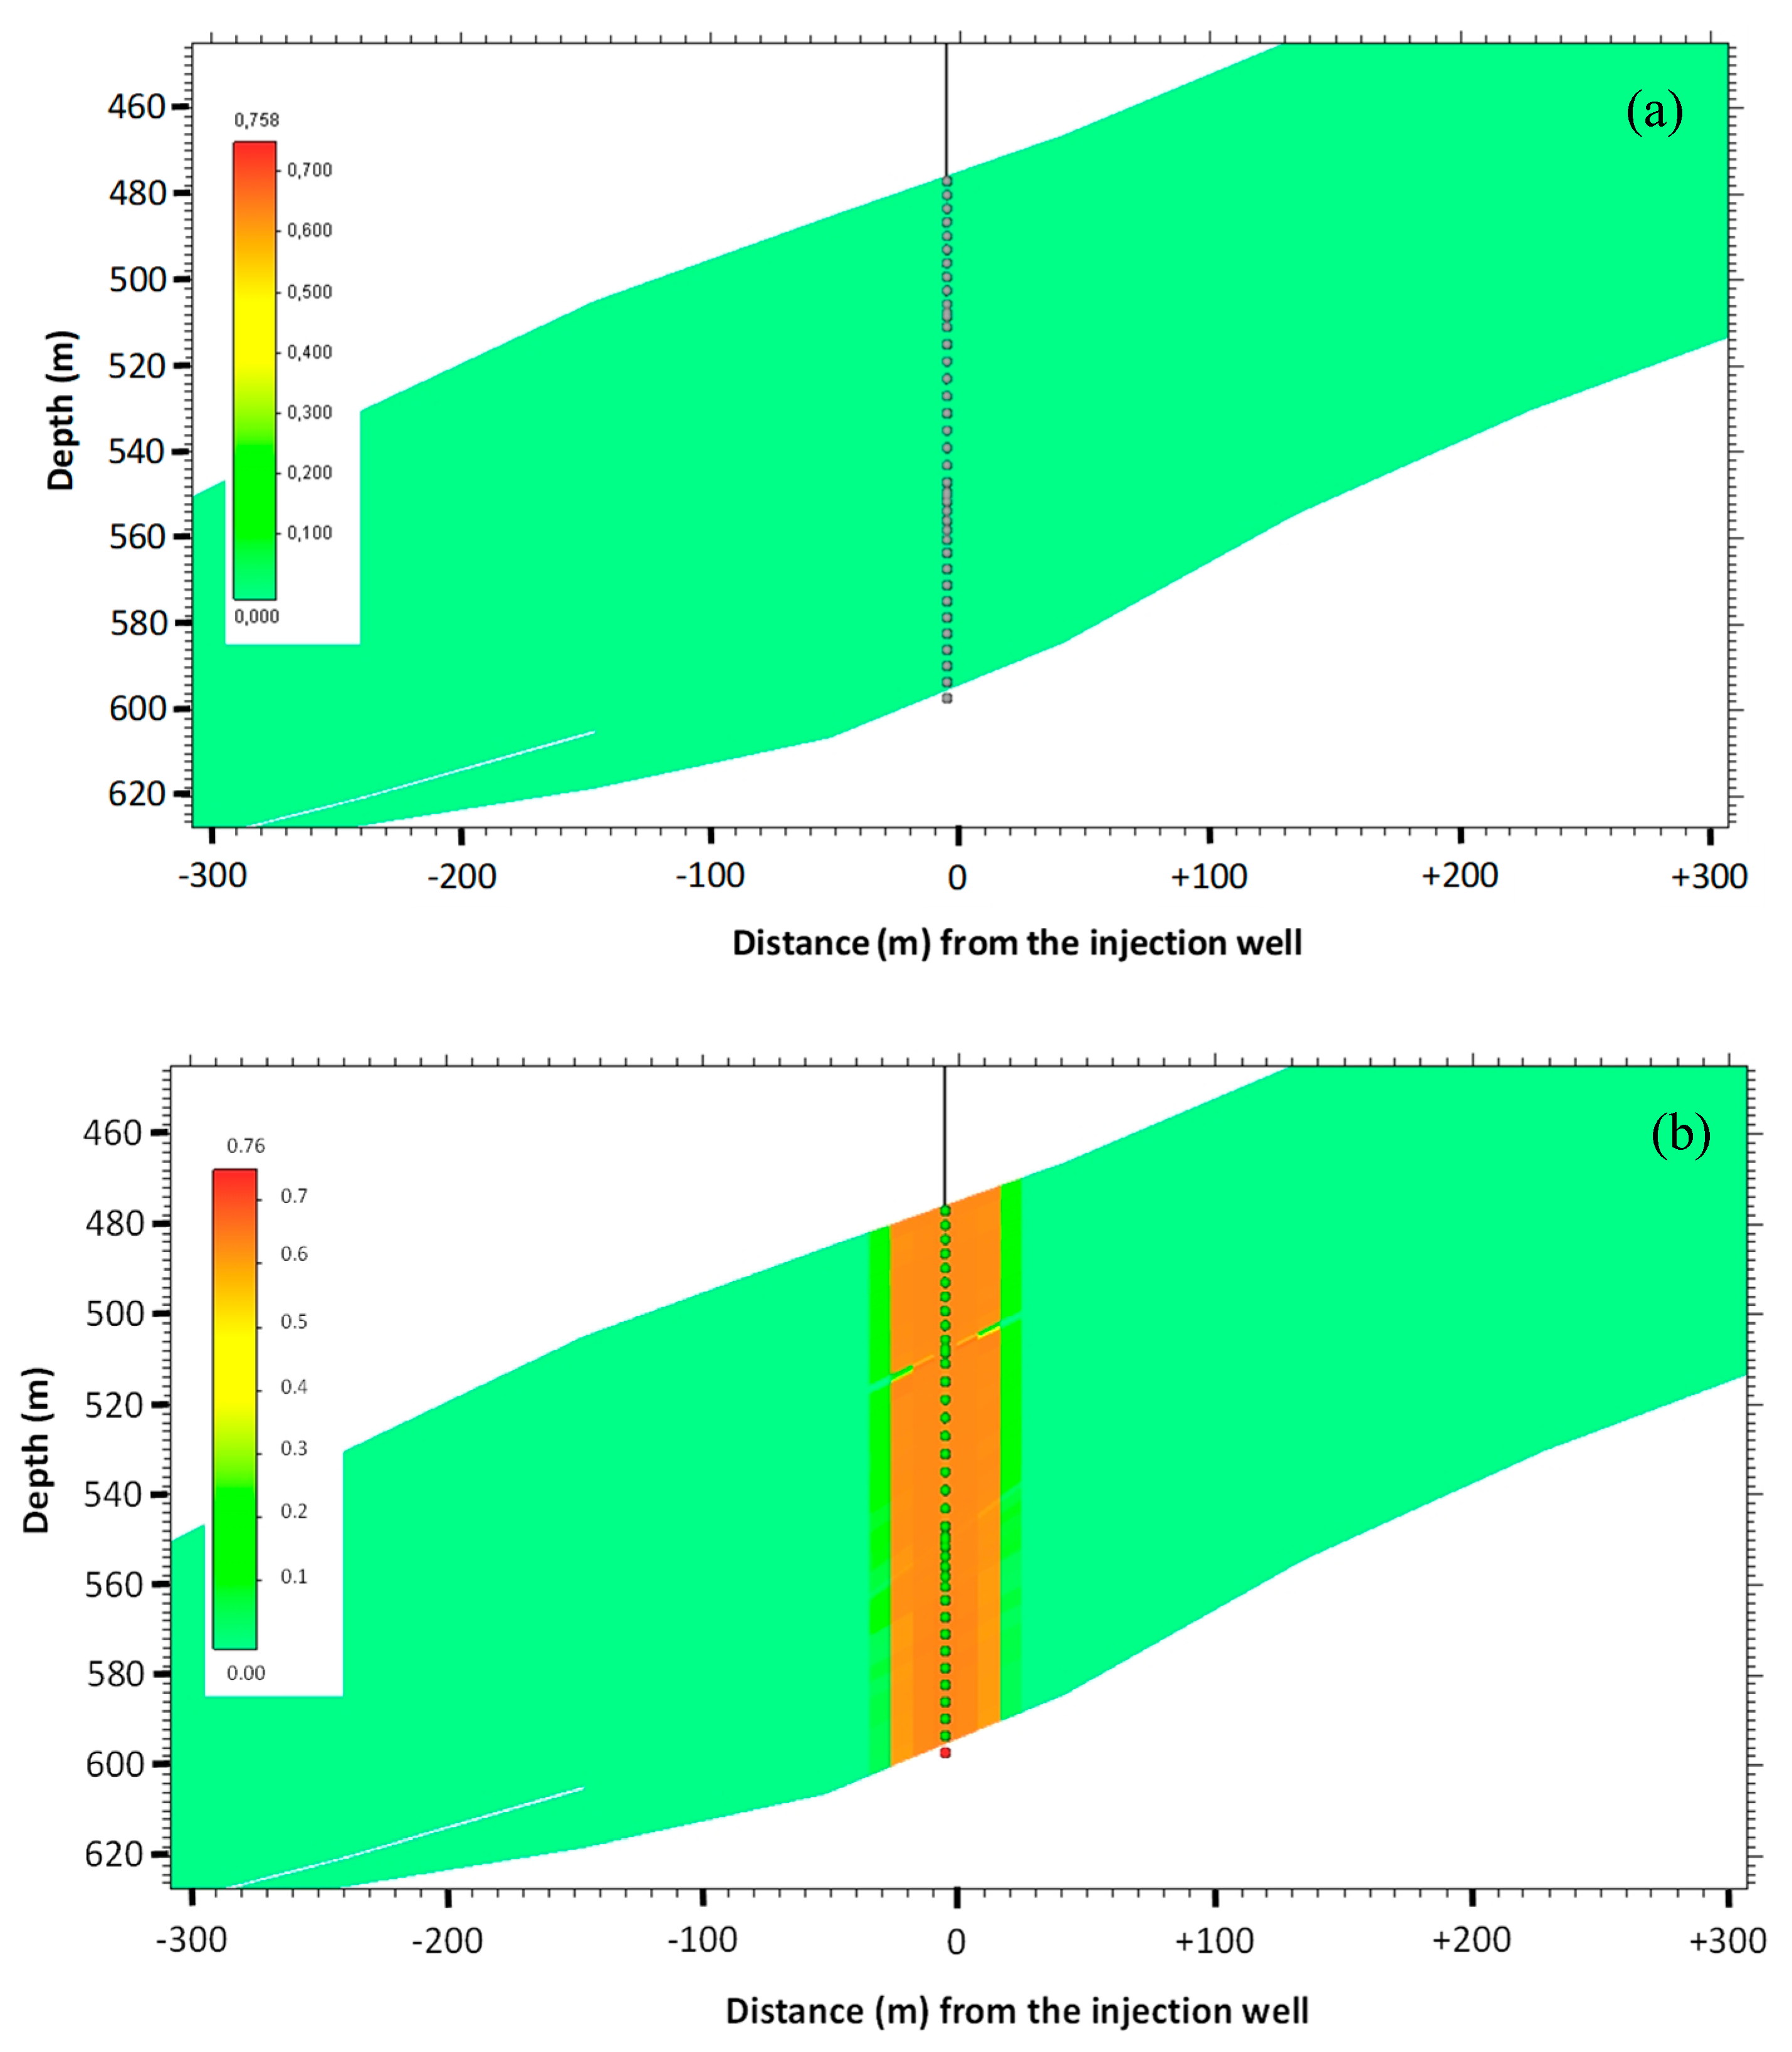
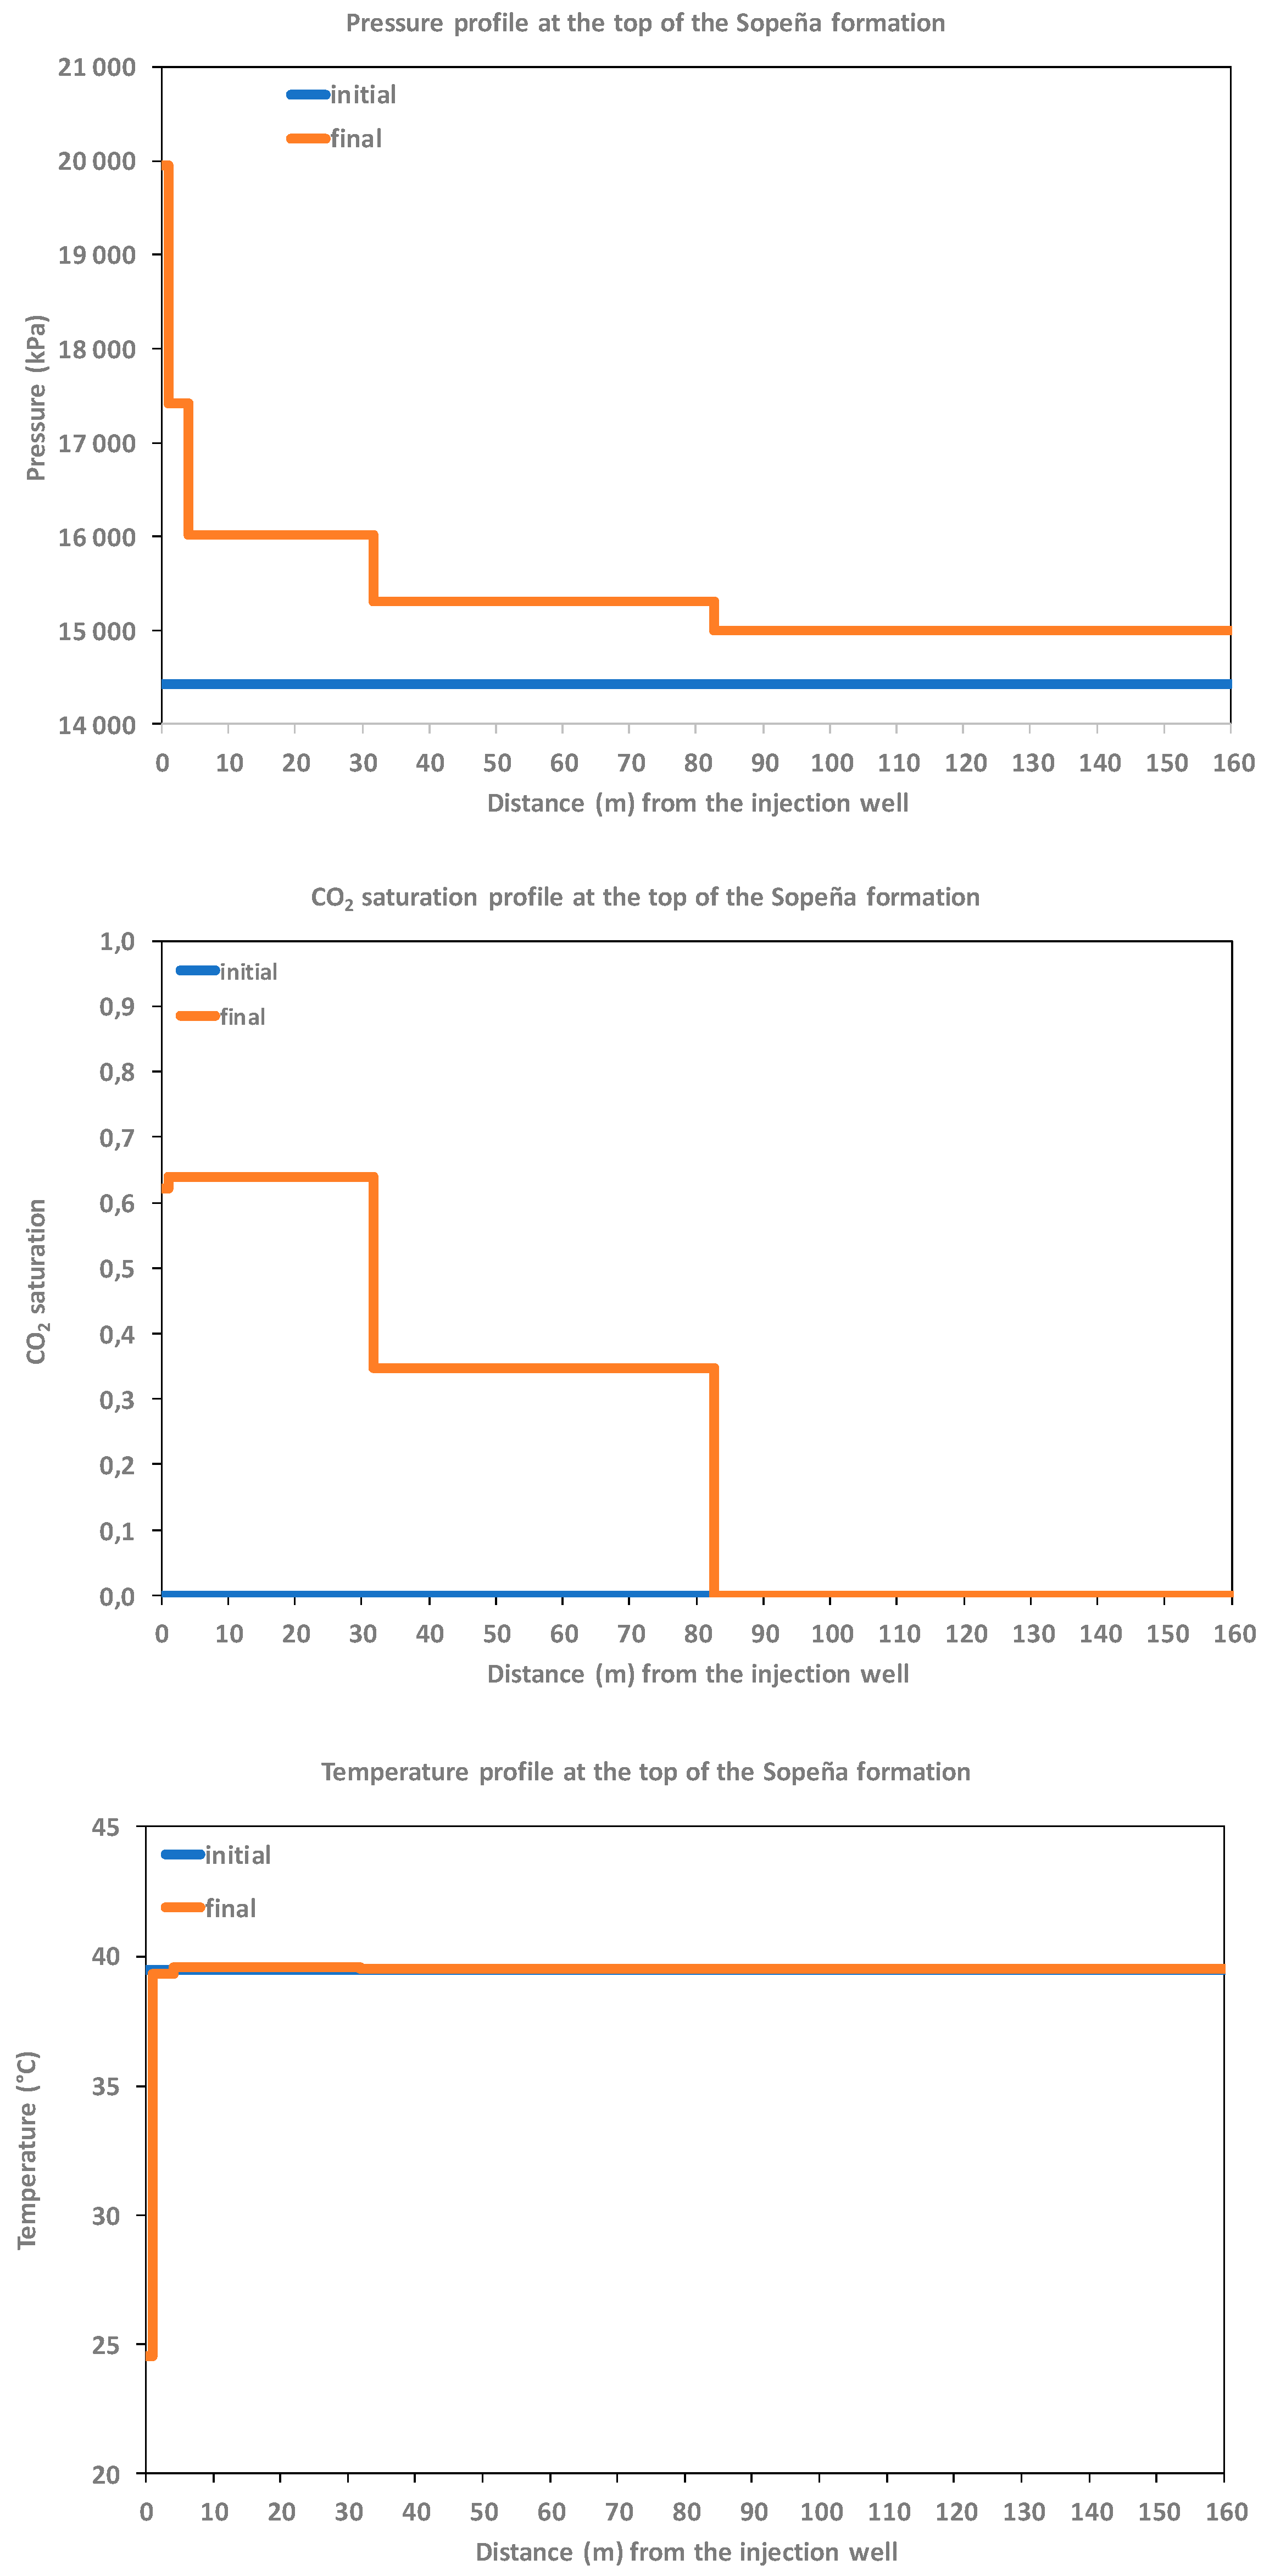
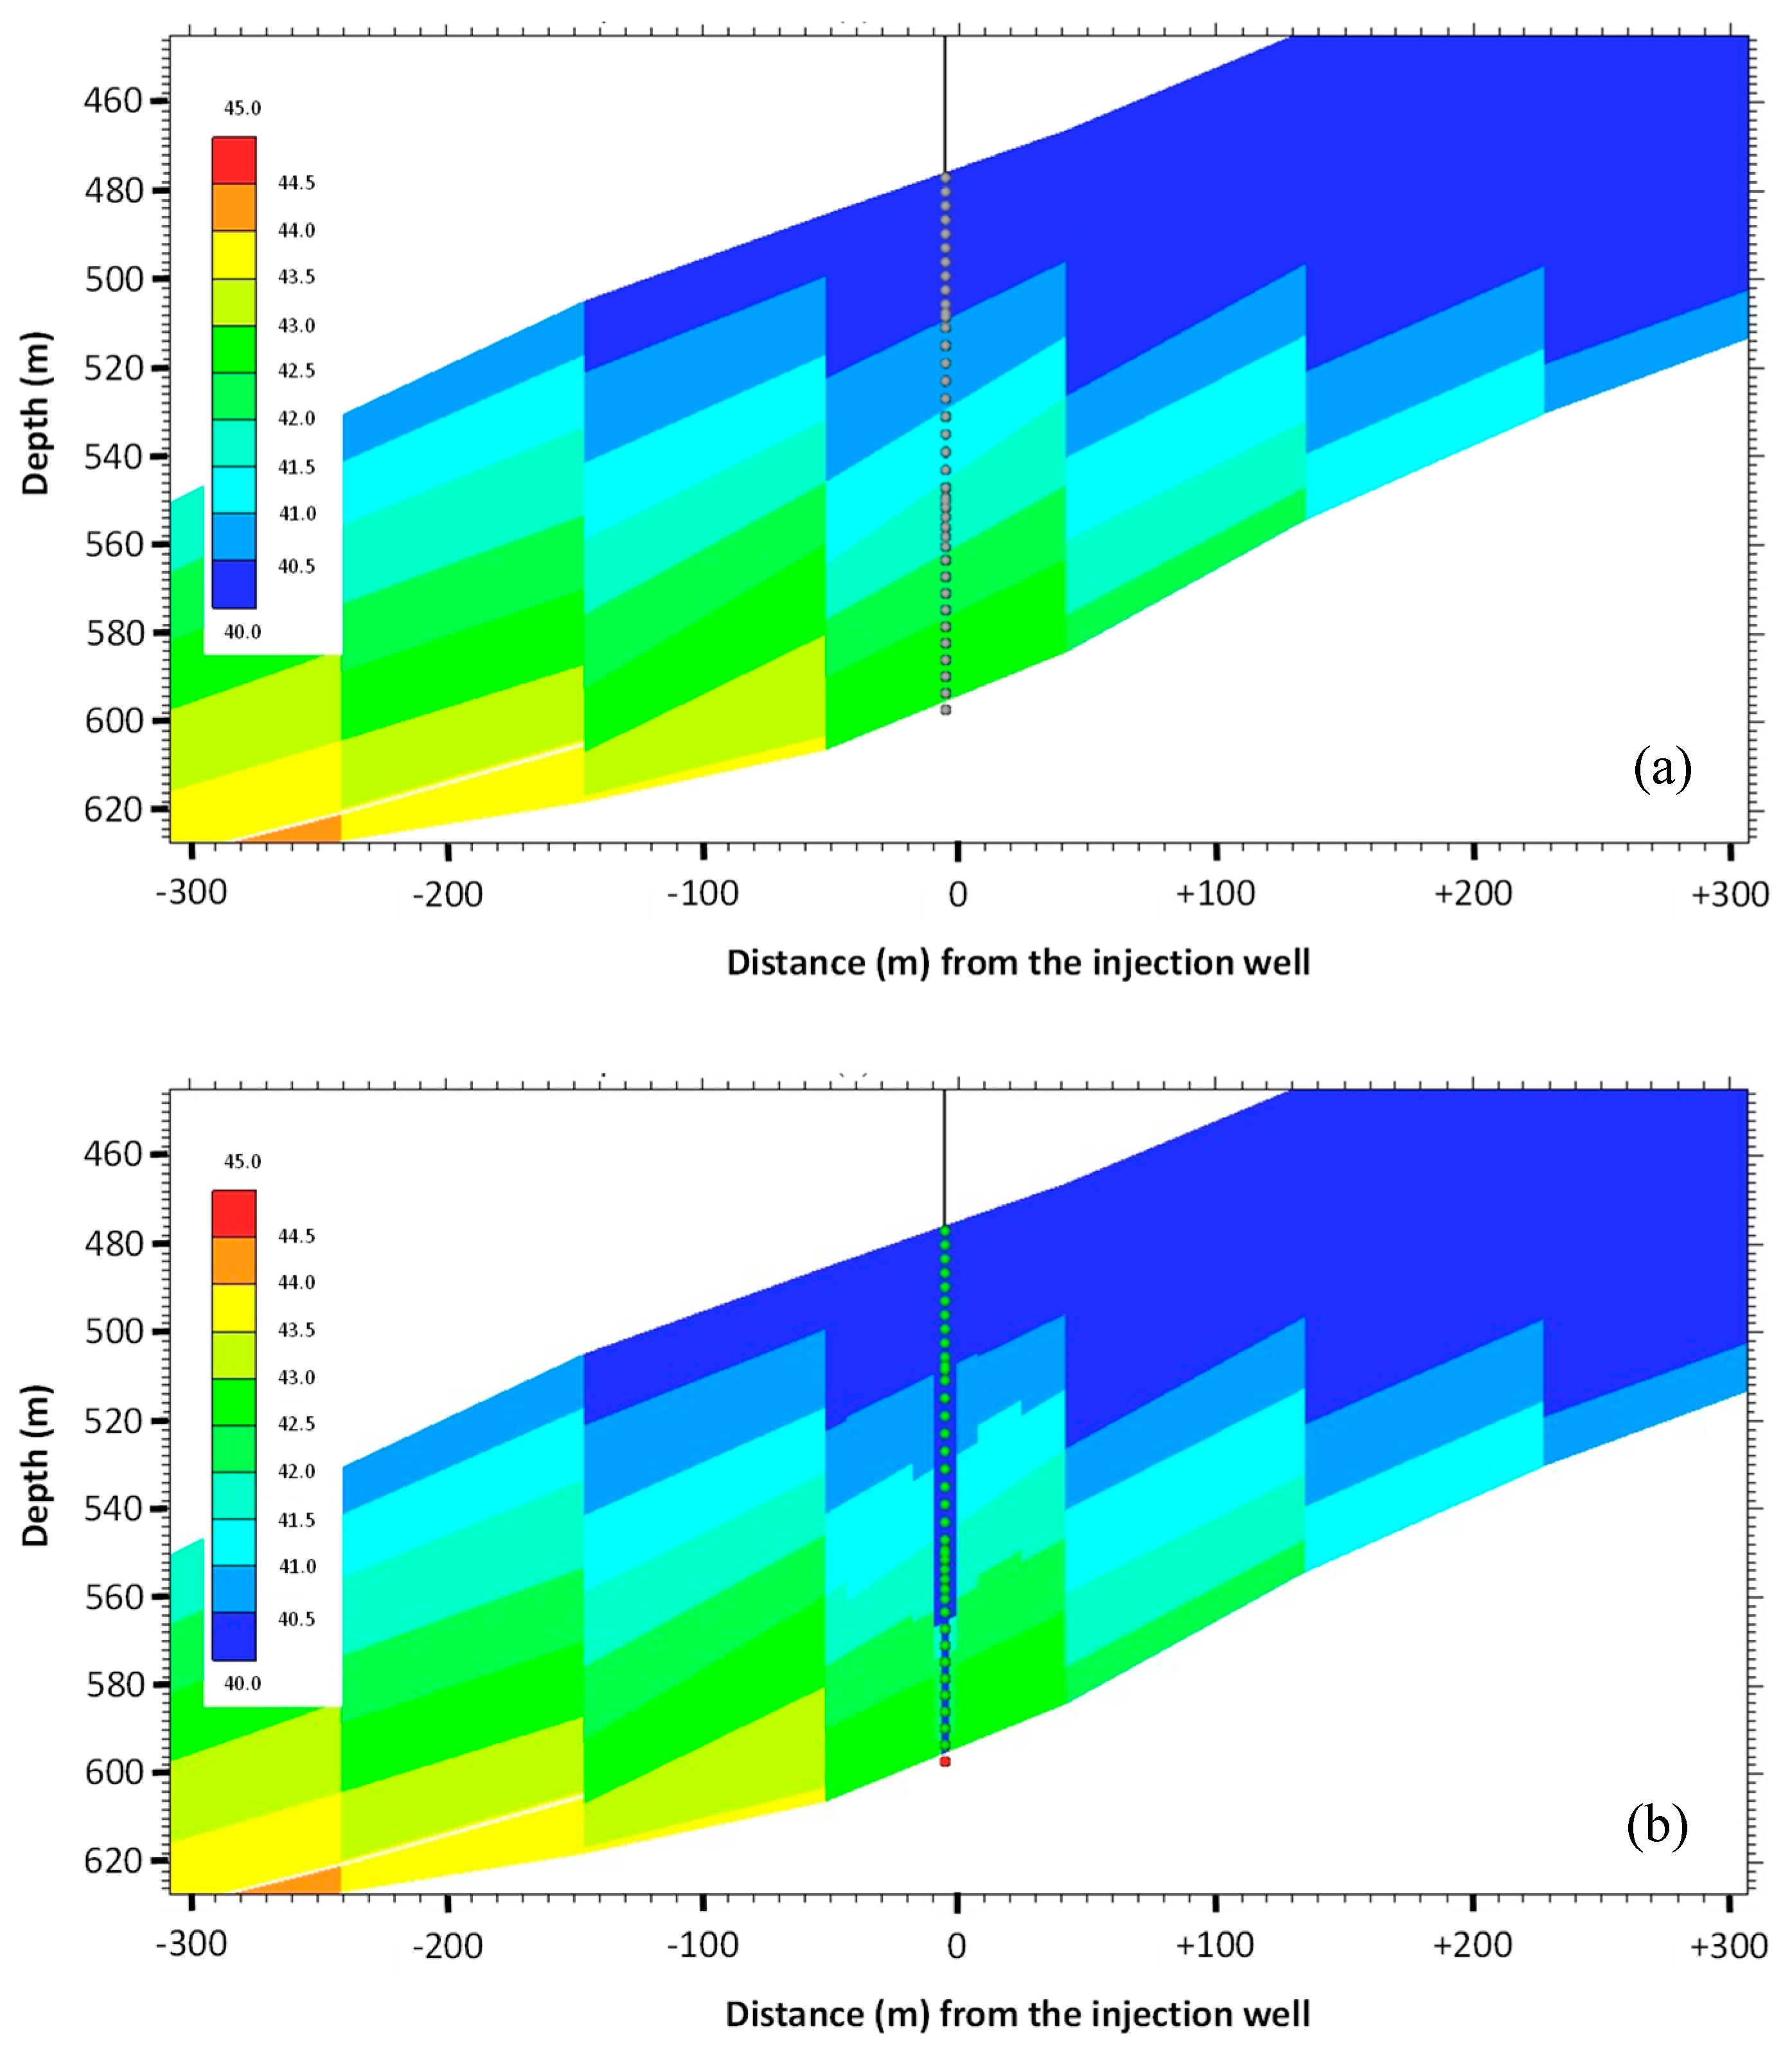
During the injection tests described in chapter 3, the CO
2 migrates about 80 m away from the injection well (as shown in
Figure 13) by the changes of the CO
2 saturation in the fracture around the well. The temperature changes due to the injection are limited to the near wellbore region, as shown in
Figure 14, due to the thermal inertia of the reservoir rock. The pressure disturbance shown in
Figure 15 extends further away from the injection well than for the CO
2 saturation front.
The local pressure increase only extends as far as the CO
2 migration and relaxes quickly in the model. The pressure relaxation at the well (see
Figure 10) in the model is always faster than in the pilot, which indicates that the aquifer response to pressure is too strong in the model. The permeability and porosity distributions of the geological model developed by Le Gallo and de Dios [
30] appears to be too continuous around the injection well, which allows for the fast pressure response of the aquifer. To improve the dynamic response of the model, the heterogeneity of the geological model should be revised as planned in the ENOS project. The history matching approach enables the tuning of the multiphase flow parameters around the injection well. However, their far-field values remain uncertain as the investigated distance (see
Figure 15) is less than 100 m from the well.
6. Discussion
The injection tests conducted so far in Hontomín within the ENOS project aimed to better understand the fractured reservoir behavior to improve the hydrodynamic stability and preserve the seal integrity. The alternative injection of brine and CO
2 involves multiphase flow hysteresis in the reservoir fracture network. This fact produces changes on the bottom hole pressure and flow rate injected on site due to the fluid properties and the injection sequence used, which induced an injectivity decrease during the testing period. Ghahfarokhi et al. [
37] concluded similar conclusions for porous mediums in their study of the SACROC EOR project in Texas (USA).
Tests conducted in the pressure control mode reveal the decrease of injected flow to hold the
WHP value constant. On the other hand, tests conducted in the flow rate control mode showed the pressure increases at the well-head to hold a constant flow rate value. The discussion is focused on whether these results correspond to wellbore effects in the short-term, as de Dios et al. [
11] proposed according to the results from Hontomín hydraulic characterization, or whether they set a trend on the long-term behavior of the pair seal-reservoir [
37].
Something similar happens with the pressure recovery period during the reservoir fall-off phase, which plays a key role in determining the hydraulic stability, as Kelley et al. [
38] demonstrated with the experiences from the MRCSP CCS Project in Michigan (USA). The terms of the
BHP recovery depend on fluid transmissivity through the fracture network, which usually produces a slower pressure recovery than in the porous medium [
11,
38], as it happens in the case of the study as well. The recovery term also depends on the alternative injection (brine/CO
2) [
37] because of the different hydraulic properties of each fluid (relative permeability) in the fractures [
19] and on the cumulative CO
2 injected on site. Therefore, it is also necessary to demonstrate if this recovery trend is due to short-term effects occurred in the well vicinity or corresponds to the long-term behavior of the reservoir.
The CO
2 injections were performed in the liquid phase, which is an efficient operation. However, the injected fluids cooled the pair seal-reservoir, which may produce impacts that put the integrity of the rock formations at risk due to the additional stresses produced by the thermal extension-contraction in the aquifer, as the simulations developed by Gor and Prévost [
39] using a thermo-poromechanical model showed. The heat transfer between the reservoir rock and the biphasic fluid needs to be investigated in order to test the long-term viability of the pair seal-reservoir, as Somaye et al. [
40] proposed according to the experiences from the Ohio River Valley Project in West Virginia (USA). Particularly, the changes induced in the geomechanical properties of the rock massif and fractures must be studied to better understand the behavior of these reservoirs during the injection, assuring the seal integrity.
The advanced modeling was developed as an initial characterization work in order to tune the model to the injection tests conducted during the hydraulic characterization phase, described by de Dios et al. [
11]. The geological model that was built up within ENOS was based upon the previous work developed by Le Gallo et al. [
19] and updated by Le Gallo and de Dios [
30] to account for a recent characterization of geological heterogeneities. The dynamic model was set up as a dual permeability and porosity media whilst considering the temperature effects and relative permeability hysteresis to account for the various operations planned to be conducted and the geological context. The fracture hydraulic characteristics control the pressure response of the reservoir. Therefore, the fracture permeability and porosity and the fracture relative permeability are the key parameters to match the model, as shown in
Figure 8 and
Figure 11. The bottom hole pressure match is quite satisfactory, nevertheless, updates and refinements are needed mainly due to the existing mismatches between the field and simulation during the fall-off period, as the simulated pressure always returns faster than the measured to its base level. The foreseen improvement of the model will include a better characterization of the heterogeneities in the fractures to better reproduce the pressure response of the formation as initiated in the ENOS project.
7. Conclusions
The results from the first not-continuous injection tests conducted in the ENOS project confirm that the fluid migration is through the carbonate fractures. Thus, when the pressure remains constant at the well-head with a value equal or higher than 75 bar for assuring the liquid CO2 injection, the flow rate decreases considerably as brine and CO2 expand within the fracture network, producing multiphase flow hysteresis and reaching values up to 23% lower than the initial. On the other hand, when the flow rate value is constant during the injection, the pressure highly increases as a lot of CO2 is injected on site, reaching values up to 30% higher at the well-head.
The BHP incremental at the end of the tests is not proportional to the WHP increase because of a drop pressure valve (choke) was installed in the HI well tubing to limit the pressure at the bottom hole during the injection and, thus, preserve the integrity of the pair seal-reservoir. Moreover, the BHP remained constant in the observation well along the injections, which proves that there was no hydraulic transmissivity through the seal.
The period of time needed for the pressure recovery at the bottom hole during the fall-off phase depends on the injected fluid due to the different hydraulic properties of CO2 and reservoir water, and the cumulative amount of CO2 existing on site. Thus, a period of 15 days to recover 98% of the initial BHP value was needed for the CO2 injection while, in similar tests conducted only with brine, the recovery period was close to 10 days. This fact may be because the supercritical CO2 is a compressible fluid affected by the closure of fractures during the fall-off periods conditioning the biphasic migration of CO2 and brine through the fracture network. Likewise, as much CO2 is injected on site, the pressure increases and longer recovery periods are necessary.
Thermal profiles and the BHP evolution corresponding to the injections confirm that liquid CO2 was injected along the tubing, which corresponds with efficient operation, reaching values of 160 bar and 32 °C for the pressure and temperature at the bottom hole, respectively, and a fluid density value of 0.828 t/m3. The gradual cooling of the reservoir was from 44 °C to 32 °C, considering that the well-head holds an average temperature value of 10 °C during the CO2 injection. Most of the relevant temperature decreases at the bottom hole happened because of the brine injection, initially to pressurize the well and, subsequently, to clean up the tubing when the CO2 injection is finalized.
The modeling developed so far shows a small lateral extension of the CO2 away from the injection well during the tests of 80 m, with an even smaller extension of the temperature disturbance limited to the near wellbore region. As for most of the CO2 storage projects in the aquifers, the main impact is the extension of the pressure disturbance that drives the CO2 migration. The future modeling work shall focus upon the pressure fall-off periods, which appears faster in the model than in the field. To improve the dynamic response, the heterogeneity of the geological model must be revised. It is expected that the updated modeling will provide far-field values for a longer distance than the actual 100 m length from the injection well, covering a representative area of the pair seal-reservoir.
The methods and results described and analyzed in this article correspond to the first injection tests conducted in ENOS. New injections during several days will be performed at Hontomín within the project. The expected outcomes will be used to update the operating strategies described in the article and to design the control procedure to monitor the storage integrity. Likewise, the outcomes will give information for setting the pressure recovery period to ensure a safe re-start of the injection. Other types of tests using cold CO2 (temperature below 10 °C) will be designed and performed for finding efficient operating parameters that are consistent with the process safety. The results from the future injections will also be used to refine the modeling developed so far for investigating the CO2 plume migration and trapping mechanisms.


