Abstract
Colloidal shear thickening fluids (STFs) have applications ranging from commercial use to those of interest to the army and law enforcement, and the oil industry. The theoretical understanding of the flow of these particulate suspensions has predominantly been focused through detailed particle simulations. While these simulations are able to accurately capture and predict the behavior of suspensions in simple flows, they are not tractable for more complex flows such as those occurring in applications. The model presented in this work, a modification of an earlier constitutive model by Stickel et al. J. Rheol. 2006, 50, 379–413, describes the evolution of a structure tensor, which is related to the particle mean free-path length. The model contains few adjustable parameters, includes nonlinear terms in the structure, and is able to predict the full range of rheological behavior including shear and extensional thickening (continuous and discontinuous). In order to demonstrate its capability for complex flow simulations, we compare the results of simulations of the model in a simple one-dimensional channel flow versus a full two-dimensional simulation. Ultimately, the model presented is a continuum model shown to predict shear and extensional thickening, as observed in experiment, with a connection to the physical microstructure, and has the capability of helping understand the behavior of STFs in complex flows.
1. Introduction
Colloidal solutions consist of a liquid, Newtonian or viscoelastic, in which solid particles (with diameters ranging from 2 to 1000 nm) are suspended, so that the particles are large compared to the lengthscale of the fluid microstructure, but small enough to be affected by Brownian motion. At low concentrations, colloidal fluids are approximately Newtonian, however, with increasing concentrations they show complex rheological behavior including shear thinning or thickening and glass-like relaxation states. At these higher concentrations the complex rheological responses are due to hydrodynamic interactions between particles at high flow rates. The focus of this work is building towards to a continuum model that captures the shear thickening behavior.
Colloidal shear thickening fluids (STFs) have exciting applications ranging from commercial use (e.g., polymeric binders for paints) to those of interest to the army and law enforcement (e.g., soft body armor) and more [1]. For example, it has been shown experimentally through ballistics tests [2] and “stabbing” tests [3] that, in the application to body armor [4], the frequency response of certain shear thickening fluids (STFs) allows a fabric interwoven with an STF to stop a projectile or prevent the piercing of a knife while also being light and flexible enough to provide full body protection. These fluids also have a possible use in the oil recovery industry. A novel microfluidic device has recently been developed to simulate flow through a sandstone core similar to that which would occur during chemical injection [5]. In this work, a series of experiments were devised to investigate the efficiency of several different liquid materials on their ability to remove oil from capillaries and pores. Using water as the baseline, they investigated how different rheological properties affect oil recovery. In particular, it was shown that shear thickening fluids show great promise for enhanced oil recovery in the future [5].
A key feature of the flows in these applications is a mixture of shear and extensional kinematics. Although the shear rheology of thickening suspensions are well understood, the extensional rheology of these suspensions remains mostly unexplored. Only a very limited number of experimental studies have investigated the response of shear thickening suspensions to extensional flows [6,7,8,9,10,11]. Two of these studies [6,7] focused on measuring the steady state extensional response of shear thickening suspensions. In both cases, the steady state extensional viscosity as a function of extension rate shows sharp extensional thickening transition very similar to shear flows. In [6], they confirmed by small-angle light scattering measurements in a hyperbolic contraction that the increase in viscosity is likely due to the formation of strings and clusters ordered in the flow direction, which is one possible mechanism responsible for the shear thickening response. A more recent, and now widely accepted key ingredient for these responses, in particular for discontinuous shear thickening, is stress-induced frictional contacts between particles [12,13], which has been recently simulated under extensional flow using particle dynamics [14].
A key challenge of suspension mechanics is the generation of a constitutive model that can be used for complex flows [5,15,16,17], which are not practical using detailed particle simulations [4,13,18,19,20,21,22,23]. Such a constitutive model would need to take into account the underlying mechanisms of shear and extensional thickening, as well as the construction and destruction of microstructure by flow [24]. To tackle this challenge, recent work has focused on developing constitutive models that describe the evolution of the microstructure of particle suspensions coupled with general equations for fluid flow [25,26,27,28,29,30,31,32,33]
In early models [25,26,27,28], particle stress is made explicitly dependent on the microstructure through the consideration of a local conformation tensor that is inspired from the orientation distribution tensor defined for dilute fiber suspensions [34]. Hand [35] formulated a general representation theorem for the total Cauchy stress tensor in terms of the conformation tensor and the deformation rate tensor. Barthés-Biesel and Acrivos [36] show that Hand’s approach is applicable for a number of different suspension types as long as a suitable microstructure tensor is available. For concentrated suspensions of spherical particles, Phan-Thien [25] proposed a differential constitutive equation for the conformation tensor based upon the unit vector joining two neighboring particles, thereby encoding a direct connection with the pair distribution function. Later, Phan-Thien et al. [26] went further with a micro-macro model inspired from statistical mechanics for the constitutive equation of the conformation tensor, but no quantitative comparisons were obtained. In 2006, Goddard [28] revisited this approach, and proposed a model involving 12 material parameters and two tensors for describing the anisotropy. Stickel et al. [27,37,38] defined the conformation tensor on the base of a directionally-dependent particle mean free path, and simplified the expression of the stress to be linear in the deformation rate and the conformation tensor, involving 13 free parameters. All of the tensorial models are, by construction, frame-invariant and potentially applicable to arbitrary flow geometries and conditions. One downside to these models is that they contain ad hoc terms and require the tuning of associated fit parameters with little physical meaning. As a result they provide limited insight into the dynamics of the microstructure and the link with the suspension stress, furthermore Chacko et al. [39] showed that these types of model fail to properly describe the dynamics of the fabric tensor under shear reversal. They attributed this to the fact that, while a second-rank tensor captures reasonably well the microstructure in steady flows, it gives a poor description during significant parts of the microstructural evolution following shear reversal. Other purely macroscopic continuum models have been developed that describe the evolution of the volume fraction, , of particles under flow with phenomenological descriptions of the stresses and viscosity as a function of [12,30,32,40,41,42]. While these models do not account, explicitly, for the microstructure, they could, coupled with a model describing the microstructure, help serve as the basis of a two-fluid model, e.g., [38].
More recent theories have focused on deriving constitutive models that reduce the number of free parameters and provide a more direct connection with the microstructure of non-colloidal suspensions [31,33]. Ozenda et al. [31] proposed a new, minimal tensorial model representing the role of microstructure on the viscosity of non-colloidal suspensions of rigid particles. Their model qualitatively reproduces several of the main rheological trends exhibited by concentrated suspensions: anisotropic and fore-aft asymmetric microstructure in simple shear and transient relaxation of the microstructure toward its stationary state. The model contains only a few model parameters, which have physical meaning, and can be identified from comparisons with experimental data. Gillissen and Wilson [33] developed a model for the microstructure and the stress of dense suspensions of non-Brownian, perfectly smooth spheres. These quantities are defined in terms of the second-order moment of the distribution function of the orientation unit vector between hydrodynamically interacting particles. The model is developed from first principles, and the evolution equation for the microstructure contains a source term that accounts for the association and the dissociation of interacting particle pairs.
All of these models have focused primarily on non-colloidal solutions, and have yet to capture the strong shear and extensional thickening behavior observed in many particulate suspensions. The goal of this paper is therefore to provide a continuum-level constitutive equation for the stress in colloidal suspensions that explicitly accounts for the evolution of its microstructure during flow. Unlike the most recent models, the focus of this work is on colloidal solutions that exhibit nonlinear rheological behavior, in particular shear thickening. We have modified the constitutive model developed by Stickel et al. [27] by including terms nonlinear in the structure while also greatly reducing the number of free parameters. By varying free parameters, the modified model can predict shear thinning, both continuous and discontinuous shear thickening under shear flow, and extensional thickening under planar extensional flow. We further provide a first insight into the simulation capabilities of the model by conducting simulations in a straight channel and comparing a simple one-dimensional approximation with a more detailed, two-dimensional simulation. The agreement between the simulations, together with the model’s ability to capture the nonlinear rheological signatures means that the model is suitable for capturing the response of such materials via simulations in complex geometries.
2. Materials and Methods
SPPC Model
In the Stickel-Phillips-Powell (SPP) [27] model, structure is defined in a suspension in terms of the average distance that a test particle can move in a direction denoted by the unit vector before colliding with another particle. A dimensionless structure function is then defined inversely proportional to this mean free-path length. Using a functional expansion with spherical harmonics as the basis set written in terms of a Cartesian tensor, the structure may be described as a spherical surface represented by a symmetric, second order tensor, . In equilibrium, the structure is in an isotropic state given by:
where is the volume fraction of particles and is the maximum packing fraction. Under flow, the structure evolves according to
where
is the corotational derivative representing the time derivative in a reference frame rotating with the local vorticity; the corotational derivative has been defended as an appropriate choice for particulate suspensions [35]. The strain rate and vorticity tensors are respectively given by
General forms of the function on the right side of Equation (2) that satisfy the constraint of frame indifference are well known [43] and form the basis of, for example, the second-order fluid constitutive model. For hard-sphere suspensions of particles at low Reynolds number, a linear dependence on the rate of strain is expected because of the linearity of the Stokes equations. Under these assumptions, the equation governing the structure in the SPP model is given by:
In the interest of simplicity, terms nonlinear in the structure tensor are also neglected, i.e., . As noted in the original paper [27], keeping these terms permits the existence of multiple steady-state structures for a given rate of deformation that may allow for stick-slip behavior or sudden jamming.
In order to generate a model with less adjustable parameters, while including terms nonlinear in the structure, that will allow for predictions of strong shear thinning and thickening, the following modification of the SPP model, called here the SPPC model, is proposed:
where is the magnitude of the strain rate tensor. In order to directly relate back to the SPP model, we have kept the names of the constant coefficients the same. On the right hand side (RHS) of the modified equation, we have eliminated several constants, and the first three terms are similar to the original model formulation. For the first term on the RHS, we have simplified the relaxation of the material back to its isotropic state by eliminating the parameters in the SPP model. The term linear to the strain rate in the SPP model does not play a significant role in the development of nonlinear rheological behavior, thus we have neglected this term (). The terms proportional to and were included in the original model formulation, but ultimately neglected in subsequent analysis for simplification reasons. The simplified, original SPP model can predict a slight shear thickening behavior [27], however, the linearity in the structure prevents the prediction of highly nonlinear rheological behavior, such as a strong shear thickening observed in many particulate suspensions. Similar nonlinear terms appear in a model constitutive model by Goddard [28], but parameters were not tested showing shear thickening behavior. As we will show, incorporating these nonlinear terms allow for the capability to predict the complex rheological behavior of shear thickening colloidal solutions.
The SPP model accounts for structure rearrangement that occurs in the absence of flow, such as the relaxation of a Brownian suspension to an isotropic state following cessation of flow, and hydrodynamic diffusion, which is determined by the suspension structure and a diffusion coefficient determined by the local rate of deformation. It also accounts for rearrangements in the structure that are driven by the imposed flow. The function h contains information about long-range repulsive forces and Brownian diffusion. Thus far, the dependence of the function h on the Peclet number, , which contains information about Brownian motion driving the system towards equilibrium, has been neglected. Including this dependence will allow for simulations to probe the complete transition from Brownian (slow flow) to hydrodynamic (fast flow) dominant, similar to the model of [42]. The function h should be inversely related to Peclet number, thus, as an addition to the original SPP model, we assume
The Peclet number describes the ratio of hydrodynamic to Brownian effects
and the dimensionless number is the ratio of hydrodynamic to repulsive forces
where S and F are material parameters having units of time. Here a is the particle radius, and is the characteristic magnitude of the repulsive interaction force. The exponent −1/8 in Equation (8) is the same choice made in the prior work [27,37], which was chosen empirically to match particle simulations and to limit the effect of to a weak singularity in their expression for the stress:
In order to simplify the model further and make it more amenable to complex flow simulations, one major assumption we have made is the stress in the material is a function solely of the structure, i.e., the stress relaxes instantaneously to the local structure of the suspension:
In this formulation, in order to eliminate to direct dependence of the stress on the shear rate, the parameters have units of inverse time. The dependence of the stress on the shear rate comes indirectly through its relationship with the microstructure. The simplification of the stress expression eliminates the singularity in the original SPP model, thus, we could in principle choose any exponent in Equation (8); at this point, we follow the original model.
3. Results
3.1. SAOS
Ultimately, we have reduced the model to six parameters: . While several of these are adjustable, some can be defined from experiment, e.g., small amplitude oscillatory shear. Let thus . For , let , where is the equilibrium structure. Plugging in we find:
which gives:
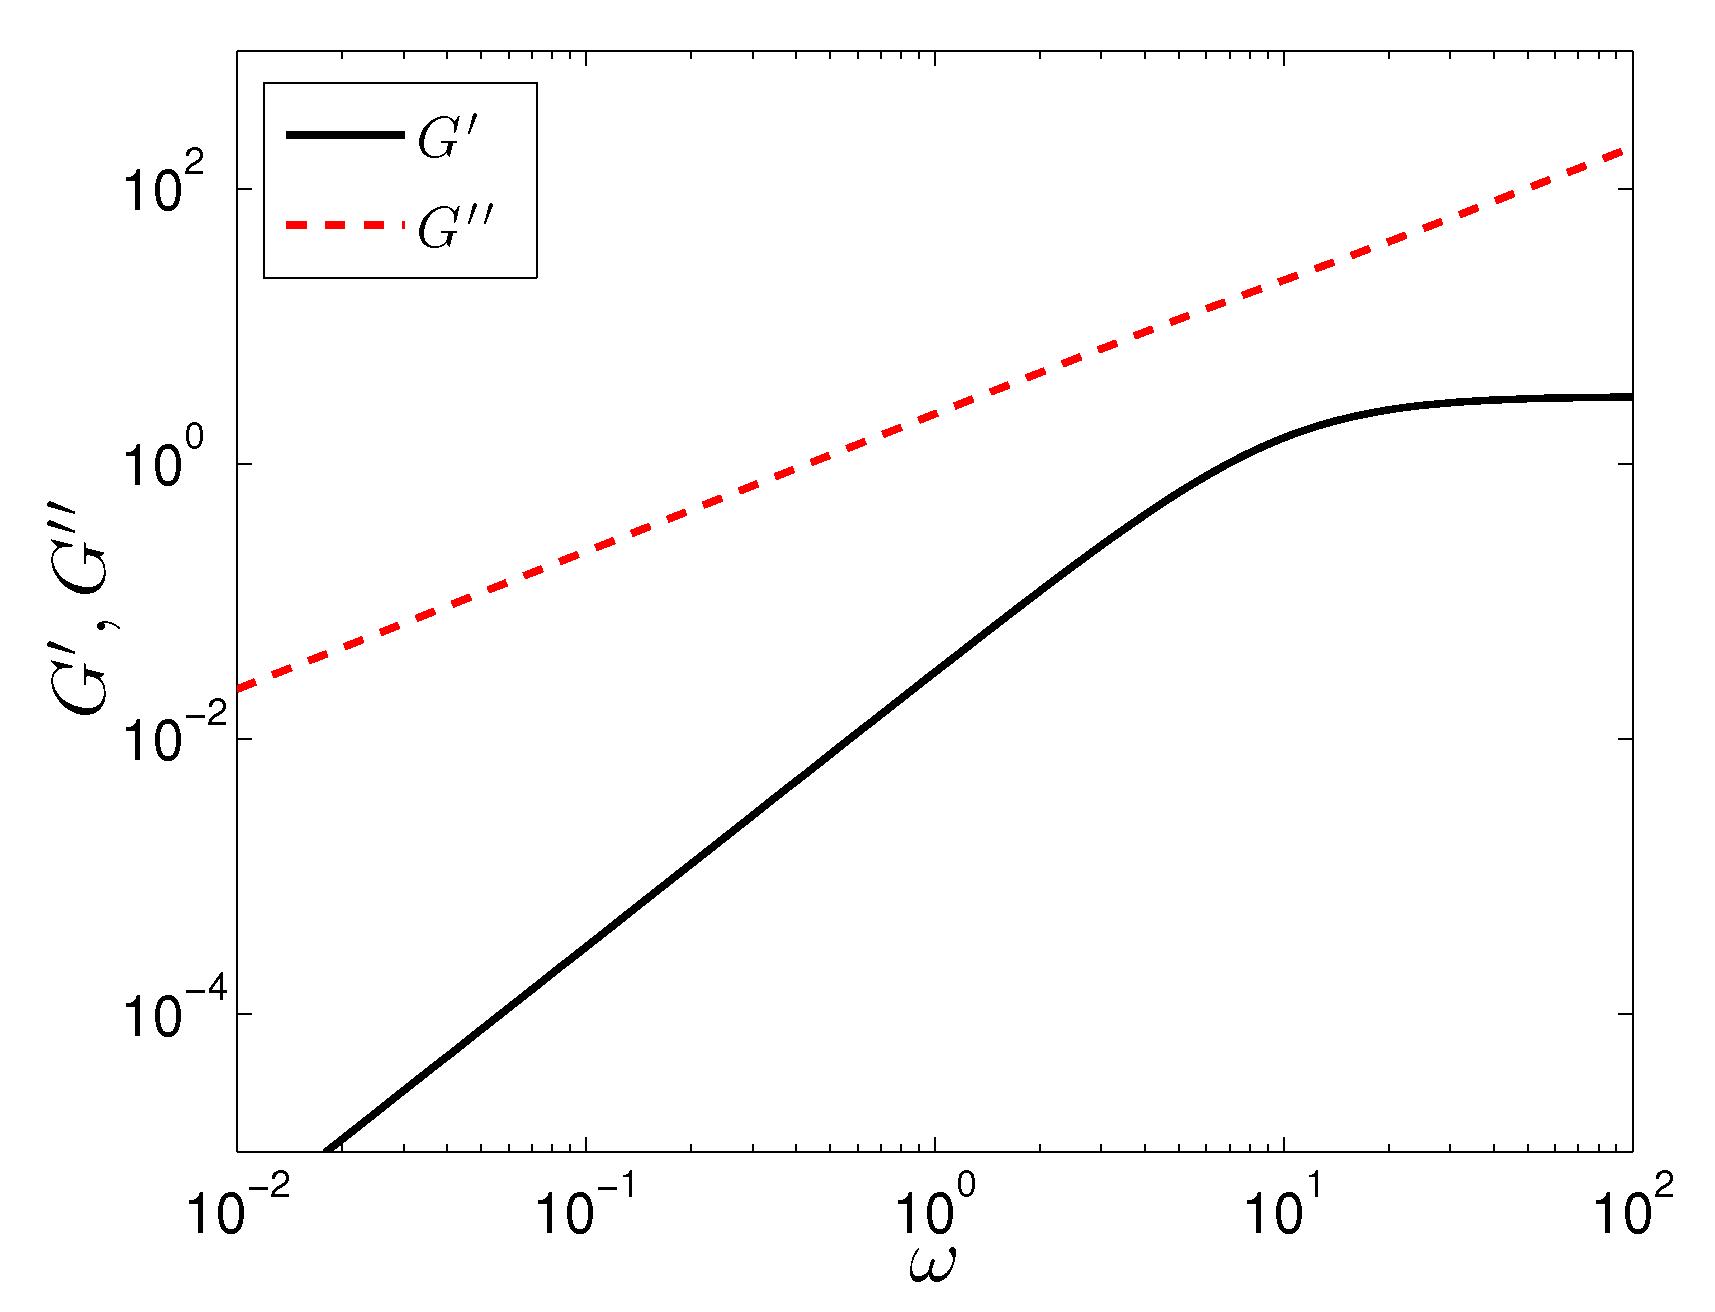
In Figure 1, we plot an example prediction of the storage, , and loss, , moduli predicted by the modified model. The interesting thing to note is that is always larger than , which has been observed in experiment [44], indicating the colloidal dispersion depicts a sol-like behavior consisting of distinct non-flocculated units. The same experiment showed that throughout the frequency range the plot of loss modulus is nearly linear, qualitatively similar to the predictions of the SPPC model. In the SPPC model, plateaus at high frequencies: as , and , i.e., constant and linear at high shear rates, respectively. In the experiment, however, the storage modulus curves upward at high frequency showing that at higher frequencies the material storage capacity increases. While the SPPC model does not predict the behavior of and over the full range of frequencies, that it captures many of the dominant features suggests that it could be useful under nonlinear conditions. Because the model predicts some experimental behavior, there are several features we can state about the model parameters. In particular, if we neglect the term, which we will do throughout much of this paper, it may be possible to extract and from experimental SAOS data. Neglecting , the model, in essence, only has three adjustable parameters, now on the same order as the model by [31].
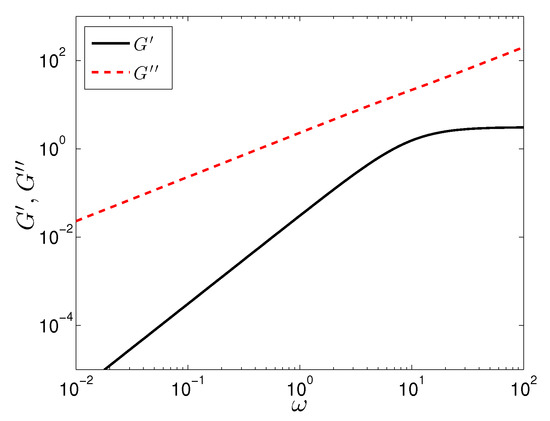
Figure 1.
Storage, , and loss, , moduli as a function of frequency, . Parameter values are: , .
3.2. Non-Linear Rheology
The primary goal of this paper is to present a model that can capture the nonlinear rheological behavior of shear thickening colloidal dispersions. In the following we consider two flows: simple shear flow and planar extensional flow. We assume linear velocity profiles and , respectively, and the resulting system of ordinary differential equations describing are solved in time using the Matlab solver ode45 (Version r2016b, MathWorks, Natick, MA, USA). In the following, we investigate the role of individual parameters in the prediction of nonlinear rheological behavior, in particular to show the full range of the model’s predictive capabilities. The base set of parameters, , , are chosen to align with the SPP model (), and to predict desired qualitative trends, namely shear and extensional thickening, and negative second normal stress difference.
3.2.1. Simple Shear Flow
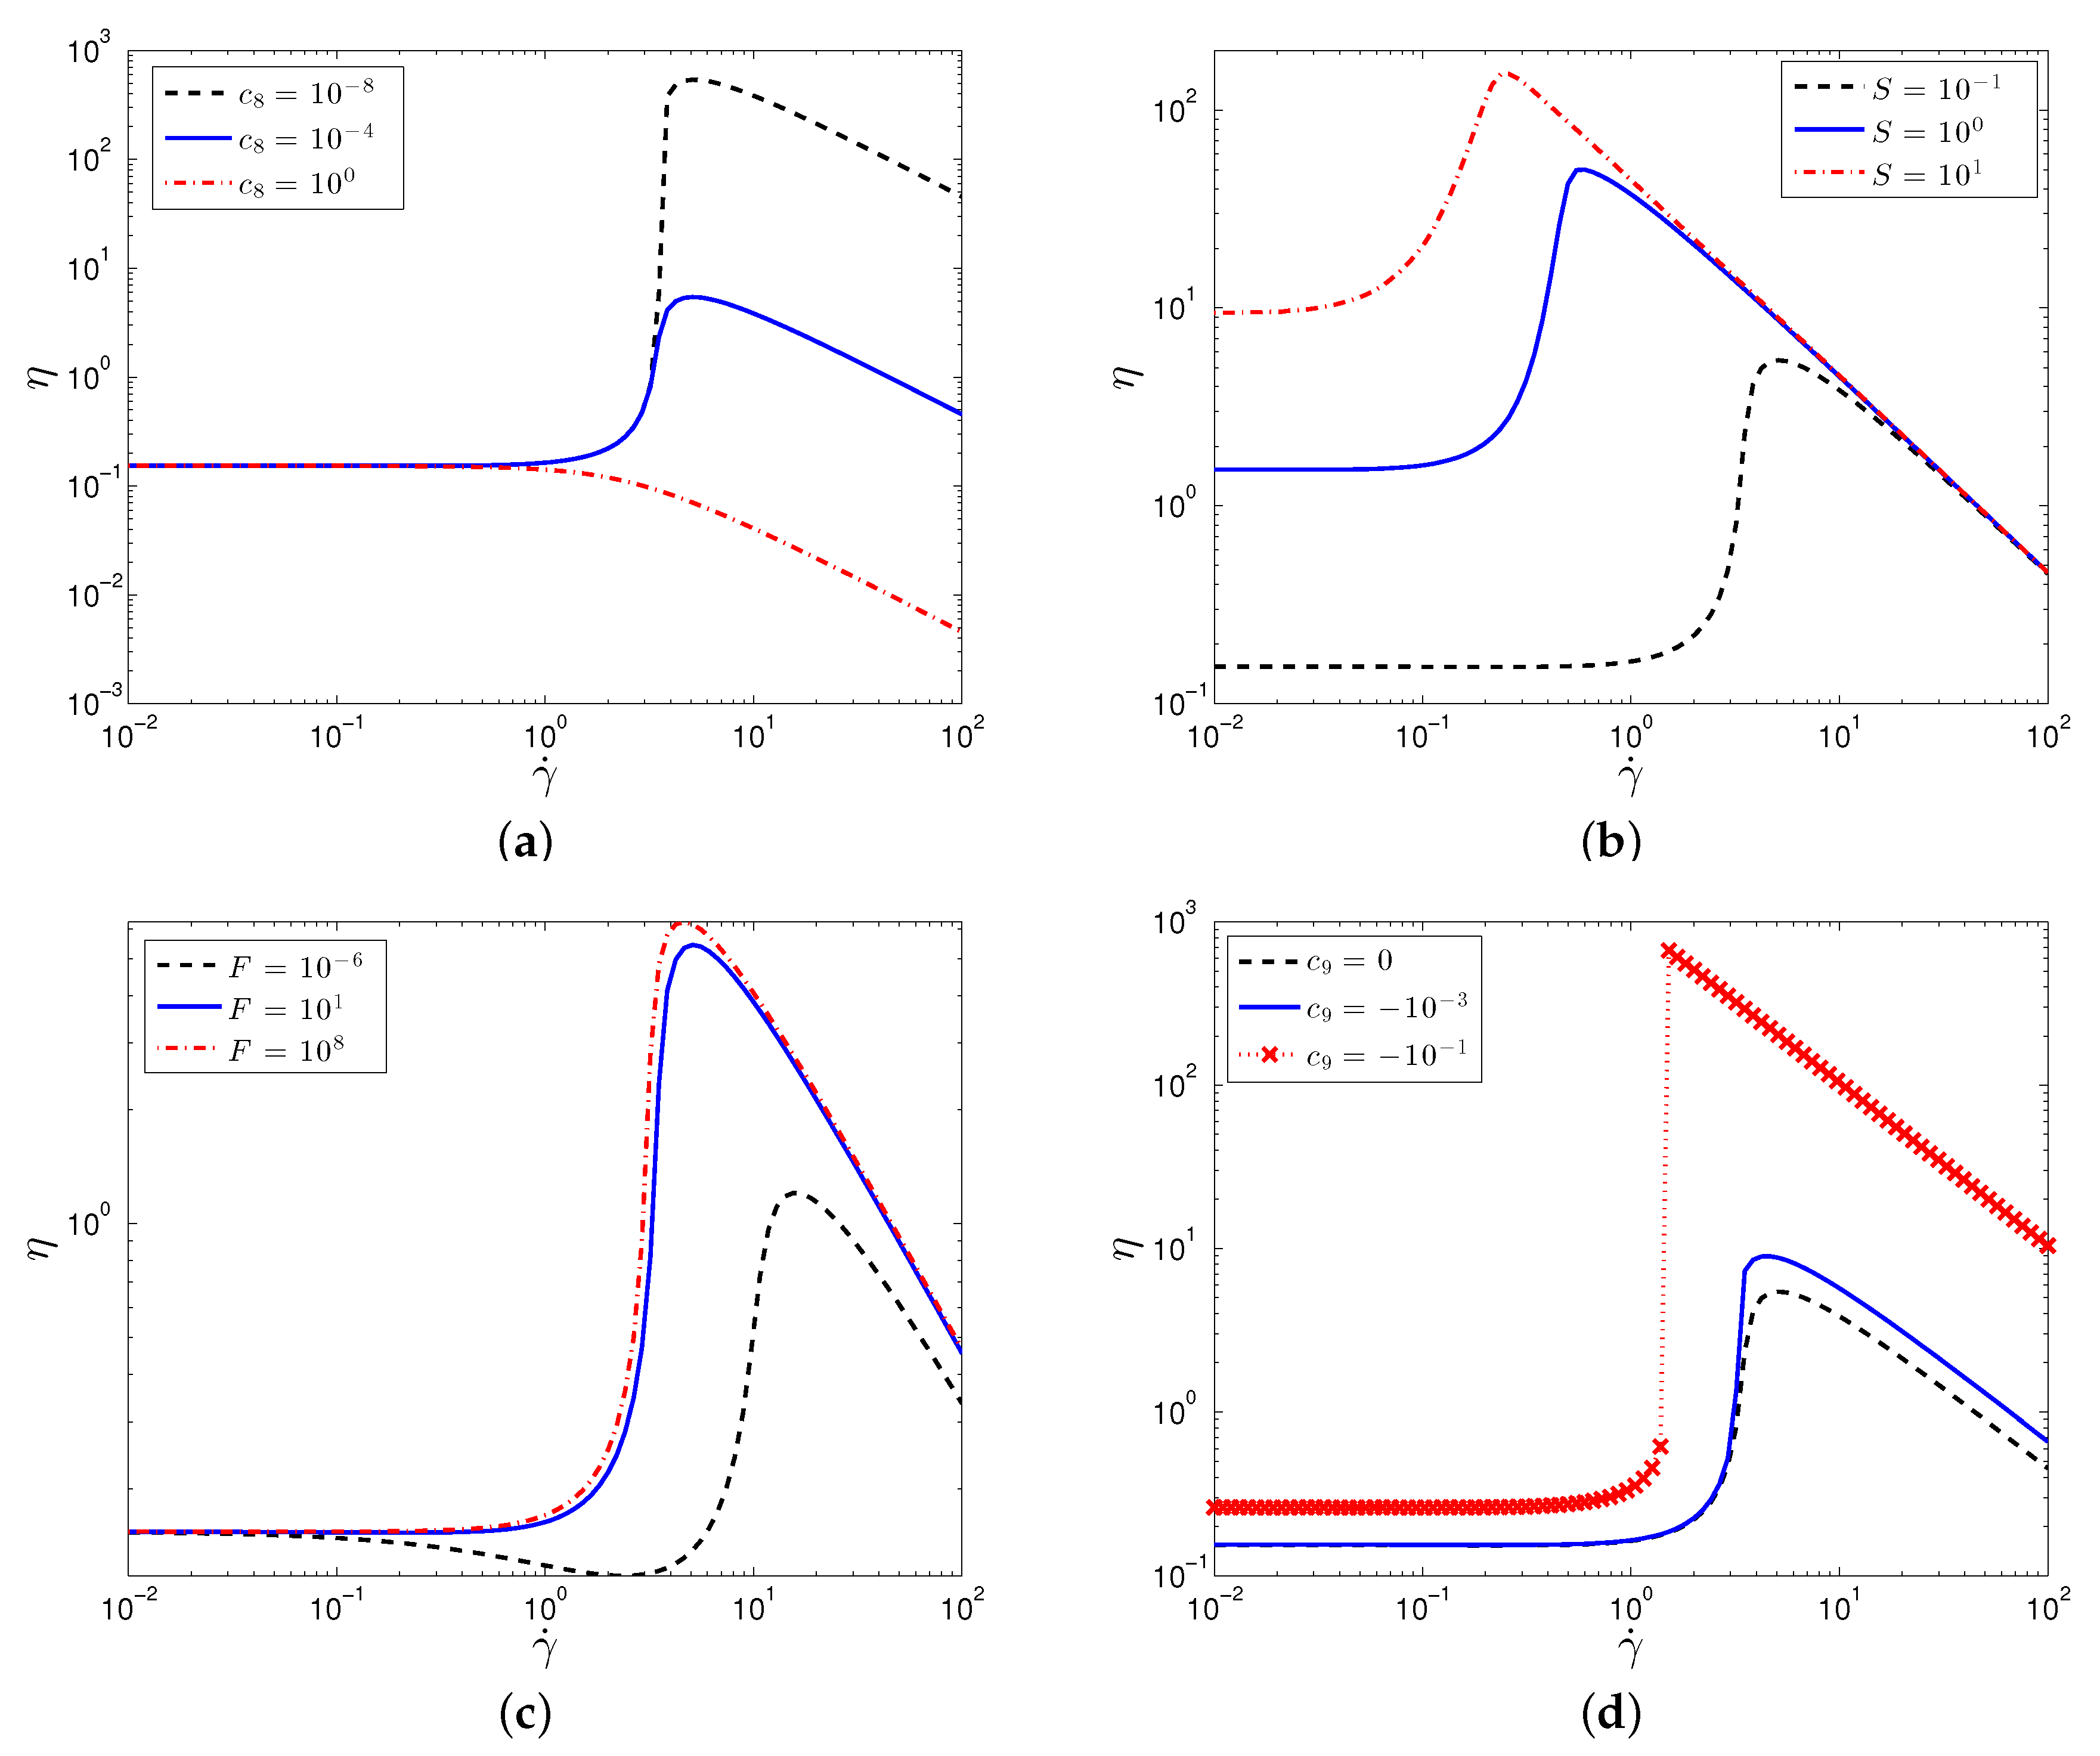
By varying the adjustable parameters, the model is capable of predicting the full range of shear rheological behavior, including shear thinning and shear thickening of various degrees, Figure 2. The results for in Figure 2a–c show a continuous shear thickening (CST) behavior, as observed in experiments, e.g., [45,46,47]). Additionally, at high shear rates, the model predicts a maximum in the viscosity followed by shear thinning behavior [48]. By varying model parameters, the degree and onset of the shear thickening can be controlled. Varying , the coefficient of the term in the SPPC model, the degree of thickening is decreased until eventually predicting shear thinning. Increasing S corresponds to decreasing the contribution of Brownian forces relative to hydrodynamic forces (note that in the original SPP model), and the model predicts that the onset of thickening, a hydrodynamic response, decreases while also decreasing the ratio between the maximum and zero-shear viscosities. Decreasing F corresponds to increasing the repulsive force magnitude relative to hydrodynamic forces, and, as a result, the SPPC model predicts an initial shear thinning prior to the onset of shear thickening for . Including can lead to drastically different predictions, namely a jump in the shear viscosity, i.e., discontinuous shear thickening (DST). This additional feature of the model will allow us the ability to predict and analyze the differences between CST and DST under different flow conditions, while providing motivation for future developments of continuum models for particulate suspensions that incorporate a physical mechanism underlying DST.
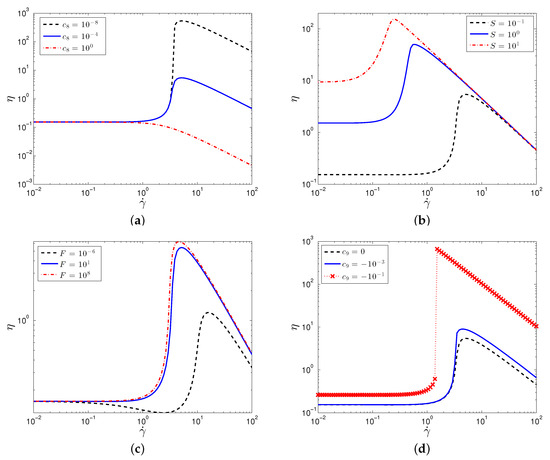
Figure 2.
Plot of the particle contribution to the viscosity, , against shear rate for varying values of (a) , (b) S, (c) F, and (d) . Parameter values are: , .
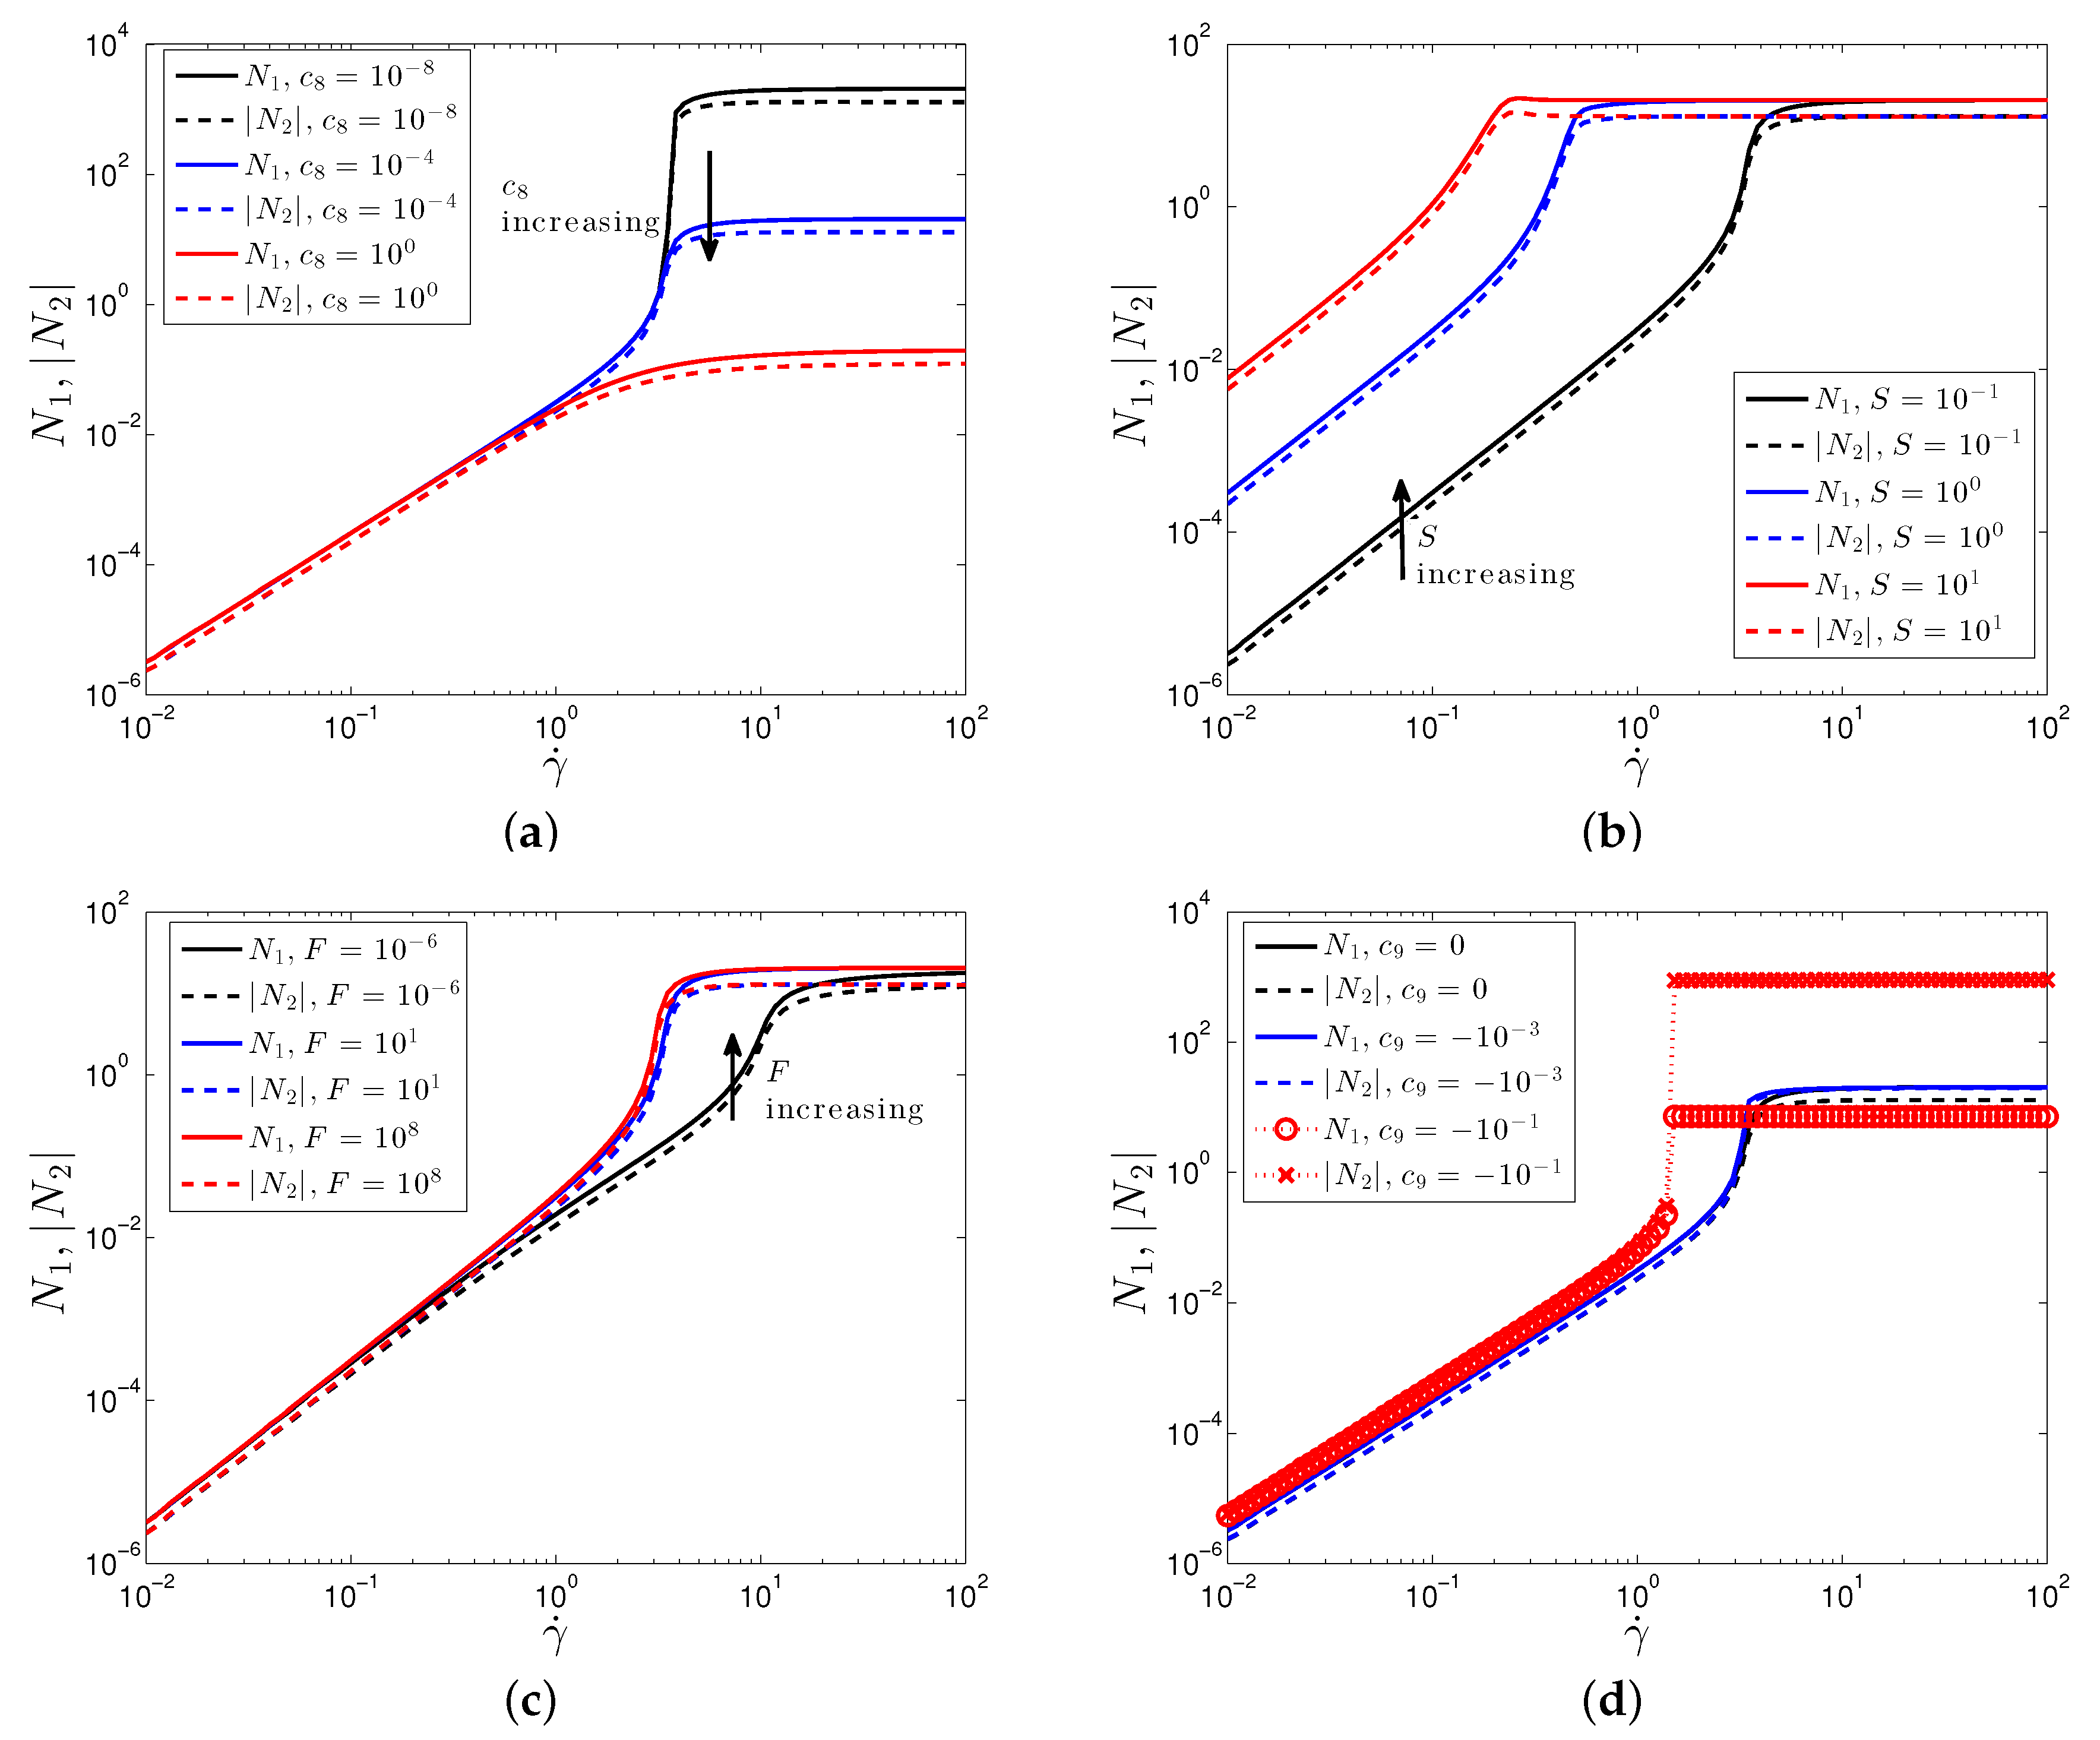
In Figure 3, we plot the first and second normal stress differences, , for the same sets of parameters. The SPPC models predicts and . The latter prediction is consistent with experiments and particle simulations [45]. The sign of is still less well understood [45,47]. Recently, it has been shown that a positive value of is expected for highly dense suspensions, which exhibits a discontinuous shear thickening (DST) behavior, while a negative value of is expected for CST [13,45,47]. In theories and simulations where some limiting degree of Brownian motion and/or interparticle repulsion has been included, is still found to be negative [49,50]. The results are in line with the available experiments, except that the two normal stress differences are predicted to be approximately equal. Simulations that incorporate friction indicate that this can reduce with respect to [50]. More recent simulations have found that these frictional forces for dense suspensions leads to a positive value of [13,23]. The SPPC model is designed for dense colloidal suspensions, thus a positive value of is expected; a more complex relationship between stress, structure and strain rate could lead to varying signs of , however, this would lead to more parameters, and it is potentially less suitable for complex simulations.
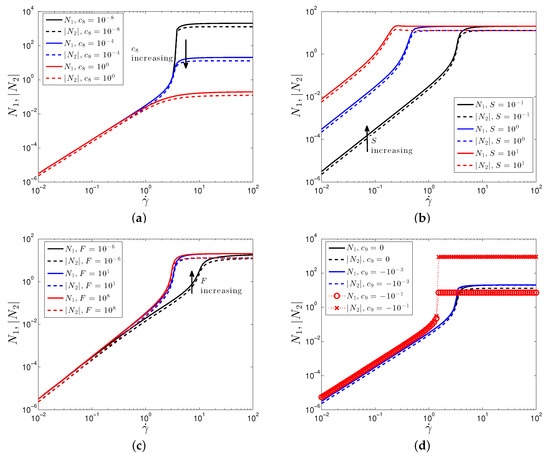
Figure 3.
Plot of the first and second normal stress difference, , against shear rate for varying values of (a) , (b) S, (c) F, and (d) . Parameter values are: , .
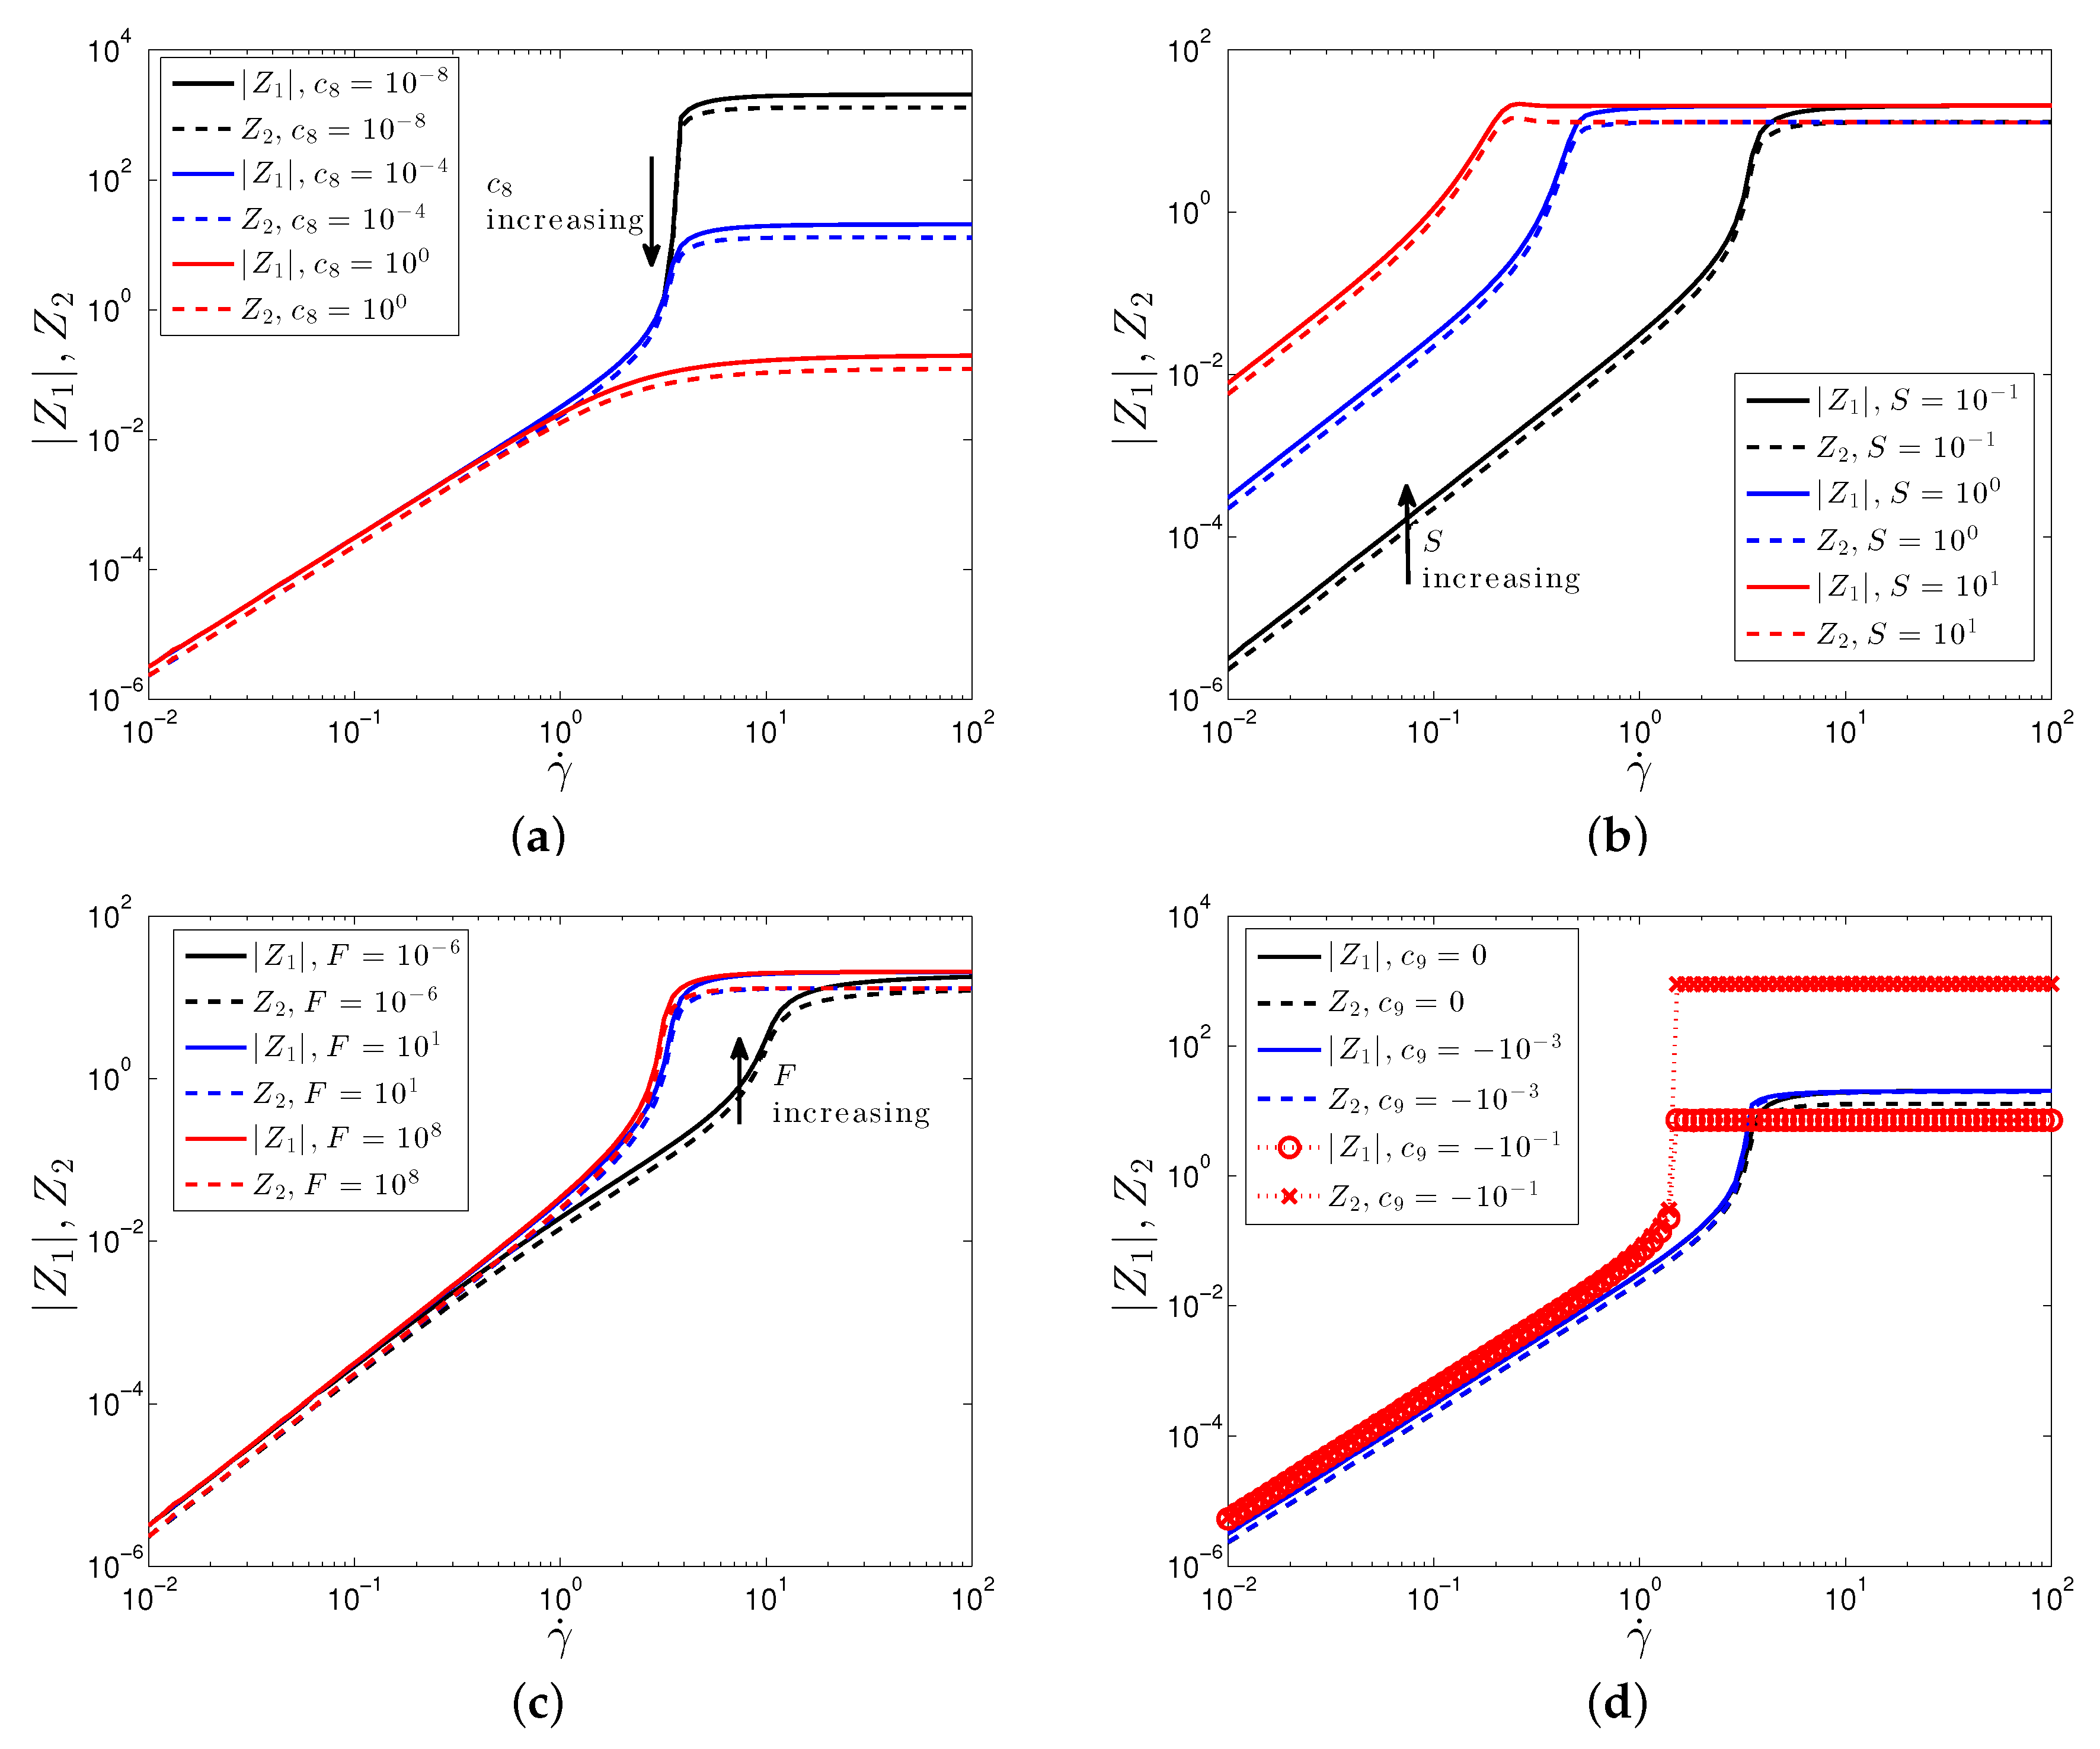
The macroscopic predictions are determined by the evolution of the microstructure described by the SPPC model. The values of the structure tensor ultimately describe the evolution of a spherical surface determined by the proximity of neighboring particles, in particular, larger values of along the diagonal correspond to a larger degree of clustering of particles. The off-diagonal components correspond to a rotation of the cluster. In order to relate the shear thinning and thickening behavior to the microstructure, in Figure 4 we plot the functions and , which are the normal structure differences. The negative and positive values of and , respectively, show that is the largest component of the normal structure components, which indicates that the thickening is due the clustering of particles perpendicular to the flow. The increased difference between and due to the large increase in for the DST result, Figure 4d, suggests that the jump in the viscosity is due to a larger degree of clustering of the particles.
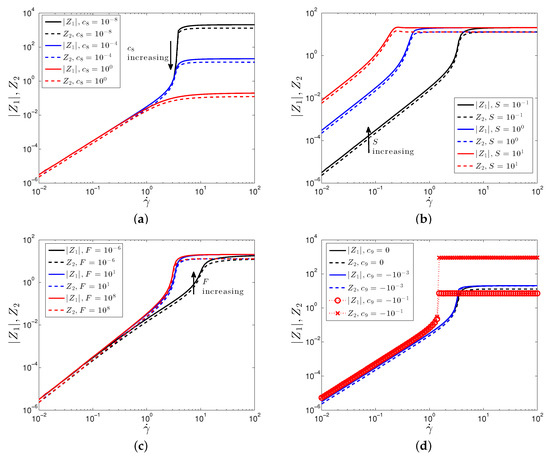
Figure 4.
Plot of the first and second normal structure differences, , against shear rate for varying values of (a) , (b) S, (c) F, and (d) . Parameter values are: , .
3.2.2. Planar Extensional Flow
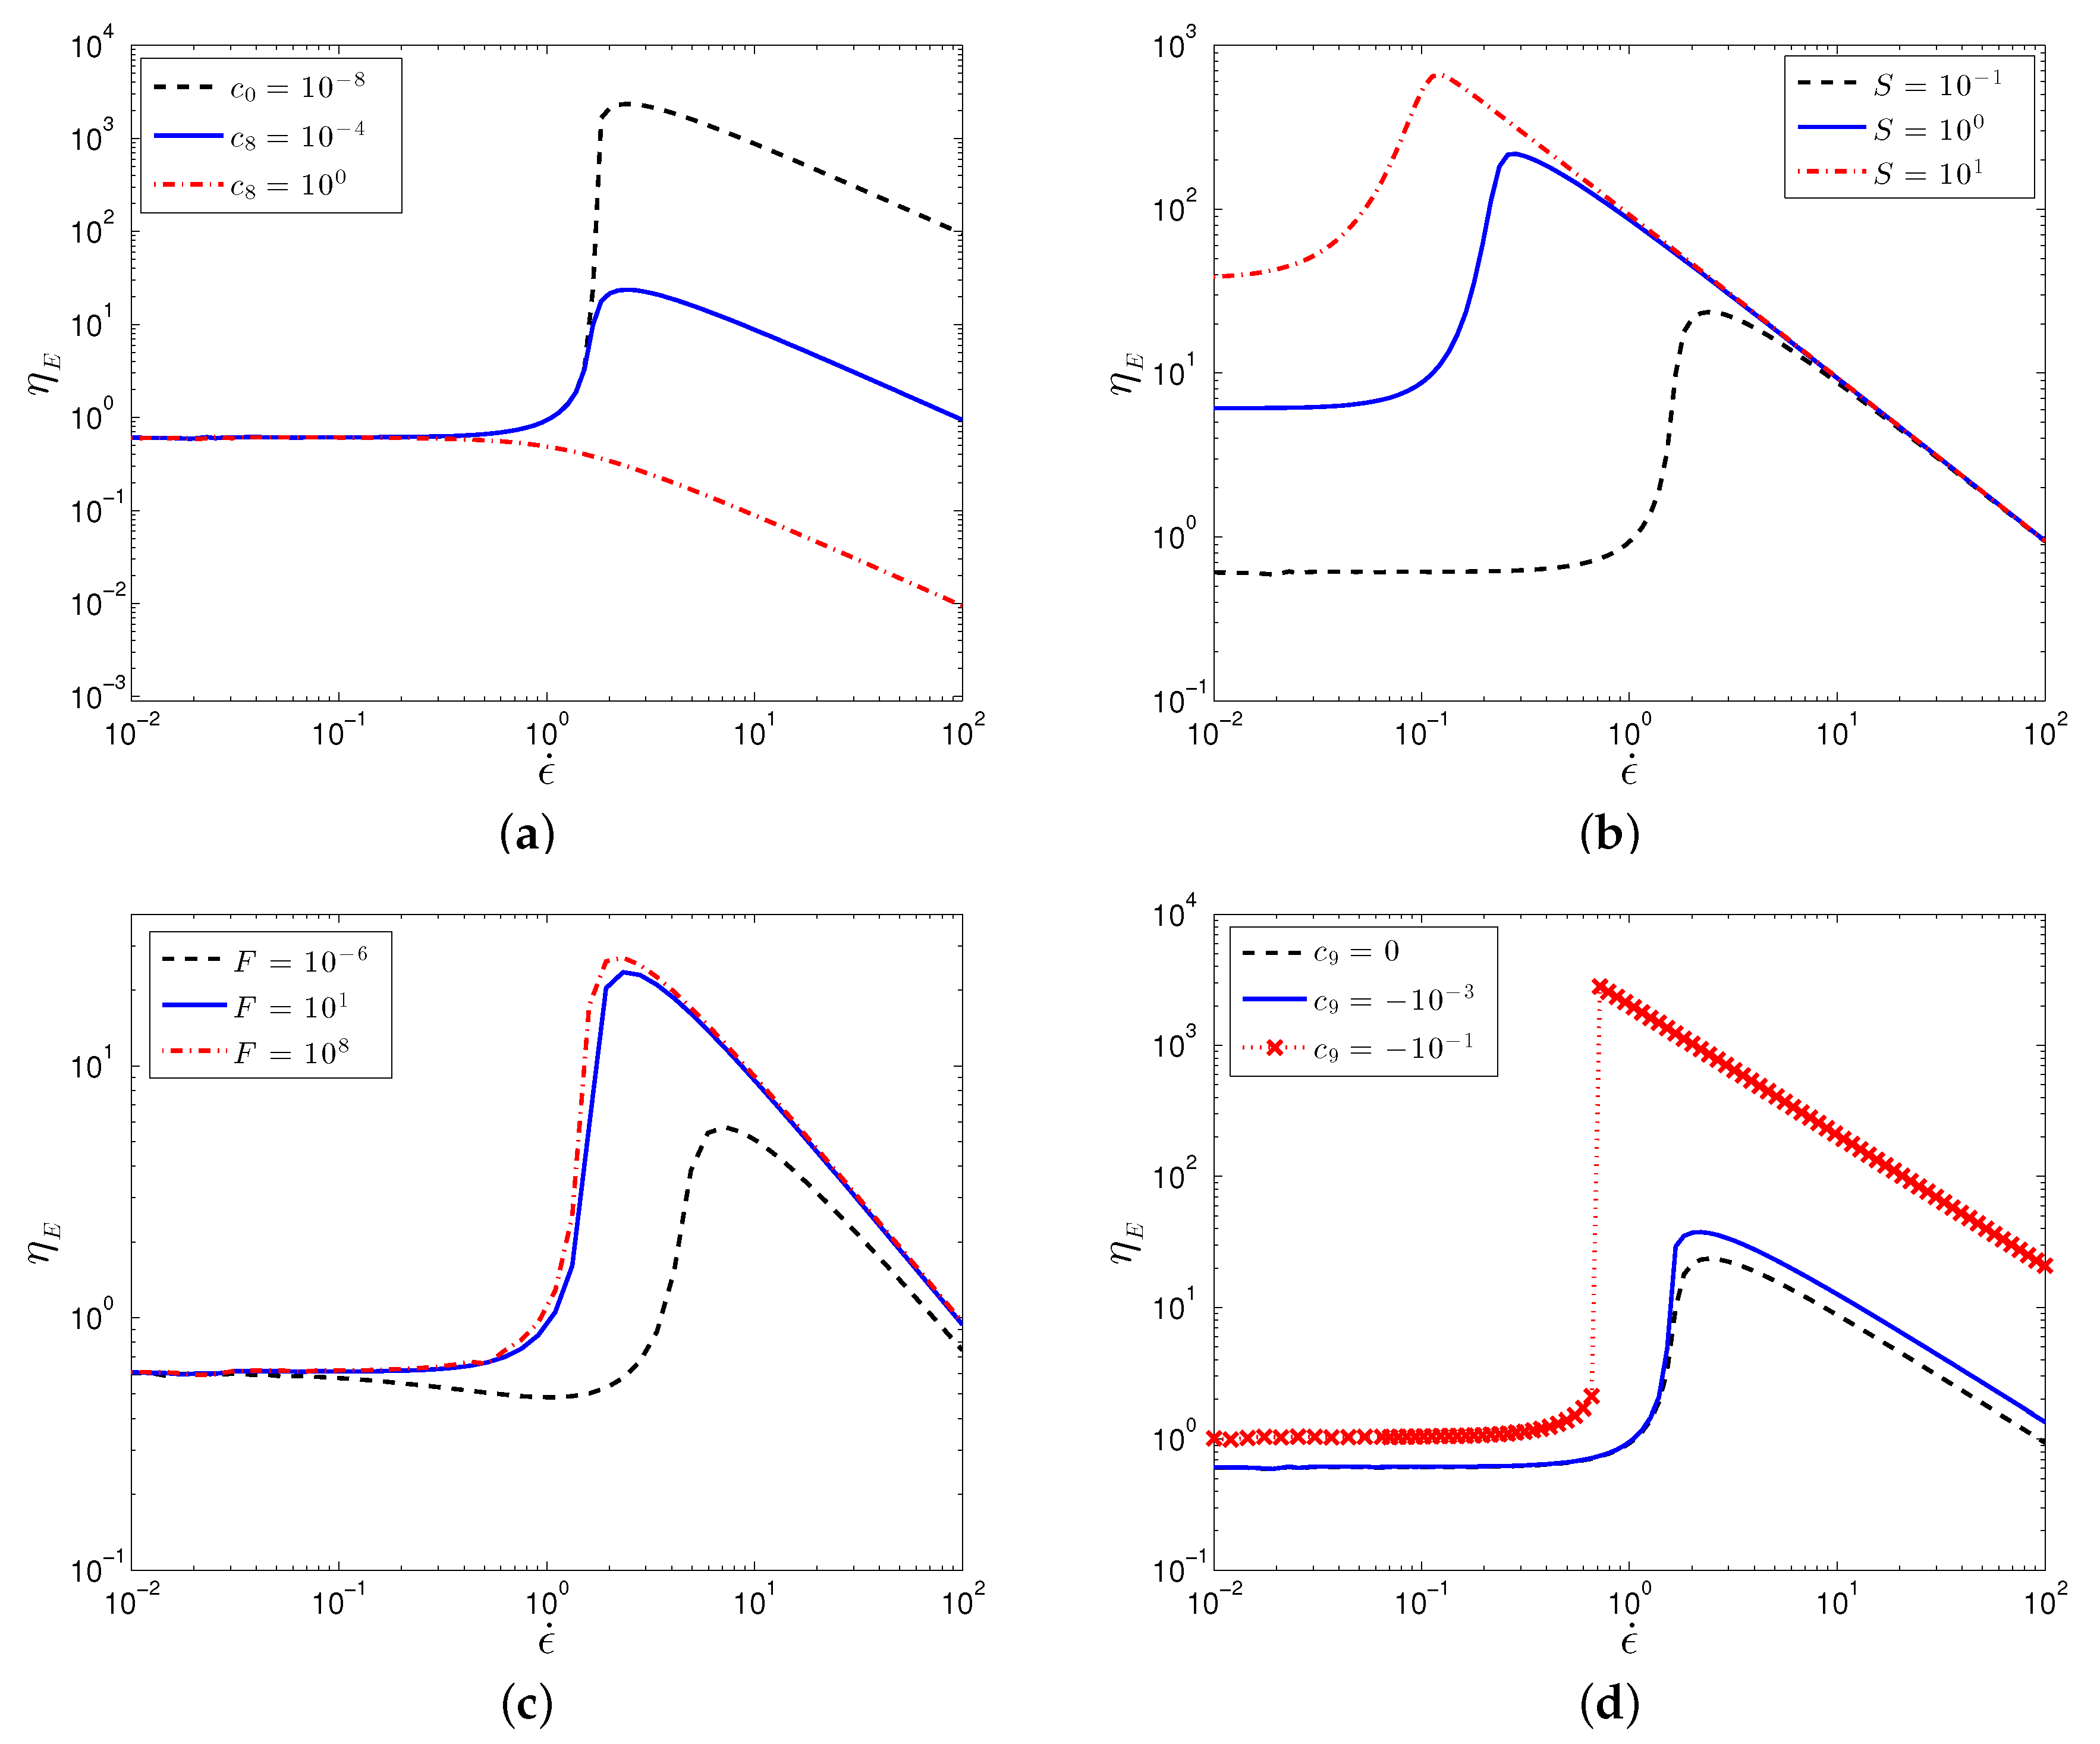
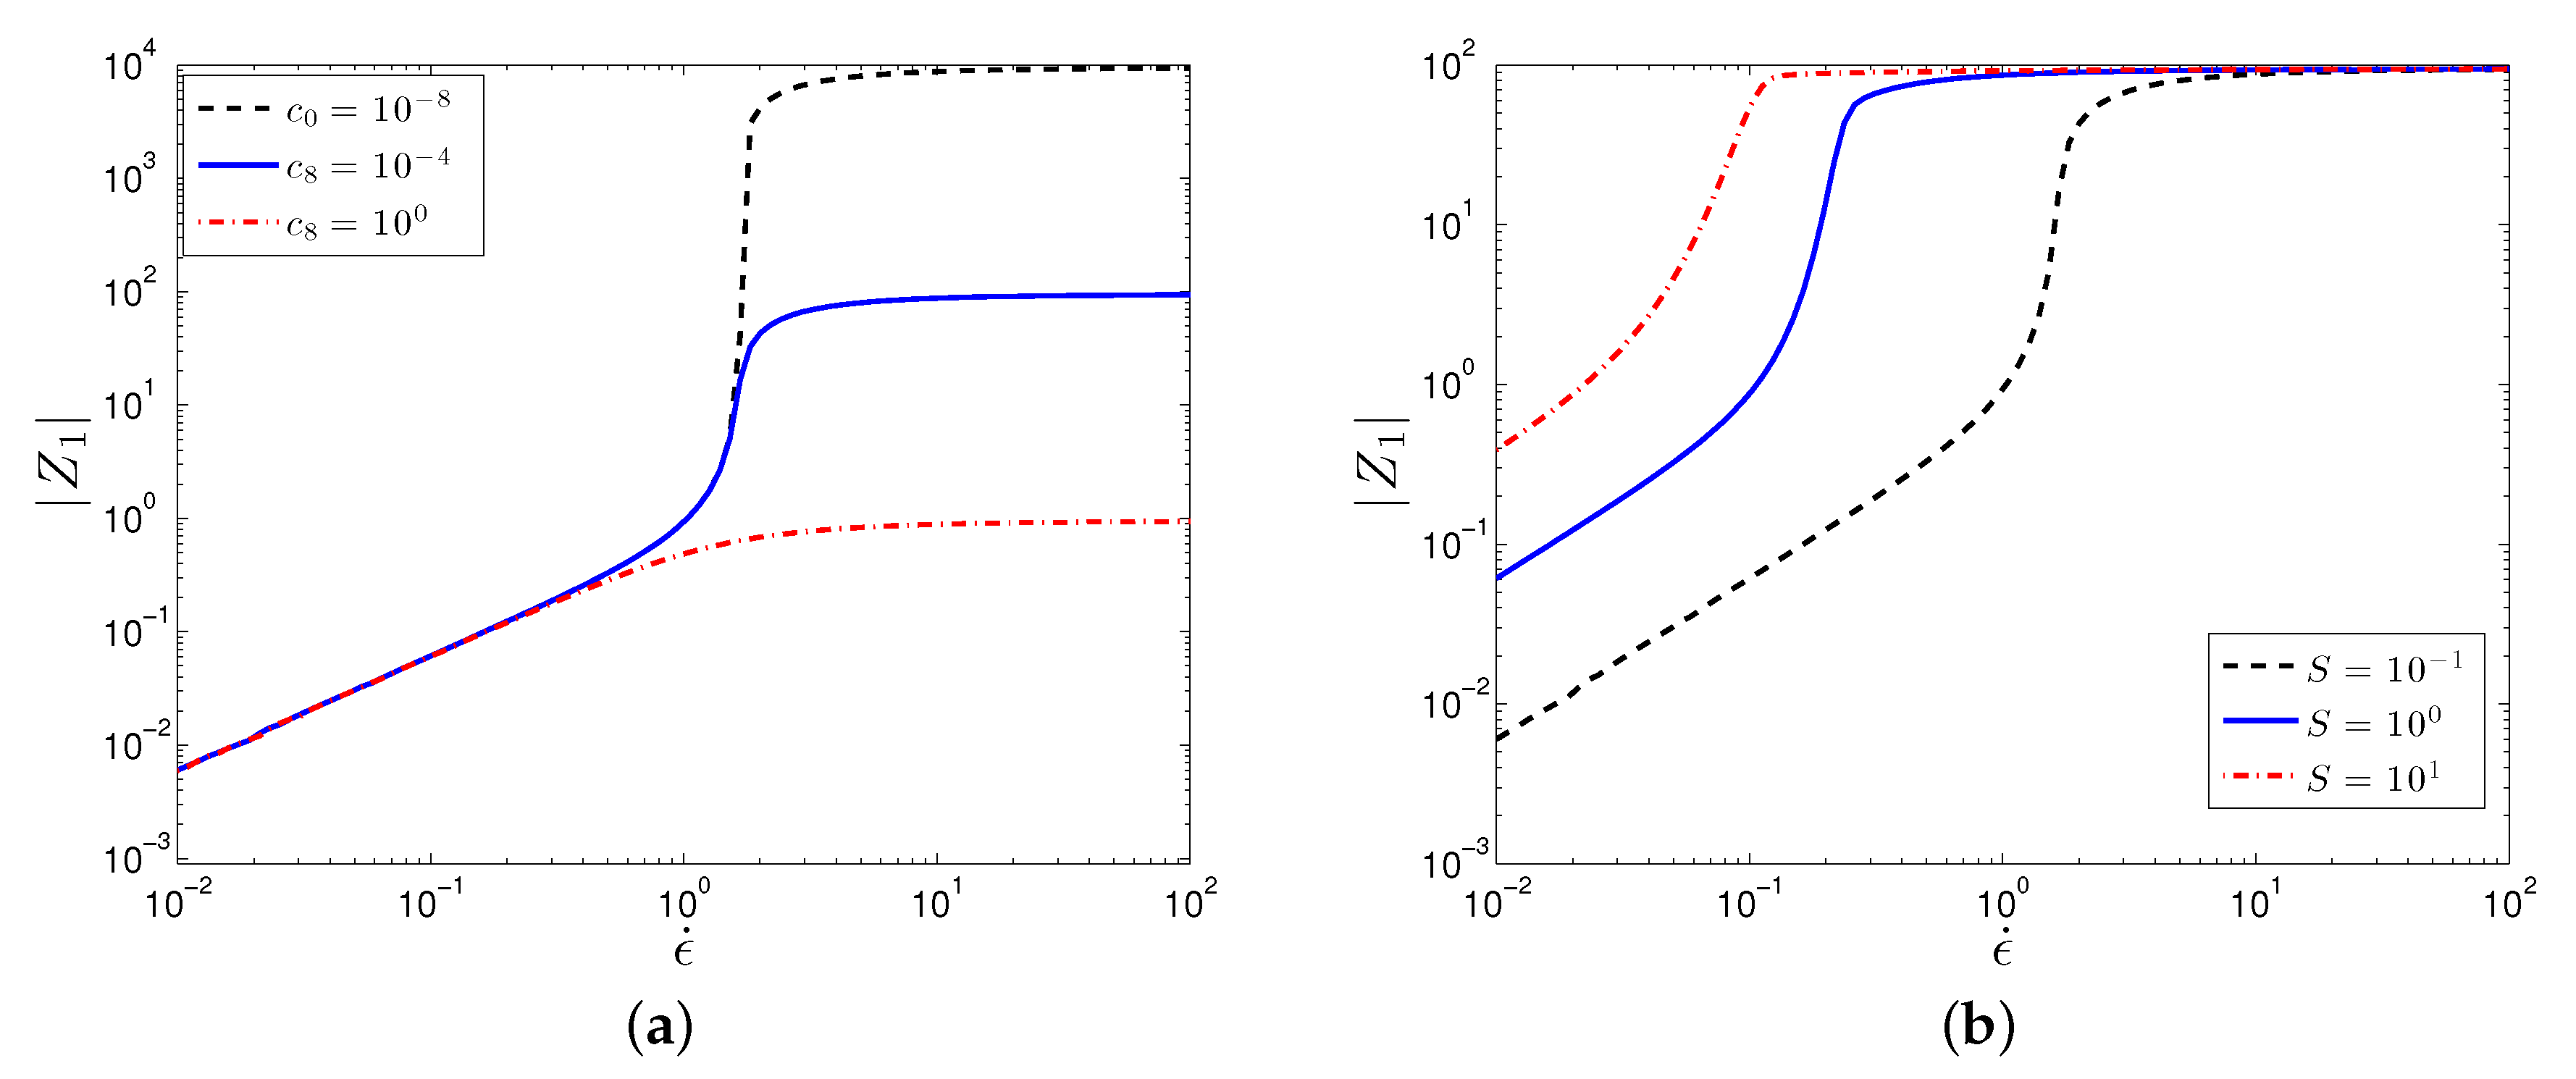
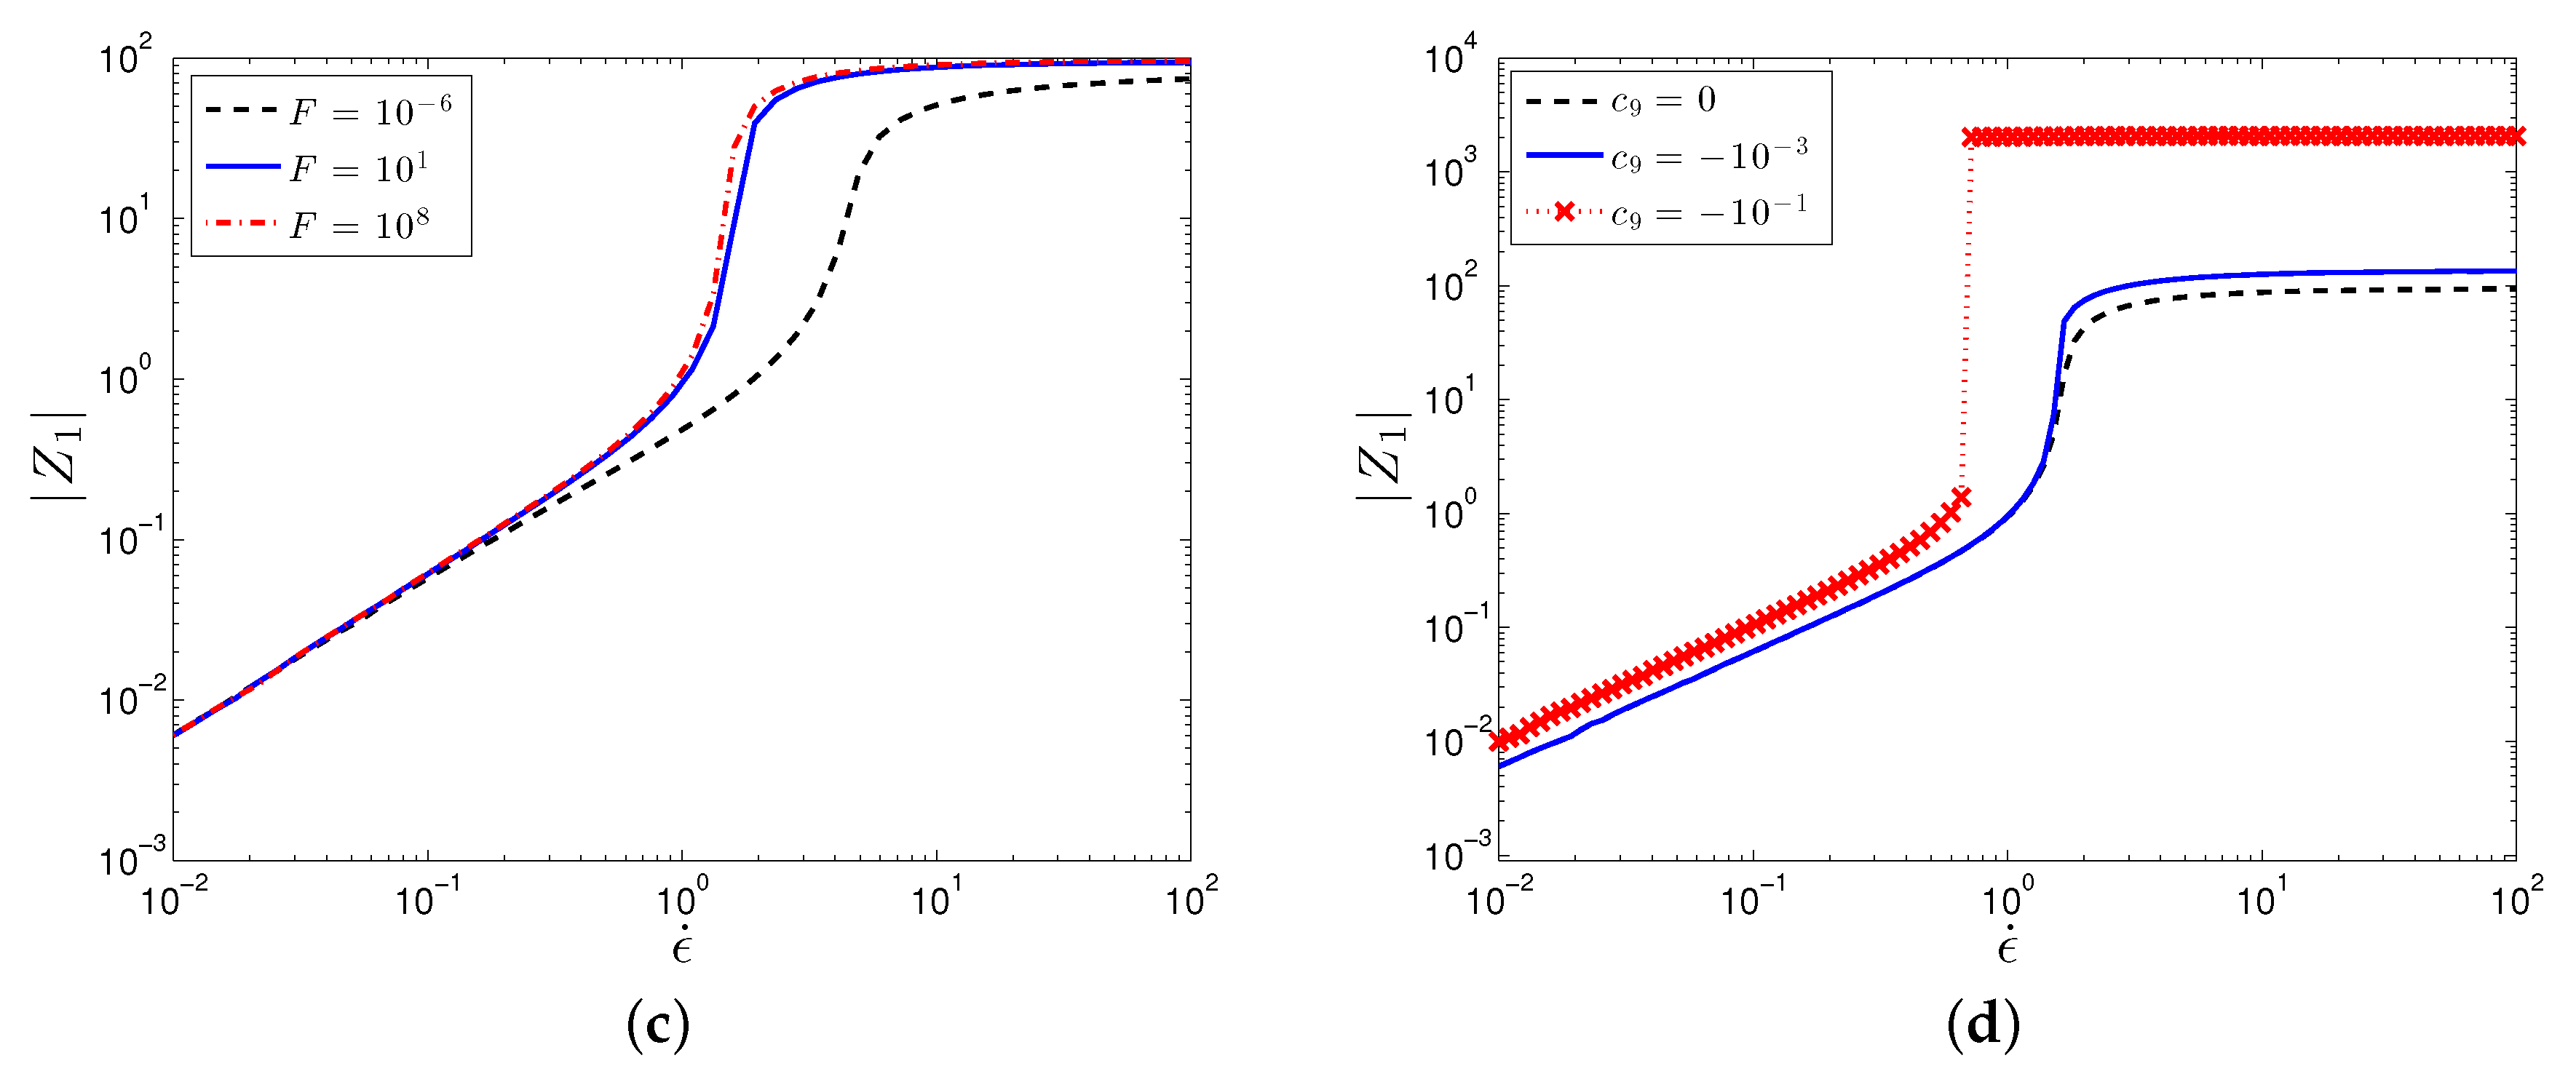
In agreement with limited experiments in extensional flow [6,7], the SPPC predicts that shear thickening fluids also exhibit a strong extensional thickening behavior, Figure 5. Furthermore, the extensional thickening occurs at lower rates than those corresponding to shear thickening, as also observed in the same experiments [6,7]. Just as in the case with the shear flow, the extensional thickening is due to the clustering of particles perpendicular to the flow direction, as indicated by a negative value of (the magnitude of is plotted in Figure 6). The trends predicted by the SPPC model for varying parameters are the same as the above for the shear flow.
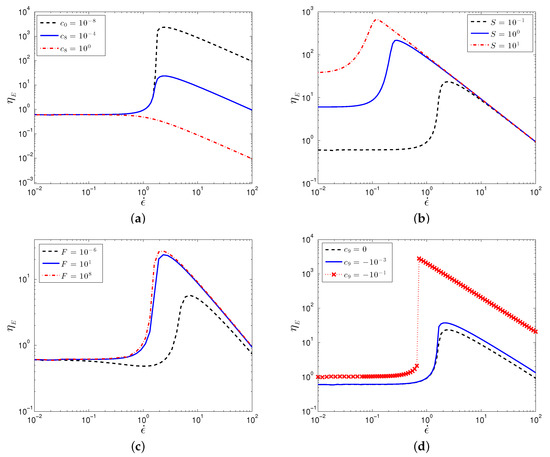
Figure 5.
Plot of the particle contribution to the extensional viscosity, , against extension rate for varying values of (a) , (b) S, (c) F, and (d) . Parameter values are: , .
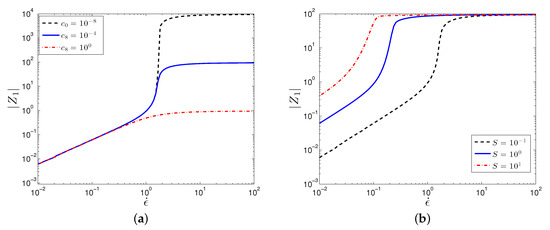
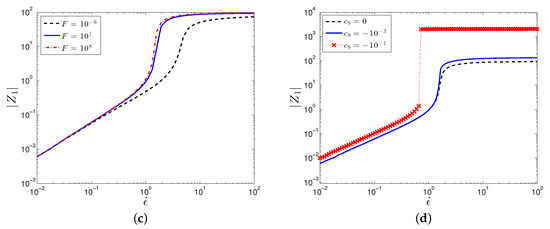
Figure 6.
Plot of the first normal structure difference, , against extension rate for varying values of (a) , (b) S, (c) F, and (d) . Parameter values are: , .
3.3. Results for Steady Poiseuille Flow
The primary goal of this work is to provide a constitutive model that describes the microstructure of a colloidal solution and its shear thickening behavior, and is suitable for complex flow simulations. In order to first test the model and the numerical solver, in this work we simulate the flow of an STF through a straight channel. Two scenarios are considered: (1) a one-dimensional (1D) assumption, in which we assume the flow moves in the x-direction but only varies in the gradient direction, y, and (2) a full two-dimensional (2D) simulation, for which the profiles across the gap in the fully-developed flow should match with the 1D predictions. There is very limited data on this flow scenario, thus, as an additional benchmark, we check our velocity predictions against one particular set of experimental data [51].
3.3.1. One-Dimensional
We consider a straight channel of length L and rectangular cross-section of width W and height . We assume the channel is long enough that entrance and exit effects are negligible and we assume that , where is the pressure drop. The height of the channel is where and we neglect variations in the z-direction. Under these assumptions the velocity, in the positive x-direction, has the form and satisfies conservation of mass, .
We assume inertialess flow, and the resulting momentum balance becomes
where . Note that integration of the momentum equation across the channel gives , or at the wall where is the total stress so . Thus the total shear stress is linear and monotone across the channel. The applied pressure is directly related to the wall shear stress .
In this 1D channel flow, the equations form a system of coupled, nonlinear partial differential equations to be solved using appropriate initial conditions and boundary conditions. We impose the no slip boundary conditions at the walls, . The method of lines is used to solve the time-dependent system where first the spatial dimension is discretized, in this case using a second order central finite difference scheme, and the resulting differential-algebraic system of equations is then marched forward in time until steady-state is achieved. The discretized system is marched forward in time using the Matlab solver ode15s.
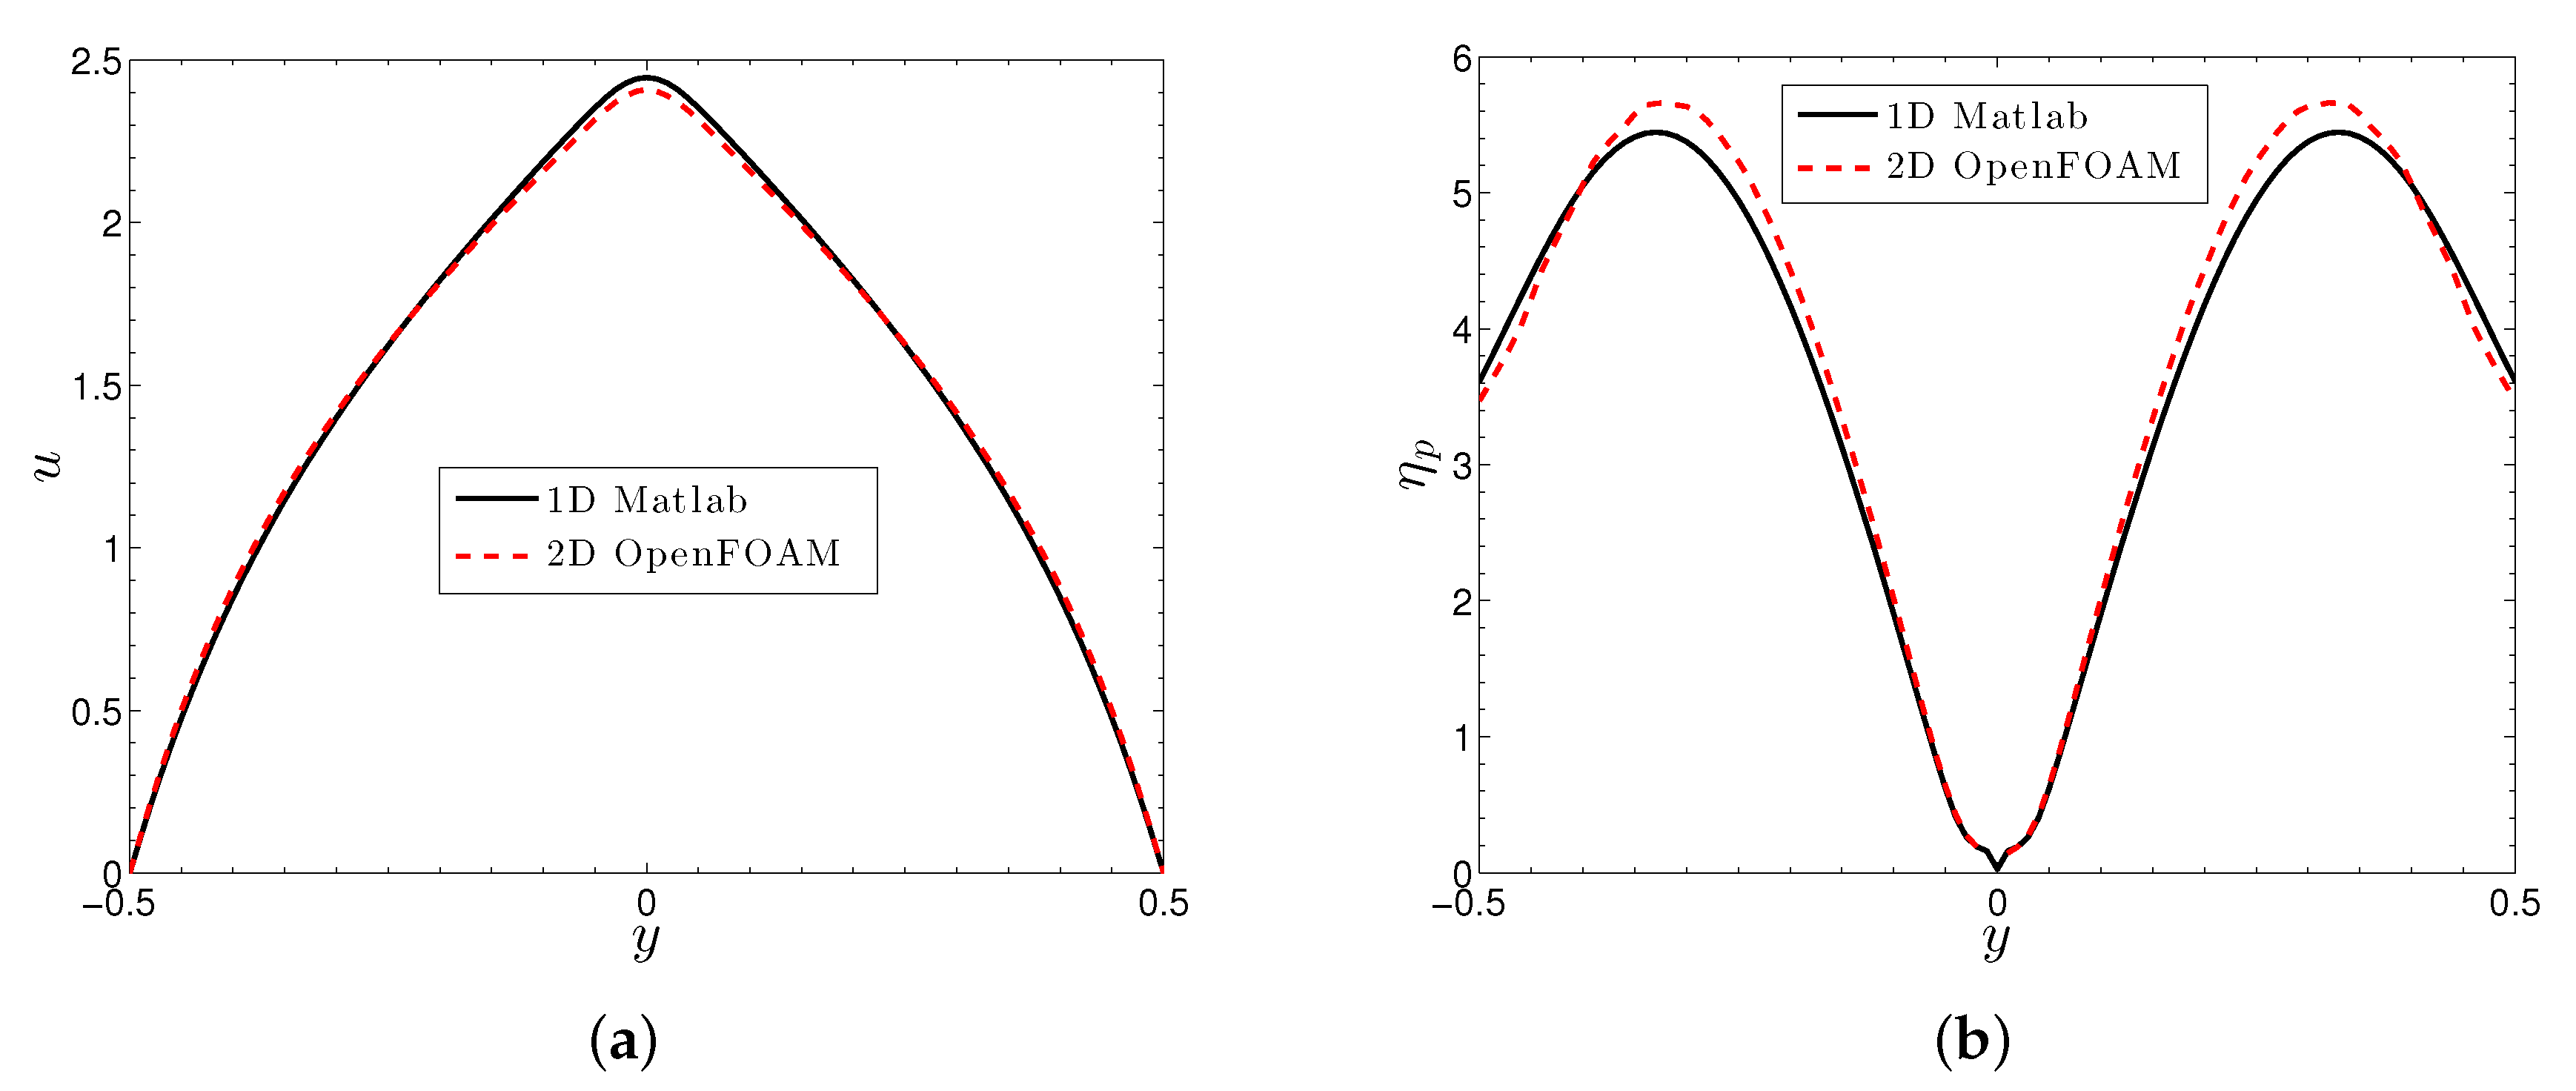
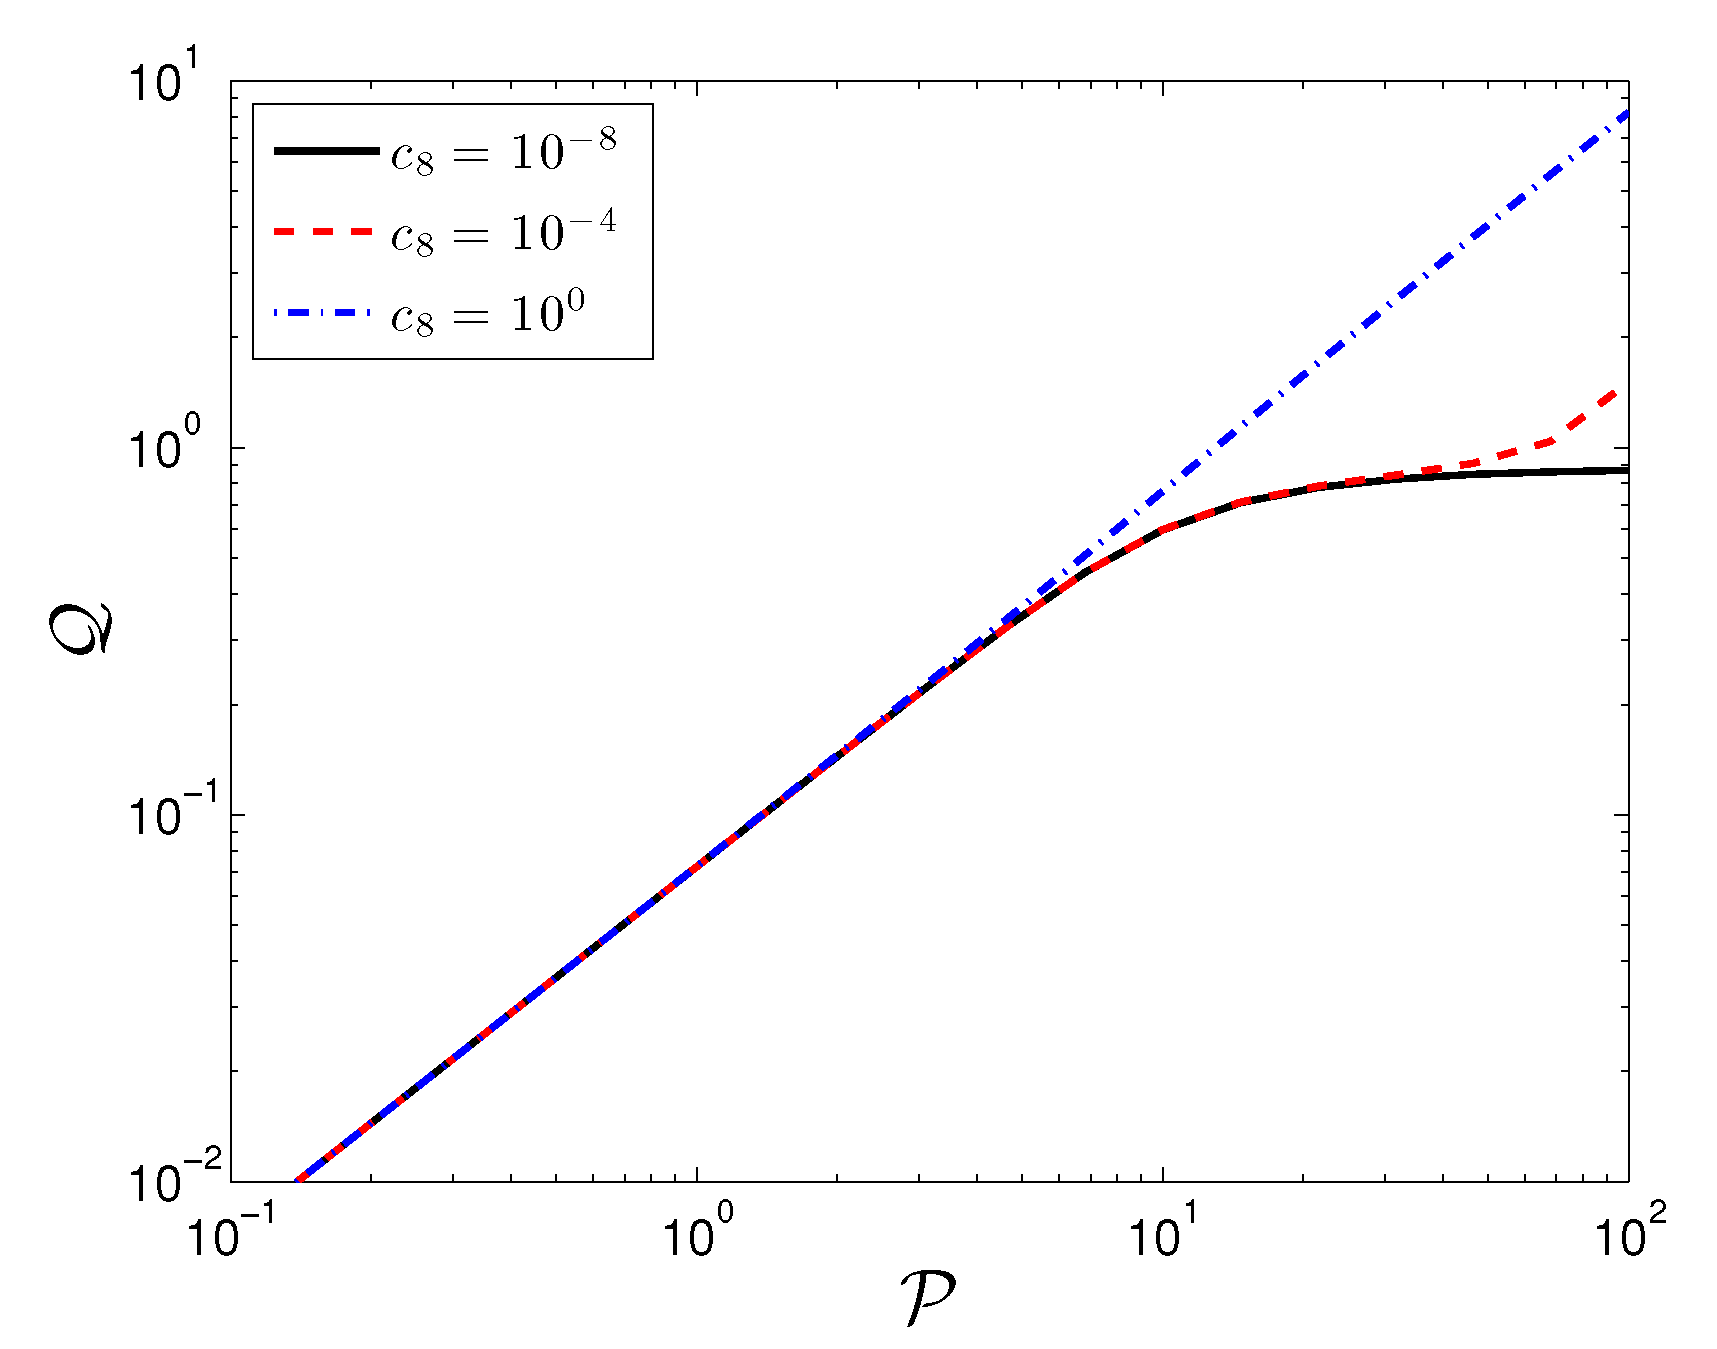
In Figure 7a,b we plot the velocity and viscosity across the gap for a single set of shear thickening parameters. We find the expected triangular velocity profile associated with a viscosity that increases from the center to wall, opposite of what occurs for the typical shear thinning materials. As expected, for a given a pressure drop, the shear thickening reduces the flow rate compared to constant and shear thinning viscosity simulations. This behavior is clearly seen in Figure 8, which plots the computed volumetric flow rate, , against the imposed pressure drop. As expected, as the degree of thickening increases, it becomes more difficult for the more viscous fluid to flow, thus reducing the flow throughput.
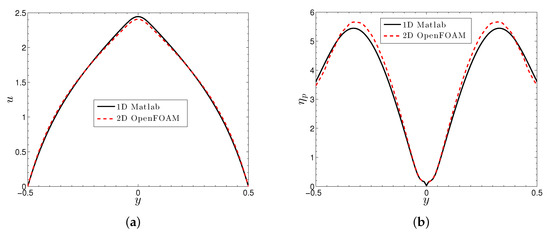
Figure 7.
Plots of the (a) velocity and (b) particle viscosity across the gap from the 1D simulation versus the fully-developed 2D flow. The imposed pressure drop for the 1D simulation is ; The inlet velocity for the 2D flow is , which, over a unit gap width, is also the flow rate. Parameter values are: , .
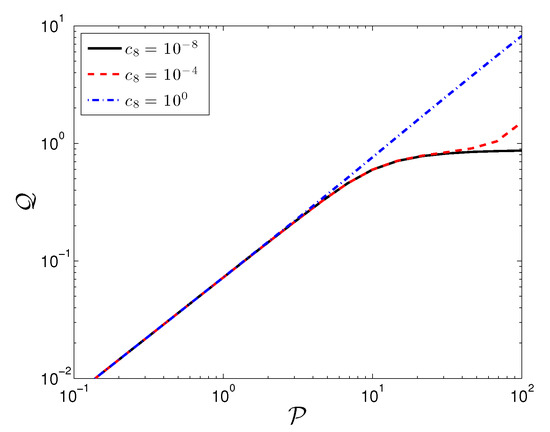
Figure 8.
Computed volumetric flow rate, , as a function of imposed pressure drop, . Parameter values are: .
3.3.2. Two-Dimensional
For two and higher dimensional flows, the governing equations are solved using then numerical solver viscoelasticFluidFoam [52], which can be found in the extended version of OpenFOAM® (version 3.0). The viscoelasticFluidFoam solver solves the governing equations sequentially in a segregated manner, where the momentum equation is solved first, followed by the pressure-correction equation, and finally the constitutive equations. It uses the Finite Volume Method (FVM) to discretize and solve all governing equations of the particular problem. For those terms involving divergence operators, the volume integral is converted to a surface integral over the control volume surfaces by applying the Gauss’ theorem. The convection terms are discretized using the limited linear differencing scheme, which is based on the Sweby scheme [53]. The remaining terms are discretized using the central differencing scheme (CDS). The resulting system of equations is solved by iterative matrix solvers, including the conjugate gradient method for the pressure-correction equation and the biconjugate gradient method for all other equations. The pressure-velocity coupling is ensured using the Pressure-Implicit Split Operator (PISO) algorithm [54]. The equations are solved in time using the built-in “Euler” scheme, which is first-order accurate. Finally, the improved both sides diffusion method [55] is implemented to stabilize the calculations.
At the inlets we impose uniform conditions on the velocity and structure, and a zero gradient condition on the pressure (and vice versa at the outlets). We use a 10:1 length:width ratio, which is sufficiently large to allow for fully-developed flow prior to reaching the outlet. Along the solid walls, the boundary conditions imposed include the no slip boundary condition on the velocity:
We use the zero gradient boundary condition on the conformation tensor at the walls, consistent with the original solver benchmark calculations [52]:
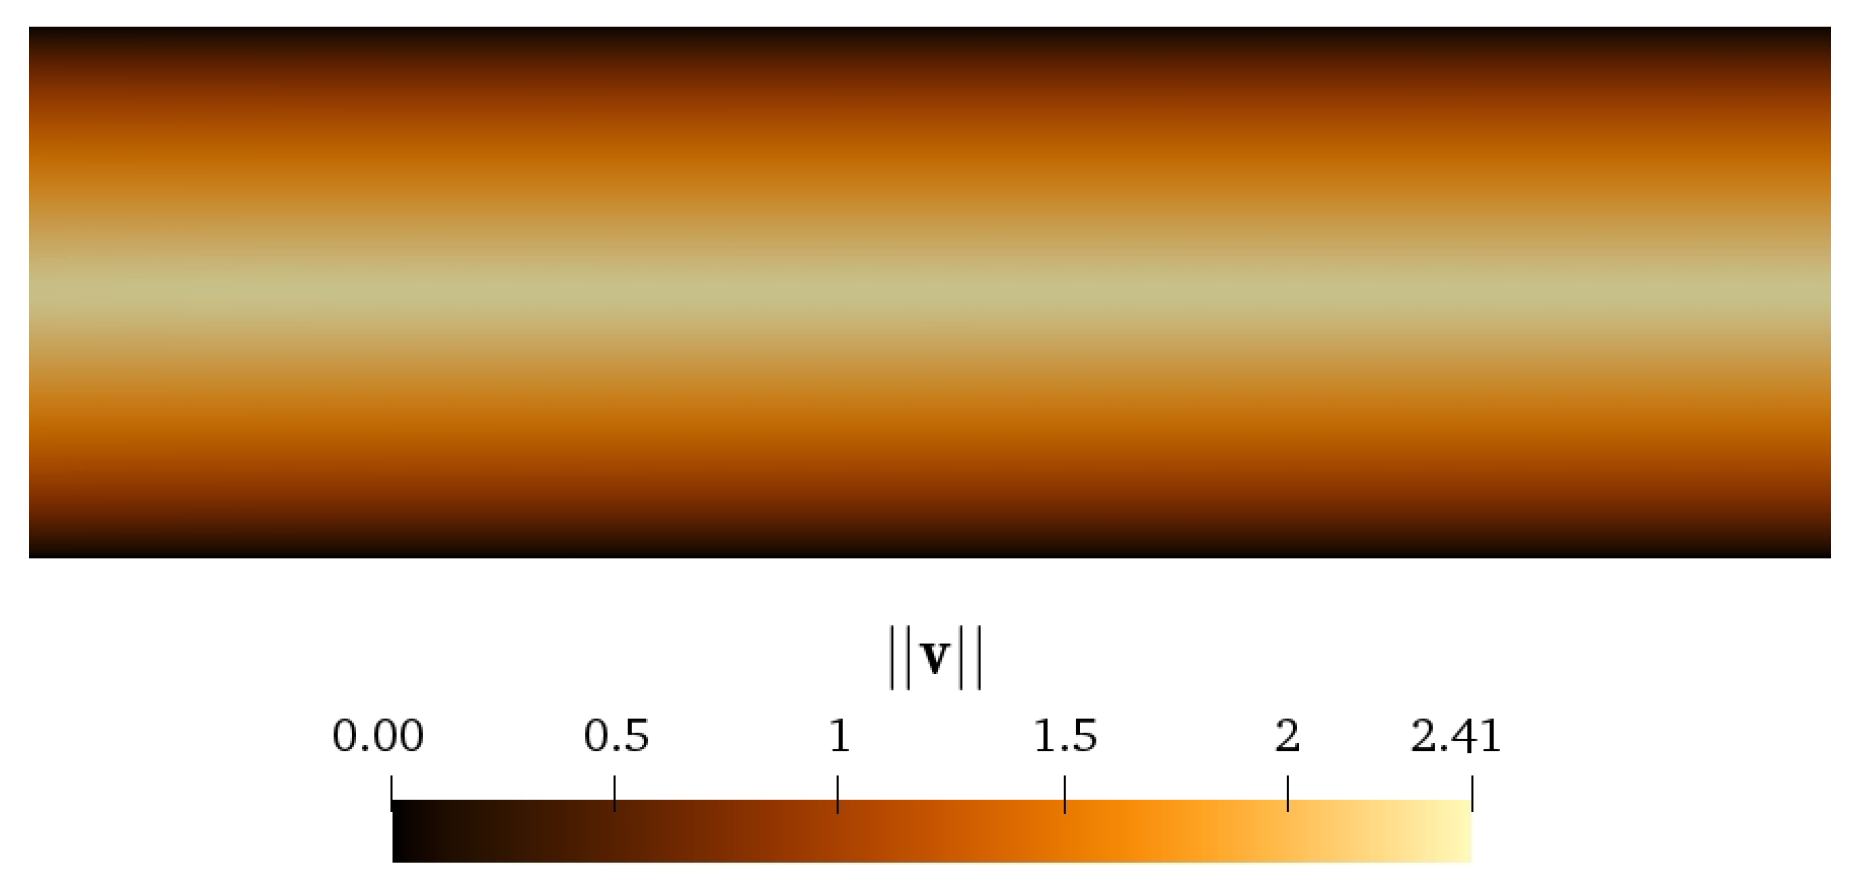
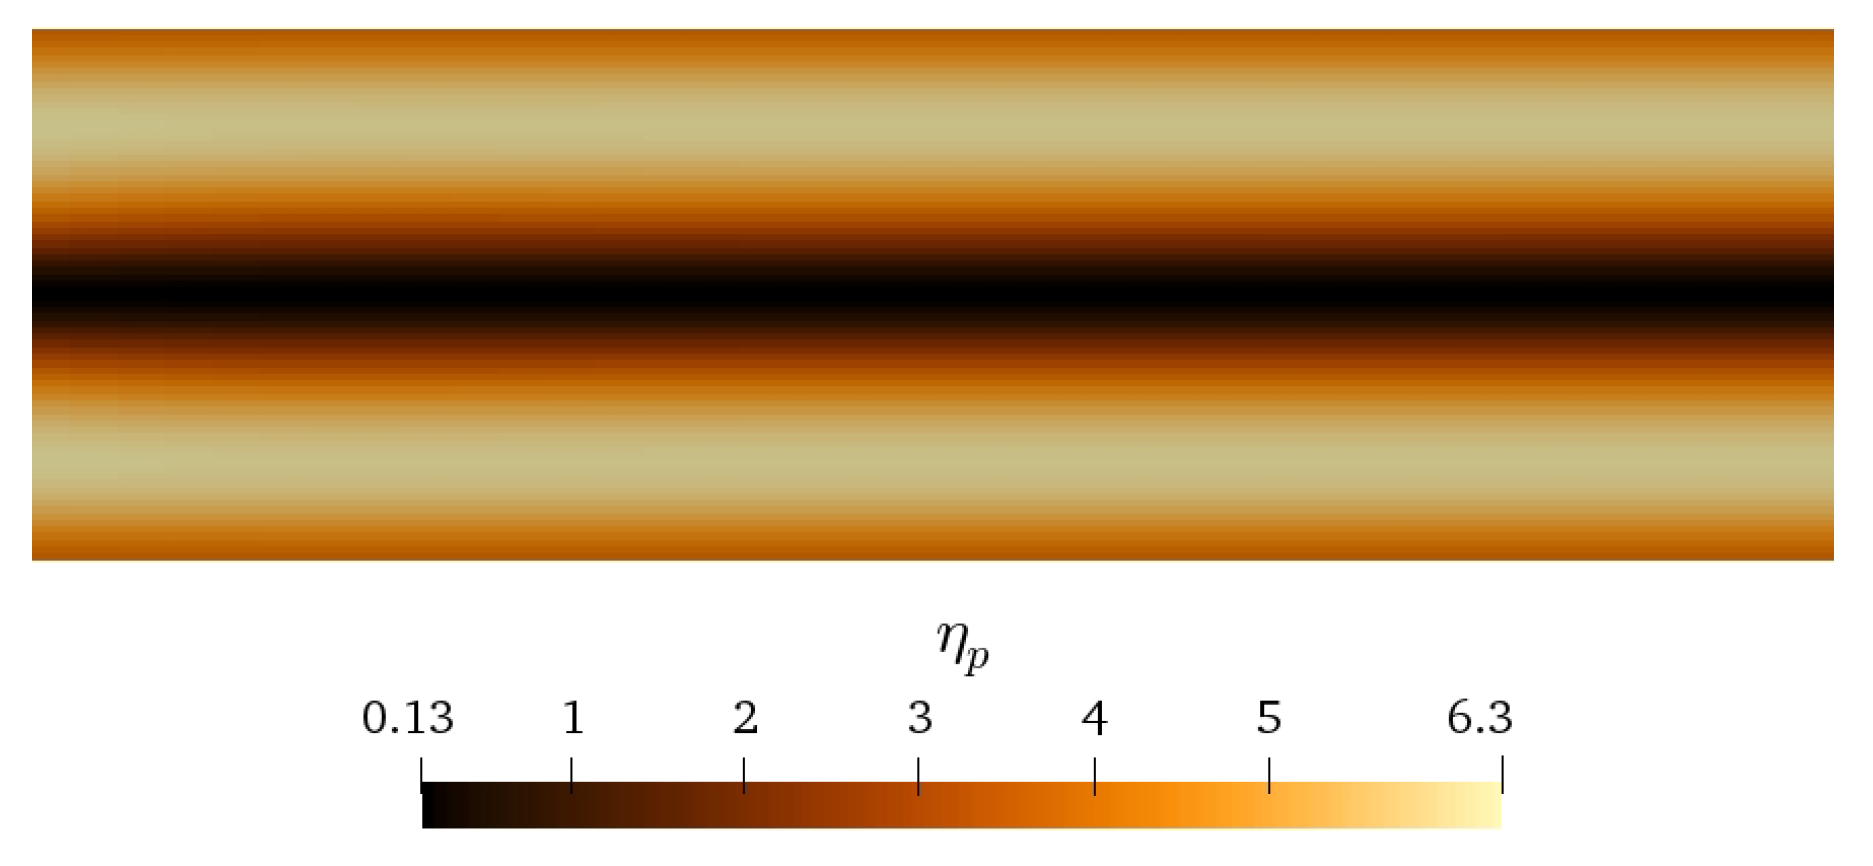
In Figure 9 we show the contour plot of the fully-developed velocity magnitude. Here we see the more triangular shaped velocity profile, expected for shear thickening fluids [51]. Associated with this velocity profile is a viscosity profile in which the viscosity is smallest in the center and increases towards the wall, Figure 10, unlike the typical behavior of constant and shear thinning materials.
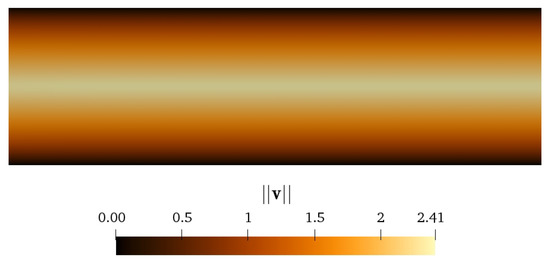
Figure 9.
Contour plot of the velocity profile for the 2D channel flow with . Parameter values are: .
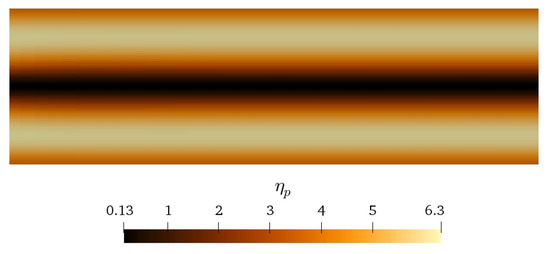
Figure 10.
Contour plot of the particle viscosity profile for the 2D channel flow with . Parameter values are: .
The important question is whether the 1D and 2D predictions coincide. In Figure 7 we plot the velocity and viscosity across the gap (for the 2D simulation we choose a location far enough downstream such that the flow is fully developed). The main differences between the one and two dimensional flows are that the former is pressure-driven whereas the latter is flow-rate-driven, and the fact the used 2D solver requires boundary conditions [52] on the structure, yet none are imposed in the 1D flow. In order to attempt to match the data, we choose a single 1D simulation with . The computed flow rate is thus , which is used for the uniform velocity inlet condition in the 2D simulation. The agreement between the 1D and 2D do not perfectly overlap, however they are sufficiently close that we feel confident that the 2D simulations are predicting the expected behavior, thus proving a viable tool for future, more complex studies.
4. Discussion
The model presented in this paper, a modification of the SPP model [27], is a contribution to the ongoing work for the development of constitutive models describing the flow of particulate suspensions. The model is still phenomenological in the sense that the form is dictated by tensor symmetries and invariances, and fit parameters are needed to match the model to experimental data, and little can be said about the physical meaning of these parameters. While the SPPC model is connected to particle physics based upon a spatially-dependent mean free-path length, there is still limited insight that can be derived into the dynamics of the microstructure and the link with the suspension stress. However, the advantage of the provided model is that it has very few free parameters and, due to the inclusion of nonlinear terms in the structure, has the capability of predicting the full range of nonlinear rheological behavior from shear thinning to both continuous and discontinuous shear thickening, and extensional thickening, the effects of which are predicted to be due to the clustering of particles. The model thus includes terms that may need to be considered in future first-principles modeling efforts in order to capture these unique features. Most importantly, having a continuum model that predicts shear and extensional thickening coupled to microstructural dynamics now means that we have the ability to conduct complex flow simulations that will help better understand the dynamics of shear thickening colloids under complex flow conditions [2,5,15,16,17,56,57].
Author Contributions
Conceptualization, M.C.; Data curation, J.A.G. and M.C.; Formal analysis, J.A.G.; Funding acquisition, M.C.; Investigation, J.A.G. and D.J.R.; Methodology, J.A.G., D.J.R. and M.C.; Project administration, M.C.; Resources, M.C.; Software, J.A.G. and D.J.R.; Supervision, M.C.; Validation, J.A.G., D.J.R. and M.C.; Visualization, J.A.G. and M.C.; Writing—original draft, M.C.; Writing—review & editing, J.A.G. and M.C.
Funding
This research was funded by American Chemical Society Petroleum Research Fund under grant number 56047-UNI9.
Conflicts of Interest
The authors declare no conflict of interest. The funders had no role in the design of the study; in the collection, analyses, or interpretation of data; in the writing of the manuscript, or in the decision to publish the results.
References
- Ding, J.; Li, W.; Shen, S.Z. Research and applications of shear thickening fluids. Recent Pat. Mater. Sci. 2011, 4, 43–49. [Google Scholar] [CrossRef]
- Lee, Y.S.; Wetzel, E.D.; Wagner, N.J. The ballistic impact characteristics of Kevlar® woven fabrics impregnated with a colloidal shear thickening fluid. J. Mater. Sci. 2003, 38, 2825–2833. [Google Scholar] [CrossRef]
- Decker, M.J.; Halbach, C.J.; Nam, C.H.; Wagner, N.J.; Wetzel, E.D. Stab resistance of shear thickening fluid (STF)-treated fabrics. Compos. Sci. Technol. 2007, 67, 565–578. [Google Scholar] [CrossRef]
- Wagner, N.J.; Brady, J.F. Shear thickening in colloidal dispersions. Phys. Today 2009, 62, 27–32. [Google Scholar] [CrossRef]
- Nilsson, M.A.; Kulkarni, R.; Gerberich, L.; Hammond, R.; Singh, R.; Baumhoff, E.; Rothstein, J.P. Effect of fluid rheology on enhanced oil recovery in a microfluidic sandstone device. J. Non-Newton. Fluid Mech. 2013, 202, 112–119. [Google Scholar] [CrossRef]
- Chellamuthu, M.; Arndt, E.M.; Rothstein, J.P. Extensional rheology of shear-thickening nanoparticle suspensions. Soft Matter 2009, 5, 2117–2124. [Google Scholar] [CrossRef]
- White, E.E.B.; Chellamuthu, M.; Rothstein, J.P. Extensional rheology of a shear-thickening cornstarch and water suspension. Rheol. Acta 2010, 49, 119–129. [Google Scholar] [CrossRef]
- Smith, M.I.; Besseling, R.; Cates, M.E.; Bertola, V. Dilatancy in the flow and fracture of stretched colloidal suspensions. Nat. Commun. 2010, 1, 114. [Google Scholar] [CrossRef]
- Roché, M.; Kellay, H.; Stone, H.A. Heterogeneity and the role of normal stresses during the extensional thinning of non-Brownian shear-thickening fluids. Phys. Rev. Lett. 2011, 107, 134503. [Google Scholar] [CrossRef]
- Zimoch, P.J.; McKinley, G.H.; Hosoi, A.E. Capillary breakup of discontinuously rate thickening suspensions. Phys. Rev. Lett. 2013, 111, 036001. [Google Scholar] [CrossRef]
- Majumdar, S.; Peters, I.R.; Han, E.; Jaeger, H.M. Dynamic shear jamming in dense granular suspensions under extension. Phys. Rev. E 2017, 95, 012603. [Google Scholar] [CrossRef]
- Wyart, M.; Cates, M.E. Discontinuous shear thickening without inertia in dense non-Brownian suspensions. Phys. Rev. Lett. 2014, 112, 098302. [Google Scholar] [CrossRef]
- Mari, R.; Seto, R.; Morris, J.F.; Denn, M.M. Shear thickening, frictionless and frictional rheologies in non-Brownian suspensions. J. Rheol. 2014, 58, 1693–1724. [Google Scholar] [CrossRef]
- Seto, R.; Giusteri, G.G.; Martiniello, A. Microstructure and thickening of dense suspensions under extensional and shear flows. J. Fluid Mech. 2017, 825, R3. [Google Scholar] [CrossRef]
- Ouriev, B.; Windhab, E.J. Novel ultrasound based time averaged flow mapping method for die entry visualization in flow of highly concentrated shear-thinning and shear-thickening suspensions. Meas. Sci. Technol. 2003, 14, 140–147. [Google Scholar]
- Von Kann, S.; Snoeijer, J.H.; Lohse, D.; van der Meer, D. Nonmonotonic settling of a sphere in a cornstarch suspension. Phys. Rev. E 2011, 84, 060401. [Google Scholar] [CrossRef] [PubMed]
- Hasanzadeh, M.; Mottaghitalab, V. The role of shear-thickening fluids (STFs) in ballistic and stab-resistance improvement of flexible armor. J. Mater. Eng. Perform. 2014, 23, 1182–1196. [Google Scholar] [CrossRef]
- Brady, J.F.; Bossis, G. Stokesian dynamics. Ann. Rev. Fluid Mech. 1988, 20, 111–157. [Google Scholar] [CrossRef]
- Foss, D.R.; Brady, J.F. Structure, diffusion and rheology of Brownian suspensions by Stokesian Dynamics simulation. J. Fluid Mech. 2000, 407, 167–200. [Google Scholar] [CrossRef]
- Picano, F.; Breugem, W.P.; Mitra, D.; Brandt, L. Shear thickening in non-Brownian suspensions: An excluded volume effect. Phys. Rev. Lett. 2013, 111, 098302. [Google Scholar] [CrossRef] [PubMed]
- Seto, R.; Mari, R.; Morris, J.F.; Denn, M.M. Discontinuous Shear Thickening of Frictional Hard-Sphere Suspensions. Phys. Rev. Lett. 2013, 111, 218301. [Google Scholar] [CrossRef] [PubMed]
- Mari, R.; Seto, R.; Morris, J.F.; Denn, M.M. Discontinuous shear thickening in Brownian suspensions by dynamic simulation. Proc. Nat. Acad. Sci. USA 2015, 112, 15326–15330. [Google Scholar] [CrossRef] [PubMed]
- Boromand, A.; Jamali, S.; Grove, B.; Maia, J.M. A generalized frictional and hydrodynamic model of the dynamics and structure of dense colloidal suspensions. J. Rheol. 2018, 62, 905–918. [Google Scholar] [CrossRef]
- Wilson, H.J. ‘Shear thickening’ in non-shear flows: The effect of microstructure. J. Fluid Mech. 2018, 836, 1–4. [Google Scholar] [CrossRef]
- Phan-Thien, N. Constitutive equation for concentrated suspensions in Newtonian liquids. J. Rheol. 1995, 39, 679–695. [Google Scholar] [CrossRef]
- Phan-Thien, N.; Fan, X.-J.; Khoo, B.C. A new constitutive model for monodispersed suspensions of spheres at high concentrations. Rheol. Acta 1999, 38, 297–304. [Google Scholar] [CrossRef]
- Stickel, J.J.; Phillips, R.J.; Powell, R.L. A constitutive model for microstructure and total stress in particulate suspensions. J. Rheol. 2006, 50, 379–413. [Google Scholar] [CrossRef]
- Goddard, J. A dissipative anisotropic fluid model for non-colloidal particle dispersions. J. Fluid Mech. 2006, 568, 1–17. [Google Scholar] [CrossRef]
- Morris, J.F. A review of microstructure in concentrated suspensions and its implications for rheology and bulk flow. Rheol. Acta 2009, 48, 909–923. [Google Scholar] [CrossRef]
- Miller, R.M.; Singh, J.P.; Morris, J.F. Suspension flow modeling for general geometries. Chem. Eng. Sci. 2009, 64, 4597–4610. [Google Scholar] [CrossRef]
- Ozenda, O.; Saramito, P.; Chambon, G. A new rate-independent tensorial model for suspensions of noncolloidal rigid particles in Newtonian fluids. J. Rheol. 2018, 62, 889–903. [Google Scholar] [CrossRef]
- Singh, A.; Mari, R.; Denn, M.M.; Morris, J.F. A constitutive model for simple shear of dense frictional suspensions. J. Rheol. 2018, 62, 457–468. [Google Scholar] [CrossRef]
- Gillissen, J.J.J.; Wilson, H.J. Modeling sphere suspension microstructure and stress. Phys. Rev. E 2018, 98, 033119. [Google Scholar] [CrossRef]
- II, G.G.L.; Denn, M.M.; Hur, D.U.; Boger, D.V. The flow of fiber suspensions in complex geometries. J. Non-Newton. Fluid Mech. 1988, 26, 297–325. [Google Scholar]
- Hand, G.L. A theory of anisotropic fluids. J. Fluid Mech. 1962, 13, 33–46. [Google Scholar] [CrossRef]
- Barthés-Biesel, D.; Acrivos, A. The rheology of suspensions and its relation to phenomenological theories for non-Newtonian fluids. Int. J. Multiph. Flow 1973, 1, 1–24. [Google Scholar] [CrossRef]
- Stickel, J.J.; Phillips, R.J.; Powell, R.L. Application of a constitutive model for particulate suspensions: Time-dependent viscometric flows. J. Rheol. 2007, 51, 1271–1302. [Google Scholar] [CrossRef]
- Yapici, K.; Powell, R.L.; Phillips, R.J. Particle migration and suspension structure in steady and oscillatory pipe flow. Phys. Fluids 2009, 21, 053302. [Google Scholar] [CrossRef]
- Chacko, R.N.; Mari, R.; Fielding, S.M.; Cates, M.E. Shear reversal in dense suspensions: The challenge to fabric evolution models from simulation data. J. Fluid Mech. 2018, 847, 700–734. [Google Scholar] [CrossRef]
- Nott, P.R.; Brady, J.F. Pressure-driven flow of suspensions: Simulation and theory. J. Fluid Mech. 1994, 275, 157–199. [Google Scholar] [CrossRef]
- Morris, J.F.; Boulay, F. Curvilinear flows of noncolloidal suspensions: The role of normal stresses. J. Rheol. 1999, 43, 1213–1237. [Google Scholar] [CrossRef]
- Frank, M.; Anderson, D.; Weeks, E.R.; Morris, J.F. Particle migration in pressure-driven flow of a Brownian suspension. J. Fluid Mech. 2003, 493, 363–378. [Google Scholar] [CrossRef]
- Truesdell, C.; Noll, W. The non-linear field theories of mechanics. In The Non-Linear Field Theories of Mechanics; Springer: Berlin/Heidelberg, Germany, 2004; pp. 1–579. [Google Scholar]
- Passey, P.; Mehta, R.G. Study of Pre-Shearing Protocol and Rheological Parameters of Shear Thickening Fluids Containing Nano Particles. Ph.D. Thesis, Thapar University, Patiala, India, 2016. [Google Scholar]
- Mewis, J.; Wagner, N.J. Colloidal Suspension Rheology; Cambridge University Press: Cambridge, UK, 2012. [Google Scholar]
- Maranzano, B.J.; Wagner, N.J. Flow-small angle neutron scattering measurements of colloidal dispersion microstructure evolution through the shear thickening transition. J. Chem. Phys. 2002, 117, 10291–10302. [Google Scholar] [CrossRef]
- Royer, J.R.; Blair, D.L.; Hudson, S.D. Rheological signature of frictional interactions in shear thickening suspensions. Phys. Rev. Lett. 2016, 116, 188301. [Google Scholar] [CrossRef] [PubMed]
- Kawasaki, T.; Ikeda, A.; Berthier, L. Thinning or thickening? Multiple rheological regimes in dense suspensions of soft particles. Europhys. Lett. 2014, 107, 28009. [Google Scholar] [CrossRef]
- Brady, J.F.; Morris, J.F. Microstructure of strongly sheared suspensions and its impact on rheology and diffusion. J. Fluid Mech. 1997, 348, 103–139. [Google Scholar] [CrossRef]
- Sierou, A.; Brady, J.F. Rheology and microstructure in concentrated noncolloidal suspensions. J. Rheol. 2002, 46, 1031–1056. [Google Scholar] [CrossRef]
- Ouriev, B.; Windhab, E.J. Rheological study of concentrated suspensions in pressure-driven shear flow using a novel in-line ultrasound Doppler method. Exp. Fluids 2002, 32, 204–211. [Google Scholar]
- Favero, J.L.; Secchi, A.R.; Cardozo, N.S.M.; Jasak, H. Viscoelastic flow analysis using the software OpenFOAM and differential constitutive equations. J. Non-Newton. Fluid Mech. 2010, 165, 1625–1636. [Google Scholar] [CrossRef]
- Sweby, P.K. High resolution schemes using flux limiters for hyperbolic conservation laws. SIAM J. Numer. Anal. 1984, 21, 995–1011. [Google Scholar] [CrossRef]
- Issa, R.I. Solution of the implicitly discretised fluid flow equations by operator-splitting. J. Comput. Phys. 1986, 62, 40–65. [Google Scholar] [CrossRef]
- Fernandes, C.; Araujo, M.S.B.; Ferrás, L.L.; Nóbrega, J.M. Improved both sides diffusion (iBSD): A new and straightforward stabilization approach for viscoelastic fluid flows. J. Non-Newton. Fluid Mech. 2017, 249, 63–78. [Google Scholar] [CrossRef]
- Lim, A.S.; Lopatnikov, S.L.; Wagner, N.J.; Gillespie, J.W., Jr. Investigating the transient response of a shear thickening fluid using the split Hopkinson pressure bar technique. Rheol. Acta 2010, 49, 879–890. [Google Scholar] [CrossRef]
- Lomakin, E.V.; Mossakovsky, P.A.; Bragov, A.M.; Lomunov, A.K.; Konstantinov, A.Y.; Kolotnikov, M.E.; Antonov, F.K.; Vakshtein, M.S. Investigation of impact resistance of multilayered woven composite barrier impregnated with the shear thickening fluid. Arch. Appl. Mech. 2011, 81, 2007–2020. [Google Scholar] [CrossRef]
© 2019 by the authors. Licensee MDPI, Basel, Switzerland. This article is an open access article distributed under the terms and conditions of the Creative Commons Attribution (CC BY) license (http://creativecommons.org/licenses/by/4.0/).

