Abstract
Deformation flows are the flows incorporating shear, strain and rotational components. These flows are ubiquitous in the geophysical flows, such as the ocean and atmosphere. They appear near almost any salience, such as isolated coherent structures (vortices and jets) and various fixed obstacles (submerged obstacles and continental boundaries). Fluid structures subject to such deformation flows may exhibit drastic changes in motion. In this review paper, we focus on the motion of a small number of coherent vortices embedded in deformation flows. Problems involving isolated one and two vortices are addressed. When considering a single-vortex problem, the main focus is on the evolution of the vortex boundary and its influence on the passive scalar motion. Two vortex problems are addressed with the use of point vortex models, and the resulting stirring patterns of neighbouring scalars are studied by a combination of numerical and analytical methods from the dynamical system theory. Many dynamical effects are reviewed with emphasis on the emergence of chaotic motion of the vortex phase trajectories and the scalars in their immediate vicinity.
1. Introduction
Coherent vortex structures are ubiquitous in the ocean. Their horizontal scales range from kilometres to thousands of kilometres (as in large-scale ocean gyres) [1,2,3,4]. From all scales, it is mesoscale vortices that have been recognised as particularly important in maintaining large-scale circulation patterns and contributing to a significant portion of mass transfer occurring in the ocean [5,6,7,8]. Because mesoscale vortices are relatively small, global circulation models still struggle resolving their complex dynamics in desirable detail. Moreover, it is often impossible to separate explicitly vortex dynamics within the full output of such models. Therefore, simpler models that govern the dynamics of a small number of isolated vortices still attract much attention [9]. Another application of simpler vortex models is to help formulate an objective definition of a vortex structure [10,11,12]. This in turn might help track more reliably vortices using global satellite altimetry data or model data [13,14].
The dynamics of vortex structures is often drastically affected by exterior flows. Moreover, if one considers the dynamics of vortex structures evolving in the ocean, such vortices hardly ever appear in isolation. More often, their dynamics is altered by the influences of large- and small-scale structures, shelf boundaries and bottom features. When located far from the vortex structures, all these influences can be approximated as linear contributions to the velocity field that governs the motion of the vortex structures. These linear contributions are called the deformation flow. If any forcing induces a 3D velocity field , decomposing the velocity tensor into symmetric and anti-symmetric parts results in
where and are the strain and rotational components of the deformation flow, respectively; ∇ is the gradient operator; and is the transpose. Considering two-dimensional flows makes and scalars S and . Often, such deformation flows are attributed to the influence of large-scale jets, which have sheared velocity fields [15,16,17,18,19,20,21,22,23,24,25], including multiple axes of strain associated with the deformation flow [26,27].
Systematic consideration of the influence of steady and unsteady deformation flows on two-dimensional vortex systems is the main objective of this review. In this review, we consider two simple models of isolated vortices subjected to deformation flows. The first one is the classic model of singular vortices, which, more than 150 years after its introduction [28,29], is still widely used in a variety of applications ranging from nano-scale in superfluids [30,31,32] to cosmological scales in astrophysics [33]. The singular vortex model is also very useful in getting qualitative insights into the motion of coherent vortical structures in the ocean [34,35,36,37,38,39,40,41,42,43,44,45,46,47,48]. It also allows a simple formulation of multipolar vortex systems that are instrumental in studying stationary vortex configurations [49,50,51,52,53]. The second model is the elliptic vortex model (and its generalisation—the ellipsoidal vortex model) [54,55,56,57,58,59,60,61]. This model is often useful for studying the evolution of isolated distributed vortices in the ocean, since almost elliptic vortices are often observed in the ocean by means of satellite altimetry [8,62]. This model allows one to study the stability of the vorticity distribution subject to various perturbations [63,64,65,66,67,68,69,70].
Both models are appropriate to study regular and chaotic motion of nearby fluid particles, since the vortex systems induce non-stationary velocity fields in their neighbourhood [71,72,73,74,75,76,77]. In the case of singular vortex systems, the nonstationarity originates from the vortex motion itself, whereas, in the case of an elliptic vortex, changing the vortex shape produces nonstationarity in the velocity field.
2. Problem Formulation
We consider a quasi-two-dimensional, rotating, inviscid, incompressible fluid [1,9,78,79,80,81,82,83,84,85]. The local vertical component of the vorticity accounting for the planetary rotation is , where is a unit, perpendicular to the plane, vector and f is the Coriolis parameter. f is assumed constant , which limits the physical scales of the structures to be mesoscale. The fluid density is also assumed to depend only on the vertical coordinate, . The quasi-two-dimensionality assumes that the mean depth of the problem, H, is much smaller than the horizontal scale, L, i.e., , and the Rossby number, , where U is a velocity scale, is . Another parameter that is ≪1 is the Froude number, , where N is the buoyancy frequency.
It is worth noting that the dynamics of oceanic mesoscale features (such as the vortices studied in the paper) may be affected by the beta-effect, that is the change of the Coriolis frequency with the latitude, if the size and strength of the vortices do not comply with the f-plane approximation, that is and . This implies essentially that and , the second one being stricter than the first one. Orders of magnitude of both are, respectively, 5000 km and 225 km for m/s, s−1 and m−1·s−1. The smaller value effectively indicates the typical size of structures that can be reasonably studied by the f-plane approximation. Otherwise, the evolution of the vortices becomes much more complicated including the possibility of a self-induced drift of isolated vortices due to the beta-effect. This, in turn, will produce much more complicated vortex evolution patterns compared to the ones reviewed in the paper.
All these assumptions lead to the quasi-geostrophic approximation, which can be formulated in terms of the potential vorticity conservation law for quasi-two-dimensional fluids [79]. The review deals with such fluids, considering mesoscale vortices in barotropic and layered configurations [1,9,36,37,42,43,79].
2.1. Quasi-Geostrophic Potential Vorticity Equations
The potential vorticity conservation law for a multi-layered fluid reads
where and are the potential vorticity and horizontal velocity components in the ith layer, respectively, and is the relative vorticity. Enumerator , where N is the number of layers. If , the model is either a single-layer model (barotropic) or a continuously stratified one.
These two-dimensional configurations allow reformulating the problem with the use of geostrophic relations
Following [1,36,37,86,87], we consider the potential vorticity in the form
where is the horizontal Laplace operator, is the interface perturbation between the adjacent layers, (rigid-lid approximation), is the bottom elevation. Dynamical pressure continuity at the layer interfaces results in , where g is gravity acceleration and , where is the ith layer density. Then, Equation (4) can be recast as
where is the outer Rossby radius of deformation in the ith layer. For a given potential vorticity distribution in each layer, one arrives at the equations for stream-functions [1,9,37],
with being the reduced gravity, and the mean density.
These equations are complemented by boundary conditions (either null flow, or conditions which ensure balanced vorticity fluxes [87]). In this review, we focus only on singular vorticity distributions [1,9,36,37], or piece-wise uniform ones [1,54,57,58,60,61,84,88]. One exception to the purely two-dimensional flows we address here is the case of a continuously stratified fluid. In this case, one introduces potential vorticity in the form [1,57,89].
where is the buoyancy frequency ( is the mean density). Only the case of constant stratification is considered (). By rescaling the vertical length-scale, one can recast the problem in the form [57,58,89]
It is worth noticing that the case of variable stratification can be addressed partially by formulating a spectral problem for the vertical operator [1,37,90].
2.2. External Deformation Flow
This review aims at presenting a short account of the dynamical phenomena attributed to the impact of deformation flows on vortices either with singular or distributed vorticity. Deformation flows are a collective term for flows that feature linear shear, strain and rotational rates of change. Manifestation of deformation flows accompanies almost all the interactions in the ocean and atmosphere. Deformation flows always appear near topography boundaries, coherent vortices, jets, large-scale gyres or other non-uniform flows. More generally, an arbitrary external perturbation can be expanded into a Taylor series up to the second-order terms, which gives the following flow form [54,55,57,58,59,61,84,89,91,92,93,94,95,96,97,98]
where corresponds to the strain component, is the rotational component, and (or ) is the linear translation. Which form of the deformation flow (the first or second equation) to use usually depends on the convention: the first one is common to singular vortex problems, while the second one can be found in elliptic (ellipsoid) vortex problems. Both variants are used in the literature, and they are equivalent up to rotation of the reference frame. Next sections present concrete vortex systems that satisfy the aforementioned general problem formulation.
2.3. Singular Vortices
The simplest vortex model is the singular (point-)vortex model [1,9,36,37,42,43,49,77,95,96,99,100,101,102,103].
The vorticity is concentrated in a countable number of points, around which there are finite circulations. Thus, the potential vorticity distribution is represented in the form
where is the potential vorticity corresponding to the vortex and strengths , where is the circulation that a singular vortex induces in the ith layer, and is the number of vortices in the ith layer. The potential vorticity distribution (Equation (10)) satisfies the potential vorticity conservation law provided the strengths remaining constant. Layer-wise equations of motion for each vortex are as follows
while the stream-function satisfies Equation (6) when substituting Equation (10) into the right-hand side.
The system in Equations (6) and (10) can be regularly inverted to give explicit forms for the stream-functions [9,37,43,79]. Since the system is linear, all the contributions from each vortex and external flows can be considered separately, while the resulting stream-functions combine them all.
After performing the inversion, one arrives at a set of equations that governs the dynamics of N singular vortices () embedded in M layers
where is the distance between vortices and . The type of vortex interaction is determined by the function . If the vortices are located in the same layer, their interaction is singular (meaning that the vortices cannot be located at the same point simultaneously), while different-layer vortices interact regularly (alignment of the vortices is permitted).
2.4. Uniformly Distributed Vortex Models: Elliptic (Kida Vortex), Ellipsoidal Vortices in Deformation Flows
Another important simple model is the uniform-vorticity distributed vortex model. Consider an ellipsoidal patch of the form
where the constant vorticity inside the ellipsoid differs from the exterior flow’s vorticity by a factor g. Thus, the potential vorticity is
where coordinate Z is related to the z-axis through Equation (8). The stream-function is then
where is defined in Equation (9), while the vortex-induced stream function complies with
Limiting the vorticity patch to retain its ellipsoidal form, the kinematic condition at the patch’s boundary ensues [54,57,61,84,97,104,105,106,107],
Moreover, the tangential velocities must be continuous. It is worth noting that Equation (17) is written given a negligible vertical velocity. From the kinematic conditions, it follows that
i.e., the ellipsoid’s centre is transported by the exterior flow. The ellipsoid parameters are governed by the following system
where is the angular rate of change of the ellipsoid provided absence of any exterior flow
The solution for Equation (16) is well-established [57,61,108]
where is determined through the algebraic relation
outside the ellipsoid and zero inside.
Equations of motions for an elliptic vorticity patch (Kida vortex) can be obtained analogously using the boundary function
The ellipse’s variables (semi-axes a, b and orientation ) are governed by the same set of Equation (19) with
The only difference is thus the self-induced rotation rate taken in the absence of any exterior flow. The ellipse (ellipsoid) centre moves as a passive scalar subjected to an exterior flow.
The next section addresses in detail a number of dynamical effects common to vortex systems subjected to deformation flows. To start, we consider linear effects.
3. Regular and Chaotic Dynamics in the Systems of Singular Vortices
The work in [109,110,111,112] establishes that periodic deformation flows may induce parametric instability of the vortex systems, including individual vortices, their ensembles and neighbouring scalars. A brief account of systems undergoing parametric instability is further presented.
3.1. Vorticity Centre Motion in Non-Stationary Deformation Flows
First, it is instrumental to derive the governing equation for the vorticity centre of an ensemble of singular vortices embedded in an M-layer flow [109,112,113]. Equation (12) governs the dynamics of singular vortices, whose combined strength is not zero, . For the vorticity centre’s coordinates
differentiating Equation (25) using Equation (12), one arrives at
The system in Equation (26) is linear and thus integrable. It is worth noticing similarity between Equation (26), governing the dynamics of the vorticity centre of a point-vortex system, and Equation (18) for the centre of an ellipsoidal (elliptic) vortex. Therefore, the following reasoning applies for both characteristics.
The solution of Equation (26) has the form
where is the fundamental solution of the corresponding homogeneous system
It is worth noticing that, in the special case
the system in Equation (28) (and Equation (26)) can be solved explicitly [109]. The relation in Equation (29) is satisfied either when , , or , , or . A solution for the case (a pure external shear) is obtained in [109]. Given the condition in Equation (29), one obtains
Let , be of the form
If , making use of a substitution , one arrives at
The solution to Equation (32) is bounded when and unbounded when . When the exterior flow is stationary , , the phase trajectories are either ellipses (for the bounded case) or hyperbolas (for the unbounded one). The centres of the family of ellipses (hyperbolas) are shifted to the point , .
When the form of the deformation flow’s alterations does not satisfy Equation (29), i.e., , the system in Equation (28) can be recast as Hill’s equation [114]. This in turn implies that, for some of the values of the parameters corresponding to bounded solutions in the special case of Equation (32), the system may evolve in a unbounded fashion. This is the case of parametric instability. A detailed analysis of the parametric instability occurring in the point-vortex systems is presented in [112]. Here, we only outline the basic concept and its implications on the vortex system dynamics. Figure 1 illustrates the vorticity centre trajectories in the case of parametric instability. When the parametric instability is realised, the trajectories diverge in a spiral fashion, while in the absence of the parametric instability, the trajectories remain bounded.
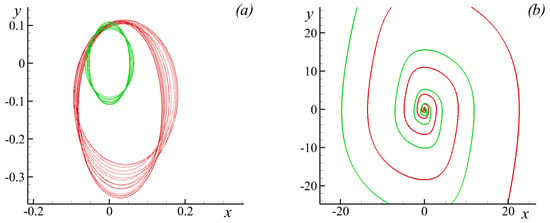
Figure 1.
Examples of trajectories of the point-vortex system: (a) in the absence of parametric instability (bounded trajectories); and (b) provided parametric instability (spiralling unbounded trajectories).
Moreover, it is possible to estimate analytically the parameters’ values that lead to parametric instability. Choosing the deformation flow in the form , (the frequencies are equal), and performing averaging over fast oscillations [115], one arrives at the estimate (see Appendix A for details)
that is valid for the leading parametric instability region in the parametric space. Figure 2 illustrates numerically-calculated parametric instability regions with the analytical estimate (solid line).
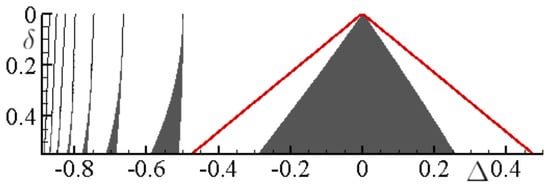
Figure 2.
Parametric instability regions (dark - unbounded motion of the vorticity centre) in the parametric space , . The solid line corresponds to the analytical estimate (33).
It is again worth recalling that because of the linear nature of parametric instability, it influences only the vorticity centre dynamics, while, in general, little can be said about the motion of the individual vortices. Their dynamics might be either bounded or unbounded, independent of the vorticity centre trajectory being bounded itself. This is addressed further in the review. Before that, we consider another vortex problem where parametric instability can also occur but in a slightly different way.
3.2. Regular Behaviour of Relative Motion of Two Singular Vortices
When considering a system of point vortices without additional constraints, besides being Hamiltonian, the system conserves the linear momentum and angular momentum. Contrary, if the system is subject to a deformation flow, the angular momentum
is no longer conserved provided the vorticity centre and deformation centre are shifted relative to each other [116]. Moving from the original reference frame into the one that is bound to the vorticity centre
allows one to recast the system in Equation (12) into a symmetric form
with two additional motion integrals [112].
3.2.1. Two Singular Vortices in An Alternating Deformation Flow
For example, we consider two singular vortices located in different layers of a two-layer model. In the literature, this vortex structure is usually referred to as a heton [9,34,35,117]. The governing equations are then
where , is the modified Bessel function of order 1, and is omitted for brevity. Typical steady-state configurations are very similar to the one-layer (barotropic) case [95,109,116,118,119]. Using the fact that the linear momentum is conserved, it is enough to study the evolution of one of the vortices, while the trajectories of the other one come from the simple relation [95,116]
Introducing dimensionless parameters and coordinate transformation
one obtains the equation of motion of one of the vortices
Now, let us return to the two-layer formulation and analyse stationary configurations, i.e., when the deformation flow’s parameters are constant , . Equating the right-hand side of Equation (40) to zero, we notice that the expressions in square brackets simultaneously become zero only if . This state corresponds to constant rotation of the two vortices with the angular velocity
If and are of different signs, there is a zero rotational frequency. At , the term remains finite thus ensuring that the central fixed point is elliptic.
When , there appear hyperbolic points in the phase space [95,116]. From Equation (40), two sets of fixed points are possible , or . Hence, for the fixed points, we have
For the barotropic case, the fixed points can be obtained explicitly ()
For definiteness, let . Calculating the eigen-values of the linearised the system in Equation (40) results in
Apart from the central fixed point at , which is always singular elliptic, all the other fixed points change their type depending on the sign of . Given , the fixed points at the y-axis are hyperbolic, while at the x-axis elliptic. Typical configurations of the phase space are shown in Figure 3. All other configurations can be obtained from the presented ones by rotating the phase space by .
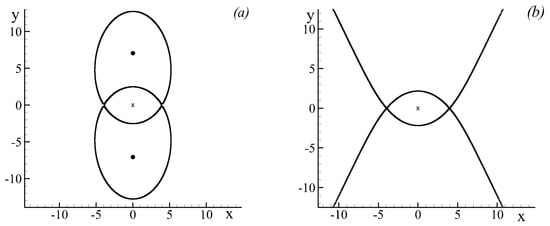
Figure 3.
Typical phase portraits of the two-vortex problem in a steady deformation flow: (a) rotation dominates over strain, ; and (b) strain dominates rotation, .
3.2.2. Parametric Instability of the Relative Vortex Motion Near Elliptic Fixed Points
Now, after introducing the stationary configuration of the two-vortex system, one can perturb it by adding harmonic oscillations to the deformation flow in the form of Equation (31). This perturbation can destabilise the motion of the vortices. However, if the perturbation is relatively small, its effect up to the second order of magnitude can induce parametric instability near the elliptic fixed points [119]. For definiteness, let the regular elliptic fixed points lay on the x-axis (as in Figure 3 rotated by ). Linearising the equation of motion (Equation (40)) near the regular elliptic fixed point , one arrives at
where are small deviations from the fixed point. Considering only the homogeneous part of the linearised equation, one again encounters Hill’s equation, which can maintain parametric instability. An analytical estimate for the leading parametric instability region gives (see Appendix A)
where and are same as in Equation (33).
The estimate suggests that the strongest instability occurs when the deformation flow’s oscillations have frequency .
Qualitatively similar results can be readily obtained for the case of two singular vortices embedded in a deformation flow with an arbitrary number of layers.
It is worth recalling that the parametric instability can only be considered in the linearised system (infinitesimal deviations from the fixed elliptic points of the corresponding stationary configuration), while the original system, which is fully nonlinear, responds to the deformation flow’s oscillations in a nonlinear way, which includes manifestation of chaotic motion of the vortices. The next section analyses the chaotic motion of the vortices subject to an altering deformation flow.
3.3. Chaotic Dynamics of Singular Vortices
When vortex systems are perturbed by a time-dependent perturbation, they may start manifesting chaotic behaviour, which is observed through high sensitivity to small changes in initial conditions [120,121,122,123]. On the other hand, often only certain fractions of the physical space are destabilised into chaotic motion, while other parts remain stable, i.e., exhibit regular behaviour. A typical scenario of transition to chaotic motion of steady-state configurations featuring hyperbolic fixed points involves splitting of the separatrix (the self-intersecting stream-line) near its hyperbolic points into stable and unstable manifolds [124,125,126], thus creating a chaotic motion region near the transverse intersections of the manifolds. However, as the perturbation increases, larger and larger regions of the phase space are involved in chaotic motion due to multiple nonlinear resonances occurring in the system [120,121,122,123,127].
It is worth pointing out that, unless stated otherwise, we consider only deterministic chaotic motion, i.e., there is no stochasticity (random influences) in the system, and all the uncertainty in the system evolution originates from the high sensitivity of the system against small changes in the perturbations and initial conditions.
An instrumental technique to study nonlinear dynamical systems experiencing periodic perturbation is constructing numerical Poincaré maps. This allows us to visualise regions of regular motion and regions of chaotic one in the phase space. A Poincaré map plots a trajectory of the system every perturbation period. Regular trajectories are plotted as orderly structured orbits, while chaotic trajectories are scattered within the chaotic region disorderly [123].
Consider the barotropic case in Equation (41) with periodic perturbations of the form
Since the forms of the perturbations are same, there is no global parametric instability, but the local parametric instability of the linearised system is still possible. Under this local parametric instability, vortex trajectories of the linearised system diverge in a spiral manner from the elliptic regular fixed points. On the other hand, in the fully nonlinear system, the spiralling trajectories are bounded by nonlinear effects [119]. The influence of these nonlinear effects are much more important because they can inhibit the spiralling not only near the separatrix region, but also near the elliptic fixed point, if a stability island appears nearby due to nonlinear resonances.
Often, authors link, to some degree, the appearance of parametric instability in the linearised systems and chaotic dynamics characteristic of the fully nonlinear systems [128,129,130,131,132,133]. However, when considering a finite vicinity from the point, around which the linearisation is carried out, the linear influence of parametric instability attenuates very fast. This suggests dismissing the linear analysis and consider the fully nonlinear systems instead. To support this result, we present Poincaré maps corresponding to the parameters for strongest parametric instability (Figure 4). The maps show that the dynamics is controlled by the distribution of stability islands, which correspond to nonlinear resonances, and all the spiralling divergence induced by linear parametric instability is suppressed by the stability islands that occupy the region corresponding to the regular elliptic fixed point. On the other hand, if one changes the perturbation frequency such that it no longer induces linear parametric instability, the stability islands move away from the elliptic fixed point region allowing the linearised system to be applicable [119].
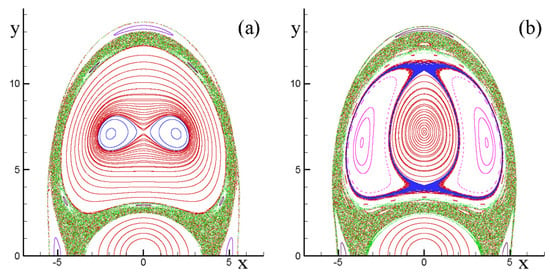
Figure 4.
Poincaré maps of the barotropic two-vortex system (, , ) and perturbation magnitude : (a) perturbation frequency —strongest linear parametric instability in the system linearised near the elliptic fixed point; and (b) perturbation frequency —no linear parametric instability.
Nevertheless, it is worth noting that weakly nonlinear theory can be used, by means of perturbation expansions in , to predict the transition between regular oscillations and chaotic behaviour. Assuming that the external deformation flow contains both a fast time and a slow time variation, a weakly nonlinear equation can be obtained for the amplitude of vortex motion around the elliptic fixed point [95]. Depending on the slow time forcing frequency, various branches of solutions exist for this equation, some of them stable and some unstable; a hysteresis cycle occurs between these branches. The exact form of the weakly nonlinear solution can be determined as a function of the forcing flow parameters for null low-frequency forcing. As increases, the vortex motion around equilibrium first exhibits a slow pulsation. Then, as is again increased, the amplitude of this motion becomes very large and the vortices escape the vicinity of the elliptic point. This is the onset of chaos.
3.4. Regular and Chaotic Motion of a Reduced Two-Layer Three-Vortex Problem in a Non-Stationary Deformation Flow
Although, generally, systems that consist of more than two singular vortices subject to stationary deformation flows manifest chaotic behaviour, special symmetric configurations can remain regular and integrable. Of this type is a reduced three-vortex problem, when one of the vortices is positioned exactly at the point where the deformation centre and the vorticity centre coincide, while the other two vortices have the same strengths and are positioned symmetrically relative to the central one. In this case, given a stationary deformation flow, the system behaves regularly [96]. If the superimposed deformation flow is time-varying, the system manifests chaotic dynamics.
Thus, let us consider a two-layer flow (both layers are of equal widths) subject to an external deformation flow of the form in Equation (48). Two singular vortices of equal strengths are positioned symmetrically against the deformation centre in the bottom layer, while another vortex of strength (here, only the case is considered) is positioned at the deformation centre in the upper layer. Hence, the system possesses a mirror symmetry for any of the bottom vortices. The governing equations can be reduced to the form
where are polar coordinates written for any of the bottom vortices.
Figure 5 exemplifies typical stationary phase portraits for the motion of one of the bottom layer vortices subject to a stationary deformation flow. Since the system is symmetric, the second bottom vortex has the same phase portraits. The central upper-layer vortex is always stationary, and it affects the dynamics of the other two vortices by accelerating (if it has the same sign circulation as the bottom vortices) or decelerating (if its circulation is of the opposing sign) the bottom vortices. Introduced this way, the central stationary vortex engenders, compared to the two-vortex problem (see Figure 3a), a number of new phase portraits, most notably the appearance of two separatrices instead of one. The diagonal panels (, , and ) exemplify a reconnection sequence, a process when the outer separatrix becomes the inner one and vice versa.
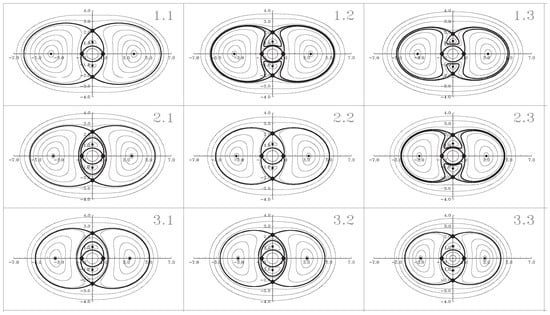
Figure 5.
Stationary phase portraits for any vortex in the bottom layer for various combinations of parameters and , respectively: rows, , , and ; and columns, , , and . The diagonal panels (, , and ) represent the process of reconnection.
It is often illustrative, before tackling the chaotic dynamics, to first analyse stationary phase portraits. Since all the trajectories are closed in the stationary case, one may start by calculating the corresponding frequencies along the closed phase trajectories. Notable phase trajectories are separatrices, which are designated phase trajectories with zero frequencies. Figure 6 illustrates the frequencies of either of the bottom-layer vortices depending on the initial position at the corresponding symmetry axis.
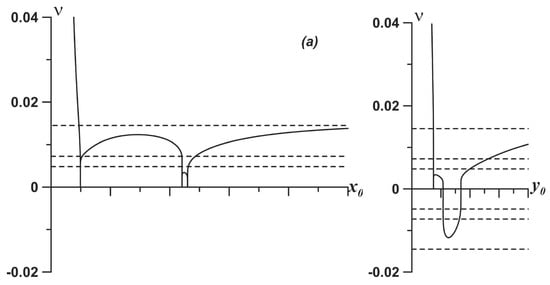
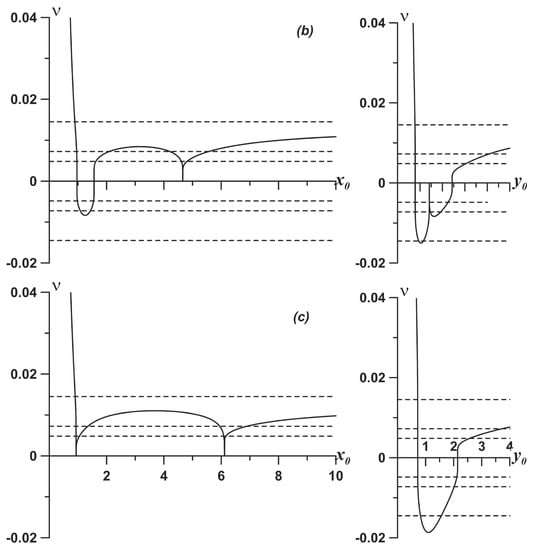
Figure 6.
Steady-state rotation frequencies depending on the initial position at the corresponding symmetry axis for the phase portraits shown in Figure 5: (a) ; (b) ; and (c) . The dashed lines show the perturbation frequencies used to induce chaotic motion in the system: ; ; .
Knowing the shape of the frequency curves may help detect trajectories that are most susceptible to perturbations of certain perturbation frequencies. Such perturbations resonate with the corresponding steady-state phase trajectory frequencies giving rise to nonlinear resonance phenomena [121,122,123]. A simple physical intuition about a nonlinear resonance is that the nonlinear resonance with a winding number appears in place of the steady-state trajectory whose frequency is proportional to the perturbation frequency as . Choosing a small value of the perturbation magnitude induces weak destabilisation of the system. Figure 7 demonstrates that narrow layers of chaotic motion emerge in place of the steady-state separatrices. The Poincaré maps correspond to the steady states , , and . Figure 7c corresponds to the case of a separatrix reconnection. However, this weak perturbation does not break a barrier of regular motion between the narrow chaotic layers that emerge in place of the steady-state separatrices. Increasing the perturbation magnitude results in increased areas occupied by chaotic motion. The barrier between the two chaotic layers associated with the two steady-state separatrices vanishes and the chaotic trajectories from within the previously disjoint chaotic regions can now travel to the other one (a trajectory flips-over from one stochastic layer to the other one [96,134,135]). It is worth noticing that, despite the fact that the barrier is already absent, the flip-overs are still relatively rare, i.e., some remnants of the barrier continue prohibiting a complete merger of the chaotic layers.

Beside the reconnection of the steady-state separatrices, another type of reconnection is possible in the perturbed system. In this case, reconnection of separatrices belonging to stability islands in the perturbed system can occur. A stability island is a region of stability associated with a particular nonlinear resonance occurring in the perturbed system at the corresponding perturbation frequency. The perturbation frequency corresponding to the perturbed systems shown in Figure 6 is chosen to be larger than the maximal rotational frequency attainable in the steady-state system. This choice in fact results in a moderately weak destabilisation of the perturbed phase space because only secondary nonlinear resonances appear in this case. However, if one chooses a perturbation frequency that is smaller than the corresponding maximal rotational steady-state frequency, the primary nonlinear resonances may appear (given a suitable perturbation magnitude). For this purpose, we set the perturbation frequency , so nonlinear resonances appear in the perturbed system (the perturbation magnitude is left the same ). They occupy the region between the now vanished steady-state separatrices (see Figure 8a). The resonance manifests itself in the Poincaré map as two stability islands that are represented by closed orbits within the chaotic region. Thus, in order to facilitate vanishing of the barrier between the two chaotic regions, the system should be perturbed with a perturbation frequency that resonates with the frequency corresponding to the steady-state trajectory somewhere near the central region between the two steady-state separatrices. In this case, a nonlinear resonance is excited at the corresponding frequency and a stability island that is actually destabilising its neighbourhood occurs at the corresponding phase trajectory.
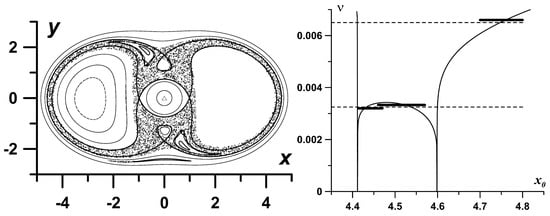
Figure 8.
A Poincaré map for the perturbed the system in Equation (49) (perturbation magnitude , and frequency ) demonstrating the manifestation of stability islands corresponding to a nonlinear resonance . The solid bold lines show the corresponding steady-state separatrices.
To demonstrate that the presence of separatrices with hyperbolic fixed points in the steady states is not necessarily required to effectively perturb the vortex system, let us consider an alternating deformation flow of a different form , while retains its form from Equation (48). The steady state may feature no separatrix, therefore each bottom layer vortex may always move in the same direction independent on its initial position. However, if there is no separatrix, the corresponding steady-state rotational frequency curve features a local minimum. Since the trajectory corresponding to the local minimum is surrounded by trajectories of equal frequencies, by exciting these trajectories, one can achieve effective destabilisation of the system. Figure 9a illustrates the steady-state rotational frequencies for the case of no separatrix (the blue curve) and two circular separatrices (the black one). Figure 9b,c depicts the corresponding Poincaré maps with the solid lines corresponding to the steady-state zero frequency trajectories. Because the neighbouring trajectories have the same frequencies, they are excited by the same perturbation, thus facilitating effective overlapping of the corresponding stability islands leading to effective destabilisation of the system even without having actual steady-state separatrices [96].
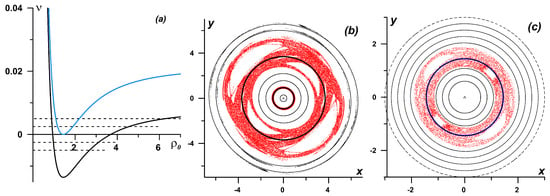
Figure 9.
(a) Steady-state rotational frequency curves for the case of a deformation flow with zero mean strain (the black curve is and the blue curve is ); and their corresponding Poincaré maps with perturbation magnitudes: (b) ; and (c) . Perturbation frequency, , and its half (and also the corresponding negative values) are plotted as dashed lines.
Now, let us consider the case of a purely strained exterior flow, i.e., let in Equation (48). When , the exterior deformation flow is hyperbolic, meaning that phase trajectories of the vortices outside the central region, where the interactions between the vortices are much stronger than the influence of the deformation flow, move to infinity along hyperbolic-like curves. In this case, the separatrices of the flow can be open and thus, when perturbed, the vortices can jump from the regions of finite motion into the region of infinite motion. Examples of Poincaré maps for typical configuration of the corresponding steady-states are shown in Figure 10. When perturbed, a vortex trajectory spends some time near the steady-state separatrices (bold lines in the maps) involved into chaotic motion. If the vortex trajectory starts from within the interior steady-state separatrix region, it may remain near it forever provided some barriers withstand the perturbation (similar to the case shown in Figure 10c; however, the vortex trajectory in the figure does eventually drift to infinity but after a long time). On the other hand, if the vortex trajectory starts near the exterior steady-state separatrix region, it will likely drift into the exterior hyperbolic region and then to infinity (see Figure 10a,b).
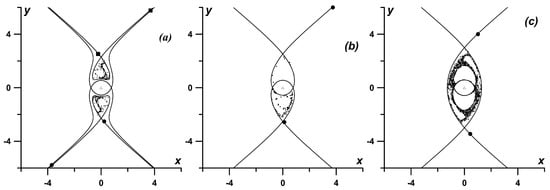
Figure 10.
Examples of Poincaré maps for a purely strained deformation flow () for different steady-state separatrix configurations: (a) , , and ; (b) , , and ; and (c) , , and . The corresponding steady-state separatrices are plotted by solid lines. The positions of the bottom vortices as they enter and leave the region of interest are marked by squares and circles.
Other types of varying deformation flows that can lead to structural reshaping of the system’s phase portrait are studied in [96].
Extending this study to two finite-area vortices (with a piecewise constant vorticity distribution), it has been shown that their horizontal and vertical interactions are modified by the influence of steady or time-varying external shear or strain. In the absence of any external flow, horizontal merger, or vertical alignment occur only if the two vortices are closer than about three vortex radii.
In the presence of steady external strain and rotation, when the vortices initially lie on the axis of elliptic points, merger is prevented and is replaced by filament shedding and final expulsion of the two vortices [136]. This occurs for close vortices and weak strain or for distant vortices with stronger external strain. When the external strain is moderate, and when vortices are initially located at the elliptic points, they remain steady at this location; when close to the elliptic points, they oscillate around these points. A newly observed regime is found when externally imposed rotation advects the two vortices from their initial position towards the compressional axis of strain leading to their merger. When the vortices are initially on the axis of hyperbolic (saddle) points, the external flow acts against their merger. The same types of evolution occur where merger is replaced by vortex alignment [137]. When the external strain is unsteady, steady states disappear but slow oscillations of the two vortices near the elliptic points still exist. More straining out is observed for distant vortices. When the unsteady component of the external flow is increased, distant vortices move irregularly in the plane and are rapidly eroded. Finally, when a vortex inside a rotating, stratified fluid interacts with a like-signed vortex at the upper fluid surface, the influence of external strain leads to their strong elongation and irreversible expulsion from the centre of the plane [138].
For now, we have concluded our brief analysis of the two-vortex (and reduced three-vortex) system subjected to constant and alternating deformation flows. Typical steady-state configurations are shown. When perturbed, the vortex systems can be destabilised into chaotic motion. However, the motion of the vorticity centre, whose trajectory can be bounded or unbounded provided the manifestation of parametric instability, is always regular. We return to the two-vortex system and study how it can advect its neighbouring passive scalars further in the review.
4. Regular and Chaotic Dynamics in the Systems of Distributed Vortices (Elliptical and Ellipsoidal)
Now, we consider the second simple model—a distributed ellipsoidal vortex subject to an external deformation flow. The ellipsoidal model is a generalisation of the well-known elliptic vortex model taking into account a simple vertical density structure of the flow. In fact, at each vertical level, the ellipsoidal model reduces to the elliptic vortex model and they can be analysed interchangeably. To start, we recall the regimes of regular motion of the ellipsoidal (elliptic) vortex model.
4.1. Regular Dynamics of an Ellipsoidal Vortex
The governing equations for the ellipsoid motion are Equations (19) and (20). Introducing variable instead of Equation (19), one arrives at
where . The area of the elliptic patch at each vertical layer is constant . Integrating Equation (50) given constant e and , one arrives at
where
Making use of the solution in Equation (51) allows one to analyse possible regimes of the ellipsoid motion, which are same for the elliptic vortex model established by Kida [54,66]. Figure 11 illustrates the possible regimes of the vortex motion.
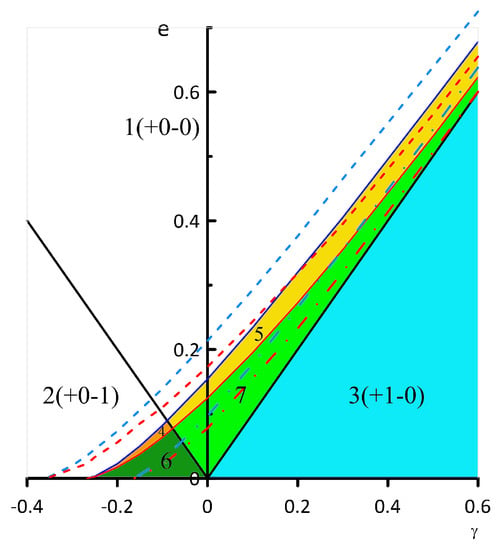
Figure 11.
Regimes of the ellipsoidal vortex motion depending on the parameters of the deformation flow.
Only the case is considered since the case can be obtained by linear transformation , , . All the phase portraits feature a quasi-separatrix at the critical value , , when the ellipse degenerates to a circle. All the other fixed points have angular coordinates . Motion Regime 1 in Figure 11 features no fixed points, which means that the ellipsoid elongates to infinity (see Figure 12a). One elliptic fixed point appears for Regimes 2 and 3 at the coordinate and , respectively (see Figure 12b,c). Phase trajectories near the elliptic fixed points correspond to the ellipsoid oscillating gradually changing its aspect ratio. Phase trajectories that are above the quasi-separatrix (the bold black lines plotted in the phase portraits) correspond to the ellipsoid rotating. All the other motion regimes feature two fixed points at , one of which is elliptic and the other is hyperbolic. Since there is a hyperbolic point, a typical separatrix also appears. Regimes 4 and 6 also feature one additional elliptic fixed point at . The corresponding phase portraits are shown in Figure 13. The shapes of the separatrices is different for these two regimes. Regime 6 allows the ellipsoid to rotate with small aspect ratio variations (rotation regime below the separatrix shown in Figure 13b).
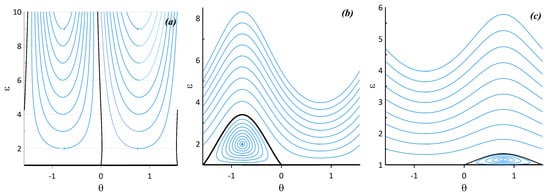
Figure 12.
Phase portraits of the ellipsoid vortex motion corresponding to Regimes: (a) 1 ( and ); (b) 2 ( and ); and (c) (3 and ).
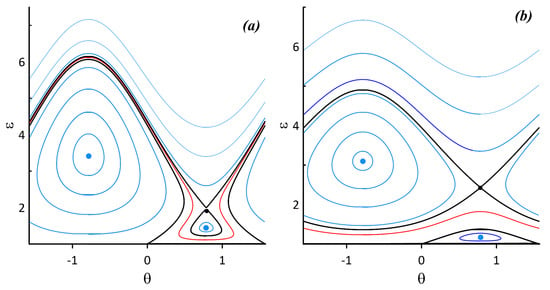
Figure 13.
Phase portraits of the ellipsoid vortex motion corresponding to Regimes: (a) 4 ( and ); and (b) 6 ( and ).
Regimes 5 and 7 (see Figure 14) differ from Regimes 4 and 6 in that there are no additional elliptic fixed points, hence only a pair of elliptic and hyperbolic points exists in either regimes. Near the elliptic fixed point the ellipsoid nutates periodically, while above the separatrix, the ellipsoid elongates to infinity.
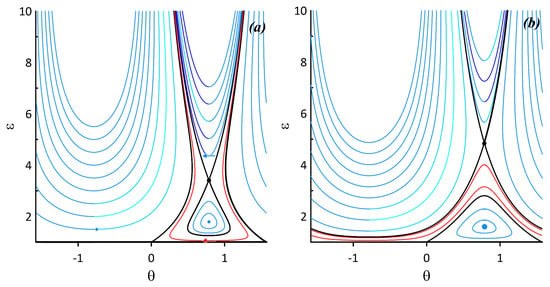
Figure 14.
Phase portraits of the ellipsoid vortex motion corresponding to Regimes: (a) 5 ( and ); and (b) 7 ( and ).
Since the phase portraits of the ellipsoidal (elliptic) vortex model feature elliptic and hyperbolic fixed points, it is tempting to perturb this steady-state model by superimposing harmonic alterations to the deformation flow similar to the case of the singular vortex model (48).
Parametric Instability of the Relative Motion of an Elliptic Vortex
Now, consider an elliptic vorticity patch (or any horizontal level of the ellipsoid vortex model) subject to an alternating deformation flow of the form in Equation (48)
The governing equations are Equation (50) with from Equation (24) and the time-dependent exterior flow (Equation (54)).
When the exterior flow is stationary, the steady-state fixed points in the corresponding phase portrait follow from [54,66]
A full classification of all the possible dynamical regimes in the steady-state case is carried out in [66]. Here, it is important to notice that the system has either no elliptic fixed points or only a single one. Now, one can consider a periodic exterior deformation flow (Equation (54)) and small deviations from the elliptic fixed point,
where , is the solution of Equation (50) given a stationary deformation flow (, in Equation (54)). Then, by linearising Equation (50), and taking only the homogeneous part (similar to the case of the singular vortex model), one obtains
We arrive at another Hill’s equation and thus the possibility of parametric instability. Similar to Equation (33), one can get an estimate for the boundaries of the leading parametric instability region (see again Appendix A)
The estimate shows that the leading parametric resonance occurs at a frequency twice the proper frequency of the linearised system. A more detailed numerical analysis of the parametric instability in the elliptic vortex model can be found in [111]. When the parametric instability manifests itself, the elliptic vortex phase trajectory spirals out from the elliptic fixed point. In the physical space, it means that the vortex nutates gradually increasing its aspect ratio and maximal angle of nutation at each quasi-period until the corresponding phase trajectory reaches the region of high nonlinearity near the steady-state separatrix.
4.2. Chaotic Dynamics of an Elliptic Vorticity Patch Subject to an Alternating Deformation Flow
When, instead of linearising it, one considers the full nonlinear system governing the evolution of an elliptic vorticity patch (Equation (50)) in an alternating deformation flow, the system starts manifesting chaotic dynamics. The regions near the hyperbolic points are most susceptible to the perturbations. It is of interest to track the evolution of stability islands appearing in the perturbed system as the perturbation frequency is changed. We consider a similar perturbation form
As an example, a drift of the stability island associated with the leading nonlinear resonance is shown in a series of Poincaré maps in Figure 15. The perturbation magnitude is taken relatively small () in order to make the destabilisation of the phase space less intense. As the perturbation frequency increases, the stability island appears near the steady-state hyperbolic point (see Figure 15a). Increasing the perturbation frequency drives the stability island towards the region associated with the steady-state elliptic fixed point (Figure 15b). When the perturbation frequency is close to the maximal eigen-frequency of the stationary phase portrait, the stability island and the stability region associated with the steady-state elliptic fixed point start interacting. As a result, the stability island associated with the nonlinear resonance occupies the central stability region (Figure 15c). Moreover, the next stability island associated with the nonlinear resonance appears near the steady-state hyperbolic fixed point.

Figure 15.
Poincaré maps detailing the drift of the stability island associated with the nonlinear resonance as the perturbation frequency is increased: (a) ; (b) ; and (c) .
It is well-established [139,140] that the size of chaotic region changes non-monotonically as the perturbation parameters vary monotonically. This is because the size of the chaotic region actually depends on the population of stability islands appearing in the perturbed system. As an example of the phenomenon, a sequence of Poincaré sections (see Figure 16) details the phase portrait changes when the perturbation frequency is increased.
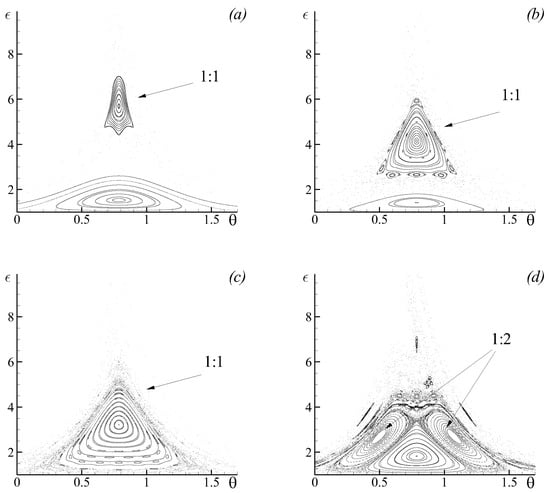
Figure 16.
(a–c) Poincaré maps detailing the stability island induced by the nonlinear resonance merging with the central stability region as the perturbation frequency is increased for the perturbation magnitude : (a) ; (b) ; and (c) . (d) A similar process for the stability island for and .
Let the perturbation magnitude be somewhat larger . As the chosen perturbation magnitude is much larger compared to the case in Figure 15, a much larger area is involved into chaotic motion. As the stability island induced by the nonlinear resonance appears in the phase space (see Figure 16a for the perturbation frequency ), it is separated from the central stability region associated with the steady-state fixed elliptic point by a wide chaotic region. As the perturbation frequency is changed, the stability islands drift towards the central stability region (see Figure 16b for ). Finally, when the perturbation frequency is changed further to become close to the maximal steady-state eigen-frequency, the stability island occupies the central stability region (Figure 16c), which regularises the system. As the perturbation frequency is increased further, the next nonlinear resonance appears in the system, and a similar process of the resonance occupying the central stability region proceeds (an intermediate configuration is shown in Figure 16d).
This concludes the first part of our review, devoted to the regular and chaotic dynamics of analytical vortex models (the singular vortex model and ellipsoidal (elliptic) vortex model) subject to stationary and non-stationary deformation flows. The second part reviews the scalar fluid particle advection induced by the models considered in the first part.
5. Regular and Chaotic Advection of Scalars Induced by Point Vortex Systems Subjected to Deformation Flows
Vortex systems are also of great interest because they facilitate effective stirring and transport of scalars. This has many implications, for instance, on the water transport in the ocean and atmosphere. Estimates show that a significant part of ocean recirculation is due to the action of coherent mesoscale eddies [2,3,6,7,141], which can be reasonably approximated by point-vortex and elliptic-vortex models [9,34,35,40,142,143,144,145,146]. This section analyses chaotic advection of passive scalars induced by the vortex systems subjected to exterior deformation flows.
If the advection system experiences periodic perturbations (either from exterior flow alterations or from internal perturbations induced by the periodically moving vortices), constructing Poincaré maps provides us with an effective means to study chaotic advection. However, despite being a very powerful method to detect chaotic motion regions, it is limited to periodically perturbed systems. If the system experiences aperiodic perturbations or a superposition of periodic ones with incompatible frequencies, one needs to resort to other methods to study chaotic motion. Since such aperiodically perturbed systems often resemble stochastic systems, many methods of identifying regular and chaotic motion regions rely on tracking the evolution of ensembles of Lagrangian particles and calculating some measures along trajectories of the particles. Of this class is calculating various measures identifying local changes in the flow topology such as Finite-Time Lyapunov exponents (FTLE) [147,148,149,150], Finite-Size Lyapunov exponents [62,151], complexity measures [5,152], local arc-lengths [153] and methods alike.
5.1. Barotropic Flow with Two Singular Vortices Subject to Deformation Flow
To start, we consider barotropic singular vortex models, such that the interaction function in the governing Equation (12), . The phase trajectories of the vortex system itself are similar to the ones shown in Figure 3. In the case of a dominantly straining external flow, one has a hyperbolic system (similar to the one shown in Figure 3b), whereas a dominantly rotating external flow induces elliptic vortex trajectories at infinity (Figure 3a). Only the case of a dominantly rotating external flow features elliptic fixed points and thus periodic vortex trajectories in their immediate vicinity. This salience can be used to study the advection of fluid particles induced by the vortex system. Let us consider a passive fluid particle moving in a velocity field induced by two singular vortices of strengths , and an external deformation flow of the form in Equation (9) with Equation (48). A particle trajectory is governed by a set of Hamiltonian equations
where , is the distance from the current particle position to the current position of vortex i, .
Now, let us focus only on the case of a stationary external deformation flow, so , . Even taking into account the stationarity of the deformation flow, the system in Equation (60) is still non-stationary in general because the vortex coordinates depend on time. To make the system stationary one needs to position the vortices precisely at the fixed points of the corresponding vortex system (see Figure 3). Once positioned this way, the vortices remain stationary and thus induce a stationary velocity field for passive fluid particles in their neighbourhood [74,75,103]. For definiteness, let the fixed elliptic points lie on the y-axis, thus their x-coordinate is . The y-coordinate can be obtained from the algebraic equation
where , is the position of the i-vortex fixed elliptic point. Despite having up to nine fixed points in the steady-state fluid particle system, the types of the three defined by Equation (61) determine the possible phase space topology [116]. When any of the three fixed points changes its type as the deformation flow’s parameters are varied, the phase space topology restructures itself to accommodate for the change. Figure 17 depicts possible phase space configurations of the advection system given the vortex strengths , .
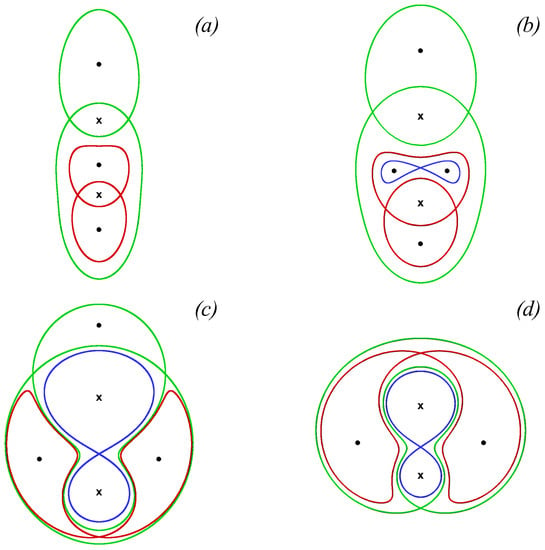
Figure 17.
Phase portraits of the stationary advection system in Equation (60) given , , and as the absolute value of the strain intensity is being decreased, : (a) ; (b) ; (c) ; and (d) .
The phase portraits feature plenty of fixed hyperbolic points. To perturb the advection system, one needs to superimpose time-dependent oscillations. The problem with superimposing periodic perturbations to the exterior deformation flow similar to Equation (48) is that such perturbations destabilise the dynamics of the vortices into a quasi-periodic or even chaotic motion. Therefore, the advection system would experience almost random perturbations, which would be harder to separate between the influence from the exterior flow perturbations or the irregular motion of the vortices themselves. Another way to perturb the advection system is to shift the vortices from their stationary positions, thus allowing them to periodically oscillate along closed phase trajectories of the phase portraits shown in Figure 3. This periodic oscillation also serves as a perturbation to the advection system. One limitation of such an intrinsic perturbation is that it cannot be controlled voluntarily as the superimposed harmonic perturbations are. Indeed, as one shifts the vortices from their stationary position, the frequency and magnitude of their motion are fixed according to the corresponding vortex phase trajectory. Shifting the vortex initial position differently will generally produce again a new set of the perturbation frequency and magnitude. This significantly limits this type of perturbation to induce effective chaotic advection in the advection system. Nevertheless, chaotic advection can still manifest itself.
Figure 18 depicts a typical vortex rotational frequency curve that shows the vortex rotational frequency along closed orbits of the vortex phase portrait shown in Figure 3 depending on the initial y-position. At infinity the frequency approaches the value (shown by a straight dashed line), which is imposed by the deformation flow. Near the separatrix, the frequency drops to zero, then it increases to reach a plateau. After the second separatrix crossing, the frequency tends to infinity as it approaches the central singular point. The plateau in-between two separatrix crossings features a local maximum, which corresponds to the fixed elliptic point. Therefore, this plateau region corresponds to allowed perturbation frequencies when the vortex is shifted from its stationary position. Moreover, altering the perturbation frequency is only possible with simultaneously altering the perturbation magnitude by means of shifting the vortices further from their stationary positions. Figure 19 exemplifies Poincaré maps for the perturbed advection system for different values of the strain parameter when the underlying vortices are shifted from their stationary positions by in the positive y-direction.
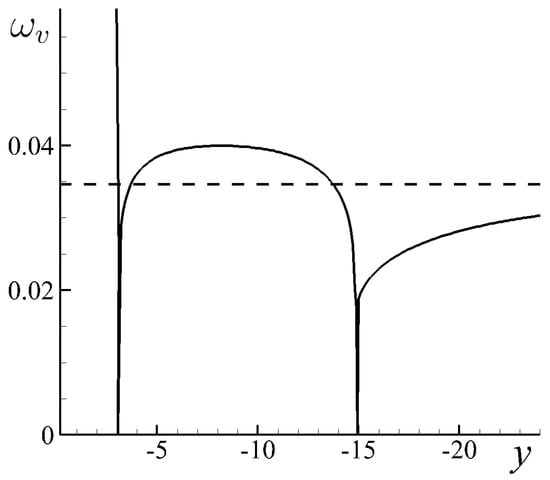
Figure 18.
Rotating frequency of the phase portrait similar to the one shown in Figure 3a. The dashed straight line corresponds to the asymptotic rotation frequency imposed by the exterior deformation flow . Zero values of the frequency correspond to the separatrices of the vortex phase portrait. The plateau in-between the zero values serves as the perturbation frequency for the advection system.
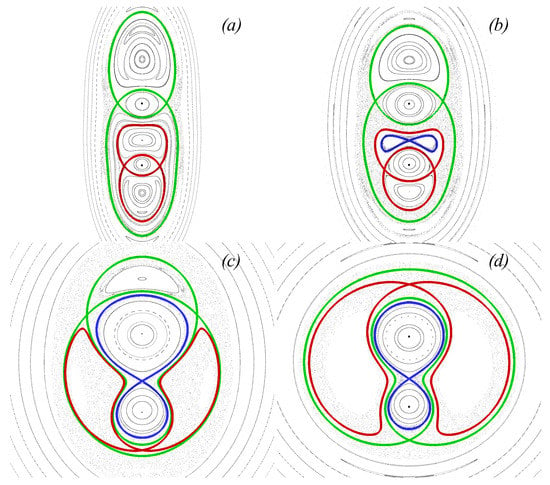
Figure 19.
Poincaré maps of the perturbed advection system as the vortices are shifted by from their stationary positions. Colour-coded are the steady-state separatrices, which vanish as the perturbation is toggled. The corresponding steady-state configurations shown in Figure 17 for : (a) ; (b) ; (c) ; and (d) .
When perturbed, the steady-state separatrices vanish and narrow chaotic advection regions appear instead. As the strain component intensity is decreased (consequently from Figure 19a–d), the system becomes more localised. This nears the stochastic regions associated with the different steady-state separatrices until they merge.
5.2. Fluid Particle Advection in the System Subject to an Alternating Deformation Flow in the Parametric Instability Regime
Now, let us consider the advection of fluid particles governed by the system in Equation (60) with two singular vortices subject to an alternating deformation flow. Thus, let S and be of the form in Equation (48). As established above, the two-vortex system can experience parametric instability that leads to unbounded spiral motion of the vorticity centre, as in Section 3.1. The advection system now undergoes perturbations not only from the exterior flow’s alternations, but also from the motion of the vortices themselves, which can be chaotic or quasi-periodic. Therefore, this sort of perturbation is not periodic and the machinery of the Poincaré map cannot be applied. Instead, we use the notion of Finite-Time Lyapunov Exponents that measure local stretching of ensembles of Lagrangian particles in time.
Let us choose the exterior flow’s parameters that lead to parametric instability of the vorticity centre of two singular vortices [118]. The form of the deformation flow alterations is Equation (31), where , and with , , , and . These parameters result in parametric instability of the vorticity centre, which manifests itself through an unbounded spiralling trajectory. Taking corresponds to no parametric instability and thus bounded motion of the vorticity centre. It is worth recalling that the parametric instability is a property of the alternating deformation flow and its manifestation is independent of the number of the singular vortices, their initial positions and strengths.
Let us consider four sets of the two vortices’ strengths: and ; and ; and ; and and . The two singular vortices start from the initial positions , and , . Figure 20a exemplifies trajectories of the two vortices along with that of their vorticity centre when it experiences parametric instability. For comparison, the case of no parametric instability is shown in Figure 20b. The shape of the vortex trajectories will differ depending on the vortices’ strengths and initial positions, but they cannot alter the manifestation of the parametric instability. Instantaneous spatial distributions of FTLE corresponding to the vortex trajectories shown in Figure 20 are illustrated in Figure 21. Brighter regions correspond to larger Lyapunov exponents, which indicate regions of intense local stretching. The insets show enlarged parts of the FTLE distributions focused on the neighbourhood of the vortices. The insets clearly show that the local advection patterns revealed by the FTLEs are almost equivalent in both cases, whereas the global advection patterns significantly differ from each other.
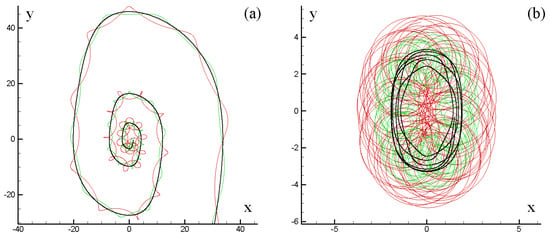
Figure 20.
The trajectories of two singular vortices (thin lines) and their vorticity centre (bold line) in the case of: (a) parametric instability manifestation; and (b) no parametric instability.
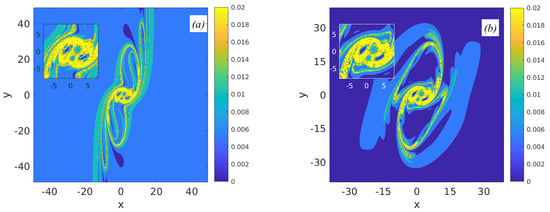
Figure 21.
Instantaneous distributions of Finite-Time Lyapunov exponents for the case of: (a) parametric instability manifestation; and (b) no parametric instability. The darker the region is, the more intensely local stirring of fluid particles occurs.
In the case of parametric instability (see Figure 21a), the FTLE pattern indicates more intense stretching compared to the case of no parametric instability (see Figure 21b). The darker and lighter regions elongate along the strain axis creating a folding pattern, whereas, in the case of no parametric instability, the FTLE distribution is reminiscent of the perturbed configurations shown in Figure 19.
To emphasise the different transport properties of the deformation flows with or without parametric instability, we obtained the following quantitative estimate. A circular patch of markers was distributed such that they completely covered both vortices; then the mean standard deviation of the patch’s markers was calculated in time. Figure 22 demonstrates the results. The standard deviation for the parametric instability case (see Figure 22) increases almost exponentially (as it would do for the case of strain dominating rotation ), whereas, for the case of no parametric instability, the standard deviation oscillates around a local value. The same result is observed for all the combinations of the vortices’ strengths, which govern the local stirring patterns [118]. Another conclusion that can be drawn from the standard deviation curves is that the type of vortex interaction (i.e., the signs of the strengths of the two vortices) matters only in the immediate vicinity of the vortices, for the general transport properties of the flow. On the other hand, it is the influence of the large-scale deformation flow that is much more important and it, in fact, dominates the advection of the fluid particles—if the exterior flow allows for unbounded motion to appear, the fluid particles will eventually end up at infinity.
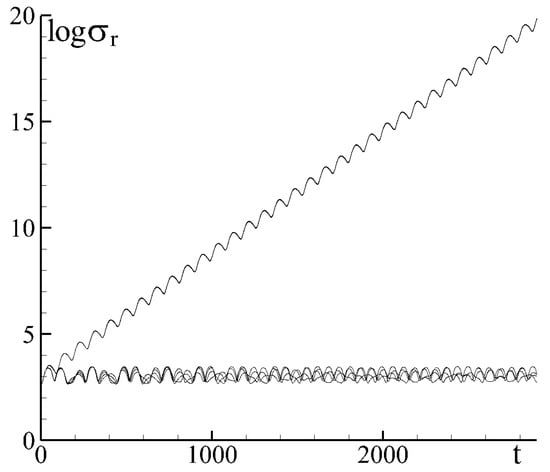
Figure 22.
Standard deviations (logarithmic scale) for four combinations of the vortices’ strengths of a circular patch consisting of markers evenly distributed over the vortices: the curves with a linear increasing trend—parametric instability manifestation; no linear trend—no parametric instability.
5.3. Fluid Particle Advection in Singular Vortex Systems in Layered Flows
The previous section considers singular vortices in barotropic configurations. This implies that there are actually regions of the flow prohibited for fluid particles to be advected there—these regions are the singular vortices’ current positions and their immediate vicinities where velocities tend to infinity [143,154]. The barotropic setting also prohibits the singular vortices to be at the same position at the same time because of the infinite velocities in their vicinities. Using instead layered flows can help overcome these shortcomings and study, for instance heton configurations [9,34,35,36,37,117], when two singular vortices are located one over the other in different layers of a multi-layered flow. Another configuration of interest is two singular vortices located in the lower layer of a two-layer flow. This configuration allows us to study the advection of upper-layer fluid particles perturbed by the periodic motion of the lower-layer vortices. This model thus may help shed light into the problem of identifying the signs of the subsurface vortices by their imprints on the ocean surface advection [6,93,155,156,157,158,159,160,161,162].
Let us consider two singular vortices of strengths located in the lower layer of a two-layer flow. The governing equations for fluid particles read
where is the width of the lower layer, is the distance from the jth vortex to the fluid particle with coordinate . When and , and the vortices are positioned exactly at their corresponding fixed points, the advection system is stationary, and the fluid particles move according to phase portraits similar to the ones shown in Figure 17. When , the phase portraits feature periodic trajectories and fixed points. Choosing the y-axis as the symmetric axis for the system, hence the positions of the fixed points follow and for the y-coordinate
A detailed analysis of the allowable number of the critical points can be found in [110]. In short, depending on the strengths of the vortices, one, three or five fixed points can be present at the y-axis. In the case of equal vortex strengths , the advection phase portraits are symmetric with respect to both coordinate axes, which is in contrast with the presence of only the y-axis symmetry in the case of differing vortex strengths exemplified by Figure 17. Figure 23 illustrates typical advection phase portraits in the case of equal strengths of the two vortices.

Figure 23.
Phase portraits of the stationary advection system Equation (62) given and as the absolute value of the strain intensity is being decreased, : (a) ; (b) ; and (c) .
The main difference between the baroclinic case and the barotropic one is that the baroclinic configuration, when the singular vortices are located in the lower layer, ensures a regular velocity for the fluid particle advection in the upper-layer, while the lower-layer advection is evolving in a singular velocity field similar to the barotropic one. As shown in Section 5.1, the area of the fluid manifesting chaotic advection is severely limited by the presence of singular points in the velocity field, which immediate vicinities act as advection barriers because of high velocities tending to infinity. On the contrary, the upper-layer velocity field of the two-layer configuration features no singular points and thus no barriers associated with singularities to chaotic advection.
Similar to the barotropic case considered above by shifting the vortices from their stationary fixed points, one can introduce time-dependent perturbations into the advection system. However, now, instead of changing the deviation of the vortices from their stationary position, we change the strain parameter and thus alter the perturbation magnitude and frequency. Our goal here is to find parameters of the exterior flow that facilitate effective chaotic advection of fluid particles in the upper layer. To do that, one needs to ensure the perturbation frequency, i.e., the rotational frequency of the vortices shifted from their stationary positions, be comparable with the proper rotational frequency of the fluid particles in the steady-state [110]. Figure 24 illustrates Poincaré maps of the perturbed advection system as the strain parameter is changed. As the strain intensity is decreased, the proper fluid particle frequency of the associated steady-state nears the perturbation frequency. This results in the appearance of more profound chaotic advection regions.
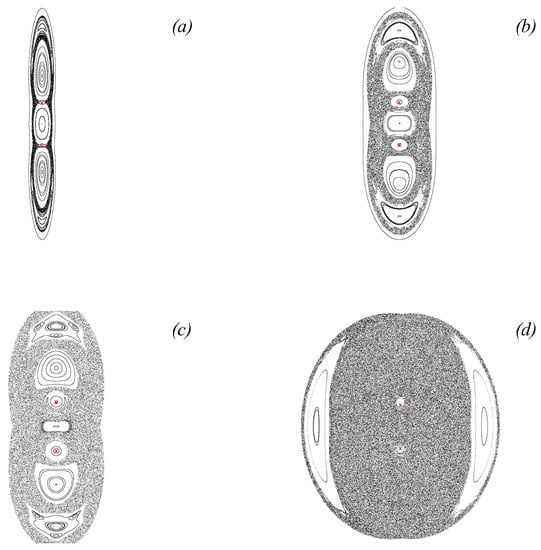
Figure 24.
Poincaré maps illustrating the increase of the chaotic advection zone in the upper layer for and as the absolute value of the strain intensity is being decreased, : (a) ; (b) ; (c) ; and (d) .
Another distinctive feature of the two-layer model is that given very weak singular vortices located in the lower layer, the upper-layer stationary phase portrait may feature no fixed points except for the central one and, therefore, separatrices. One of the implications of such a possibility is that, from the point of view of an observer, there are no signs of the vortex influence in the upper layer at all. This suggests that the fluid advection in the upper layer is completely governed by the deformation flow. Figure 25a exemplifies this possibility for a weak vortex strength . The stationary phase portrait of the advection system reveals no vortex influence from the underlying layer. If the system had no vortex influence, the rotational frequency of fluid particles along the elliptic trajectories would be constant and equal . However, as Figure 25b attests, the rotational frequencies of fluid particles are deformed by the underlying vortices (the curves correspond to ), but not strong enough to make them reach the zero value, and thus produce separatrices. Nevertheless, the fact that the fluid particle rotational frequencies vary allows one to find appropriate perturbations that lead to multiple resonance phenomena in the upper-layer advection system [110].
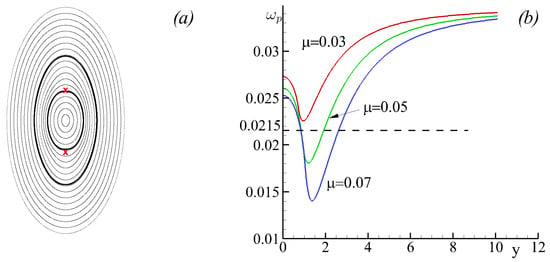
Figure 25.
(a) A stationary phase portrait of the advection system in Equation (62) with two singular vortices of weak strengths that are located in the lower layer: and . (b) Fluid particle rotational frequency corresponding to the phase portrait for different vortex strengths.
Now, let us perturb the advection system with the parameters corresponding to the phase portrait shown in Figure 25a. Once shifted from their stationary positions, the vortices start oscillate (solid lines in Figure 26) and thus periodically perturb the advection system. It is worth pointing out again that, in the case of stationary weak lower-layer vortices, there may appear no complex advection patterns in the upper layer. Consider vortex strengths and various shifts of the vortices from their stationary positions. Figure 26 illustrates Poincaré maps corresponding to the shifts: (a) ; (b) ; and (c) . Given a small shift, the advection pattern starts experiencing perturbation from the vortices, but still is relatively stable (see Figure 26a). As the perturbation is increased, an intricate pattern of stability islands appear in the advection system (Figure 26b). As the perturbation is further increased, the advection pattern becomes much more complicated as many new series of nonlinear resonances manifest themselves in the advection system (Figure 26c).

Figure 26.
Poincaré maps for the upper-layer advection system perturbed by two lower-layer vortices of equal weak strength when , and the shift of the vortices from their stationary positions is: (a) ; (b) ; and (c) .
Now, let us consider another reconnection phenomenon that can occur in the perturbed system. Since the stationary configuration features no separatrix, there is no separatrix reconnection in the stationary system. On the other hand, when the advection system is perturbed, stability islands may appear in the system and reconnections of their separatrices become possible. Let and the perturbation shift be . Two distinctive series of large stability islands associated with the nonlinear resonance appear in the advection system’s phase space. The first series is symmetric over the y-axis, while the second one is symmetric over the x-axis. Their separatrices have already vanished because of the interaction with smaller resonance series, and resulting chaotic motion region encircles both series (see Figure 27a). As the parameter is slightly varied, the two series of stability islands start changing their positions which results in a united chaotic motion region (see Figure 27b), which again then splits up into two distinctive chaotic layers attributed to the action of each series of the nonlinear resonances (see Figure 27c).

Figure 27.
Poincaré maps for the upper-layer advection system perturbed by two lower-layer vortices of equal weak strength when , and the shift of the vortices from their stationary positions is . The sequence shows a reconnection of the chaotic regions associated with two resonance series as the vortex strengths vary: (a) ; (b) ; and (c) .
This concludes the subsection devoted to the analysing regular and chaotic advection of fluid particles perturbed by the motion of singular vortices. The next section considers fluid particle advection induced by the motion of an ellipsoidal vortex.
5.4. Regular and Chaotic Dynamics of Passive Scalars Close to an Ellipsoid Vortex
Now, let us consider the ellipsoidal vortex model and analyse the evolution of passive fluid particles located near the vortex and thus affected by the evolution of its shape. First, let us define a stationary problem, when the shape of the vortex does not change and thus the velocity field around the vortex is stationary. This stationary configuration is attained at any elliptic fixed point of the phase portraits shown in Figure 12, Figure 13 and Figure 14. These elliptic fixed points correspond to the vortex not changing its shape and orientation angle, thus remaining stationary.
The governing equations for the motion of a fluid particle in the ellipsoidal vortex system is given by
where
and these equations should be solved together with the equations for the evolution of the vortex itself, namely Equations (50) and (53).
Given a stationary ellipsoidal vortex, the velocity field near the vortex is also stationary, hence all the fluid particles move periodically. Figure 28 demonstrates typical fluid particle trajectory patterns (phase portraits) induced by a stationary ellipsoidal vortex at the surface. The phase portraits can be of three types: only closed trajectories (Figure 28a–c) for the case of the deformation flow’s rotational component dominating the strain component. In this case, if the motion inside the vortex counter-directional to the imposed rotation, there appear recirculation zones near the vortex that are separated by a separatrix from the exterior flow (Figure 28a,b). It is worth noticing that the area occupied by the recirculation zones can exceed the area of the vortex itself (Figure 28b). If the motion inside the vortex co-directional with the imposed rotation, no recirculation zones appear in the advection system (Figure 28c). On the other hand, when the strain component of the deformation flow dominates the rotational component, the exterior flow turns hyperbolic and a separatrix demarcating the exterior flow and the immediate vicinity of the vortex emerges in the system (Figure 28d).
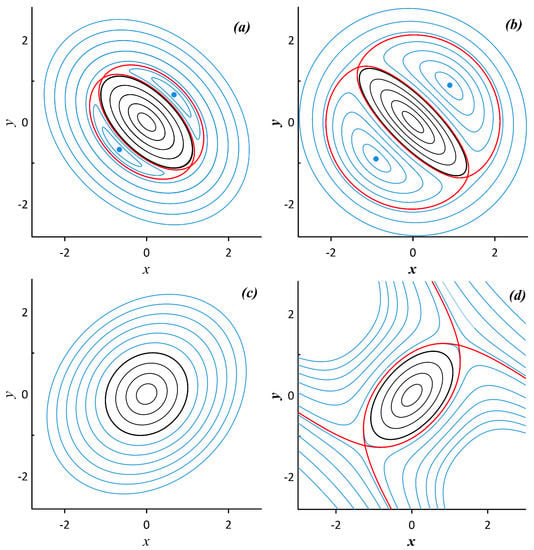
Figure 28.
Examples of fluid particle trajectory patters induced by a stationary ellipsoidal vortex corresponding to various regimes of the ellipsoidal vortex’s orientation against the exterior deformation flow: (a) , , , and ; (b) , , , and ; (c) , , , and ; and (d) , , , and . The boundary of the vortex is marked by a black line. The red line shows the separatrix.
Now, to perturb the advection system, it is enough to shift the vortex from its stationary position. Once shifted, the vortex starts oscillating periodically in accordance with the phase portraits shown in Figure 12, Figure 13 and Figure 14. These oscillations play the role of a perturbation to the fluid particles near the vortex.
Let us first address the case of zero fixed points in the advection system. When the vortex is shifted from its stationary position, a narrow region of chaotic motion emerges in the advection system. Figure 29a depicts rotational frequency curves of the stationary advection system (p for particle) and the corresponding rotational frequency curves of the vortex system (v for vortex). The numbers refer to the corresponding vortex motion regime shown in Figure 11. The vortex frequency thus plays the role of the perturbation frequency to the advection system. The red interval corresponds to the vortex oscillating, whereas the green interval corresponds to the vortex rotating. The values in both intervals are greater than the particle rotational frequency, which features a constant value corresponding to the motion within the ellipsoid, then it monotonically decreases approaching the asymptotic value imposed by the deformation flow. This result in the appearance of nonlinear resonance in the perturbed advection system. Poincaré maps shown in Figure 29b,c evidence the appearance of a chaotic motion region near the vortex. Two stability islands associated with nonlinear resonance occur in the system because the perturbation frequency (the frequency of the vortex oscillations) surpasses the eigen-frequency of the advection system (the rotational frequency of a fluid particle in the corresponding stationary case). As the vortex starts rotating, the advection is perturbed in a similar manner and a set of pronounced stability islands emerges (see Figure 29c).

Figure 29.
(a) Rotational frequencies of the corresponding stationary configurations: the numbers refer to the corresponding vortex motion regime; index p (particle) implies that the frequency curve corresponds to the stationary advection system, whereas v (vortex) stands for the corresponding vortex motion system. (b,c) Poincaré maps illustrating the appearance of chaotic motion regions in the advection system as the vortex oscillates or rotates: (b) , , and the vortex oscillating from the initial position ; and (c) , , and the vortex rotating .
When the stationary advection system features fixed points (corresponding to the stationary case Figure 28a), perturbing these advection configurations typically produces much more effective chaotic advection. The corresponding rotational frequency curves for the advection system and for the vortex motion itself are shown in Figure 30a. The blue interval indicates the particle frequency values corresponding to the lateral recirculation zones. The vortex motion frequency values and the stationary advection frequency values are commensurate for the case. As the vortex is shifted and starts oscillating, a very pronounced chaotic advection region manifests itself (see Figure 30b). The recirculation zones have disappeared and been substituted by the chaotic motion regions. Weak stability islands can be discerned near the exterior flow region. When the vortex starts rotating, a similar perturbed Poincaré map is obtained (see Figure 30c).

Figure 30.
(a) The same as in Figure 29: (b) , , and the vortex oscillating ; and (c) , , and the vortex rotating .
When the strain components dominate the rotational component, the deformation flow induces hyperbolic fluid particle trajectories at infinity. Therefore, once perturbed, the separatrix, which separates the region of bounded advection from the unbounded one, vanishes and chaotic fluid particle trajectories leave the bounded advection region. The corresponding frequency curves are presented in Figure 31a. In the case of Regime 7, the vortex frequency values, given an oscillating ellipsoid, are similar to the stationary advection frequency values. Given a rotating ellipsoid, the vortex frequency values decrease rapidly and eventually become less than the stationary advection frequency ones. Therefore, influential nonlinear resonances and occur in the advection system. When overlapping, the resonances induce a large chaotic region. Typical Poincaré maps are illustrated in Figure 31: Case (b) corresponds to the vortex oscillating, whereas Case (c) corresponds to the vortex rotating. A detailed study of the perturbed advection system, including analysing the advection patterns at different vertical levels, can be found in [89].

Figure 31.
(a) The same as in Figure 29: (b) , and the vortex oscillating ; and (c) , and the vortex rotating .
5.5. Diffusion-Affected Leakage of an Ellipsoidal Vortex
The vortex boundary in the ellipsoidal vortex model is impermeable and thus there is no exchange of fluid particles between the vortex and its ambient fluid [163]. On the other hand, the effect of vortex leakage is well-documented. To imbue the ellipsoidal vortex model with this property, one can introduce diffusion effects in the system. Now, the fluid particles are allowed to jump between the vortex interior and its ambient fluid. Taking into account the stirring properties of the ellipsoidal vortex model, it is of interest to assess the joint contribution of deterministic stirring and diffusion to the net mixing of the model.
A Monte-Carlo method is used to model diffusion effects in the advection system in Equation (64) [144,164,165,166,167,168]. Fluid particles of concentration are subject to a deterministic velocity field , where is the spatial vector coordinate, and diffusion contribution as follows
where is the diffusivity. An auxiliary scalar field can be introduced to satisfy
where is a delta-correlated vector Gaussian process with the properties
is the Kronecker delta, is the Dirac function, and are two consecutive instants in time. Averaging over an ensemble of a random process ’s realisations, one obtains an average solution
The random process is the modelled diffusion process with diffusivity as the vertical diffusivity is an order of magnitude smaller than the horizontal ones [169] in absolute values, but has the same magnitude when scaled by the vertical velocity. The governing equations for a fluid particle ensue
where the terms correspond to the horizontal diffusivity and is scaled by the vertical diffusivity .
We consider two cases: first, when the vortex is stationary and therefore the advection is regular; and, second, when the vortex is non-stationary and thus its oscillation (rotation) engenders chaotic advection in its vicinity. To demonstrate the effect of adding diffusion to the advection system, a series of numerical experiments was conducted. First, markers were evenly distributed within the ellipsoid and then the distributions of the markers were followed in time for both cases. The time scale is rotational periods of the ellipsoid. In total, realisations of the stochastic process were then averaged to produce a solution. The surface area of the vortex was constant .
When the vortex is stationary ( and ), the deterministic motion of the fluid particles is always regular and thus the fluid mixing results from diffusion. Thus, the probability distribution functions remain Gaussian in space and time. Examples of marker distributions in the stationary case are presented in Figure 32 after 40 characteristic time steps. Figure 32a,b shows plots for the case of switched-on vertical diffusion (), whereas Figure 32c,d corresponds to the case of only horizontal diffusion at work (). A significantly improved leakage of the vortex markers due to the presence of vertical diffusion is evident. Figure 32a,c illustrates the distributions at the surface (), whereas Figure 32b,d illustrates the distributions at the lower level of the initial marker distribution.
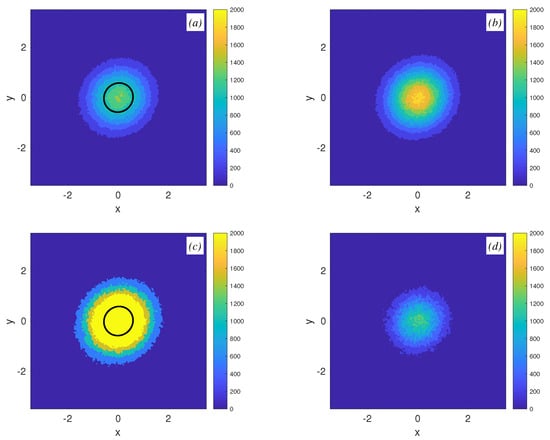
Figure 32.
Marker distributions after 40 characteristic time steps out of evenly distributed within the ellipsoid markers for the case of stationary vortex ( and ). The bold lines mark the initial distribution boundaries (the ellipsoidal vortex boundary). (a) —the surface layer (); (b) the lower layer of the initial marker distribution; and (c,d) same as in (a,b), respectively, with switched-off vertical diffusion.
Now, consider the case of a non-stationary vortex. The vortex thus induces a non-stationary velocity field for the ambient fluid particles, which leads to chaotic advection. In this case, the markers that are initially distributed within the vortex and diffused through its boundary can be chaotically advected near the vortex. The ellipsoid makes one full rotation in , which accounts for in 40 time steps (to compare with the stationary case). Figure 33 shows instantaneous marker distributions after 21 full revolutions of the ellipsoid, such that it is oriented the same as initially. Similar to the case of a stationary vortex, the leakage of the vortex is much higher in the case of switched-on vertical diffusion because now the markers are allowed to move between vertical levels. Another feature is that since the ambient fluid is mixed due to both deterministic stirring and diffusion, the marker distribution is noticeably anisotropic and spread over a significantly larger area compared to the case of a stationary vortex.
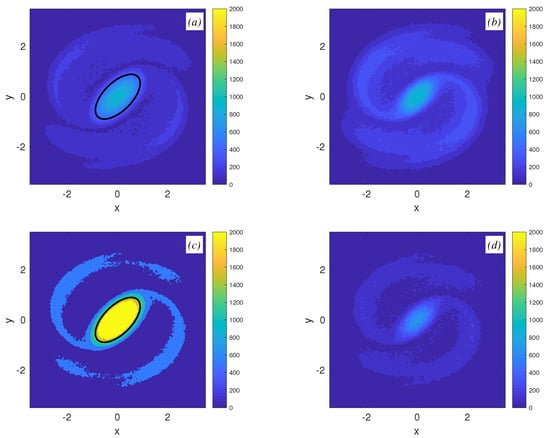
Figure 33.
(a–d) Same as in Figure 32 for the case of a non-stationary vortex ( and ), i.e., the markers are mixed due to both deterministic stirring and stochastic diffusion.
To accentuate the difference between the stationary vortex case and the non-stationary one, probability density curves are calculated as follows. Since for the case of a non-stationary vortex, the vortex rotates, the ambient fluid shrinks and elongates together with the vortex. Therefore, to accurately estimate the marker distribution, one needs to calculate it only for the same orientation of the vortex. In our case, the same orientation repeats itself with period . Then, all the markers are attributed to ellipsoidal rings of equal volumes. The value
is calculated for every vortex rotational period, where is the number of markers located in the ith ellipsoidal ring and N is the total number of markers injected into the system for all the realisations of the stochastic process . The volume of every nested ellipsoidal ring is of the ellipsoid’s volume and thus initially for every ellipsoidal ring within the ellipsoid. Figure 34 depicts the obtained PDFs for the stationary vortex case (Figure 34a,b) and non-stationary one (Figure 34c,d). Correspondingly, Figure 34a,c refers to the case of switched-on vertical diffusion, whereas Figure 34b,d to the switched-off vertical diffusion. PDFs for four time intervals are presented. The PDFs for the stationary vortex case imply a Gaussian distribution of the markers. On the other hand, the PDFs for the non-stationary vortex case suggest a different distribution with heavier tails that are impacted by the chaotic stirring process that the vortex induces. Switching on the vertical diffusion facilitates the transport of markers through the vortex’s boundary for either case. Detailed analyses of the problem can be found in [168].
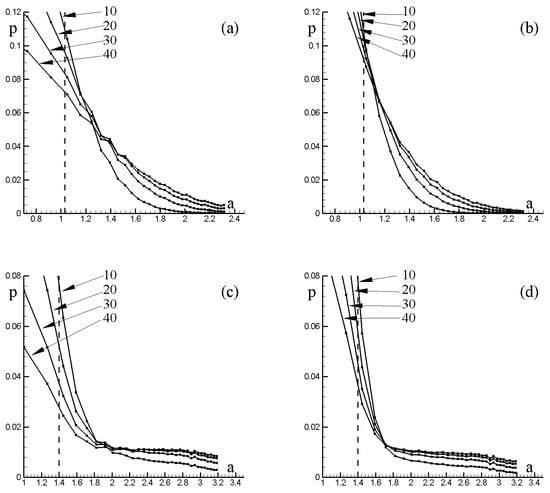
Figure 34.
The PDFs versus the ellipsoid’s semi-axis a. Initially, inside the ellipsoid and the density disperses in time intervals: The vertical lines mark the ellipsoid’s boundary. (a,b) the stationary vortex case with switched-on and switched-off vertical diffusion, respectively; and (c,d) the non-stationary vortex case with switched-on and switched-off vertical diffusion, respectively.
6. Discussion
This review paper has recalled and synthesized the recent efforts to model the evolution of several point vortices or of a single elliptic (ellipsoidal) vortex, under the influence of external strain and rotation. The equilibria (elliptical or hyperbolic fixed points) have been determined in the case of steady external flows. The number and nature of these fixed points have been determined as a function of the external flow parameters. The steady state rotation frequencies around these equilibria were calculated. The parametric instability of these equilibria, when the external flow is imposed as time varying (most often, periodic in time), has been described, and in particular the conditions for their bounded or unbounded characters. As the unsteady component of the external strain or rotation are increased, chaos in the vortex evolution due to multiple nonlinear resonances becomes more profound. Stability islands replace the elliptic points, and control the evolution of the flow, as shown by Poincaré maps. Chaos also proceeds by destabilizing the steady state separatrices, so that, as the unsteady external flow magnitude increases, the barriers between chaotic regions vanish. Chaos can also grow via the reconnection of separatrices belonging to stability islands in the perturbed system.
For the two-point-vortex (or three-point-vortex) system, chaos gives rise to chaotic trajectories which span larger and larger regions of physical space. For the elliptic (ellipsoidal) vortex system, chaos can lead to the irreversible (and infinite) deformation of the vortex (with an ever-increasing aspect ratio).
The influence of external deformation flows on the fluid particle advection in the vortex system is also very prominent. The evolution of fluid particles can become chaotic due to the perturbations introduced by time-varying external flows or due to the non-stationarity of the motion of the vortices.
The chaotic advection of passive particles in the unsteady flow composed of one or several vortices, and of a time-varying external shear/strain flow, was studied by means of FTLE (finite-time Lyapunov exponents). Parametric instability of the vortices leads to more stretching of the particle patches. In the two-layer case, the lower layer has singular points, the vicinity of which acts as a dynamical barrier; on the contrary, in the upper layer, there are no barriers to chaotic advection. It is then possible to have no signature of the deep vortices in the upper layer. Chaotic advection intensifies as the strain intensity is decreased. However, complex advection in the upper layer can be absent if the lower-layer vortices are weak and steady.
The presence of steady or unsteady external strain also affects the interaction of finite-area vortices. In particular, nonlinear regimes appear, such as steady vortices at the elliptic point location, oscillation near these points, advection of the vortices to infinity, and irreversible elongation of the vortices; some of these processes act against vortex merger or vertical alignment.
Vortices in shear have been studied as the prototype of low- to mid-latitude flows on giant gaseous planets. In particular, much work has been devoted to explain the structure and evolution of the Great Red Spot on Jupiter, an elliptic vortex in the midst of a banded, sheared zonal flow; work has also concentrated on the evolution of Neptune’s Great Dark Spot, detected by the Voyager probe, considering again its elliptical shape [170]. However, the likeliness of such situations for oceanic vortices has been less investigated.
Using satellite altimetry, and vortex identification and tracking software, Chelton et al. [3] discovered that about 5500–6000 eddies exist at any time in the world oceans. Dividing the total ocean surface by this number yields a mean distance between eddies (d) of about 250 km. Their study also indicated that the mean radius (R) of eddies thus identified is 90 km. The ratio of shear on vorticity thus goes as or %. This value is below the threshold for irreversible vortex elongation in flows (about 15 %, see the review paper by McWilliams [171]), but it is still important when considering vortex deformation. Therefore, eddies in the ocean appear most often deformed (with prevalent azimuthal mode 1 and mode 2 deformations on their contours).
It should be noted that eddies move relative to each other in the ocean, both because they self-advect differently and also because they are embedded in different external flows. Vortex drift in the ocean usually ranges between 2 and 8 cm/s (more rarely 10 cm/s or faster). With 5 cm/s ( km/day), this would lead to a vortex radius being spanned in 20 days; this can be considered as a forcing period, for the shear that one vortex exerts on its neighbour, while the natural rotation period in a vortex is rather 5–7 days. Thus, a rough estimate of the ratio of forcing to rotation period in oceanic vortices is 3–4. This may allow resonance. Nevertheless, a specific study, using output from a high resolution numerical ocean model, would be necessary to ascertain the frequency of such resonant interactions, in oceanic domains rich in vortices (near unstable boundary currents, for instance).
Author Contributions
Conceptualization, X.C., K.K. and E.R.; methodology, X.C., K.K. and E.R.; formal analysis, X.C., K.K. and E.R.; writing—original draft preparation, X.C., K.K. and E.R.; and writing—review and editing, X.C., K.K. and E.R.
Funding
The contribution of K.K. was funded by the POI FEB RAS Program No. 0271-2019-0001 and by the Russian Foundation for Basic Research, Projects 17-05-00035 and 19-55-10001. X.C. thanks CNRS (Centre National de la Recherche Scientifique, France) for support under PRC (programme de recherche conjoint) 1069, between RFBR and CNRS. E.R. was partially supported by the NERC grant NE/R011567/1.
Acknowledgments
We want to express our gratitude to our long-term collaborators, Mikhail A. Sokolovskiy, Xavier Perrot, and Vladimir V. Zhmur, who contributed significantly to parts of the research reviewed here.
Conflicts of Interest
The authors declare no conflict of interest. The funders had no role in the design of the study; in the collection, analyses, or interpretation of data; in the writing of the manuscript, or in the decision to publish the results.
Appendix A. Determination of the Resonant Frequencies by Averaging Over Fast Oscillations
Let us consider the second order linear system of ODE with periodic coefficients
Based on ideas from the invariant embedding method [109,115,135], we introduce a new function , where is defined below. It is convenient to choose the parameter E in the form . Then, a Riccati equation ensues
Averaging over fast oscillations results in
The averaged Equation (A3) can be solved explicitly
The expression for decrement gives us an approximation for the first parametric instability zone.
Exact positions of the parametric instability zones for the system in Equation (A1) can be found making use of the Floquet theory [114,172]. Auxiliary functions that satisfy the Riccati equations [109,135] are introduced
The expression for Floquet multipliers is
where is the fundamental matrix of the system in Equation (A1) with initial conditions , and is the period of the coefficients. The Wronskian is equal to unity. Thus, the boundaries between the real (unbounded) and complex (bounded) solutions are defined by the relation
, , an estimate of Equation (33) can be obtained from Equation (A4).
Estimate (47) ensues similarly by comparing the system in Equation (46) and Equation (A1). In this case, , and , , then one needs to use Equation (A4).
For elliptic (ellipsoidal) vortex, one can compare the system in Equation (57) with Equation (A1) and set , and . Then, from Equation (A4), an estimate of Equation (58) follows.
The exact boundaries of the stability zones can be found by solving the appropriate analogues of Equations (A5) and (A7).
References
- Carton, X. Hydrodynamical modeling of oceanic vortices. Surv. Geophys. 2001, 22, 179–263. [Google Scholar] [CrossRef]
- Chelton, D.B.; Schlax, M.G.; Samelson, R.M.; de Szoeke, R.A. Global observations of large oceanic eddies. Geophys. Res. Lett. 2007, 34, L15606. [Google Scholar] [CrossRef]
- Chelton, D.B.; Schlax, M.G.; Samelson, R.M. Global observations of nonlinear mesoscale eddies. Prog. Oceanogr. 2011, 91, 167–216. [Google Scholar] [CrossRef]
- Zhang, Z.; Wang, W.; Qiu, B. Oceanic Mass Transport by Mesoscale Eddies. Science 2014, 345, 322–324. [Google Scholar] [CrossRef] [PubMed]
- Samelson, R.M. Lagrangian Motion, Coherent Structures, and Lines of Persistent Material Strain. Annu. Rev. Mar. Sci. 2013, 5, 137–163. [Google Scholar] [CrossRef] [PubMed]
- Barbosa Aguiar, A.C.; Peliz, A.; Carton, X. A census of Meddies in a long-term high-resolution simulation. Prog. Oceanogr. 2013, 116, 80–94. [Google Scholar] [CrossRef]
- Dong, C.; McWilliams, J.C.; Liu, Y.; Chen, D. Global heat and salt transports by eddy movement. Nat. Commun. 2014, 5, 3294. [Google Scholar] [CrossRef]
- Abernathey, R.; Haller, G. Transport by Lagrangian Vortices in the Eastern Pacific. J. Phys. Oceanogr. 2018, 48, 667–685. [Google Scholar] [CrossRef]
- Sokolovskiy, M.A.; Verron, J. Dynamics of Vortex Structures in a Stratified Rotating Fluid; Springer: Cham, Switzerland, 2014. [Google Scholar]
- Haller, G. An objective definition of a vortex. J. Fluid Mech. 2005, 525, 1–26. [Google Scholar] [CrossRef]
- Peacock, T.; Froyland, G.; Haller, G. Introduction to Focus Issue: Objective Detection of Coherent Structures. Chaos 2015, 25, 087201. [Google Scholar] [CrossRef]
- Hadjighasem, A.; Farazmand, M.; Blazevski, D.; Froyland, G.; Haller, G. A critical comparison of Lagrangian methods for coherent structure detection. Chaos 2017, 27, 053104. [Google Scholar] [CrossRef] [PubMed]
- Stepanov, D.V. Mesoscale eddies and baroclinic instability over the eastern Sakhalin shelf of the Sea of Okhotsk: a model-based analysis. Ocean Dyn. 2018, 68, 1353–1370. [Google Scholar] [CrossRef]
- Stepanov, D.V.; Diansky, N.A.; Fomin, V.V. Eddy energy sources and mesoscale eddies in the Sea of Okhotsk. Ocean Dyn. 2018, 68, 825–845. [Google Scholar] [CrossRef]
- Stern, M.E.; Flierl, G.R. On the Interaction of a Vortex With a Shear Flow. J. Geophys. Res. 1987, 92, 10733–10744. [Google Scholar] [CrossRef]
- Nazarenko, S.V.; Zakharov, V.E. Kinetic equation for point vortices in a shear flow. Physica D 1992, 56, 381–388. [Google Scholar] [CrossRef]
- Samelson, R.M. Fluid exchange across a meandering jet. J. Phys. Oceanogr. 1992, 22, 431–440. [Google Scholar] [CrossRef]
- Del-Castillo-Negrete, D.; Morrison, P. Chaotic transport by Rossby waves in shear flow. Phys. Fluids 1993, 5, 948–965. [Google Scholar] [CrossRef]
- Schecter, D.A.; Dubin, D.H.E. Vortex Motion Driven by a Background Vorticity Gradient. Phys. Rev. Lett. 1999, 83, 2191–2194. [Google Scholar] [CrossRef]
- Finn, J.M.; del-Castillo-Negrete, D. Lagrangian chaos and Eulerian chaos in shear flow dynamics. Chaos 2001, 11, 816. [Google Scholar] [CrossRef]
- Budyansky, M.V.; Uleysky, M.Y.; Prants, S.V. Detection of barriers to cross-jet Lagrangian transport and its destruction in a meandering flow. Phys. Rev. E 2009, 79, 056215. [Google Scholar] [CrossRef]
- Uleysky, M.Y.; Budyansky, M.V.; Prants, S.V. Mechanism of destruction of transport barriers in geophysical jets with Rossby waves. Phys. Rev. E 2010, 81, 017202. [Google Scholar] [CrossRef] [PubMed]
- Balasuriya, S. Meridional and Zonal Wavenumber Dependence in Tracer Flux in Rossby Waves. Fluids 2016, 1, 30. [Google Scholar] [CrossRef]
- Reinaud, J.N.; Dritschel, D.G.; Carton, X. Interaction between a surface quasi-geostrophic buoyancy filament and an internal vortex. Geophys. Astrophys. Fluid Dyn. 2016, 110, 461–490. [Google Scholar] [CrossRef]
- Reinaud, J.N.; Carton, X.; Dritschel, D.G. Interaction between a Quasi-Geostrophic Buoyancy Filament and a Heton. Fluids 2017, 2, 37. [Google Scholar] [CrossRef]
- Le Dizès, S.; Eloy, C. Short-wavelength instability of a vortex in a multipolar strain field. Phys. Fluids 1999, 11, 500–502. [Google Scholar] [CrossRef]
- Eloy, C.; Le Dizès, S. Stability of the Rankine vortex in a multipolar strain field. Phys. Fluids 2001, 13, 660. [Google Scholar] [CrossRef]
- Helmholtz, H. On Integrals of the hydrodynamical equations, which express vortex-motion. Philos. Mag. Ser. 4 1867, 33, 485–512. [Google Scholar] [CrossRef]
- Kirchhoff, G. Vorlesungen uber mathematische Physik. Mechanik; B. G. Teubner: Leipzig, Germany, 1876; p. 255. [Google Scholar]
- Middelkamp, S.; Torres, P.; Kevrekidis, P.; Frantzeskakis, D.; Carretero-Gonzalez, R.; Schmelcher, P.; Freilich, D.V.; Hall, D. Guiding-center dynamics of vortex dipoles in Bose-Einstein condensates. Phys. Rev. A 2011, 84, 011605. [Google Scholar] [CrossRef]
- Torres, P.J.; Kevrekidis, P.G.; Frantzeskakis, D.J.; Carretero-Gonzalez, R.; Schmelcher, P.; Hall, D.S. Dynamics of vortex dipoles in confined Bose-Einstein condensates. Phys. Lett. A 2011, 375, 3044–3050. [Google Scholar] [CrossRef]
- Torres, P. Mathematical Models with Singularities: A Zoo of Singular Creatures; Atlantis Press: Paris, France, 2015. [Google Scholar]
- Bannikova, E.Y.; Kontorovich, V.M.; Reznik, G.M. Dynamics of a vortex pair in radial flow. J. Exp. Theor. Phys. 2007, 105, 542–548. [Google Scholar] [CrossRef]
- Hogg, N.G.; Stommel, H.M. The Heton, an Elementary Interaction Between Discrete Baroclinic Geostrophic Vortices, and Its Implications Concerning Eddy Heat-Flow. Proc. R. Soc. Lond. A 1985, 397, 1–20. [Google Scholar] [CrossRef]
- Hogg, N.; Stommel, H. Hetonic explosions: the break-up and spread of warm pools as explained by baroclinic point vortices. J. Atmos. Sci. 1985, 42, 1465–1476. [Google Scholar] [CrossRef]
- Gryanik, V.M. Dynamics of singular geostrophical vortices in a 2-level model of the atmosphere (ocean). Izv. Atmos. Ocean. Phys. 1983, 19, 227–240. [Google Scholar]
- Gryanik, V.M.; Tevs, M.V. Dynamics of singular geostrophical vortices in a N-level model of the atmosphere (ocean). Izv. Atmos. Ocean. Phys. 1989, 25, 179–188. [Google Scholar]
- Reznik, G.M. Dynamics of singular vortices on a beta-plane. J. Fluid Mech. 1992, 240, 405–432. [Google Scholar] [CrossRef]
- Sokolovskiy, M.A.; Verron, J. Four-vortex motion in the two layer approximation: Integrable case. Regul. Chaotic Dyn. 2000, 5, 413–436. [Google Scholar] [CrossRef]
- Legg, S.; Marshall, J. A heton model of the spreading phase of open-ocean deep convection. J. Phys. Oceanogr. 1993, 23, 1040–1056. [Google Scholar] [CrossRef]
- Legg, S.Y.; Jones, H.; Visbeck, M. A heton perspective of baroclinic eddy transfer in localized open ocean convection. J. Phys. Oceanogr. 1996, 26, 2251–2266. [Google Scholar] [CrossRef]
- Gryanik, V.M.; Doronina, T.N.; Olbers, D.J.; Warncke, T.H. The theory of three-dimensional hetons and vortex-dominated spreading in localized turbulent convection in a fast rotating stratified fluid. J. Fluid Mech. 2000, 423, 71–125. [Google Scholar] [CrossRef]
- Gryanik, V.M.; Sokolovskiy, M.A.; Verron, J. Dynamics of heton-like vortices. Regul. Chaotic Dyn. 2006, 11, 383–434. [Google Scholar] [CrossRef]
- Reznik, G.; Kizner, Z. Two-layer quasi-geostrophic singular vortices embedded in a regular flow. Part 1. Invariants of motion and stability of vortex pairs. J. Fluid Mech. 2007, 584, 185–202. [Google Scholar] [CrossRef]
- Reznik, G.; Kizner, Z. Two-layer quasi-geostrophic singular vortices embedded in a regular flow. Part 2. Steady and unsteady drift of individual vortices on a beta-plane. J. Fluid Mech. 2007, 584, 185–202. [Google Scholar] [CrossRef]
- Reznik, G.M. Dynamics of Localized Vortices on the Beta Plane. Izv. Atmos. Ocean. Phys. 2010, 46, 784–797. [Google Scholar] [CrossRef]
- Kunnen, R.; Trieling, R.; van Heijst, G.J. Vortices in time-periodic shear flow. Theor. Comput. Fluid Dyn. 2010, 24, 315–322. [Google Scholar] [CrossRef]
- Koshel, K.V.; Reinaud, J.N.; Riccardi, G.; Ryzhov, E.A. Dynamics of a vortex pair interacting with a fixed point vortex revisited. Part I: Point vortices. Phys. Fluids 2018, 30, 096603. [Google Scholar] [CrossRef]
- Newton, P.K. The N-Vortex Problem: Analytical Techniques; Springer: Berlin, Germany, 2001. [Google Scholar]
- Kurakin, L.G. On nonlinear stability of the regular vortex systems on a sphere. Chaos 2004, 14, 592. [Google Scholar] [CrossRef] [PubMed]
- Newton, P.K. The N-vortex problem on a sphere: geophysical mechanisms that break integrability. Theor. Comput. Fluid Dyn. 2010, 24, 137–149. [Google Scholar] [CrossRef]
- Kurakin, L.G.; Ostrovskaya, I.V. Nonlinear Stability Analysis of a Regular Vortex Pentagon Outside a Circle. Regul. Chaotic Dyn. 2012, 17, 385–396. [Google Scholar] [CrossRef]
- Kurakin, L.G. Influence of annular boundaries on Thomson’s vortex polygon stability. Chaos 2014, 24, 023105. [Google Scholar] [CrossRef]
- Kida, S. Motion of an elliptic vortex in a uniform shear flow. J. Phys. Soc. Jpn. 1981, 50, 3517–3520. [Google Scholar] [CrossRef]
- Zhmur, V.V. Localized eddy formation in a shear-flow. Oceanology 1988, 28, 536–538. [Google Scholar]
- Zhmur, V.V. Subsurface mesoscale eddy structures in a stratificated ocean. Oceanology 1989, 29, 28–32. [Google Scholar]
- Zhmur, V.V.; Pankratov, K.K. The dynamics of the semi-ellipsoid subsurface vortex in the non-uniform flow. Oceanology 1989, 29, 205–211. [Google Scholar]
- Zhmur, V.V.; Pankratov, K.K. Dynamics of mesoscale eddy formation in the field currents of large intensive vortex. Okeanologia 1990, 30, 124–129. [Google Scholar]
- Meacham, S.P.; Flierl, G.R.; Send, U. Vortices in shear. Dyn. Atmos. Oceans 1989, 14, 333–386. [Google Scholar] [CrossRef]
- Meacham, S.P. Quasigeostrophic, ellipsoidal vortices in stratified fluid. Dyn. Atmos. Oceans 1992, 16, 189–223. [Google Scholar] [CrossRef]
- Meacham, S.P.; Pankratov, K.K.; Shchepetkin, A.F.; Zhmur, V.V. The interaction of ellipsoidal vortices with background shear flows in a stratified fluid. Dyn. Atmos. Oceans 1994, 21, 167–212. [Google Scholar] [CrossRef]
- D’Ovidio, F.; Isern-Fontanet, J.; López, C.; Hernández-García, E.; García-Ladona, E. Comparison between Eulerian diagnostics and finite-size Lyapunov exponents computed from altimetry in the Algerian basin. Deep Sea Res. 2009, 56, 15–31. [Google Scholar] [CrossRef]
- Dritschel, D.G.; Legras, B. The elliptical model of two-dimensional vortex dynamics. II: Disturbance equations. Phys. Fluids A 1991, 3, 855. [Google Scholar] [CrossRef]
- Dhanak, M.R.; Marshall, M.P. Motion of an elliptic vortex under applied periodic strain. Phys. Fluids 1993, 5, 1224–1230. [Google Scholar] [CrossRef]
- Ide, K.; Wiggins, S. The dynamics of elliptically shaped regions of uniform vorticity in time-periodic, linear external velocity fields. Fluid Dyn. Res. 1995, 15, 205–235. [Google Scholar] [CrossRef]
- Bayly, B.J.; Holm, D.D.; Lifschitz, A. Three-dimensional stability of elliptical vortex columns in external strain flows. Philos. Trans. R. Soc. Lond. A 1996, 354, 895–926. [Google Scholar] [CrossRef]
- Ngan, K.; Meacham, S.P.; Morrison, P.J. Elliptical vortices in shear: Hamiltonian moment formulation and Melnikov analysis. Phys. Fluids 1996, 8, 896–913. [Google Scholar] [CrossRef]
- Riccardi, G.; Piva, R. Motion of an elliptical vortex under rotating strain: conditions for asymmetric merging. Fluid Dyn. Res. 1998, 23, 63–88. [Google Scholar] [CrossRef]
- Riccardi, G.; Piva, R. The interaction of an elliptical patch with a point vortex. Fluid Dyn. Res. 2000, 27, 269–289. [Google Scholar] [CrossRef]
- McKiver, W.J.; Dritschel, D.G. The stability of a quasi-geostrophic ellipsoidal vortex in a background shear flow. J. Fluid Mech. 2006, 560, 1–17. [Google Scholar] [CrossRef]
- Polvani, L.M.; Wisdom, J. Chaotic Lagrangian trajectories around an elliptical vortex patch embedded in a constant and uniform background shear flow. Phys. Fluids A 1990, 2, 123–126. [Google Scholar] [CrossRef]
- Dahleh, M.D. Exterior flow of the Kida ellipse. Phys. Fluids A 1992, 4, 1979–1985. [Google Scholar] [CrossRef]
- Kawakami, A.; Funakoshi, M. Chaotic motion of fluid particles around a rotating elliptic vortex in a linear shear flow. Fluid Dyn. Res. 1999, 25, 168–193. [Google Scholar] [CrossRef]
- Kuznetsov, L.; Zaslavsky, G.M. Regular and chaotic advection in the flow field of a three-vortex system. Phys. Rev. E 1998, 58, 7330–7349. [Google Scholar] [CrossRef]
- Kuznetsov, L.; Zaslavsky, G.M. Passive particle transport in three-vortex flow. Phys. Rev. E 2000, 61, 3777–3792. [Google Scholar] [CrossRef]
- Kozlov, V.F.; Koshel, K.V.; Stepanov, D.V. Influence of the boundary on chaotic advection in the simplest model of a topographic vortex. Izv. Atmos. Ocean. Phys. 2005, 41, 217–227. [Google Scholar]
- Koshel, K.V.; Prants, S.V. Chaotic advection in the ocean. Physics-Uspekhi 2006, 49, 1151–1178. [Google Scholar] [CrossRef]
- Kozlov, V. Models of the Topographic Vortices in Ocean; Nauka: Moscow, Russia, 1984. [Google Scholar]
- Pedlosky, J. Geophysical Fluid Dynamics, 2 ed.; Springer: New York, NY, USA, 1987. [Google Scholar]
- Monin, A. Theoretical Geophysical Fluid Dynamics; Kluwer Academic Publishers: Dordrecht, The Netherlands, 1990. [Google Scholar]
- Pedlosky, J. Ocean Circulation Theory; Springer: New York, NY, USA, 1996. [Google Scholar]
- McWilliams, J. Fundamentals of Geophysical Fluid Dynamics; Cambridge University Press: Cambridge, UK, 2006. [Google Scholar]
- Cushman-Roisin, B.; Beckers, J.M. Introduction to Geophysical Fluid Dynamics. Physical and Numerical Aspects, 2nd ed.; Academic Press; Elsevier Inc.: New York, NY, USA, 2011. [Google Scholar]
- Zhmur. Mezoscale Ocean Eddies; GEOS: Moscow, Russia, 2011. (In Russian) [Google Scholar]
- Vallis, G.K. Atmospheric and Oceanic Fluid Dynamics; Cambridge University Press: Cambridge, UK, 2017. [Google Scholar]
- Gryanik, V.M.; Doronina, T.N. Advective transport of passive mixture by localized (point) geostrophic vortices in the atmosphere (ocean). Izv. Atmos. Ocean. Phys. 1990, 26, 1011–1026. [Google Scholar]
- Kozlov, V.F. Background currents in geophysical hydrodynamics. Izv. Atmos. Ocean. Phys. 1995, 31, 245–250. [Google Scholar]
- Mckiver, W.J.; Dritschel, D.G. Balance in non-hydrostatic rotating stratified turbulence. J. Fluid Mech. 2008, 596, 201–219. [Google Scholar] [CrossRef]
- Zhmur, V.V.; Ryzhov, E.A.; Koshel, K.V. Ellipsoidal vortex in a nonuniform flow: Dynamics and chaotic advections. J. Mar. Res. 2011, 69, 435–461. [Google Scholar] [CrossRef]
- Bretherton, F.P. Critical layer instability in baroclinic flows. Q. J. R. Meteorol. Soc. 1966, 92, 325–334. [Google Scholar] [CrossRef]
- Walsh, D. A model of a mesoscale lens in large scale shear. Part I. Linear Calculations. J. Phys. Oceanogr. 1995, 25, 735–746. [Google Scholar] [CrossRef]
- Walsh, D.; Pratt, L.J. The interaction of a pair of point potential vortices in uniform shear. Dyn. Atmos. Oceans 1995, 22, 135–160. [Google Scholar] [CrossRef]
- Walsh, P.L.; Richarson, J.L. Observation of tilting meddies. J. Phys. Oceanogr. 1996, 26, 1023–1039. [Google Scholar] [CrossRef]
- Maze, G.; Carton, X.; Lapeyre, G. Dynamics of a 2D vortex doublet under external deformation. Regul. Chaotic Dyn. 2004, 9, 477–497. [Google Scholar] [CrossRef]
- Perrot, X.; Carton, X. Point-vortex Interaction in an oscillatory deformation field: Hamiltonian dynamics, harmonic resonance and transition to chaos. Discrete Cont. Dyn. B 2009, 11, 971–995. [Google Scholar] [CrossRef]
- Sokolovskiy, M.A.; Koshel, K.V.; Carton, X. Baroclinic multipole evolution in shear and strain. Geophys. Astrophys. Fluid Dyn. 2011, 105, 506–535. [Google Scholar] [CrossRef]
- McKiver, W.J. The Ellipsoidal Vortex: A Novel Approach to Geophysical Turbulence. Adv. Math. Phys. 2015, 2015, 613683. [Google Scholar] [CrossRef]
- Reinaud, J.N.; Sokolovkiy, M.A.; Carton, X. Hetonic quartets in a two-layer quasi-geostrophic flow: V–states and stability. Phys. Fluids 2018, 30, 056602. [Google Scholar] [CrossRef]
- Novikov, E. Dynamics and statistics of a system of vortices. Sov. Phys. JETP 1975, 68, 1868–1882. [Google Scholar]
- Sutyrin, G.G.; Perrot, X.; Carton, X. Integrable motion of a vortex dipole in an axisymmetric flow. Phys. Lett. A 2008, 372, 5452–5457. [Google Scholar] [CrossRef]
- Sokolovskiy, M.; Koshel, K.; Verron, J. Three-vortex quasi-geostrophic dynamics in a two-layer fluid. Part 1. Analysis of relative and absolute motions. J. Fluid Mech. 2013, 717, 232–254. [Google Scholar] [CrossRef]
- Newton, P. Point vortex dynamics in the post-Aref era. Fluid Dyn. Res. 2014, 46, 031401. [Google Scholar] [CrossRef]
- Aref, H. Integrable, chaotic, and turbulent vortex motion in two-dimensional flows. Annu. Rev. Fluid Mech. 1983, 15, 345–389. [Google Scholar] [CrossRef]
- Legras, B.; Dritschel, D. The elliptical model of two-dimensional vortex dynamics. I: The basic state. Phys. Fluids 1991, 3, 845–854. [Google Scholar] [CrossRef]
- McKiver, W.J.; Dritschel, D.G. The motion of a fluid ellipsoid in a general linear background flow. J. Fluid Mech. 2003, 474, 147–173. [Google Scholar] [CrossRef]
- Dritschel, D.G.; Reinaud, J.N.; McKiver, W.J. The quasi-geostrophic ellipsoidal vortex model. J. Fluid Mech. 2004, 505, 201–223. [Google Scholar] [CrossRef]
- Lilly, J.M. Kinematics of a Fluid Ellipse in a Linear Flow. Fluids 2018, 3, 16. [Google Scholar] [CrossRef]
- Lamb, H. Hydrodynamics, 6th ed.; Cambridge University Press: Cambridge, UK, 1932. [Google Scholar]
- Koshel, K.V.; Ryzhov, E.A. Parametric resonance with a point-vortex pair in a nonstationary deformation flow. Phys. Lett. A 2012, 376, 744–747. [Google Scholar] [CrossRef]
- Ryzhov, E.A.; Koshel, K.V. Resonance phenomena in a two-layer two-vortex shear flow. Chaos 2016, 26, 113116. [Google Scholar] [CrossRef]
- Koshel, K.V.; Ryzhov, E.A. Parametric resonance in the dynamics of an elliptic vortex in a periodically strained environment. Nonlinear Processes Geophys. 2017, 24, 1–8. [Google Scholar] [CrossRef]
- Ryzhov, E.A.; Koshel, K.V. Parametric instability of a many point-vortex system in a multi-layer flow under linear deformation. Regul. Chaotic Dyn. 2016, 21, 254–266. [Google Scholar] [CrossRef]
- Ryzhov, E.A.; Koshel, K.V. The effects of chaotic advection in a three-layer ocean model. Izv. Atmos. Ocean. Phys. 2011, 47, 241–251. [Google Scholar] [CrossRef]
- Magnus, W.; Winkler, S. Hill’s Equation; Interscience-Wiley: New York, NY, USA, 1966; p. 135. [Google Scholar]
- Klyatskin, V.I.; Koshel, K.V. Numerical modeling of wave propagation in periodic media. J. Exp. Theor. Phys. 1983, 84, 2092–2098. [Google Scholar]
- Ryzhov, E.A.; Koshel, K.V.; Carton, X.J. Passive scalar advection in the vicinity of two point vortices in a deformation flow. Eur. J. Mech. B Fluid 2012, 34, 121–130. [Google Scholar] [CrossRef]
- Sokolovskiy, M.A.; Verron, J. Finite-core hetons: stability and interactions. J. Fluid Mech. 2000, 423, 127–154. [Google Scholar] [CrossRef]
- Ryzhov, E.A.; Koshel, K.V. Two-point-vortex evolution in an oscillatory shear flow with rotation. Europhys. Lett. 2014, 108, 24002. [Google Scholar] [CrossRef]
- Koshel, K.V.; Ryzhov, E.A. Local parametric instability near elliptic points in vortex flows under shear deformation. Chaos 2016, 26, 083111. [Google Scholar] [CrossRef] [PubMed]
- Zaslavsky, G.M.; Chirikov, B.V. Stochastic instability of nonlinear oscillations. Soviet Physics Uspekhi 1972, 14, 549–672. [Google Scholar] [CrossRef]
- Chirikov, B.V. A universal instability of many-dimensional oscillator systems. Phys. Rep. 1979, 52, 263–379. [Google Scholar] [CrossRef]
- Lichtenberg, A.; Lieberman, M. Regular and Stochastic Motion; Springer: New York, NY, USA, 1983. [Google Scholar]
- Zaslavsky, G.M. Physics of Chaos in Hamiltonian Dynamics; Imperial College Press: London, UK, 1998. [Google Scholar]
- Rom-Kedar, V.; Leonard, A.; Wiggins, A. An analytical study of transport, mixing and chaos in an unsteady vortical flow. J. Fluid Mech. 1990, 214, 347–394. [Google Scholar] [CrossRef]
- Neishtadt, A.I. Probability phenomena due to separatrix crossing. Chaos 1991, 1, 42–48. [Google Scholar] [CrossRef]
- Wiggins, S. Chaotic Transport in Dynamical Systems; Springer: New York, NY, USA, 1992. [Google Scholar]
- Koshel, K.V.; Sokolovskiy, M.A.; Davies, P.A. Chaotic advection and nonlinear resonances in an oceanic flow above submerged obstacle. Fluid Dyn. Res. 2008, 40, 695–736. [Google Scholar] [CrossRef]
- Zavodney, L.; Nayfeh, A.; Sanchez, N. Bifurcations and Chaos in Parametrically Excited Single-Degree-of-Freedom Systems. Nonlinear Dyn. 1990, 1, 1–21. [Google Scholar] [CrossRef]
- Jeon, D.; Bai, M.; Chu, C.; Kang, X.; Lee, S.; Riabko, A.; Zhao, X. Role of parametric resonances in global chaos. Phys. Rev. E 1996, 54, 4192–4201. [Google Scholar] [CrossRef]
- Prants, S.; Konkov, L. Parametric instability and Hamiltonian chaos in cavity semiclassical electrodynamics. J. Exp. Theor. Phys. 1999, 88, 406–414. [Google Scholar] [CrossRef]
- Kandrup, H.E.; Vass, I.M.; Sideris, I.V. Transient chaos and resonant phase mixing in violent relaxation. Mon. Not. R. Astron. Soc. 2003, 341, 927–936. [Google Scholar] [CrossRef]
- Kecik, K.; Warminski, J. Chaos in mechanical pendulum-like system near main parametric resonance. Procedia IUTAM 2012, 5, 249–258. [Google Scholar] [CrossRef]
- Khomeriki, G. Parametric resonance induced chaos in magnetic damped driven pendulum. Phys. Lett. A 2016, 380, 2382–2385. [Google Scholar] [CrossRef]
- Gluhovsky, A.; Klyatskin, V. On dynamics of flipover phenomena in simple hydrodynamic models. Dokl. Earth Sci. Sec. 1977, 237, 18–20. [Google Scholar]
- Klyatskin, V. Stochastic Equations. Theory and Its Applications to the Acoustics, Fluid Dynamics, and Radiophysics; Fizmatlit: Moscow, Russia, 2008; Volume 1–2. [Google Scholar]
- Perrot, X.; Carton, X. 2D vortex interaction in a non-uniform flow. Theor. Comput. Fluid Dyn. 2010, 24, 95–100. [Google Scholar] [CrossRef]
- Perrot, X.; Carton, X.; Guillou, A. Geostrophic vortex alignment in external shear or strain. IUTAM Symposium on Turbulence in the Atmosphere and Oceans. In IUTAM Bookseries; Springer: Berlin, Germany, 2010; Volume 28, pp. 217–228. [Google Scholar]
- Perrot, X.; Reinaud, J.N.; Carton, X.; Dritschel, D.G. Homostrophic Vortex Interaction under External Strain, in a Coupled QG-SQG Model. Regul. Chaotic Dyn. 2010, 15, 66–83. [Google Scholar] [CrossRef]
- Koshel, K.V.; Stepanov, D.V. Some specific features of chaotization and transport in pulsating barotropic flow over a topographic point vortex near boundary. Regul. Chaotic Dyn. 2004, 9, 439–449. [Google Scholar] [CrossRef]
- Izrailsky, Y.G.; Koshel, K.V.; Stepanov, D.V. Determination of optimal excitation frequency range in background flows. Chaos 2008, 18, 013107. [Google Scholar] [CrossRef] [PubMed]
- Li, Y.; Xu, Y. Penetration depth of diapycnal mixing generated by wind stress and flow over topography in the northwestern Pacific. J. Geophys. Res. 2014, 119, 5501–5514. [Google Scholar] [CrossRef]
- Liu, Z.; Roebber, P.J. Vortex-Driven Sensitivity in Deformation Flow. J. Phys. Oceanogr. 2008, 65, 3819–3839. [Google Scholar] [CrossRef]
- Ryzhov, E.A.; Koshel, K.V. Chaotic transport and mixing of a passive admixture by vortex flows behind obstacles. Izv. Atmos. Ocean. Phys. 2010, 46, 184–191. [Google Scholar] [CrossRef]
- Koshel, K.V.; Ryzhov, E.A.; Zhmur, V.V. Diffusion-affected passive scalar transport in an ellipsoidal vortex in a shear flow. Nonlinear Process. Geophys. 2013, 20, 437–444. [Google Scholar] [CrossRef]
- Ryzhov, E.A.; Koshel, K.V. Interaction of a monopole vortex with an isolated topographic feature in a three-layer geophysical flow. Nonlinear Process. Geophys. 2013, 20, 107–119. [Google Scholar] [CrossRef]
- Southwick, O.R.; Johnson, E.R.; McDonald, N.R. A point vortex model for the formation of ocean eddies by flow separation. Phys. Fluids 2015, 27, 016604. [Google Scholar] [CrossRef]
- Haller, G.; Poje, A. Finite time transport in aperiodic flows. Physica D 1998, 119, 352–380. [Google Scholar] [CrossRef]
- Haller, G.; Yuan, G. Lagrangian coherent structures and mixing in two-dimensional turbulence. Physica D 2000, 147, 352–370. [Google Scholar] [CrossRef]
- Prants, S.V. Dynamical systems theory methods to study mixing and transport in the ocean. Phys. Scr. 2013, 87, 038115. [Google Scholar] [CrossRef]
- Haller, G. Lagrangian coherent structures. Annu. Rev. Fluid Mech. 2015, 47, 137–162. [Google Scholar] [CrossRef]
- Aurell, E.; Boffetta, G.; Crisanti, A.; Paladin, G.; Vulpiani, A. Predictability in the large: An extension of the concept of Lyapunov exponent. J. Phys. A Math. Gen. 1997, 30, 1–26. [Google Scholar] [CrossRef]
- Rypina, I.I.; Scott, S.E.; Pratt, L.J.; Brown, M.G. Investigating the connection between complexity of isolated trajectories and Lagrangian coherent structures. Nonlinear Process. Geophys. 2011, 18, 977–987. [Google Scholar] [CrossRef]
- Mendoza, C.; Mancho, A. Hidden geometry of ocean flows. Phys. Rev. Lett. 2010, 105, 038501. [Google Scholar] [CrossRef] [PubMed]
- Ryzhov, E.A.; Koshel, K.V. Estimating the size of the regular region of a topographically trapped vortex. Geophys. Astrophys. Fluid Dyn. 2011, 105, 536–551. [Google Scholar] [CrossRef]
- Tychensky, A.; Carton, X. Hydrological and dynamical characterization of Meddies in the Azores region: A paradigm for baroclinic vortex dynamics. J. Geophys. Res. 1998, 103, 25061–25079. [Google Scholar] [CrossRef]
- Richardson, P.L.; Bower, A.S.; Zenk, W. A census of Meddies tracked by floats. Prog. Oceanogr. 2000, 45, 209–250. [Google Scholar] [CrossRef]
- Viudez, A. Vertical Splitting of Vortices in Geophysical Dipoles. J. Phys. Oceanogr. 2010, 40, 2170–2179. [Google Scholar] [CrossRef]
- LaCasce, J.H.; Wang, J. Estimating Subsurface Velocities from Surface Fields with Idealized Stratification. J. Phys. Oceanogr. 2015, 45, 2424–2435. [Google Scholar] [CrossRef]
- Ryzhov, E.A.; Koshel, K.V. Global chaotization of fluid particle trajectories in a sheared two-layer two-vortex flow. Chaos 2015, 25, 103108. [Google Scholar] [CrossRef]
- Assassi, C.; Morel, Y.; Vandermeirsch, F.; Chaigneau, A.; Pegliasco, C.; Morrow, R.; Colas, F.; Fleury, S.; Carton, X.; Klein, P.; et al. An index to distinguish surface and subsurface intensified vortices from surface observations. J. Phys. Oceanogr. 2016, 46, 2529–2552. [Google Scholar] [CrossRef]
- Ciani, D.; Carton, X.; Verron, J. On the merger of subsurface isolated vortices. Geophys. Astrophys. Fluid Dyn. 2016, 110, 23–49. [Google Scholar] [CrossRef]
- Sokolovskiy, M.A.; Carton, X.J.; Filyushkin, B.N.; Yakovenko, O.I. Interaction between a surface jet and subsurface vortices in a three-layer quasi-geostrophic model. Geophys. Astrophys. Fluid Dyn. 2016, 110, 201–223. [Google Scholar] [CrossRef]
- Brown, M.G.; Samelson, R.M. Particle motion in vorticity-conserving, 2-dimensional incompressible flows. Phys. Fluids 1994, 6, 2875–2876. [Google Scholar] [CrossRef]
- Klyatskin, V.I. Statistical description of the diffusion of a passive tracer in a random velocity field. Physics-Uspekhi 1994, 37, 501–513. [Google Scholar] [CrossRef]
- Koshel, K.V.; Alexandrova, O.V. Some results of a numerical modeling of the diffusion of passive tracers in a random field of velocities. Izv. Atmos. Ocean. Phys. 1999, 35, 578–588. [Google Scholar]
- Klyatskin, V.I.; Koshel, K.V. The simplest example of the development of a cluster-structured passive tracer field in random flows. Physics-Uspekhi 2000, 170, 771–778. [Google Scholar]
- Klyatskin, V.I. Stochastic Equations through the Eyes of the Physicist (Basic Concepts, Exact Results, and Asymptotic Approximations); Elsevier Science: Amsterdam, The Netherlands, 2005; p. 556. [Google Scholar]
- Koshel, K.V.; Ryzhov, E.A.; Zhmur, V.V. Effect of the vertical component of diffusion on passive scalar transport in an isolated vortex model. Phys. Rev. E 2015, 92, 053021. [Google Scholar] [CrossRef]
- Monin, A.S.; Ozmidov, R.V. Turbulence in the Ocean; Reidel: Dordrecht, The Netherlands, 1985; p. 247. [Google Scholar]
- Polvani, L.M.; Wisdom, J.; DeJong, E.; Ingersoll, A.P. Simple Dynamical Models of Neptune’s Great Dark Spot. Science 1990, 249, 1393–1398. [Google Scholar] [CrossRef]
- McWilliams, J. Geostrophic Vortices. In Nonlinear Topics in Ocean Physics: Proceedings of the International School of Physics “Enrico Fermi”, Course 109; Osborne, A., Ed.; North-Holland, Elsevier Science Publishers B.V.: Amsterdam, The Netherlands, 1991; pp. 5–50. [Google Scholar]
- Ince, E.L. Ordinary Differential Equations; Courier Dover Publications: New York, NY, USA, 1956. [Google Scholar]
© 2019 by the authors. Licensee MDPI, Basel, Switzerland. This article is an open access article distributed under the terms and conditions of the Creative Commons Attribution (CC BY) license (http://creativecommons.org/licenses/by/4.0/).