1. Introduction
In order to gain public acceptance of hydrogen as an energy carrier requires addressing key safety issues related to its production, storage and application. Since hydrogen is an easily detonable gas with a wide flammability limit, a rigorous hazard assessment is necessary to progress towards a hydrogen economy. Serious explosion accidents involving hydrogen have been attributed to massive release rates of hydrogen into a congested space with obstacles and due to accidental introduction of air into high-pressure storage vessels [
1]. High-fidelity numerical simulations can yield valuable insights into deflagration and detonation scenarios involving hydrogen-air mixtures. However, while considerable care has gone into the selection of appropriate turbulence and gas-phase chemistry modeling methodologies in these scenarios, the impacts of radiative heat losses have often been overlooked or ignored. These may either be attributed to the fact that a propagating deflagration/detonation wave may be considered to be optically thin and, therefore, radiative losses are anticipated to be minimal. Further, there is a significant computational overhead associated with modeling the spatial, temporal, directional, and wavelength dependencies of radiative transport. In the context of dust explosions in hydrogen–oxygen mixtures, Liberman et al. [
2,
3] accounted for the effects of radiation by considering the gas mixture to be transparent and the dispersed phase to be radiatively participating. They found radiative transfer to cause heating of the particles ahead of the flame followed by re-emission of this radiation. This radiative preheating of the mixture ahead of the flame either increased the flame velocity or triggered detonation through the Zeldovich gradient mechanism [
4].
In the context of heat losses, a consistent application of thermal boundary conditions (i.e., isothermal, adiabatic) is also not found in the literature. It is worth noting that in the context of pulse detonation engines (PDEs), the impact of convective heat losses on the engine performance have been well recognized [
5]. The heat loss magnitudes were found to be governed by the tube length (L) to tube diameter (D) ratios (L/D) and were significantly impacted the gas dynamics (pressure profiles) inside the detonation tube and lowered the impulse generated by the expanding gases. Analogous to higher heat losses at larger L/D ratios in PDE experiments, detonation simulations in narrow (micro) channels have also seen an impact of the thermal boundary conditions on the flame acceleration and deflagration-to-detonation transitions (DDT) [
6]. However, similar studies in macro-channels are lacking resulting from obvious assumptions that these are likely to be minimal. The goal of this manuscript is to provide an initial assessment of the validity of this assumption by rigorously accounting for the effects of radiative and convective losses on flame acceleration and its subsequent transition to a detonation wave in hydrogen-air mixtures. We consider a long macro-channel (diameter: 174 mm and 11.878 m length) with obstacles for our assessment to represent a congested geometry with obstacles. In addition, the impacts of system pressure (0.1 atm and 3 atm) representing high pressure vessels and the use of isothermal and adiabatic boundary conditions are also investigated.
The acceleration of a low speed laminar flame to a high-speed deflagration wave and its subsequent transition to a detonation wave has been attributed to the complex interplay between turbulent flame–shock interactions, the development of hot spots and reaction gradients [
7,
8]. In macro-channels (>10 mm), the first stage of flame acceleration is likely caused by instabilities in the flame that promote flame wrinkling (or an increase in reaction surface area). Kelvin–Helmholtz instabilities resulting from a large velocity difference between adjacent layers of a fluid promote the formation of a fast flame near the walls of the pipe, while Rayleigh-Taylor instabilities resulting from density differences result in “flame wrinkling” as the pressure and temperature on either side of the flame try to “adjust” to the density differences at the interface. The presence of obstacles only triggers or hastes the formation of these instabilities by inducing turbulent flow ahead of the flame front. Numerically, resolving these transient instability characteristics therefore requires the use of high-fidelity turbulence models such as those in the Large Eddy Simulation (LES) framework [
9] or Direct Numerical Simulations (DNS) [
10].
The self-sustained propagation mechanism of these fast flames and their eventual transition to a detonation wave have been attributed to the formation of the hot-spots in the wake of turbulent mixing, flame surface distortion due to repeated shock wave interactions and the triggering of Richtmyer–Meshkov (RM) instabilities (resulting from the acceleration of fluid elements of different densities in the presence of a shock wave). Predictions of temperature-gradient induction lengths that were thought to play a vital role in triggering detonations in DDT scenarios were found to be sensitive to the chemistry models employed in the simulations by Liberman et al. [
11]. Minimal induction length predictions when employing detailed chemistry models along with accurate kinetic-transport models were found to be 2–3 orders of magnitude greater than those predicted employing single-step global chemistry models. Consequently, several recent studies have employed detailed chemistry models to simulate detonation scenarios in spite of the high computational cost [
9,
11,
12,
13,
14]. Using accurate kinetic-transport models in conjunction with detailed chemistry becomes even more important in detonation scenarios involving hydrogen, due to the differential diffusivities of hydrogen and oxidizer molecules resulting in non-unity Lewis numbers [
14].
2. Methods
After considering the current state of the art in numerical simulations of DDT reviewed in the previous section, we carried out CFD simulations employing the LES framework and a detailed 21-step chemical kinetic model with transport properties determined from kinetic theory using the software ANSYS FLUENT (version) [
15]. In order to account for the radiative losses, the P-1 radiation model was employed to solve the radiative transport equation as an acceptable compromise between speed and accuracy in comparison to the more accurate but computationally expensive discrete ordinates method [
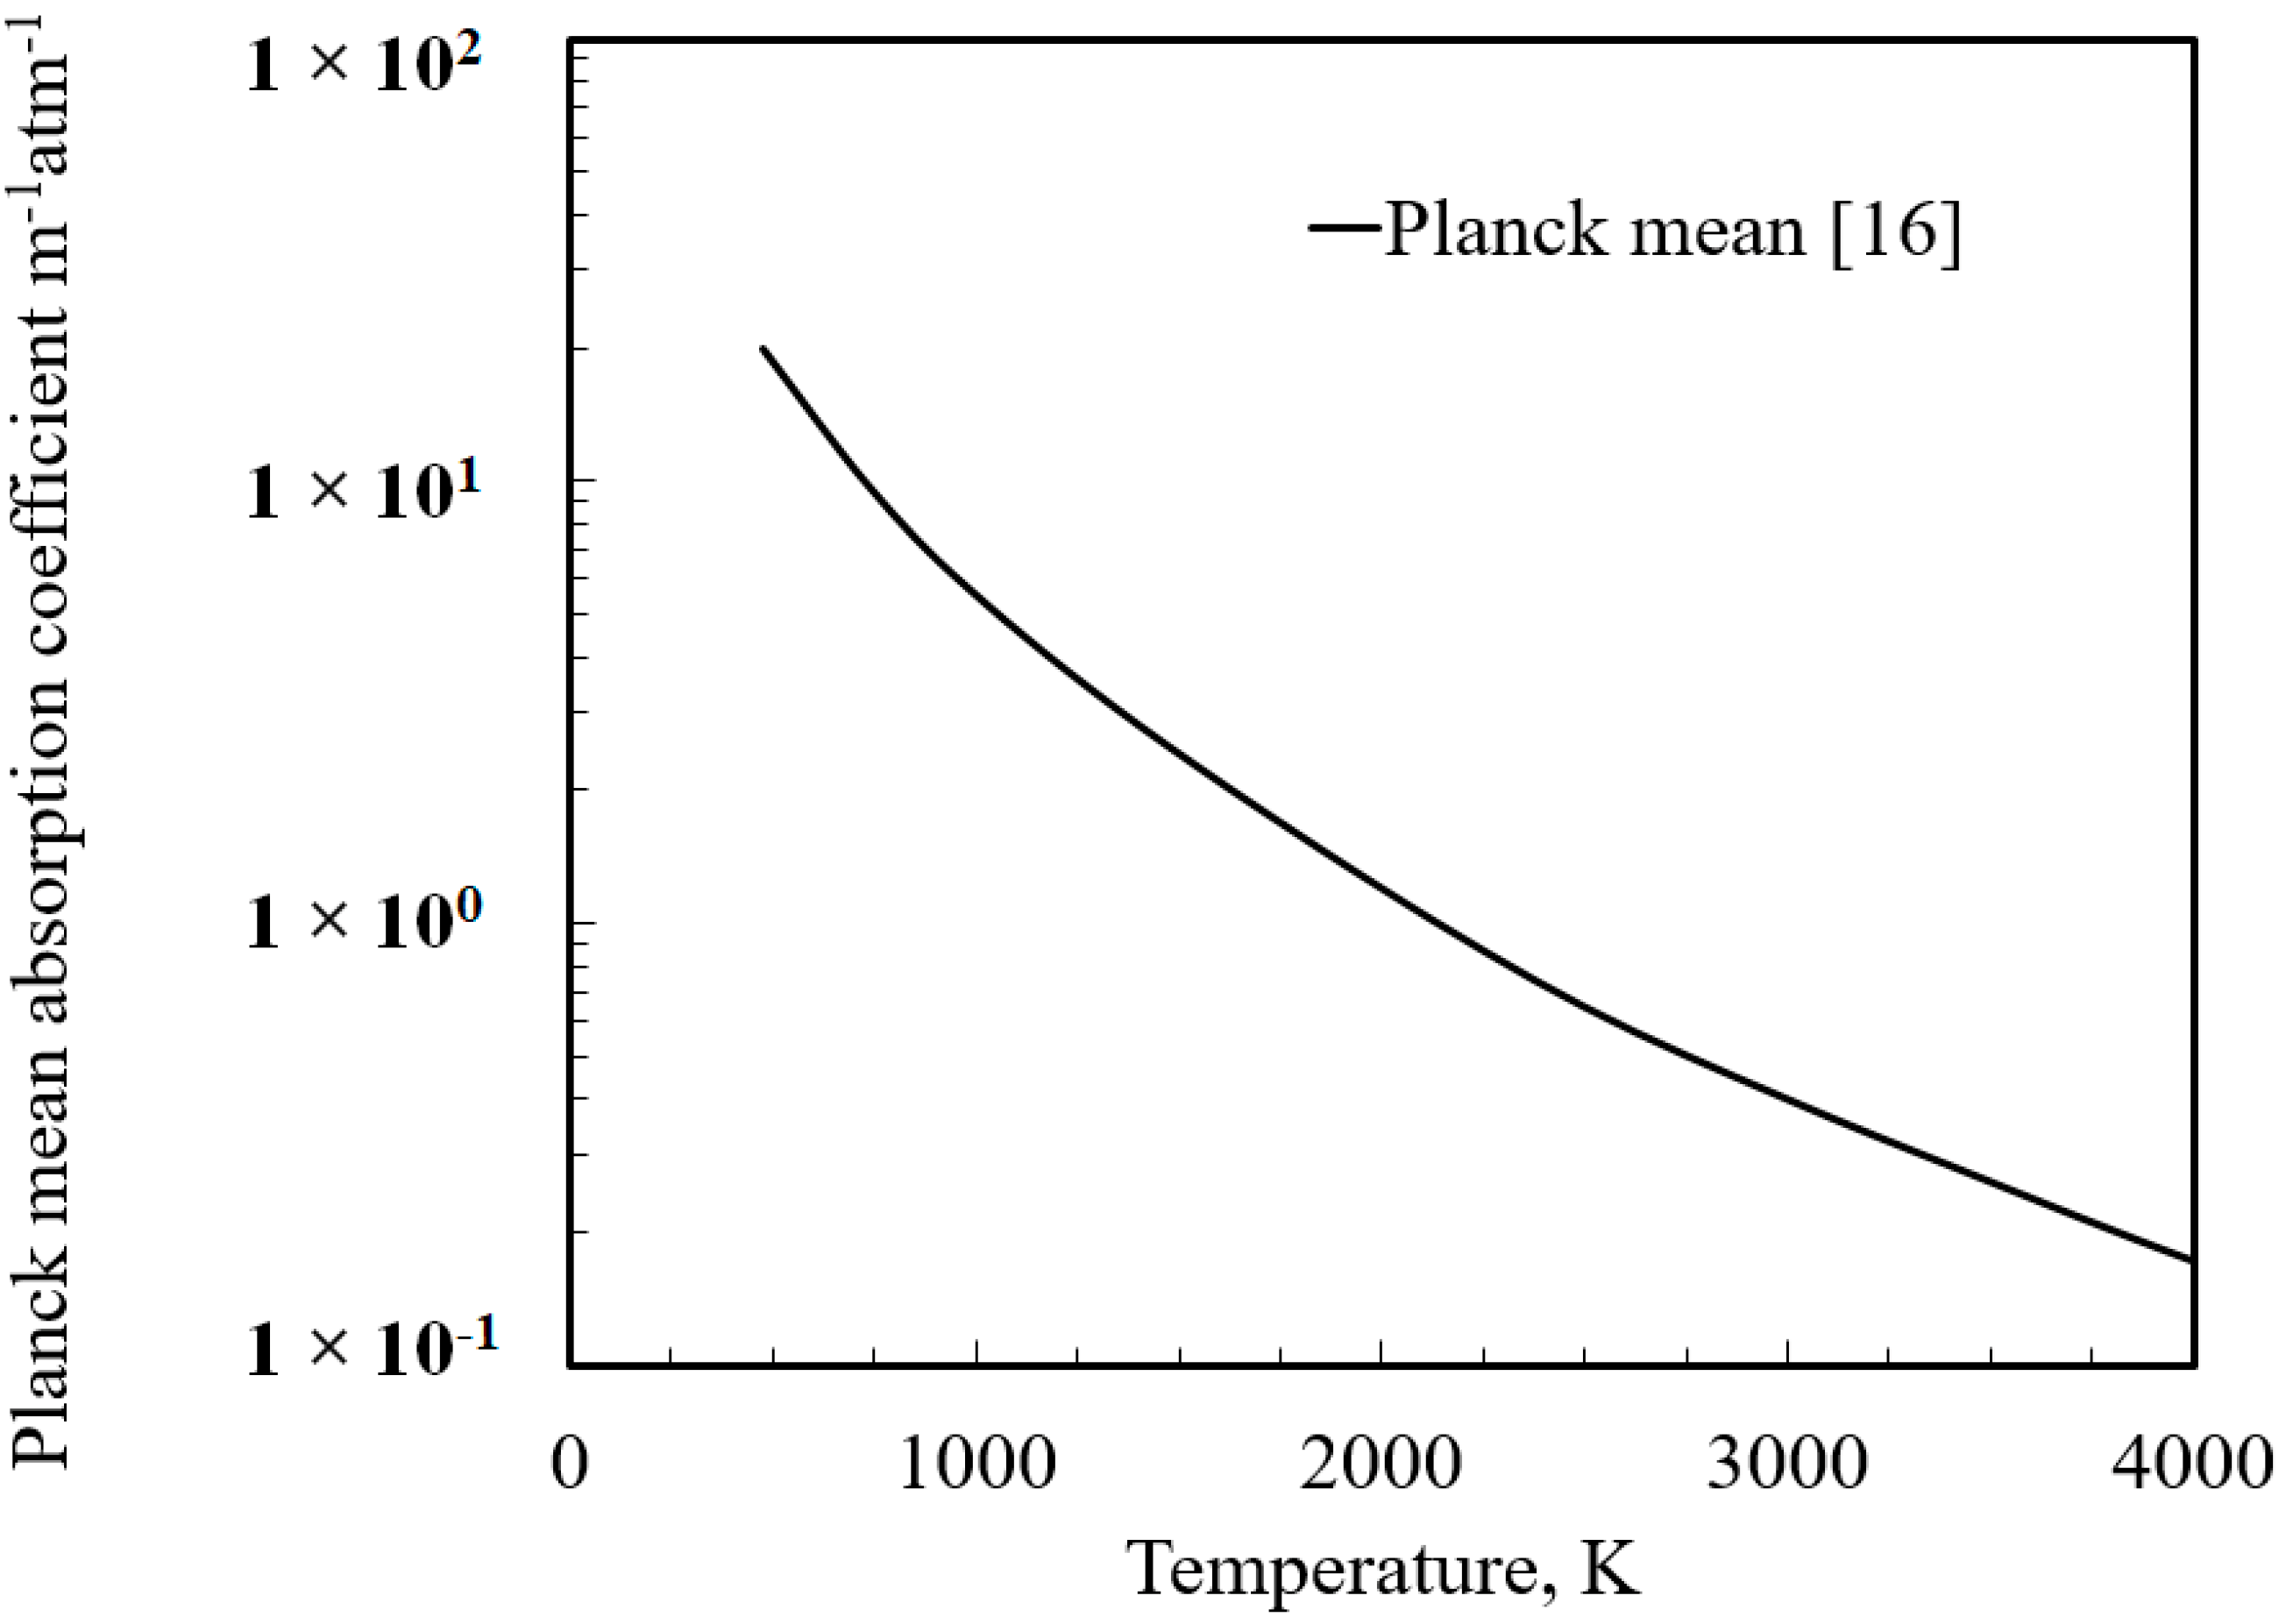
15]. A temperature-dependent Planck mean absorption coefficient [
16] was employed to describe the radiative property of water vapor and was implemented as an add-on function in ANSYS FLUENT (cf.
Figure 1).
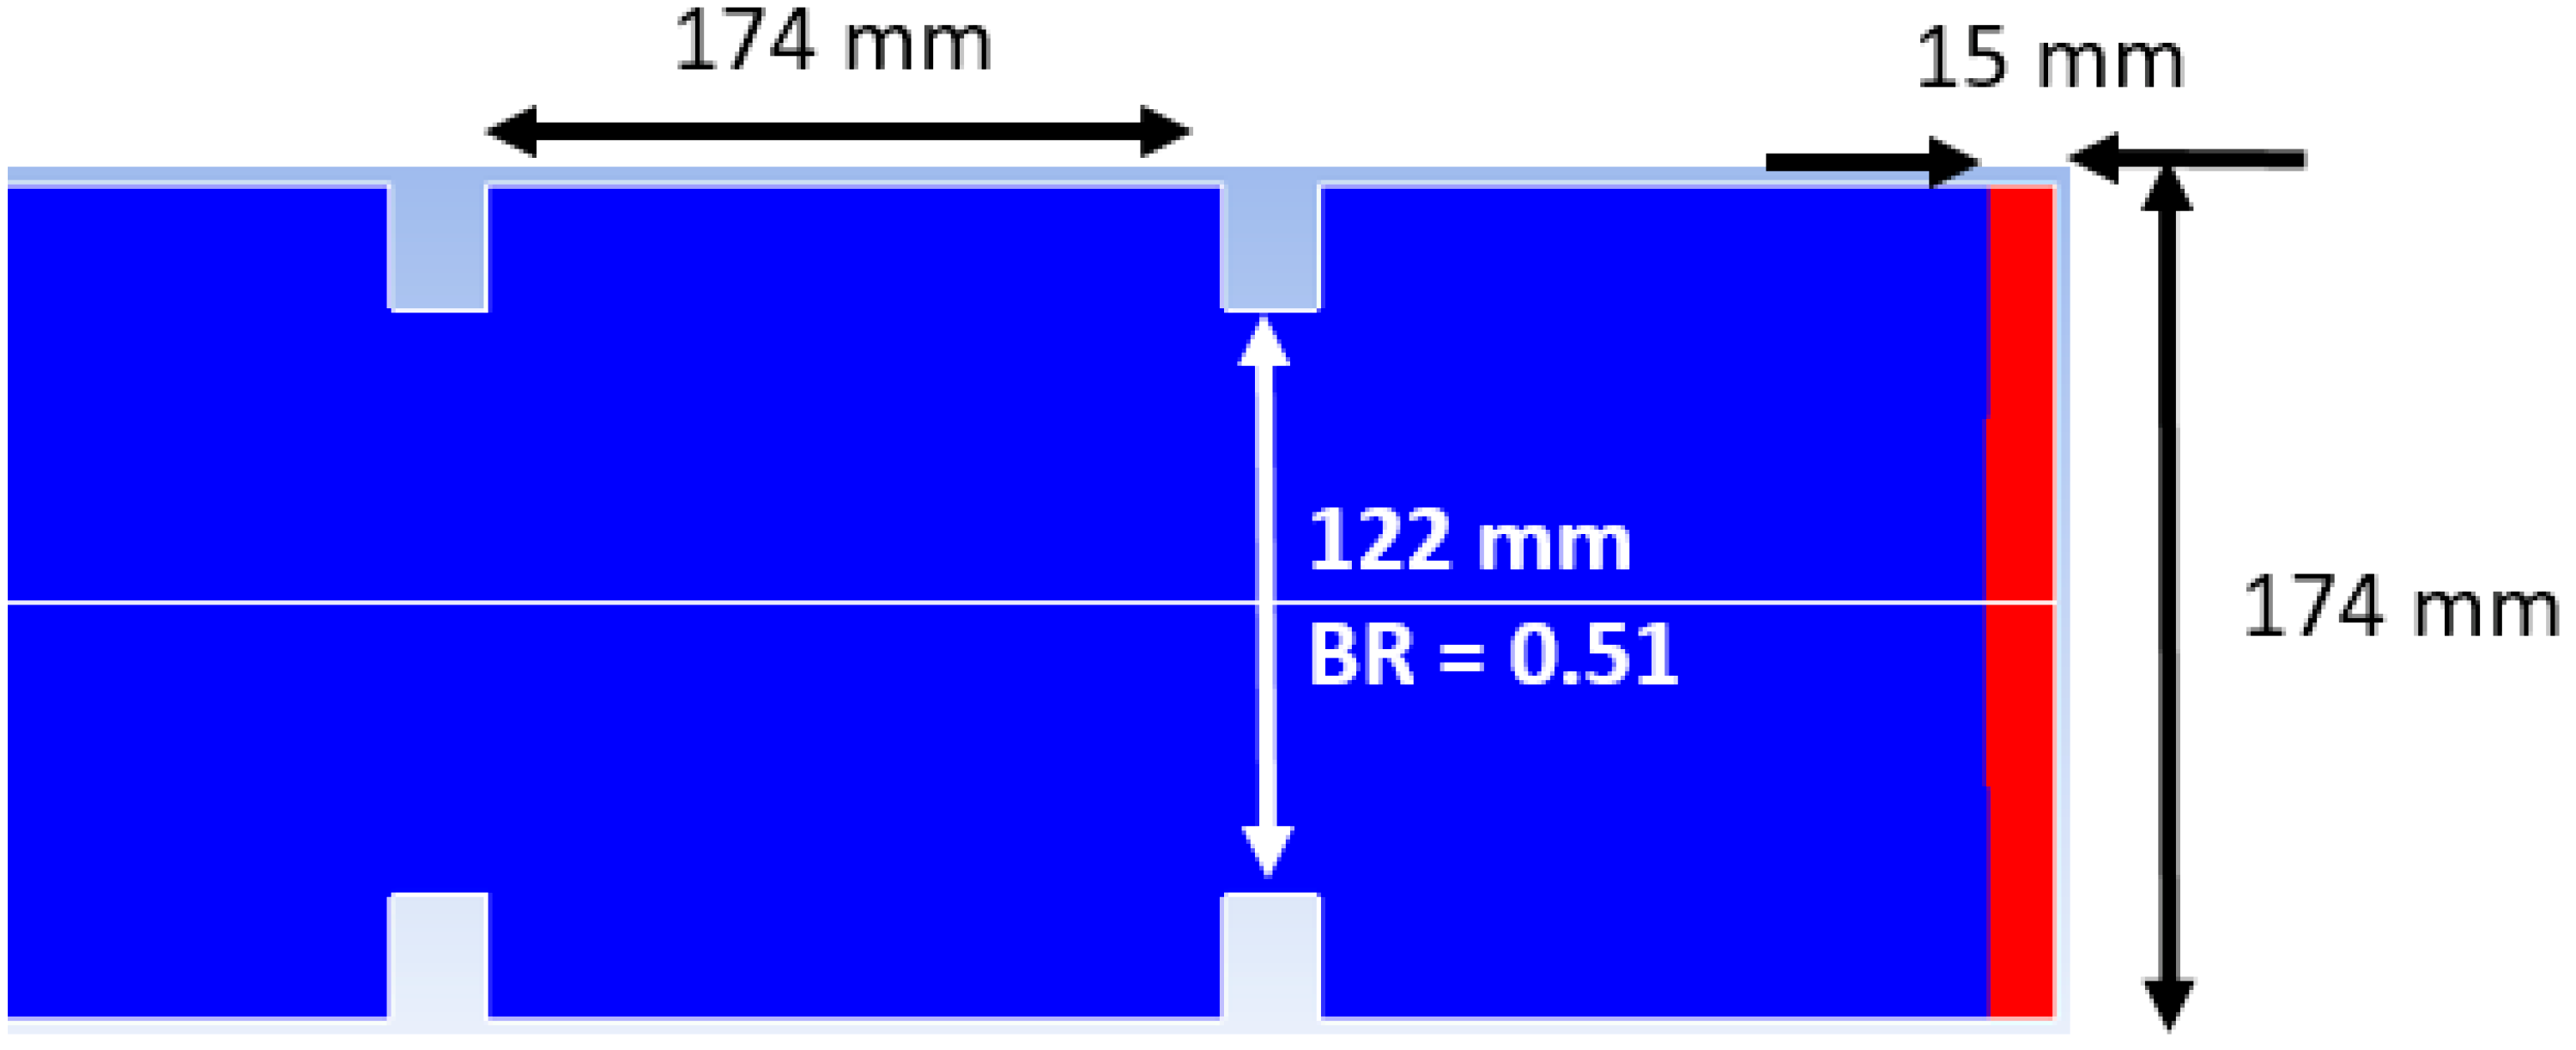
The size of each cell in the computation domain was 15 mm along the direction of propagation of the combustion wave. This resolution has been deemed to be adequate to perform computationally efficient industrial hazard assessments in large-scale practical domains of interest. For instance, grid resolutions of 16.7 mm and 50 mm were employed by Middha and Hansen [
17] to simulate and validate the combustion models in the CFD code FLame ACceleration Simulator (FLACS) by comparing their predictions against well-established, legacy experimental data. In order to initiate the detonation, one computational cell normal to the closed end of the tube was patched with a temperature of 1700 K as a close approximation to the adiabatic flame temperature of hydrogen-air mixtures at an equivalence ratio of 0.5. Next, based on the volume of the detonation kernel and the patched temperature, the ideal gas equation of state was employed to compute the pressure within the detonation volume. The other end of the tube was open with a gauge pressure of zero (i.e., total pressure equal to the system pressure). A portion of the computational domain along with the initial detonation volume is shown in
Figure 2. The blockage ratio (BR) shown in
Figure 2 was calculated as: BR = 1 − (122
2/174
2) as per its definition in Kuzetsov et al. [
18] to represent the fraction of the cross-sectional area that was blocked by the obstruction.
The complete initial details within the domain at the start of the simulation are summarized in
Table 1.
LES methods involve the solution of the time-dependent Navier–Stokes equations which have been spatially filtered over the computational grid. To model the compressible flow behavior associated with the turbulent combustion process within the LES framework, a change of variable is first introduced through Favre filtering where filtered/time-averaged variables are weighted by density to consider density fluctuations. For a given variable (
φ), the Favre-filtered value is defined as:
The filtered continuity, momentum, enthalpy (
h) and the specie mass fraction (
Y) equations are then written as:
In Equations (2)–(5), whenever the same index appears twice in any term, summation over the range of that index is implied according to Einstein convention. The molecular Prandtl (
Pr) and Schmidt numbers (
Sc) in Equations (4) and (5) respectively were assumed to have a constant value of 0.85.
QReaction and
SReaction in Equations (4) and (5) represent the net rate of production of enthalpy and specie respectively through chemical reactions.
qj in Equation (4) represents the radiative flux vector.
Sij (in Equation (3)) is the strain-rate of the large-scale (or resolved) field and is defined as:
In LES, the final terms on the right-hand side of Equations (3)–(5) (also known as the subgrid stress terms) require modeling. These terms contain local averages of the sub-grid scale (SGS) field. In this study, the effect of the SGS motion was approximation through a SGS eddy viscosity model. Here, the sub-grid stress terms were recast in the form of the diffusion terms of the corresponding equation as:
In this study, the turbulent Prandtl (
Prt) number and turbulent (
Sct) Schmidt number in Equations (8) and (9) respectively were held constant at 0.7. The turbulent eddy-viscosity (
µt) was calculated as:
where
LSGS, the mixing length for the sub-grid scale was computed as:
where
κ is the von Kármán constant,
d is the distance to the closest wall,
Cs is the Smagorinsky constant (assumed to take a constant value of 0.1 in this study), and
Vc is the computational volume of the local cell.
in Equation (10) was computed as:
To model radiative transport, the P-1 radiation model was employed in this study. The transport equation for the P-1 approximation determines the distribution of the incident radiation (
G) throughout the domain. If
k represents the absorption coefficient,
σs is the scattering coefficient (assumed to be zero in this study),
C is the linear-anisotropic phase function and
T is the temperature, then the differential equation governing the P-1 approximation can be written as [
15]:
where
If
εw and
Tw are the emissivity (assumed to be unity in this study) and temperature of the boundaries, respectively, then the boundary condition associated with the above equation is:
If the absorption coefficient and temperature within the domain are specified or can be obtained along with the boundary properties, then Equation (13) can be iteratively solved for the irradiation (
G) throughout the domain. The coupling between radiative transfer and the other physical models in the simulation occurs through the radiative flux vector and its divergence. The radiative flux vector impacts the energy balance at the system boundaries whereas its divergence is a source term in the energy balance equation. The radiative flux vector (
q) and its divergence at a position vector
r inside the domain are calculated as [
15]:
where
σ is the Stefan-Boltzmann constant,
k is the absorption coefficient, and
T is the local fluid temperature. The absorption coefficient (
k) was calculated through an add-function describing the functional form shown in
Figure 1.
Table 2 provides a complete summary of the different modeling options invoked in this study.
3. Results and Discussion
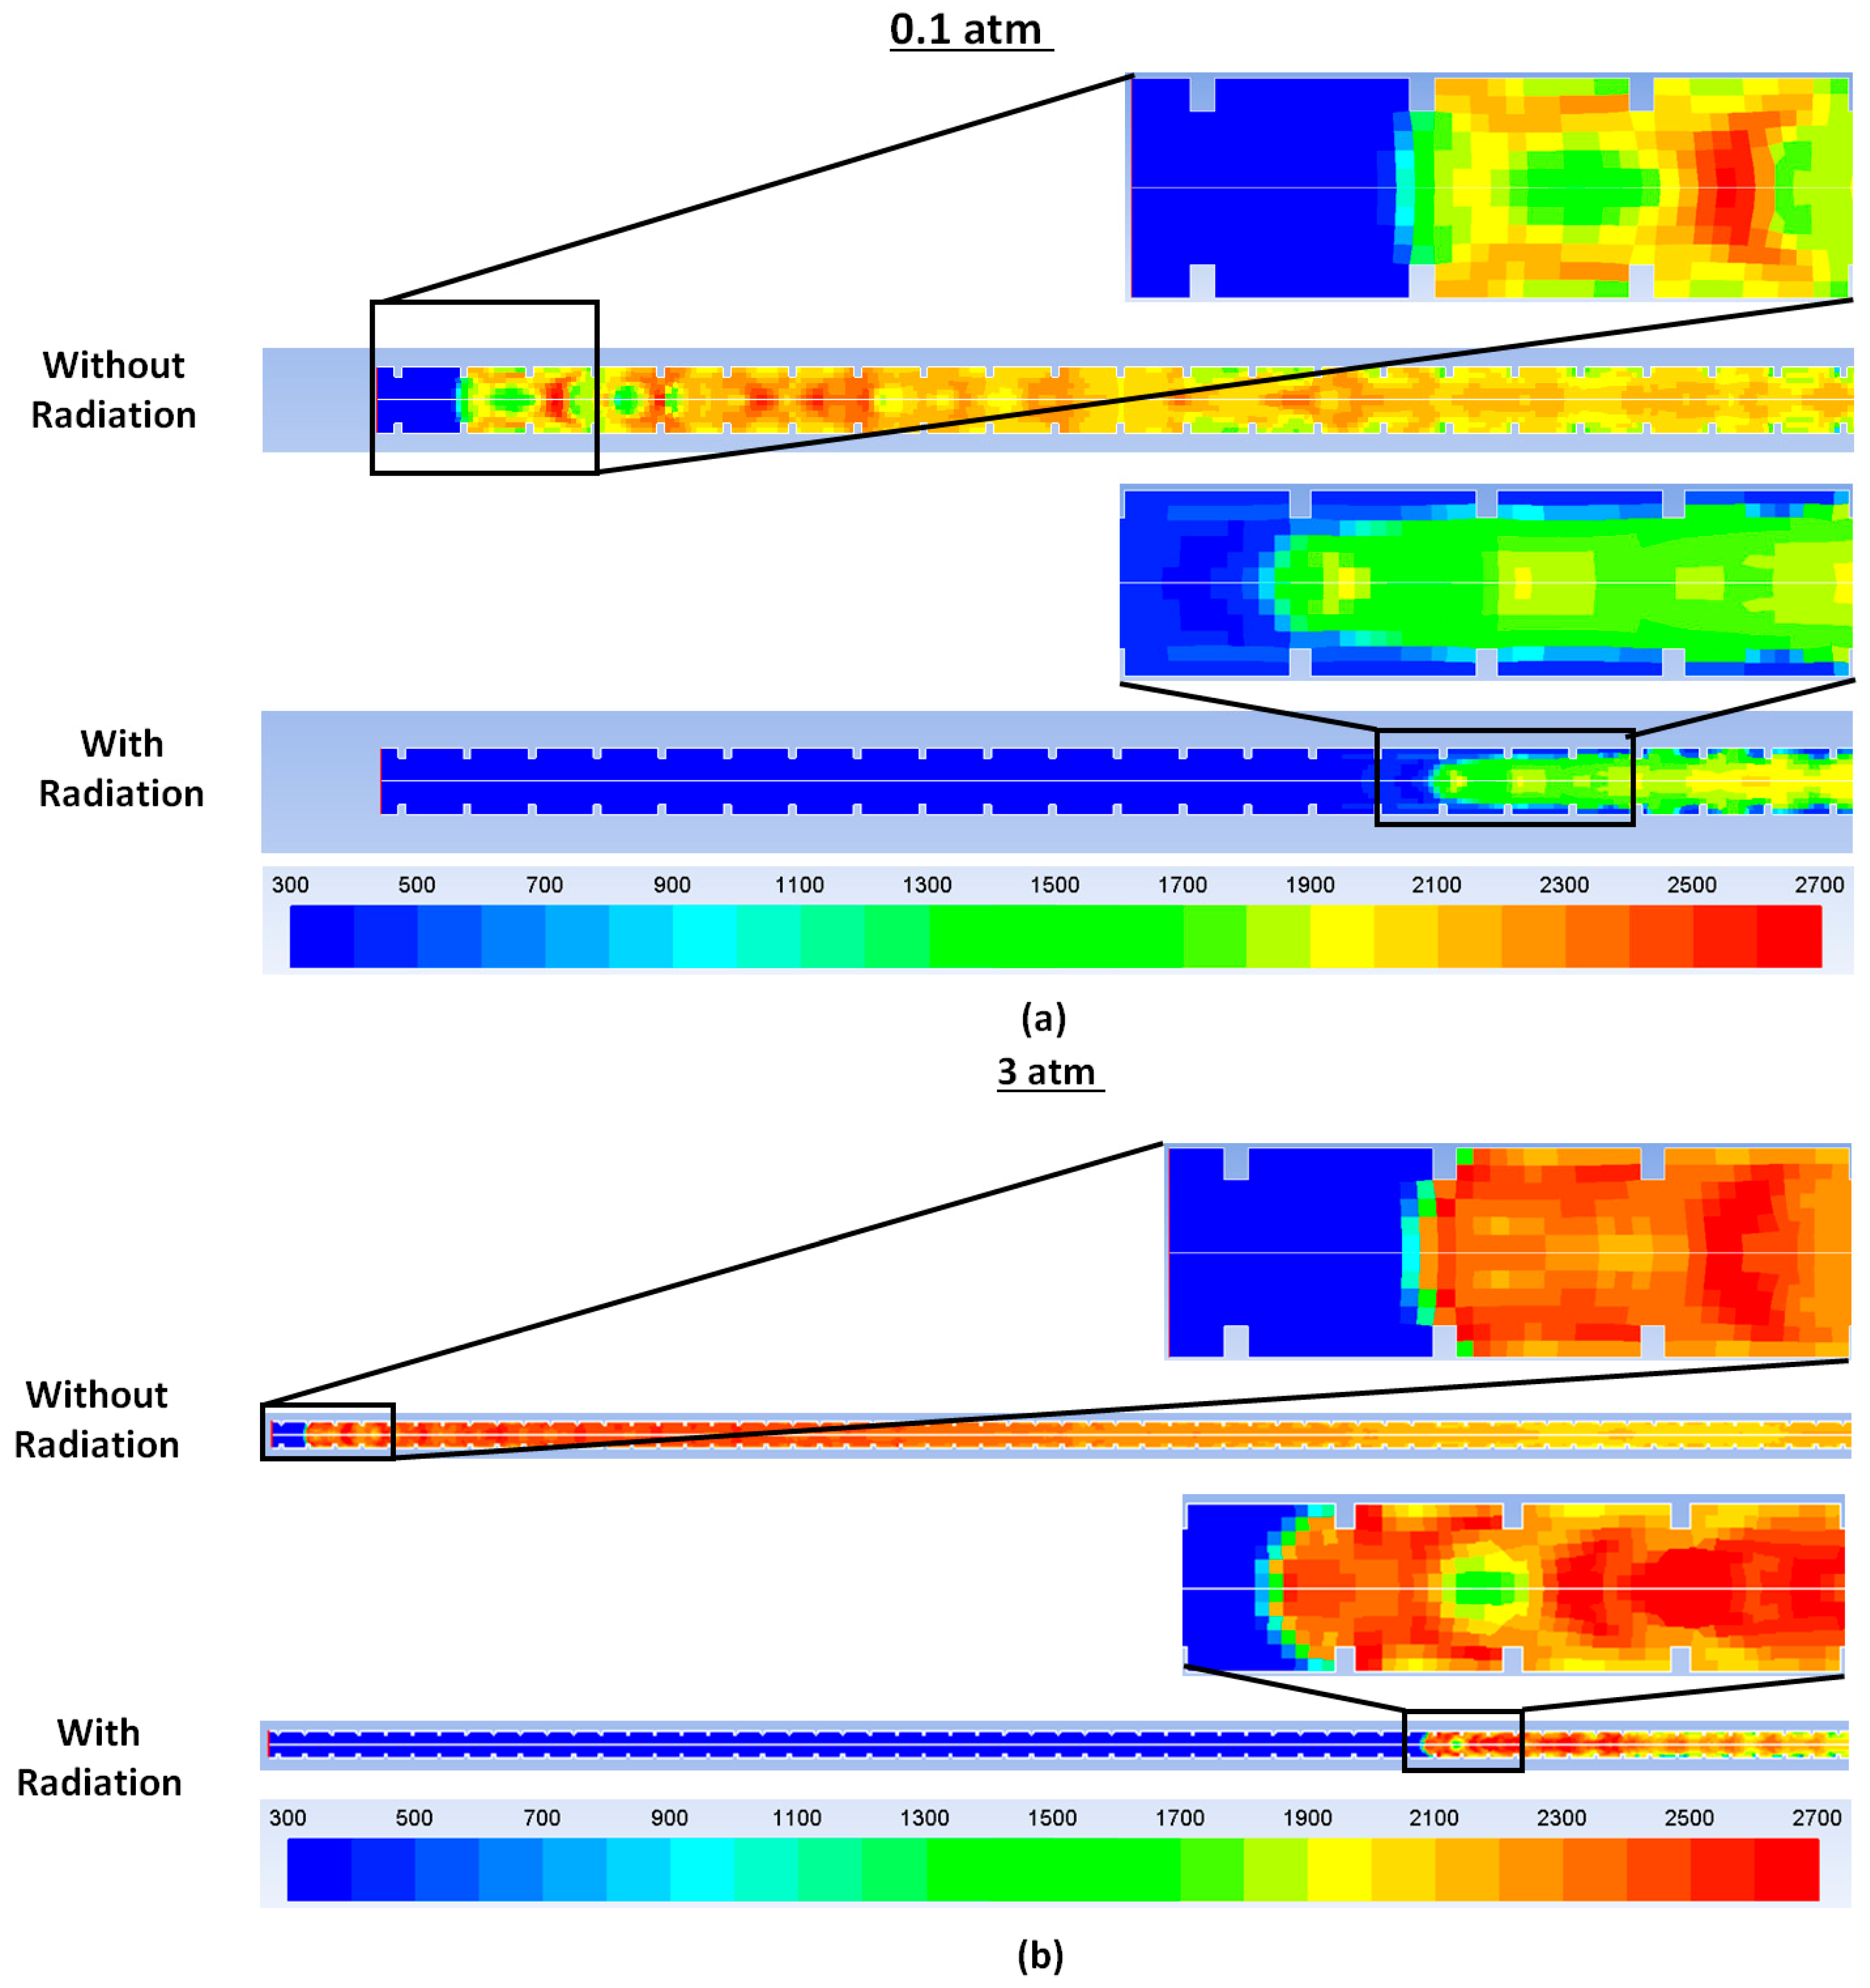
The position of the combustion wave at 6.4 × 10
−2 s at a system pressure of 0.1 atm relative to the open end of the tube is shown in
Figure 3a, and is represented by the gas temperature contours. The simulations were run employing adiabatic boundary conditions in both cases. Results from running the simulation without radiation are shown on the top whereas results with radiative transfer are shown at the bottom. Emission from the reacted mixture results in lower gas temperatures and the combustion wave (with radiation) is seen to clearly lag behind the combustion wave (without radiative losses). The corresponding temperature contours at 4 × 10
−2 s for a system pressure of 3 atm are shown in
Figure 3b. At 3 atm, the distances between the radiating and non-radiating combustion wave are further exacerbated on account of increased emission rates at higher water-vapor partial pressures.
Figure 4 shows the water vapor absorption coefficient (
k) at
t = 6.4 × 10
−2 s for a system pressure of 0.1 atm and at
t = 4 × 10
−2 s for a system pressure of 3.0 atm (corresponding to the combustion wave positions shown in
Figure 3a,b). Since the absorption coefficients are a function of water vapor partial pressures and temperatures, the absorption coefficients at 3.0 atm are roughly 30 times those at 0.1 atm. If
L represents the thickness of the combustion wave (on the order of 10
−3 m), we find that kL is on the order of 10
−3 for the 0.1 atm case and of the order 10
−2 for the 3 atm case. Since
kL << 1 in both these scenarios, an optically thin approximation (that accounts for emission only and neglects absorption within the medium) could have been undertaken in this study to avail some savings in computational time. This approximation was previously invoked by Mulenga and Krishnamoorthy [
20] during their investigation of internal detonation scenarios involving the hydrogen-air mixtures. In the optically thin approximation, the radiative source term (divergence of the radiative flux
q) at each spatial location is determined as:
where
σ is the Stefan–Boltzmann constant,
k is the absorption coefficient, and
T and
T∞ are the local and surrounding temperatures, respectively. The optically thin radiation approximation has also been employed in estimating radiation from air in hypersonic shock layers [
21] as well as from radiatively participating combustion products in mildly radiating dilute hydrogen flames [
22].
Figure 5 shows the position vs time (in a) as well as the velocity vs time (in b) of the simulations carried out using adiabatic boundary conditions at the walls. As seen previously in
Figure 3, the distances between the radiating combustion wave and the non-radiating combustion wave are exacerbated at higher operating pressures due to higher radiative loss magnitudes. Further, the transitions through flame acceleration and DDT are seen to occur earlier at the higher operating pressures. The effects of system pressure and blockage ratios on the flame acceleration propensities of hydrogen-air mixtures have been discussed by Sherman et al. [
23] and Dorofeev et al. [
24]. After conducting a series of 37 experiments at blockage ratios of 30% and 60%, at system pressures of 1 atm and 3 atm, Sherman et al. [
23] concluded that the combined effects of blockage effects and system pressure were important on establishing the “benign burning” limits. However, they did not isolate the individual effects (system pressure, blockage ratios) on these limits. Dorofeev et al. [
24] summarized in their study, the propagation speeds of hydrogen-air mixtures in obstructed channels at operating pressures of 1 bar and 3 bar and suggested correlations establishing critical conditions for flame acceleration. For a channel diameter of 174 mm (same as the one employed in this study) and a blockage ratio (BR) of 0.6, initial H
2 mole fractions of 15% resulted in fast flames while those at 25% were found to result in quasi-detonations respectively. Our results in
Figure 5 indicate that at initial mole fractions of 17% H
2, a system pressure of 0.1 atm results in flame acceleration whereas at 3 atm, the accelerating flame eventually transitions to quasi-detonation. Kuznetsov et al. [
18] found that the characteristic detonation velocities of hydrogen-air mixtures were a function of BR. For a 17%/17.5% H
2-Air mixture and BR’s of 0.1 and 0.3, the characteristic detonation velocities were found to be 1560 and 1390 m/s respectively.
Figure 5b indicates that at a system pressure of 3 atm, the combustion wave propagation reaches a steady state propagation velocity of 1270 m/s. Although the focus of our study was to assess the effects of radiative heat losses over a 30-fold range of operating pressures, our results seem to be within the performance envelope of acceleration and quasi-detonations observed in previous studies [
18,
24].
Figure 6 shows the peak temperatures of the combustion waves with time (in a), as well as the differences in the combustion wave temperatures as a result of including radiative heat losses. The maximum temperature observed at a system pressure of 3 atm is higher than that observed at a system pressure of 0.1 atm. Since the temperature increase should only be a function of compression ratios, this points to the fact that the combustion wave at 0.1 atm is still in the “accelerating regime” when it reaches the end of the tube, whereas at 3 atm, it has transitioned to a “quasi-detonation”. This is further confirmed by the velocities shown in
Figure 5b. Also, since radiative losses are a sink term in the energy equation (cf. Equation (3)),
Figure 6b shows lower temperatures in the simulations that account for radiative losses in comparison to the corresponding simulations that did not account for radiative losses. An average difference in peak temperature of about 50 K was observed between the cases without radiative loss and those with radiative loss during the flame acceleration phase.
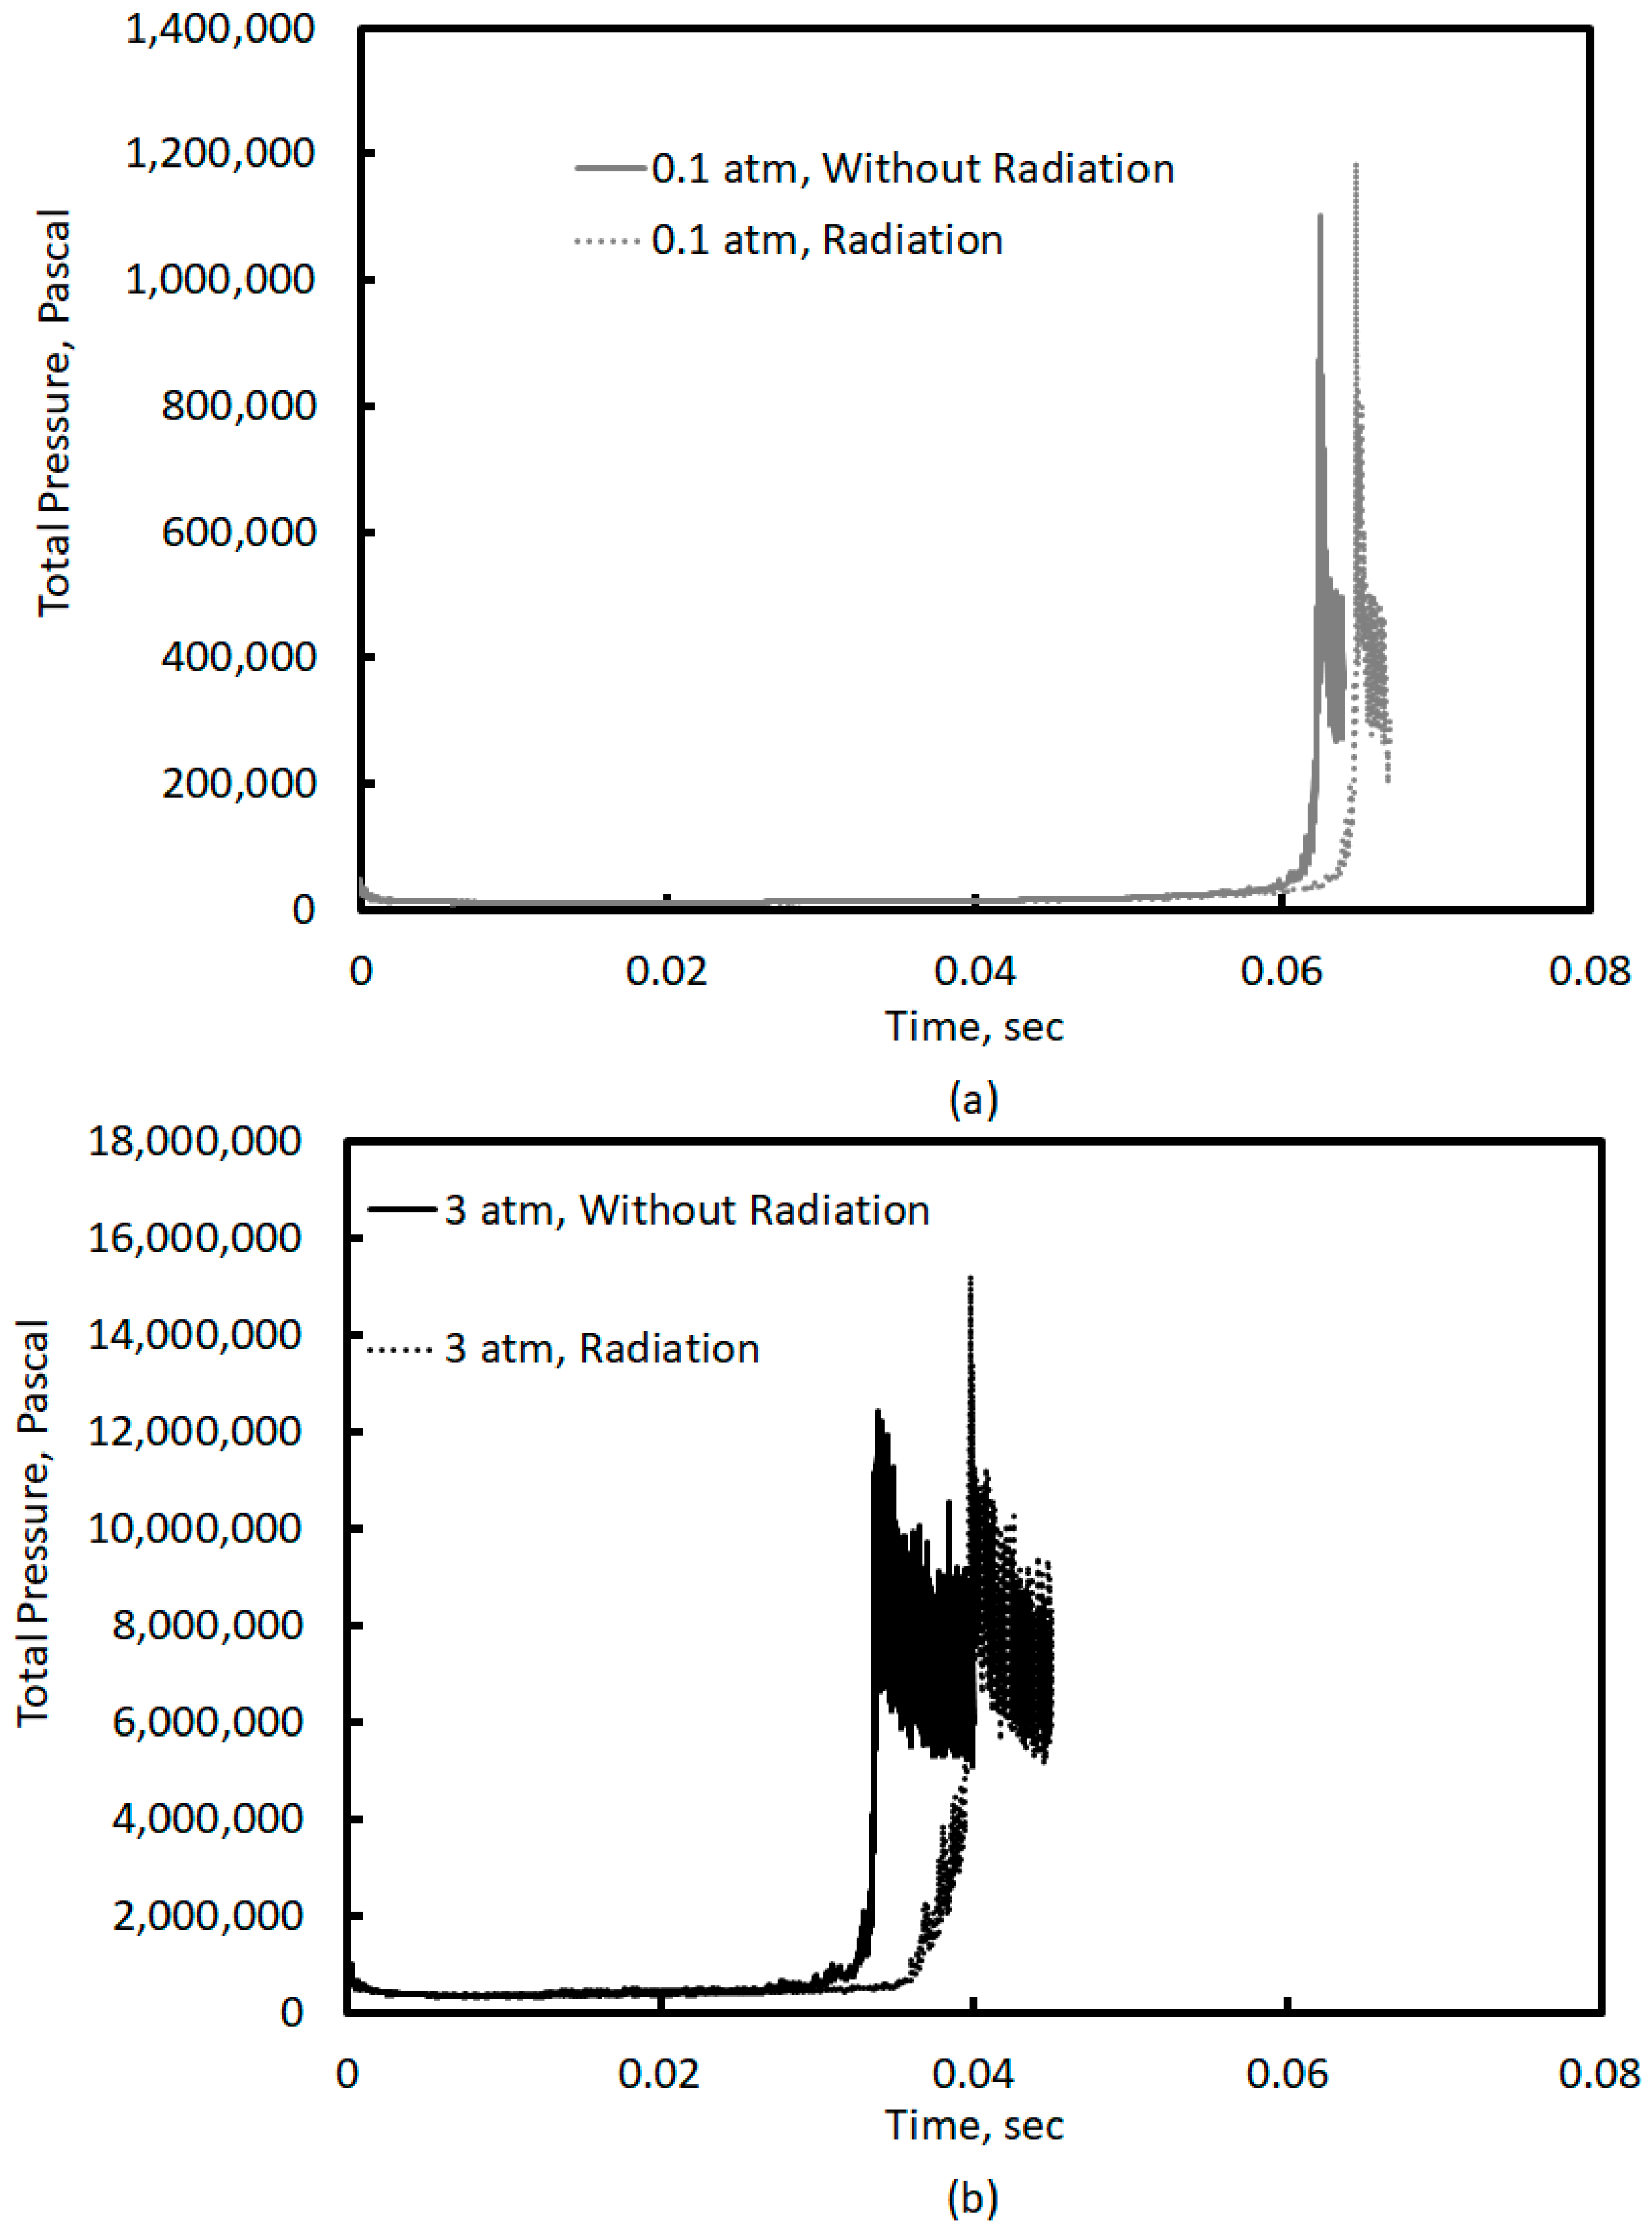
Figure 7 shows the maximum pressure variation with time predicted by the simulations in this study. By studying the detonation characteristics of hydrogen–oxygen mixtures at high initial pressures, Gealer and Churchill [
25] determined the ratio of detonation pressure to the initial pressure to be invariant with the initial system pressure. This has been further validated by the data provided in Shultz and Shepard [
26]. The ratio of detonation pressure to the initial pressure during the quasi-detonation phase was determined to be between 22 and 24 for both system pressures. Further, these pressure ratios are in reasonable agreement with those of Kuznetsov et al. [
18], who measured pressure ratios ranging between 10 and 23.6 during the detonation phase for a 17% H
2-Air mixture at a BR of 0.3.
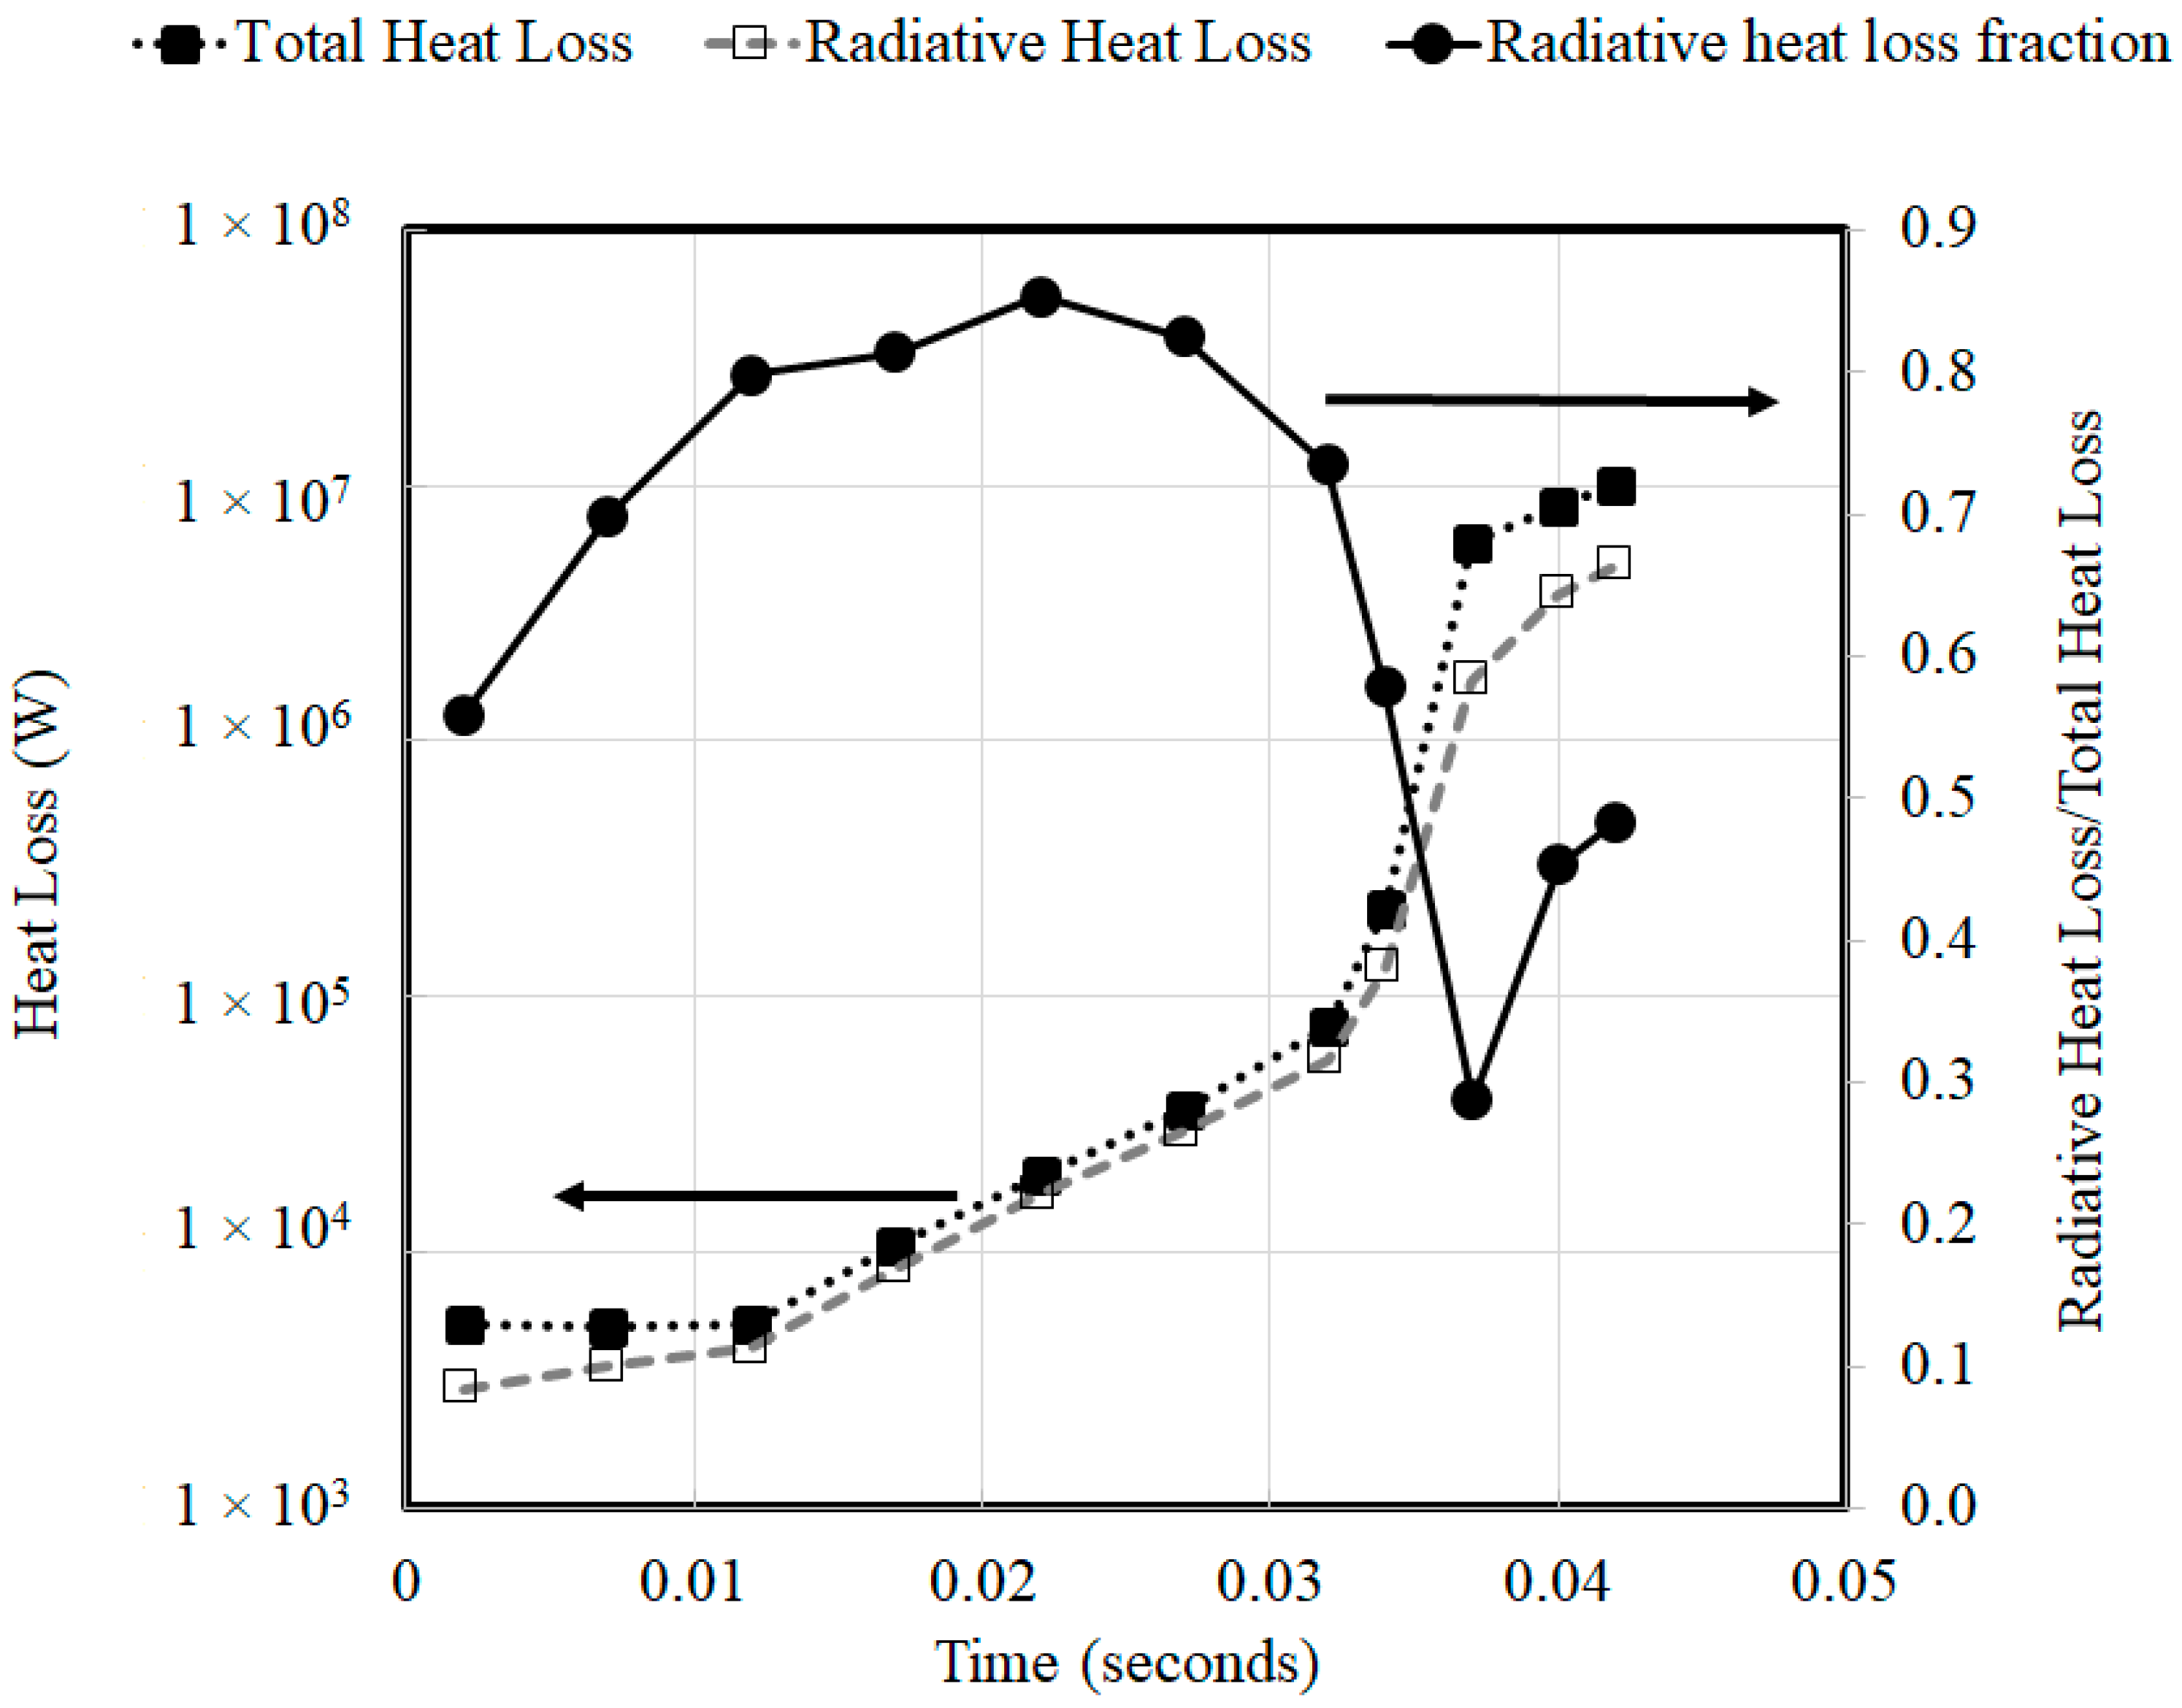
In order to assess the relative magnitudes of convective and radiative heat losses when the walls are not insulated, the simulations with radiative losses at a system pressure of 3 atm were repeated by employing isothermal wall boundary conditions at 300 K.
Figure 8 compares the relative magnitudes of the radiative heat losses to the total heat losses to the walls when employing isothermal wall boundary conditions (300 K) at a system pressure of 3 atm. The magnitude of wall heat loss increases as the combustion wave travels through the domain. During the flame acceleration stage that was associated with an increase in temperature, the fractional contribution of radiative losses to the total heat losses increased steadily from 0.5 to 0.85. However, with detonation onset that was associated with a sudden increase in velocities, the convective heat transfer rates increased, resulting in a corresponding drop in radiative heat loss fraction before the radiative heat loss fraction stabilized to 50% of the total heat loss when the wave reached the end of the tube.
4. Conclusions
The impact of radiative heat transfer on the propagation mechanisms involving a combustion wave are investigated in this study in a macro-channel with obstacles. The magnitude of radiative losses is often over-looked in the literature due to it’s anticipated insignificance based on scaling analysis (i.e., opacity of the flame front, small surface area-to-volume ratios) along with the additional computational overhead associated with resolving it’s spatial, temporal, directional and wavelength dependencies. By implementing Planck mean absorption coefficients as an add on function to a CFD code, and employing it in conjunction with the P-1 radiation model, simulations of lean (equivalence ratio: 0.5) hydrogen-air mixtures in a long (11.878 m), macro-channel (hydraulic diameter: 17.4 mm) with obstacles (Blockage ratio: 0.51) are carried out at system pressures of 0.1 atm and 3 atm. The simulations also employed a 21-step detailed chemical kinetic mechanism, estimated individual species transport properties based on kinetic theory and calculated the density using the Soave Redlich Kwong equation of state in a Large Eddy Simulation framework. In addition, the momentum, energy and specie conservation equations were solved concurrently at each time-step to enable strong coupling between the flow variables. The initialization of the detonation kernel was based on a constant volume combustion calculation. Based on the results of this study, the following conclusions can be drawn:
The conditions in the channel promoted flame acceleration and DDT, causing large pressures and temperatures in the vicinity of the combustion wave. Consequently, this increased the magnitude of radiative losses and affected the run-up distances to DDT. Flame acceleration and DDT were delayed in the simulations when radiative losses were accounted for in comparison to those in which the radiative transport equation was not solved.
As anticipated, at higher system pressures the run-up distances to DDT decreased while the impact of radiative losses on flame acceleration, DDT and the run-up distances only increased. This is because a 30-fold variation in the system pressure (0.1 atm to 3 atm) resulted in a corresponding 30-fold increase in the Planck mean absorption coefficients.
The product of the absorption coefficient and the path-length across the combustion wave (kL << 1) in all of the investigated scenarios indicated that an optically thin approximation (that accounts for radiative heat losses through an “emission only” source term in the energy equation) might be deemed to be adequate to account for the effects of radiative transfer.
The relative magnitudes of radiative heat losses to the total heat losses to the walls were also assessed in a scenario involving isothermal walls. During the flame acceleration stage that was associated with an increase in temperature, the fractional contribution of radiative losses to the total heat losses increased steadily from 0.5 to 0.85. However, with detonation onset that was associated with a sudden increase in velocities, the convective heat transfer rates increased, resulting in a corresponding drop in radiative heat loss fraction.
In conclusion, this study highlights the importance of accounting for radiative heat losses for explosive hazard assessments as well as during the evaluation of pulse detonation engine designs.
