3.2. Characterization of the Single Bubble
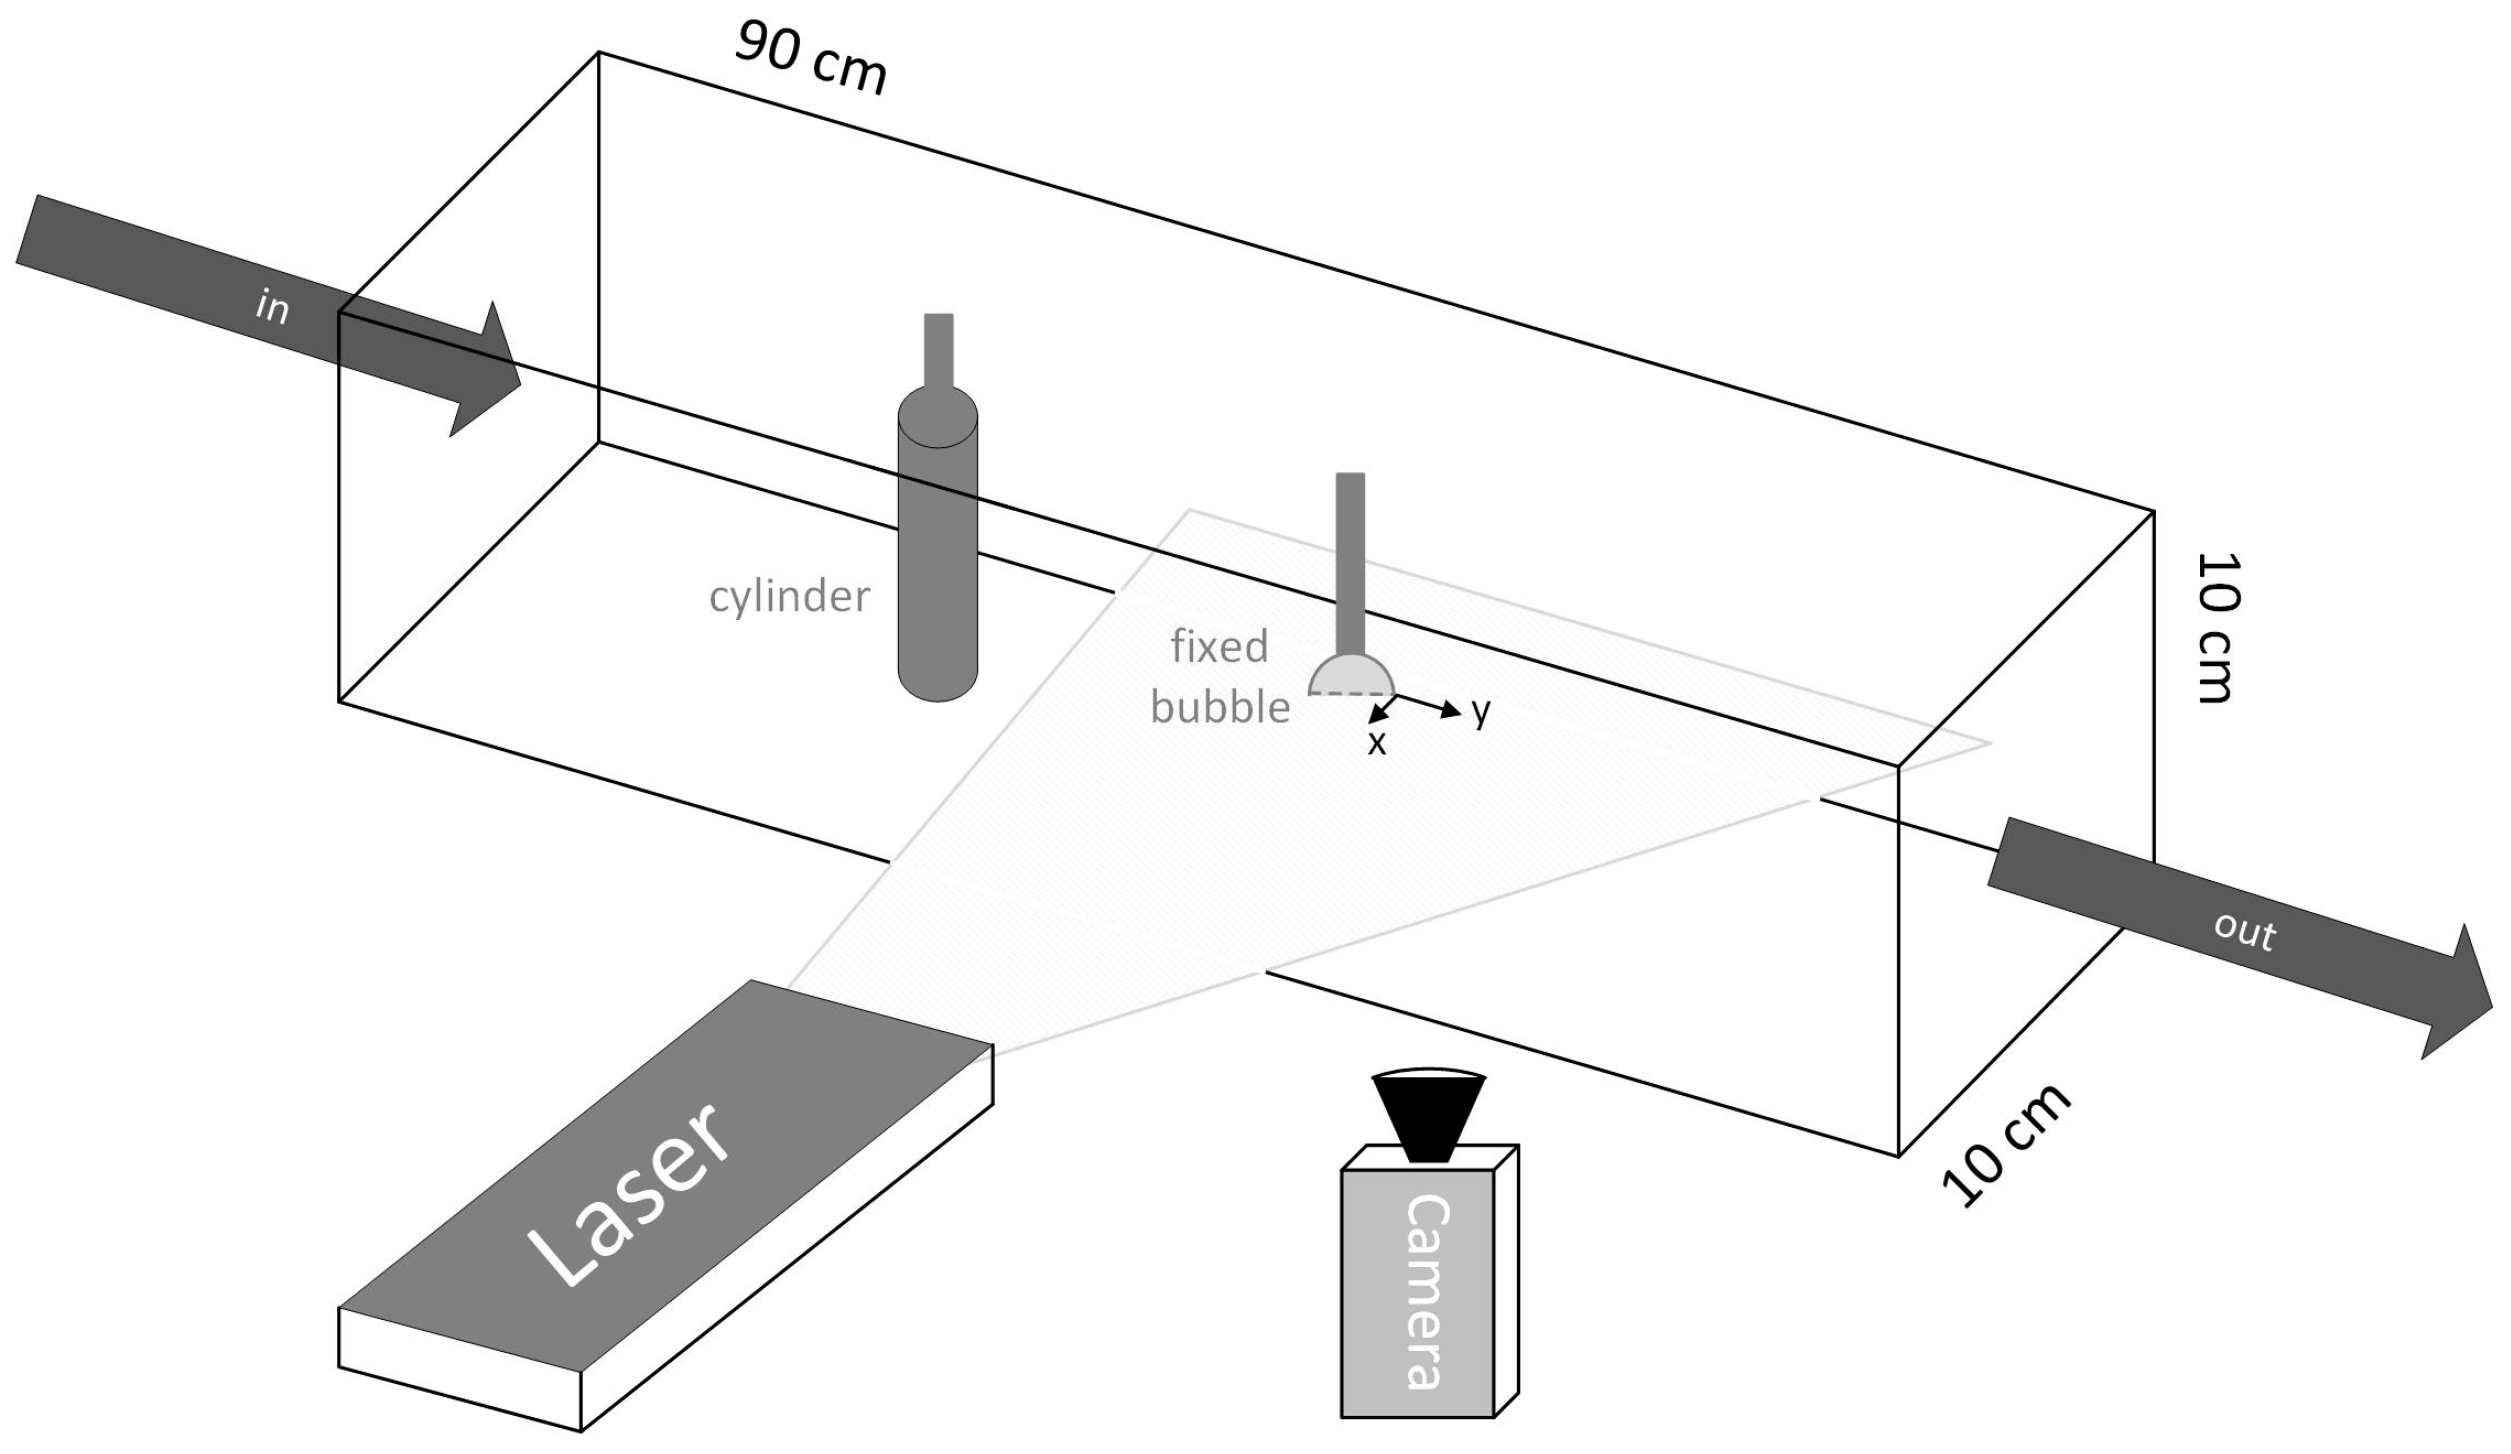
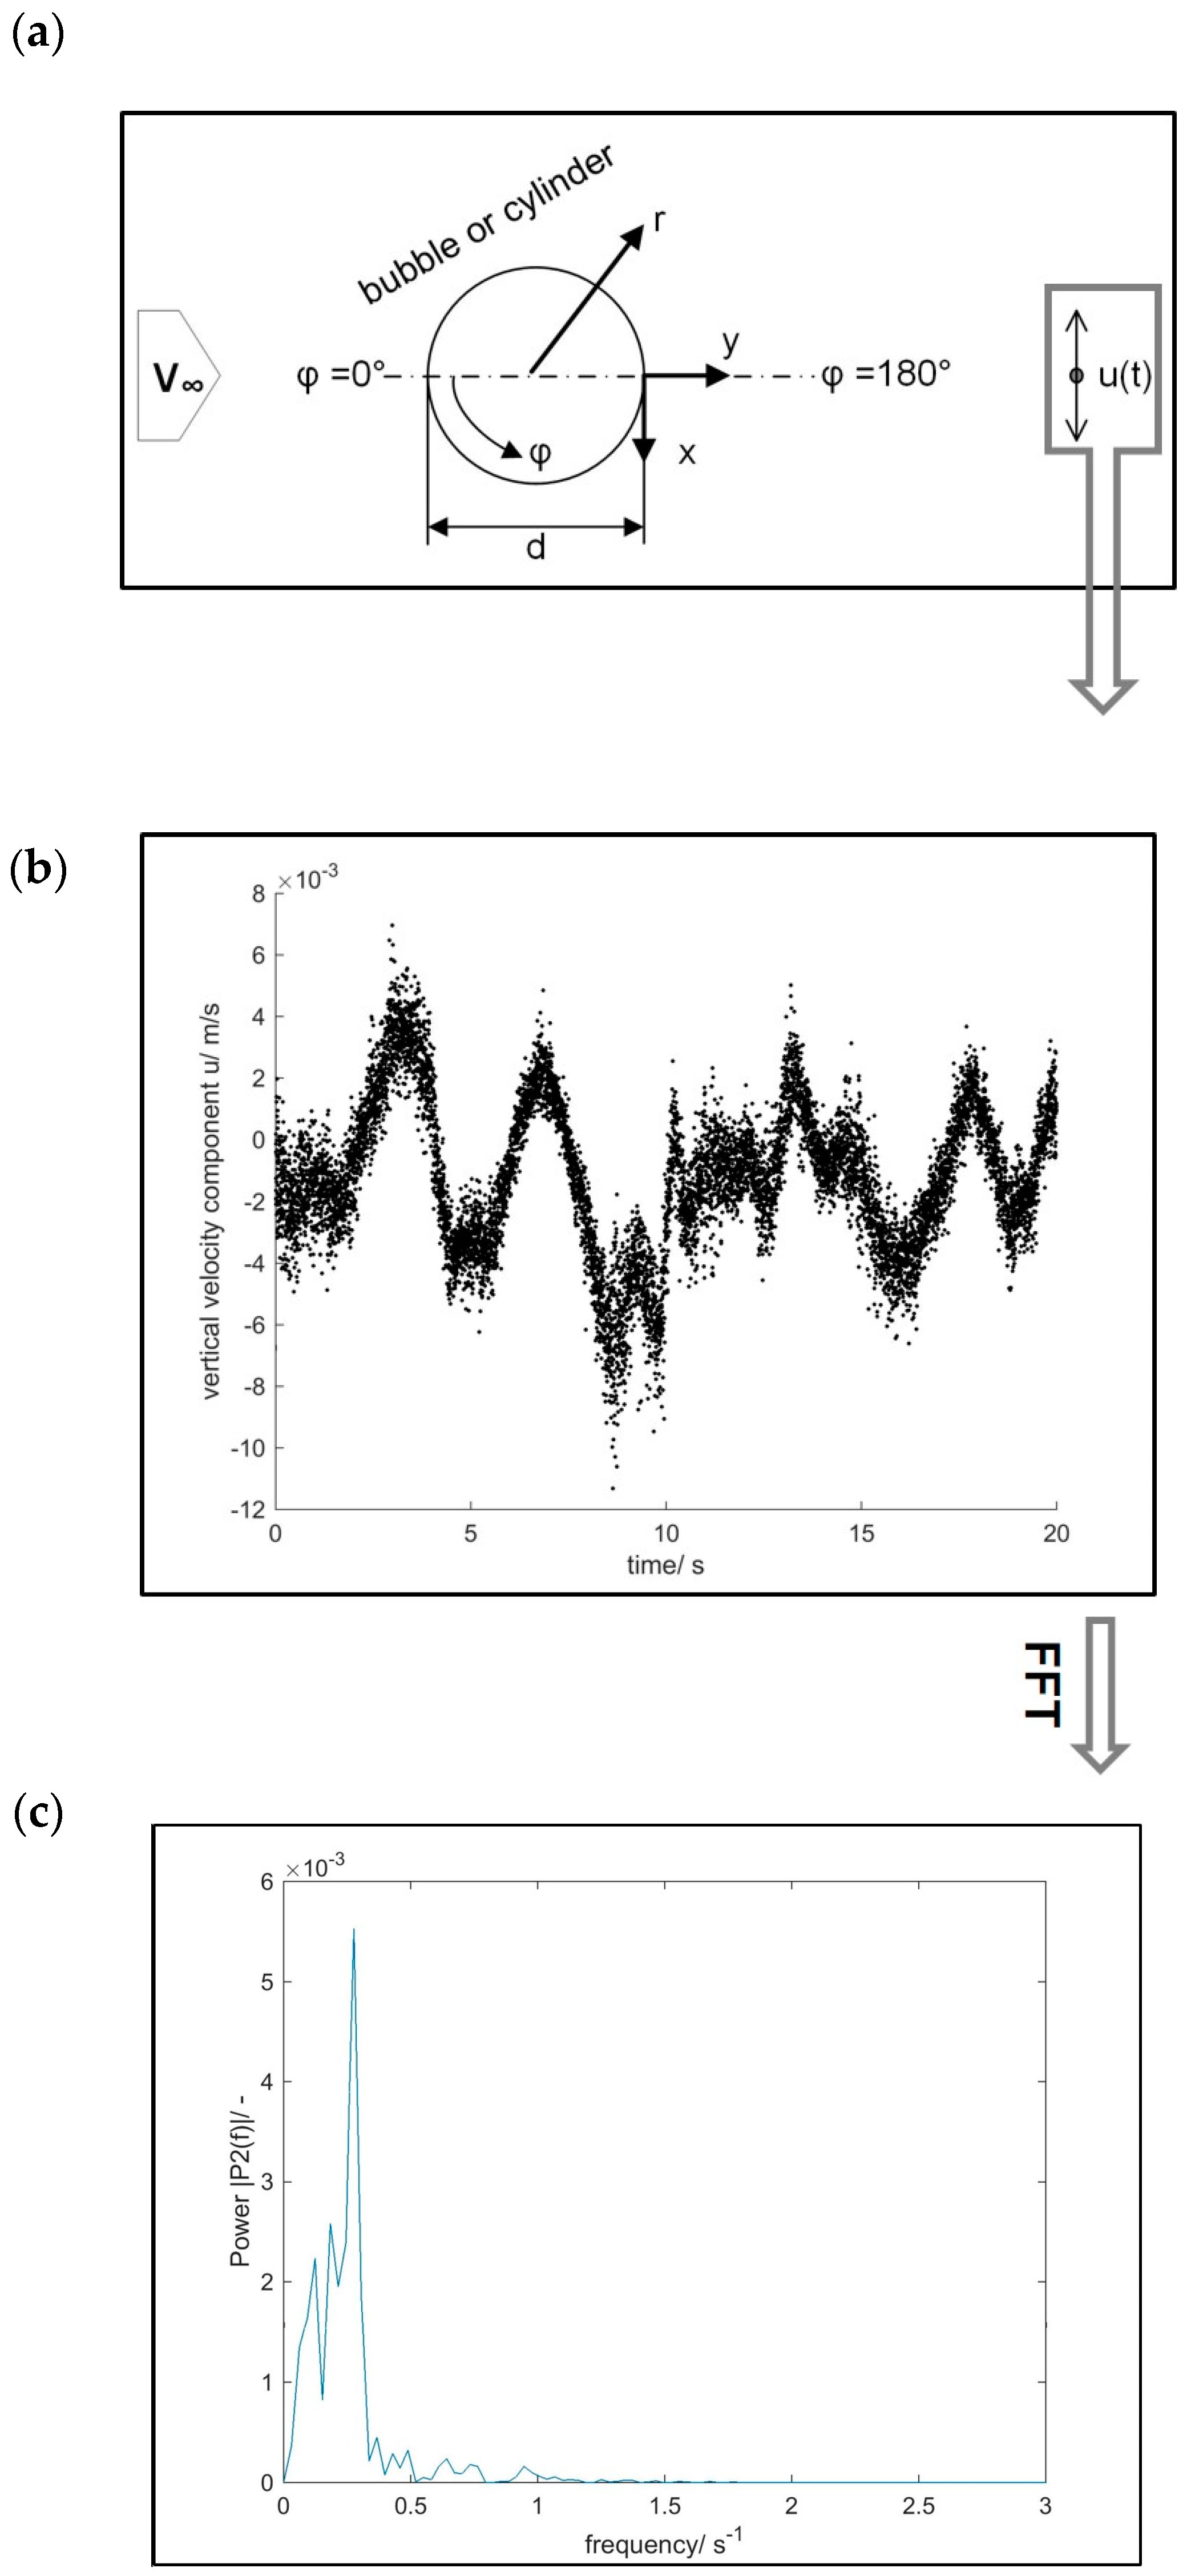
In the following, the fluid flow around the single bubble (no cylinder) is characterized. This is done by a frequency analysis and by the analysis of the streamwise velocity component . Since only the equatorial plane of the bubble is illuminated by the laser light sheet (2D experiments), the velocity is evaluated for three azimuthal angles . By monitoring several Reynolds numbers, an overview of the flow structure depending on the relative velocity between the bubble and the liquid is obtained.
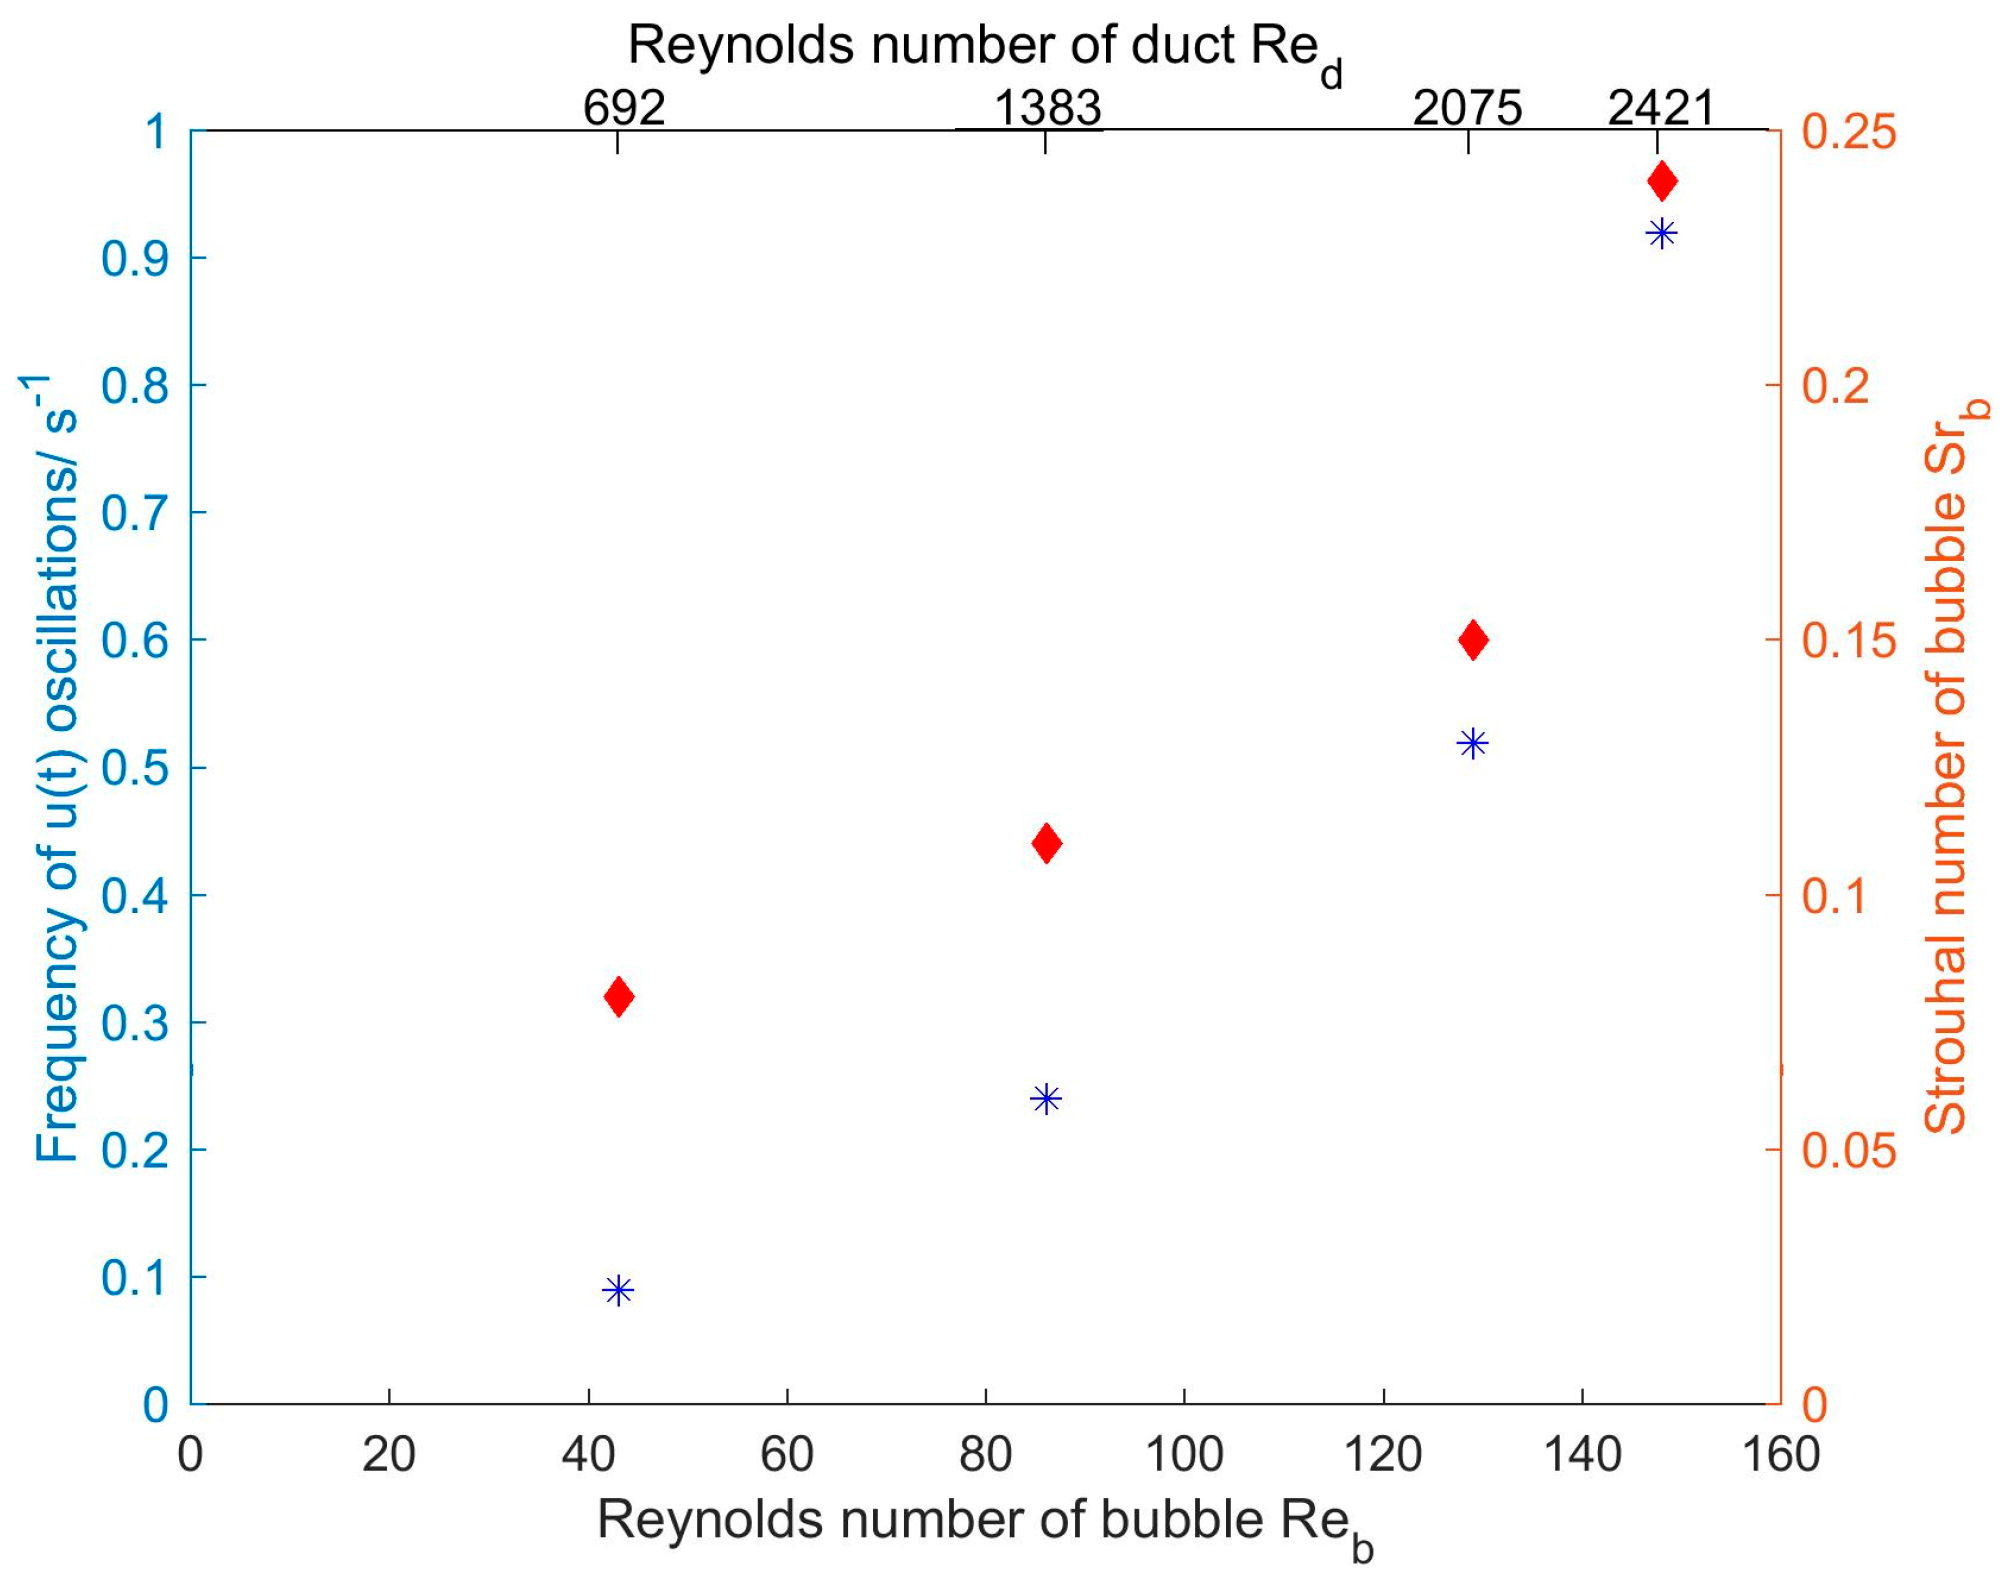
A dependency of the frequencies behind the bubble on the Reynolds number is clearly visible in
Figure 5. There, the Strouhal number of the single bubbles (right red
y axis) and the frequency of velocity fluctuations (left blue
y axis) is plotted against the Reynolds number of the bubble. For the flow regime investigated in this work, no asymptotic value for the Strouhal number is achieved. For the Reynolds numbers in this regime, Strouhal numbers between 0.1 and 0.18 are expected, similar to the cylinder Strouhal number. This can be estimated from the first equation given in
Section 1. While the Strouhal numbers for the lower three Reynolds numbers are slightly below the values estimated from the equation, the Strouhal number for
Re = 148 is higher. The differences of the values that are presented in
Figure 5 may arise due to the fluidic interface; they can also be caused by three-dimensional effects. In
Section 1, critical points for the cylinder wake are mentioned. For the bubble, the three-dimensional effects are different from the ones of the cylinder wake. For spheres, a large amount of information is available from the literature [
27]. In contrast to flow past cylinders, the wake structure behind spheres looks different and stays planar up to
Re = 350. However, there is still a lack of information regarding the flow past spheres with the fluidic interface, as is the case for a bubble in three-dimensional flow. For this reason, a clear statement concerning three-dimensional effects in the bubble wake cannot be made, and further research is needed. Furthermore, it is also likely that the differences arise due to experimental limits. For example, there is only a given amount of frequencies that can be calculated during the FFT. When the flow is non-linear and the data are noisy, higher order dynamic mode decomposition can be used to calculate dominant frequencies [
28]. However, with the given temporal resolution (see
Table 1), the data basis in this study is considered to be large enough. It is worth noting that the Reynolds numbers in this work are in a low-to-medium regime. For bubbles, there are only Strouhal number correlations for much higher Reynolds numbers [
2,
29]. The duct Reynolds numbers are added to an upper
x axis. The fact that the data points at the highest Reynolds number are already in a transitional regime (
) can be an explanation for the remarkably higher Strouhal number.
To characterize the flow field in the vicinity of the bubble, the mean velocity
in the direction of flow is used. The non-dimensional velocities
of the single bubble depend strongly on the azimuthal angle
and scale with the Reynolds number of the bubble. In
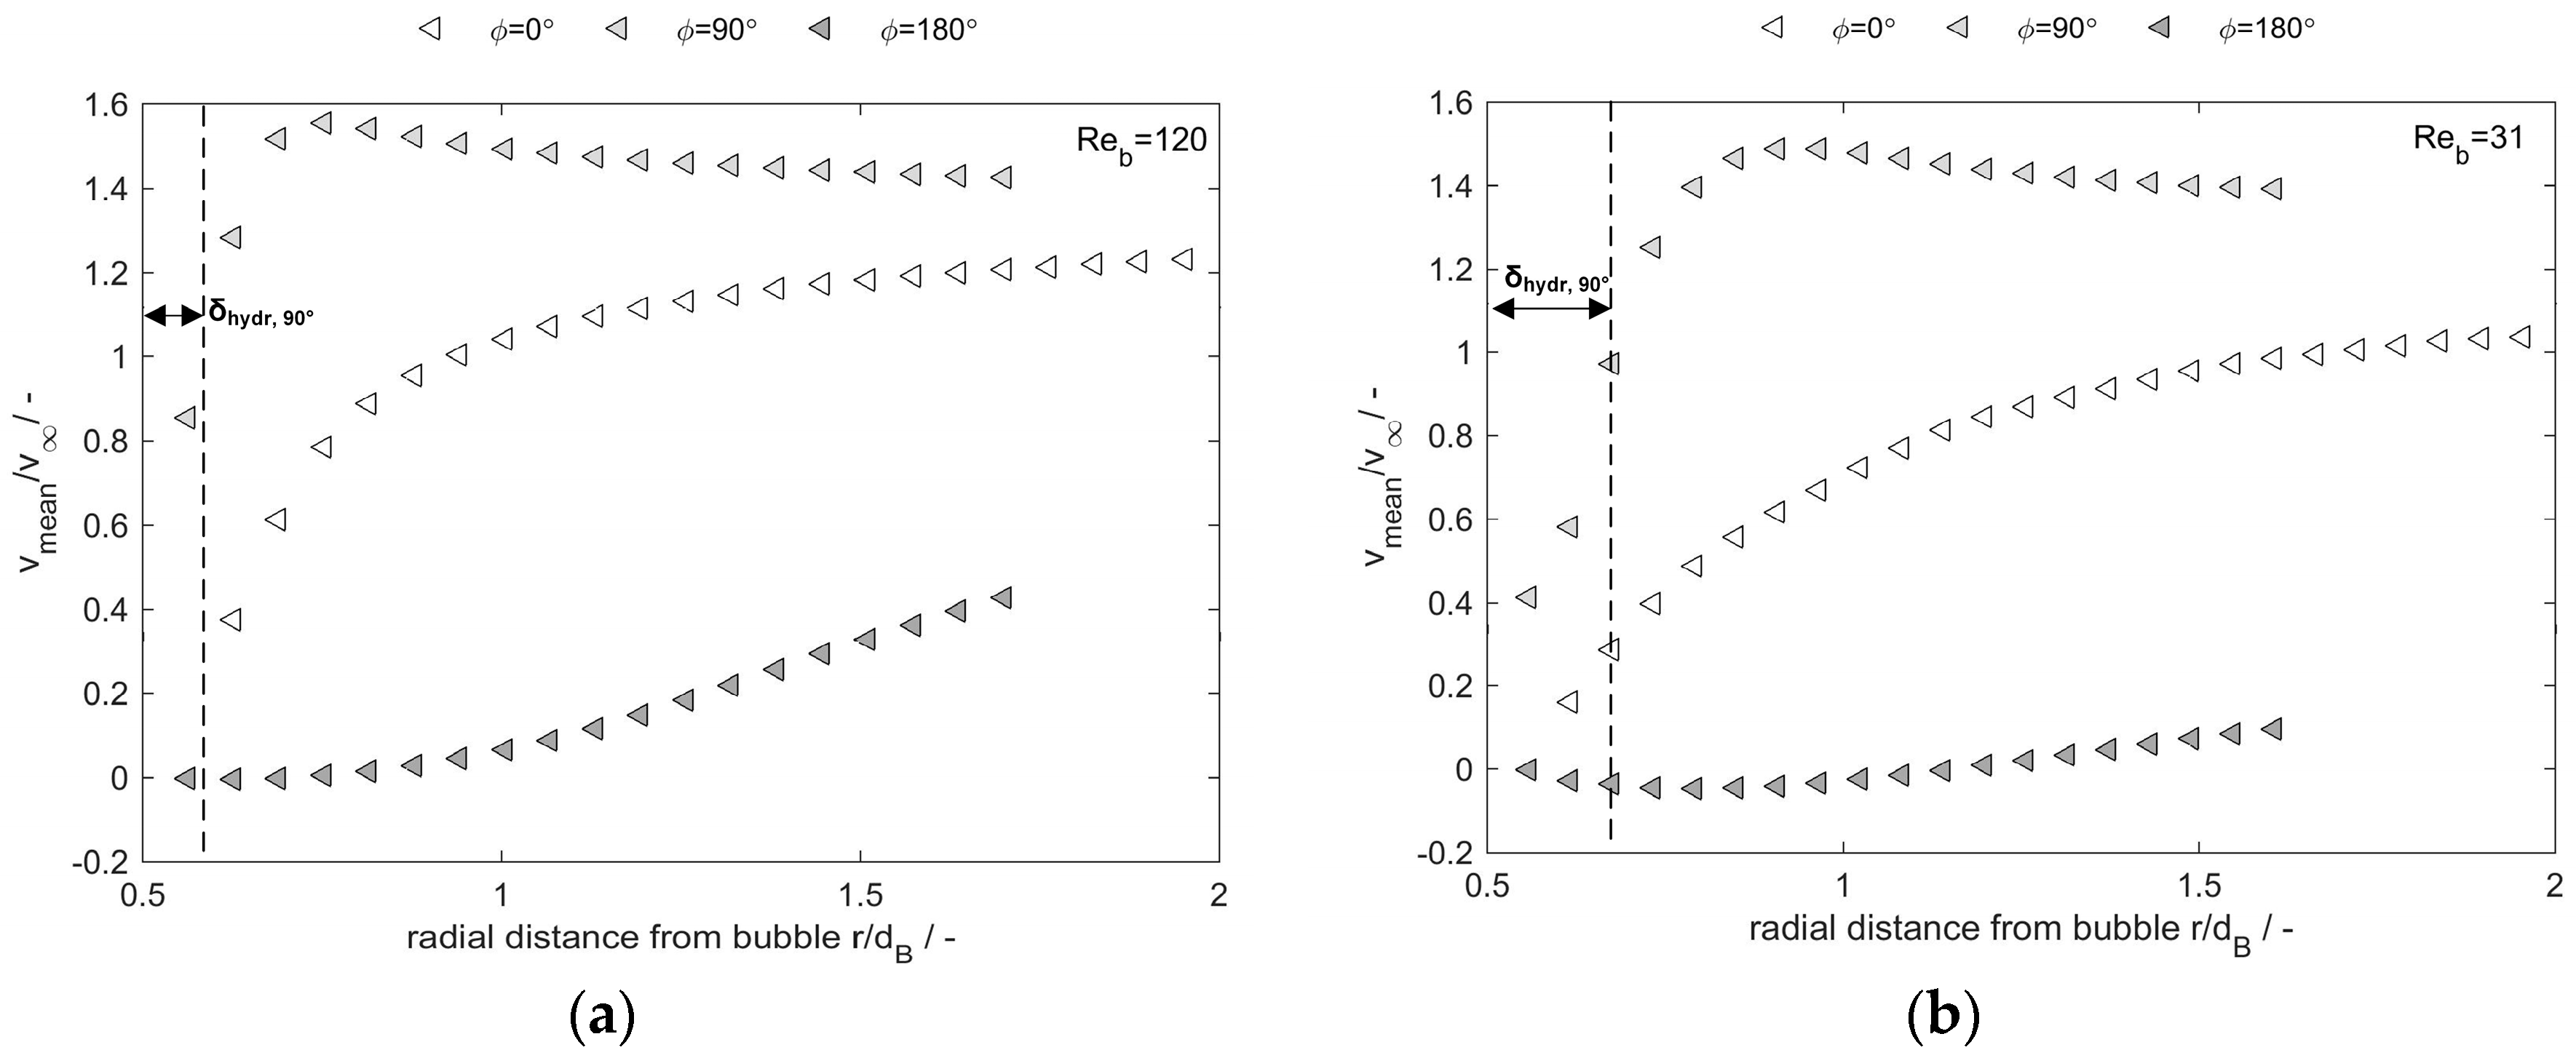
Figure 6, velocities of the bubble are plotted for two different Reynolds numbers. They are plotted over the distance from the bubble center. Utilizing
and
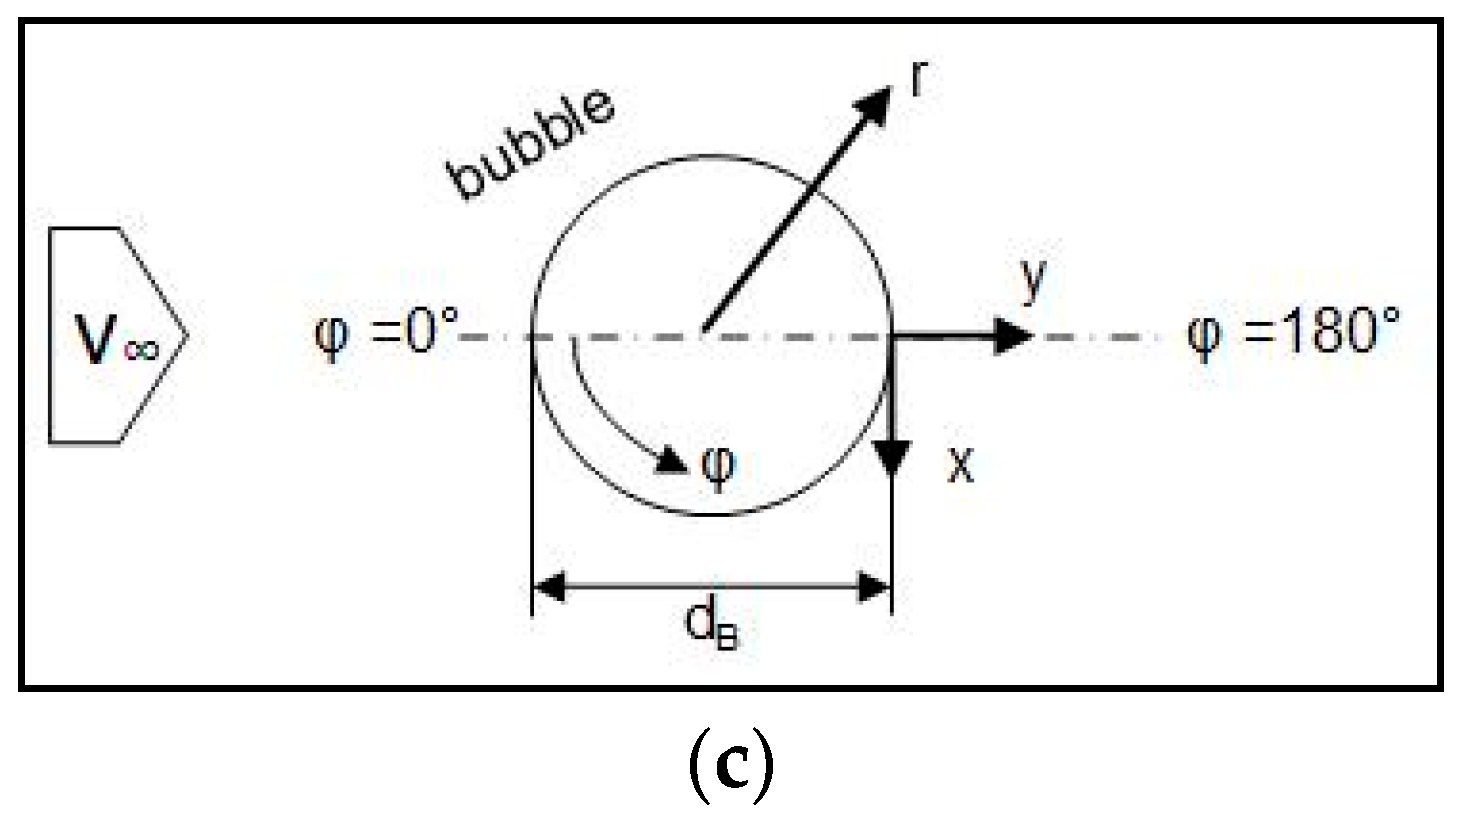
, the axes are made non-dimensional. The horizontal axis starts with 0.5, since PIV only yields information regarding the flow of the continuous phase outside the bubble. For detailed information on the coordinate system, a schematic overview is added to
Figure 6. Data points are shown for three azimuthal angles of 0°, 90° and 180°.
At the angle (empty icons), the velocity decreases with decreasing distance from the bubble until the stagnation point is nearly reached. Further away from the bubble, at , it is well visible that is nearly equal to one. This means that the velocity calculated from the continuity equation dominates there. At the very surface of the bubble, no velocity field information is available since a mask has to be used to cover the bubble during PIV data processing.
At
(light-colored icons), the fluid is accelerated near the bubble and then approaches to a profile which is the undisturbed flow profile in the duct. Due to the position of the bubble in the center of the duct, the undisturbed flow profile does not equal one. In the literature, there is a theoretical curve given by Oellrich et al. [
29] (semi-analytical solution for a single bubble of constant spherical shape). This curve goes at
90 straight to
. The reason why the experimental results from this study differ slightly from [
29] is that there is a flow profile approaching the bubble and not one single velocity
. Close to the interface, the experimental data from
Figure 6 decrease significantly. This leads to the assumption that the single bubble in the experiments has only a little inner circulation. This can be a result of the bubble fixation.
Behind the bubble, which is
= 180° (dark-colored icons), the tangential velocity is very low and also can be slightly negative due to back flow (
Figure 6b). Here, the fluid is decelerated due to the bubble. However, there is no back flow for the higher Reynolds number (
Figure 6a). The wake at
Re = 31 is very steady, and vortex shedding is very low or does not occur at all. According to Komasawa et al. [
30],
Re = 31 lies in the regime of a laminar wake, while
Re = 120 lies in the regime of a transitional wake. When comparing the findings of Komasawa et al. [
30] to the findings of this work, it has to be kept in mind that this study deals with fixed bubbles. Due to the fixation, the relative velocity between bubble and liquid is determined by the duct flow. The shape of the bubble is spherical due to the fixation cap, although free rising bubbles with a comparable diameter may often be already of an ellipsoidal or cap shape. Clift et al. [
2] present cases of wake shapes for several Reynolds numbers. They describe a change from a convex to a concave shape at
Re = 35.
Finally, some considerations concerning the hydrodynamic boundary layer can be made by further analyzing the
= 90° curve. The hydrodynamic boundary layer is defined as the thickness that is needed until 99% of the velocity far away from the interface is reached. This is highlighted in
Figure 6a,b for the location
= 90°. It is well visible that this boundary layer is thicker for the lower Reynolds number and thinner for the higher one. This meets the expectations. There is a rule of thumb to estimate the boundary layer thickness of spheres [
31]:
Utilizing this equation leads to theoretical values of mm for the lower Reynolds number and mm for the higher Reynolds number. The values match the experimental results well.
3.3. Characterization of the Single Bubble Wake Influenced by the Vortex Street
The observation of velocity fluctuations is a helpful and widely-used tool to describe unsteady flow structures. By decomposing the velocity vector into a temporal mean (highlighted by a bar over the symbol or a mean in the lower index) and a fluctuating part (Reynolds decomposition), statements on the turbulence and unsteadiness of a fluid flow can be made. In the Reynolds number regime investigated in this work, the fluid flow around the bubble cannot be described as turbulent. Nevertheless, there are unsteady motions in the wake of the bubble, and therefore, it is reasonable to use root mean square (RMS) velocities. They are calculated by the following:
In this work,
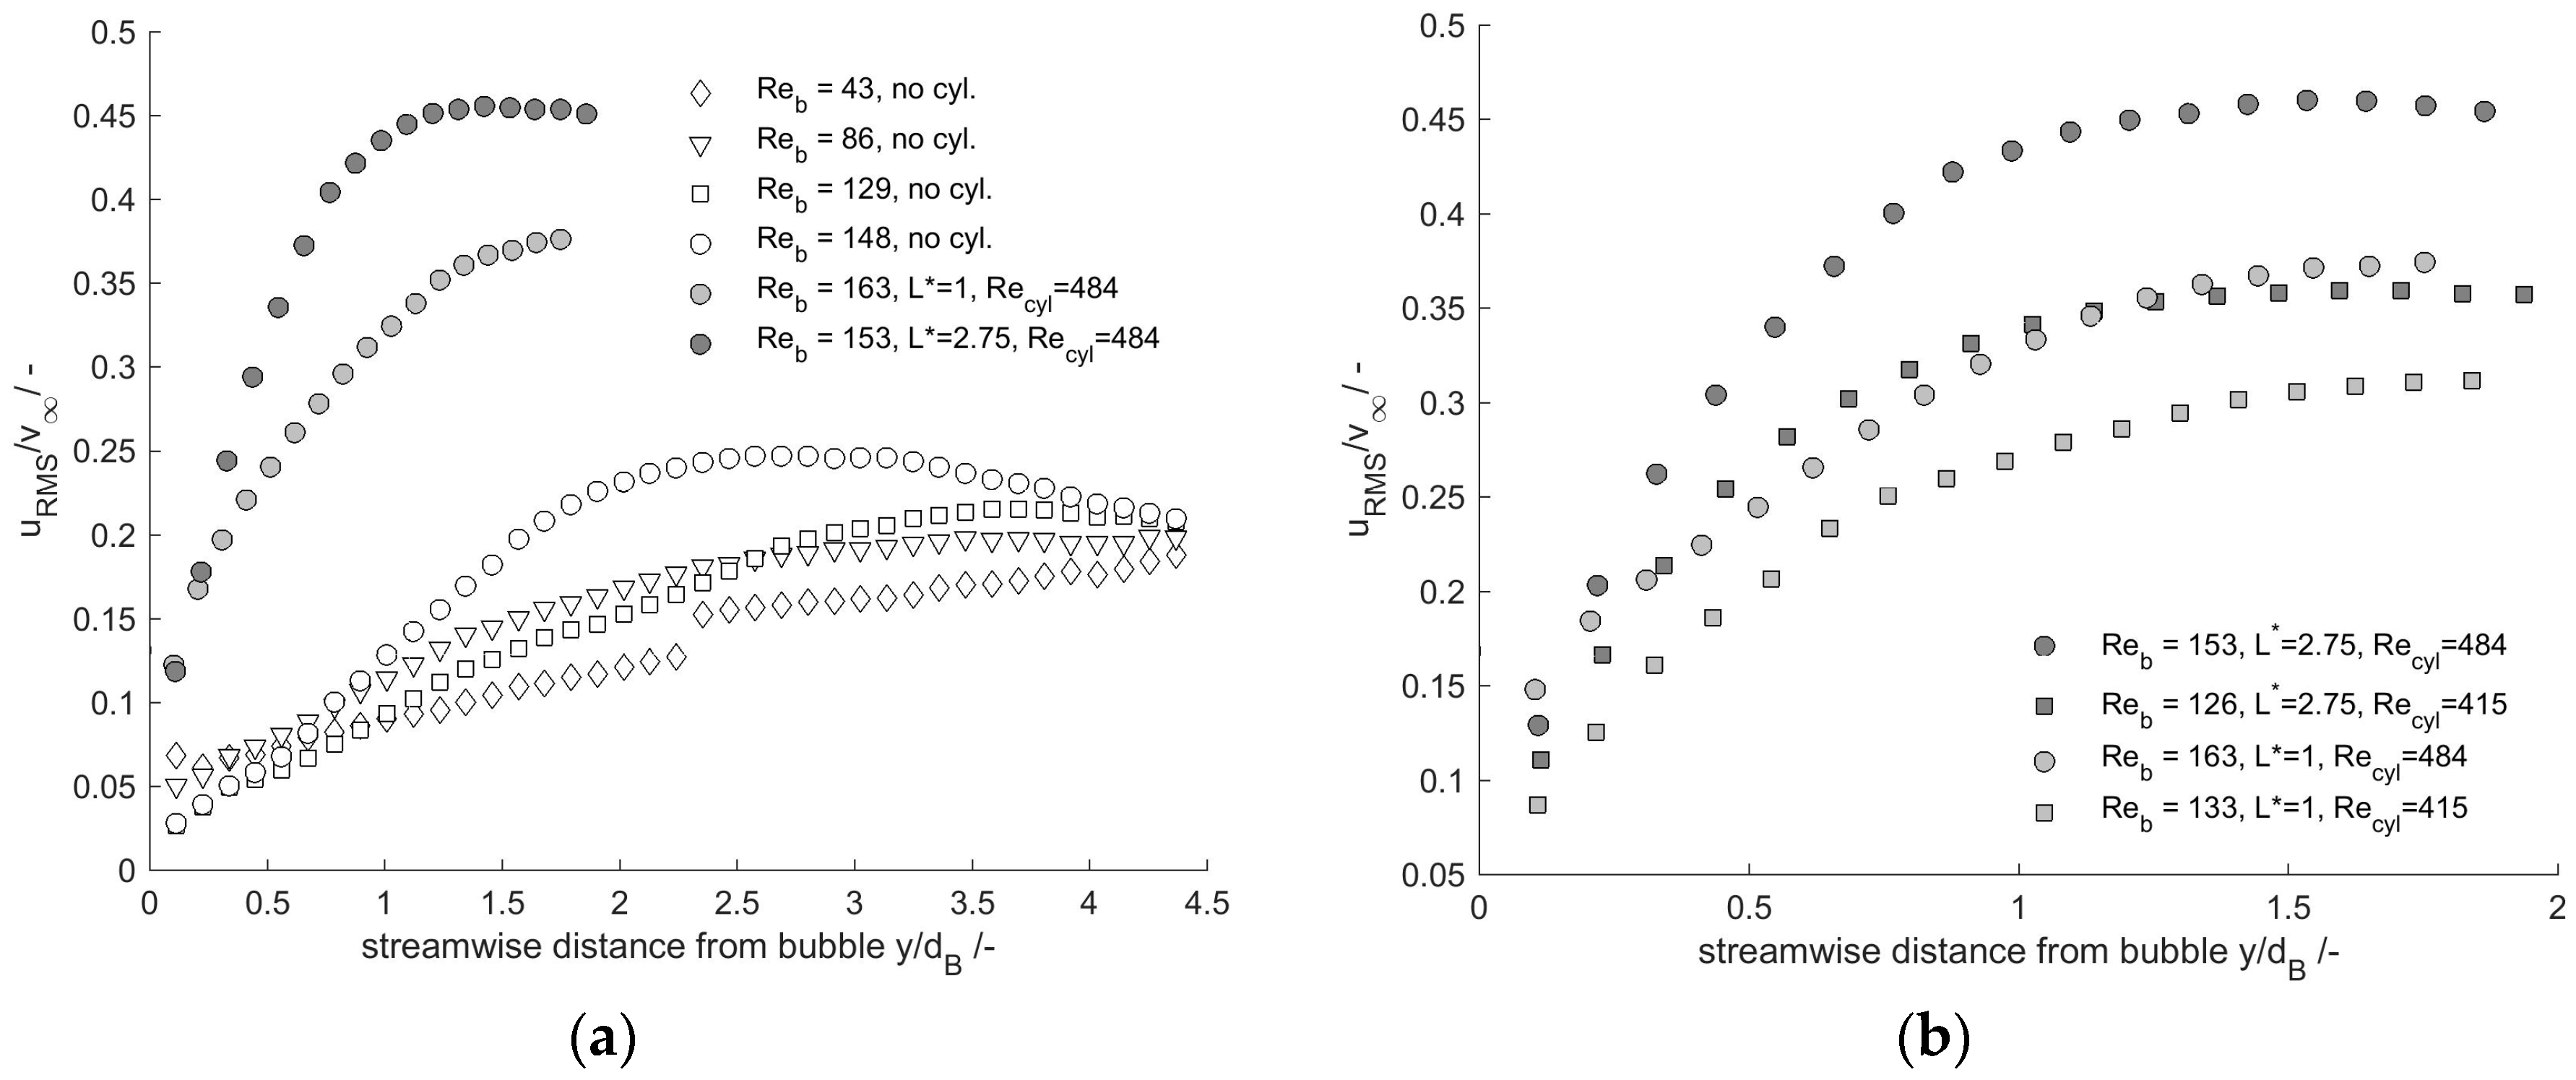
depicts the fluctuations perpendicular to the flow direction. This is shown in
Figure 7a,b along the y coordinates along a line downstream the bubble (see
Figure 4 or
Figure 6 for orientation). Utilizing
and
, the axes are made non-dimensional. Expectedly,
is dependent on the Reynolds number and increases with increasing distance from the bubble. It is expected to again decrease further downstream. The dependency on the Reynolds number is weak for the lower three Reynolds numbers. The profiles for
Re = 43,
Re = 86 and
Re = 129 do not differ much; they even intersect. However, what is remarkable is that for similar Reynolds numbers of about
Re = 150 (circular symbols),
is influenced by the vortex street (filled icons). There are two different staggered configurations presented in
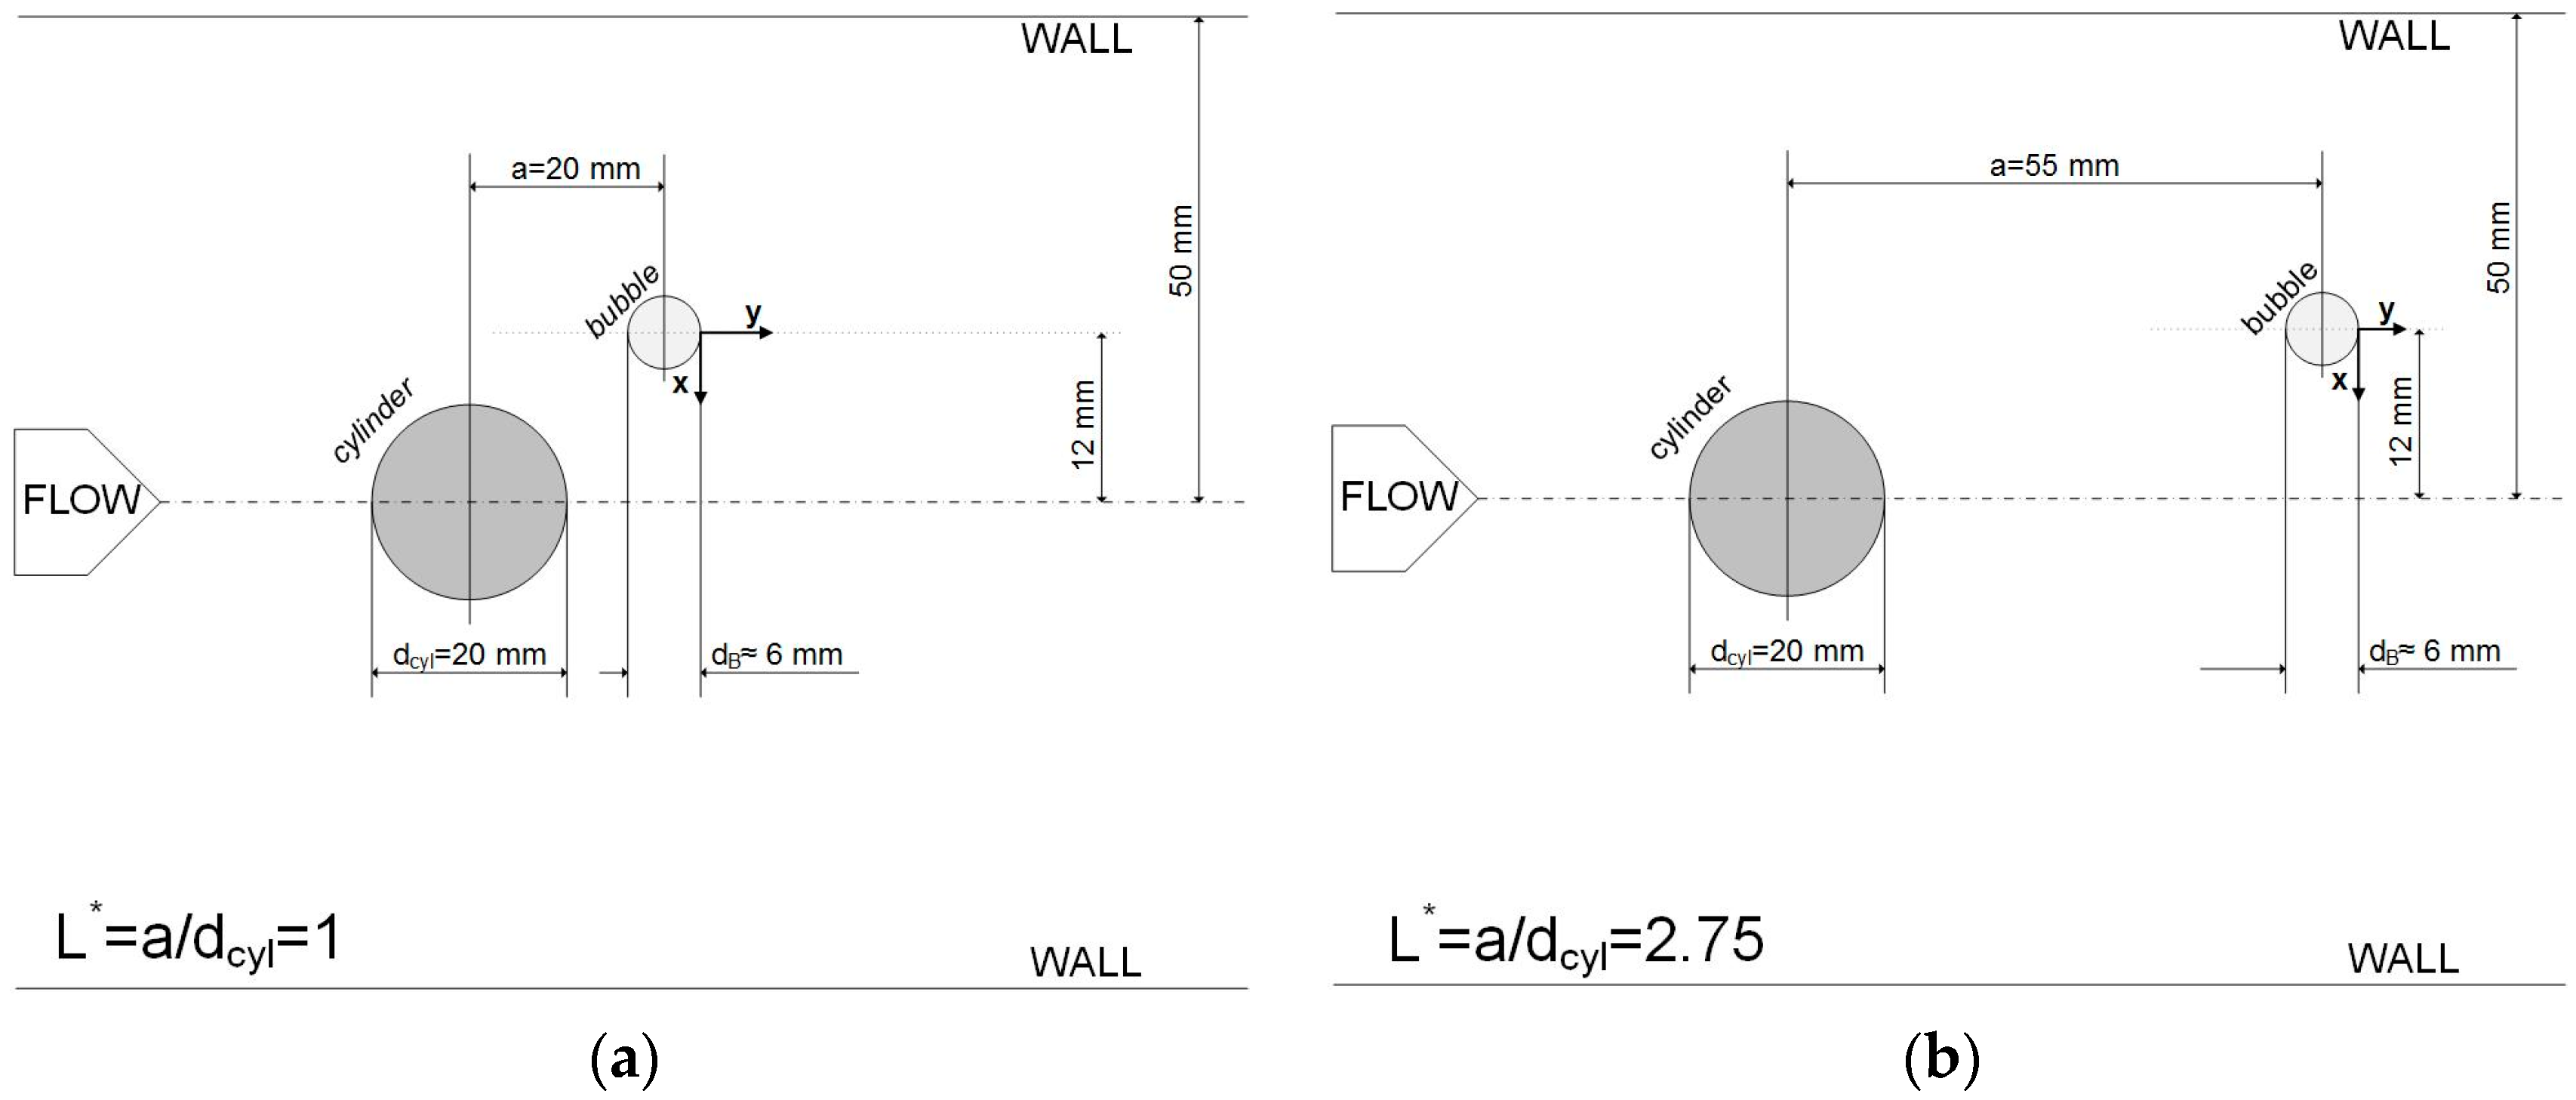
Figure 7: A cylinder with 2 cm in diameter, 5.5 cm from the bubble (
L* = 5.5 cm/2 cm = 2.75), and a cylinder with 2 cm in diameter, 2 cm from the bubble (
L* = 2 cm/2 cm = 1) (see
Figure 1). Both cylinders enhance the velocity fluctuations downstream the bubble and, thus, the cross-mixing within the bubble wake. The cylinder further away (
L* = 2.75) increases
to a higher extent (dark-colored icons) than the cylinder which is closer to the bubble (
L* = 1) (light-colored icons). To further discuss this point, the fluctuations for the two configurations are plotted for two different Reynolds numbers in
Figure 7b. There, it is visible that the type of configuration, i.e., the value of
L*, affects the fluctuations to a greater extent than the Reynolds number. The development of
is very similar for
Re = 126/
L* = 2.75 and
Re = 163/
L* = 1, even though the Reynolds numbers differ. The stronger influence of the
L* = 2.75 configuration of the
profile can be explained as follows. Due to the larger distance between the bubble and the cylinder, the vortex street is further developed for
L* = 2.75. With increasing distance from the cylinder, this momentum affects a larger area of the flow field (like in a free jet) and therefore leads to higher values for
and to a wake that remains for a longer distance because even the dissipation of energy in the larger area needs a longer time (respectively longer way) compared to the case for the
L* = 1 configuration. The vortices are detached from the cylinder over a longer distance and are accelerated by the surrounding fluid flow. This development leads to a higher momentum within the wake.
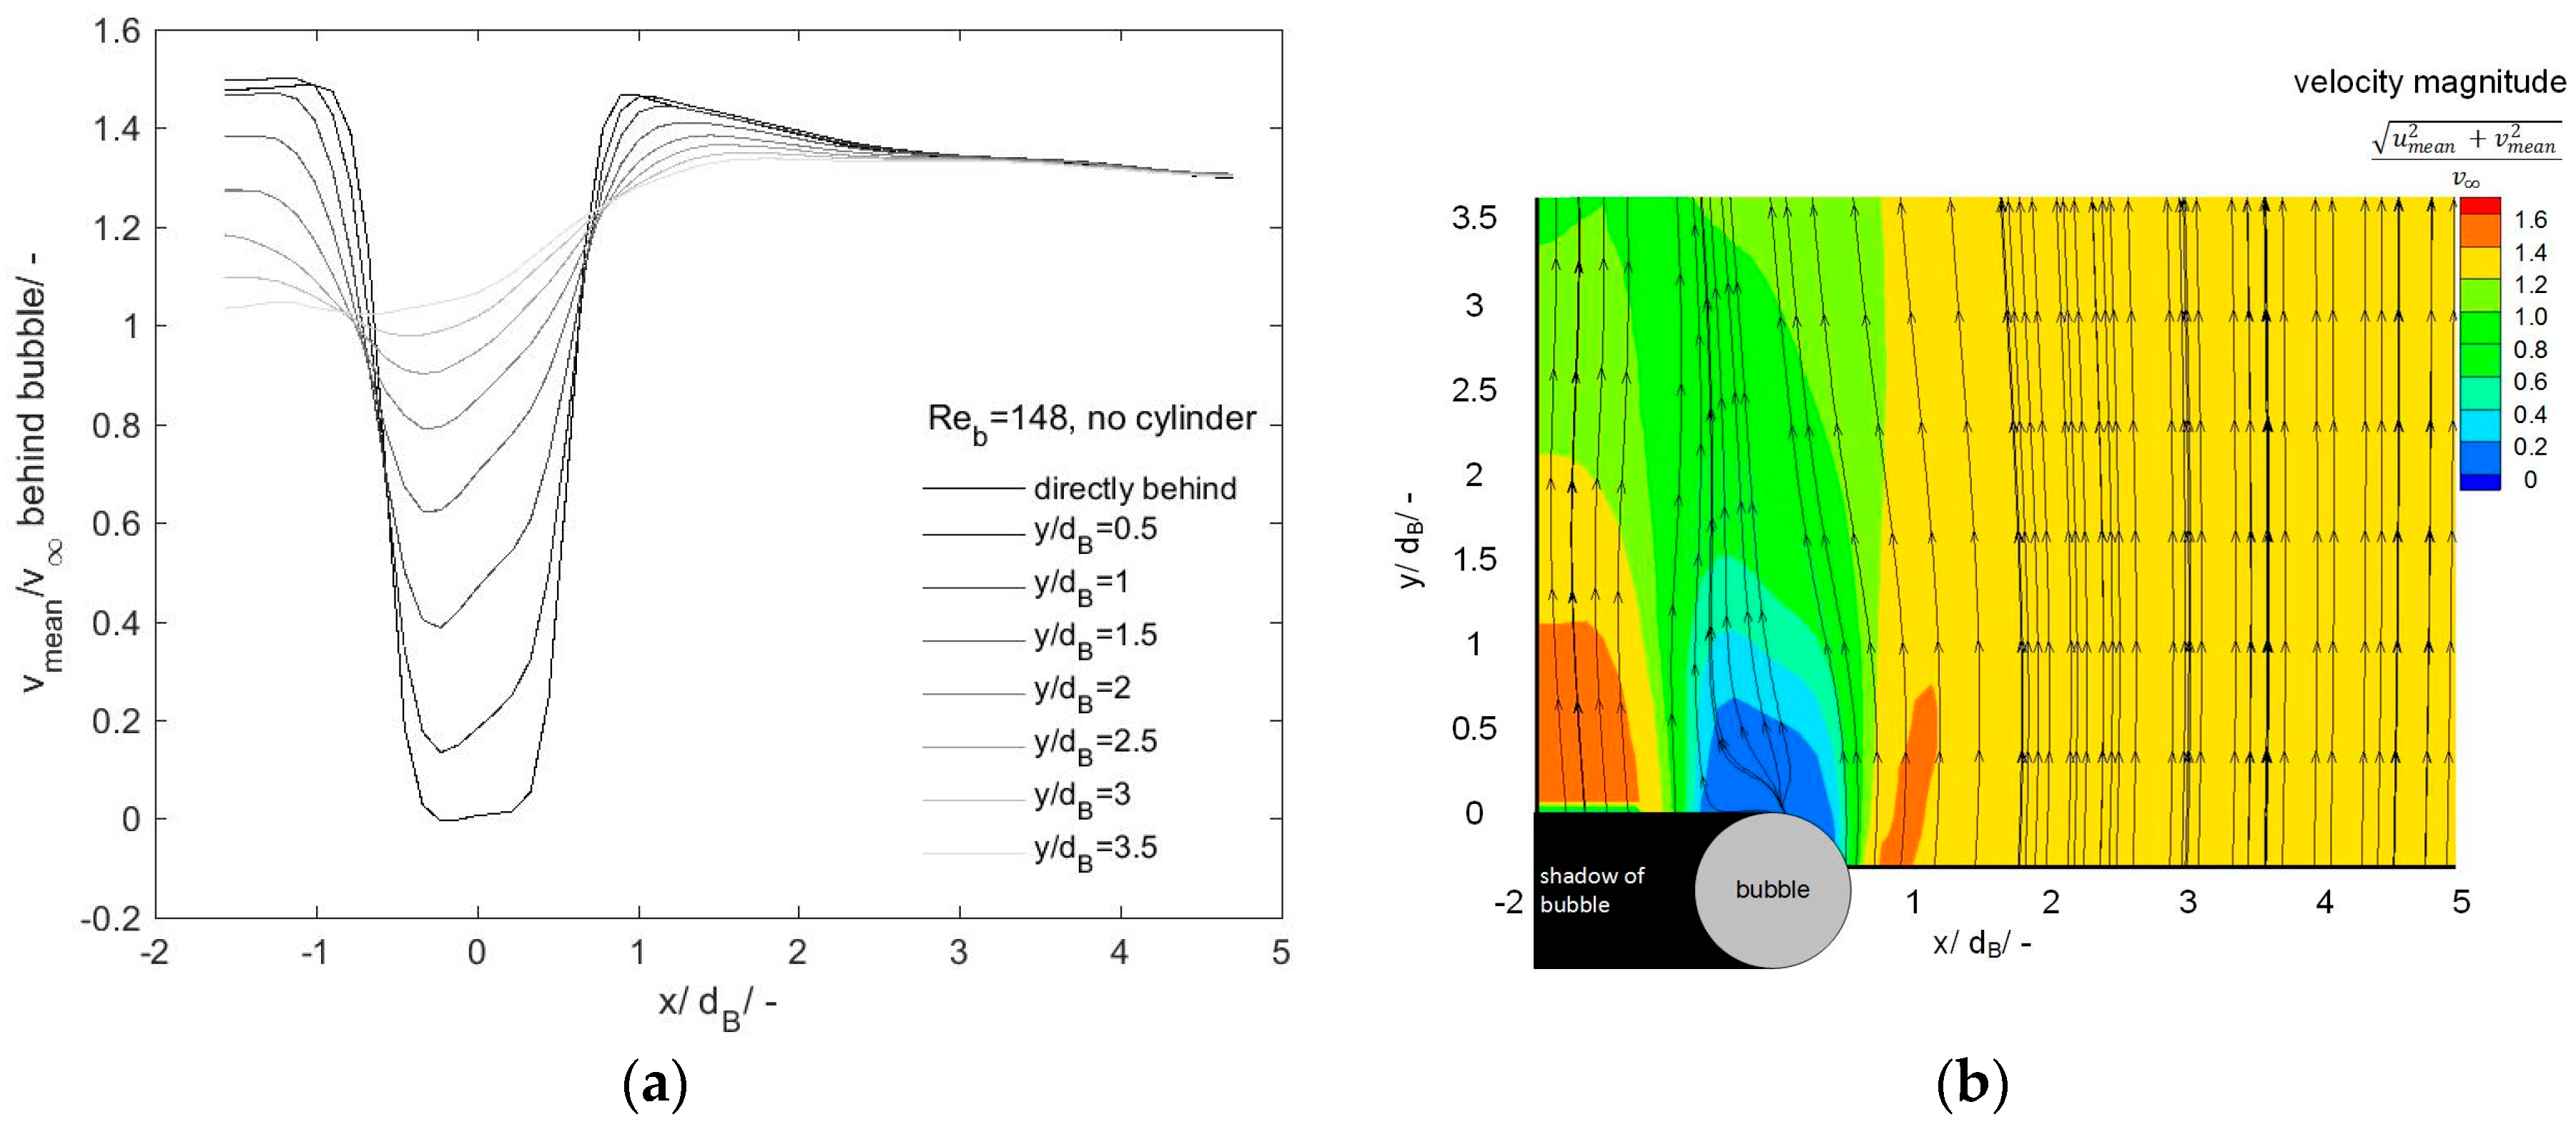
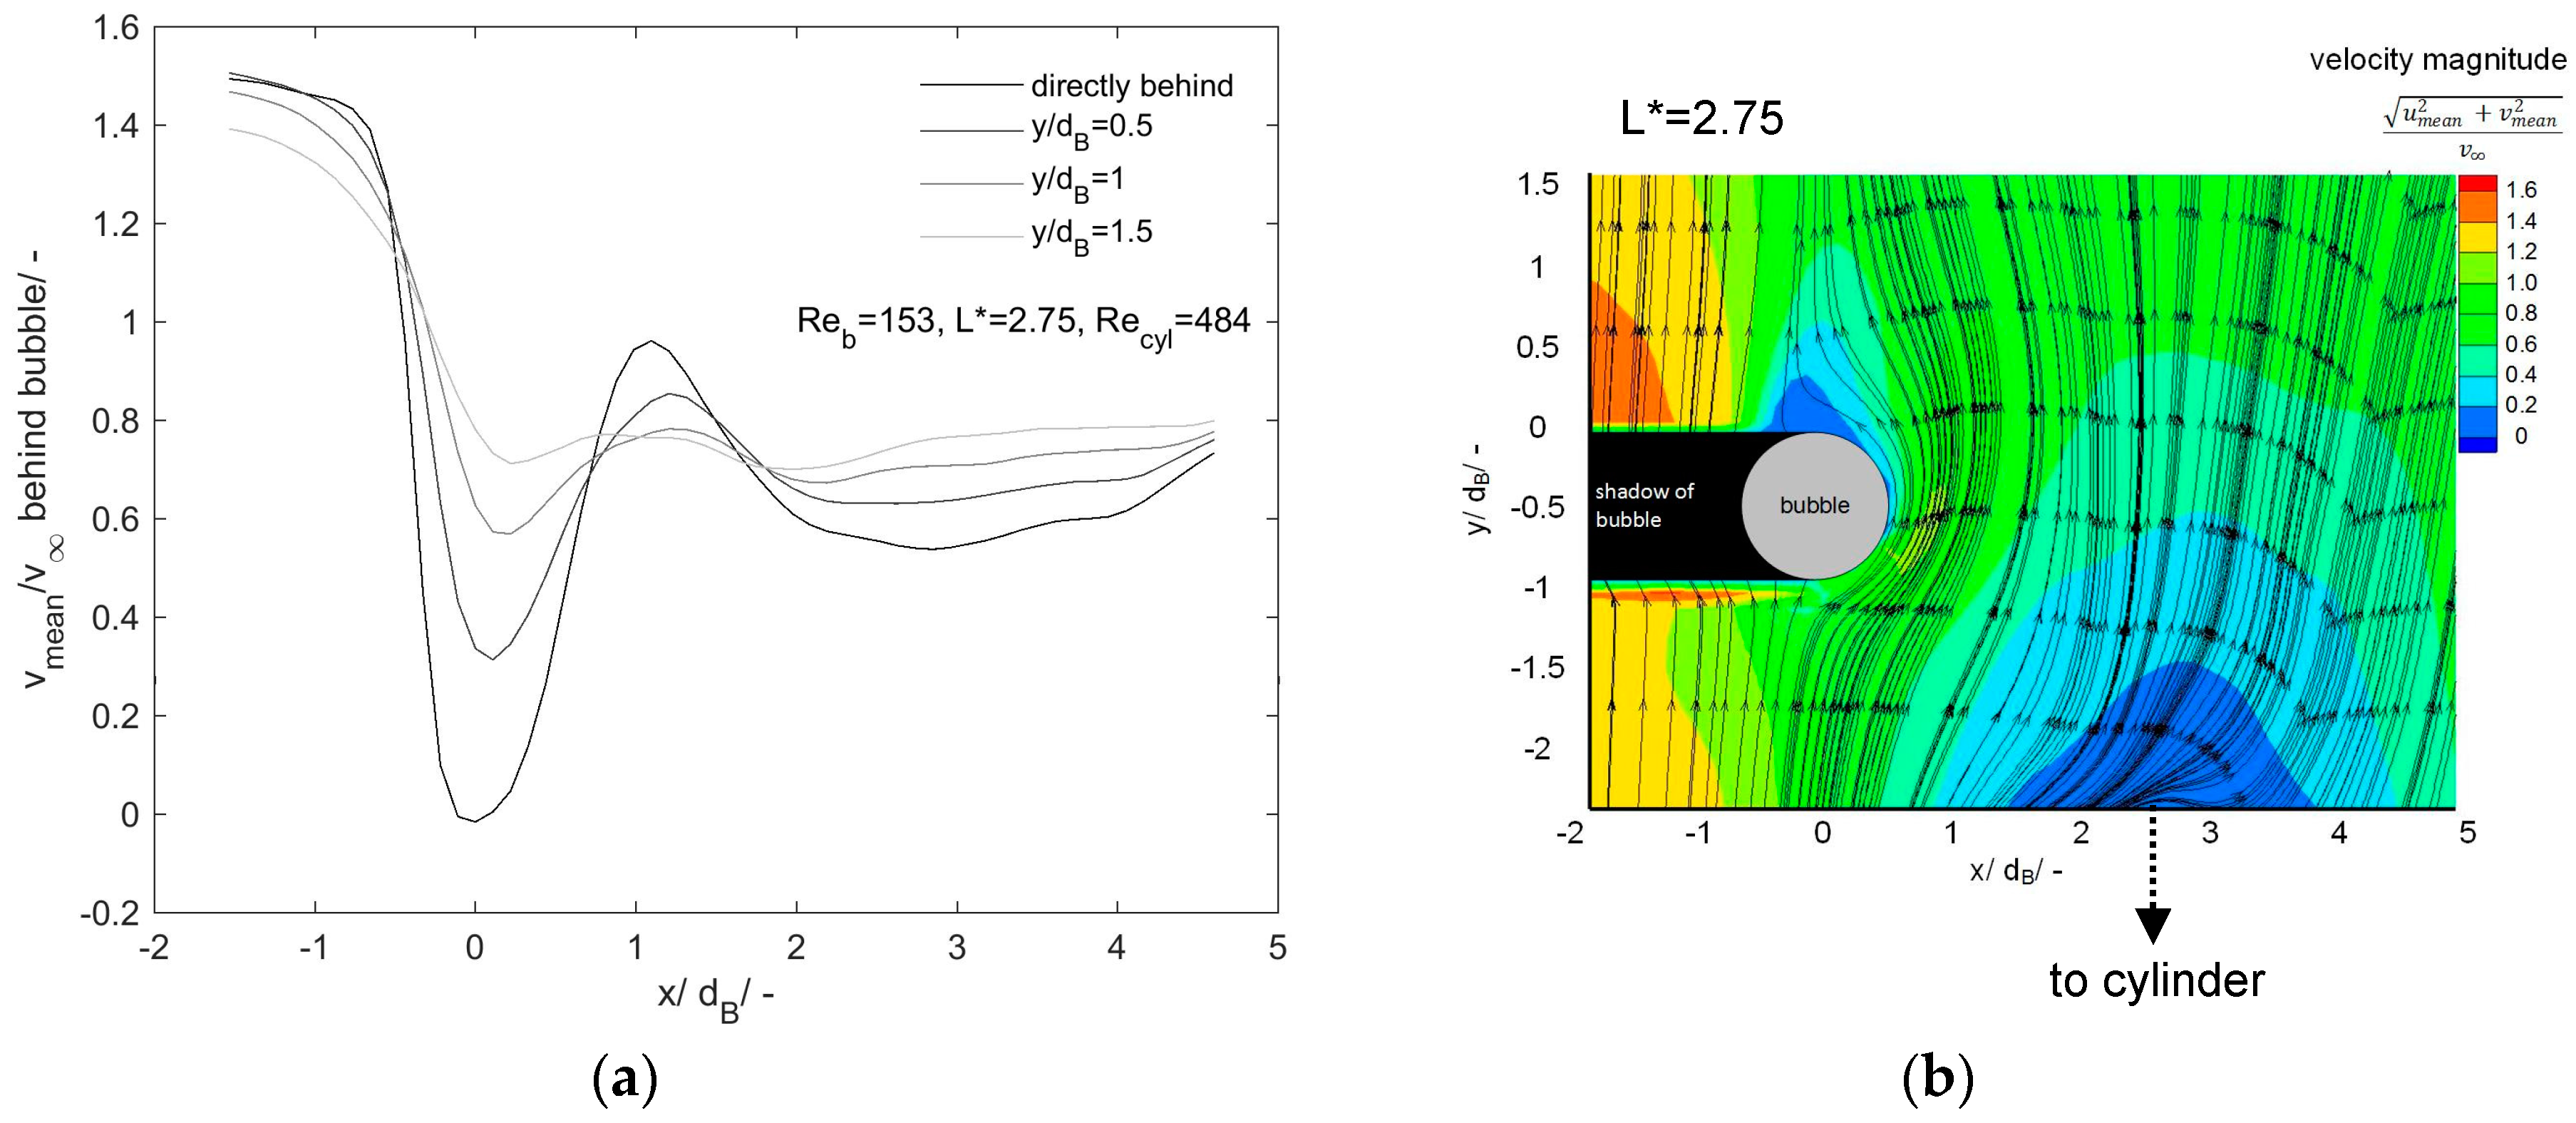
To get a deeper insight into this finding, velocity profiles of mean velocities in the flow direction (y direction) are plotted in
Figure 8,
Figure 9 and
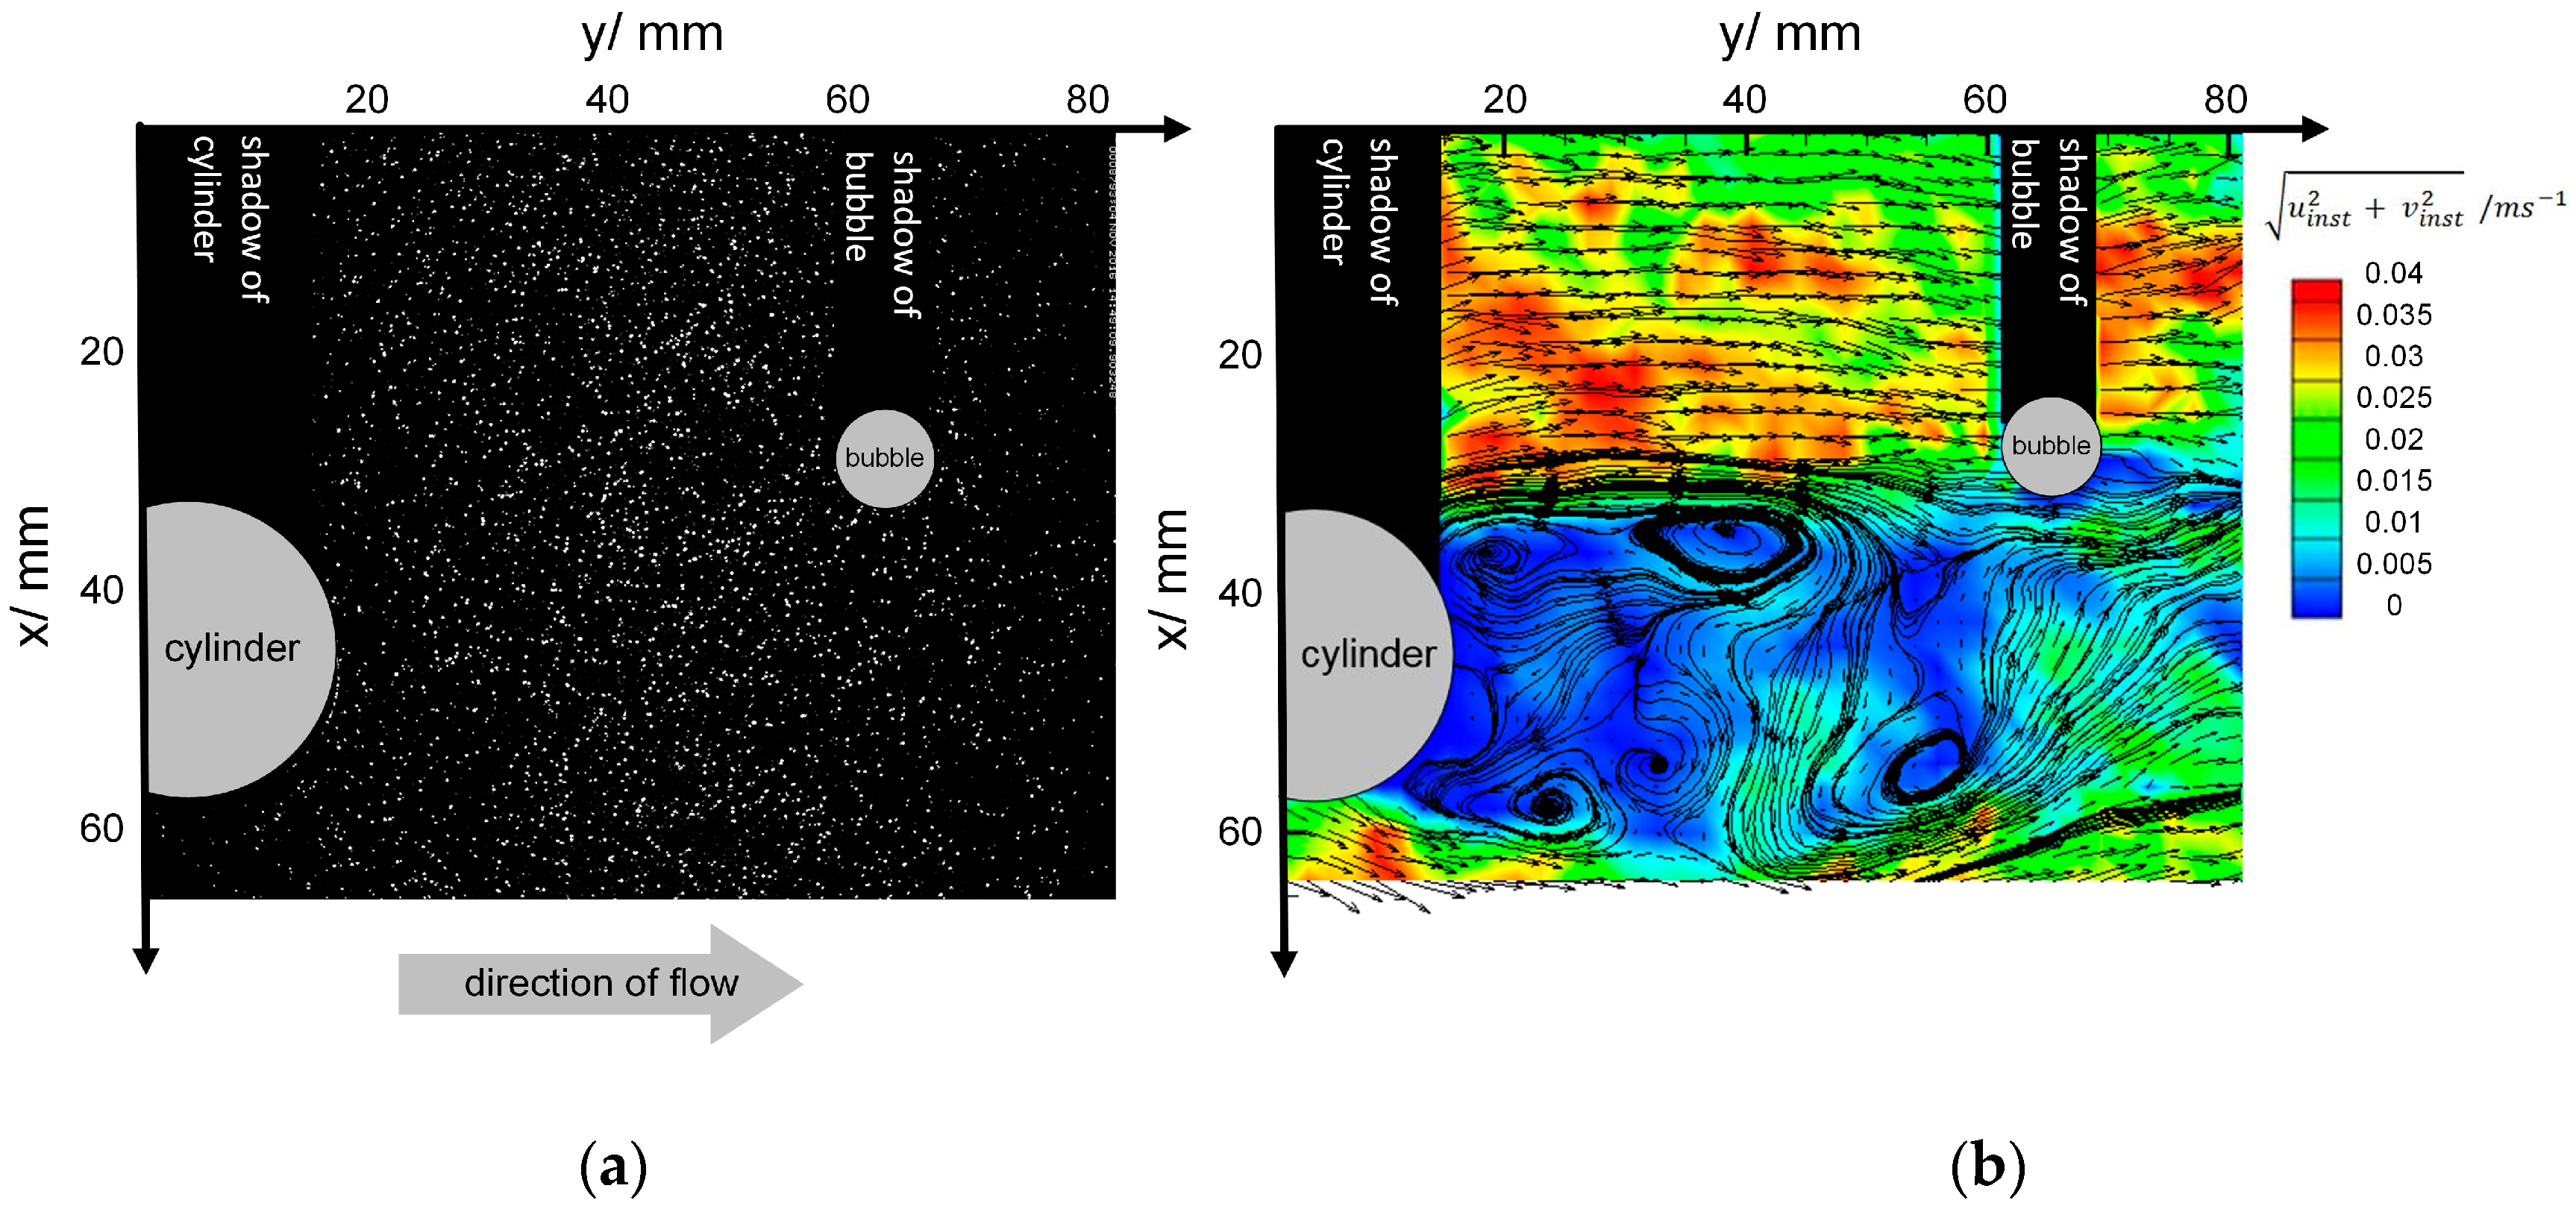
Figure 10 at several locations downstream the bubble. The distances from the bubble are given in bubble diameters (d). Velocity fields for the whole viewing field including streamlines are added in small pictures to the profiles. The bubble, as well as the shadow of the bubble, which occurs as a result of the laser light sheet illumination, are marked. Due to the bubble, the mean velocity in the y direction
decreases dramatically. Further away from the bubble,
again increases. The width of the primary bubble wake is in the order of the bubble diameter. The sharp changes in
depict the spatial extension of the primary bubble wake. In
Figure 8, it can be seen that in absence of a cylinder wake, these sharp changes blur with increasing distance from the bubble until they are no longer sharp for a distance three bubble diameters from the rear stagnation point (180°). In the presence of cylinder wakes (
Figure 9 and
Figure 10), the velocity profiles look different. Due to the cylinder, which is located at positive x values, upstream the bubble, the velocity increases to a lesser extent to the right from the bubble (increasing
x values). The influence of the different cylinder setups is well visible: for the
L* = 1 configuration, the primary cylinder wake is still visible. This leads to a more rapid blurring of the bubble wake: already one bubble diameter behind the rear stagnation point, the bubble wake is no longer sharply recognizable. For the
L* = 2.75 configuration, the bubble wake is blurred 1.5 diameters behind the rear stagnation point. This means that the presence of the cylinder wake shortens the primary bubble wake length. The three-dimensional effects found in the cylinder wake may enhance this effect. The higher value of
L* leads to a stronger increase of the vertical RMS velocities, whereas the bubble wake length remains longer. Between the bubble and the cylinder, an inner shear layer is formed, which is described later on when
Figure 11 is discussed. This shear layer transfers momentum from the cylinder wake into the bubble wake. Since the momentum within the cylinder wake for the
L* = 2.75 configuration is considered to have a larger momentum (see the discussion of
Figure 7b) close to the bubble, the inner shear layer can transfer the momentum to the bubble wake. Thus, the bubble wake remains longer for this configuration. Furthermore, it is visible that for the
L* = 1 configuration, the bubble wake is attracted strongly to the cylinder wake. The bubble wake is therefore pulled away. It does not remain downstream the bubble, but it is drawn in the positive
direction. As mentioned earlier, the cylinders enhance the cross-mixing (higher
velocities,
Figure 7) and, thus, the interaction of the wake with the external flow. The observation of the shortened primary wake leads to the assumption that not only the cross-mixing, but also the downstream mixing is enhanced. This downstream mixing is enhanced more strongly for the
L* = 1 configuration due to the shortened wake. Transferred mass from the bubble into the liquid may therefore be mixed into the liquid remarkably faster.
Due to the fact that the centers of the cylinder and the bubble are at different
x coordinates, the cylinder wake attracts the bubble wake, and therefore, it is slightly shifted to the right (higher
x values). This is more clearly visible for the
L* = 1 configuration. The formation of an asymmetric wake structure of both the bubble and the cylinder is a convincing explanation of why the
L* = 2.75 configuration leads to higher velocity fluctuations directly behind the bubble in
Figure 7.
For both configurations of bubble and cylinder, no dominating frequency could be found at the observation point 1 cm behind the bubble. Thus, no Strouhal numbers are calculated. From
Figure 7, it could be learned, however, that the vertical velocity fluctuations increase behind the bubble. By observation of the temporal vertical velocity profiles, it could be deduced that the fluctuations increase in an irregular manner, which explains the fact that no sharp peak in the power spectrum is found.
The interaction of the bubble wake and the cylinder wake is strongly dependent on the distance between them. Strong wake interaction is well visible for
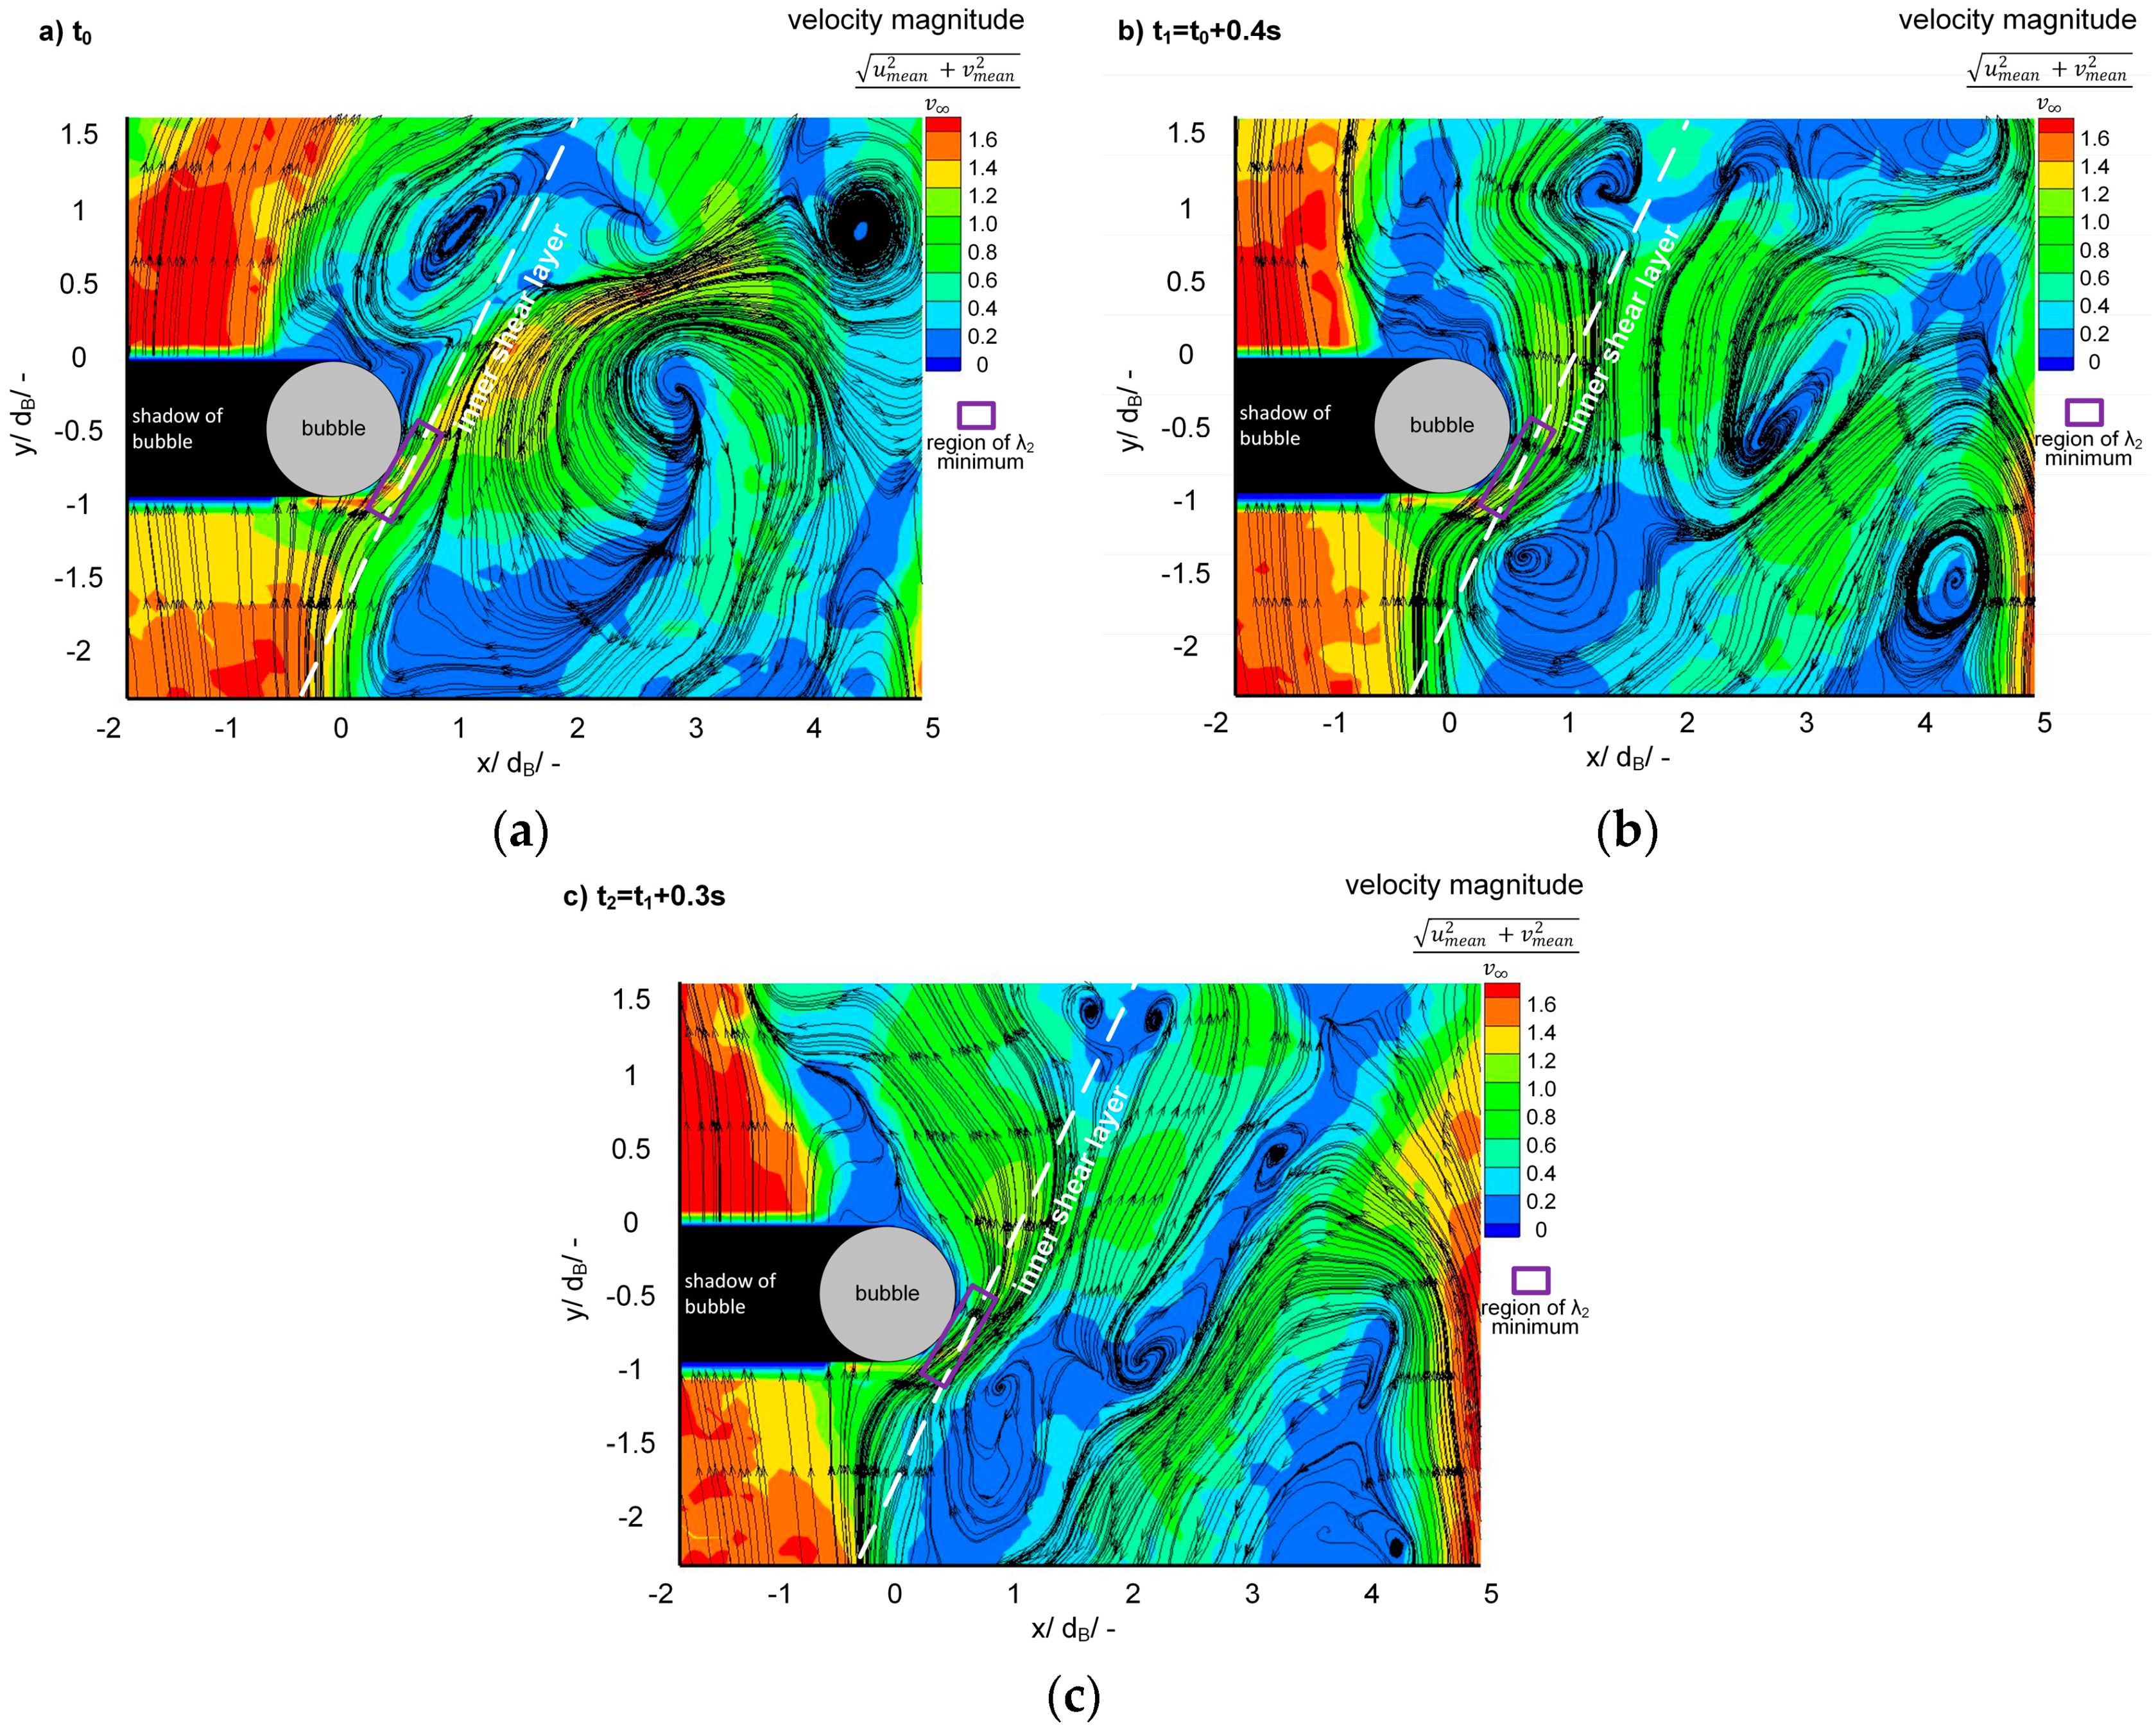
L* = 1. The formation of an inner shear layer resulting from proximity and wake interference can be observed by following the stream traces. In this study, for the sake of simplicity, it is called the inner shear layer. Strictly speaking, according to Sumner [
17], it consists of the upstream inner shear layer (cylinder), the downstream inner shear layer (bubble), as well as the gap between them. Tokuhiro et al. [
21] observed a jet-like behavior when investigating two bubbles in a parallel configuration. Due to the staggered configuration of this work, a jet-like behavior cannot arise; however, the complex interaction of shear layers is visible. Along the inner shear layer, vortices and even coupled vortices occur. It has to be pointed out that wake interaction can be investigated better by analyzing instantaneous velocity fields. This is depicted in
Figure 11. Instantaneous velocity fields of the velocity magnitude are presented for three time steps. Again, the bubble and the bubble shadow are marked. Observation of the stream traces gives insight into the vortex structures, which approach the interface. Many vortices are formed along the inner shear layer, which is highlighted white in
Figure 11. A good way to analyze flow structures is to use flow topology [
32,
33,
34]. For the flow around cylinders, proper orthogonal decomposition, dynamic mode decomposition and critical point theory have been applied to experimental and numerical data to analyze the flow structure [
35,
36]. This gives the opportunity to make statements concerning the kinetic energy distribution within nonlinear and unsteady flow [
35]. Vortices can be detected furthermore via vortex detection criteria [
37,
38,
39]. Following the streamlines can give a first visualization of vortices within instantaneous flow fields. A node (critical point) shows the presence of a vortex, while the limiting streamlines follow the trajectory of the inner shear layer. The vortex is separated from the bubble by the inner shear layer. Jeong and Hussain [
38] suggest a criterion that identifies local pressure minima by making a critical point analysis of the Hessian of pressure. Starting with the Navier–Stokes equation for incompressible flows and neglecting unsteady irrotational straining and viscous effects, they find that a vortex core is a connected region with two negative eigenvalues of
. This condition is equivalent to the condition that after ordering the eigenvalues according to size (
), the second eigenvalue has to be negative:
. For this reason, it is called the
criterion. At the point where the inner shear layer touches the bubble, the application of the
criterion yields a minimum (see
Figure 11, marked purple). This location can therefore be interpreted as an important point from which the separation of vortices from the bubble starts. Only the vortices that are formed downstream the bubble move visibly in the direction of flow. Interestingly, it can be observed how a coupled vortex is formed, which is also located close to the inner shear layer: in
Figure 11c, two vortices rotating in opposite directions are visible at the upper part of the image. This is also found by Hu and Zhou [
40], who call this phenomenon vortex pairing and enveloping. In studies dealing with flow around circular cylinders [
15,
16], the flow is classified based on interference. This classification says for the flow case in this work that there should be proximity and wake interference, which matches the findings of this work. This accordance is remarkable since most studies are carried out at much higher Reynolds numbers and with cylindrical bodies with equal diameters.
As is the case for all experimental investigations, there are several shortcomings of this study, which will be discussed in the following. It has to be mentioned that the measurements take place in a two-dimensional plane. Therefore, three-dimensional effects cannot be observed. Vortices moving out of the laser light sheet plane cannot be tracked once they have left the illuminated area. Trajectories of vortices are therefore not identified in this work. This can be overcome in the future by carrying out three-dimensional measurement methods, e.g., tomographic PIV [
41]. As was already discussed earlier, events that take place very close to the interface cannot be tracked via PIV. This is observable in
Figure 6. Due to a mask, which has to be put over the bubble during PIV processing, the velocities close to the bubble are low. It is not clear whether there is in fact only very little internal circulation within the bubble or whether the velocities close to the bubble are underestimated due to the data processing. Eventually, the fixation of the bubble reduces the degrees of freedom of the bubble motion. Free rising bubbles undergo different shape regimes as a function of the three non-dimensional numbers, Reynolds, Eotvos and Morton [
2]. In contrast to free rising bubbles, the shape of the bubble in this study is constantly spherical. This slightly idealized system has been chosen deliberately since only with a fixed bubble, these deep insights into bubble and cylinder interactions could be carried out.
