Article

Urban Floods Adaptation and Sustainable Drainage Measures

by
Helena M. Ramos
1,
Modesto Pérez-Sánchez
2,*,
A. Bento Franco
1 and
P. Amparo López-Jiménez
2
1
Civil Engineering, Architecture and Georesources Department, CERIS, Instituto Superior Técnico, Universidade de Lisboa, 1049-001 Lisboa, Portugal
2
Hydraulic and Environmental Engineering Department, Universitat Politècnica de València, 46022 Valencia, Spain
*
Author to whom correspondence should be addressed.
Fluids 2017, 2(4), 61; https://doi.org/10.3390/fluids2040061
Submission received: 8 October 2017 / Revised: 25 October 2017 / Accepted: 1 November 2017 / Published: 7 November 2017
(This article belongs to the Special Issue Advances in Hydrodynamics)

Abstract

:
Sustainability is crucial to the urban zones, especially related to the water management, which is vulnerable to flood occurrence. This research applies the procedure contemplated by the Soil Conservation Service (SCS) to determine the generated volumes when the impervious areas can exceed the drainage capacity of existing pluvial water networks. Several computational simulations were developed for the current scenario of an existing basin in Lisbon. Using CivilStorm software from Bentley Systems (Bentley EMEA, Bentley Systems International Limited, Dublin, Ireland), it enabled the evaluation of the volumes of flood peaks and the hydraulic behavior of a small hydrographic basin in the continuation of an urbanization process, considering the modification of its superficial impervious parts and the growth of the urbanized area. Several measures are suggested to solve the limited capacity of the existing drainage system. This study analyzes the efficiency of the application of constructive measures, pondering the viability of their effectiveness, individually and combined. The option that best minimizes the effects of the urbanization is the combination of different structural measures, in particular retention ponds, storage blocks, ditches and specific drainage interventions in some parts of the network.

1. Introduction

Although climatic modification has always existed as a natural and cyclical phenomenon, this issue recently has increased concern in the scientific community and general population. This increased concern about climate change is mainly due to high population growth as well as the technological and scientific development that caused drastic climate change. Urban flooding, from pluvial storm, has special importance due to the impacts caused in people's everyday lives and in economic activities in view of its fast action. The recognition of this problem is ratified by the European Environment Agency (EEA) [1,2,3,4,5,6,7,8,9]. This association defends good land management and emergency plans. These actions reduce the impacts of natural hazards and decrease the interactions with human activities. In this line, the traditional strategies of micro and macro urban drainage systems are considered as unsustainable, i.e., not understanding what actually originates the problem of floods but only transferring the runoff in the watershed [2,3,4,5,6,7,8].
The main reason for the unsustainability of the traditional systems is the increase of impervious areas, leading a need to review the entire system. Thus, unconventional drainage systems, known as sustainable urban drainage systems (SUDS), have increased in the last years [9,10,11,12,13,14,15]. These systems differ from the traditional concept, and they are used with old systems to optimize and adapt them to new realities. Using techniques of flow delay, detention, retention and infiltration allow greater control over the quantity and quality of water drained, preventing flood areas from affecting water supply systems existing downstream.
This study contributes to the analysis of flooding in urban areas and evaluates the performance of different mitigation measures for its prevention. For this purpose, a computer simulation program (CivilStorm V8i (Bentley EMEA, Bentley Systems International Limited, Dublin, Ireland)) was used, with the objective of managing and preventing risk situations that cause this type of phenomena, enabling the development of best practices and rules for managing the risk associated with the occurrence of flood events [4]. Studying the effects of the urbanization and the efficiency of the implementation of some mitigation measures to control the runoff and reducing urban flooding are goals of this study [16,17,18,19,20]. Later, based on the results, conclusions are drawn about the behavior of impervious urban areas, runoff conditions, and how the different solutions of retention, capture and infiltration of rain may lead towards sustainable urban drainage systems.

2. The Sustainability in the Urban Drainage

2.1. The Impact of Urbanization

A huge number of people are living, mostly in urban areas compared to rural areas. Europe is a continent with the highest rate of urbanization: about 75% of the population occupies urban areas, which will increase to 80% by 2020 [10,11,12,13]. The space occupied by urban areas is increasing faster than the population itself, in which the world population will approximately increase 72% between 2000 and 2030, while, for the same period of time, an increase of 175% for urban areas with 100,000 or more inhabitants is expected. Therefore, modern patterns of city growth over the past two centuries indicate a greater use of the land of deployment, in contrast to the decrease in average urban density, mainly due to improvements that have occurred in terms of roads and mobility [5].
Non-urbanized basins are characterized by the occurrence of a natural system of flow control, which is formed by the vegetation, permeable soils and natural depressions (which contribute to the temporary retention), increased infiltration and evapotranspiration in the watershed [6,7]. Conversely, urbanized watersheds affect water resources and the hydrological cycle, mainly through the implementation of impervious surfaces that lead to a significant increase of the runoff speed and peak flows, reduced evapotranspiration, increased pollution present in the runoff, reducing the absorption of rain, and inevitable decline of aquifers recharges [8].
Urban development can also lead to changes in the natural course of drainage, revealing different impacts, by sealing them and their effects on dynamic flows in watersheds [9,10,11,12,13,14,15], as presented in Table 1.
Among the factors that influence flooding, it is possible to identify those that are natural, depending on the catchment configuration (Figure 1), the peak flow, etc. [16] such as:
  • Physical features of the aquatic environment, e.g., rivers, streams, and canals;
  • Characteristics of the basin/flood plain and associated habitats; and
  • Characteristic of the socio-economic occupation.

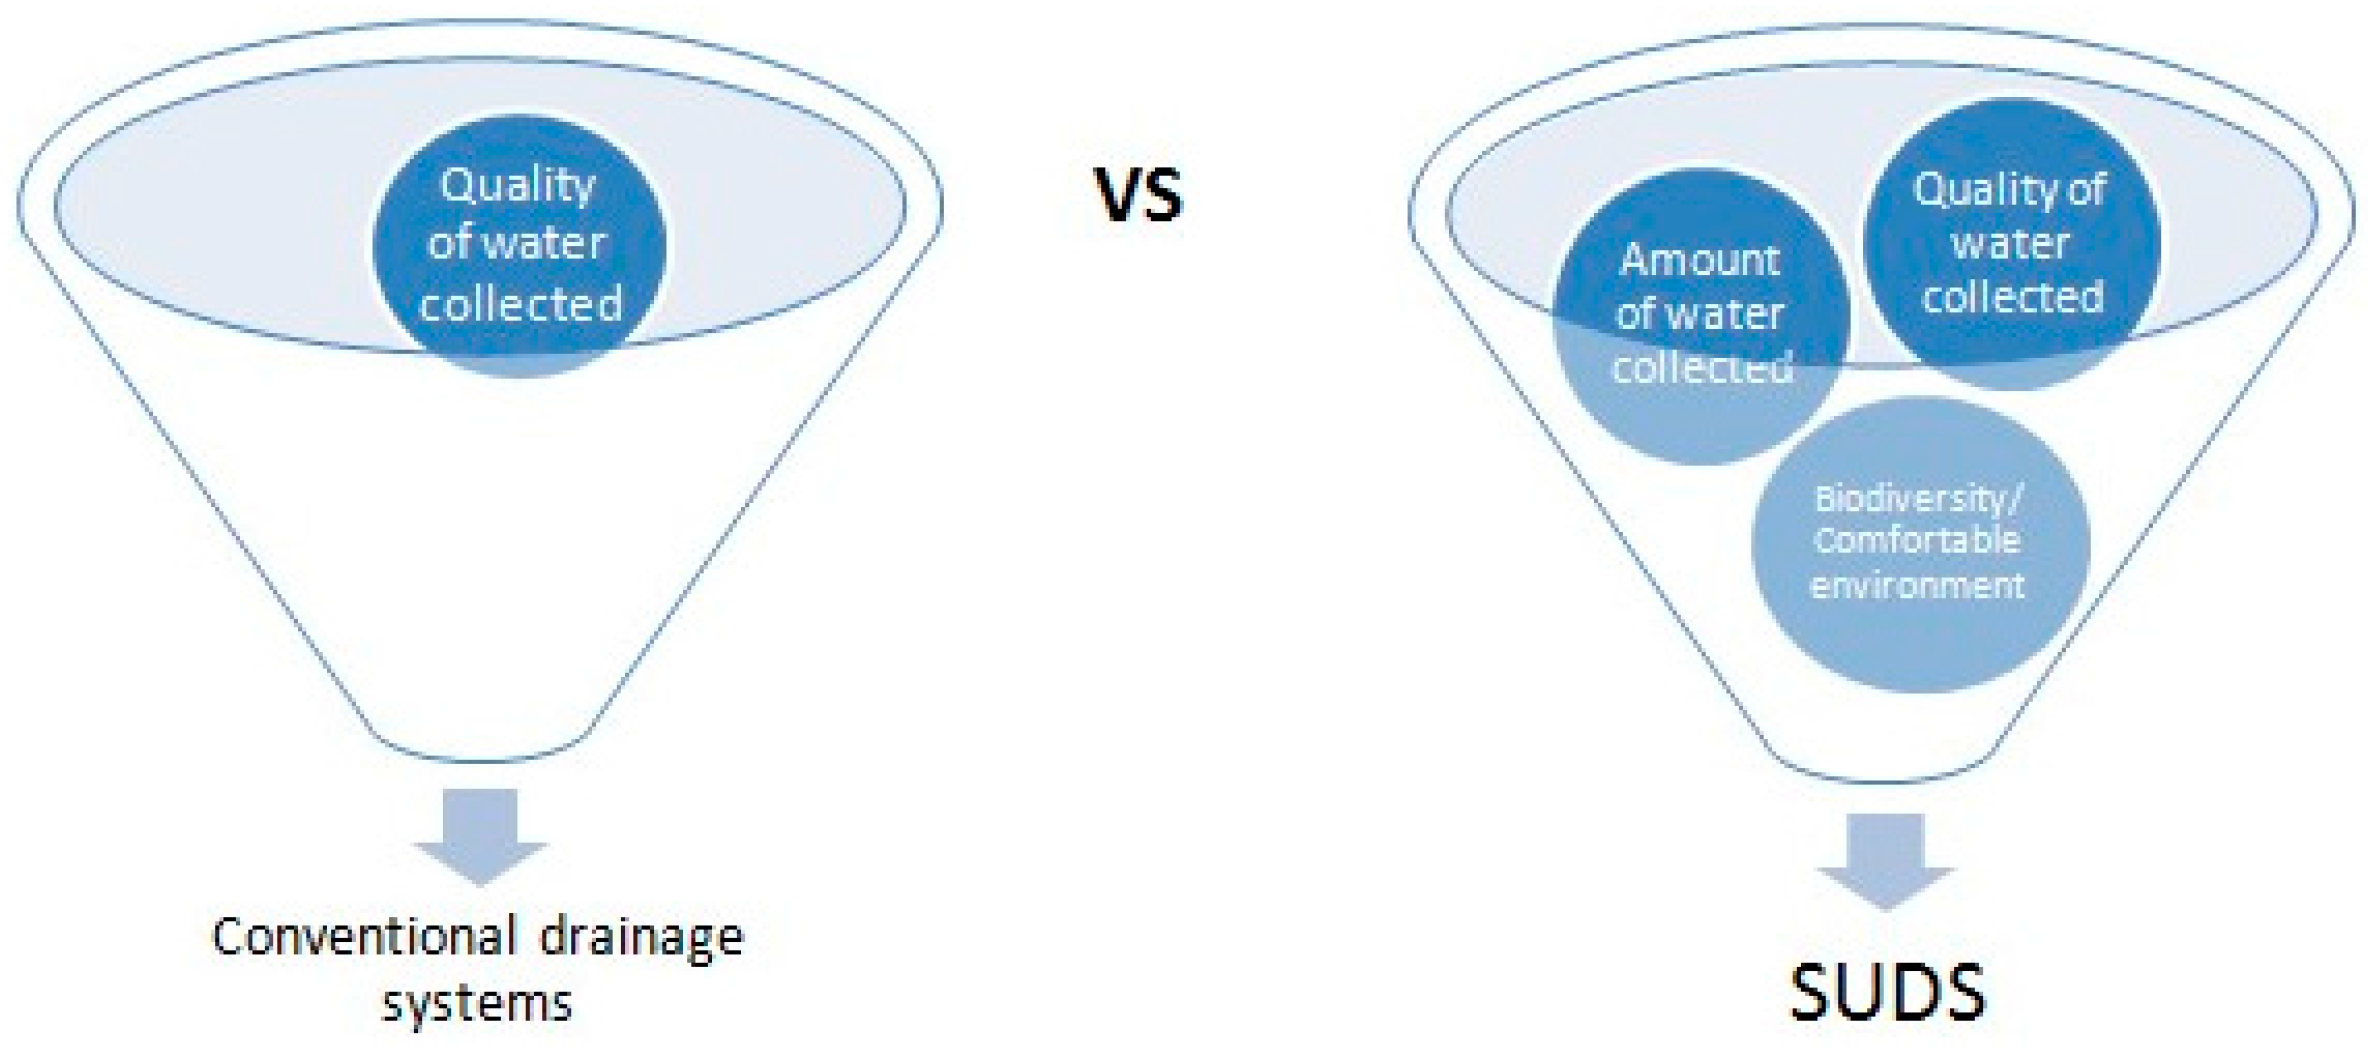
2.2. Sustainable Urban Drainage (SUD)

Several authors [10,11,12,13,14,15,16,17,18,19] consider that, in many countries, the traditional SUDs revealed a lack of proper management and very weak conditions of operation and maintenance. However, new methods of design and construction of urban drainage systems are being studied and tested to influence their development, and to lead a minimization of the impact they have on the natural drainage of the rainwater. The scientific society is increasingly looking for innovative techniques that allow storing and using rainwater collected in basins.
Nowadays, urban drainage can be seen and framed in a broad view of planning, which includes urban development, a policy of water supply and adequate sanitation, control of floods and environmental adaptation [18], resulting in the new concept of sustainable urban drainage systems (SUDS). Several authors [19,20] argue that the modern urban drainage should have as principles the non-transfer impacts to downstream, the non-amplification of flooding, the existence of plans and legislation that allow a better guidance and control systems, technical and administrative skills through the public administration, control measures, defined land use, risk areas, and environmental education for political power, population and technical means.
The SUDS can be described as a concept that includes long term environmental and social factors in drainage decisions, taking into account the quantity, quality and usefulness of the surface water in urban areas. They also promise to include a sequence of management practices and control structures designed to drain in a more sustainable way, compared with the conventional one.
Summarizing, it is possible to determine the best management practices allied to new SUDS, which should include (Figure 2):
  • Mitigation of accidents that can result in pollution incidents;
  • The reduction of polluting activities;
  • Reducing emissions of polluting materials; and
  • Collection and water treatment.

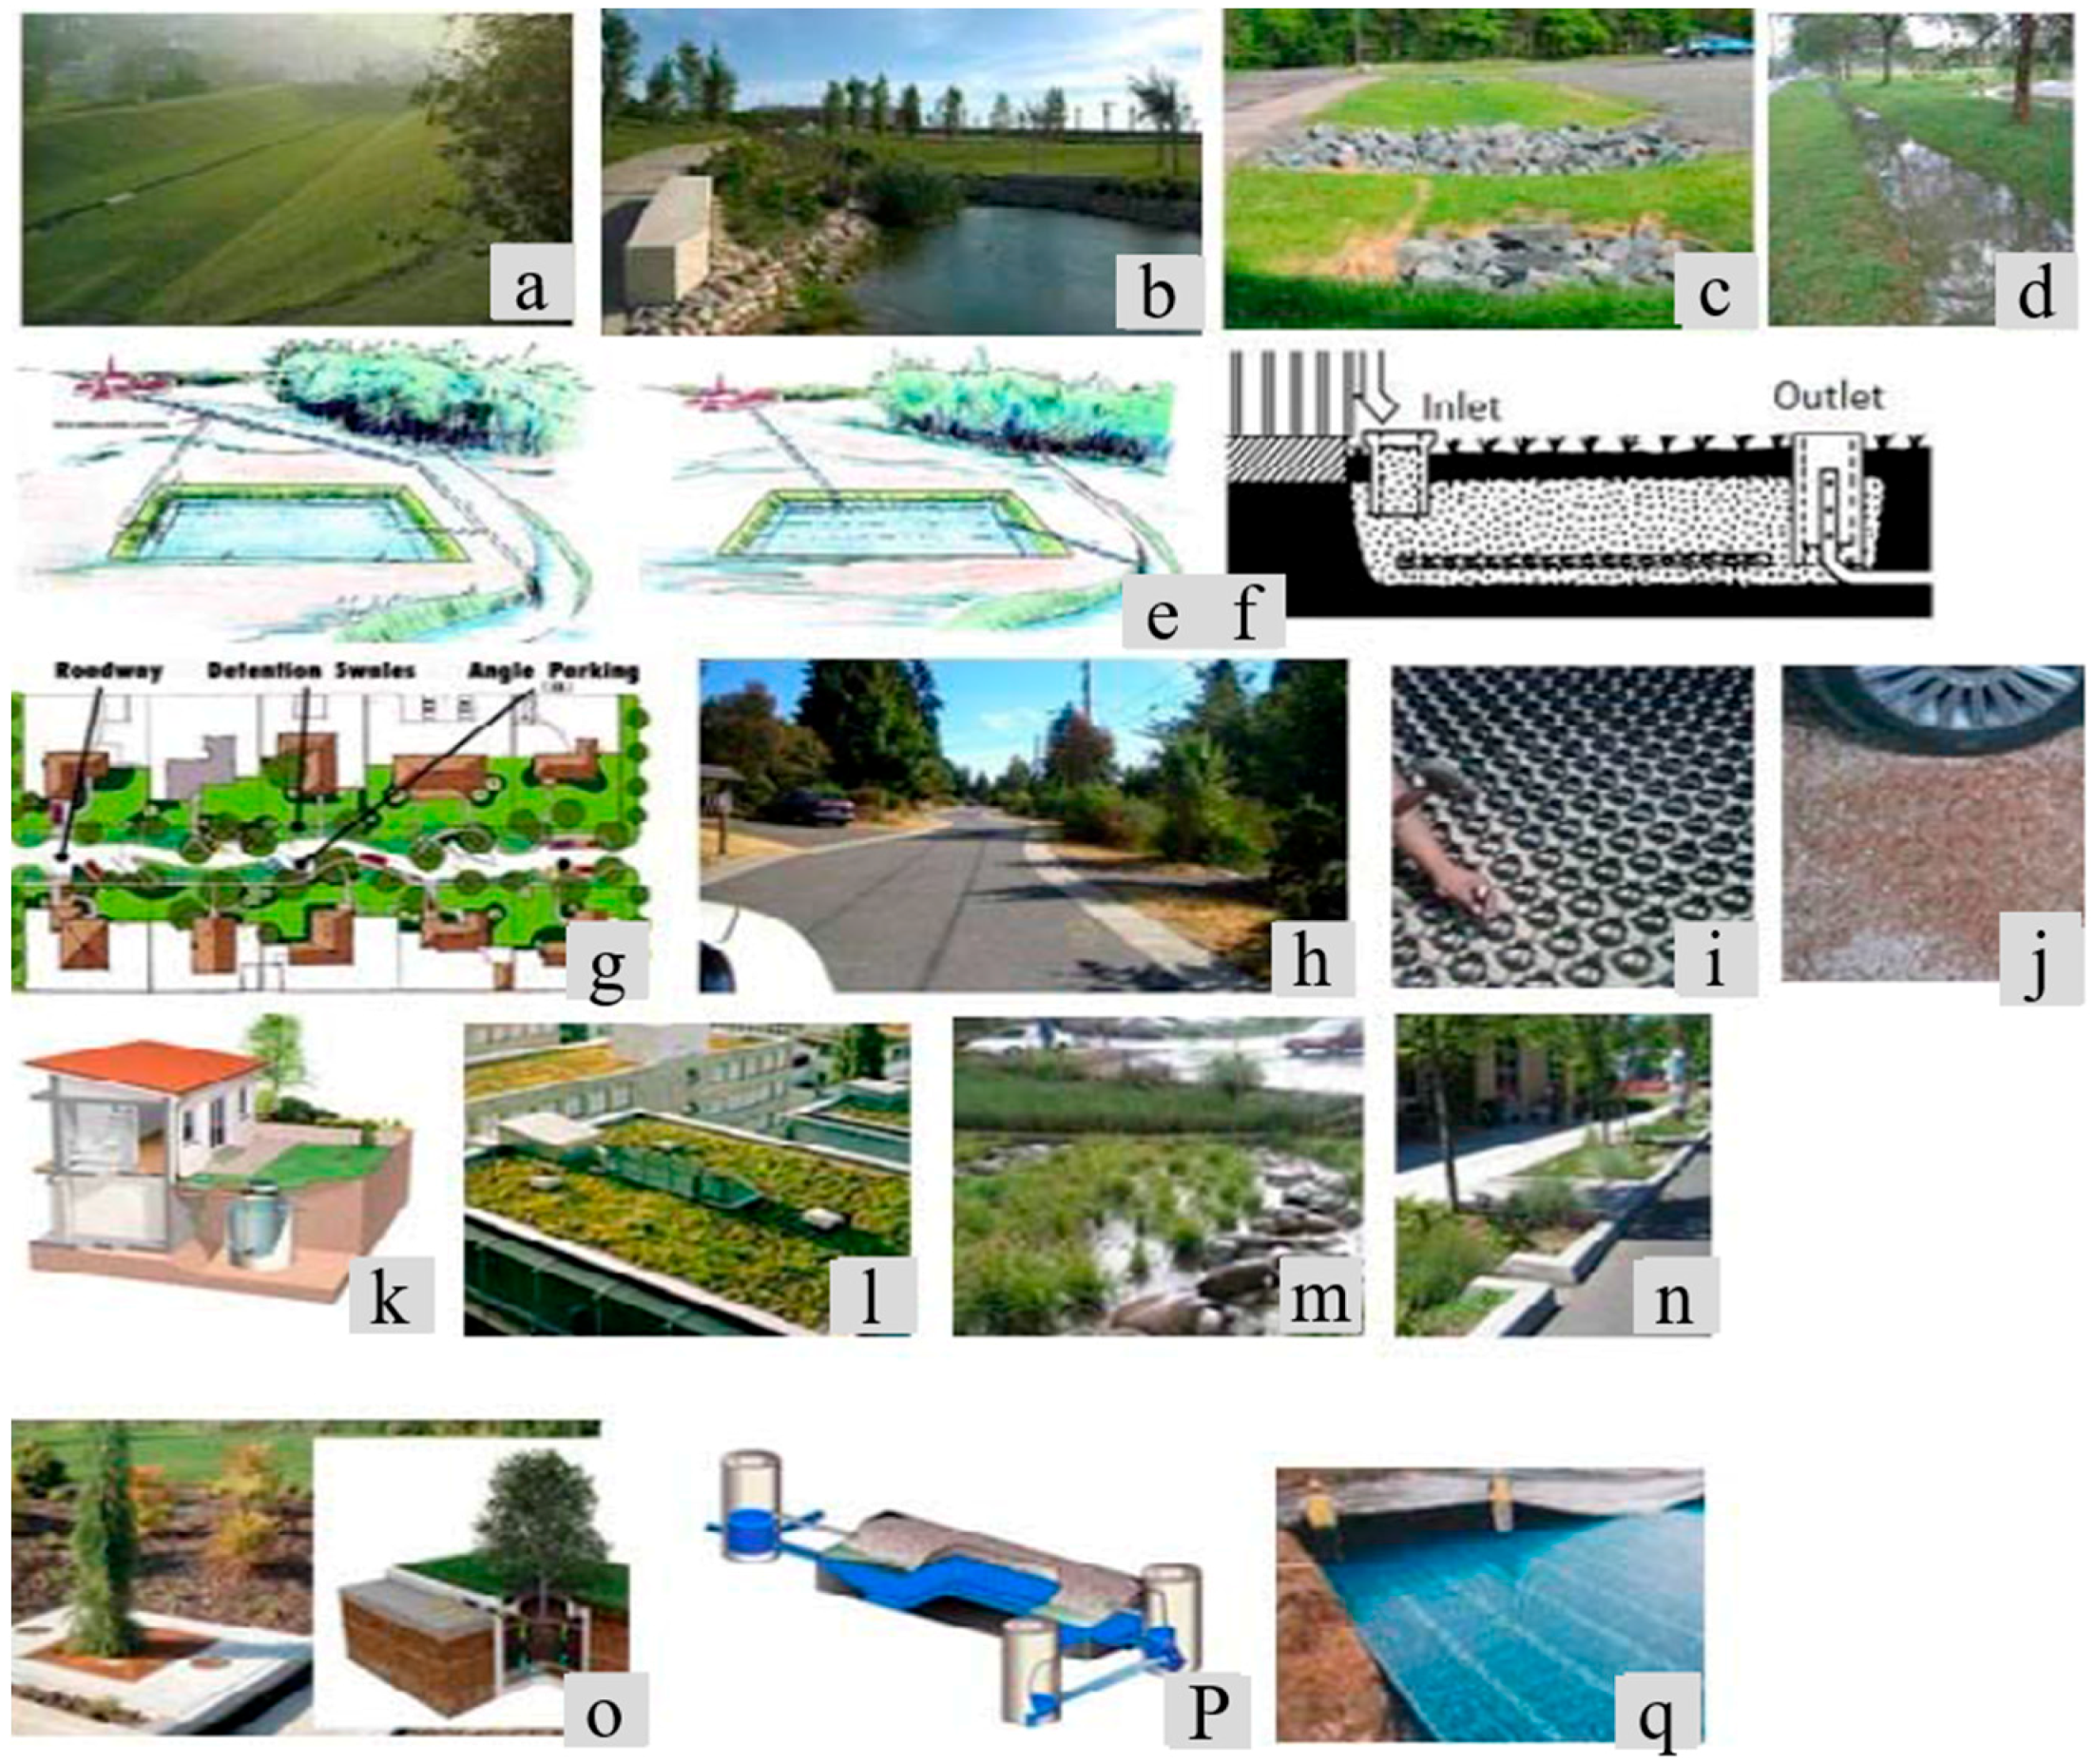
2.3. Floods Mitigation Measures

Although the construction processes are commonly associated with mitigation measures, it is possible to classify flood control measures as structured or unstructured. The structured measures are those that change the structural system due to carrying out civil construction works to maintain or improve the runoff at certain points. These measures include the construction of systems based on Best Management Practices (BMP). In contrast, nonstructural measures include the organization of areas of flooding associated with municipal master plans, flood insurance, national and international laws and predictions of flooding, where these measures propose actions of cohabitation with the floods and provide guidelines for reversal and mitigation of problems associated with the flooding.
Structural mitigation measures analyzed in this research can consider (Figure 3):
  • Runoff control basins are essentially applied to flow storage when the drainage network is not ready to meet new peak flows caused by recent urbanization.
  • Drainage ditches or infiltration trenches are drainage devices that help to reduce the runoff and increase groundwater recharge;
  • Ditches lined with vegetation and bio-swales are a type of measures that could be applied along streets or roads. With longitudinal development, these devices are located in open spaces, with existing plants tolerant to flooding and erosion resistance.
  • Paving alternative can be used in areas with high rates of urbanization, allowing by itself the runoff control and providing an aesthetically pleasing solution.
  • Infiltration wells permit conducting surface runoff into the soil.
  • Micro-reservoirs, conduit storage and permeable pipes are urban storage elements for the flow produced in the urban residential and commercial areas.
  • Green roofs compensate the related impervious areas of the building implementation, which allows using their covering for storage pluvial draining.
  • Rain Gardens take advantage of topographical depressions of the land through the pluvial water collecting.
  • Storage Blocks are structures made of ultra-lightweight, modular, of polypropylene to provide storage of ground water runoff, to mitigate the storm water or the infiltration.
The nonstructural mitigation measures try to reduce the impacts through mechanisms such as standards, legislation and technical manuals, trying to prepare the society to implement and follow these rules by organizations and citizens. The cost of protecting a flooded area by these measures is generally lower than structural protection, since these latter measures impose an expensive maintenance, and require large efforts in the technical level.

3. Model Simulation

In computer simulations, the CivilStorm V8i, from Bentley systems, a robust model already verified and calibrated by Bentley, is used in this research [16]. This software allows modeling the rainwater drainage system through tools capable of solving the dynamic solution using the Saint–Venant equations.
In accordance with the principle of mass conservation, the sum of the outgoing, the inlet and the variation of flow within a control volume is equal to:
( ρ × A × d x ) t ρ × ( Q + q × d s ) + ρ × ( Q + Q x × d x ) = 0
The equation of the momentum (known by the Euler equation) considers that for a given volume of fluid, the sum of the following forces is null at any instant: weight, resulting from the contact forces exerted by the outer medium on the contained fluid in volume across the boundary surface, resulting from the local inertial forces and from the quantities of movement input to the control volume and the outputs therefrom in unit time. This equation known as Newton's second equation can be written in the form of the Reynolds transport theorem:
F = d d t × V × ρ × d + V × ρ × V × d A
Equation (2) shows that the sum of the forces applied in the mass of fluid contained within the control volume is equal to the amount of movement entering and leaving the interior of the control volume, being equivalent to:
Q t + ( β × Q 2 A ) x + g × A × ( y x S 0 + S f + S e ) β × q × ν x + W f × β = 0
where: t is the time (s); x is the distance measured in the direction of flow (m); y is the flow depth (m); Q is the flow rate (m3/s); A is the active cross-sectional area of the flow (m2); q is the lateral inlet or outlet (m3/s/m); β is the correction factor of the amount of movement that takes into account the velocity distribution in cross section; vx is the ratio between the flow rate direction and the flow direction; g is the acceleration of gravity (m/s2); S0 is the longitudinal slope of the channel bottom (m/m); S'f is the slope of the energy line (-); and Se is the Loss of load due to expansion or contraction (-).
These equations correspond to the complete dynamic model, which when written under the conservative form are able to simulate the bore propagation [14]:
U t + F ( U ) x = D ( U )
where U, F(U) and D(U) are the following vectors:
U = [ A Q ] ; F ( U ) = [ Q Q 2 A + g A y ] ; D ( U ) = [ 0 g A ( S 0 S f ) ]
The implicit method has the advantage of maintaining good stability for large computational simulation times and demonstrates robustness in the modeling of systems that require complex interactions of several characteristic parameters in different drainage system transitions. CivilStorm uses a relaxation technique in the convergence process, which decomposes the drainage network into individual branches, solving each component through an implicit Preissman four-point scheme, as presented in [14]. The branches are treated according to a classification scheme, making it possible to obtain a boundary condition downstream of a branch, which will be determined using the mean calculated at the confluence of the two cross sections as applied in a first order resolution.
The implicit method used in CivilStorm is solving the equations of Saint–Venant along the pipes starting from the most downstream emitter element for a subcritical flow and at upstream for a supercritical flow.
Rainwater collectors are subject to a number of special hydraulic conditions that must be considered in the development of a system. The “opening” method of Preissman is a technique that is used to simulate and adjust to the free surface model flows or overloads that lead to situations of pressure flow. One of the challenges in the unstable flow of rainwater drainage systems is the alternation between subcritical and supercritical flow. An urban drainage system can have a wide variety of slopes in the pipes, and it is common to see changes in the slopes of the junction points. Studies also show that the diffusion model, by eliminating the two inertial terms in the momentum equation, leads to stable numerical solutions for critical flow (Fr = 1) and supercritical flow (Fr > 1). However, to benefit from the stability of the diffusion model and maintain the rigor of the dynamic model, it is used in the modeling of an advanced numerical model known as Local Partial Inertial modification (LPI). In the LPI, the momentum equation is modified by a numerical factor (σ) so that the inertial terms are partially or totally omitted based on the variable dependent on the local-time of the hydraulic conditions [16].
The modified equation comes as:
σ [ Q t + ( β Q 2 A ) x ] + g A ( y x S o + S f + S i ) + L = 0
where σ is a numerical factor, in which its value for each finite difference (between xi and xi + 1) will be determined for each time step by Equation (7).
σ = { 1 F r m F r 1 , 0 0 F r > 1 , 0
where m is a constant specified by the user and should take values greater than 1.
It is observed that, in some cases, lower m values tend to stabilize numerically, while higher m values tend to give greater precision.
In pipes with very steep slopes, causing the flows in such conduits to have supercritical regimes, a kinematic treatment is applied, in which the Manning equation is used to replace the dynamics equation during the solution process. For the conditions of no flow, the numerical model applies a small initial equilibrium flow (called a virtual flow rate) at the beginning of the simulation. This virtual flow is applied to the system and its effect on the computational results obtained at the end of the simulation can be negligible. These virtual flow allocations are based on minimum threshold values that are dynamically adjusted during the simulation period, where a filtering algorithm adjusts the results to the values and depths of the virtual flows. The model simulates the flow of the runoff using a nonlinear Muskingum–Cunge method that forwards the flows through the streets and then uses the Manning equation to calculate the flow depth.

4. Application to a Real Basin
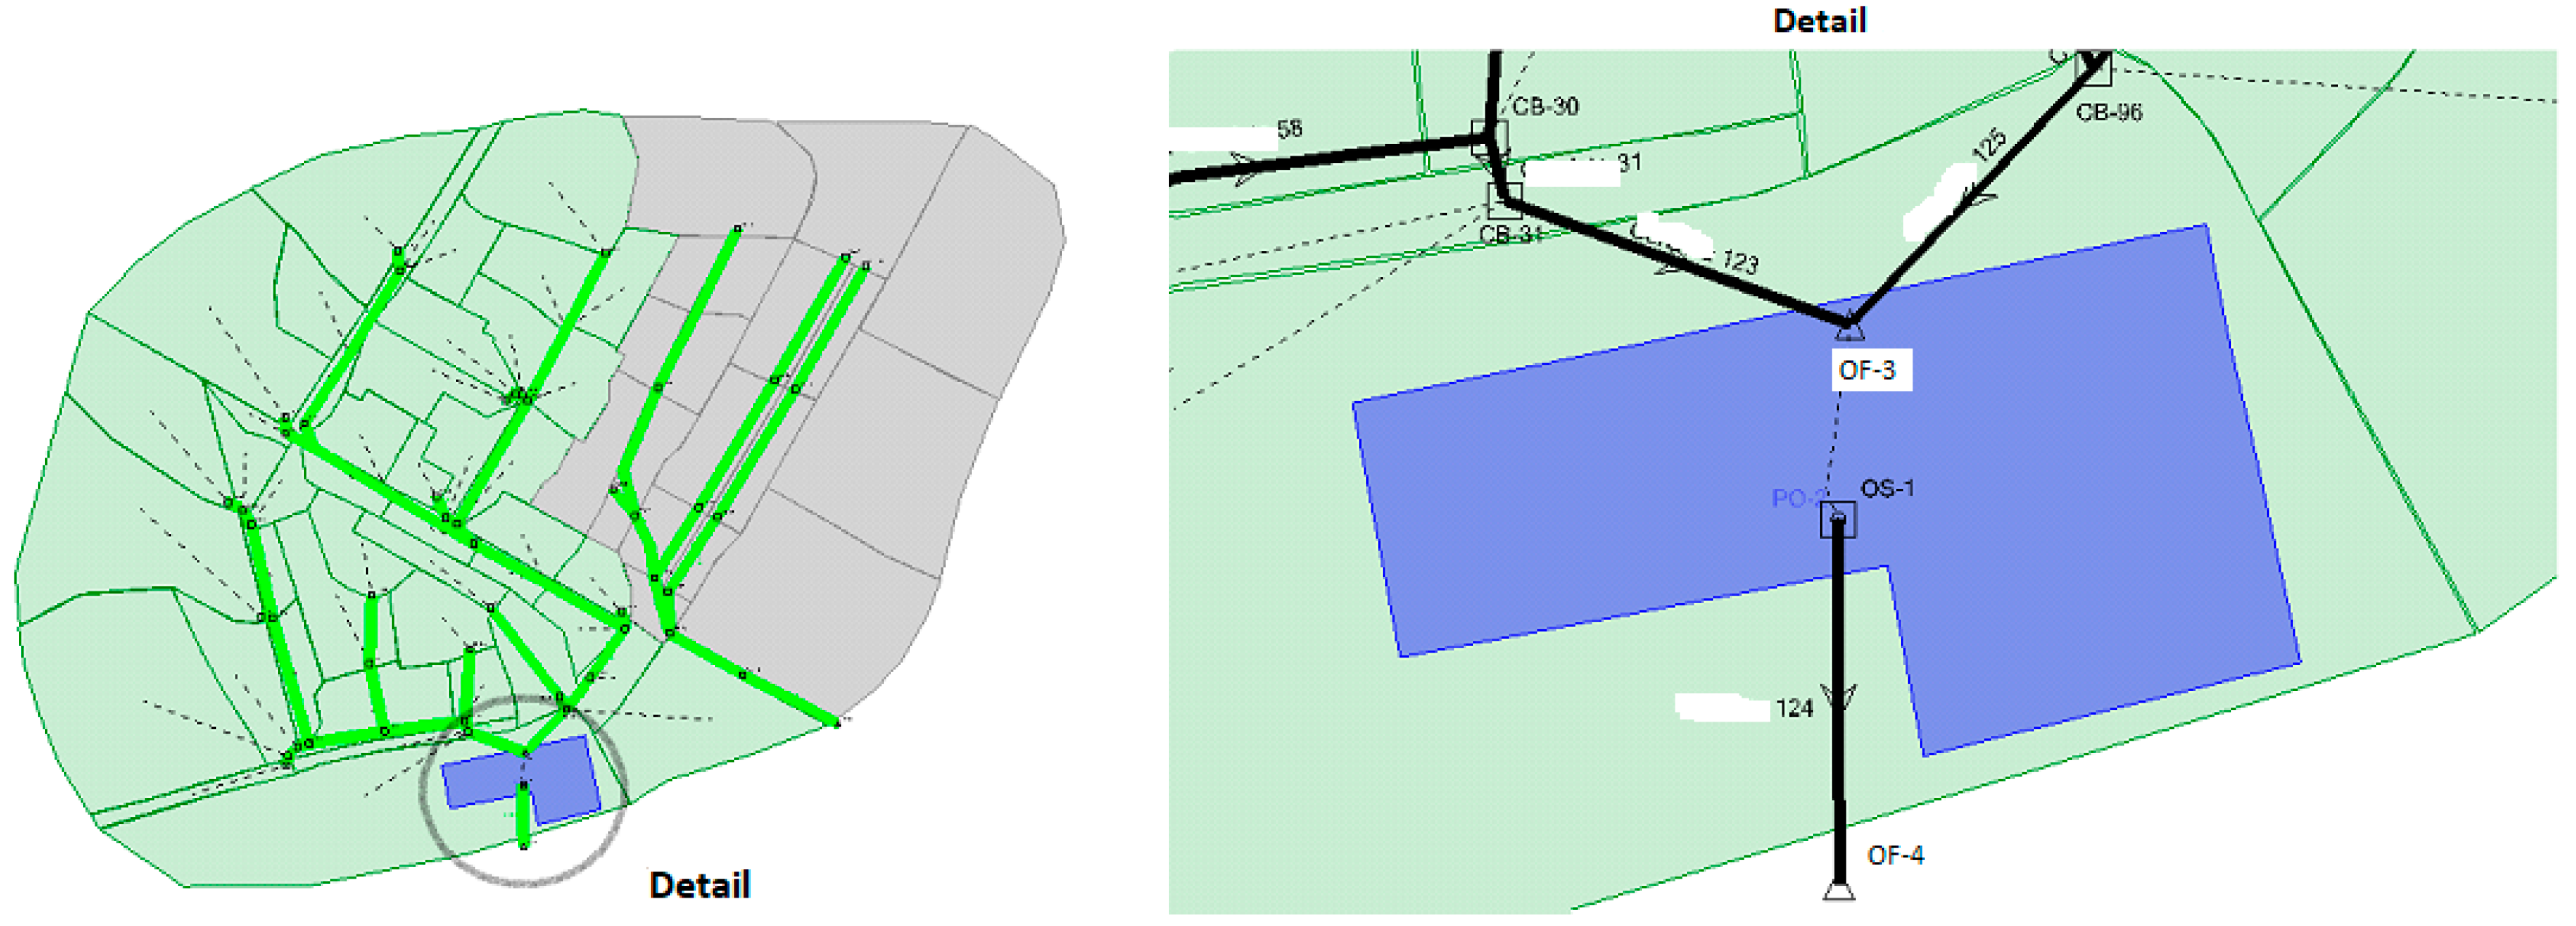
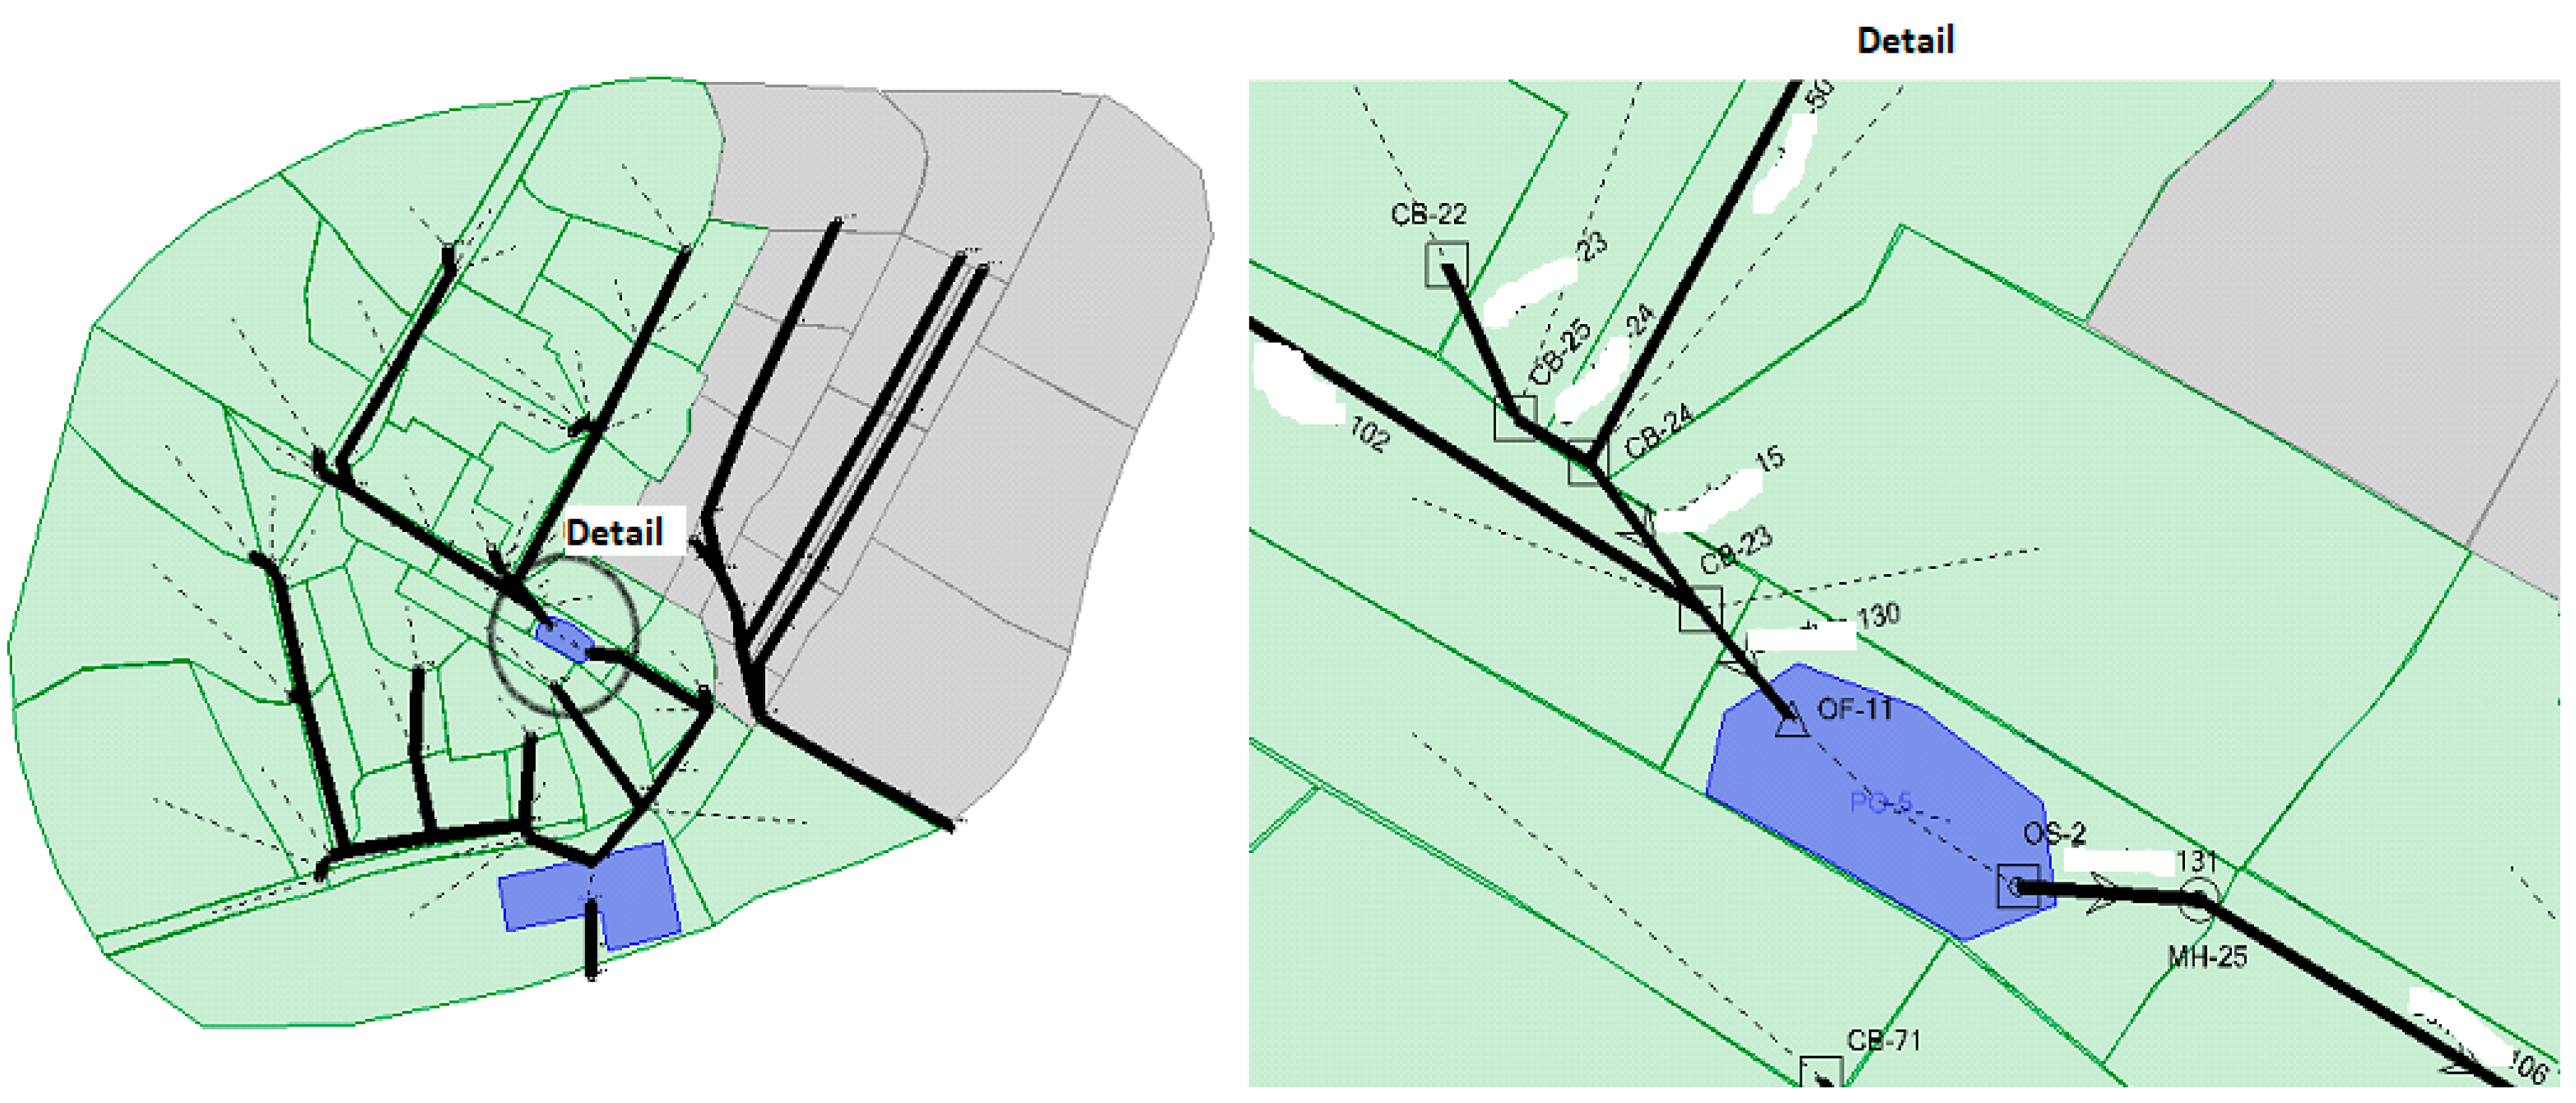
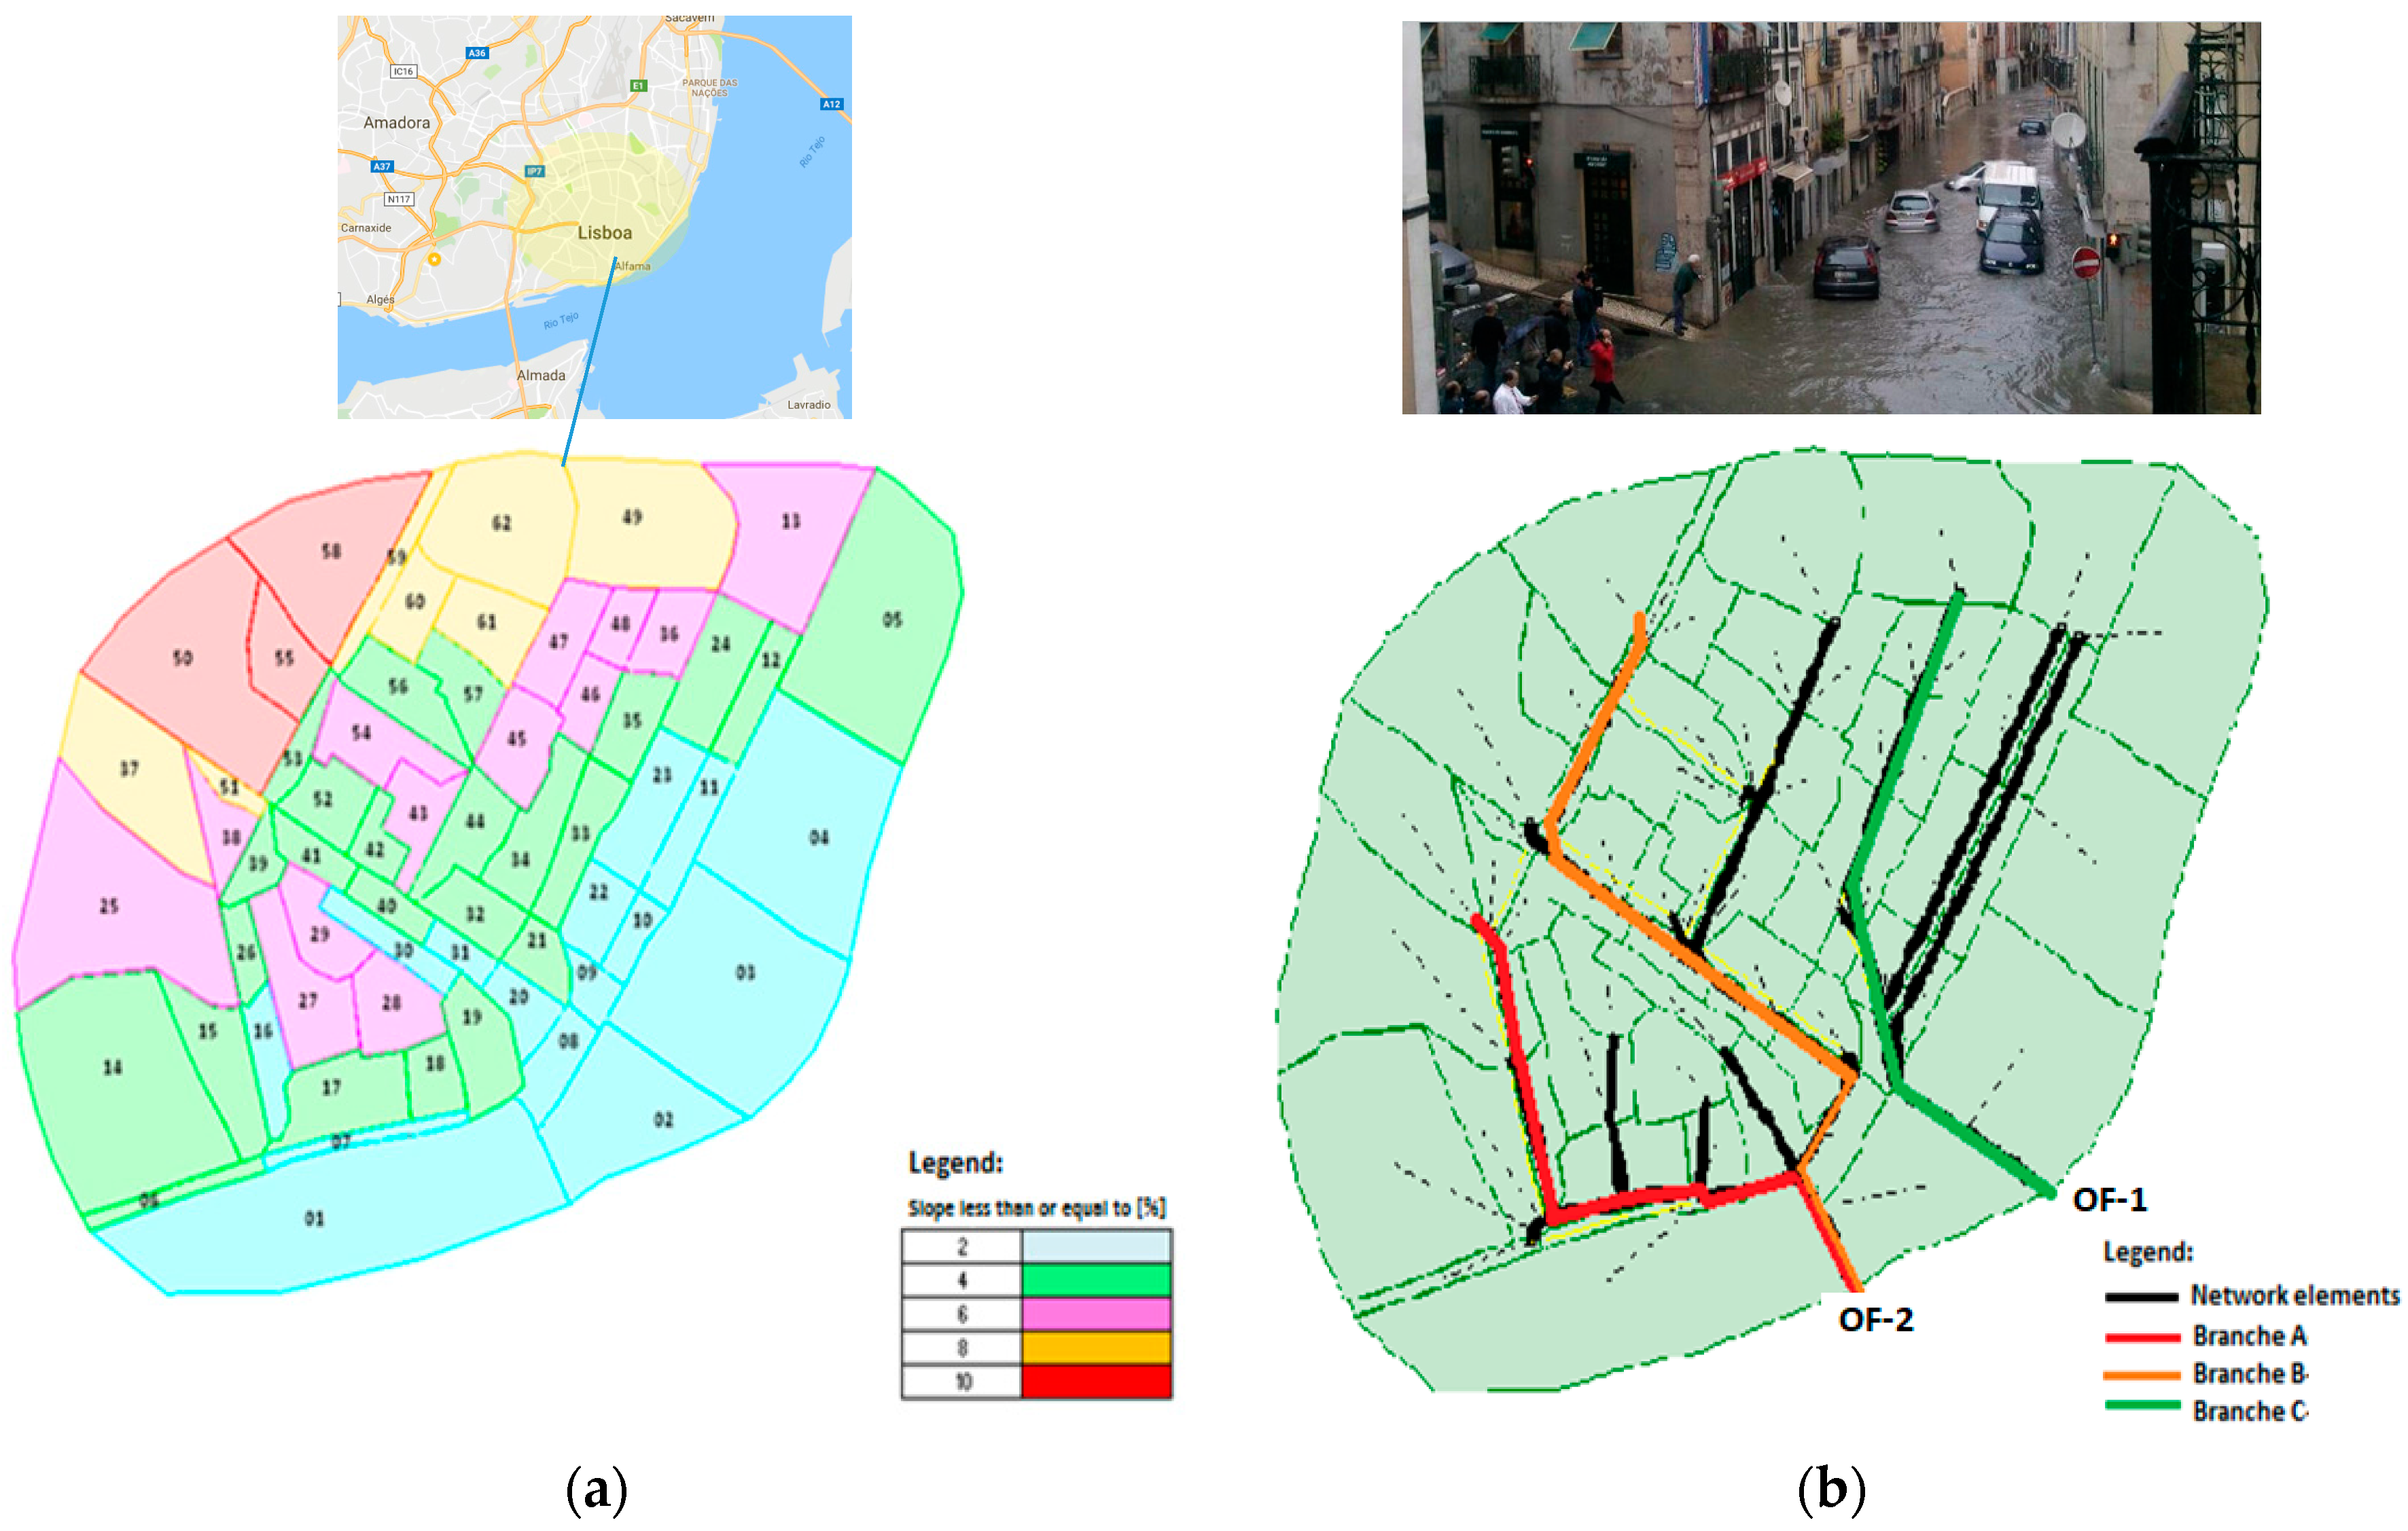
4.1. Case Study

4.1.1. Characteristics of the Studied Basin

The characteristics of the studied basin composed the base model for an approximate urban basin (Figure 4 and Table 2) in the region of Lisbon, with an area of 269,630 m2. It consists of 62 sub-basins that were defined essentially by adapting the urban area (buildings and roads), type of land use and slopes, allowing a better match to simulate the system, including the implementation of different protection elements. It was also considered that the flows are processed through the storm drainage network defined for this purpose and that the discharge exit to a water line in two different points (OF-1 and OF-2) due to the characteristics of the system. Three small-networks of drainage are defined, as identified by branches A, B and C. The small networks associated with branches A and B presents the same discharged point (OF-2), as presented in Figure 4.

4.1.2. Parameters of the Hydrological Basin

The properties of the field were assumed homogeneous for the entire basin analysis, in the presence of a soil type B and average conditions of soil moisture (AMC-II). The choice of the curve number adopted for each sub-basin was carried out according to the type of the soil occupation. The AMC I condition represents dry soils, where rainfall in the last five days does not exceed 15 mm; the AMC II condition is an average case in the flood season, where the rainfall in the last five days totals between 15 and 40 mm; and, finally, the AMC III condition corresponds to states of soils close to the saturation, where the rains in the last five days were higher than 40 mm and the meteorological conditions were unfavorable to high evaporation rates. Since the AMC II condition is normally used for determining the flow hydrograph for current drainage projects in urban drainage, the authors adopted this assumption in this study. Different return periods were used for the rain events, from two, five and ten years, to test the effectiveness of the storm water collection system, to higher return periods of 20, 50 and 100 years to test mitigation measures based on the deployment of retention reservoirs.
In this case, the intensity–duration–frequency curves (IDF) of the precipitation in Portugal are used based on some studies [20]. The area to be examined is located in the network and has been adopted the parameters of the respective IDF curves. To describe the influence on the peak flow rates of the non-uniformity of the intense precipitations over the respective durations, the used hyetographs were calculated from the parameters of the IDF curves. Thus, based on the study carried out by [20], different projects of hyetographs are established, lasting four hours and with a maximum intensity of time-centered precipitation.
The hyetographs were calculated for a total duration of 4 h (240 min), for return periods of 2, 5, 10, 20, 50 and 100 years, and durations of maximum precipitation (Dm) of 5, 15, 30, 60 and 90 min.

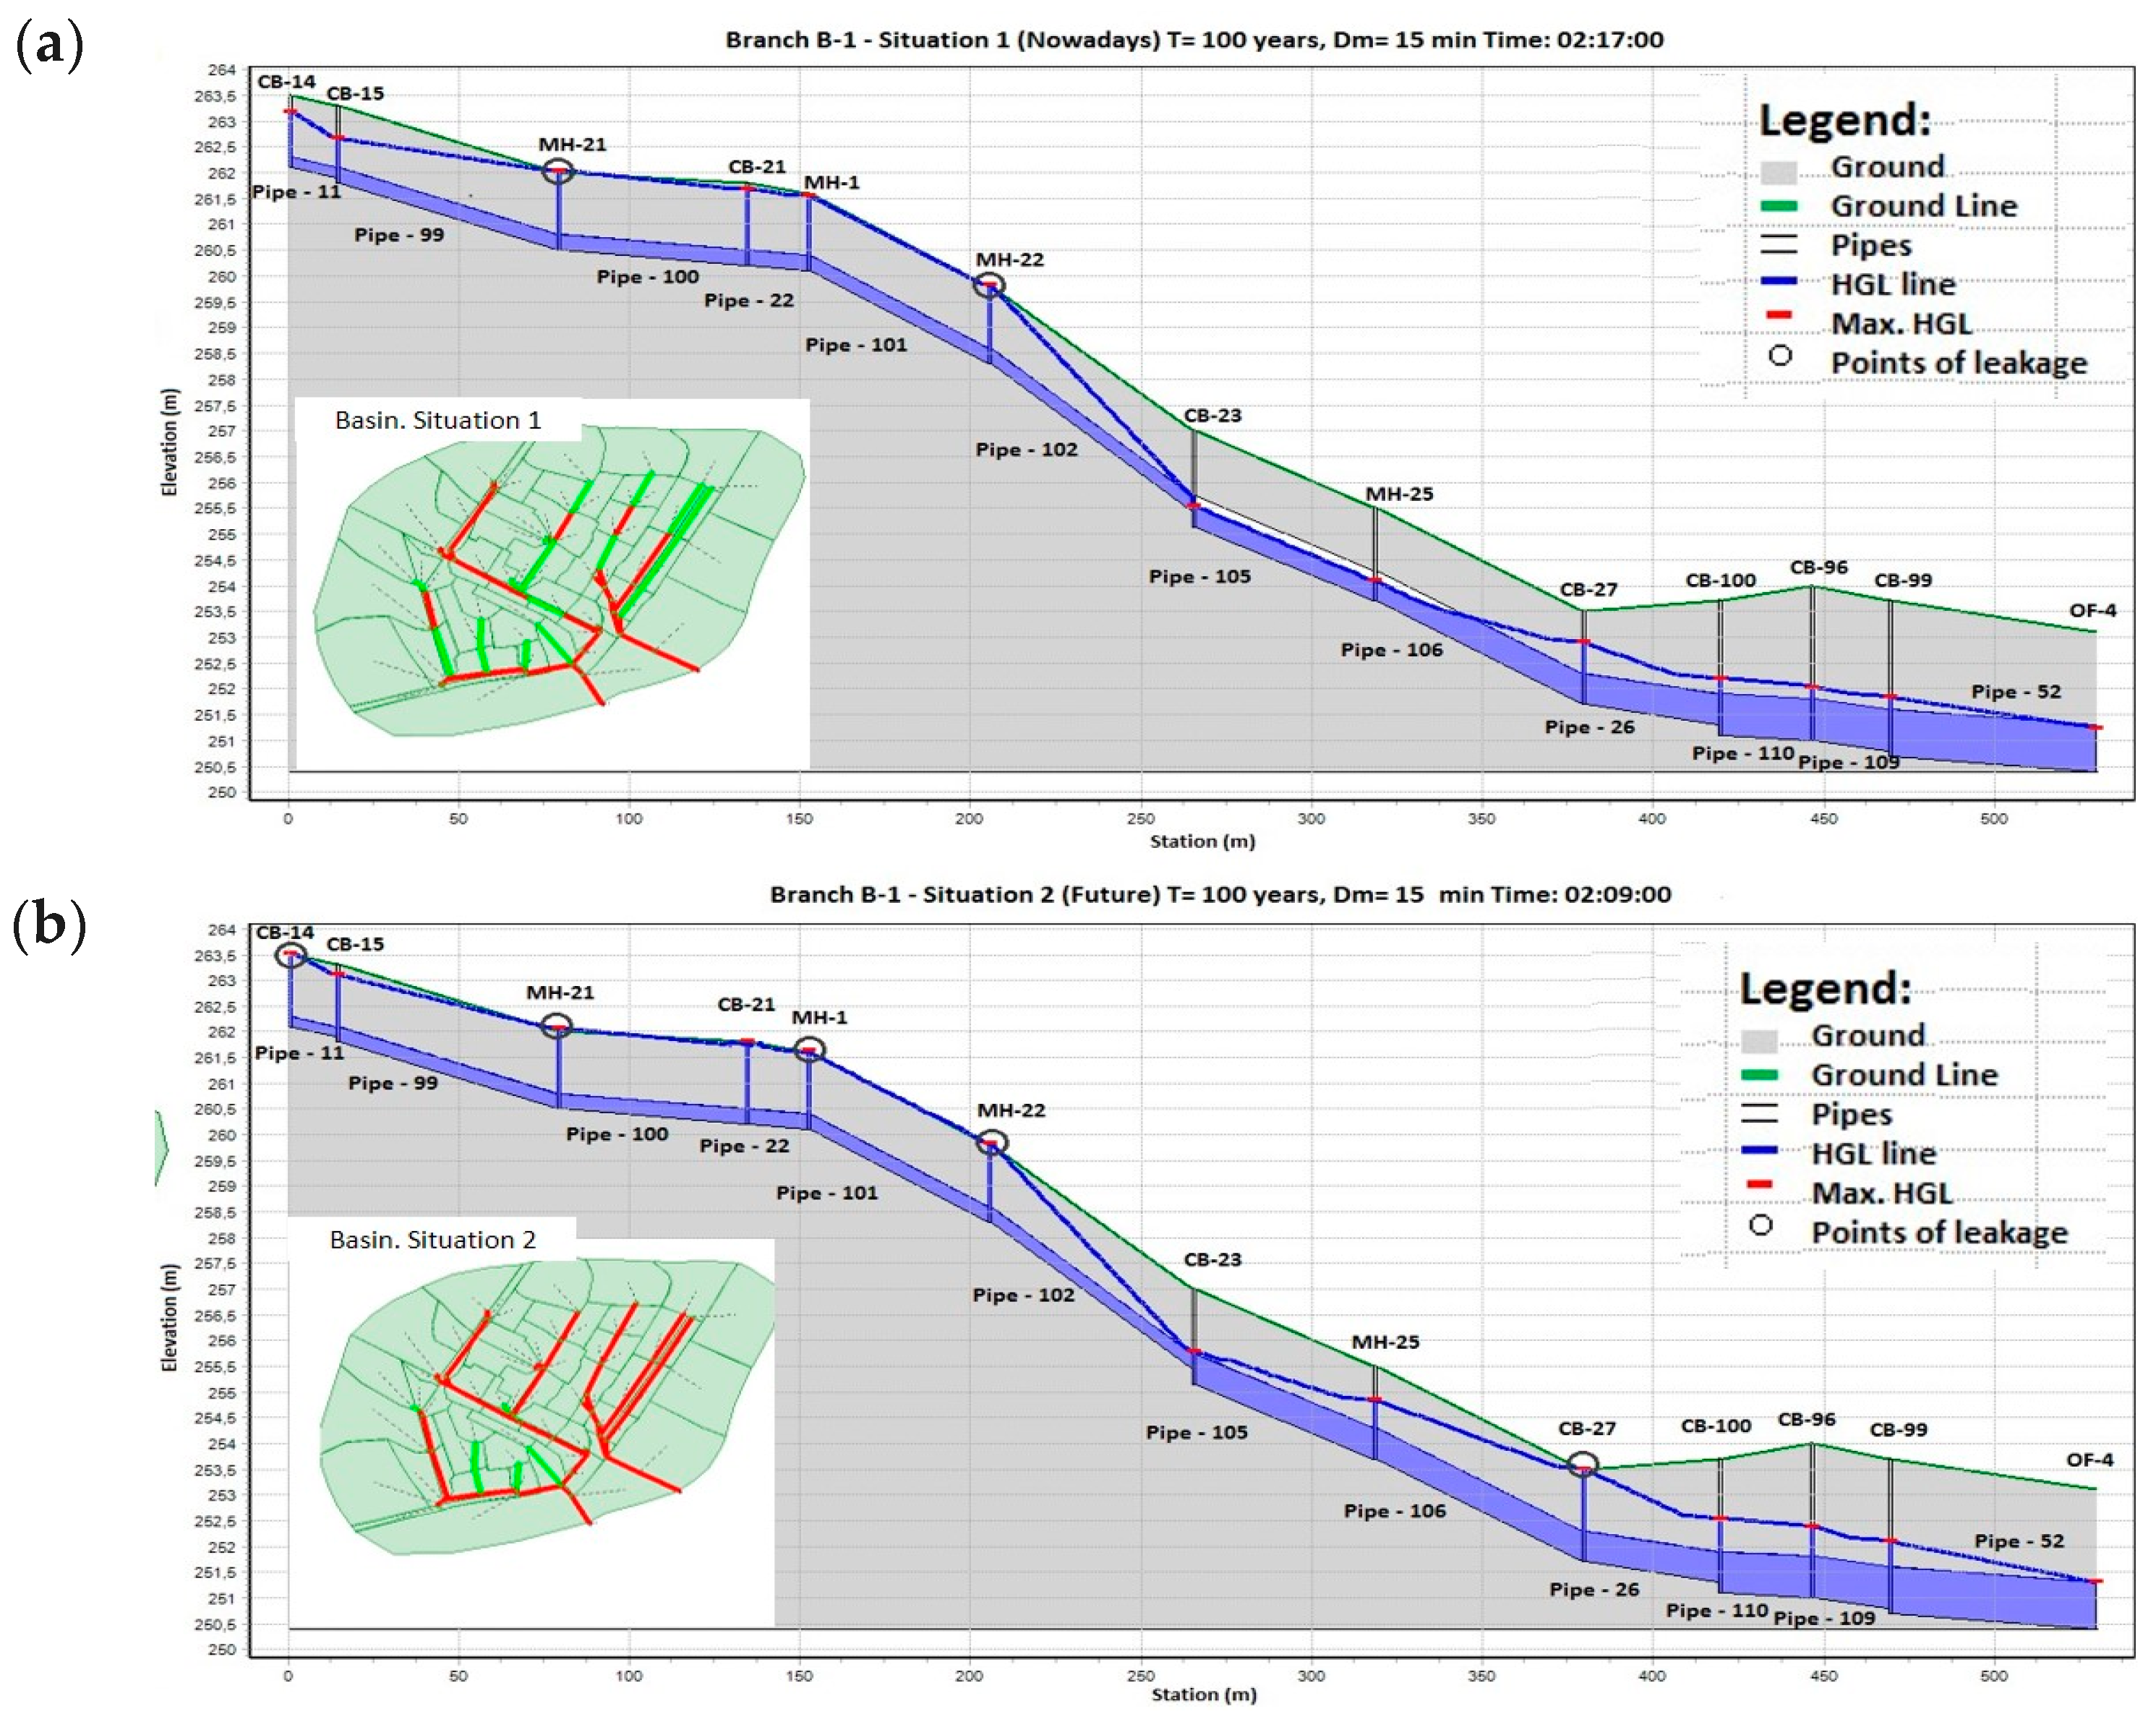
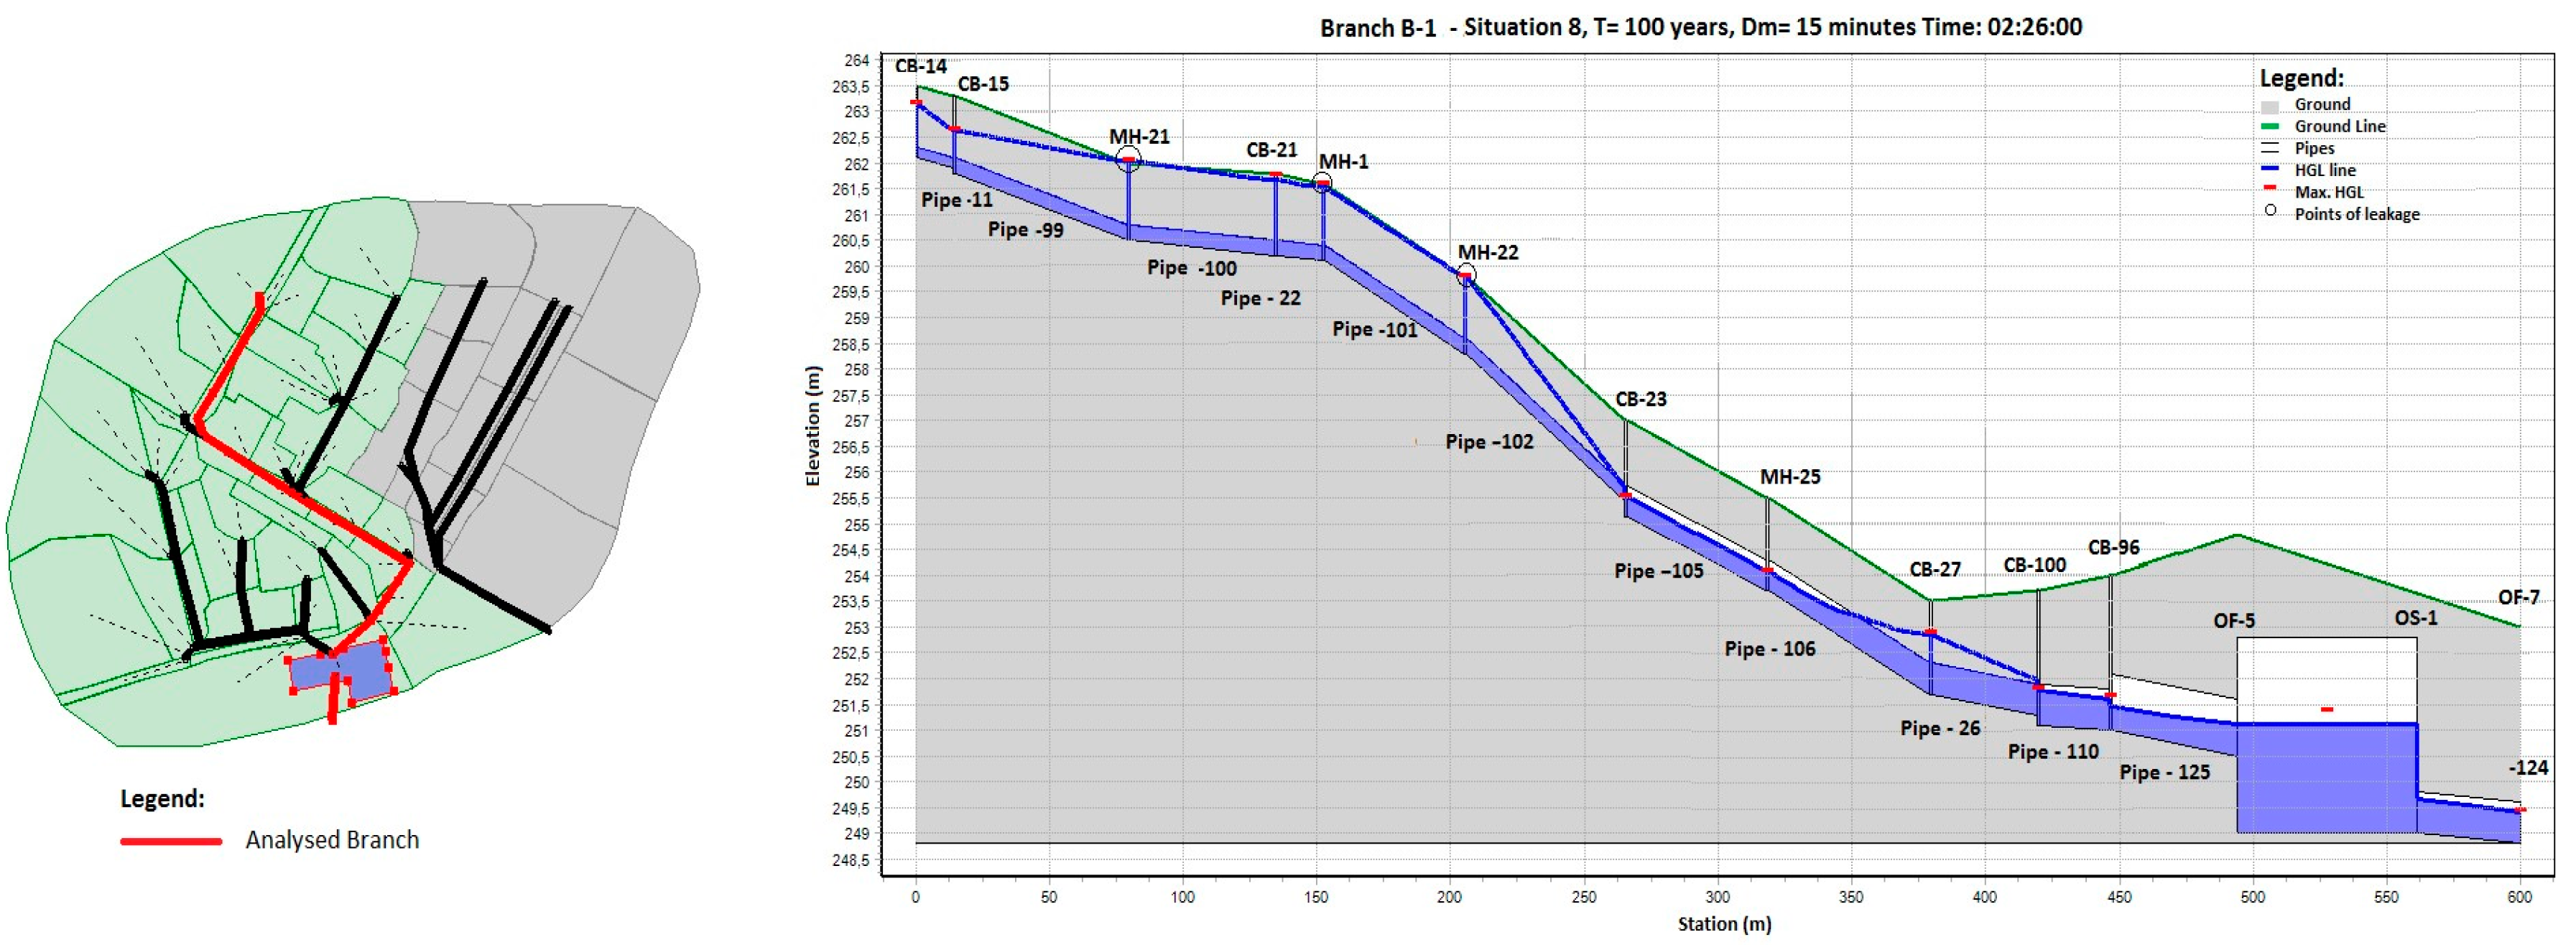
4.2. Simulated Scenarios

Within the developed analysis, different rates of impervious areas/land uses are studied as function of total area of the basin, as well as different soil types and different occupation areas. To allow conclusions to be drawn from the effects of the urbanization, a future scenario (Scenario 2) that represents an increase of impervious rate was considered. Different types of land use were analyzed for each sub-basin: green areas/vacant lots, paved roads, and residential and industrial areas (Table 3).
The analyzed scenarios are represented in Table 4, considering changes in impervious areas (Scenario 2) and evaluation of some mitigation measures, either individually or together (Scenarios 3–9). Some sections of the network were resized to verify the places where it would be necessary to intervene to not obtain any type of overflow from the network.
The analysis of the results was developed based on the more relevant output information of the system, emphasizing the highest level of overflow volumes on the manholes and the hydrographs obtained in the two discharge points (OF-1 and OF-2). In the calculation of peak flows associated with various return periods and for different scenarios, the semi-empirical method of the unit hygrogram of the Soil Conservation Service was used, with a curvilinear representation.
The application of green roofs and permeable paving was simulated for occupations of 30%, 50%, 70% and 90% impermeable area (Table 5).
The application of drainage ditches was defined as the replacing of some of the pipes that drain to the exit discharge point OF-1 by two types of ditches with trapezoidal cross-section.
The implementation of the underground reservoir led to a small rearrangement of the rainwater network, with a retained volume of 5800 m3, with a plan area of approximately 3500 m2 and a maximum height of 3.8 m. The combination of the underground reservoir with the storage blocks used a plan area of 400 m2, with a retained volume of 550 m3.

4.3. Analysis of Results

In this research, the effect of urbanization on increasing floods was analyzed, and the performance of different mitigation measures for its prevention was evaluated. Hence, based on the summary tables of results, it is possible to show the variations in the peak flow (Table 6 and Table 7) and the estimated average concentration time (Table 8) that were assessed by different methods.
Scenario 2 (with impervious areas) induced a general increase in the values of peak flows with the largest values recorded for the durations of maximum precipitation (Dm) of 5 and 15 min and return periods of 5, 10 and 20 years. The maximum rise was 0.67 m3/s, corresponding to an increase of 71% relative to Scenario 1. There is a natural increase of the flow peak from Scenario 1 (current) to Scenario 2 (future) due to more urban occupation of the basin. It is concluded that the value of the peak flow becomes more significant as the return period increases. Besides, the increase of urban area leads to a decrease in the concentration time (tc), and the durations of the maximum precipitation of 5 and 15 min are the ones that recorded the greatest decreases (maximum 11 min), corresponding to a decrease of 8% compared with the status-quo (Scenario 1).
Figure 5 represents the profiles obtained in Scenarios 1 and 2 to the main pipe branch of the network for the rainfall event for T = 100 years and Dm = 15 min. The Figure 5 shows the map of the basin, with its network of drainage pipes, red represents the locations where the flow capacity design was exceeded, while it shows the flow profiles for scenarios 1 and 2 (Figure 5a,b).
With the application of the conjugated green roofs and impervious paving, for an occupation of 30% of the total impermeable area (Scenario 3), the maximum reduction in the peak flow is 0.25 m3/s, which equals a reduction of 20% of the registered value in Scenario 2. For an occupation of 50% in the impervious areas (Scenario 4), the maximum reduction in the peak flow is 0.34 m3/s, which equals a 27% reduction. For occupations of 70% and 90% (Scenarios 5 and 6), the maximum reductions in the peak flow are 0.38 m3/s and 0.37 m3/s, respectively, corresponding to 28% reductions in the peak flow in both cases.
Through the comparison of these scenarios, it is possible to verify that, for occupations of 30% and 50% (Scenarios 3 and 4), the maximum reductions in the peak flow are registered for return periods of 5 and 10 years and durations of the maximum precipitation of 5 and 15 min. For occupations of 70% and 90% (Scenarios 5 and 6), the maximum reductions in the peak flow are registered for return periods of 10 and 20 years and durations of the maximum precipitation of 15 and 30 min.
The application of drainage ditches in Scenario 1 leads to a maximum reduction in the peak flow of 0.05 m3/s, and, for Scenario 2, the maximum reduction would be 0.14 m3/s, which is equivalent to 6% and 12% reductions, respectively. Hence, it was verified that this type of measure leads to low reductions in the case of being applied to Scenario 1, and, when applied to Scenario 2, the rainfall events with return periods greater than 10 years and durations of maximum precipitation of 5 and 15 min are those that register the highest percentages of reduction. Related to the time to peak, it is verified that this type of measure exerts a small influence on it, translated in a maximum increase of 9 min, equivalent to 7%.
One concludes that the implementation of drainage ditches, when compared with the implementation of green roofs and permeable paving, leads to better results in the reduction of peak flows for events with raised return periods (100 years), and to a lesser effectiveness for the remaining return periods. The implementation of green roofs and permeable paving discloses the biggest effectiveness of storage for rainfall events of lesser duration.
When comparing the reductions in the time to the peak flow, bigger benefits are verified with the implementation of the drainage ditches.
The application of the underground reservoir (Scenario 8) leads to a maximum reduction in the peak flow of 0.89 m3/s compared with Scenario 1, and a reduction of 1.15 m3/s compared to Scenario 2, representing reductions of 49% and 55%, respectively. For this measure, reductions in the peak flow increases with the increasing of the return period for the simulated event. For the same return period, the greatest reductions are registered in the events with lower durations of maximum precipitation (5 and 15 min). In this particular case, the retention pond begins to present satisfactory results for events with return periods greater or equal to 20 years when applied to Scenario 1 and with return periods greater or equal to five years when applied to Scenario 2.
Hence, it is concluded that, for this studied basin, in comparison with the mitigation measures former referred, the application of retention ponds (Figure 6) is a good option to accomplish the storage water for events with high return periods and lower durations of the maximum precipitation (5 to 30 min).
The use of retention ponds equally leads to increase in the time of the peak flow, due to the accomplished lag of flow propagation, being registered maximum increases of 30 min, corresponding to an average increase percentage of 24% relative to scenarios without pond. With the similarity of what occurs in the reductions of peak flows, the highest increases in the time to the peak flow appear in events with high return periods and low durations of the maximum precipitation. From the conjugation between the retention ponds and the blocks of storage, it can be concluded that, in terms of reduction of peak flow, both had not brought great improvements (maximum of 0.06 m3/s). Apart from this, the addition in the time to the peak flow leads to a maximum increase of 38 min, registering an increase of 29% towards the scenarios without application of these measures. Hence, the joint application of such measures allows obtaining the highest values for the time to the peak flow, leading to a bigger lag between the affluent and the effluent hyetograph. This measure in comparison with all the others applied leads to the biggest increase of the time to the peak flow. Table 9, Table 10 and Table 11 represent the peak flow volumes in all simulations.
The information of the peak flow volumes for the network must be analyzed with parsimony, since not all of the characteristics of the flood areas were known. Thus, for both exit discharge points, the system of pluvial draining registers the biggest peak flow volumes for a duration of maximum precipitation of 15 min, being the maximum value for Scenario 1 of 170 m3 and 773 m3 for Scenario 2. Thus, the urbanization process leads in its extreme case to an increase of 455% of the peak flow volume.
Hence, for higher return periods (50 and 100 years), the system shows the highest values of the peak flow volumes, with many places flooded in the network system and a larger number of pipelines operating with overpressure, because, in these rainfall events, the higher incidence of the urbanization and their effects are notorious in the increase of the runoff into the system.
The combined application of the green roofs and the permeable paving allows solving the peak flows for the intermediate return periods (10–20 years), and equally for the highest durations of the maximum precipitation (90 min) and higher return periods (50–100 years). In this type of measures, the biggest reductions in the overflow volumes were registered for the events with higher return periods (50 and 100 years), and with durations of the maximum precipitation of 15 and 30 min, being possible to reach percentages of peak flow volume reduction of 78% compared with Scenario 2. Hence, this type of measure is most suitable and effective in rainfall events with lower return periods and lower durations of the maximum precipitation. However, the percentages of occupation in the system efficiency may not be economically viable, just in Scenarios 5 and 6, where it is verified that the maximum reduction of the peak flow volume is 11%.
The implementation of drainage ditches (Scenario 7) when applied to Scenario 1 leads to a minimization of the peak flow volumes, although its efficiency is not high since the existing peak flow corresponds to small localized flooding, due solely to the under-sizing of harvesting structures. For Scenario 2, it was concluded that the greatest reductions are recorded for the lower durations of the maximum precipitation (5 and 15 min), and that this mitigation measure presents better results for higher return periods.
Comparing the application of drainage ditches with the joint solution of green roofs and permeable paving, it is possible to see that the first one is the best measure for rainfall events with high return periods and low durations of the maximum precipitation. It is still possible to verify that, in the case of application of green roofs and permeable paving with occupations of ≥50%, the results must be analyzed with stinginess because those measures do not have into account the related effects of loss of capacity by clogging and by lack of maintenance, factors that are quite determinant.
With the application of a retention pond (Scenario 8) and comparing with Scenarios 1 and 2, a maximum decrease is recorded in the peak flow volume of 125 m3 and 514 m3, corresponding to reductions of 73% and 66%, respectively. Comparing the implementation of green roofs and permeable paving with the implementation of the retention ponds, the results exhibit greater efficacy in events with higher return periods.
Figure 7 shows the profile of the main pipe branch of the drainage network for the rainfall event T = 100 years and Dm = 15 min, after the application of a retention pond in Scenario 1.
There are still peak flows, although the retention pond capacity never approaches the maximum limit. This reveals that some elements exist in the system with the capacity to carry the runoff originated by some extreme rainfall events.
With the combination of a retention pond and blocks of storage, it is possible to get maximum reductions in the peak flow volume of 163 m3 for Scenario 1 and 617 m3 for Scenario 2, equivalent to reductions of 96% and 80%, respectively (Figure 8).
Thus, the comparison of results obtained in Scenarios 8 and 9 (Figure 9), shows that increasing the return periods of the rainfall events increases the effectiveness in reducing the peak flow volume, being the durations of the maximum precipitation of 5 and 15 min, which show the highest values.
In conclusion, there is no ideal and general solution to these problems of urban floods and the optimization of a combination of different measures results in the best step to get the best solution. This type of research work is now essential for systemic systems of floods and urban inundation areas adaptation and prevention, requiring urban interventions in a systematic and controlled way, especially in small hydrologic basins, allowing a better control of the hydric resources and collecting strategic information for possible mitigation actions.

5. Conclusions

In this research, it is demonstrated that the volumes generated due to the impervious areas of the ground in urban areas can exceed the capacity of draining of the existing pluvial system network. The hydraulic and hydrological behavior of a small hydrographic basin in the continuation of the urbanization process is analyzed, with the modification of its superficial covering and growth of the built-up area. As a way to translate the occupation of the ground of the hydrographic basin for different scenarios, suitable parameters were chosen for the curve number, depending on the soil and rainfall events.
Several computational simulations were developed using the CivilStorm model of Bentley systems, for the current scenario of the basin, or for a scenario of urban expansion, by evaluating peak flow volumes contemplated by the Soil Conservation Service (SCS) technique.
With the combination of the retention ponds and blocks of storage, it is possible to get maximum reductions in peak flow volumes for Scenarios 1 and 2 equivalent to 96% and 80%, respectively. Thus, the comparison of results obtained in Scenarios 8 and 9, shows the increasing of return periods of the rainfall events. In this case, the effectiveness increases, reducing the peak flow volume, being the durations of the maximum precipitation of 5 and 15 min, which show the highest values. Therefore, the best use of this type of mitigation measure will be more suitable for intermediate return periods (10–20 years), which depend on the type of civil works, social and environmental components that can be damaged. It also leads to an average increase of 5% in the time of the peak flow, equivalent approximately to 7 min. Finally, no absolute or typical solution to the problem of urban floods can be pointed out as a best practice rule. On the contrary, it was verified that the combination of different measures can lead to the advised best solution.
Several structural and other measures are presented to solve the flood scenarios where the generated volumes by the impervious areas of the urban ground can exceed the capacity of the existing drainage system. Based on computational simulations, the efficiency of the following application in a hydrographic basin were analyzed: retention ponds, permeable paving, green roofs, underground storage and grassed swales, pondering the viability of their operation individually or combined. For the analyzed urban area, the option that best minimizes the effects of the urbanization process in the flood events is the combination of different measures: namely, the application of a retention pond and/or storage blocks, ditches, or equivalent drainage interventions in some parts of the network.

Acknowledgments

The authors want to thank the project REDAWN (Reducing Energy Dependency in Atlantic Area Water Networks) EAPA_198/2016 from INTERREG ATLANTIC AREA PROGRAMME 2014–2020 and CERIS (CEHIDRO-IST). The authors also thank the program to support the academic career at the faculty of the Universitat Politècnica de València 2016/2017 in the project “Maximization of the global efficiency in PATs (Pumps as Turbines) in laboratory facility” of the Modesto Pérez-Sánchez.

Author Contributions

Helena M. Ramos contributed the idea, wrote and revised the document, and supervised the whole research. A. Bento Franco was involved in the writing and analyses of results. Modesto Pérez-Sánchez performed the simulations. P. Amparo López-Jiménez revised the final document.

Conflicts of Interest

The authors declare no conflict of interest. The founding sponsors had no role in the design of the study; in the collection, analyses, or interpretation of data; in the writing of the manuscript, and in the decision to publish the results.

Abbreviations

The following abbreviations are used in this manuscript:
EEAEuropean Environment Agency
IDFIntensity–duration–frequency curves
SCSSoil Conservation Service
SUDSustainable Urban Drainage
SUDSSustainable Urban Drainage Systems

References

  1. Santos, R. Urban Floods and Constructive Measures for Its Mitigation. Master’s Thesis, Universidade Técnica de Lisboa (I.S.T), Lisbon, Portugal, 2011. [Google Scholar]
  2. Neal, J.; Villanueva, I.; Wright, N.; Willis, T.; Fewtrell, T.; Bates, P.D. How much physical complexity is needed to model flood inundation? Hydrol. Process. 2012, 26, 2264–2282. [Google Scholar] [CrossRef]
  3. Miller, J.D.; Hutchins, M. The impacts of urbanisation and climate change on urban flooding and urban water quality: A review of the evidence concerning the United Kingdom. J. Hydrol. Reg. Stud. 2017, 12, 345–362. [Google Scholar] [CrossRef]
  4. Néelz, S.; Pender, G. Benchmarking of 2D Hydraulic Modelling Packages, SC080035/SR2; Environment Agency: Bristol, UK, 2010.
  5. Jha, A.K.; Lamond, R.B.J. Cities and Flooding: A Guide to Integrated Urban Flood Risk Management for the 21st Century; World Bank: Washington, DC, USA, 2012; ISBN 978-0-8213-9477-9. [Google Scholar]
  6. Costabile, P.; Costanzo, C.; Macchione, F. Performances and limitations of the diffusive approximation of the 2-D shallow water equations for flood simulation in urban and rural areas. Appl. Numer. Math. 2017, 116, 141–156. [Google Scholar] [CrossRef]
  7. Ashley, R.M.; Balmforth, D.J.; Saul, A.J.; Blansk, J.D. Flooding in the future–predicting climate change, risks and responses in urban areas. Water Sci. Technol. J. Int. Assoc. Water Pollut. Res. 2005, 5, 265–273. [Google Scholar]
  8. Fowler, H.J.; Wilby, R.L. Detecting changes in seasonal precipitation extremes using regional climate model projections: implications for managing fluvial flood risk. Water Resour. Res. 2010, 46, 1–17. [Google Scholar] [CrossRef]
  9. Jacobson, C.R. Identification and quantification of the hydrological impacts of imperviousness in urban catchments: A review. J. Environ. Manag. 2011, 92, 1438–1448. [Google Scholar] [CrossRef] [PubMed]
  10. Perales-Momparler, S.; Hernández-Crespo, C.; Vallés-Morán, F.J.; Martín-Monerris, M.; Andrés-Doménech, I.; Álvarez, J.A. SUDS efficiency during the start-up period under Mediterranean climatic conditions. CLEAN-Soil Air Water 2014, 2, 178–186. [Google Scholar] [CrossRef]
  11. Brath, A.; Montanari, A.; Moretti, G. Assessing the Effects on Flood Risk of the Land-Use Changes in the Last Five Decades: an Italian Case Study. In Proceedings of the International Symposium ‘Hydrology of Meditterranean and Semiarid Regions’, Montpellier, France, 1–4 April 2003. IAHS Publications, No. 278. [Google Scholar]
  12. Hutchins, M.G.; McGrane, S.J.; Miller, J.D. Integrated modeling in urban hydrology: Reviewing the role of monitoring technology in overcoming the issue of ‘big data’ requirements. Water 2016, 4, 1–24. [Google Scholar] [CrossRef]
  13. Fordham, M. Participatory Planning for Flood Mitigation: Models and Approaches. In Floods Volume II; Parker, D.J., Ed.; Routledge: London, UK, 2000; pp. 66–79. [Google Scholar]
  14. Ramos, H.M. Mathematic Models for Simulation Unsteady Flows in Open Channels. Master’s Thesis, Universidade Técnica de Lisboa (I.S.T), Lisbon, Portugal, 1986. (In Portuguese). [Google Scholar]
  15. Geldof, G.D. Adaptative water management: Integrated water management on the edge of chaos. Water Sci. Technol. 1995, 32, 7–13. [Google Scholar]
  16. CivilStorm® Comprehensive Stormwater Modeling and Analysis. Available online: https://www.bentley.com/pt/products/product-line/hydraulics-and-hydrology-software/civilstorm (accessed on 15 March 2017).
  17. Wilson, S.; Bray, R.; Cooper, P. Sustainable Urban Drainage Systems; Hydraulic, Structural and Water Quality Advice (C609); CIRIA: London, UK, 2004. [Google Scholar]
  18. Shaffer, P.; Elliott, C.; Reed, J.; Holmes, J.; Ward, M. Model Agreements for Sustainable Water Management Systems, Model Agreement for Rainwater and Greywater Use Systems; CIRIA: London, UK, 2004. [Google Scholar]
  19. Virginia Department of Conservation and Recreational Resources. Stormwater Management Handbook: Implementing Green Infrastructure in Northern Kentucky Communities; Nevue Ngan Associates Eisen: Portland, OR, USA; Letunic Van Meter Williams Pollack LLP ICF International: Fairfax, VA, USA, 2009.
  20. Brandão, C.; Hipólito, J.N. Curvas de Possibilidade Udométrica (IDF) para Aveiro, Lisboa, Évora e Faro. Revista da APRH 1997, 18, 45–52. [Google Scholar]
Figure 1. Influence of the geometry of basins and associated flood hydrographs of peak flow (Q).
Fluids 02 00061 g001
Figure 2. Comparison of conventional drainage systems and sustainable urban drainage systems (SUDS).
Fluids 02 00061 g002
Figure 3. Examples of structural flood mitigation measures: (a) retention basin; (b) detention pond; (c) infiltration pond; (d) drainage ditches; (e) flow discharge and flow energy control (with parallel and series retention basins); (f) infiltration trenches; (g) detention swales; (h) plants tolerant to flooding and erosion resistance; (i) structural shapes for permeable parking; (j) permeable paving; (k) micro reservoirs; (l) green roofs; (m) rain gardens; (n) pluvial seedbeds; (o) individual infiltration; (p) storage blocks with drainage ditches; (q) modular storage of ground water runoff.
Fluids 02 00061 g003
Figure 4. Studied area, flood event and identification of sub-basins for the simulation model and level of slopes (a); and the network of the storm drainage system (b).
Fluids 02 00061 g004
Figure 5. Representation of the network and profiles of the main pipe branch for Scenarios 1 and 2 (T = 100 years and Dm = 15 min), (a) Scenarios 1 (nowadays) and (b) Scenarios 2 (future).
Fluids 02 00061 g005
Figure 6. Representation of a retention pond.
Fluids 02 00061 g006
Figure 7. Profile of the main pipe branch after the application of a retention pond in the Scenario 1 (T = 100 years and Dm = 15 min).
Fluids 02 00061 g007
Figure 8. Combination of a retention pond and blocks of storage.
Fluids 02 00061 g008
Figure 9. Profile of the main pipe branch after the application of a retention pond in the Scenario 2 (T = 100 years and Dm = 15 min).
Fluids 02 00061 g009
Table 1. Constructive causes and associated impacts.
Constructive CausesImpacts
Removal of Native VegetationIncreased volume of runoff and maximum flows
Increased runoff velocity
Increased vulnerability of the land against erosion
Deposition of sediments leading to blockages in pipes and streams
Implantation of Artificial Drainage NetworkSignificant increase in runoff velocity and peak flows
Inadequate drainage works, e.g., diameters of pipes with reduced cross-section leading to extensions of the inundation areas
Construction in River AreasExposure to flooding in areas naturally flooded
Expansion of wetlands and localized flooding resulting from reductions in sections of the drainage system
Table 2. Summary of main characteristics of the basin.
Area (km2)Perimeter (km)Length of the Main Line (km)Mean Elevation (m)Maximum Elevation/
Minimum Elevation (m)
Average Slope (%)
0.271.900.526065/534.5
Table 3. Land use for Scenarios 1 (nowadays) and Scenarios 2 (future).
ScenarioType of
Land Use
Area (m2)Occupied Area (%)ScenarioType of Land UseArea (m2)Occupied Area (%)
1 (Nowadays)Green areas/
vacant lots
167,320622 (Future)Green areas/
vacant lots
109,13041
Built up areas88,89033Built up areas143,27053
Paved areas13,4205Paved areas17,2306
Table 4. Summary of simulated scenarios.
ScenarioFeaturesScenarioFeatures
1Current occupation of the study area6Green roofs and permeable paving applied to 90% of impermeable areas
2Future occupation of the study area7Application of drainage ditches
3Green roofs and permeable paving applied to 30% of impermeable areas8Application of a retention pond
4Green roofs and permeable paving applied to 50% of impermeable areas9Application of a retention pond and underground storage blocks
5Green roofs and permeable paving applied to 70% of impermeable areas10Resizing some parts of the drainage network in combination with other scenarios
Table 5. Occupation areas for different simulated situations.
ScenariosPercentage of Occupation (%)Permeable Paving Areas (m2)Green Roofs Areas (m2)Total Area of Application (m2)
330516942,98148,150
450861571,63580,250
57012,061100,289112,350
69015,507128,943144,450
Table 6. Summary results with changes in the peak flow at the exit discharge point OF-1.
T (years)Dm (min)Variations in the Peak Flow (m3/s)
Scenario 2 vs. 1Scenario 3 vs. 2Scenario 4 vs. 2Scenario 5 vs. 2Scenario 6 vs. 2Scenario 7 vs. 1Scenario 4 vs. 2
Discharge Point OF-1
250.16−0.08−0.08−0.08−0.080.00−0.01
150.13−0.07−0.08−0.08−0.080.00−0.01
300.09−0.06−0.07−0.07−0.070.00−0.01
600.06−0.04−0.05−0.05−0.050.00−0.01
900.04−0.03−0.04−0.04−0.040.000.00
550.28−0.12−0.14−0.15−0.15−0.01−0.01
150.22−0.10−0.13−0.14−0.14−0.01−0.02
300.14−0.07−0.10−0.11−0.110.00−0.02
600.08−0.05−0.07−0.08−0.08−0.01−0.01
900.06−0.03−0.05−0.07−0.07−0.01−0.01
1050.34−0.12−0.16−0.17−0.17−0.01−0.04
150.27−0.11−0.15−0.17−0.17−0.01−0.02
300.16−0.07−0.11−0.13−0.14−0.01−0.02
600.09−0.04−0.07−0.09−0.10−0.01−0.01
900.07−0.04−0.06−0.08−0.09−0.01−0.01
2050.35−0.11−0.09−0.17−0.18−0.01−0.09
150.30−0.07−0.16−0.19−0.19−0.02−0.12
300.18−0.08−0.13−0.15−0.16−0.01−0.01
600.10−0.05−0.08−0.11−0.12−0.01−0.01
900.07−0.03−0.06−0.08−0.09−0.02−0.01
5050.30−0.10−0.08−0.11−0.12−0.02−0.09
150.31−0.04−0.05−0.06−0.07−0.03−0.13
300.19−0.04−0.05−0.17−0.18−0.02−0.03
600.11−0.05−0.09−0.12−0.14−0.02−0.02
900.07−0.04−0.07−0.09−0.11−0.01−0.01
10050.17−0.04−0.05−0.05−0.04−0.04−0.10
150.26−0.03−0.04−0.09−0.09−0.05−0.14
300.14−0.04−0.05−0.08−0.09−0.02−0.03
600.10−0.02−0.07−0.12−0.15−0.02−0.03
900.07−0.05−0.07−0.09−0.12−0.01−0.02
Table 7. Summary results with changes in the peak flow at the exit discharge point OF-2.
T (years)Dm (min)Variations in the Peak Flow (m3/s)
Scenario 2 vs. 1Scenario 3 vs. 2Scenario 4 vs. 2Scenario 5 vs. 2Scenario 6 vs. 2Scenario 8 vs. 1Scenario 8 vs. 2Scenario 9 vs. 1Scenario 8 vs. 1
Discharge Point OF-2
250.45−0.21−0.24−0.24−0.24−0.01−0.26−0.02−0.27
150.37−0.19−0.24−0.24−0.24−0.02−0.19−0.02−0.19
300.24−0.14−0.18−0.18−0.19−0.01−0.06−0.01−0.06
600.15−0.09−0.13−0.13−0.14−0.01−0.03−0.01−0.04
900.11−0.07−0.10−0.11−0.110.00−0.010.00−0.01
550.65−0.21−0.28−0.30−0.31−0.13−0.65−0.13−0.66
150.56−0.25−0.34−0.36−0.37−0.15−0.60−0.15−0.60
300.36−0.19−0.28−0.30−0.30−0.11−0.35−0.11−0.36
600.21−0.12−0.18−0.21−0.22−0.03−0.12−0.03−0.12
900.15−0.09−0.14−0.18−0.19−0.02−0.07−0.02−0.07
1050.67−0.18−0.28−0.32−0.34−0.29−0.85−0.29−0.86
150.59−0.21−0.32−0.36−0.37−0.34−0.79−0.34−0.81
300.42−0.21−0.32−0.37−0.38−0.26−0.56−0.26−0.57
600.24−0.13−0.21−0.26−0.28−0.12−0.27−0.12−0.28
900.17−0.10−0.16−0.20−0.23−0.06−0.16−0.06−0.16
2050.52−0.14−0.12−0.21−0.22−0.48−0.90−0.49−0.91
150.48−0.08−0.20−0.25−0.27−0.53−0.92−0.53−0.93
300.34−0.10−0.22−0.30−0.33−0.42−0.67−0.42−0.68
600.25−0.13−0.22−0.29−0.33−0.25−0.39−0.26−0.40
900.18−0.10−0.17−0.23−0.26−0.16−0.23−0.17−0.24
5050.46−0.13−0.12−0.19−0.27−0.72−1.07−0.73−1.13
150.32−0.06−0.10−0.12−0.12−0.79−1.07−0.79−1.07
300.20−0.05−0.09−0.20−0.23−0.66−0.81−0.67−0.81
600.22−0.09−0.19−0.27−0.33−0.42−0.56−0.42−0.57
900.19−0.11−0.18−0.25−0.30−0.27−0.39−0.27−0.40
10050.32−0.05−0.09−0.09−0.10−0.88−1.15−0.88−1.15
150.28−0.05−0.10−0.13−0.14−0.89−1.12−0.89−1.12
300.16−0.05−0.07−0.11−0.16−0.78−0.89−0.79−0.89
600.10−0.03−0.08−0.18−0.24−0.59−0.62−0.59−0.63
900.16−0.07−0.15−0.22−0.29−0.41−0.50−0.41−0.51
Table 8. Concentration time in OF-1 and OF-2.
MethodOF-1 tc (min)OF-2 tc (min)
Kirpich1211
Carter1312
Temez1211
Ven Te Chow1112
Kerby/Hathaway1213
Federal Aviation Agency3027
SCS Lag2220
Giandotti1010
Kinematic wave- Manning1111
Average concentration time1514
Table 9. Peak flow volumes based on the Scenario 1.
T (years)Dm (min)Peak Flow Volume (m3)
Scenario 1Scenario 7 Applied on 1Scenario 1Scenario 8 Applied on 1Scenario 9 Applied on 1
VOF-1 (m3)VOF-2 (m3)
50151.280.009.061.490.00
100153.633.5178.6815.962.22
309.157.82170.4145.727.57
606.694.61108.3112.382.05
Table 10. Peak flow volumes based on the Scenario 2, recorded in the area that drains to the exit discharge point OF-1.
T (years)Dm (min)Peak Flow Volume (m3)
Scenario 2Scenario 3 Applied on 2Scenario 4 Applied on 2Scenario 5 Applied on 2Scenario 6 Applied on 2Scenario 7 Applied on 2
20151.650.000.000.000.000.00
50531.8222.0513.467.885.482.04
1520.7014.1512.159.300.2417.14
309.636.935.062.090.789.13
100562.7740.4437.5634.1231.1618.58
1553.2334.3529.3327.1526.9035.07
3023.6112.659.589.202.1621.31
607.013.062.570.030.006.65
Table 11. Peak flow volumes based on the Scenario 2, recorded in the area that drains to the discharge point OF-2.
T (years)Dm (min)Peak Flow Volume (m3)
Scenario. 2Scenario 3 Applied on 2Scenario 4 Applied on 2Scenario 5 Applied on 2Scenario 6 Applied on 2Scenario 8 Applied on 2Scenario 8 Applied on 2
1057.490.000.000.000.000.000.00
1537.050.000.000.000.000.000.00
20584.520.560.000.000.0031.370.00
15179.7217.700.000.000.0010.896.87
3078.620.000.000.000.000.000.00
505389.0678.8129.0421.45 15.9459.3134.28
15393.06163.9976.9545.79 37.44136.2279.06
30349.7978.027.535.76 1.5029.187.43
6042.410.000.000.000.000.000.00
1005603.64301.77138.2994.88 81.41272.56143.29
15775.20456.17248.54200.56 161.48261.18158.00
30686.80330.51123.9381.22 72.03208.69118.43
60276.8748.137.650.44 0.0124.904.00
9031.620.000.000.000.000.000.00

