Article

Multi-Objective Optimization and Entropy Production Analysis of Solid–Liquid Two-Phase Flow in Centrifugal Pumps Based on Fluent—Event-Driven Execution Manager Coupling Method


1
School of Water Resources and Architectural Engineering, Northwest Agriculture and Forestry University, Xianyang 712100, China
2
Key Laboratory of Agricultural Soil and Water Engineering in Dry Areas, Ministry of Education, Xianyang 712100, China
*
Author to whom correspondence should be addressed.
Fluids 2026, 11(9), 212; https://doi.org/10.3390/fluids11090212
Submission received: 29 June 2026 / Revised: 12 August 2026 / Accepted: 21 August 2026 / Published: 26 August 2026
(This article belongs to the Special Issue Fluid Machinery and Fluid Mechanics)

Abstract

In response to the severe wear of centrifugal pumps, Workbench workflow is utilized to adjust the blade inlet and outlet angles, aiming to reduce the wear of the impeller and volute of the centrifugal pump and optimize the pump’s efficiency and head. Orthogonal experiments are conducted by varying the inlet and outlet angles. The original sample points are expanded and optimized in combination with the support vector machine and grid search. The optimization results indicate that under the condition of spherical particles, the efficiency at the rated operating condition increases by 1.71%, and the head rises by 0.35%. The appropriate eddy currents formed by increasing the impeller inlet angle alleviate the particle deposition phenomenon in the centrifugal pump, resulting in a smoother particle flow. The wear of the centrifugal pump blades decreases from 40.76 × 10⁻⁷ mm to 7.77 × 10⁻⁷ mm. After optimization, the overall entropy generation rate of the volute decreases, while that of the blade suction surface and the impeller outlet area increases. Additionally, through empirical mode decomposition analysis, it is found that the optimized design reduces high–frequency interference and the pulsation amplitude, making the flow field more stable. The frequency distribution also shifts from being dominated by high–frequency components to concentrating energy in the medium- and low-frequency regions.

1. Introduction

Centrifugal pumps are widely used in general machinery and are widely applied in various fields closely related to economic development, such as energy development, the petrochemical industry, water conservancy projects, sewage treatment. These application scenarios require a large number of centrifugal pumps to convey liquids containing solid particles [1,2,3,4,5,6,7]. The conveyance of liquids containing solid particles by centrifugal pumps caused significant wear and damage, seriously affecting the normal use of centrifugal pumps, shortening their service life, and ultimately resulting in energy waste and equipment damage, causing huge economic losses [8,9]. To improve their anti-wear performance and efficiency, this paper optimized the structure of the centrifugal pump impeller.
Research in the field of centrifugal pump particle wear has made some initial progress both domestically and internationally [10,11,12,13].
Cheng WJ [14] used the Fluent-EDEM (Event-Driven Execution Manager) coupling method to study the solid–liquid two-phase flow inside the pump, analyzed the main positions of particle wear and the particle flow trajectories, and verified it through particle image velocimetry experiments. Shi XW [15] conducted a study based on a CFD-DEM coupled solid–liquid two-phase model. They found that as the particle density, volume fraction and size increased, the wear area concentrated and the wear depth increased. Wang TT [16] analyzed the influence of particle size on the wear of centrifugal pumps through the field force coupling method. The analysis of the normal energy and radial energy indicated that the sliding friction of the particles was the main wear mechanism of the centrifugal pump. The volute suffered the most severe wear. With the increase in flow velocity, the wear amount on the volute gradually decreased. Cao WD [17] conducted numerical simulations of centrifugal pumps with different particle sizes and shapes using the CFD-DEM method. The study found that the particles mainly collided with the leading edge, trailing edge of the blade and the leading edge of the guide vane blade, and the wear was mainly distributed in these areas. With the increase in particle size and the decrease in sphericity, the average wear of the flow components increased. Wang ZQ [18] solved the particle-fluid bidirectional coupling wear characteristics of centrifugal pumps on EDEM. The study found that in high concentration conditions, the pressure surface of the entire blade was prone to erosion to varying degrees. When the particle size increased, the wear rate decreased, while smaller particles would exacerbate the wear of the components. Pu W [19] improved the four-way coupling method and studied the wear characteristics of the pump wall, compared the influence of particle density on the collision strength between particles and the blade wall, and discussed the interaction between particles.
Domestic and foreign scholars have used different optimization methods with different optimization goals to improve the performance of centrifugal pumps, and the research results are abundant. Qi HD [20] in this paper used the particle swarm algorithm to find the optimal solution among the Pareto frontier solutions. The entropy generation of the optimized centrifugal pump has decreased by 5.41%, and the efficiency has increased by 3.89%. Harsito C [21] used the response surface method to optimize the design of the liquefied hydrogen centrifugal pump. The efficiency of the centrifugal pump using liquefied hydrogen as the working fluid is approximately 82.4%, which is higher than that of the centrifugal pump using water as the working fluid. Wu TX [22] used Gaussian regression and the non-dominated sorting genetic algorithm II to perform multi-objective optimization of the centrifugal pump impeller and diffuser. The head and efficiency of the optimized centrifugal pump under the design conditions have increased by 8.8% and 2.8%, respectively. Compared with the original model, the optimized model reduces energy loss and the flow in the interaction area between the impeller and the diffuser becomes more stable. Wang YQ [23] optimized the main structural parameters of the centrifugal pump using the genetic algorithm. The efficiency of the optimized centrifugal pump has significantly improved, and the energy loss has significantly decreased. In addition, the experimental test results show that under the rated condition, the head of the centrifugal pump has increased by 26.92%, the efficiency has increased by 32.28%, and the energy loss has decreased by 14.38%. Zhao JT [24] used the genetic algorithm, backpropagation neural network model, and multi-island genetic algorithm to improve the hydraulic efficiency. The efficiency of the optimized model has increased by 4.29% under the rated condition, effectively eliminating the deterioration of the centrifugal pump’s performance under overloaded conditions. In addition, the turbulent kinetic energy distribution in the multi-stage centrifugal pump has improved, and the unstable flow structure has been reduced.
Considering the structure and performance of the centrifugal pump, this paper optimized the inlet and outlet angles of the centrifugal pump impeller through the support vector machine (SVM), grid search and response surface combination methods, and conducted a comparative analysis of the performance, wear condition and entropy production of the centrifugal pump before and after the optimization.

2. Three-Dimensional Centrifugal Pump Model and Model Reliability Verification

2.1. Three-Dimensional Centrifugal Pump Model

The design flow rate of the centrifugal pump used in this experiment is 50 m3/h, and the design head is 39 m. The specific parameters are shown in Table 1.
Figure 1 shows the three-dimensional mesh model of the centrifugal pump, which adopts a structured and unstructured mixed mesh strategy. Mesh refinement wass carried out at complex locations to improve the mesh quality.
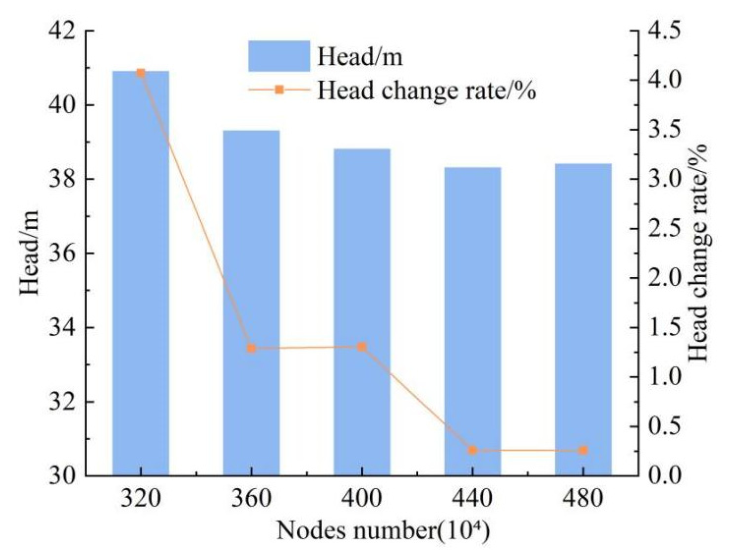
Figure 2 presents the results of the grid independence verification. As the number of grid nodes increases, the head value gradually decreases and stabilizes at around 38.3 m, remaining almost unchanged between 4.4 million and 4.8 million nodes. Meanwhile, by observing the head change rate, it can be seen that the change rate is 1.305% at 4 million nodes and 0.26% at 4.4 million nodes, approaching zero. This indicates that when the number of grid nodes reaches 4.4 million, the simulation results have achieved grid independence.

2.2. Model Reliability Verification

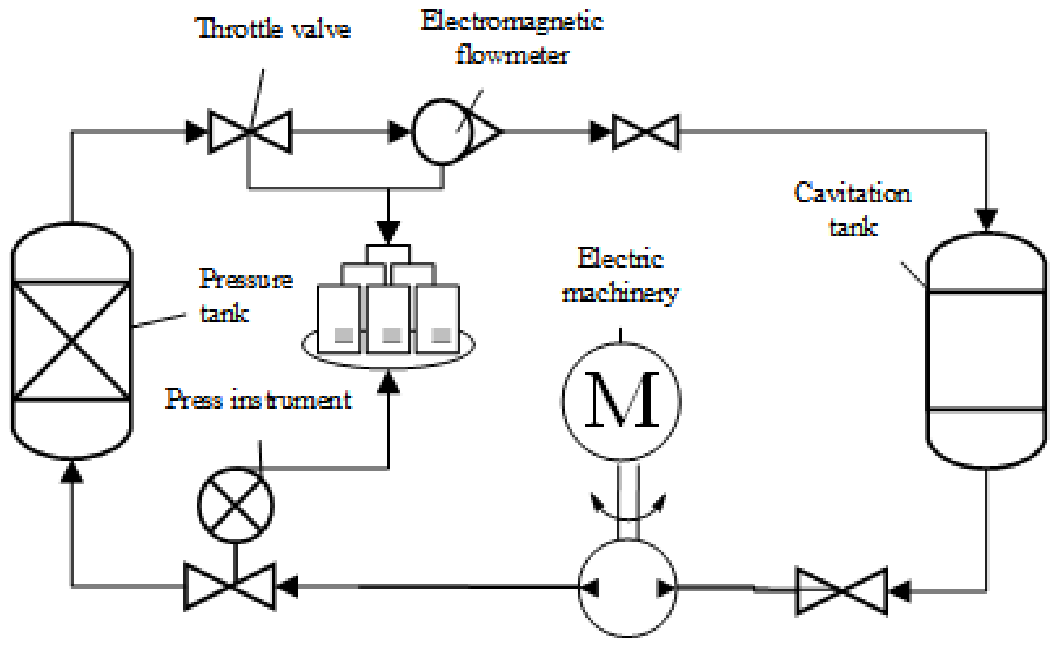
The on-site layout of the centrifugal pump unit performance testing platform is shown in Figure 3.
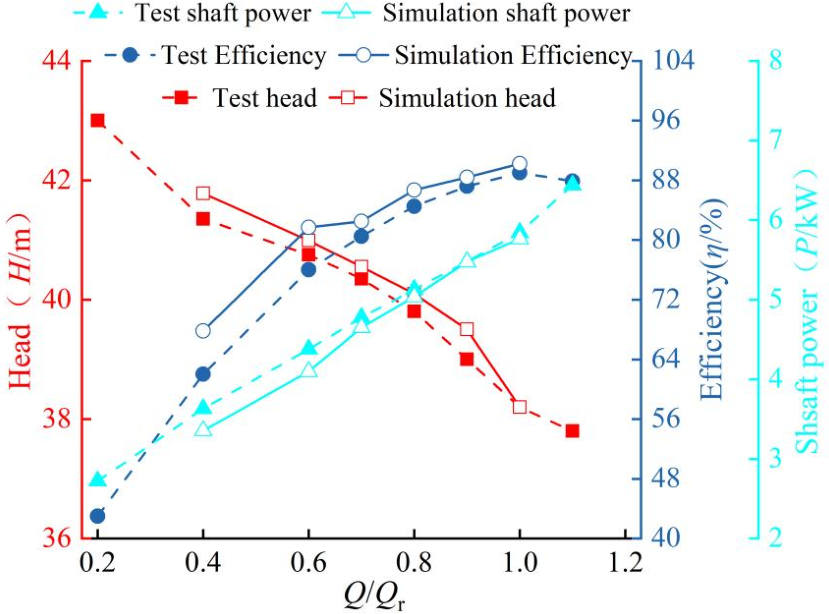
To ensure the reliability of the methods and numerical simulations of the grid adopted in this study, the numerical simulation results (such as head, efficiency, and shaft power) were compared with the experimental results. The specific results are shown in Figure 4.
Figure 4 presents the comparison data of the experimental results and the numerical simulation results from this study. As can be seen from the figure, with the increase in the flow ratio, the water head gradually decreases, while the efficiency first increases and then decreases, reaching the peak at the design condition. The shaft power decreases as the flow ratio increases. The overall trend of the experimental and simulation data is consistent. There is a relatively large deviation at low flow rates, which may be due to the difficulty in simulating the boundary conditions or turbulent effects under extreme conditions.

2.3. Boundary Conditions

The study employed the FLUENT-EDEM coupling method. The time step in FLUENT was set to 1 × 10⁻⁴ s. EDEM used the Oka wear model.
This model predicts the volume of material removed due to particle impact as a function of particle size, impact velocity, and impact angle.
The wear depth D w is calculated based on the impact angle-dependent normalized erosion g ( α ) , the wear volume per unit mass E ( α ) , and the particle mass m p , and is normalized by the surface area A .
D w = g ( α ) E ( α ) m p A
E ( α ) = 65 W k 1 v 104 2.3 H v 0.038 D 0.326 0.19
g ( α ) = sin ( α ) 0.71 H v 0.14 1 + H v 1 sin ( α ) 2.4 H v 0.94
W represents the material’s wear constant, v is the impact velocity of the particles, Hv is the Vickers hardness of the worn material, D is the particle diameter, and k 1 is the coefficient obtained from the experiment.
The Poisson ratio of the pump body was 0.3, the shear modulus was 70 MPa, the density was 7800 kg/m3, the restitution coefficient of the material between the particles and the pump body was 0.50, the static friction coefficient was 0.15, and the rolling friction coefficient was 0.01. The Poisson ratio of the particles was 0.4, the shear modulus was 21.3 MPa, the recovery coefficient of the material between the particles was 0.44, the static friction coefficient was 0.27, and the rolling friction coefficient was 0.01. The contact model between the particles was selected as the Hertz-Mindlin non-sliding model. The time step in EDEM was set to 1 × 10⁻⁵ s. The SST k-ω turbulence model was used for the calculation, and the boundary conditions were set as standard atmospheric pressure inlet and flow outlet.

3. Multi-Objective Optimization of Centrifugal Pumps

3.1. Optimization of Orthogonal Sampling

The essence of sediment abrasion is the impact, sliding and erosion of solid particles against the impeller wall. The particle incidence angle, relative velocity, and vortex reflux within the flow channel are the core causes of abrasion. The installation angles of the blades at the inlet and outlet directly affect the movement behavior of the particles. In this paper, the impeller structure is modified by adjusting the inlet and outlet blade angles to achieve the optimization objectives. Orthogonal experiments are carried out with six inlet blade angle schemes (15°, 20°, 25°, 30°, 35°, 40°) and six outlet blade angle schemes (10°, 20°, 40°, 50°, 70°, 90°), yielding a total of 36 sample points. High-precision numerical simulations are performed using the coupled FLUENT-EDEM method to obtain the wear loss of flow-passing components and external characteristic performance of the solid–liquid two-phase flow centrifugal pump under each design sample point.

3.2. Multi-Objective Optimization Response Surface Analysis

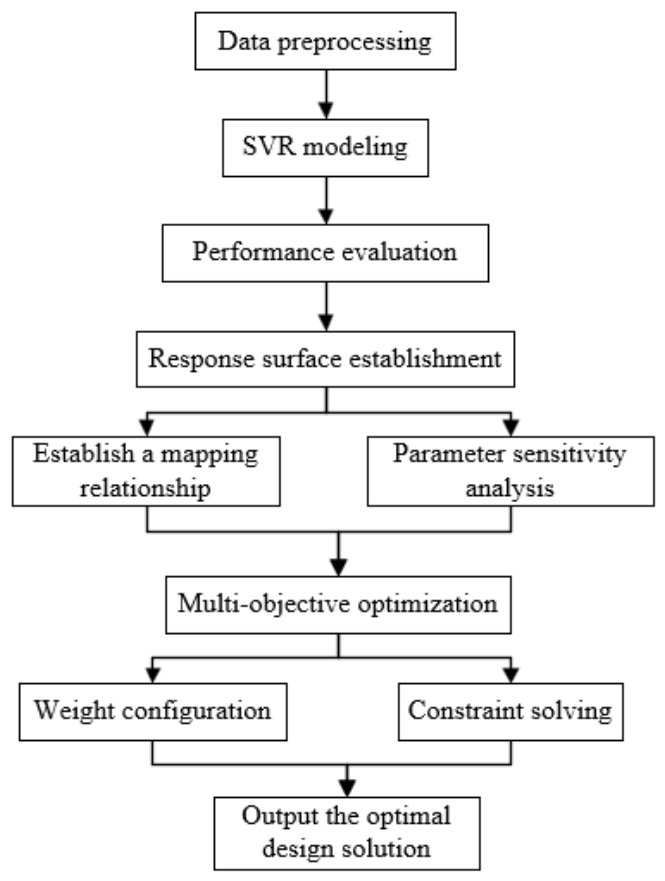
This paper employs support vector regression combined with the grid search method for optimization. By pre-defining the discretized parameter space of the inlet angle α1 and the outlet angle β2, the system traverses all possible combinations and builds the response surface of the objective function based on the experimental data. The specific operation process is shown in Figure 5.
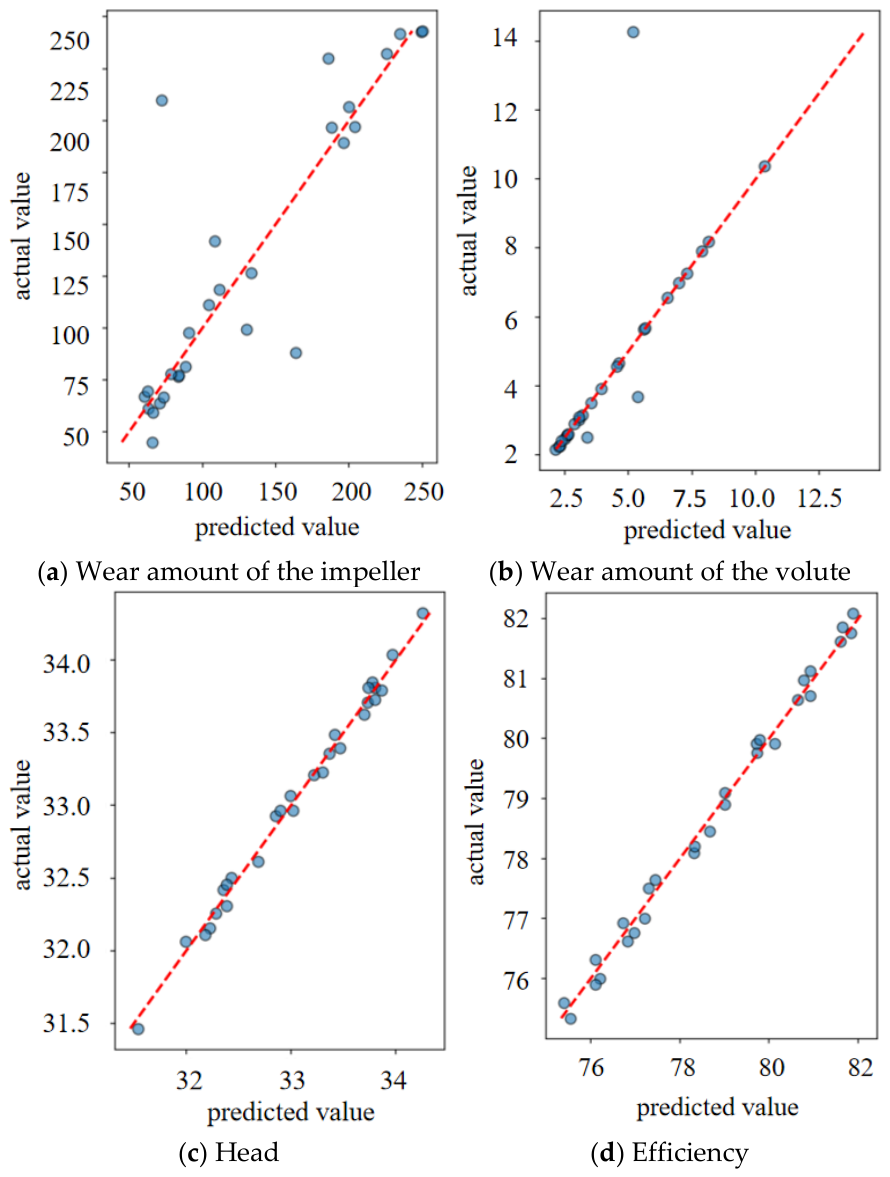
The model evaluation results are presented in a visual form. Through the scatter plot of predicted values and measured values, one can intuitively understand the prediction performance and reliability of the model. At the same time, to balance the relationship among wear, head and efficiency of each part of the centrifugal pump during the optimization process, the weight ratios of the wear amount of the impeller, the wear amount of the volute, the head and the efficiency are set as −0.4, −0.2, 0.1 and 0.3, respectively.
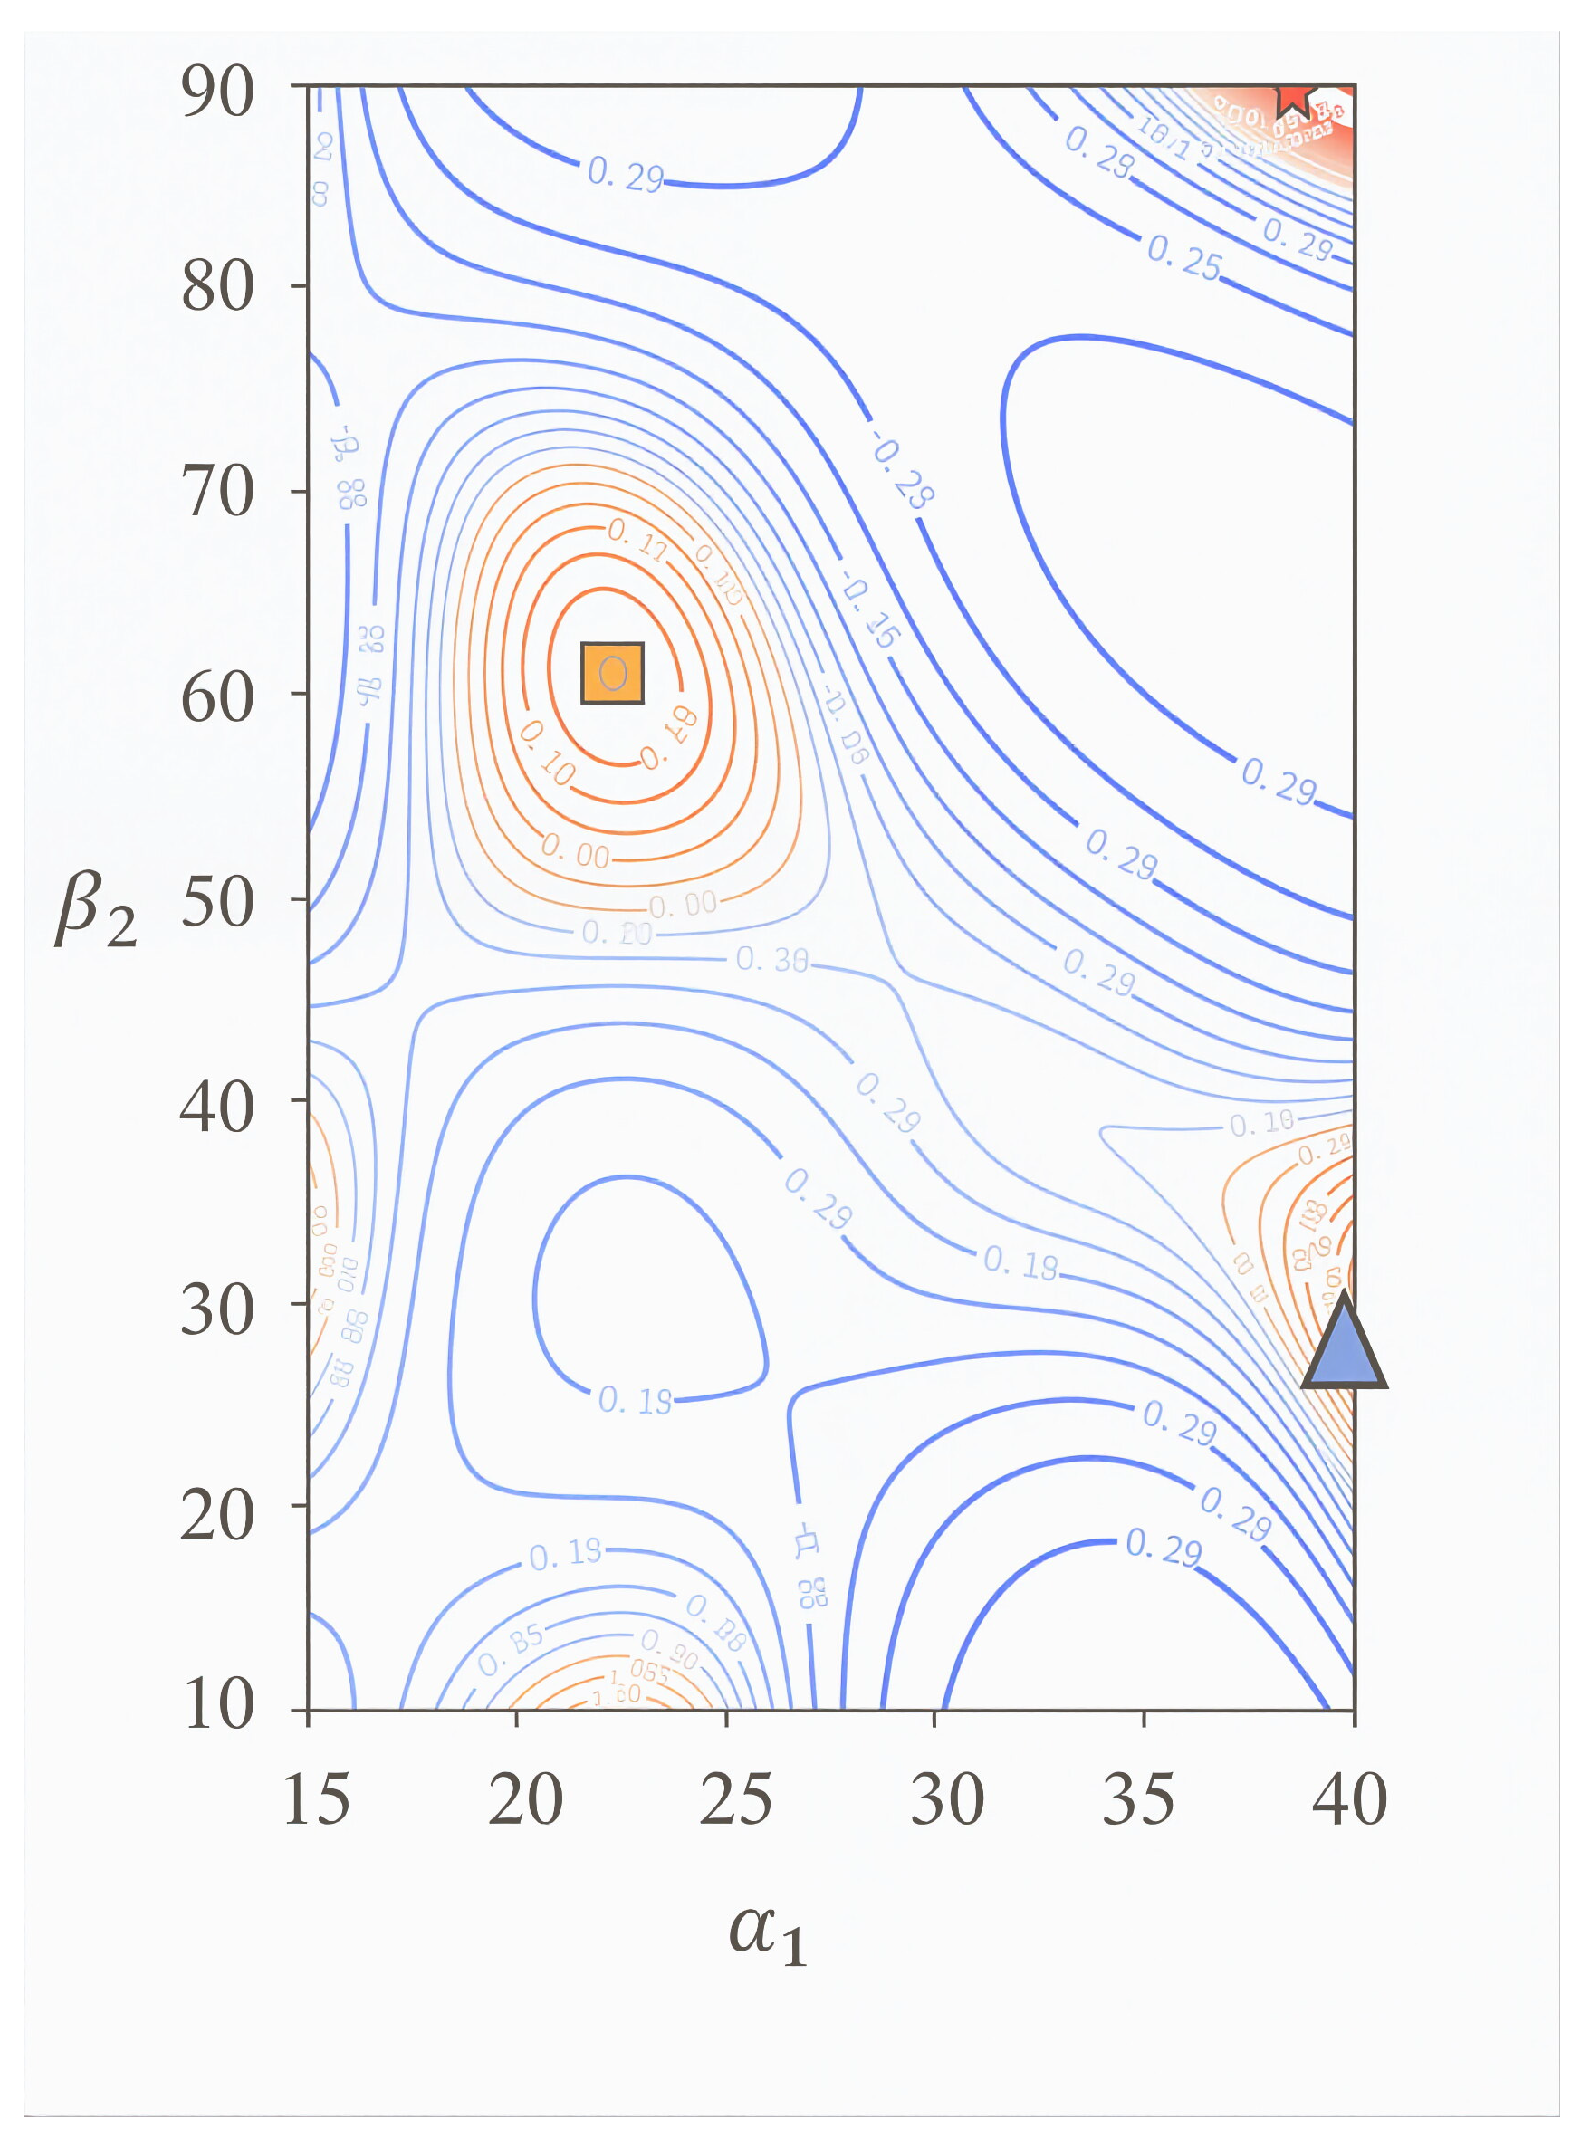
The comparison between predicted and actual values for each objective response is shown in the figures. The red dashed lines denote the ideal reference lines for perfect prediction, and the blue scatter points represent the sample pairs of predicted-actual values. It can be observed that most sample points are distributed close to the ideal diagonal lines, while certain boundary samples exhibit noticeable deviations. The coefficient of determination R2 for wear rate, power, head and efficiency are 0.862, 0.927, 0.978 and 0.981, respectively, and the corresponding root-mean-square error (RMSE) values are 13.72, 0.416, 0.073 and 0.124. Except for the wear rate, which shows relatively lower prediction accuracy due to the complex flow characteristics, the R2 values of the remaining objectives are all higher than 0.92. This demonstrates that the established surrogate model possesses favorable prediction accuracy and can be adopted for subsequent optimization calculations. By observing Figure 6, it can be seen that the predicted values of the four optimization quantities are very close to the actual values, and the prediction performance meets the requirements. Figure 7 shows the optimization results of the comprehensive objective function. From the above contour plots, it can be seen that there are multiple optimal points. Considering that an excessively large outlet angle may lead to a significant increase in the centrifugal pump’s shaft power, which is not conducive to the stable operation of the centrifugal pump, the final selection for α1 in this paper is 40° and that for β2 is 26°.

4. Centrifugal Pump Performance Optimization Results

Studies have shown that due to the existence of geometric anisotropy, non-spherical particles are prone to rotational effects and local stress concentration during frictional contact, significantly exacerbating the wear on the material surface. By introducing the sphericity parameter, the degree of deviation of the particles from the ideal sphere can be quantitatively described.
φ = ( c 2 / a b ) 1 / 3
a, b, and c represent the lengths of the major axis, the middle axis, and the minor axis respectively.
This parameter converts the complex three-dimensional morphological features into continuous scalars within the 0–1 range through normalization. Here, φ = 1 represents an ideal sphere. To investigate the influence of sphericity on the optimized centrifugal pump in this study, two sphericity values of 1.0 and 0.8 were introduced.
To verify the accuracy of the optimization results, a comparative analysis was conducted on the advantages and disadvantages of the centrifugal pump optimization results under different particle sizes. The centrifugal pump was calculated under the conditions of a particle mass fraction of 0.0015, a density of 2500 kg/m3, and a particle size of 0.3 mm. The wear conditions and energy loss situations of different parts of the centrifugal pump were analyzed under various circumstances.

4.1. Comparison of Models Before and After Centrifugal Pump Optimization

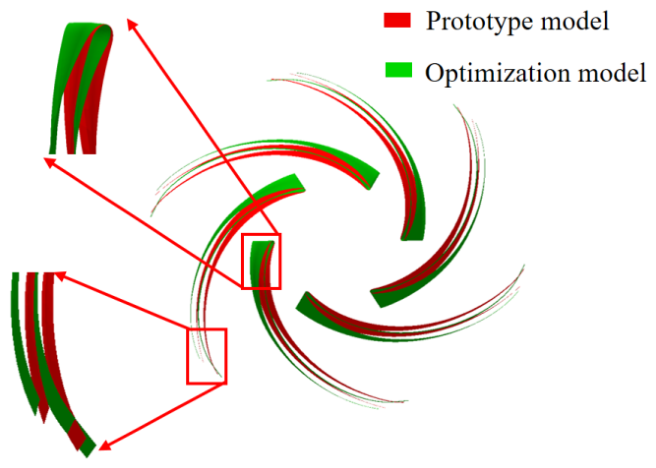
Based on the above analysis, the optimal result is an inlet angle of 40° and an outlet angle of 26°. The comparison of the models before and after optimization is shown in Figure 8.
Figure 8 shows the comparison of the blade geometric shapes before and after optimization. From the figure, it can be seen that the overall changes in the pump blades before and after optimization are relatively small, mainly manifested in the significant shortening at the blade outlet. To explore the relationship between the change in blade position and the wear condition, energy loss, and pressure pulsation variation of the centrifugal pump, comparisons were made before and after optimization in terms of wear performance, entropy production analysis, and pressure pulsation analysis.

4.2. Comparison of Results Before and After Centrifugal Pump Optimization

4.2.1. Performance Comparison Before and After Centrifugal Pump Optimization

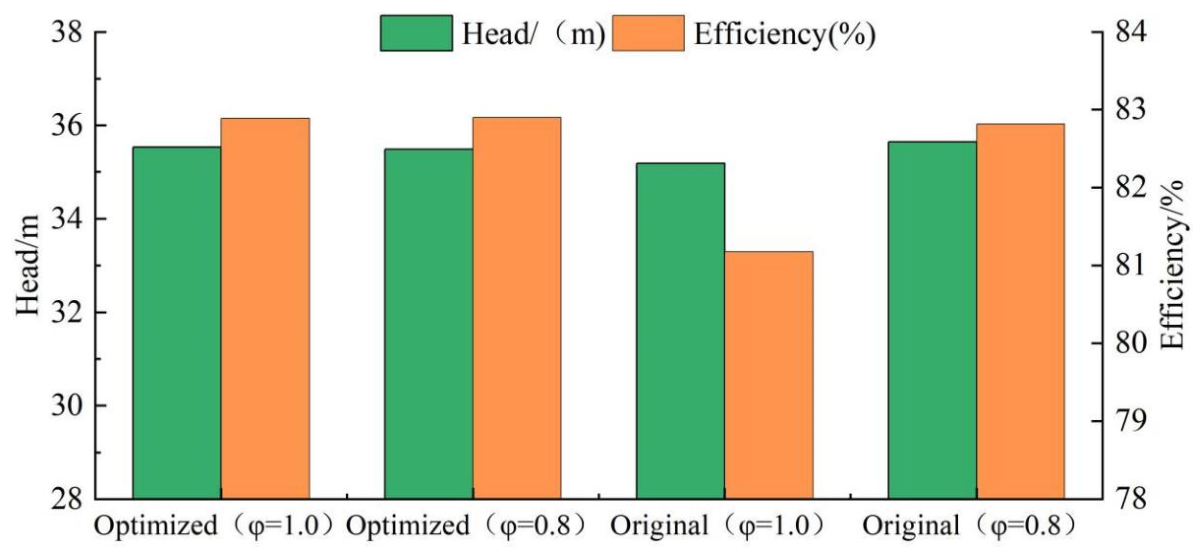
To study the performance comparison of the centrifugal pump under clean water conditions and particle-containing conditions, the influence of inlet and outlet angle optimization on efficiency and head was analyzed, as shown in Figure 9.
By comparing the performance of the models before and after optimization, when the sphericity was 1, the efficiency increased from 81.18% to 82.90%; when the sphericity was 0.8, the efficiency slightly increased from 82.82% to 82.90%. The optimization effect was relatively weak. When transporting non-spherical particles, the head of the optimized centrifugal pump is slightly lower than that of the original model. This may be because the presence of particles causes a certain degree of fluctuation in the head of the solid–liquid two-phase flow centrifugal pump, resulting in the head of the optimized pump being lower than that of the original model when transporting non-spherical particles.

4.2.2. Comparison of Wear Amount Before and After Centrifugal Pump Optimization

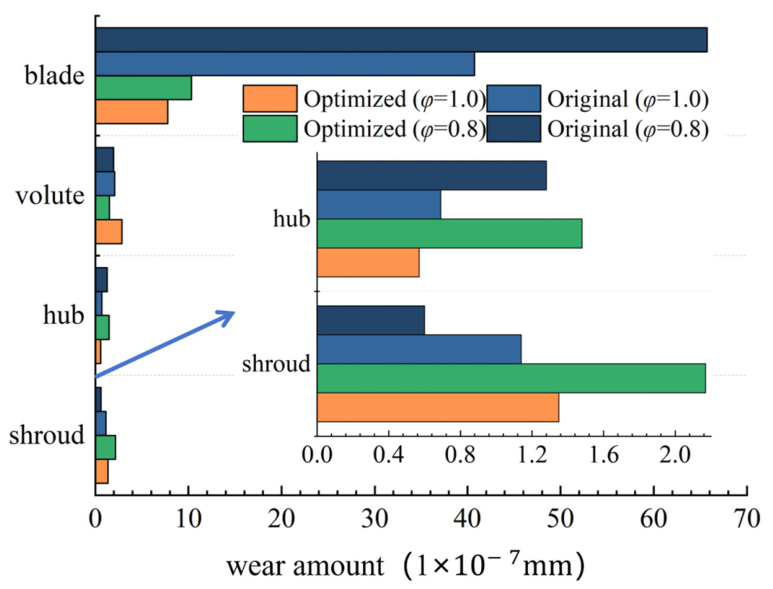
To study the anti-wear performance of the optimized impeller, the influence of different sphericality particles on the wear amounts of four key areas—the blade, the volute, the hub, and the shroud—was compared and analyzed. The results are shown in Figure 10.
The data comparison after optimization shows that, compared with spherical particles, the wear condition of non-spherical particles is more severe. This might be due to the irregular shape of non-spherical particles, which leads to a more unfavorable flow state and results in a higher wear amount than that of spherical particles. Regardless of the shape of the particles, the blades and the volute are always the most severely worn areas.
The wear amount of the optimized blades has significantly decreased, while the wear amounts of the volute, hub, and shroud have slightly increased. Compared with the change in the overall wear amount, the increase in the wear amount of the volute, hub, and guard has a relatively smaller impact. This might be because the optimized inlet and outlet angles improve the internal flow state, and the increase in α1 makes the fluid entry more smooth, reducing the direct impact of the fluid and particles, and reducing the wear of the blades. The decrease in β2 makes the fluid outlet smoother, reducing the wear on the volute.
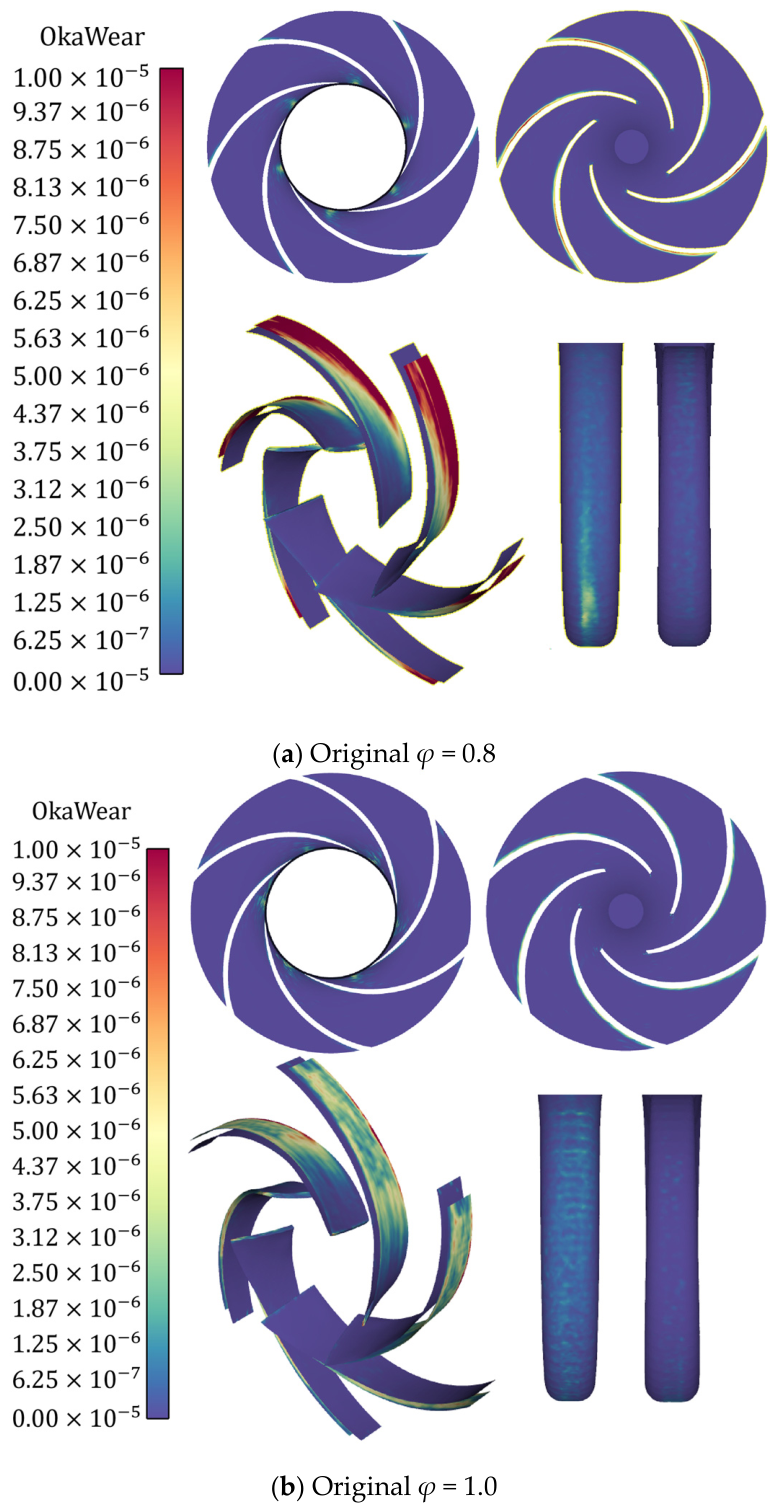
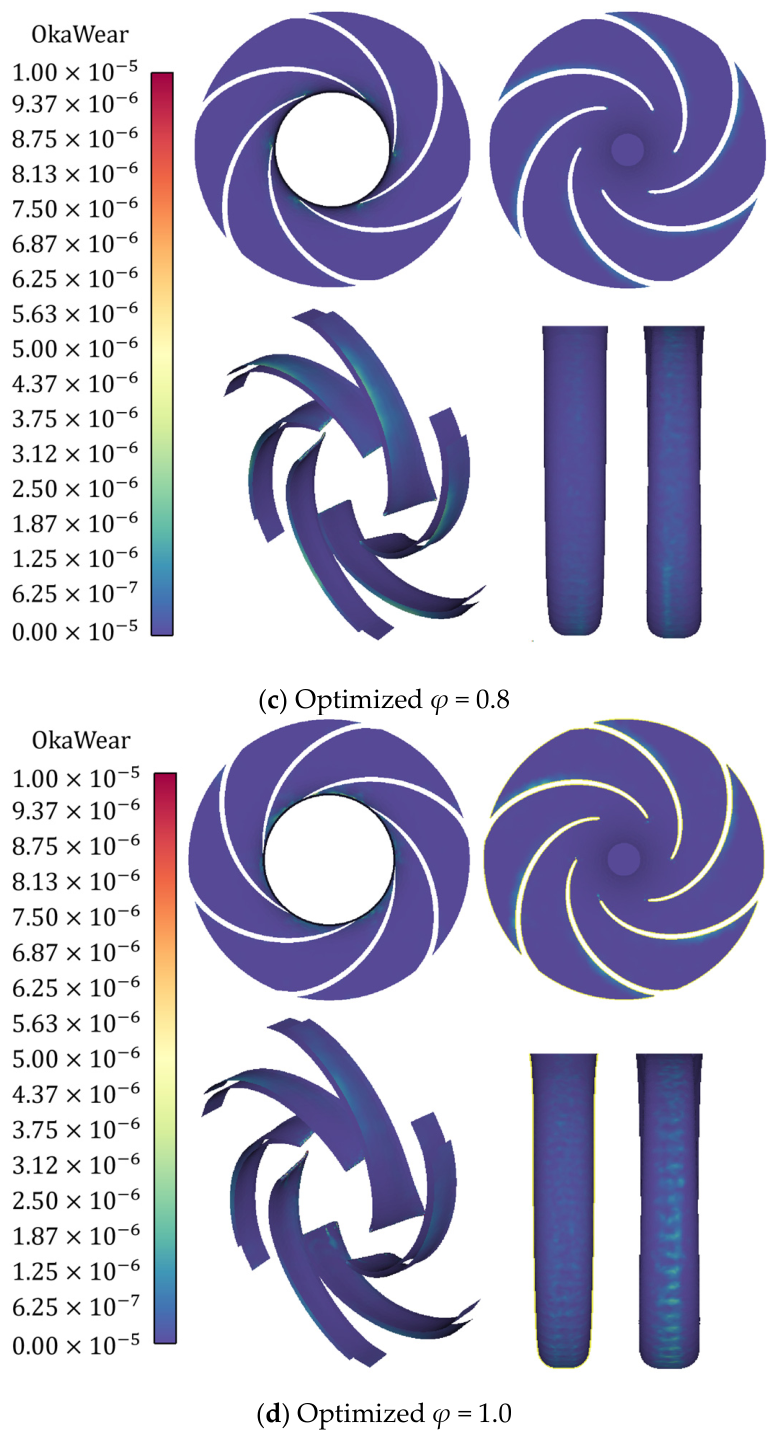
Figure 11 shows the wear cloud maps of the flow components of the centrifugal pump before and after optimization. Compared with before and after the optimization, the wear amounts of the blades and the volute have significantly decreased, while the changes in other parts are not significant. The original position with severe wear on the blade pressure surface is located on the blade. The rear cover plate has more severe wear than the front cover plate and the wear is mainly concentrated at the inlet position. After optimization, the wear condition of the centrifugal pump has been significantly improved. The wear amounts of the blades and the volute have been greatly reduced. The main wear position of the blades has shifted from the pressure surface near the rear cover plate to the middle part of the pressure surface.

4.2.3. Comparison of Particle Motion States Before and After Centrifugal Pump Optimization

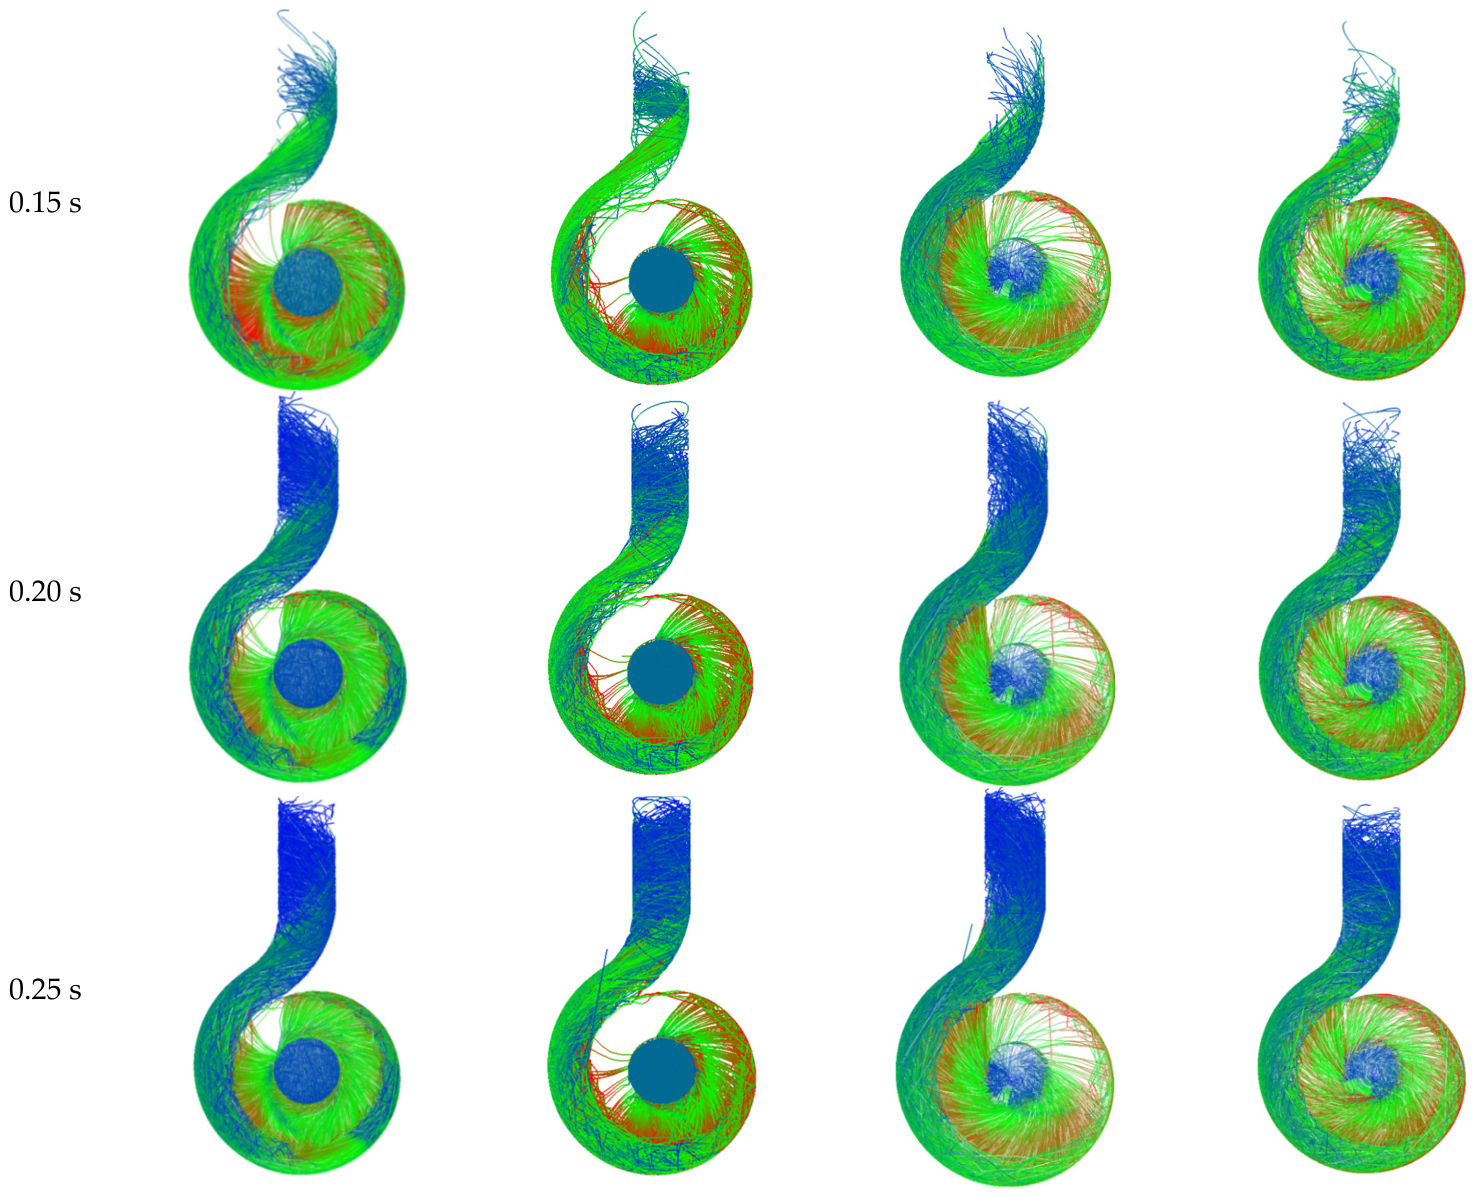
To conduct a detailed comparison of the motion states of spherical and non-spherical particles before and after optimization, the motion trajectories of the models before and after optimization at four different time points under different working conditions was plotted for the distribution of particles with different degrees of sphericity over time.
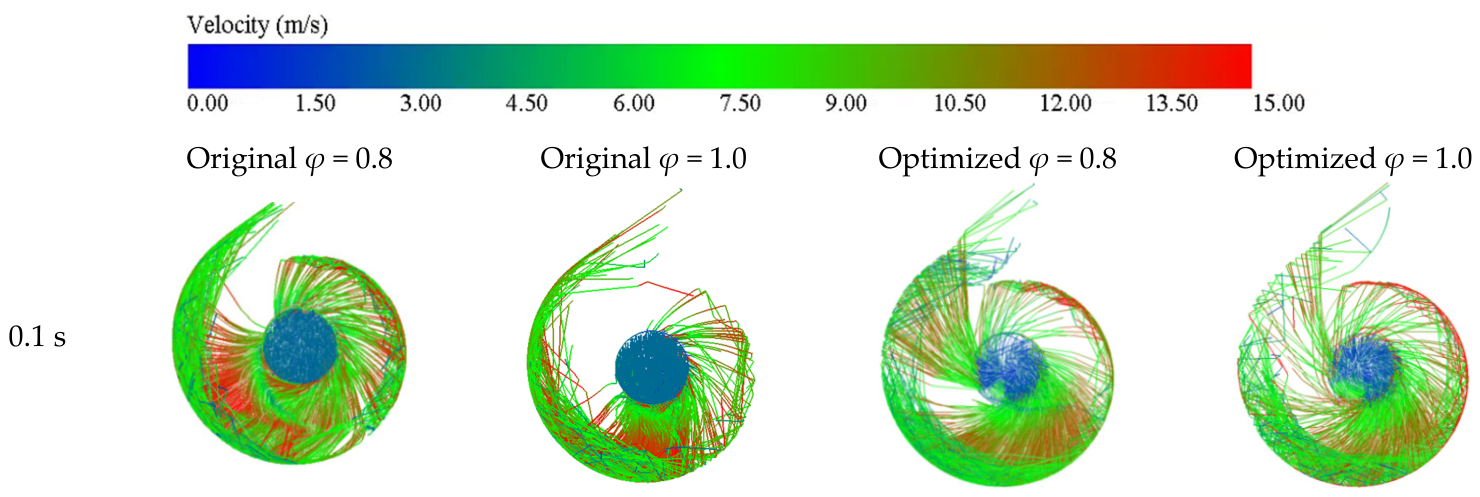
From Figure 12, it can be seen that compared with the original model, the optimized model has a significantly more uniform distribution of particles when transporting solid–liquid two-phase flow, and the acceleration of particles in the impeller flow channel is also more uniform, without any obvious concentrated acceleration. The most obvious observation is from the distribution chart at 0.1 s. After optimization, the speed variation range of the centrifugal pump significantly decreases, the collision intensity between particles and the wall surface reduces, and the wear amount decreases.
Before and after model optimization, there is a significant speed increase in the middle of the impeller, and its movement direction also changes. Combined with the analysis of the wear location, it can be seen that the particles collide with the blades, change the movement direction, and cause wear. In addition, when particles move in the original model due to the effect of gravity, they deposit in the extension section of the inlet, and the particles mainly concentrate below the impeller. This led to severe impact wear in the lower part of the volute. Compared with the original model, the optimized model has a significantly more uniform distribution of particles when transporting solid–liquid two-phase flow, and the acceleration in the impeller flow channel is also more uniform, without any obvious concentrated acceleration. The deposition phenomenon of particles has also improved. It was found that this is because the optimized blade shape does not conform to the state of no impact at the inlet, and there is a certain vortex in the fluid at the impeller inlet, which caused the particles to deposit under the impact of the vortex in the inlet extension section, separate from the original trajectory, and be uniformly distributed at the impeller inlet. At the same time, due to the existence of the vortex, the speed of the particles increases, and their autonomy increases appropriately, rather than like in the original model where the particles adhere to the pressure surface and move gradually, further reducing the contact opportunities between the particles and the blades.
Before optimization, the particle trajectories have obvious turns at different positions. When transporting non-spherical particles, the turn occurs in the lower left of the impeller, while when transporting spherical particles, the turn occurs in the lower left position of the impeller. This indicates that non-spherical particles have better following performance compared to spherical particles. This may be due to the coupling between the particles and the fluid, and the movement of non-spherical particles caused fluid disorder, resulting in an increase in the axial vortex.

4.3. Entropy Generation Comparison of Centrifugal Pumps

To deeply analyze the optimization results of centrifugal pumps and their energy loss situations, an entropy generation analysis was conducted for the pumps before and after optimization. By analyzing the distribution and change patterns of entropy generation, the entropy generation analysis can guide the optimization design of the impeller geometry, flow channel layout, and operating parameters, in order to reduce energy loss and improve the efficiency and reliability of the pump. In the solid–liquid two-phase flow system, due to the presence of solid particles, the mechanism of entropy generation is more complex. Studying its characteristics is of great value for improving the efficiency and stability of the pump. The total entropy generation rate within the computational domain can be decomposed into three key components: direct dissipation entropy generation rate, pulsation dissipation entropy generation rate, and wall entropy generation rate. The expression is as follows:
S p r o = S p r o , D + S p r o , D + S p r o , W
Direct dissipation entropy production rate S p r o , D : This part of the entropy production is caused by the average velocity gradient of the fluid mainstream; Pulsatile dissipation entropy production rate S p r o , D : This part of the entropy production is caused by the turbulent pulsations of the fluid; Wall entropy production rate S p r o , W : Since the entropy production rate is closely related to the wall shear stress, it is particularly obvious on the top wall.

4.3.1. Comparison of Entropy Production Distribution of Centrifugal Pumps

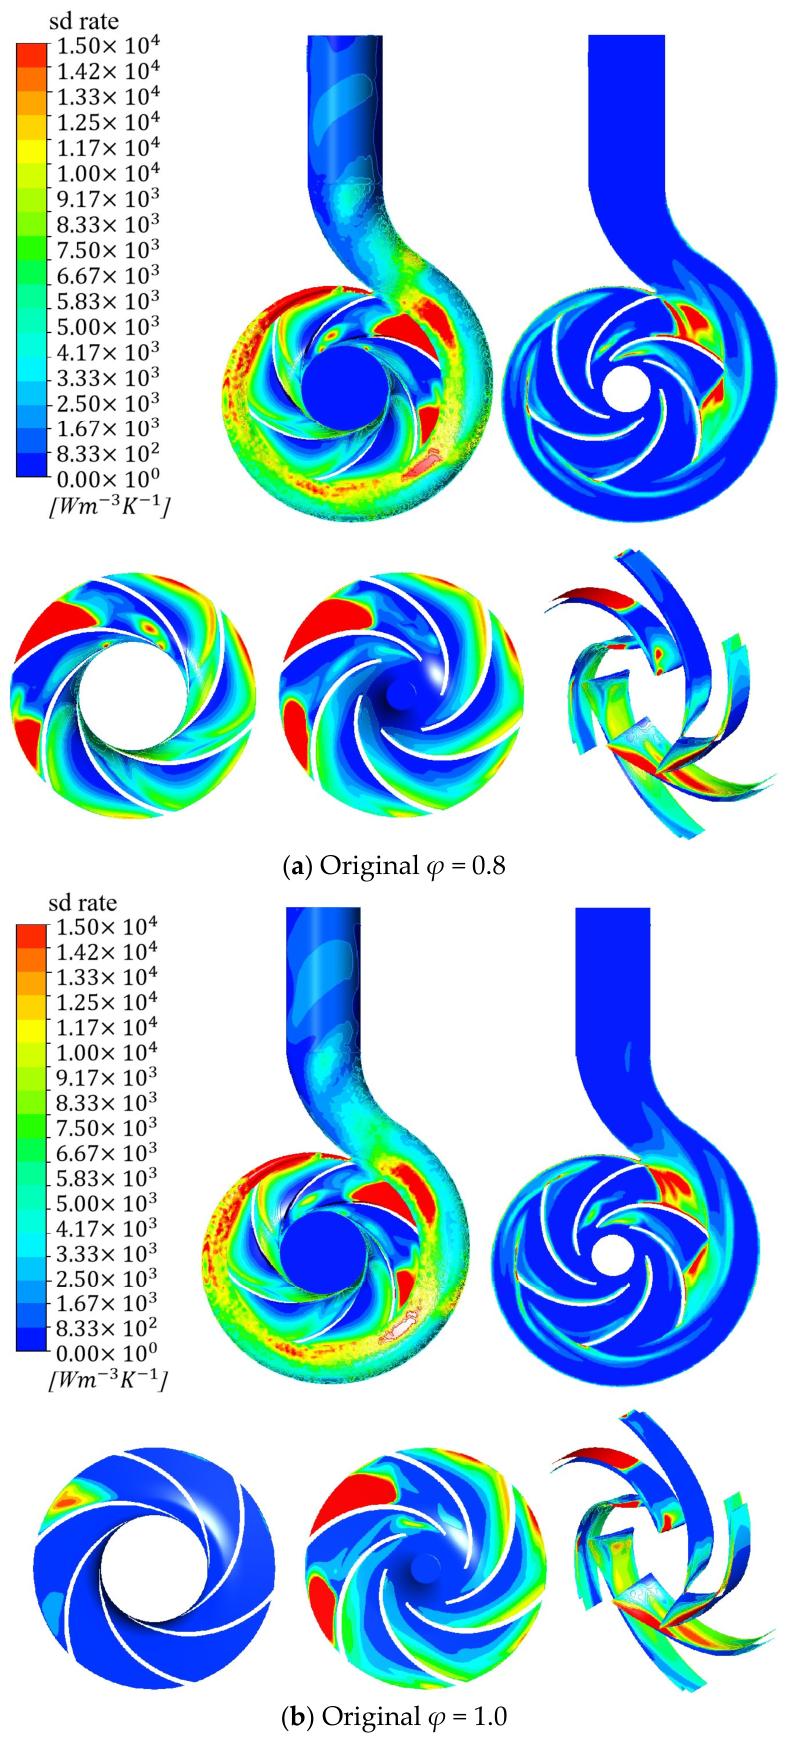
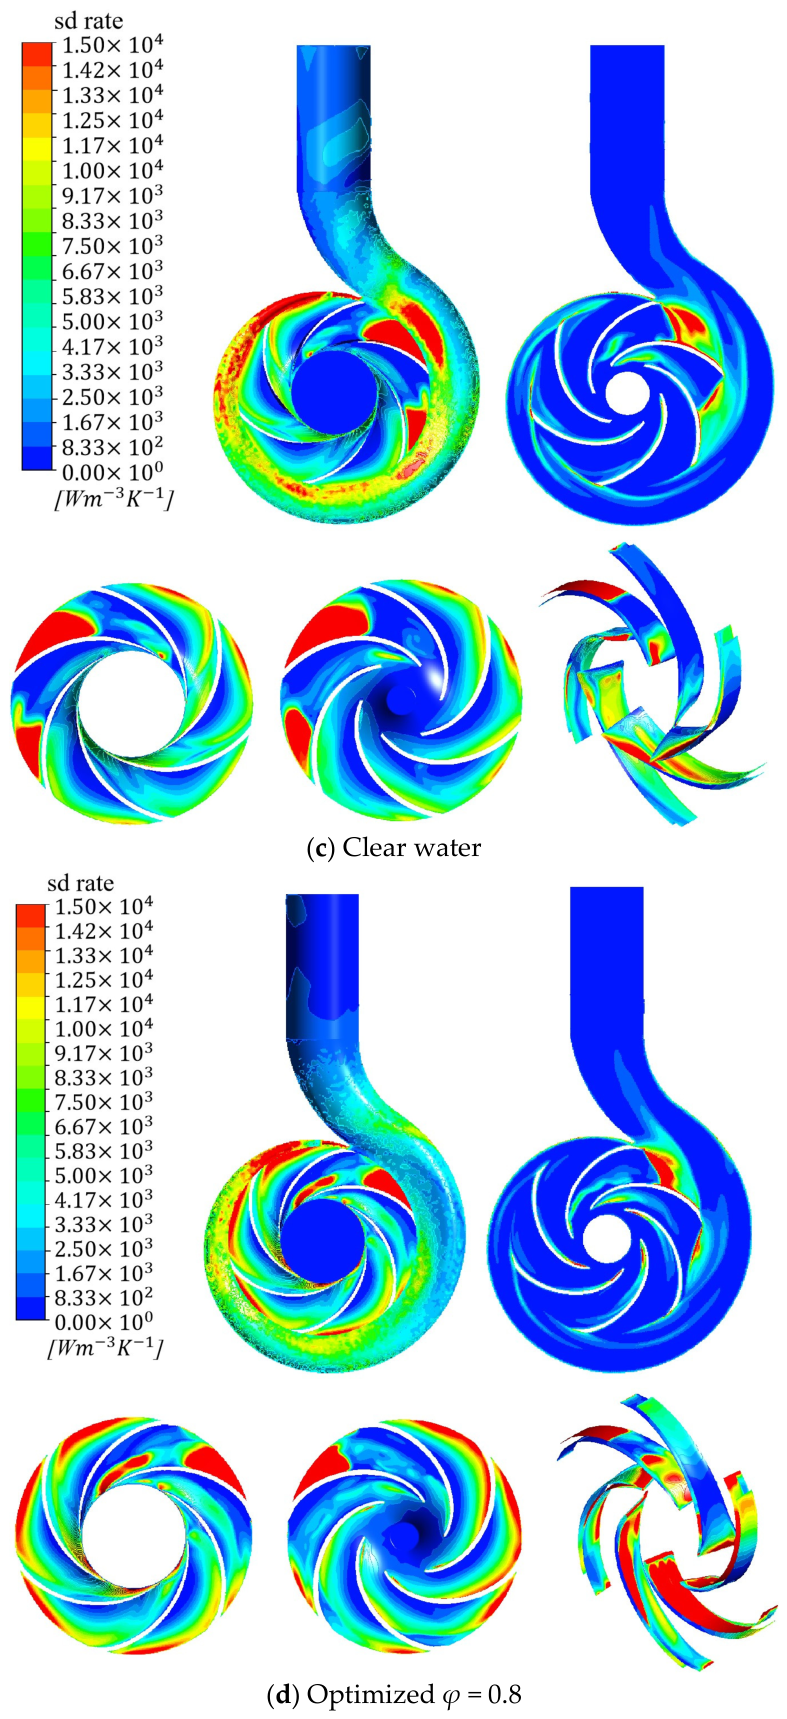
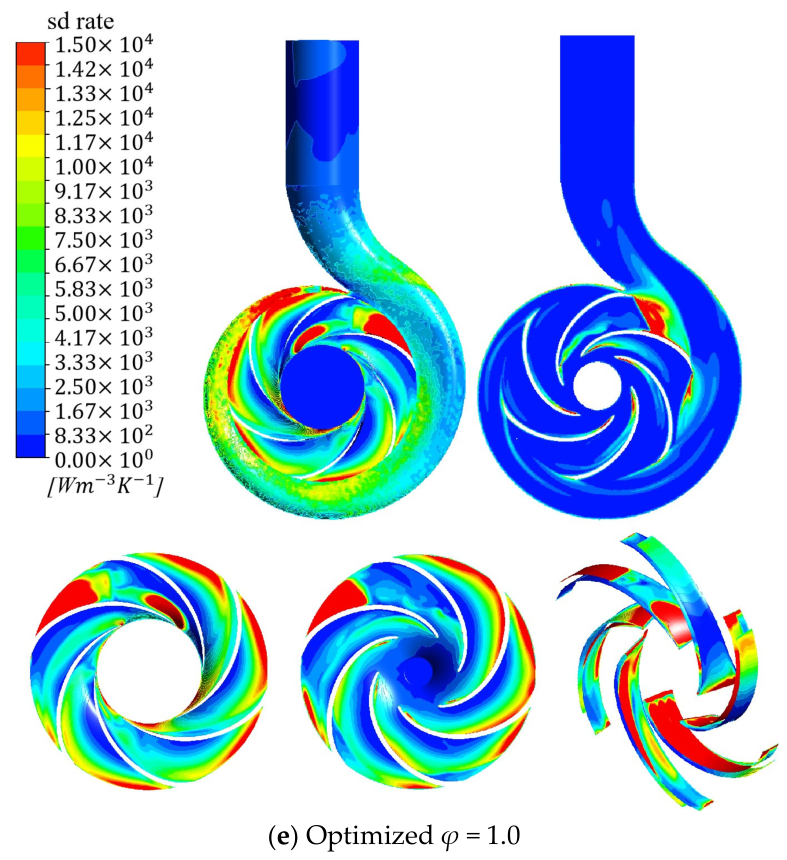
The figure below shows the entropy generation cloud diagrams for each part of the centrifugal pump at various operating conditions.
In Figure 13a, the impeller region shows a significant uneven distribution of entropy production. The edge area of the blade pressure surface has a relatively high entropy production rate, especially in the vicinity of the volute tongue region. Combined with the slice analysis, there is also a significant change in entropy production within the fluid, which may be related to the conversion of kinetic energy and potential energy of the fluid at this point, forming a certain degree of reverse pressure gradient, resulting in the formation of axial vortex. The high entropy production in the volute region is mainly concentrated on the left and right sides of the volute tongue and the fluid interface near the impeller outlet, forming a higher distribution band of high entropy production. However, within this position, the entropy production rate is actually not high.
Figure 13b has a similar overall distribution pattern to Figure 13a, but the distribution of the entropy production area has a slight change. The entropy production rate in the overall space has decreased somewhat, but the degree is not particularly obvious. This may indicate that under the φ = 1.0 condition, the regularity of the particle shape makes the flow pattern more orderly, but the entropy production intensity in the local area may slightly increase.
Figure 13c has a very similar overall distribution to Figure 13b, but there are subtle differences in certain key areas. This also indirectly indicates that the addition of solid-phase particles has a relatively minor impact on the entropy characteristics, and also a relatively minor impact on the size and range in local positions.
The optimized entropy production distribution has a significant change. In Figure 13d,e the regions with larger entropy production on the impeller mainly concentrate on the suction surface of the blade and the blade outlet area, forming a more obvious “strip-like” entropy production area. The entropy production on the suction surface increases significantly, and the entropy production near the hub of the pressure surface also increases significantly. This indicates that under the optimized design, it may lead to stronger fluid–structure interaction and greater energy dissipation in the suction surface of the impeller, as well as the area near the junction of the impeller and the volute.
The main sources of irreversible flow losses are concentrated in three areas: the suction surface of the blade, the tongue position, and the impeller outlet. These areas have high entropy production due to complex fluid dynamics phenomena, indicating that they are the main areas of energy loss. The optimized design significantly changes the spatial distribution characteristics of entropy production. This redistribution indicates that the optimized design has indeed changed the flow mechanism within the pump.

4.3.2. Entropy Production Ratio of Centrifugal Pump

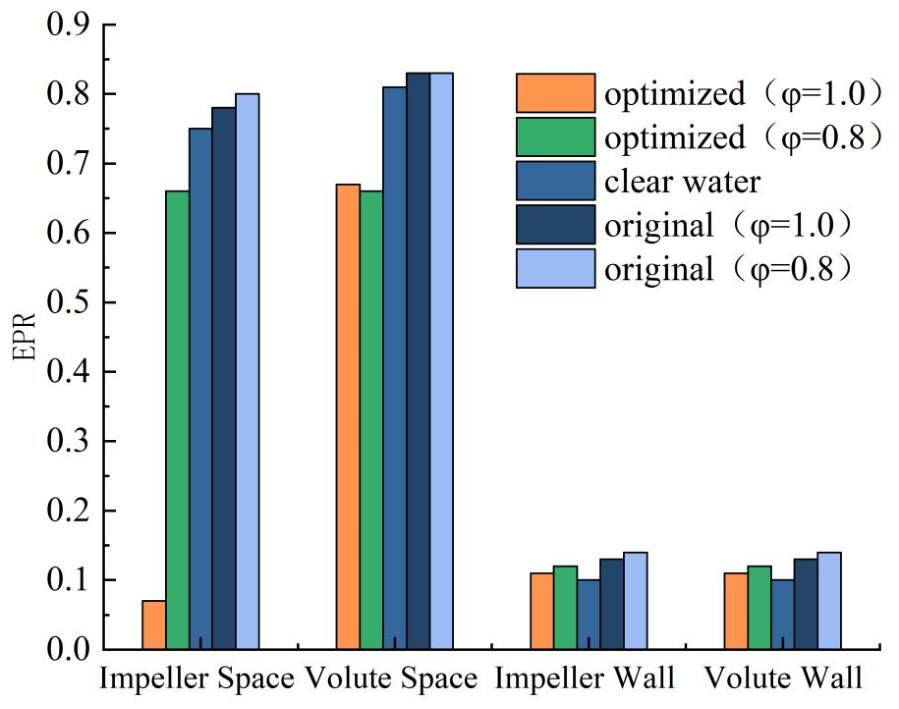
To conduct a quantitative analysis of the specific distribution of entropy production (EPR) in various parts for the study, as shown in Figure 14, the entropy production distribution of the impeller and volute in different operating conditions is presented.
From the data distribution, it can be seen that the entropy production values of the impeller space and volute space in the optimized model are significantly higher than those of the wall surface, indicating that the internal flow losses of the fluid are the main source of entropy production. Under the optimized φ = 1.0 condition, the EPR of the impeller space decreased to 0.07, which was approximately 90% lower compared to other conditions. However, the EPR of the volute space remained at a relatively high level. This result indicates that the optimization of the inlet and outlet angles of the blades significantly improved the flow in the impeller space under this condition, but the optimization of the internal flow pattern in the volute was not obvious. The change in wall surface entropy production was relatively small. The EPR of the impeller wall surface was between 0.10 and 0.14, and the EPR of the volute wall surface was also between 0.10 and 0.14. This indicates that the wall friction loss is less affected by the change in operating conditions.

4.4. Comparison of Pressure Pulsations in Centrifugal Pumps

The pressure pulsation of centrifugal pumps is a key indicator for evaluating performance. By setting monitoring points at critical positions of the centrifugal pump body, pressure pulsation can be captured, revealing the influence of solid particles on the flow field. At the same time, through frequency domain feature analysis, the operating status can be diagnosed and potential faults can be predicted, providing a basis for multi-objective optimization design of solid–liquid two-phase flows.
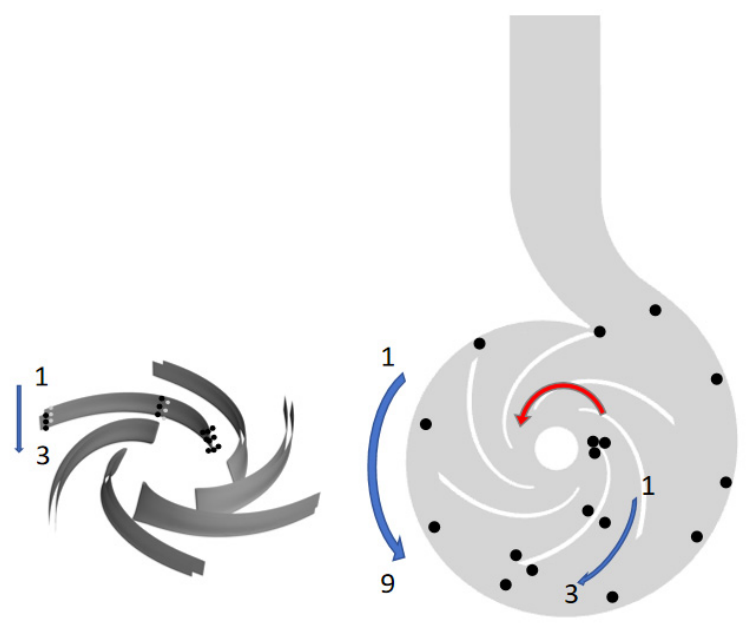
To monitor the pressure pulsation of different flow components of the centrifugal pump under different operating conditions, corresponding monitoring points were set up at different positions. Nine monitoring points were arranged at different axial and radial positions on the pressure surface and suction surface of the impeller. Three monitoring points were placed at different axial positions on the leading edge of the blade, and nine monitoring points were set up at different circumferential positions of the volute. Additionally, because the pressure change in the baffle is significant, three monitoring points were arranged at different axial positions of the baffle. The specific distribution of the monitoring points is shown in Figure 15.

4.4.1. Frequency Domain Analysis of Pressure Fluctuation in Centrifugal Pumps

The unstable flow phenomena such as dynamic-static interference and local recirculation zones within the centrifugal pump left unique frequencies in the pressure pulsation signals of the corresponding areas. Through systematic analysis of these frequency characteristics, we can more accurately identify and locate the unstable flow sources in the complex flow field within the pump. This study introduces dimensionless pressure pulsation coefficient Cp and dimensionless time coefficient Ct, eliminating the influence of absolute size and operating parameters, and more accurately evaluating the impact of geometric improvements on the stability of the flow within the pump.
C p = p p ¯ 0.5 ρ u 2         u = π D n 60000         C t = t t a t b t a
p—Instantaneous pressure at the monitoring point, Pa; p ¯ —Average pressure at the monitoring point, Pa; u—The peripheral speed at the outlet of the impeller, m/s; D—The diameter of the impeller outlet, mm; n—The rotational speed of the pump impeller, r/min; t—The current moment of numerical calculation, s; ta—The starting moment of the rotation period, s; tb—The end of the rotation period, s.
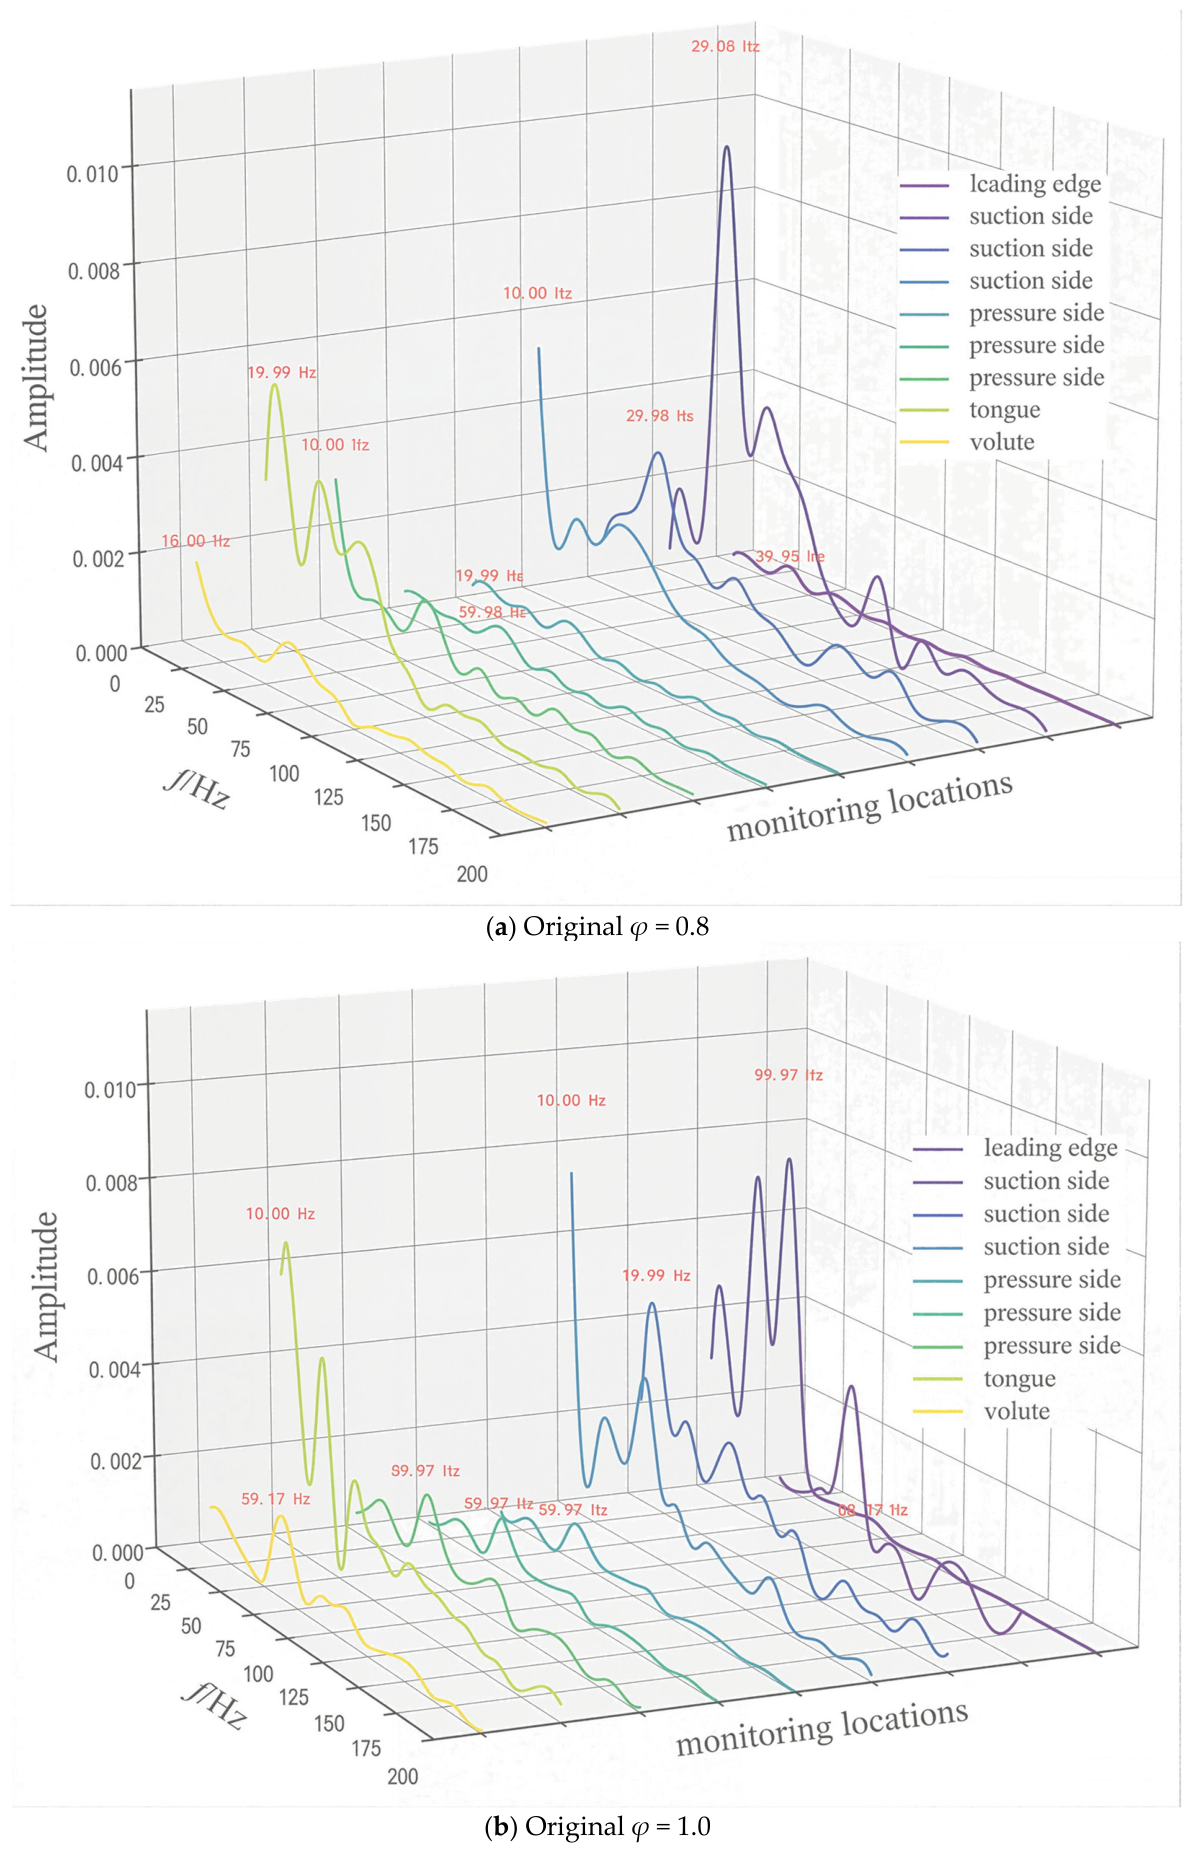
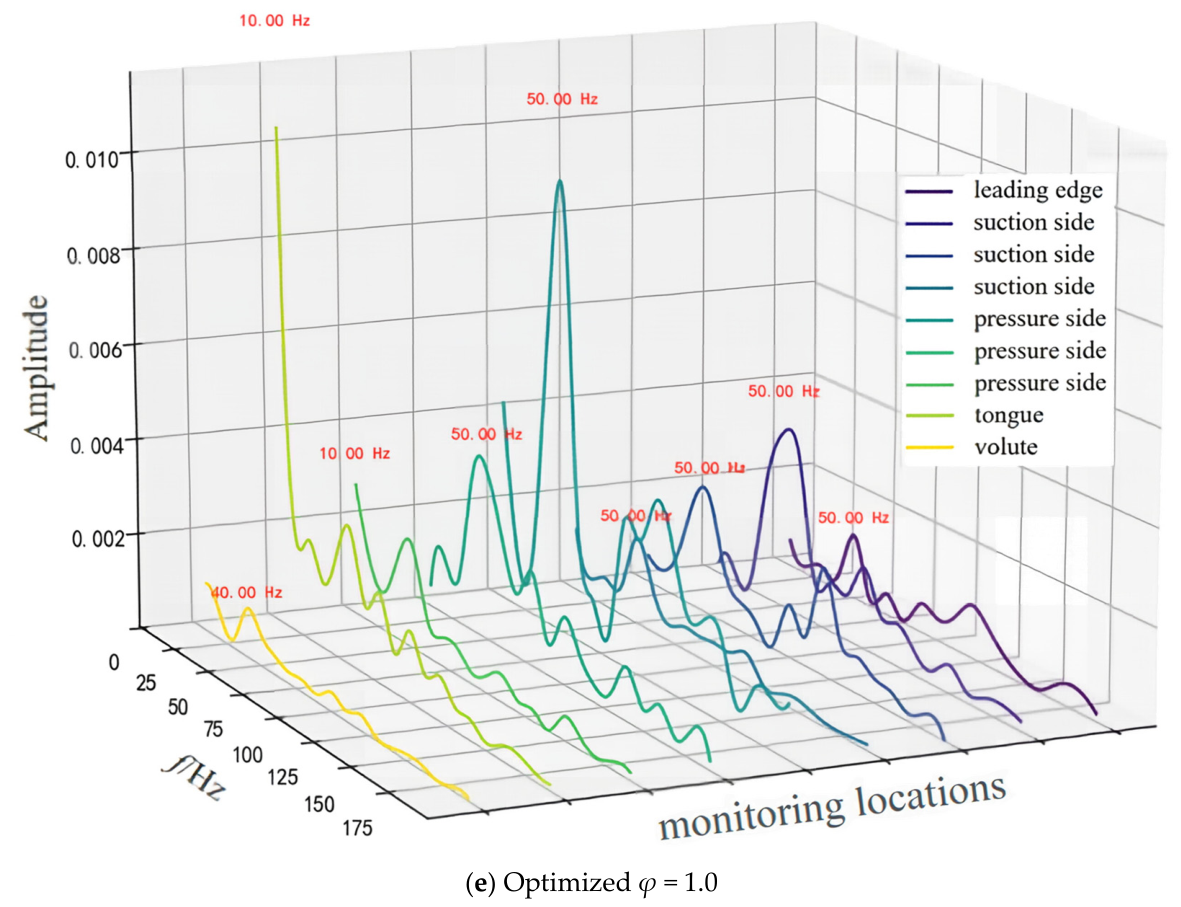
Figure 16 presents the pressure pulsation characteristics of the centrifugal pump under different operating conditions through a three-dimensional spectrogram. Figure 16a shows the pressure pulsation characteristics of the original model when non-spherical particles are present. The pressure pulsation is most significant at 39.98 Hz, with an amplitude of up to 0.010 at position 1 of the suction surface, and the frequency is approximately 0.83 times the fundamental frequency. There are also high-amplitude pulsations of the same frequency at suction surface 2 and suction surface 3, with the intensity gradually decreasing. The secondary peak at 19.99 Hz in the tongue separation zone may be related to the low-frequency disturbances caused by the interaction between the tongue and the impeller. The random orientation of non-spherical particles in the flow field may be the main reason for the high pulsation in the leading-edge region. These particles undergo complex rotations and collisions in the inlet area, generating strong flow fluctuations.
Figure 16b shows the pressure pulsation in the case of spherical particles. The main frequency increases to 59.97 Hz, forming a double-peak structure at suction surface 3, suction surface 1 and the tongue. The maximum amplitude is approximately 0.008. Compared with φ = 0.8, the main frequency has a significant deviation, indicating that the sphericality of the particles has a significant impact on the frequency of the flow disturbance. The spatial distribution of the pulsation is more concentrated in the suction surface area, with slightly reduced intensity. The overall pressure pulsation at the suction surface increases, indicating that the disturbance generated by spherical particles is more regular but with weaker intensity. The pulsation at the volute and tongue is significantly weakened, indicating that the sphericality has an impact on the secondary flow structure within the pump.
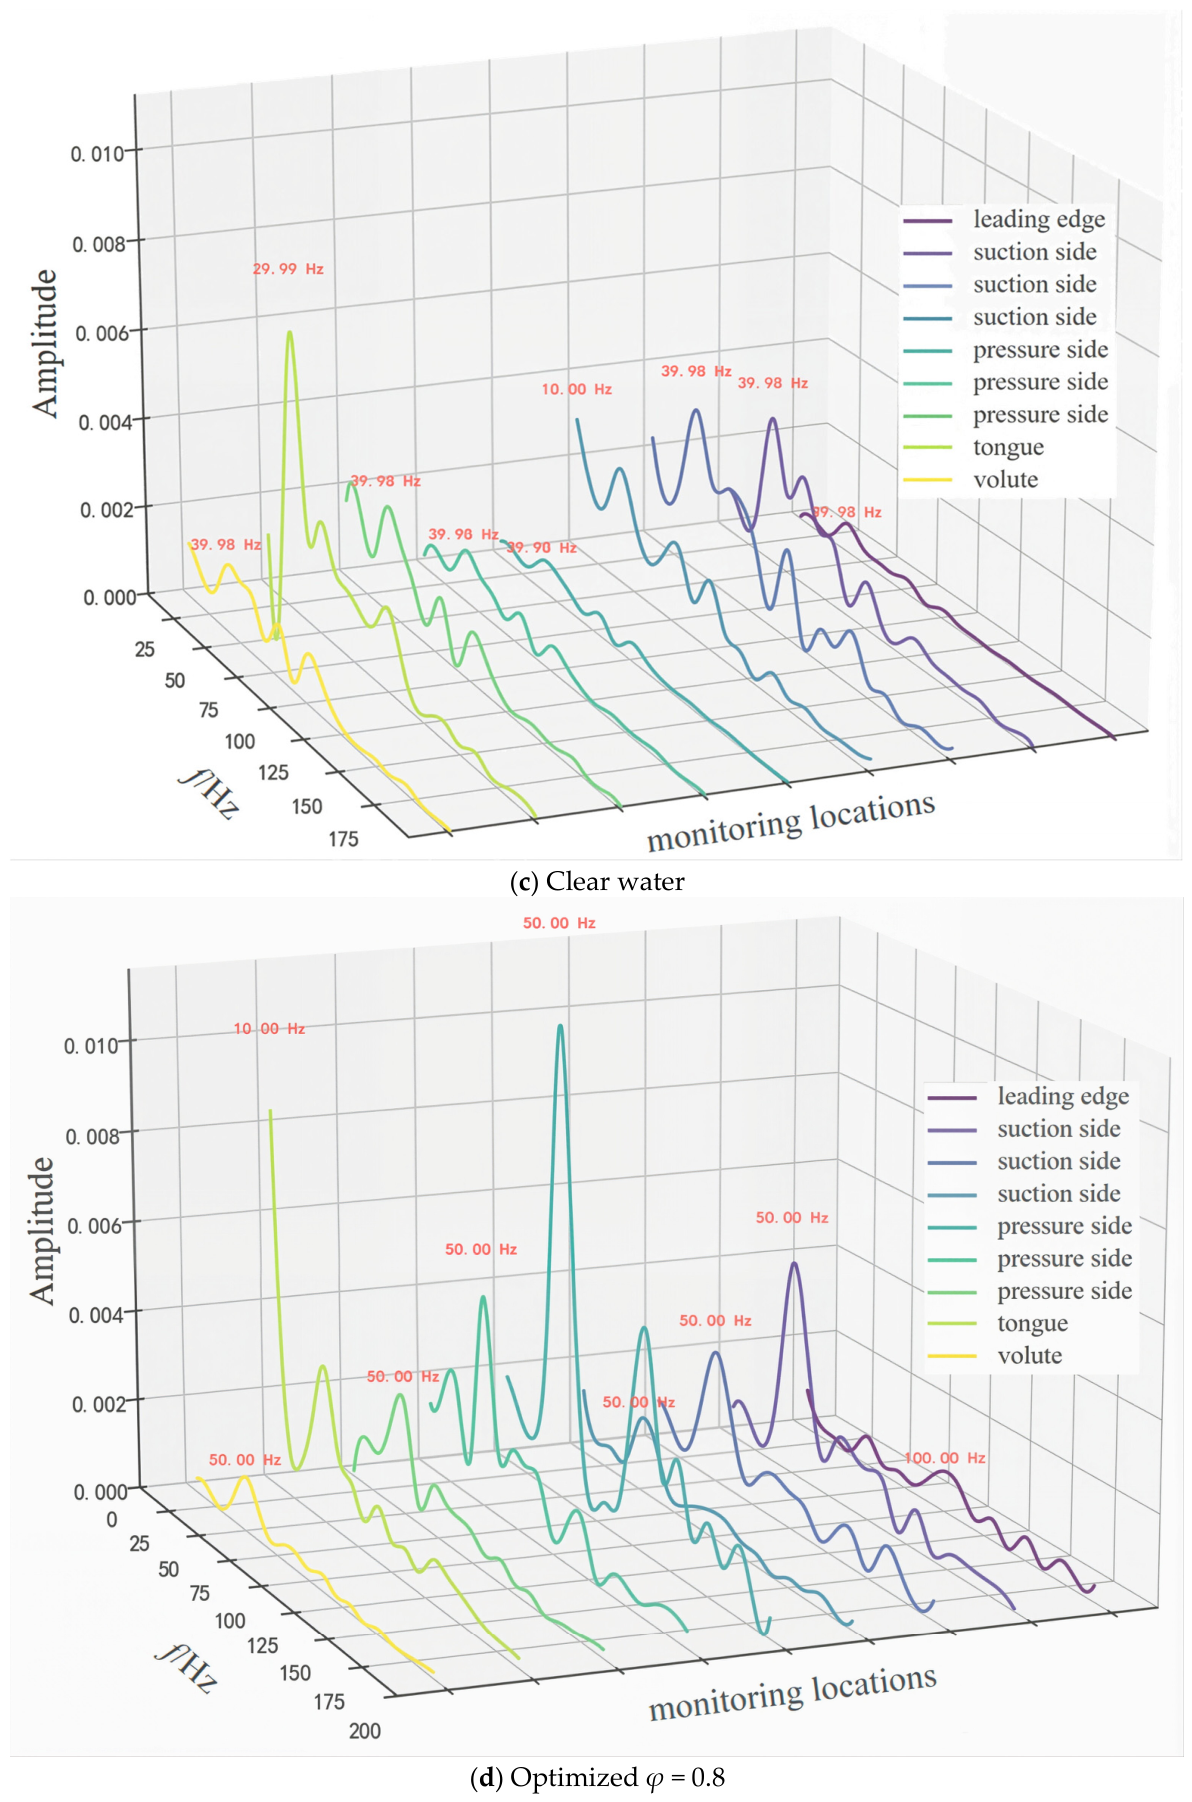
Figure 16c presents the frequency domain analysis of pressure pulsation under clean water conditions. The main frequency remains at 39.98 Hz, but the amplitudes at all measurement points have generally decreased. The spatial distribution of the pulsation is more uniform, indicating that the flow is more stable under clean water conditions, and the boundary layer separation and secondary flow phenomena have weakened. Moreover, the low-frequency component of 10.00 Hz has almost disappeared, and the leading-edge position is no longer the main source of pulsation, confirming that the presence of solid particles leads to the generation of low-frequency disturbances and significantly alters the flow structure and pulsation propagation path within the pump.
Figure 16d shows the pressure pulsation under the optimized condition with non-spherical particles. The pressure pulsation fluctuates strongly near the leading edge and the tongue position, with an amplitude of approximately 0.010. The frequencies at each measurement point are more consistent, all being within the range of 50.00 Hz or its harmonics, indicating that the optimized design makes the flow pattern more regular and reduces the random disturbances caused by the flow-particle interaction. The pulsation intensity at the leading-edge position has significantly weakened, confirming that increasing the inlet angle indeed improves the inlet flow condition. The enhancement of pulsation on pressure surface 1 may be related to the acceleration effect of the fluid on the blade pressure surface after the inlet angle is increased, and this accelerated flow forms a new pulsation source with the particle interaction.
Figure 16e shows the characteristics of the spherical particle condition under the optimized design. It is notable that a pulsation with an amplitude of up to 0.011 appears at the tongue position, with a frequency of 10.00 Hz, approximately 0.21 times the fundamental frequency. Strong 50.00 Hz pulsations are also observed on the suction surface, but they are significantly weaker at the leading-edge position. The polarized distribution of this pressure pulsation indicates that the optimized design improves the inlet flow while possibly deteriorating the flow stability in the outlet region, especially when transporting spherical particles.
In terms of spatial distribution, the pulsation of the original design was mainly concentrated in the tongue and suction surface areas. The leading-edge pulsation was the strongest at φ = 0.8, and it presented a bimodal distribution at φ = 1.0. The optimized design changed this pattern, with the suction surface becoming the main pulsation source under φ = 0.8, and two strong pulsation areas were formed at the tongue and pressure surface 1 under φ = 1.0. The optimized design increased the pressure pulsation in the inlet area and reduced the overall pressure pulsation on the suction surface. The stability of the inlet flow was sacrificed, but the overall strength of the other parts was reduced.

4.4.2. Empirical Mode Decomposition of Pressure Pulsation in the Tongue Separation Area

To conduct a more in-depth study on the pressure pulsation changes at the tongue position under different operating conditions, this research performed EMD analysis on the pressure pulsation data of the centrifugal pump tongue 1 under various conditions. The pressure signals under each condition were decomposed into multiple IMF components and a residual term. The energy shares of each IMF component were calculated, and the dominant frequency component was identified.
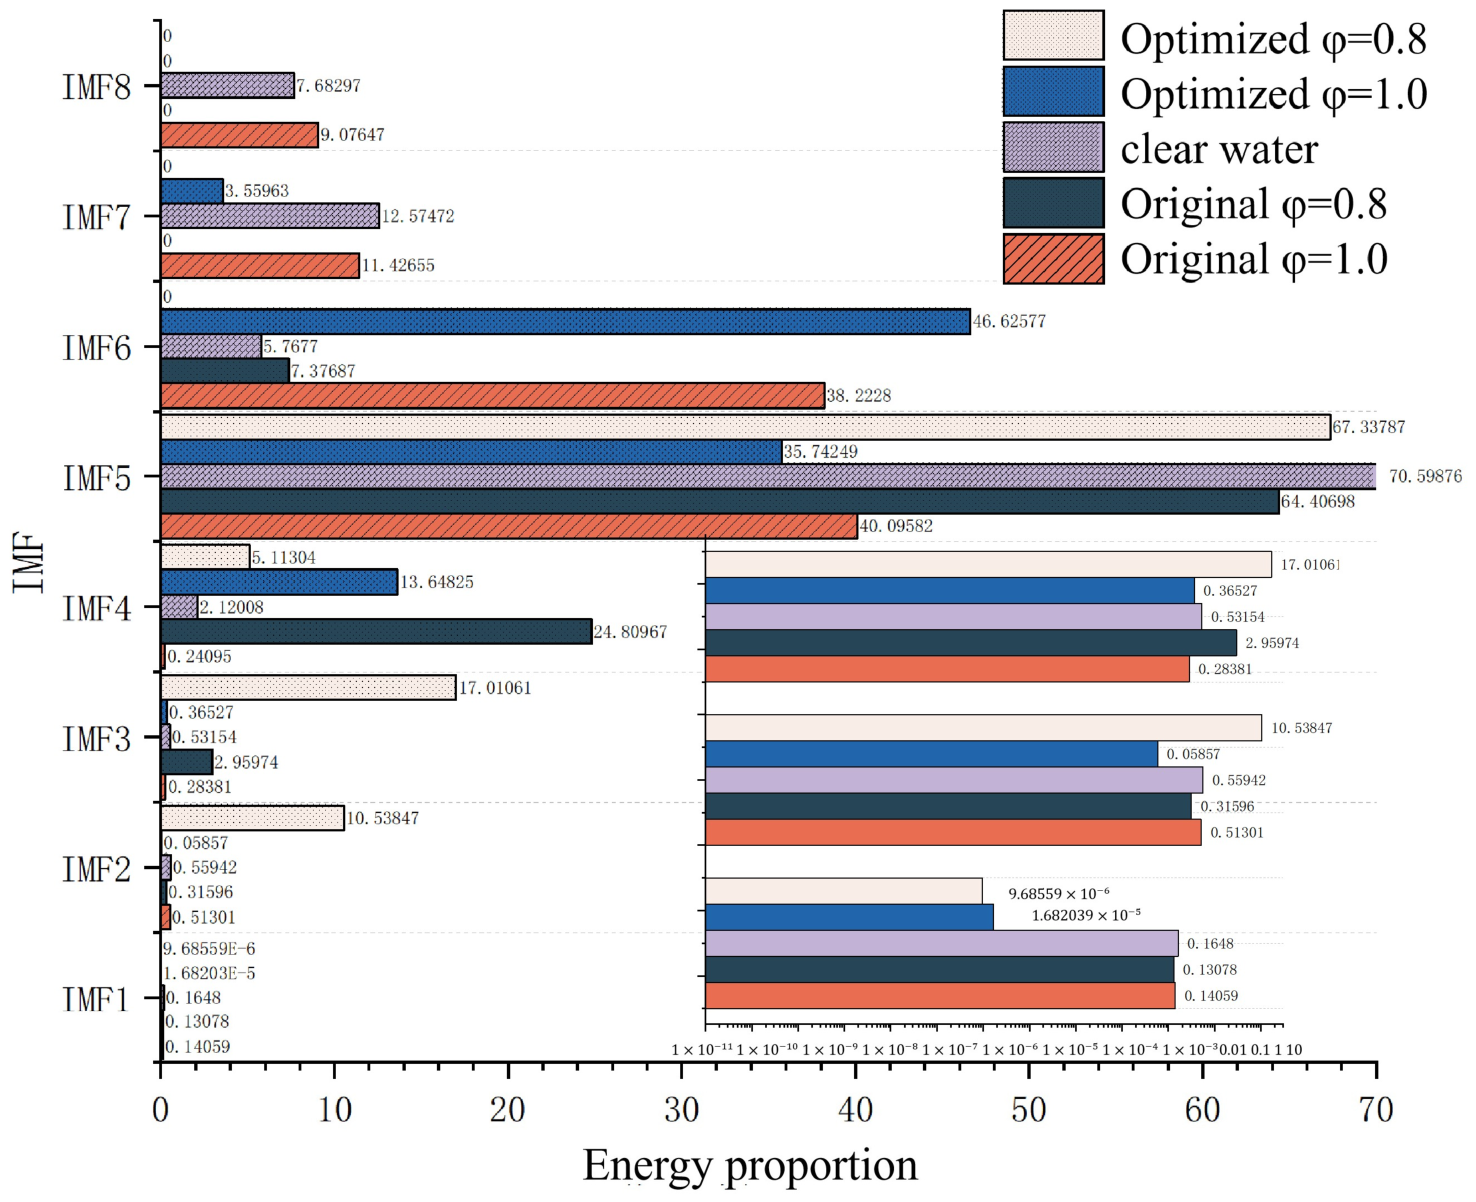
Figure 17 is a bar chart showing the energy proportion of each IMF component. It clearly and intuitively presents the energy distribution characteristics of each IMF component under different operating conditions.
From the figure, it can be seen that the energy distribution in each condition is mainly concentrated in the medium-frequency range. Under the optimized φ = 0.8, clean water, and initial = 1.0 conditions, the energy proportion of IMF5 is the highest, approximately 70%, indicating that in these conditions, the optimized pressure pulsation energy is highly concentrated in this medium-frequency component.
For the high-frequency part, the energy contribution of almost all operating conditions is not high at this point. Apart from optimizing φ = 0.8, the proportions of this condition in IMF2 and IMF3 are 10.5% and 17% respectively, and the remaining parts contribute approximately 1% at this point. The contributions of IMF7 and IMF8 are relatively small overall, especially under the optimized conditions.
The energy distribution characteristics obtained through EMD decomposition provide an important basis for studying the changes in the internal flow structure of centrifugal pumps under different operating conditions. At the same time, it also verifies the effectiveness of the optimized design in improving the pressure pulsation characteristics.
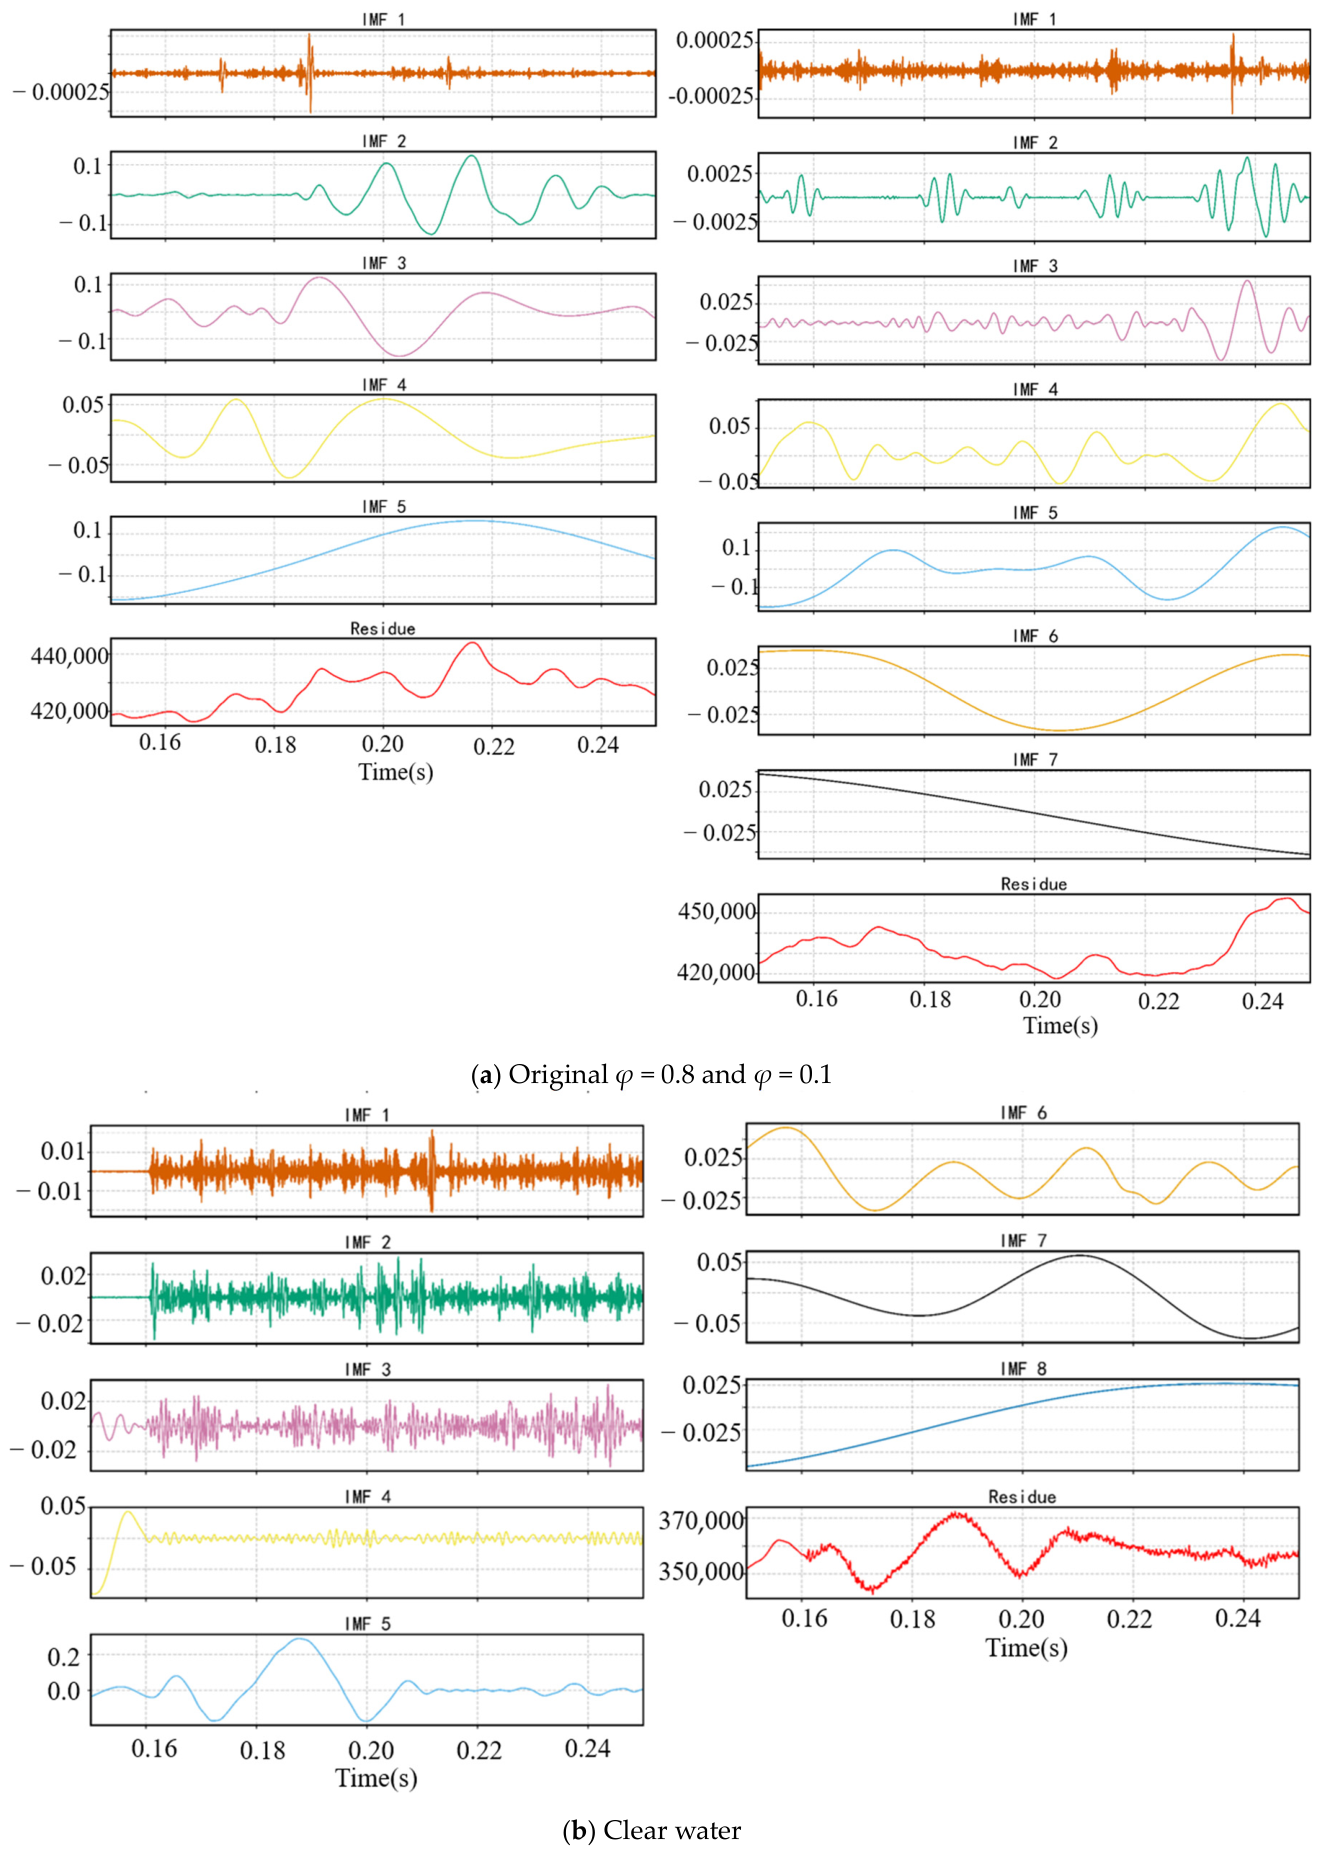
Figure 18 presents the EMD decomposition diagrams under different working conditions, Figure 18a examines the EMD decomposition results under the original model. By comparing spherical particles and non-spherical particles, it can be seen that the intrinsic functions of the two mainly differ in the high-frequency range. Among them, the amplitude of the high-frequency part of the non-spherical particles is significantly higher than that of the decomposition under spherical particles. This might be due to the fact that when non-spherical particles move, due to their own forces and the resulting fluid disorder, the intensity of the high-frequency part increases.
Figure 18b shows the EMD analysis results under clean water conditions. Compared with the original and optimized model conditions, the original pressure data exhibit unique fluctuation characteristics, including both high-frequency small-amplitude oscillations and obvious low-frequency large fluctuations. The high-frequency components such as IMF1 account for a large proportion of IMF4, indicating that high-frequency disturbances are significant under clean water conditions. IMF5 to IMF8 show fluctuation characteristics ranging from medium frequency to very low frequency, among which IMF6 shows a clear periodic vibration. IMF6 exhibits a clear periodic vibration. The residual components are similar to the original pressure waveform, indicating that low-frequency characteristics dominate in this case.
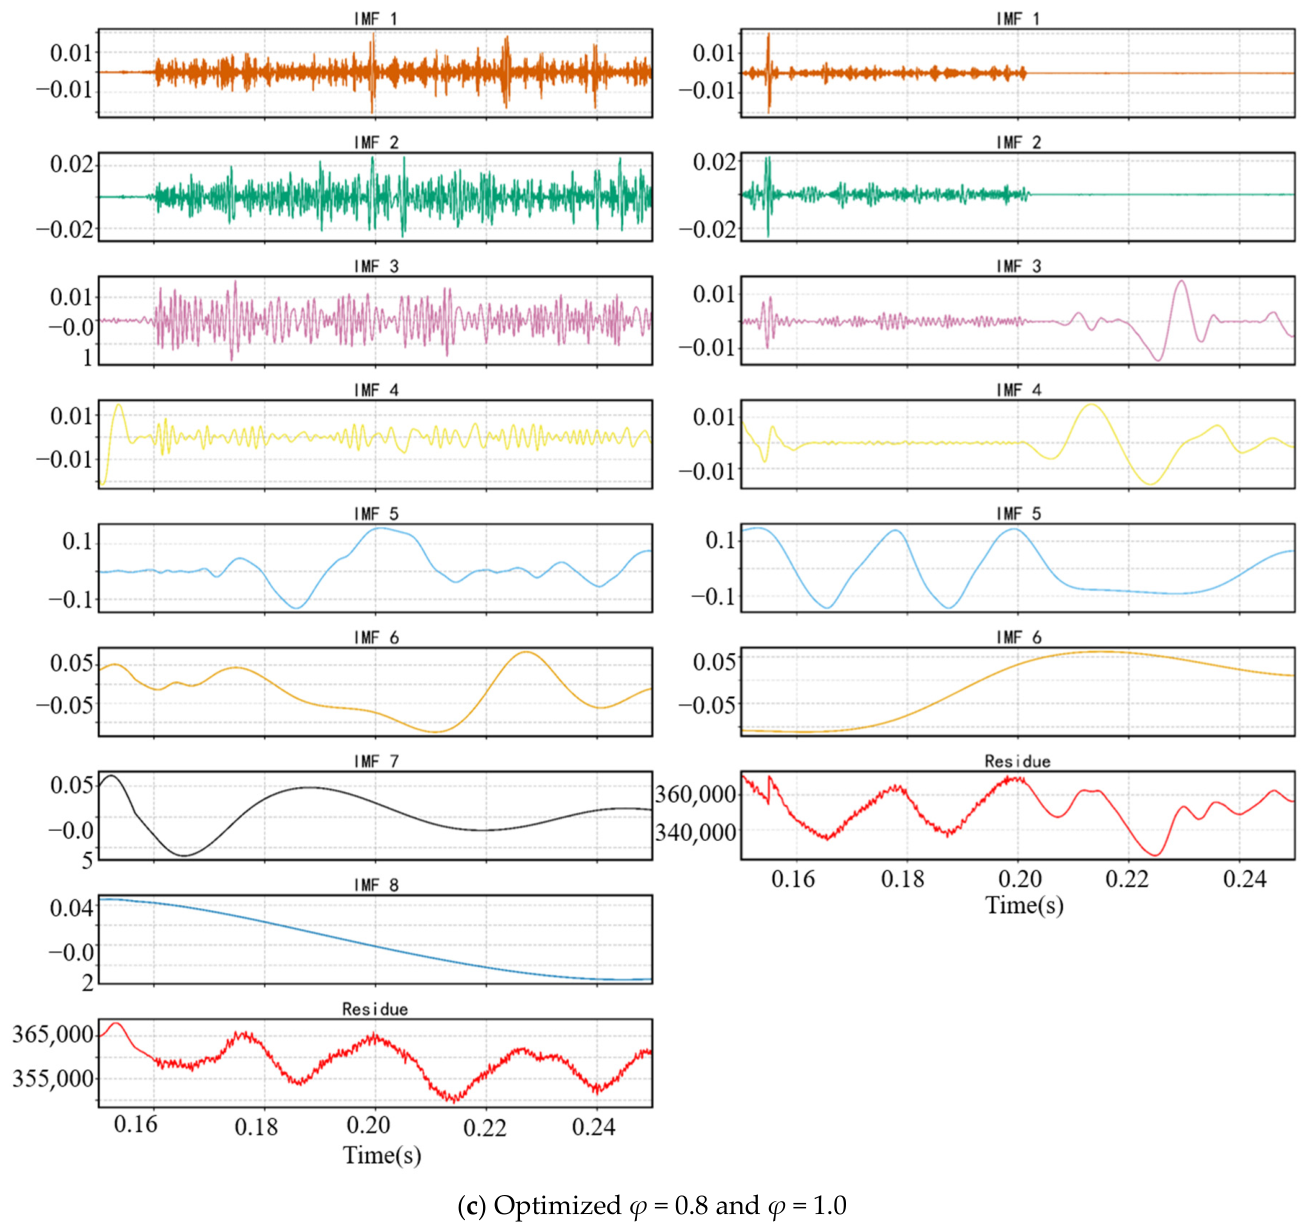
Figure 18c shows the EMD analysis results under φ = 0.8 and φ = 1.0 conditions. Compared with the initial conditions, the amplitude of the original pressure fluctuations after optimization is significantly reduced, indicating that the optimized design effectively reduces the pressure pulsation intensity. The normalized pressure data also show that the fluctuation range of the pressure coefficients under the optimized conditions narrows. The IMF component analysis indicates that the energy proportion of high-frequency components (IMF3–4) decreases under the optimized conditions, and the waveform becomes more regular. The medium- and low-frequency components (IMF4–7) dominate, and IMF4–5 in particular shows regular periodic changes. The residual components show a smoother trend, indicating that the optimized design reduces the instability of the base flow field.
By correctly comparing the three figures, it can be seen that under the optimized conditions, the amplitude of pressure pulsation is significantly reduced compared to the initial conditions, the high-frequency interference components decrease, and the flow field becomes more stable. In each working condition group, the pressure pulsation under the φ = 0.8 condition is generally greater than that under the φ = 1.0 condition, confirming the rule that the instability of non-spherical particle flow increases.

5. Conclusions

  • The analysis of wear distribution shows that the average wear amount of the optimized blades has significantly decreased. Compared to the original model, which caused severe wear at the outlet position of the pressure surface of the blades, the optimized inlet and outlet of the solid–liquid two-phase flow centrifugal pump reduced the wear of the flow passage components significantly and made the wear uniform and consistent. Although the local wear of the front cover plate increased, the overall wear control effect was significant, especially for the control of spherical particles.
  • The increase in the inlet angle of the impeller formed an appropriate vortex, which effectively alleviated the particle deposition phenomenon, making the distribution of particles more uniform when entering the impeller. At the same time, the acceleration process of the particles in the impeller channel was more gradual, reducing the number of collisions with the impeller, especially for spherical particles (φ = 1.0), and this directly reduced the wear risk of the impeller.
  • The entropy generation analysis reveals the changes in the energy mechanism of the optimized design. The high entropy generation areas shift from the extensive distribution around the volute in the original design to the band-like distribution at the rear edge of the blades and the outlet of the flow channel in the optimized design, indicating that the optimization measures have a significant effect on improving the flow in the impeller space.
  • The analysis of pressure pulsation revealed that the optimized design changed the distribution of the sources of flow instability. The pulsation location shifted from being strong at the leading edge and suction surface to being strong at the pressure surface and tongue. The pressure pulsation characteristics of the centrifugal pump tongue were analyzed using EMD. The optimized design concentrated energy on specific frequency components, reduced high-frequency interference, and decreased the pulsation amplitude, making the flow field stable. The pressure pulsation was stronger in the low sphericality (φ = 0.8) condition compared to the high sphericality (φ = 1.0) condition, confirming that reducing the sphericality increases the flow instability.
The present optimization only focuses on the blade inlet and outlet angles of the centrifugal pump. Numerous structural parameters of the impeller have been proven to affect both its anti-abrasion and hydraulic performance in previous studies, and it is impossible to comprehensively investigate all these factors within the scope of this work. Relevant explorations on other structural variables will be carried out in our follow-up research.

Author Contributions

Conceptualization, W.D. and J.X.; methodology, W.D. and J.X.; software, J.X.; validation, J.X., L.Y. and S.L.; formal analysis, J.X.; investigation, L.Y.; resources, W.D.; data curation, L.Y.; writing—original draft preparation, J.X.; writing—review and editing, W.D.; visualization, L.Y.; supervision, W.D.; project administration, W.D.; funding acquisition, W.D. All authors have read and agreed to the published version of the manuscript.

Funding

This research was funded by National Natural Science Foundation of China (Grant No. 52009114), and the Xianyang Major Science and Technology Innovation Special Project (Grant No. L2025-ZDKJ-ZDGG-KTH-004).

Institutional Review Board Statement

Not applicable.

Informed Consent Statement

Not applicable.

Data Availability Statement

The original contributions presented in this study are included in the article. Further inquiries can be directed to the corresponding author.

Conflicts of Interest

The authors declare no conflict of interest.

References

  1. Wang, Y.; Wang, X.L.; Chen, J.; Li, G.X.; Liu, H.L.; Xiong, W. An Experimental Insight into Dynamic Characteristics and Wear of Centrifugal Pump Handling Multi-Size Particulate Slurry. Eng. Fail. Anal. 2022, 138, 106303. [Google Scholar] [CrossRef] [Scilit]
  2. Wang, Y.P.; He, T.L.; Ding, Q.M.; Gao, P.L.; Tao, R.L.; Zhu, Z.C. Analysis of Internal Flow and Wear Characteristics of Binary Mixture Particles in Centrifugal Pump Based on Cfd-Dem. Processes 2022, 10, 681. [Google Scholar] [CrossRef] [Scilit]
  3. Duan, A.Q.; Lin, Z.; Chen, D.S.; Li, Y. A Review on the Hydraulic Performance and Erosion Wear Characteristic of the Centrifugal Slurry Pump. Particuology 2024, 95, 370–392. [Google Scholar] [CrossRef] [Scilit]
  4. Peng, G.J.; Chen, Q.; Bai, L.; Hu, Z.Q.; Zhou, L.; Huang, X. Wear Mechanism Investigation in a Centrifugal Slurry Pump Impeller by Numerical Simulation and Experiments. Eng. Fail. Anal. 2021, 128, 105637. [Google Scholar] [CrossRef] [Scilit]
  5. Tang, C.; Yang, Y.C.; Liu, P.Z.; Kim, Y.J. Prediction of Abrasive and Impact Wear Due to Multi-Shaped Particles in a Centrifugal Pump Via Cfd-Dem Coupling Method. Energies 2021, 14, 2391. [Google Scholar] [CrossRef] [Scilit]
  6. DaqiqShirazi, M.; Torabi, R.; Riasi, A.; Nourbakhsh, S.A. The effect of wear ring clearance on flow field in the impeller sidewall gap and efficiency of a low specific speed centrifugal pump. Proc. Inst. Mech. Eng. Part C-J. Eng. Mech. Eng. Sci. 2018, 232, 3062–3073. [Google Scholar] [CrossRef] [Scilit]
  7. Tarodiya, R.; Gandhi, B.K. Hydraulic performance and erosive wear of centrifugal slurry pumps—A Review. Powder Technol. 2017, 305, 27–38. [Google Scholar] [CrossRef] [Scilit]
  8. Wang, Y.P.; Zu, Y.H.; He, T.L.; Deng, X.F.; Li, Y. Effect of the Volume Concentration of Binary Mixed Particles on the Flow and Wear Characteristics of Centrifugal Pumps. Processes 2024, 12, 1185. [Google Scholar] [CrossRef] [Scilit]
  9. Li, Y.; Zhang, H.Y.; Lin, Z.; Zhang, G.; Zhu, Z.C. Analysis of Particle Motion and Wear Characteristics for Mixed Particle Sizes in Centrifugal Pumps. J. Mech. Sci. Technol. 2023, 37, 4705–4716. [Google Scholar] [CrossRef] [Scilit]
  10. Khan, R.; Ahmad, M.; Ali, S.; Qahtani, F.; Talha, T.; Alqaed, S.; Mustafa, J.; Safdar, S.O. Failure analysis of a centrifugal pump impeller in erosive flow conditions. Eng. Fail. Anal. 2026, 187, 110584. [Google Scholar] [CrossRef] [Scilit]
  11. Yasser, E.; Zhou, L.; El-Emam, M.A. Failure mechanism analysis of erosion in centrifugal pumps attributed to particle morphology: A coupled CFD-DEM-ANN approach. Eng. Fail. Anal. 2025, 181, 109957. [Google Scholar] [CrossRef] [Scilit]
  12. Meerakaviyad, D.; Keville, T.; Prakash, A.; Sajid, A.; Hamad, F. Recent progress in multiphase flow simulation through multiphase pumps. Heat Transf. 2020, 49, 2849–2867. [Google Scholar] [CrossRef] [Scilit]
  13. Huerta, E.H.; Perez, A.I.M.; Amezcua, R.C.; Cardenas, E.E.V.; Ríos, M.M. Integrated CFD and theoretical modeling of erosive wear in composite laminates. Eng. Sci. Technol. 2025, 71, 102182. [Google Scholar] [CrossRef] [Scilit]
  14. Cheng, W.J.; Fan, H.Q.; Cheng, W.J.; Shao, C.L. Investigation on Wear Induced by Solid-Liquid Two-Phase Flow in a Centrifugal Pump Based on Edem-Fluent Coupling Method. Flow Meas. Instrum. 2024, 96, 102542. [Google Scholar] [CrossRef] [Scilit]
  15. Shi, X.W.; Ding, W.J.; Xu, C.J.; Xie, F.W.; Tian, Z.Z. Numerical Investigation of Particle Effect on Wear Characteristic of Centrifugal Slurry Pump Based on Cfd-Dem Coupling. Eng. Comput. 2023, 40, 2386–2408. [Google Scholar] [CrossRef] [Scilit]
  16. Wang, T.T.; Chen, D.Y.; Yu, L.M.; Sun, Q.Q.; Zhang, L.T. Study on the Vortex Characteristics and Wear of Centrifugal Pump Based on Field-Force Coupling Method. Irrig. Drain. 2025, 74, 1410–1422. [Google Scholar] [CrossRef] [Scilit]
  17. Cao, W.D.; Wang, H.; Tang, J.A. Study on Wear Characteristics of a Guide Vane Centrifugal Pump Based on Cfd-Dem. J. Mar. Sci. Eng. 2024, 12, 593. [Google Scholar] [CrossRef] [Scilit]
  18. Wang, Z.Q.; Peng, G.J.; Chang, H.; Hong, S.M.; Ji, G.C. Investigation and Improvement of Centrifugal Slurry Pump Wear Characteristics Via Cfd-Dem Coupling. Water 2024, 16, 3050. [Google Scholar] [CrossRef] [Scilit]
  19. Pu, W.; Ji, L.L.; Li, W.; Shi, W.D.; Tian, F.; Xiao, C.; Yang, Y.; Agarwal, R. Blade Wear Intensity of a Centrifugal Pump Based on an Improved Four-Way Coupling Method. Phys. Fluids 2025, 37, 043323. [Google Scholar] [CrossRef] [Scilit]
  20. Qi, H.D.; Li, W.; Ji, L.L.; Liu, M.J.; Song, R.; Pan, Y.X.; Yang, Y. Performance Optimization of Centrifugal Pump Based on Particle Swarm Optimization and Entropy Generation Theory. Front. Energy Res. 2023, 10, 1094717. [Google Scholar] [CrossRef] [Scilit]
  21. Harsito, C.; Yun, J.E.; Shin, J.Y.; Kim, J.M. Optimal Design of a Liquid Hydrogen Centrifugal Pump Impeller. Energies 2024, 17, 6299. [Google Scholar] [CrossRef] [Scilit]
  22. Wu, T.X.; Wu, D.H.; Gao, S.Y.; Song, Y.; Ren, Y.; Mou, J.G. Multi-Objective Optimization and Loss Analysis of Multistage Centrifugal Pumps. Energy 2023, 284, 128638. [Google Scholar] [CrossRef] [Scilit]
  23. Wang, Y.Q.; Zhou, L.X.; Zheng, S.M. Multi-Objective Optimization Design of Low Specific Speed Centrifugal Pumps Based on Genetic Algorithm. IEEE Access 2023, 11, 97896–97908. [Google Scholar] [CrossRef] [Scilit]
  24. Zhao, J.T.; Pei, J.; Yuan, J.P.; Wang, W.J. Structural Optimization of Multistage Centrifugal Pump Via Computational Fluid Dynamics and Machine Learning Method. J. Comput. Des. Eng. 2023, 10, 1204–1218. [Google Scholar] [CrossRef] [Scilit]
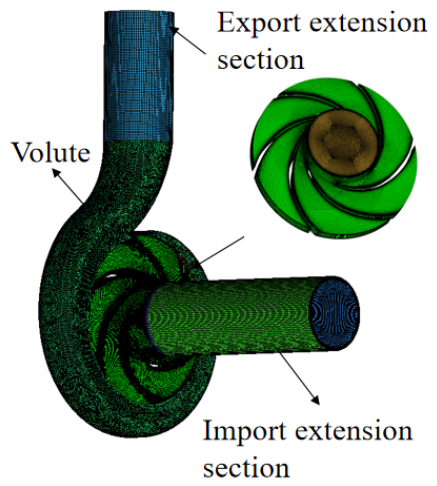
Figure 1. Mesh of centrifugal pump.
Fluids 11 00212 g001
Figure 2. Grid independence verification of centrifugal pump.
Fluids 11 00212 g002
Figure 3. Experimental test bench for centrifugal pump.
Fluids 11 00212 g003
Figure 4. Reliability verification of numerical simulation for centrifugal pump.
Fluids 11 00212 g004
Figure 5. Multi-objective optimization flowchart.
Fluids 11 00212 g005
Figure 6. Scatter plot of the predicted and measured values of the optimization quantity.
Fluids 11 00212 g006
Figure 7. Weighted value fitting response surface analysis graph.
Fluids 11 00212 g007
Figure 8. Comparison of models before and after optimization.
Fluids 11 00212 g008
Figure 9. Comparison of external characteristics before and after optimization.
Fluids 11 00212 g009
Figure 10. Comparison of wear amount before and after optimization.
Fluids 11 00212 g010
Figure 11. Wear cloud maps of the flow passage components of the centrifugal pump before and after optimization.
Fluids 11 00212 g011aFluids 11 00212 g011b
Figure 12. Particle motion trajectory in centrifugal pump at different moments under different working conditions.
Fluids 11 00212 g012aFluids 11 00212 g012b
Figure 13. Entropy production distribution diagram of centrifugal pump under different working conditions.
Fluids 11 00212 g013aFluids 11 00212 g013bFluids 11 00212 g013c
Figure 14. Proportion diagram of different entropy production in flow components of centrifugal pump under different working conditions.
Fluids 11 00212 g014
Figure 15. Distribution diagram of monitoring points in centrifugal pump.
Fluids 11 00212 g015
Figure 16. Frequency domain analysis of the pressure pulsation of the centrifugal pump under various operating conditions.
Fluids 11 00212 g016aFluids 11 00212 g016bFluids 11 00212 g016c
Figure 17. The energy proportion of eigenfunctions.
Fluids 11 00212 g017
Figure 18. Decomposition diagram of eigenfunctions under different working conditions.
Fluids 11 00212 g018aFluids 11 00212 g018b
Table 1. Geometric Parameters of Centrifugal Pump.
Geometry ParameterNumerical Value
Design flow Qd (m3/h)50
Design head Hd (m)39
Design speed nd (r/min)2900
The diameter of the impeller inlet D1/(mm)75
The diameter of the impeller outlet D2/(mm)170
Number of blades Z1/(mm)6
Disclaimer/Publisher’s Note: The statements, opinions and data contained in all publications are solely those of the individual author(s) and contributor(s) and not of MDPI and/or the editor(s). MDPI and/or the editor(s) disclaim responsibility for any injury to people or property resulting from any ideas, methods, instructions or products referred to in the content.