Article

Catalytic Combustion Enhancement of Cottonseed Biodiesel-Based Nanofuel Containing MgCO3 Nanoparticles in a Diesel Engine: Experimental Investigation and RSM Optimization


1
Marine Engineering Department, Bandirma Onyedi Eylul University, Balikesir 10200, Türkiye
2
Mechanical Engineering Department, Karabuk University, Karabuk 78050, Türkiye
*
Author to whom correspondence should be addressed.
Fluids 2026, 11(8), 193; https://doi.org/10.3390/fluids11080193
Submission received: 18 June 2026 / Revised: 29 July 2026 / Accepted: 31 July 2026 / Published: 3 August 2026

Abstract

This study investigates the effects of magnesium carbonate (MgCO3) nanoparticles in addition to cottonseed biodiesel/diesel blends on diesel engine performance and emission characteristics. Experiments were conducted under various engine loads, and Response Surface Methodology (RSM) was employed for modeling and multi-objective optimization of operating parameters. Results showed that biodiesel blends increased brake-specific fuel consumption (BSFC) by up to 16.11% and reduced brake thermal efficiency (BTE) by up to 13.53% compared to diesel fuel, mainly due to lower calorific value and higher viscosity. However, the addition of MgCO3 nanoparticles improved combustion performance, reducing BSFC by up to 5.25% and increasing BTE by up to 5.87% under optimal conditions. Emission analysis revealed that nitrogen oxide (NOx) emissions increased by up to 49.06%, while hydrocarbon (HC) and carbon monoxide (CO) emissions decreased by up to 42.44% and 51.93%, respectively, indicating enhanced combustion efficiency. Carbon dioxide (CO2) emissions increased by up to 17.67% due to improved oxidation reactions. RSM analysis confirmed the statistical significance of the developed models with high coefficients of determination (R2 = 0.9178–0.9921). The optimal operating condition was determined to be 52.30 ppm MgCO3 and 1.51 kW engine load. Validation experiments showed good agreement between predicted and experimental results, with errors ranging from 0.71% to 8.83%, all within acceptable limits. Overall, the study demonstrates that MgCO3 nanoparticles can partially mitigate the performance drawbacks of biodiesel while improving combustion quality, and RSM is an effective tool for optimizing engine operating conditions.

1. Introduction

The continuous increase in global energy demand and the acceleration of industrialization have led to a significant increase in fossil fuel consumption, particularly in the transportation and energy production sectors [1]. Diesel engines are among the most widely used energy conversion systems today due to their high thermal efficiency, durability, reliable operation, and low operating costs [2]. However, their heavy reliance on petroleum-based diesel fuels brings with it serious environmental and economic problems due to the dwindling reserves of fossil fuels, fluctuations in crude oil prices, and the release of harmful emissions such as carbon monoxide (CO), hydrocarbons (HC), nitrogen oxides (NOx), and carbon dioxide (CO2) into the atmosphere [3,4,5]. These emissions significantly contribute to increased air pollution, global climate change, and negative impacts on human health [6]. Therefore, one of the most important study fields in the world in recent years is the development of ecologically friendly, sustainable, and renewable alternative fuels that may be utilized in diesel engines.
Among the various alternative fuels used in compression ignition engines, biodiesel has become a noteworthy fuel type due to its renewable nature, biodegradability, high oxygen content, sulfur-free nature, and the fact that it can be used in existing diesel engine systems without requiring significant structural changes [7,8]. Biodiesel can be produced from a wide variety of raw materials, including edible oils, non-edible vegetable oils, waste frying oils, animal fats, and microalgae [9,10]. However, the use of edible oils in biodiesel production has led to serious debates regarding food safety and the use of agricultural land, creating a significant problem described in the literature as the “food-versus-fuel” problem [11]. Therefore, recent studies have focused on second-generation biodiesel raw materials obtained from unsustainable biomass sources that are unsuitable for human consumption.
Cottonseed oil stands out as a promising second-generation biodiesel feedstock due to its widespread availability, relatively low production cost, renewable nature, and unsuitability for human consumption [12]. Additionally, cottonseed biodiesel can be utilized directly in diesel engines at different blending ratios because it shares physical and chemical characteristics with traditional diesel fuel [13]. Studies in the literature show that cottonseed biodiesel improves combustion quality and reduces CO [14] and HC [15] emissions resulting from incomplete combustion thanks to its high oxygen content and higher cetane number [16]. However, due to its lower calorific value and higher viscosity compared to diesel fuel, negative aspects such as increased brake-specific fuel consumption (BSFC) and decreased brake thermal efficiency (BTE) can also be observed [17]. Additionally, the increased oxygen content in the combustion environment can lead to increased cylinder temperatures, resulting in increased NOx emissions [18]. Therefore, improving the combustion characteristics and engine performance of cottonseed biodiesel is considered a significant research area today.
In recent years, nanoparticle additives have become a significant research topic in biodiesel-fueled diesel engines to improve combustion efficiency and reduce exhaust emissions. Thanks to their high surface area/volume ratio, improved thermal conductivity, and catalytic oxidation properties, nanoparticles provide a more efficient combustion process by improving fuel atomization, reducing ignition delay, and accelerating oxidation reactions [19]. Several studies have demonstrated that the incorporation of metal and metal oxide nanoparticles into biodiesel blends leads to considerable improvements in engine performance and emission characteristics. Bitire et al. reported that CuO nanoparticles enhanced heat transfer characteristics, improved thermo-physical fuel properties, and contributed to reductions in harmful exhaust emissions in biodiesel-fueled diesel engines [20]. Similarly, Muniyappan and Krishnaiah investigated cerium dioxide (CeO2), copper (II) oxide (CuO), and titanium dioxide (TiO2) nanoparticle additives in mahua biodiesel blends and observed increases in BTE together with significant decreases in BSFC, CO, HC, smoke, and NOx emissions due to enhanced combustion behaviour [21]. Mylapalli et al. demonstrated that Fe3O4 nanoparticle-dispersed biodiesel blends improved cylinder pressure and heat release rate while simultaneously decreasing CO, HC, NOx, and smoke emissions, indicating enhanced in-cylinder combustion characteristics [22]. In another study, Aswathanrayan et al. reported that Al2O3 nanoparticles improved fuel oxidation behaviour and combustion efficiency owing to their catalytic activity and high surface area, resulting in improved BTE and reduced exhaust emissions in neem biodiesel blends [23]. Although numerous studies have focused on nanoparticle-assisted biodiesel combustion enhancement using additives such as Al2O3, TiO2, CeO2, CuO, ZnO, and Fe-based nanoparticles, the catalytic potential of magnesium carbonate (MgCO3) nanoparticles has received very limited attention in the existing literature. Therefore, further investigation of MgCO3 nanoparticle-doped second-generation biodiesel fuels is required to better understand their effects on diesel engine combustion, performance, and emission characteristics.
MgCO3 nanoparticles are noteworthy additives due to their catalytic surface activity, oxygen-carrying capacity, high thermal stability, and potential to improve fuel–air interaction during combustion [24]. Thanks to these properties, they can contribute to accelerating oxidation reactions, improving heat dissipation and creating a more efficient combustion process in diesel engines using biodiesel blends. Although numerous studies exist in the literature on various nanoparticle additives in different biodiesel fuels, comprehensive research examining the use of MgCO3 nanoparticles in combination with cottonseed biodiesel is quite limited. Furthermore, most existing studies are limited to experimental evaluations conducted under restricted operating conditions, rather than optimizing engine operating parameters and nanoparticle concentrations together. To overcome these limitations, the use of advanced statistical optimization methods in internal combustion engine studies has become widespread. Among these methods, Response Surface Methodology (RSM) is frequently preferred because it can generate reliable mathematical models with fewer experiments, analyse interactions between variables, and determine optimum operating conditions [25]. Furthermore, RSM stands out as an effective method for optimizing engine performance, fuel consumption, and emission parameters simultaneously.
The purpose of this work was to use cottonseed biodiesel blends enhanced with MgCO3 nanoparticles to experimentally explore and optimize the emission characteristics and performance of a diesel engine. In this investigation, cottonseed oil was initially converted to biodiesel using transesterification. For initial testing, the generated biodiesel was combined with diesel fuel at volumetric percentages of 10%, 20%, 30%, and 40%. MgCO3 nanoparticles were added to B30, which was shown to be the best base fuel mixture in the initial tests, at concentrations of 50, 100, and 150 parts per million. Six various load scenarios, ranging from 0.5 to 3 kW, and a steady engine operating speed of 3000 rpm were used for engine testing. The combined effects of engine load and nanoparticle concentration on performance and exhaust emissions were assessed by applying the RSM approach to the collected experimental data. The unique contributions of this study can be summarized as follows. First, cottonseed oil, a widely available and sustainable second-generation feedstock, was utilized for biodiesel production, and preliminary experiments identified the B30 blend as the optimum baseline fuel in terms of overall engine performance and emission trade-off. Second, unlike previous studies in the literature, which have rarely investigated the combined use of cottonseed biodiesel and MgCO3 nanoparticles, this work systematically evaluates the influence of MgCO3 as an emerging and relatively underexplored combustion-enhancing additive for biodiesel-fuelled diesel engines. Third, a comprehensive experimental campaign was conducted, involving three different MgCO3 nanoparticle concentrations and six distinct engine load conditions, enabling a detailed and systematic evaluation of both performance and emission characteristics under a wide operating range. Finally, all experimental datasets were integrated and optimized using the RSM, allowing simultaneous multi-objective optimization of engine responses. To the best of the authors’ knowledge, the combined application of cottonseed biodiesel with MgCO3 nanoparticles, supported by a full factorial-like experimental design and RSM-based optimization across multiple engine loads, has not been previously reported. Therefore, this study fills an important gap in the literature by providing new insights into nanoparticle-enhanced biodiesel combustion and offers a practical pathway toward cleaner, more efficient, and optimized diesel engine operation.

2. Materials and Methods

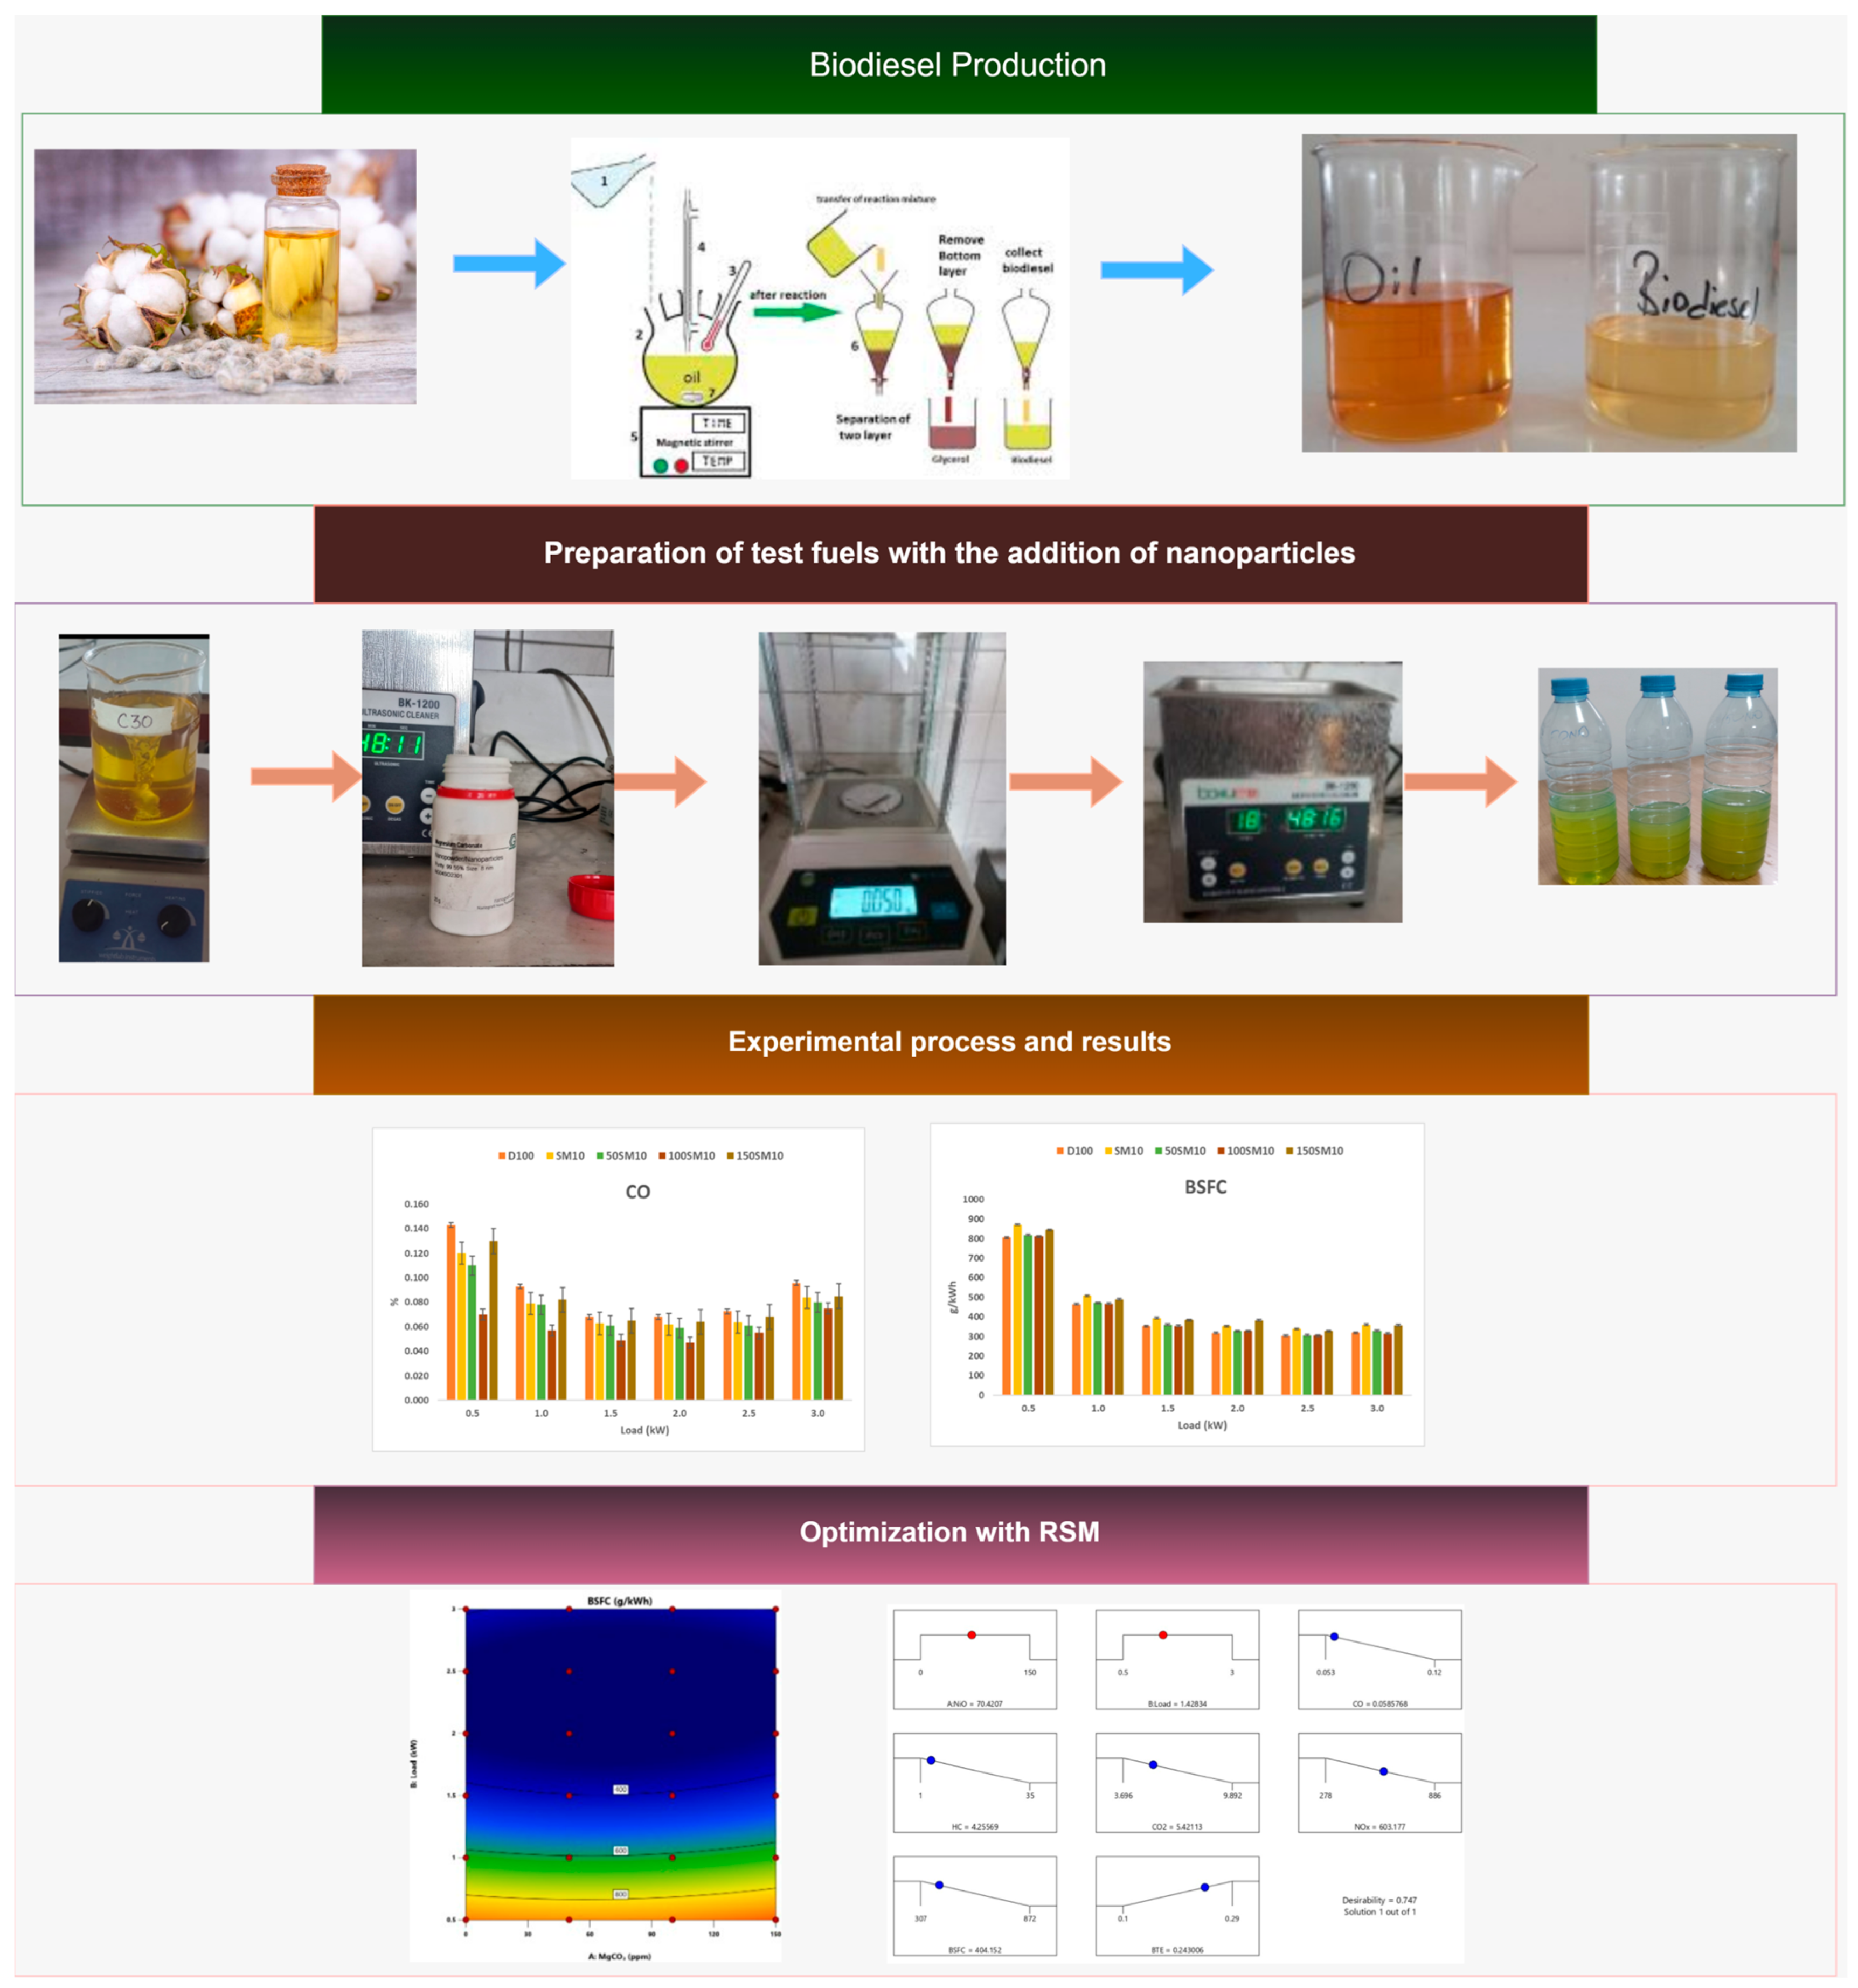
Concerns regarding sustainability and the effects on the environment are raised using conventional fossil fuels as energy sources in a variety of industries, including transportation and agriculture. To solve these issues and assess biodiesel made from cottonseed oil as a sustainable and renewable alternative fuel source, this study was conducted. The study’s graphical representation is presented in Figure 1. Biodiesel was first produced using cottonseed oil. The produced biodiesel was mixed with diesel at volumetric percentages of between 10% and 40%, to determine the optimal mixing ratio. Preliminary experiments showed that the 30% fuel mixture yielded the best emissions and performance. To make test fuels, three different quantities of MgCO3 nanoparticles (50, 100, and 150 ppm) were combined with the 30% cottonseed biodiesel mixture. These test fuels were then used for engine tests on a diesel generator at six different loads, ranging from 0.5 to 3 kW. In this study, the effects of nanoparticle quantity on engine performance and emissions were investigated using three different quantities, and the effects of engine load on engine performance and emissions were investigated using six different engine loads. The concentration of MgCO3 and engine loads that produced the best performance and the lowest emissions were then found via RSM optimization based on these experimental findings.

2.1. Production of Cottonseed Biodiesel

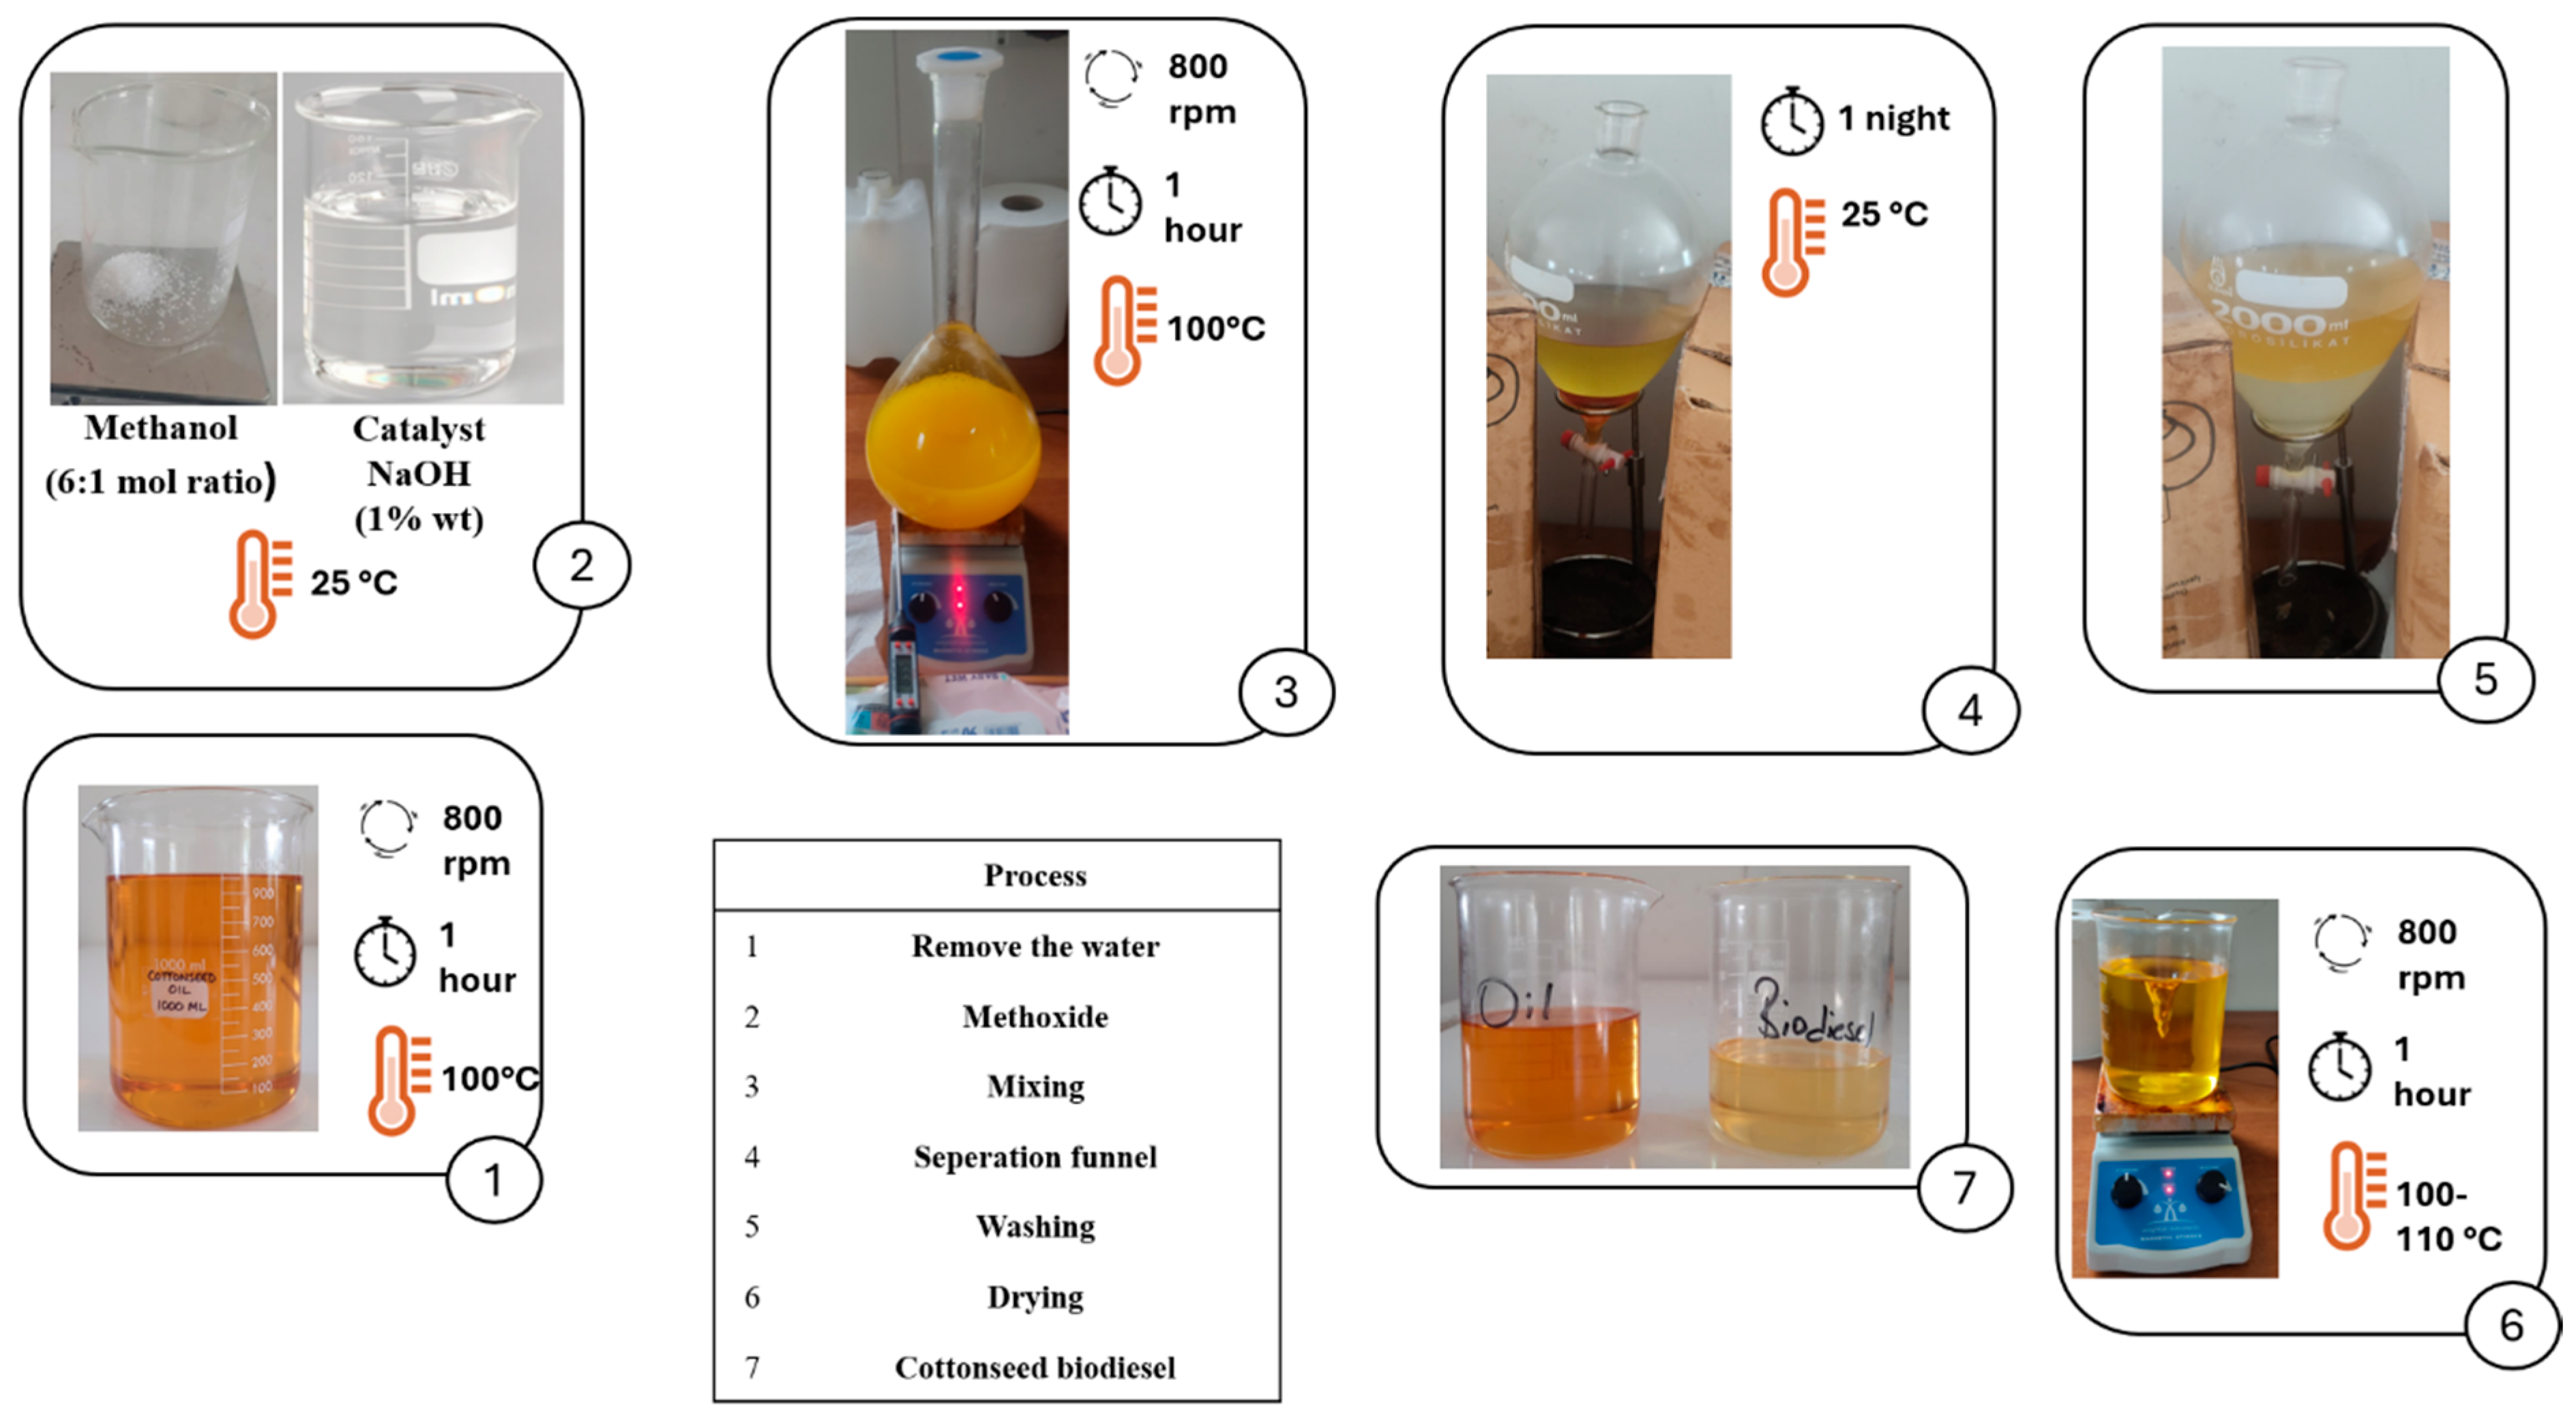
Biodiesel can be produced using a variety of source materials. Because of their similar physical and chemical characteristics to diesel, biodiesels are favorable in this regard and can be utilized in conventional fossil fuel distribution and storage systems without requiring significant modifications. For the manufacturing of biodiesel to be sustainable and renewable, raw materials are essential. With an estimated global production of approximately 42.1 million metric tons in 2023 and the advantage of not being directly used as a primary food source, cottonseed stands out as a promising feedstock for biodiesel production [26]. In this work, cottonseed oil was converted into biodiesel using the transesterification process. Triglyceride molecules combine with an alcohol and base catalyst during the chemical process known as transesterification to produce glycerol and fatty acid esters. The processing of biodiesel is depicted schematically in Figure 2. First, water was extracted by heating cottonseed oil that was purchased from a nearby provider. To conduct the reaction, a mixture of methanol and NaOH was made while the heated oil was allowed to cool to room temperature. Methoxide was added and combined with the oil once it reached the proper temperature. The mixture was allowed to sit at room temperature to extract the glycerine once the mixing operation was finished. After the glycerine was extracted, the biodiesel was washed to remove any unwanted substances. After cleaning, the biodiesel was heated once again to remove the water.

2.2. MgCO3 Nanoparticle Addition

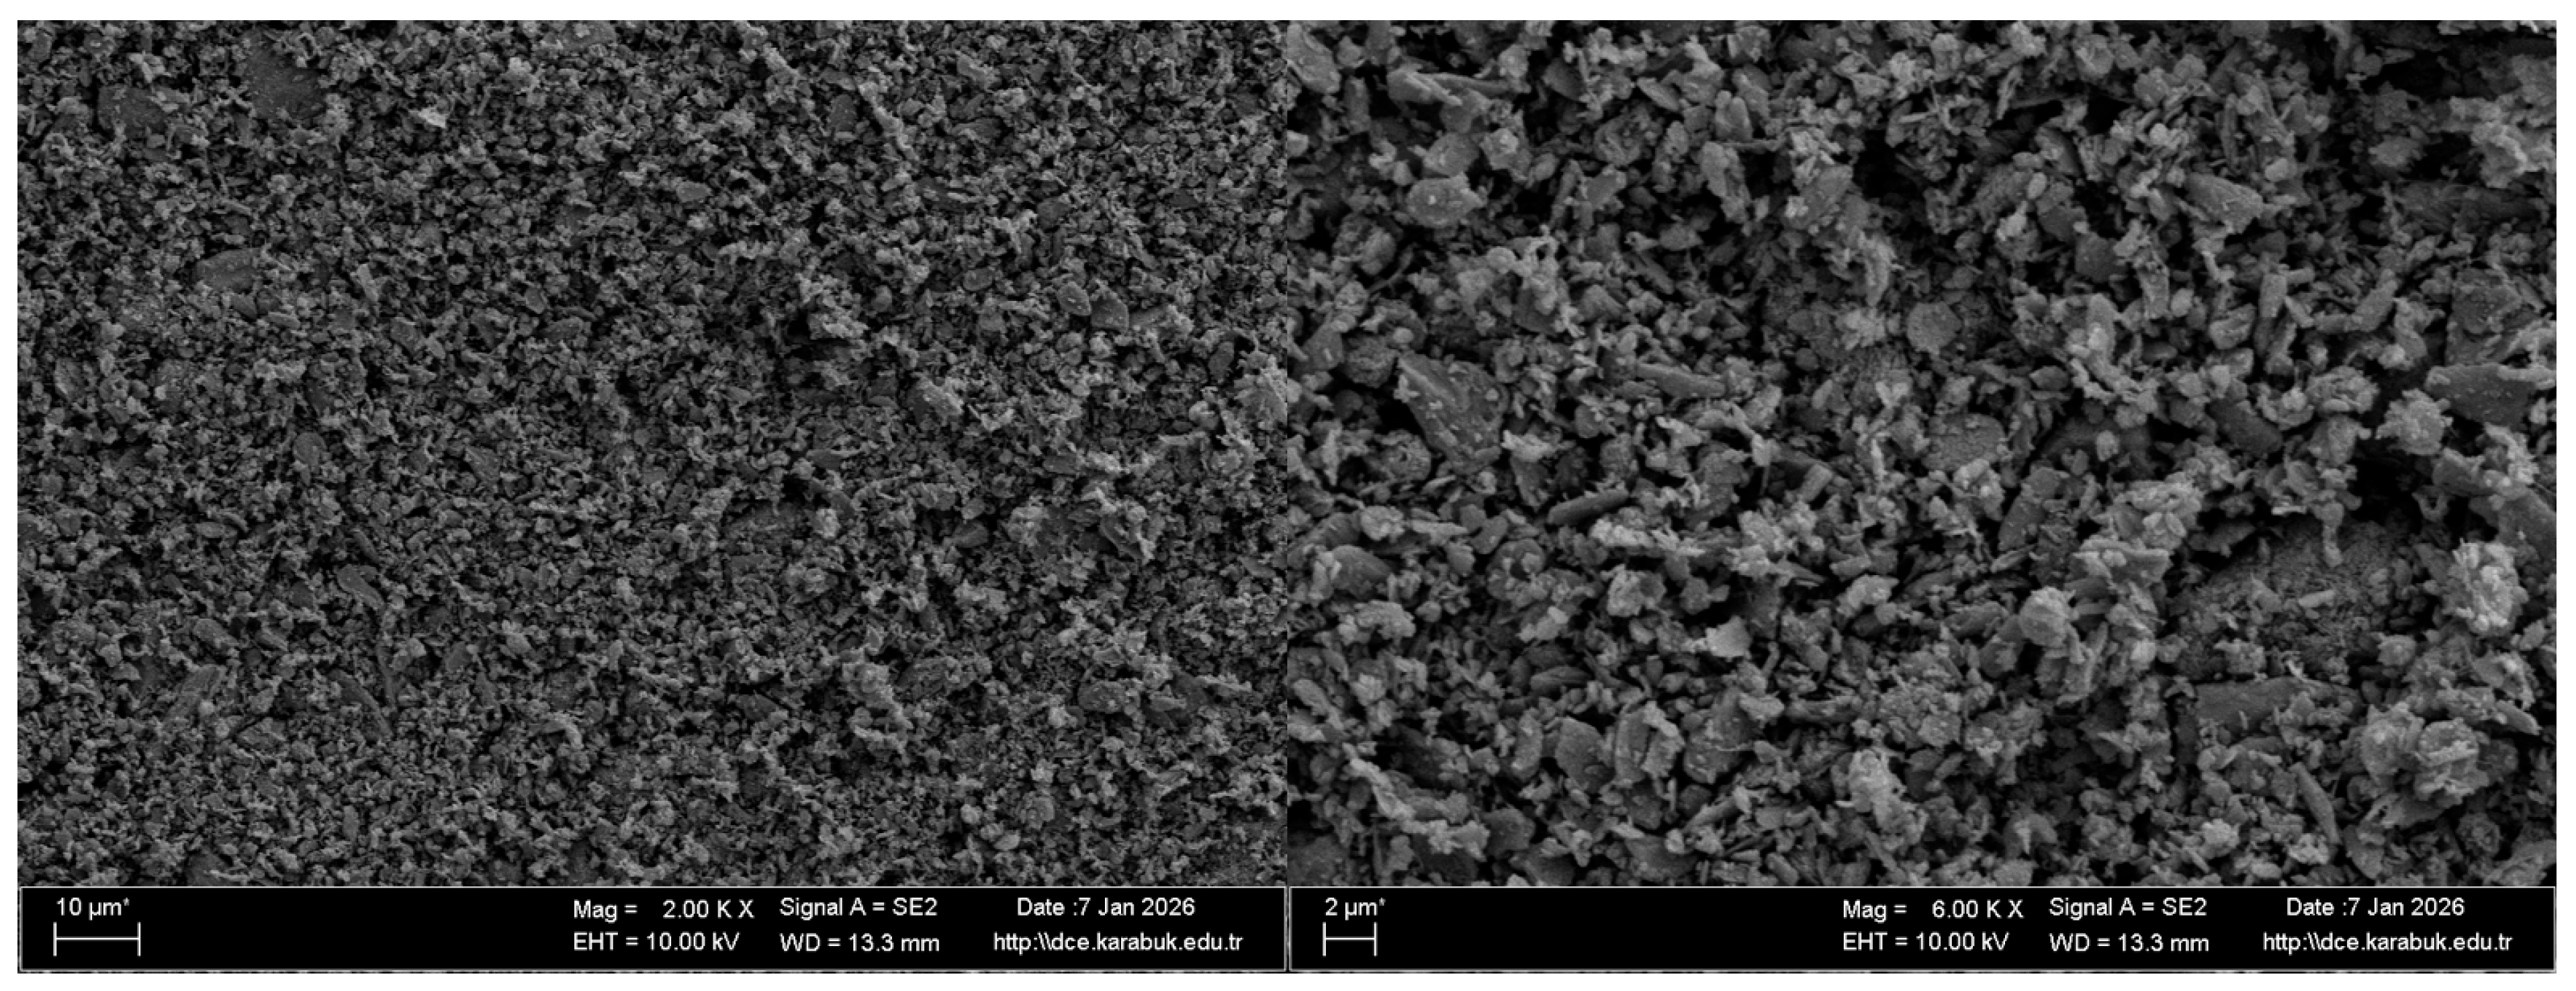
Figure 3 displays scanning electron microscope (SEM) images of a MgCO3 nanoparticle at magnifications of 2 kX and 6 kX. The surface shape and particle size distribution of the nanoparticle are clearly displayed in Figure 3. The particles are seen to aggregate to create irregularly shaped macrostructures with a porous matrix at 2.00 kX magnification. This is a common sign of the high surface energy-induced aggregation tendency. Examining the image at a greater magnification (6.00 kX) reveals that these enormous clusters are the result of much smaller, primary nanoparticles aggregating.
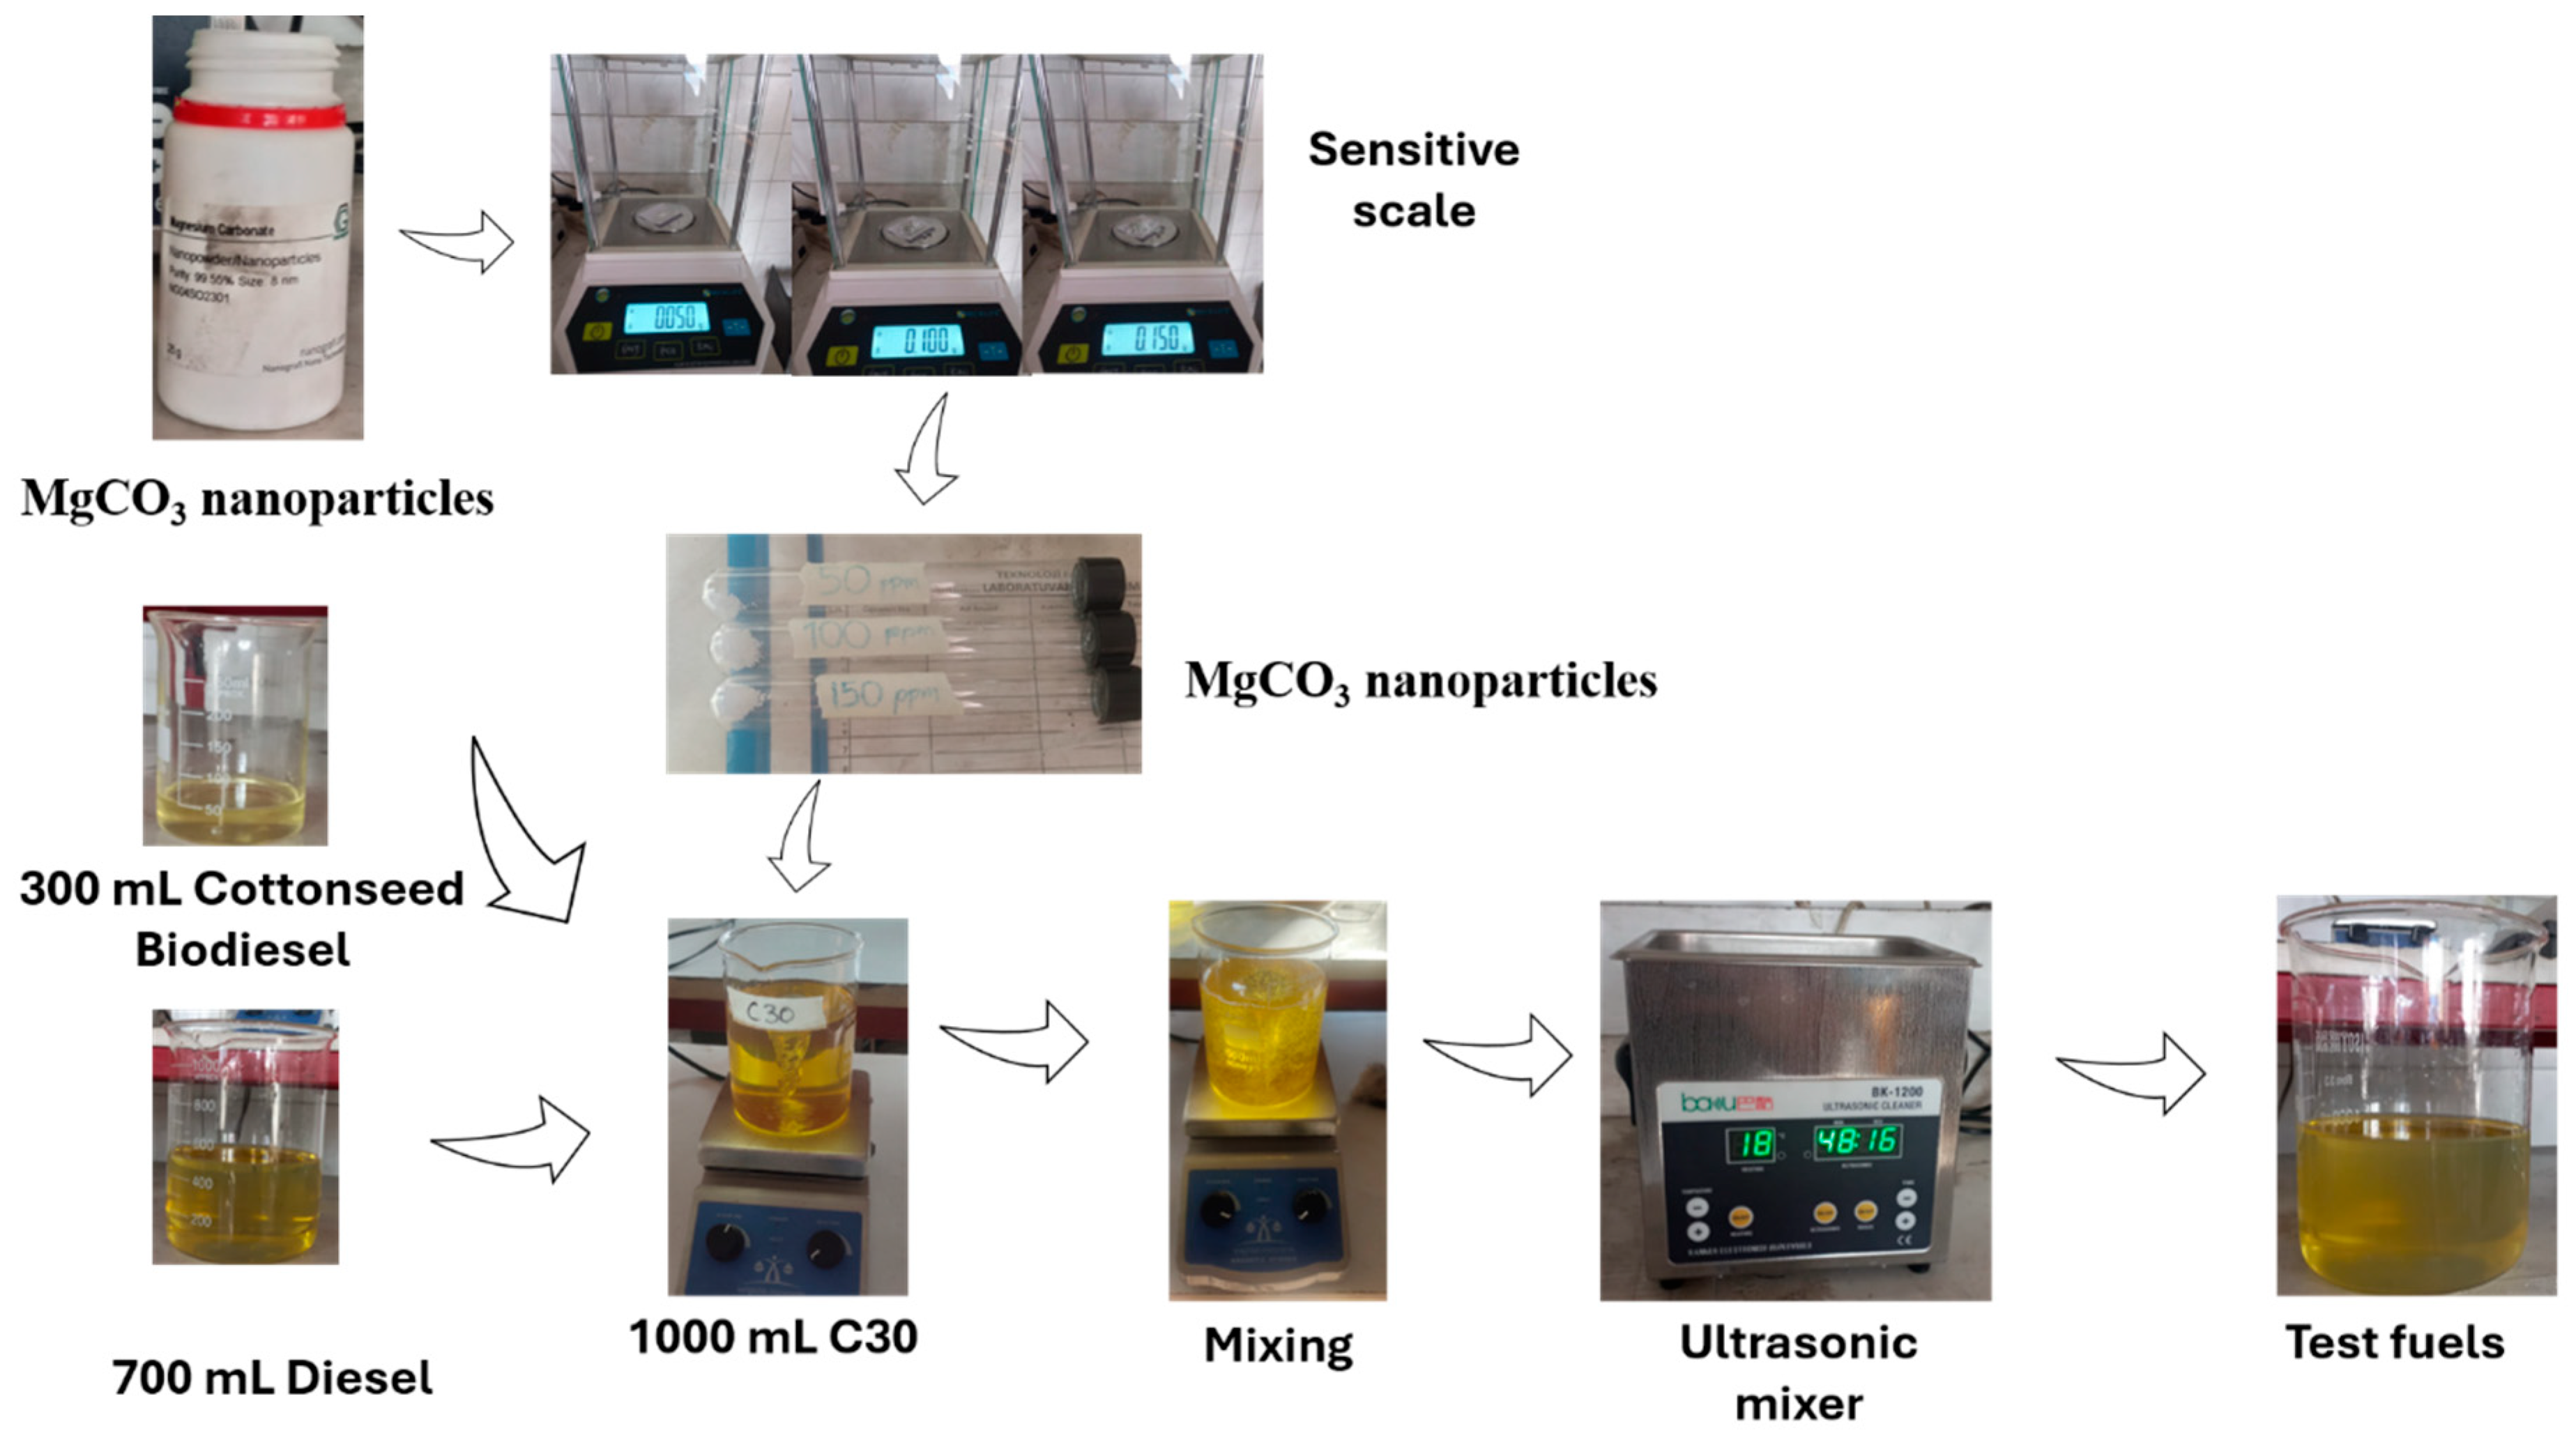
First, C30 fuel (70% pure diesel and 30% biodiesel) was made to prepare the test fuels. A homogenous mixture was achieved by mixing 300 mL of cottonseed biodiesel and 700 mL of pure diesel in a beaker at ambient temperature and atmospheric pressure for an hour at a steady speed of 800 rpm. A precision balance was used to measure the MgCO3 nanoparticles before adding 1000 mL of the resulting fuel mixture to achieve 50 ppm MgCO3. The fuel mixture was supplemented with the measured nanoparticles. Following the addition of nanoparticles, the fuel mixture was first agitated for an hour with a magnetic stirring device and then for two hours with an ultrasonic mixer. The 50C30 (50 ppm MgCO3 + 70% pure diesel + 30% biodiesel) test fuel was produced after mixing. The test fuels 100C30 (100 ppm MgCO3 + 70% pure diesel + 30% biodiesel) and 150C30 (150 ppm MgCO3 + 70% pure diesel + 30% biodiesel) underwent these processes. Figure 4 depicts the fuel preparation process schematically. Table 1 shows the features of the test fuels.

2.3. Experimental Process

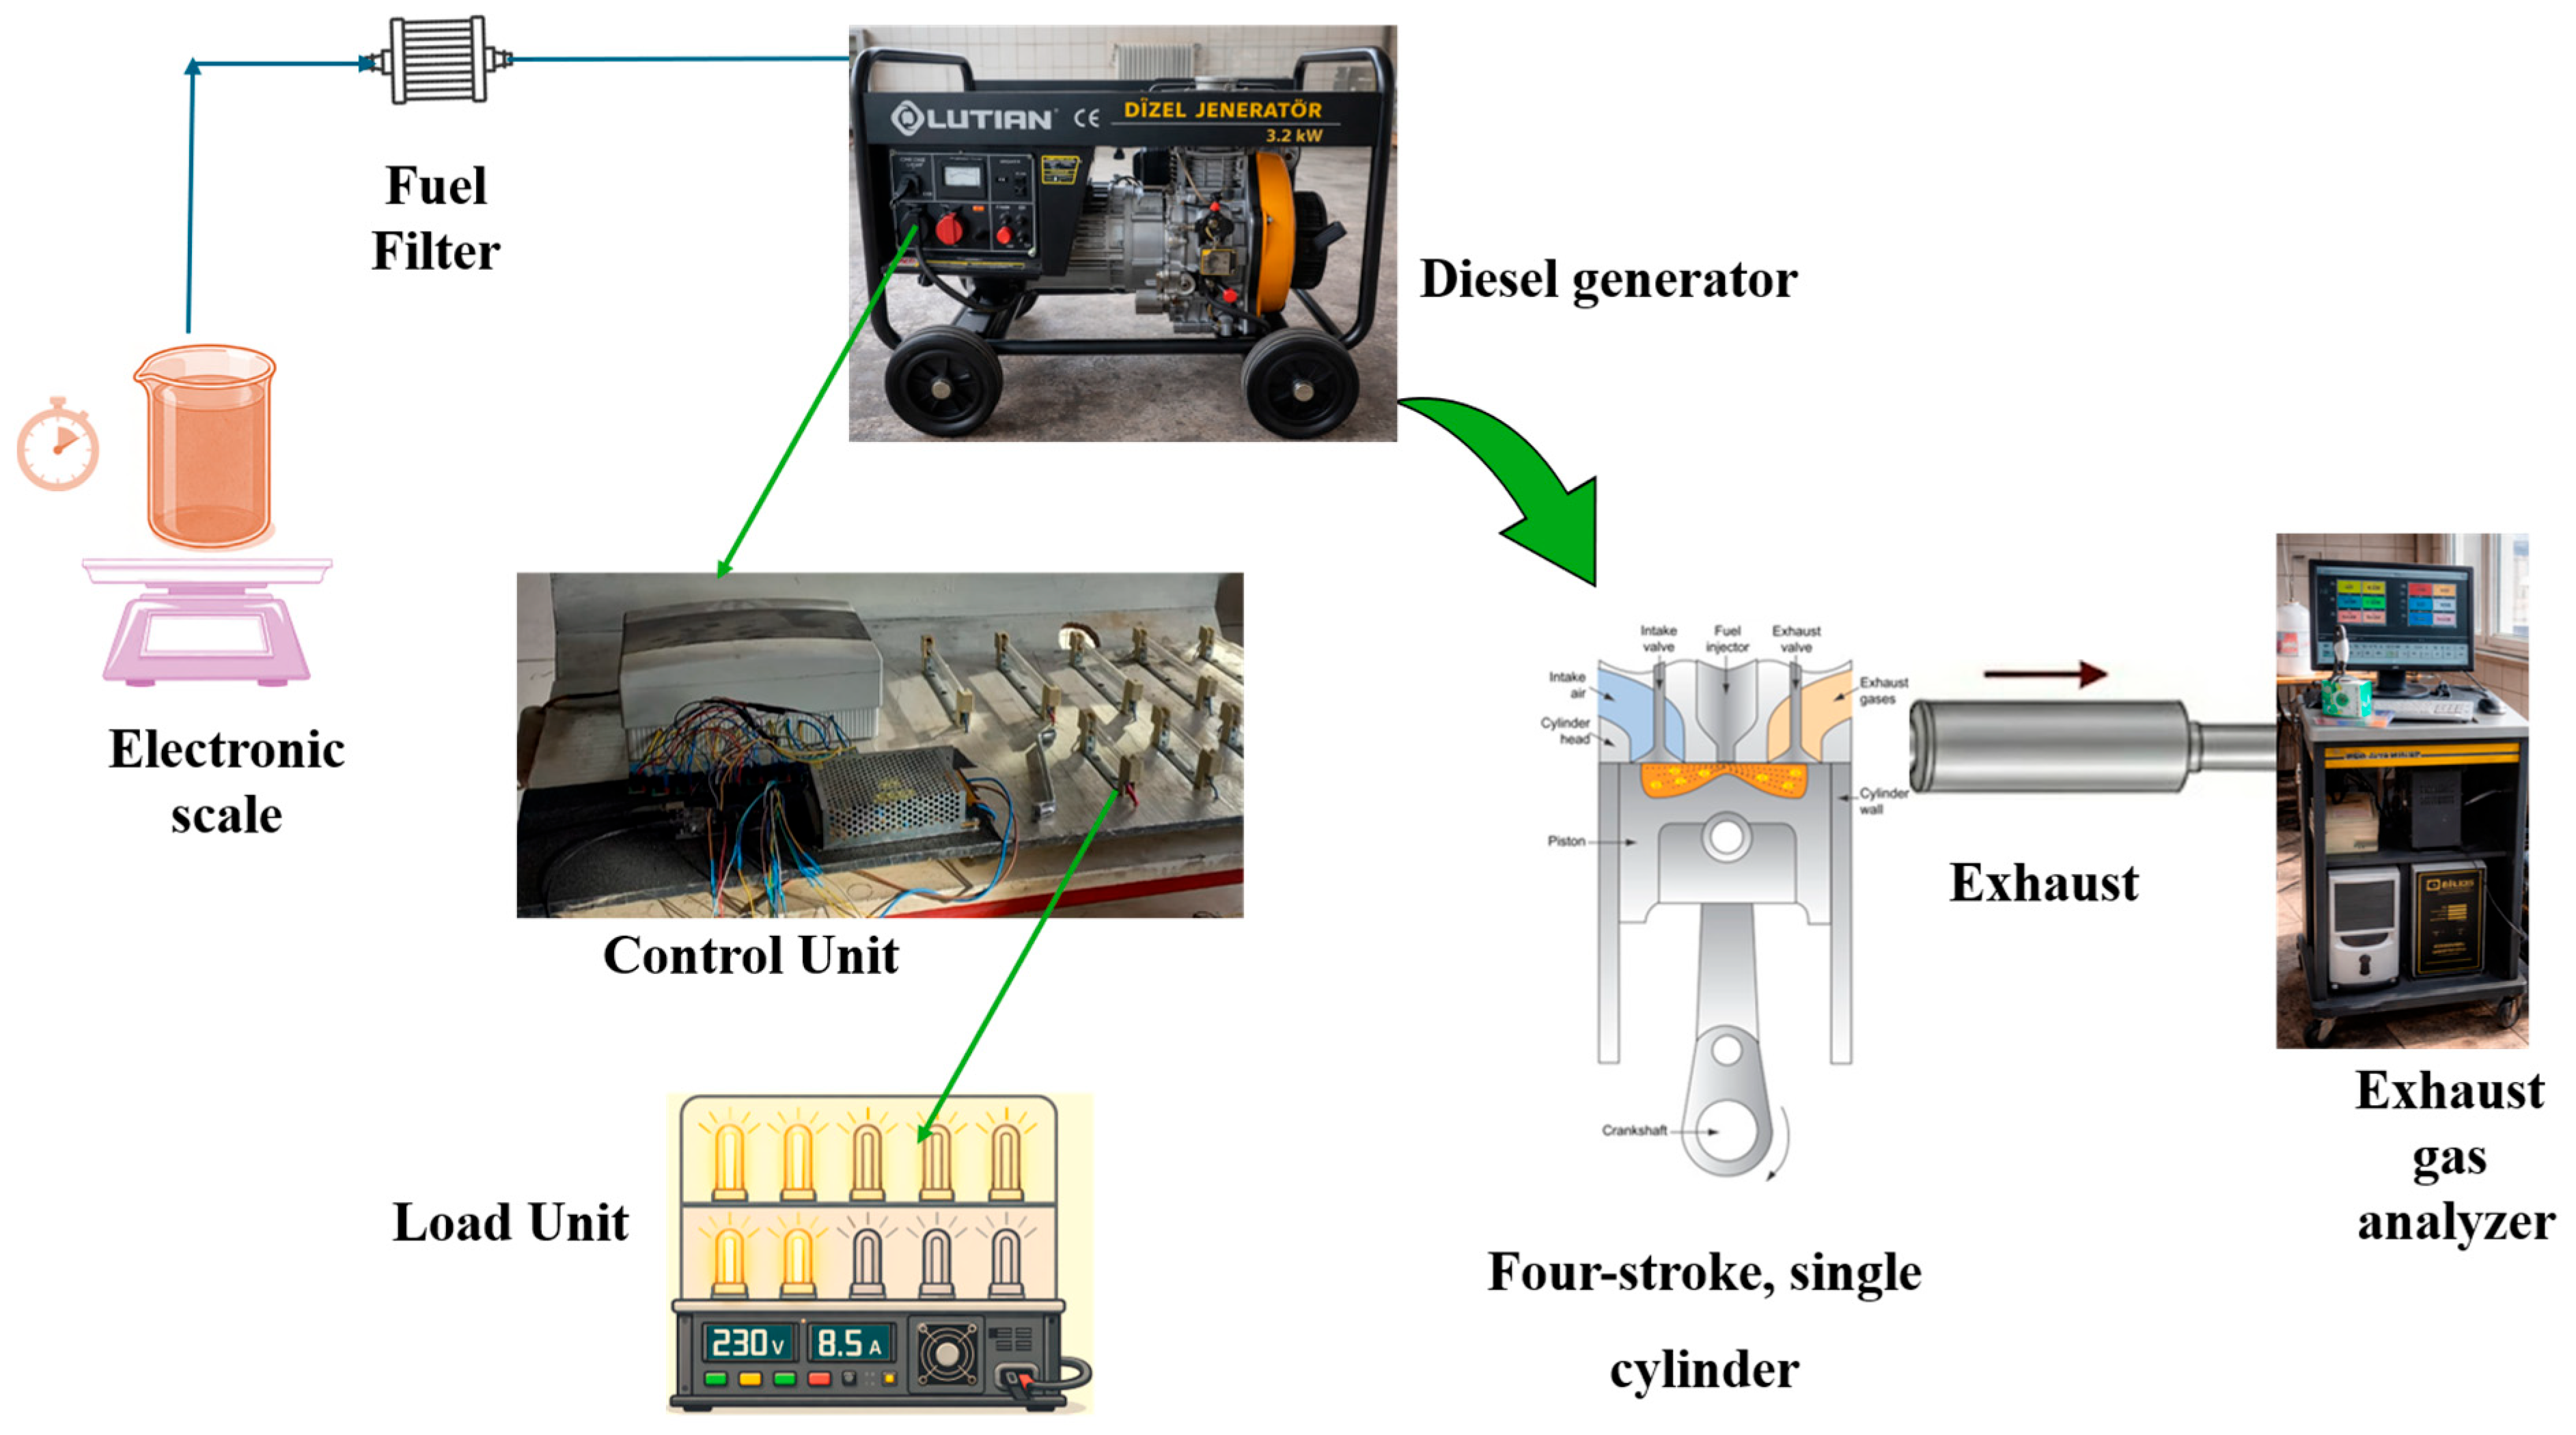
The test setup is shown in Figure 5. Every engine experiment was carried out at 3000 rpm, which is the test engine’s rated speed. This operating setting was selected to ensure steady-state operation, measurement stability, and repeatability throughout the experiment. The effects of speed-related variability were lessened by maintaining a constant engine speed, allowing for the controlled evaluation of the effects of biodiesel mixing and nanoparticle additions on engine performance and emission characteristics. As a result, the experimental configuration was created to produce reliable and similar outcomes at a typical working point. Before the studies began, the engine ran for half an hour to reach thermal equilibrium. The performance and emission levels of each test fuel were recorded once they had reached equilibrium. Each experiment was performed in triplicate, and the uncertainties were calculated from the repeated measurements. After completing the tests for each fuel blend, the engine was operated with neat diesel fuel for a sufficient period to flush the remaining test fuel from the fuel line, injection system, and combustion chamber before introducing the next fuel blend. The fuel filter was not replaced between tests, as the flushing procedure effectively minimized potential cross-contamination between successive fuel blends. Every experiment was conducted three times to guarantee that the data collected from the trials could be reproduced. Table 2 lists the specifications of the engine used in the experiments. The characteristics of the gas analyzer used to measure the emission values are displayed in Table 3. Uncertainty analysis was performed using the method developed by Kline and McClintock (Equation (1)) to eliminate discrepancies and uncertainties between the test results [31]. BSFC ±1.1, BTE ±0.7, CO2 ±1.2, HC ±1.3, CO ±1.5, NOx ±2.4,and load ±0.7 are the parameters’ uncertainty values. The total uncertainty is set at ±3.65.
U o v e r a l l = [ ( U B T E ) 2 + ( U B S F C ) 2 + ( U L o a d ) 2 + ( U C O 2 ) 2 + ( U N O x ) 2 + ( U C O ) 2 + ( U H C ) 2 ] 1 / 2

2.4. RSM

George E. P. Box and K. B. Wilson first proposed RSM in 1951. It addresses problems in an empirical model using statistical and mathematical techniques. One of the many technical applications that use RSM is internal combustion engines [32]. Two of the main features that distinguish RSM from other methods are its low error rate and need for fewer experiments. RSM is used to determine the impacts and levels of influence of input parameters on parameters that are regarded as output parameters [33,34]. A second-order polynomial model was chosen to accurately depict the nonlinear behaviours and interaction effects found in diesel engine performance and emission characteristics. An ANOVA was used to statistically validate the model form’s adequacy, and it was chosen because of the high R2 and significance of the second-order terms, which produced better predictive ability than first-order models. CO, HC, CO2, NOx, BSFC, and BTE were identified as output parameters in this study, whereas the amount of MgCO3 and load were identified for input features. Design-Expert software, version 13.0.5, automatically coded the independent variables to guarantee correct normalization and numerical stability during regression modelling, and the study was conducted at a 95% confidence level. The final equations were written in terms of the real experimental variables (engine load and MgCO3 amount) for practical comprehension, while the regression coefficients were first computed in the coded variable space. RSM was utilized to develop predictive models and improve the effects of engine load and biodiesel ratio on engine performance and emission characteristics. The experimental design matrix was constructed to fully cover the selected operating ranges of the input parameters to guarantee stable and consistent engine operation under all test conditions. The RSM analysis included 24 different experimental operating points that represented every possible combination of the chosen amount of nanoparticle and load levels. To increase measurement reliability and lower experimental uncertainty, each experimental condition was evaluated three times. The mean values were then utilized for statistical modelling. Table 4 shows the experimental data.

3. Results and Discussion

3.1. Experimental Results

Unless otherwise specified, all percentage differences presented in the following sections are based on the average values obtained over the six engine load conditions relative to the corresponding reference fuel (D100 or C30).

3.1.1. Performance

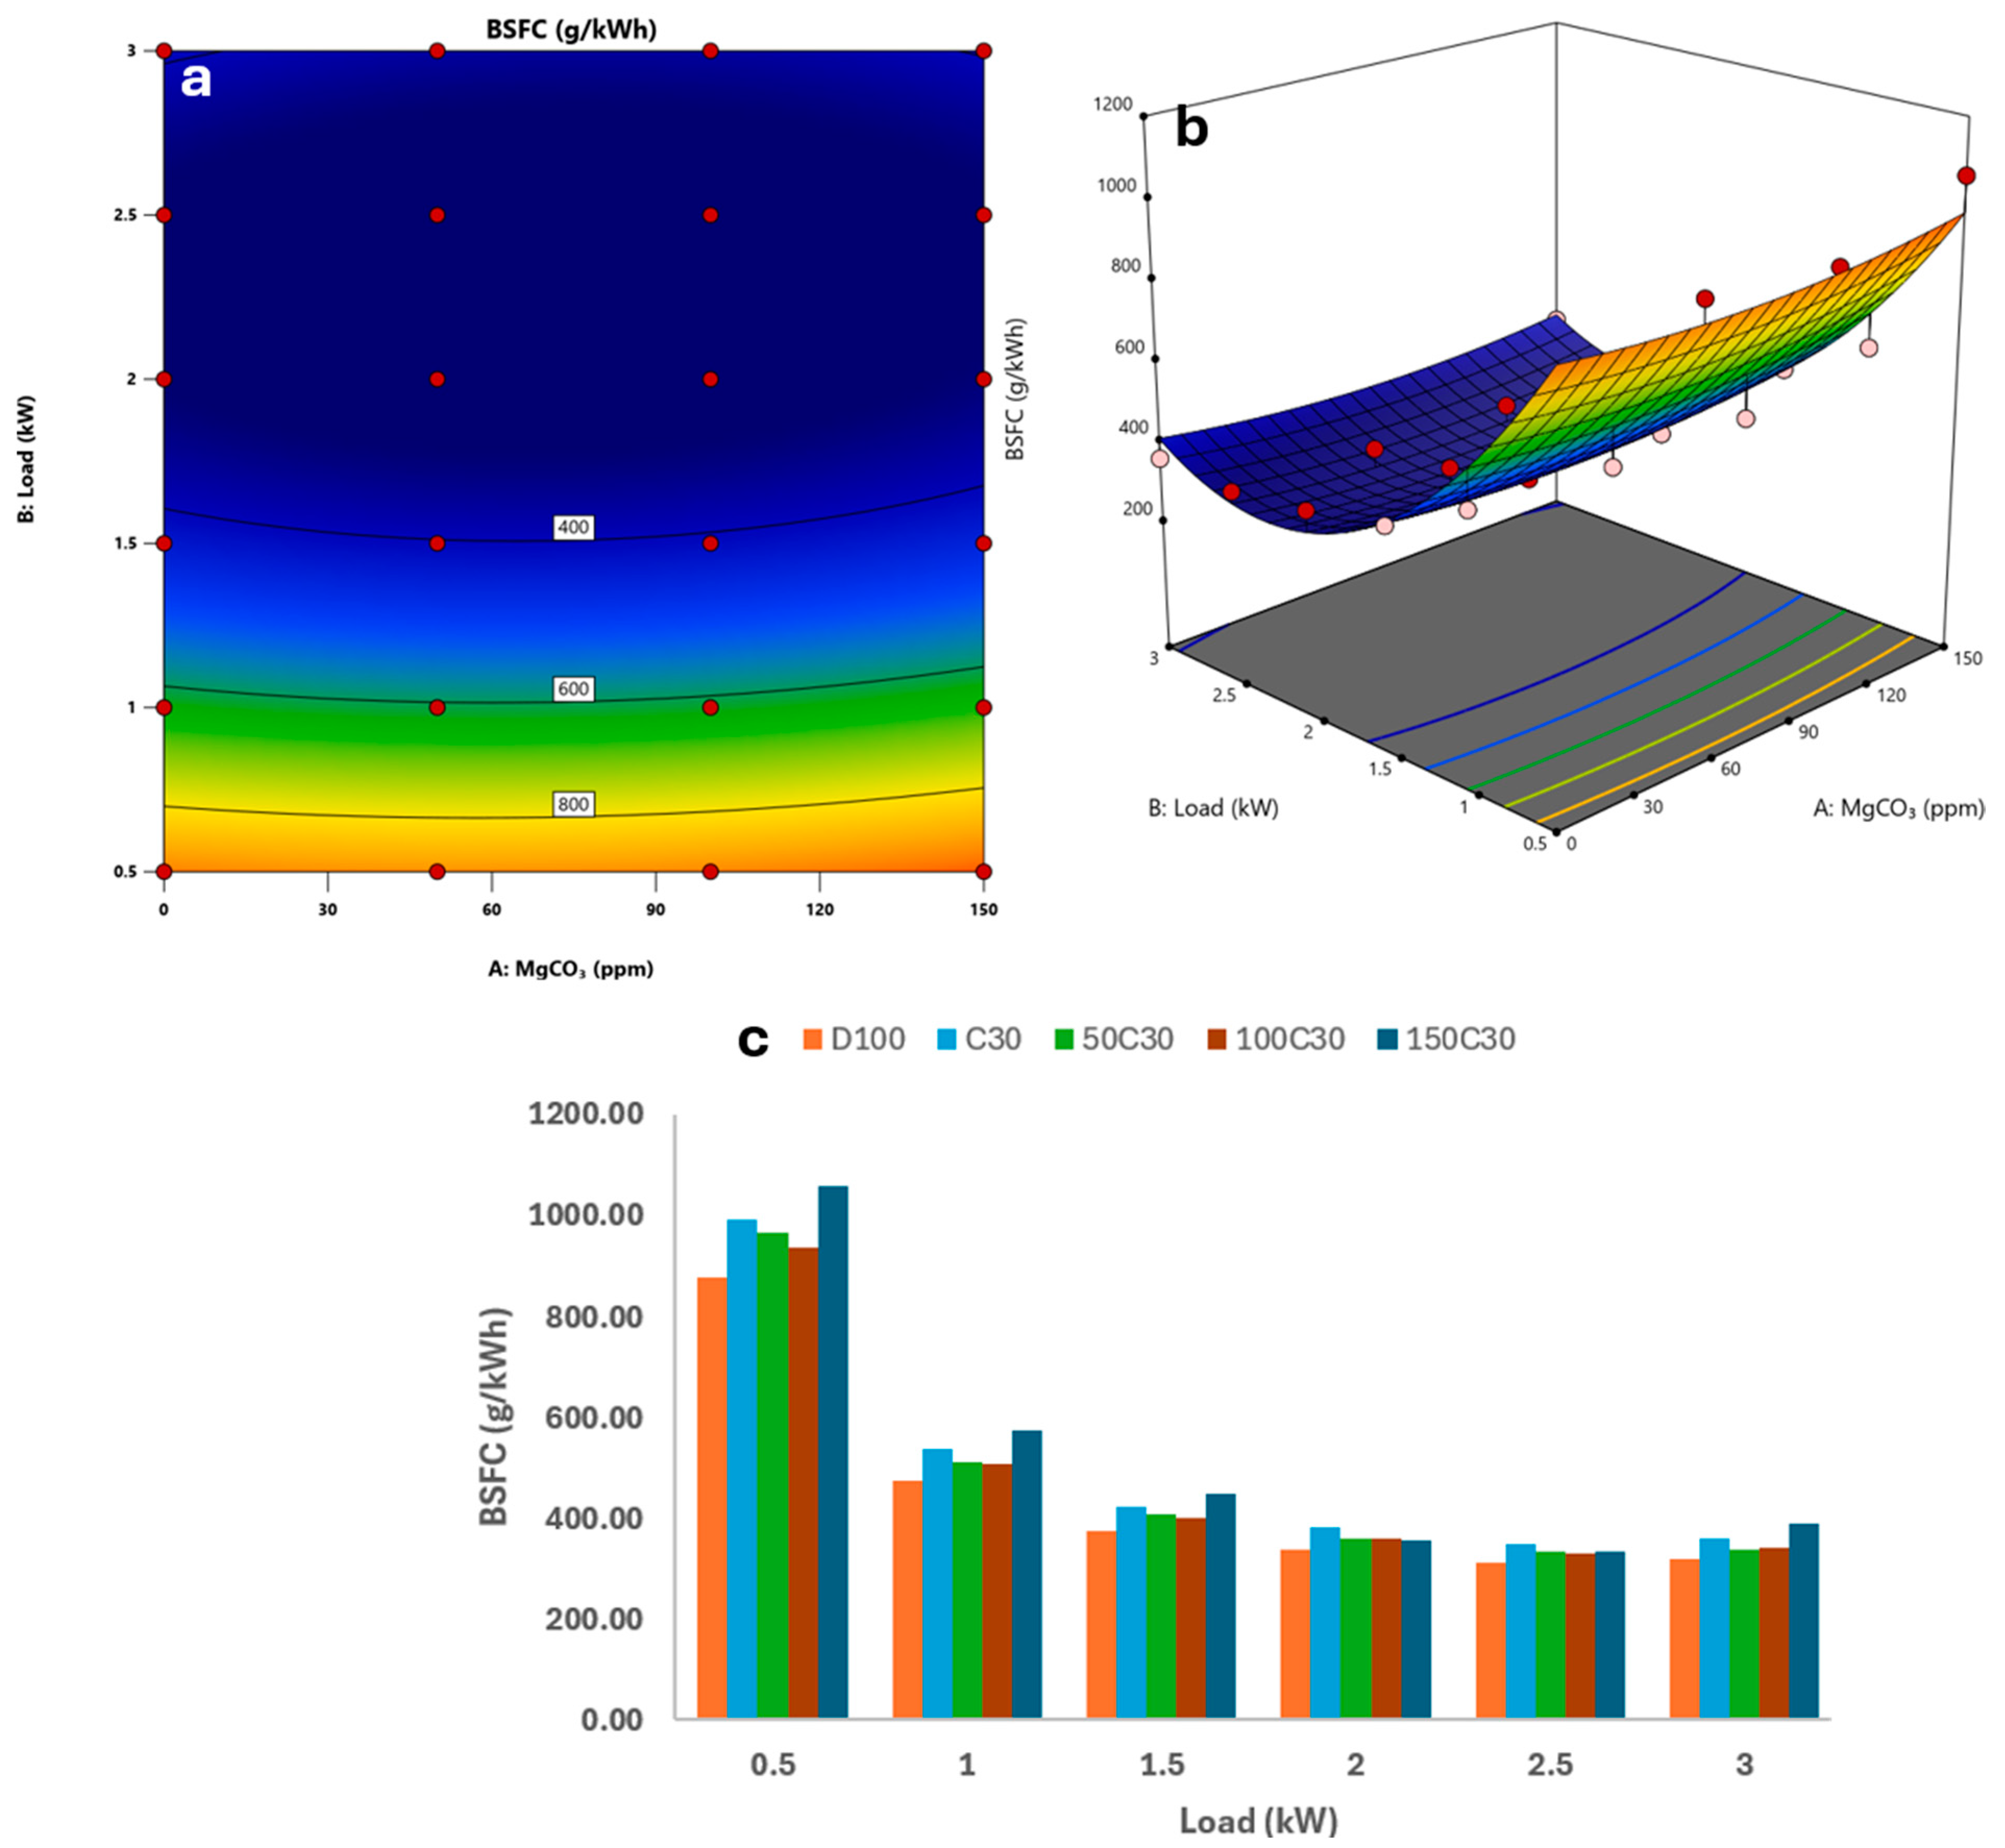
Engine performance was evaluated based on BSFC and BTE, which are influenced by the combustion characteristics of the test fuels. The calorific value of the fuel has a direct effect on fuel consumption. BSFC, or the amount of fuel required in grams to produce one kW of load in an hour, is one of the most important engine parameters. The experimental results showed that the calorific value of cottonseed biodiesel was 12.57% lower than that of diesel. Similarly, the calorific value of the C30 fuel was 3.77% lower than that of diesel. Among the study’s test fuels, 150C30 had the highest BSFC value at a load of 0.5 kW with 1059 g/kWh, while D100 had the lowest BSFC at a load of 2.5 kW with 310 g/kWh. Due to the rising in-cylinder temperature, the BSFC value in all test fuels reduced with a higher load [35]. However, because there was not enough time for complete combustion, the BSFC increased again after reaching certain thresholds. The use of MgCO3 nanoparticles increased combustion efficiency and reduced BSFC because of increased heat transfer caused by the nanoparticles’ significant surface area/volume ratio [36]. However, beyond a specific point, increasing the number of nanoparticles disrupted fuel atomization, lowering combustion efficiency and increasing BSFC. The relationship between BSFC and engine load and MgCO3 is seen in Figure 6. When compared to D100 fuel, the BSFC values for C30, 50C30, 100C30, and 150C30 increased by 12.76%, 7.93%, 6.84%, and 16.11%. As compared to C30 fuel, BSFC values for 50C30 and 100C30 fuels decreased by 4.29% and 5.25%, respectively, while they increased by 2.97% for 150C30 fuel. An examination of the contour and surface graphs in Figure 6 revealed that the fuel with 90 ppm MgCO3 supplied at roughly 2.5 kW load had the minimum BSFC value.
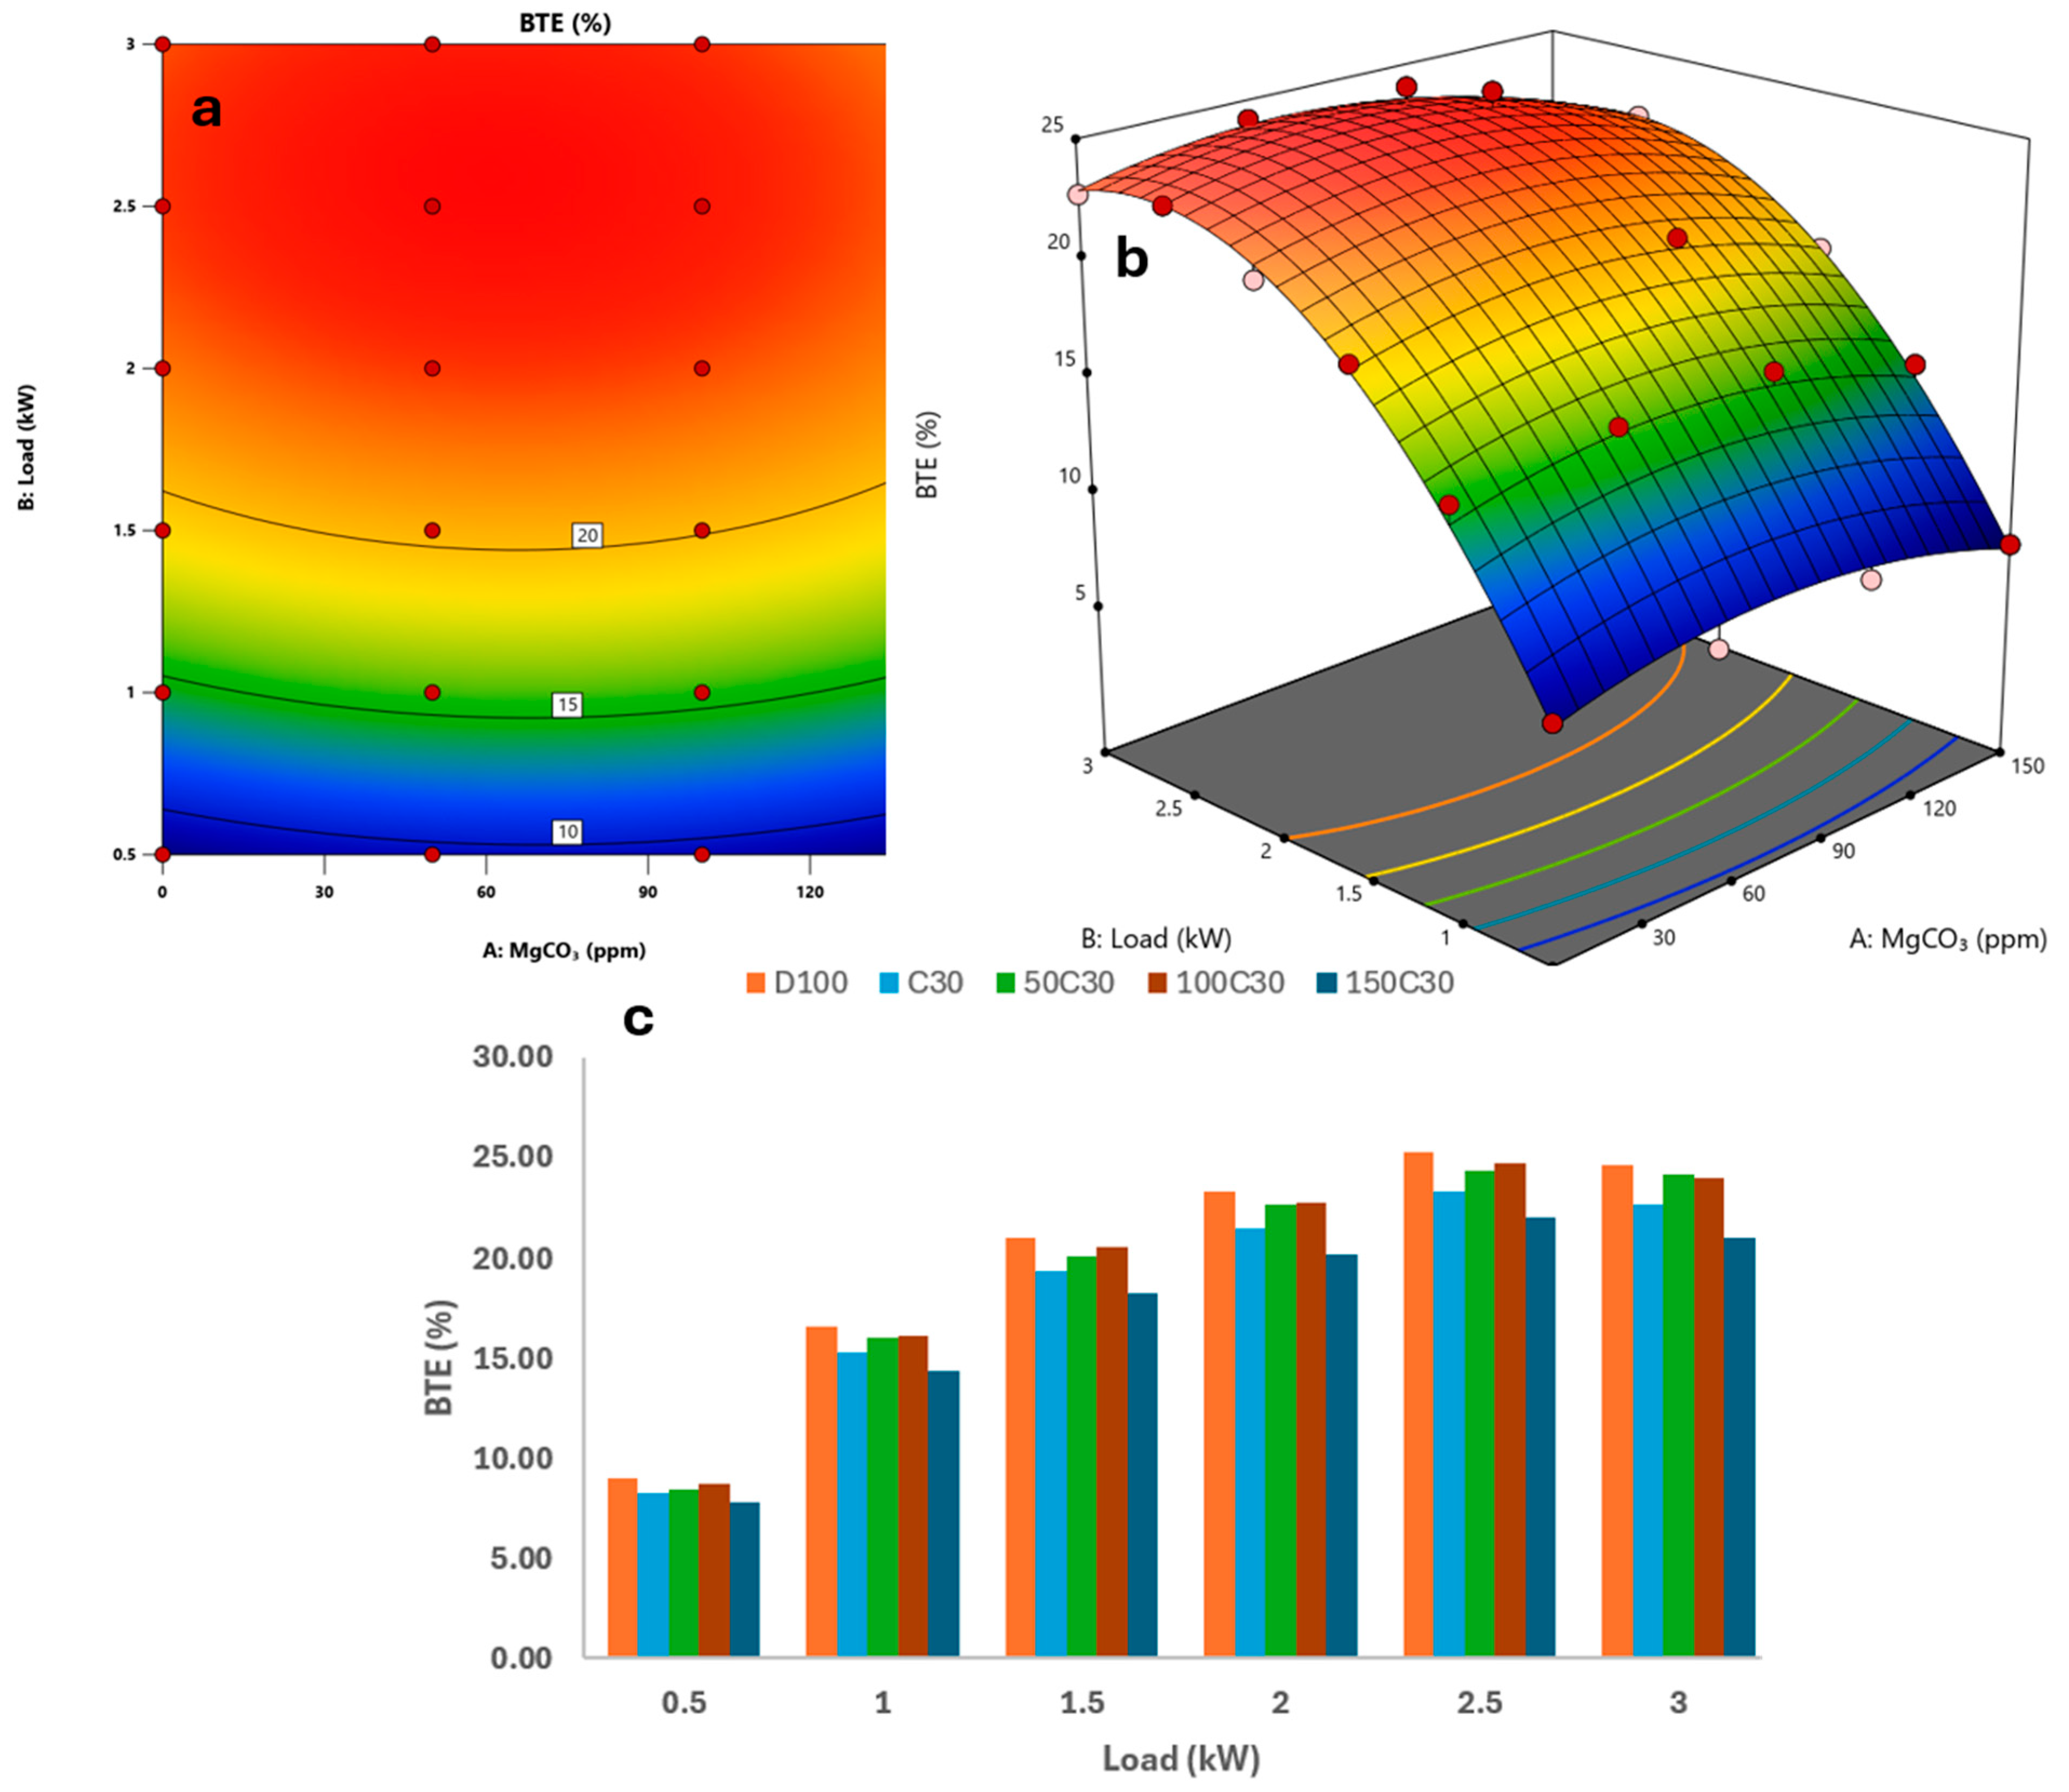
BTE, which represents the amount of energy from fuel used to produce useful power, is a crucial engine metric. Due to their lower calorific value compared to diesel and physical characteristics like increased viscosity and density that hinder fuel atomization (and, consequently, effective burning), fuels made from biodiesel often have low efficiency of combustion [37]. In comparison to D100, the kinematic viscosity values of C100 and C30 were 116% and 34% greater, respectively. In comparison to D100, density values for C100 and C30 rose by 7.65% and 2.29%, respectively. Figure 7 exhibits the BTE variation depending on engine load and MgCO3 nanoparticles. In all test fuels, BTE increased as load increased up to roughly 2.5 kW. Beyond this load, BTE exhibited a decreasing trend. Compared with D100 fuel, the average BTE values decreased by 7.84%, 3.60%, 2.43%, and 13.53% for C30, 50C30, 100C30, and 150C30 fuels, respectively. Biodiesels have a lower BTE value than D100 because of their high density, high viscosity, and low energy content [38]. However, by reducing the ignition delay and raising BTE, the inclusion of nanoparticles enhanced combustion [39]. BTE values for 50C30 and 100C30 fuels increased by 4.61% and 5.87%, respectively, in comparison to C30 fuel. However, fuel atomization declined and efficiency dropped as the MgCO3 level rose. Compared to C30 fuel, the BTE value of 150C30 fuel is 6.17% less. Examining the BTE contour and surface graphs revealed that the fuel containing 90 ppm MgCO3 had the highest BTE value at about a 2.5 kW load.

3.1.2. Emissions

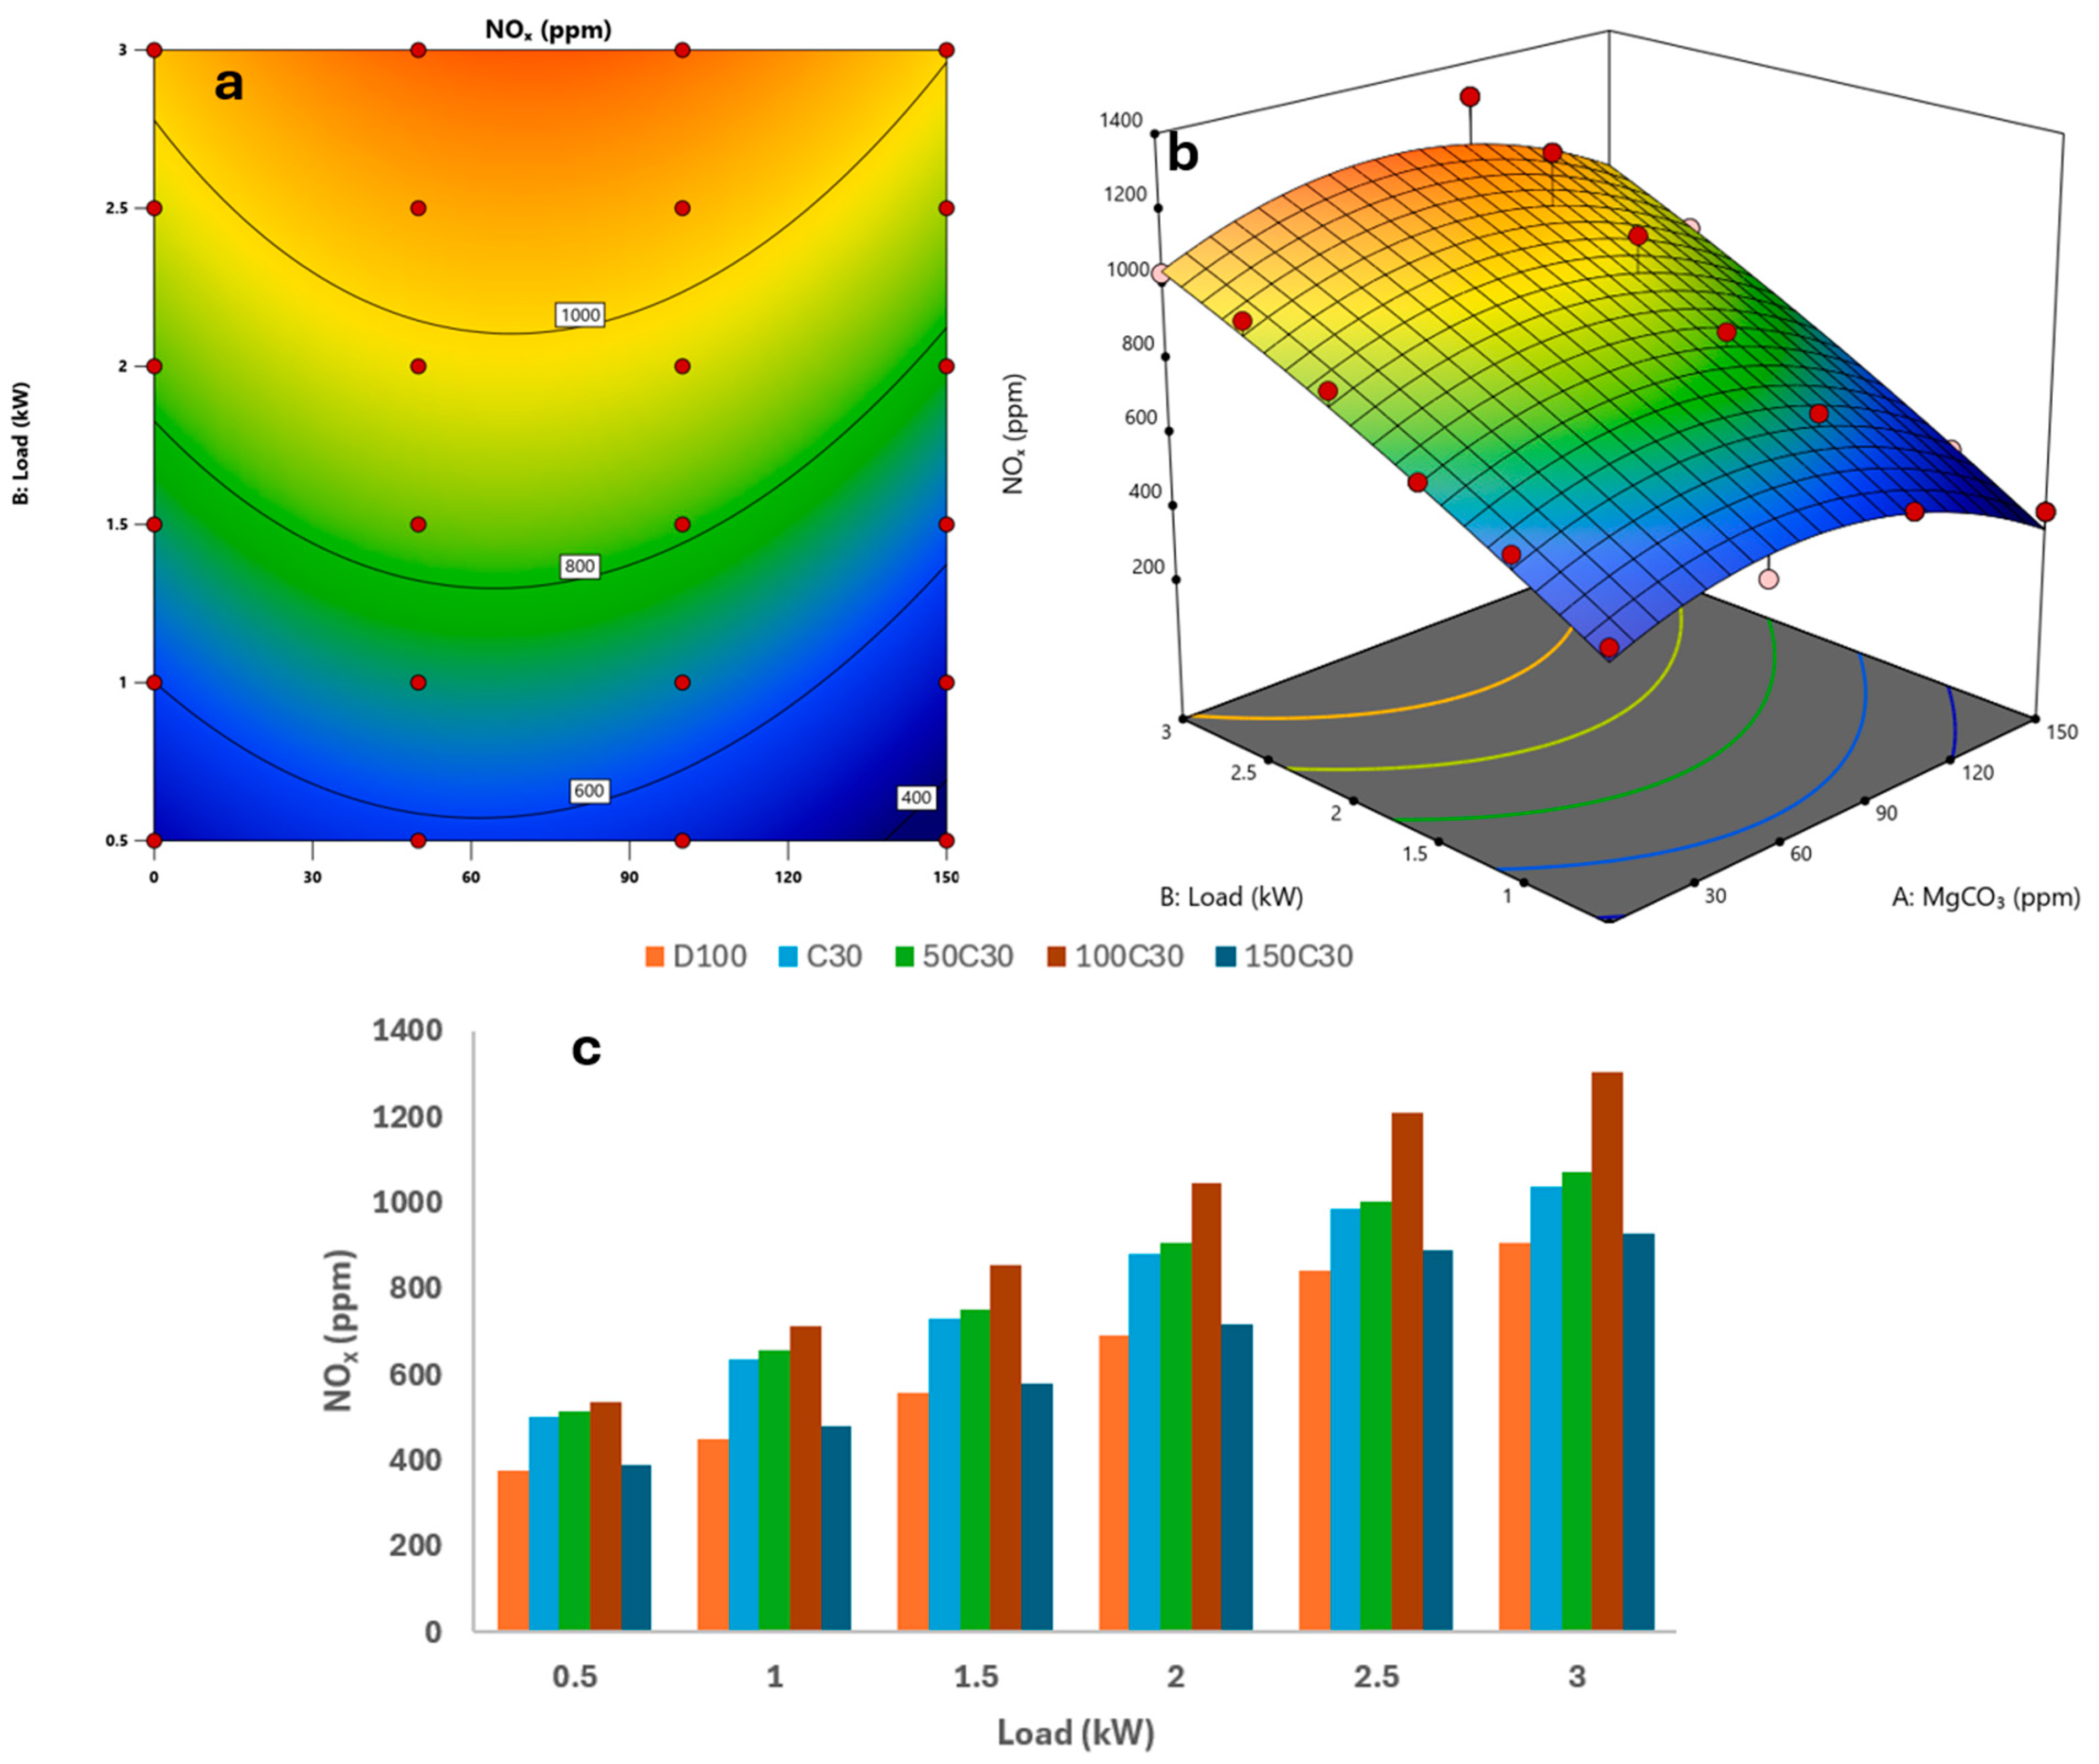
When there is enough oxygen present, NOx emissions are produced at elevated regional temperatures, according to the Zeldovich approach [40]. NOx emissions are mostly produced when nitrogen in the air combines with oxygen inside the combustion chamber at high temperatures and pressures, posing serious risks to the environment and human health. Figure 8 conveys the variation in NOx emissions according to load and MgCO3. All the test fuels utilized in the experiment showed an increase in NOx emissions as the in-cylinder temperature rose with increasing load. For C30, 50C30, 100C30, and 150C30 fuels, the increases were 27.40%, 30.86%, 49.06%, and 4.31% in comparison to D100 fuel. During burning, the oxygen in the biodiesel structure produced a richer oxygen environment, hastening the growth of flames [41]. Local combustion temperatures rose because of improved combustion. NOx emissions increased because of this support for the thermal NOx production mechanism. NOx emissions increased because of the fuel’s higher thermal conductivity due to the addition of nanoparticles [42]. 50C30 and 100C30 fuels produced 2.71% and 17.40% greater NOx emissions, respectively, than C30 fuel, whereas 150C30 fuel produced 17.70% fewer NOx emissions. The fuel with 60–80 ppm MgCO3 at about 3 kW (high load) had the greatest NOx emission value, according to the contour and surface graphs in Figure 8, whereas at a load of 0.5 kW, the fuel with no additional nanoparticles produced the smallest amount of NOx.
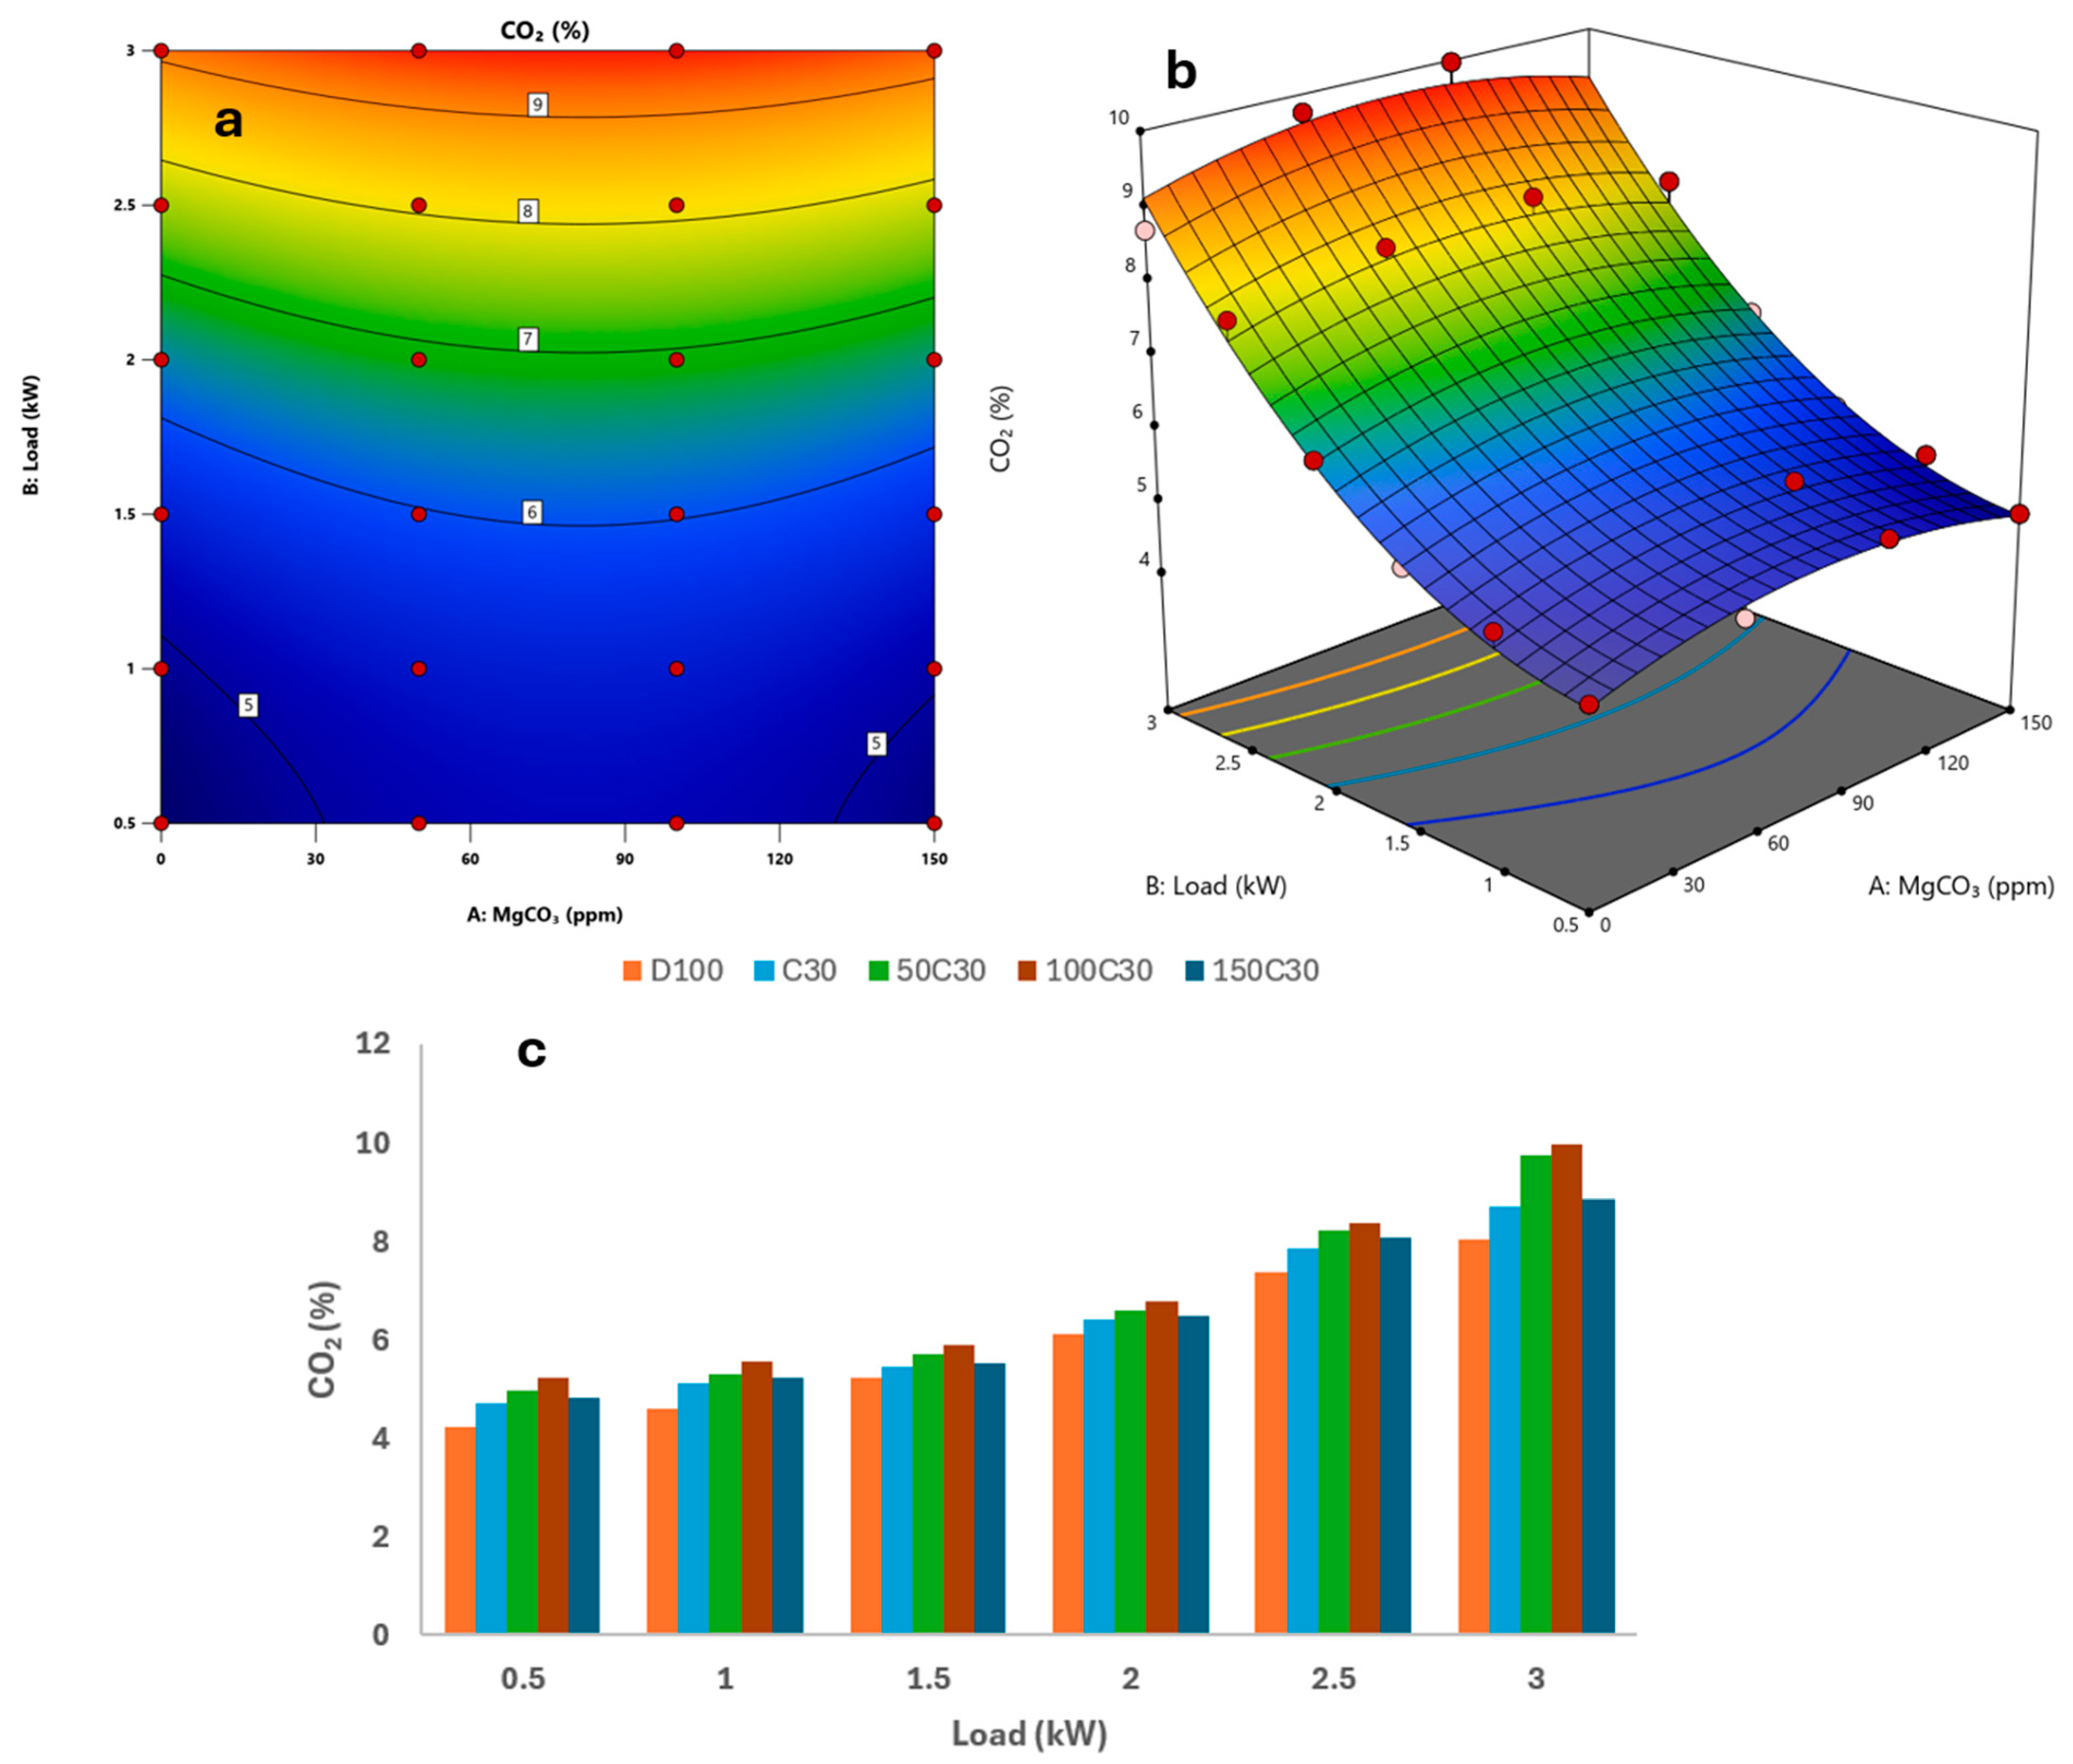
The efficient oxidation of fuels containing carbon is demonstrated by CO2 emissions, which are the ultimate byproducts of full combustion. Higher CO2 levels are usually the result of improved complete combustion and high combustion efficiency. Figure 9 highlights how CO2 varies with engine load and MgCO3. In the present study, CO2 emissions increased with increasing engine load for all test fuels, which agrees with the results reported by Savas [43]. CO2 emission values for C30, 50C30, 100C30, and 150C30 fuels increased by 7.73%, 13.83%, 17.67%, and 9.80% compared to D100 fuel. 50C30, 100C30, and 150C30 fuels had CO2 emissions that were 5.65%, 9.19%, and 1.90% greater than those of C30 fuel, respectively. The high surface area/volume ratio of MgCO3 nanoparticles enhances combustion, increasing the amount of full combustion [44]. More complete burning leads to an increase in CO2 emissions. Increasing the number of nanoparticles is not always beneficial to combustion. Viscosity increases with the number of nanoparticles, which hinders atomization and reduces CO2 emissions and full combustion. An examination of the contour and surface plots in Figure 9 revealed that the highest CO2 emissions occurred at high loads and with fuel containing 60–80 ppm MgCO3. The fuel with the lowest CO2 emission values was in the 0.5–1 kW load range and contained 0–30 ppm MgCO3.
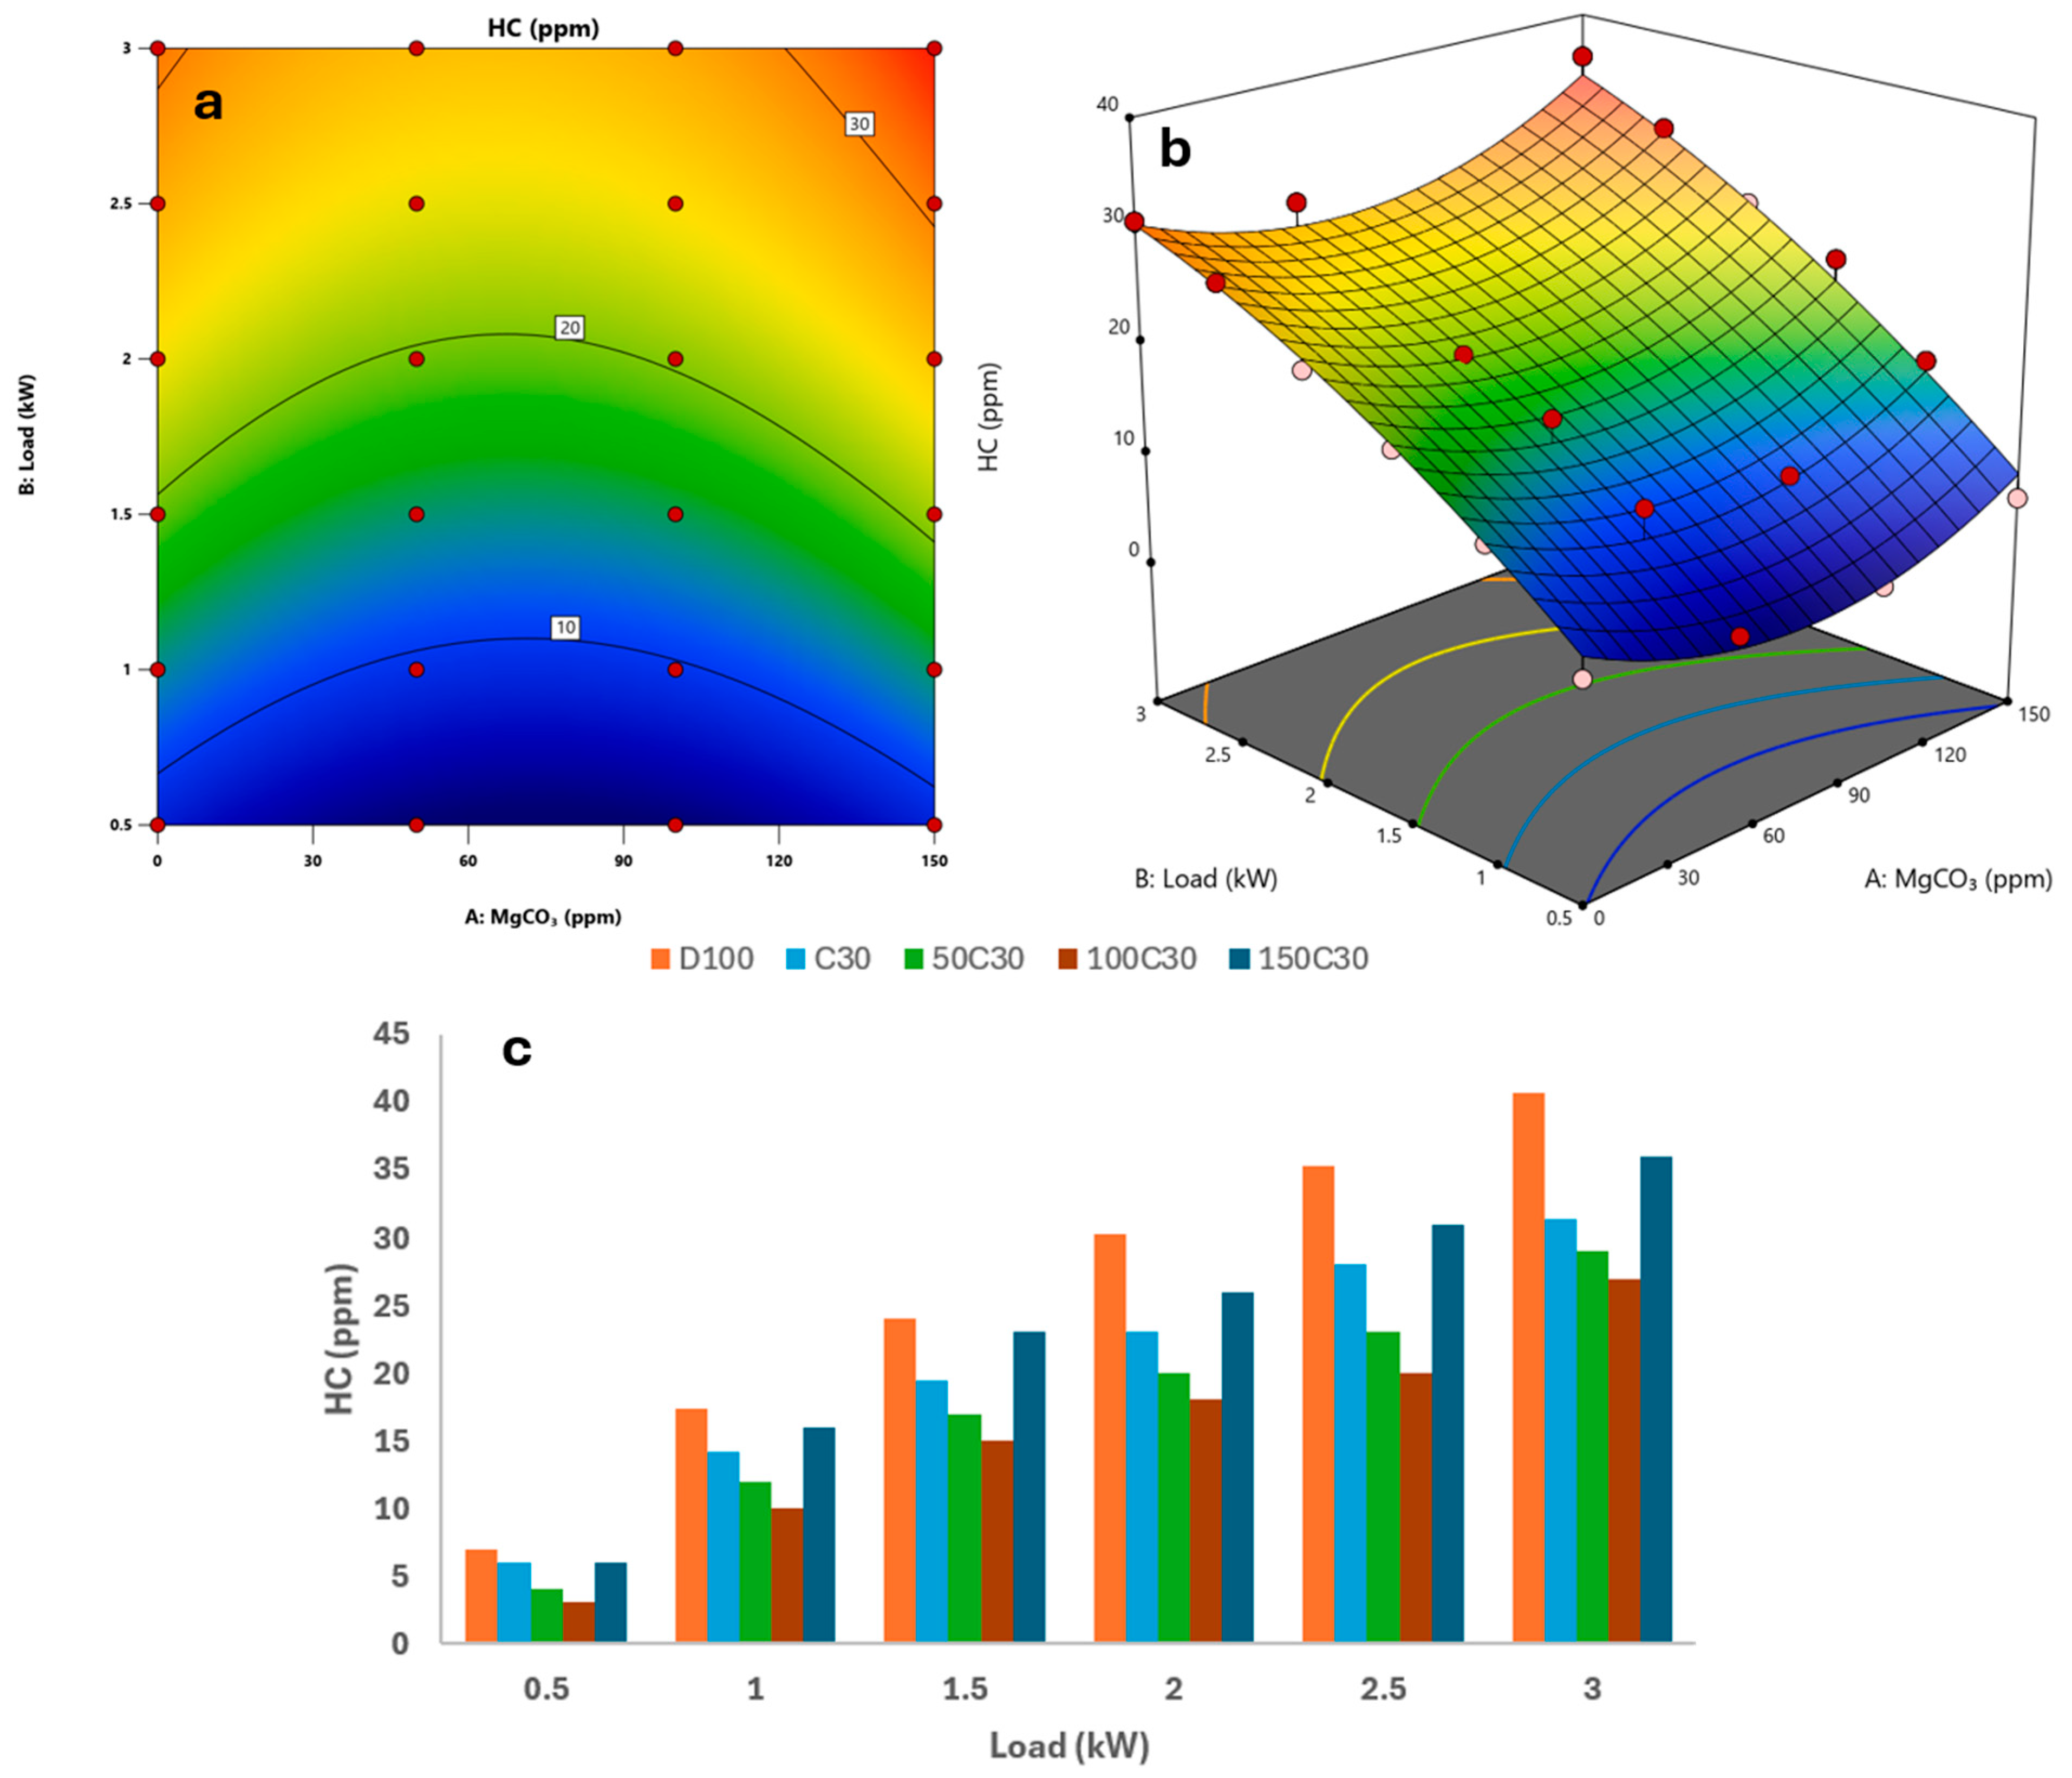
HC emissions originate from incomplete combustion, in contrast to CO2 emissions. When fuel molecules escape without being completely burnt or oxidized, HC emissions are produced. Like CO emissions, HC emissions are incomplete combustion products that are typically brought on by low combustion temperatures, inadequate fuel/air mixing, inadequate atomization, and extinction close to the cylinder walls [45]. Figure 10 demonstrates how engine load and MgCO3 affect HC emissions. It was demonstrated that HC emissions increased with increasing load in every test fuel. HC emission values for C30, 50C30, 100C30, and 150C30 fuels dropped by 20.50%, 33.41%, 42.44%, and 10.70%, respectively, in comparison to D100 fuel. The oxygen content of biodiesel enhanced combustion, consequently reducing HC emissions [46]. HC emissions rose by 11.41% for 150C30 fuel but fell by 16.77% and 27.89% for 50C30 and 100C30 fuels in comparison to C30 fuel. By increasing heat transport, the addition of nanoparticles enhanced combustion [47]. HC emissions dropped because of better combustion. Low loads and fuel with 0–30 ppm MgCO3 produced the lowest HC emissions, whereas the highest HC emissions were found at high loads with fuel containing 120–150 ppm MgCO3, based on a study of the surface and contour plots in Figure 10.
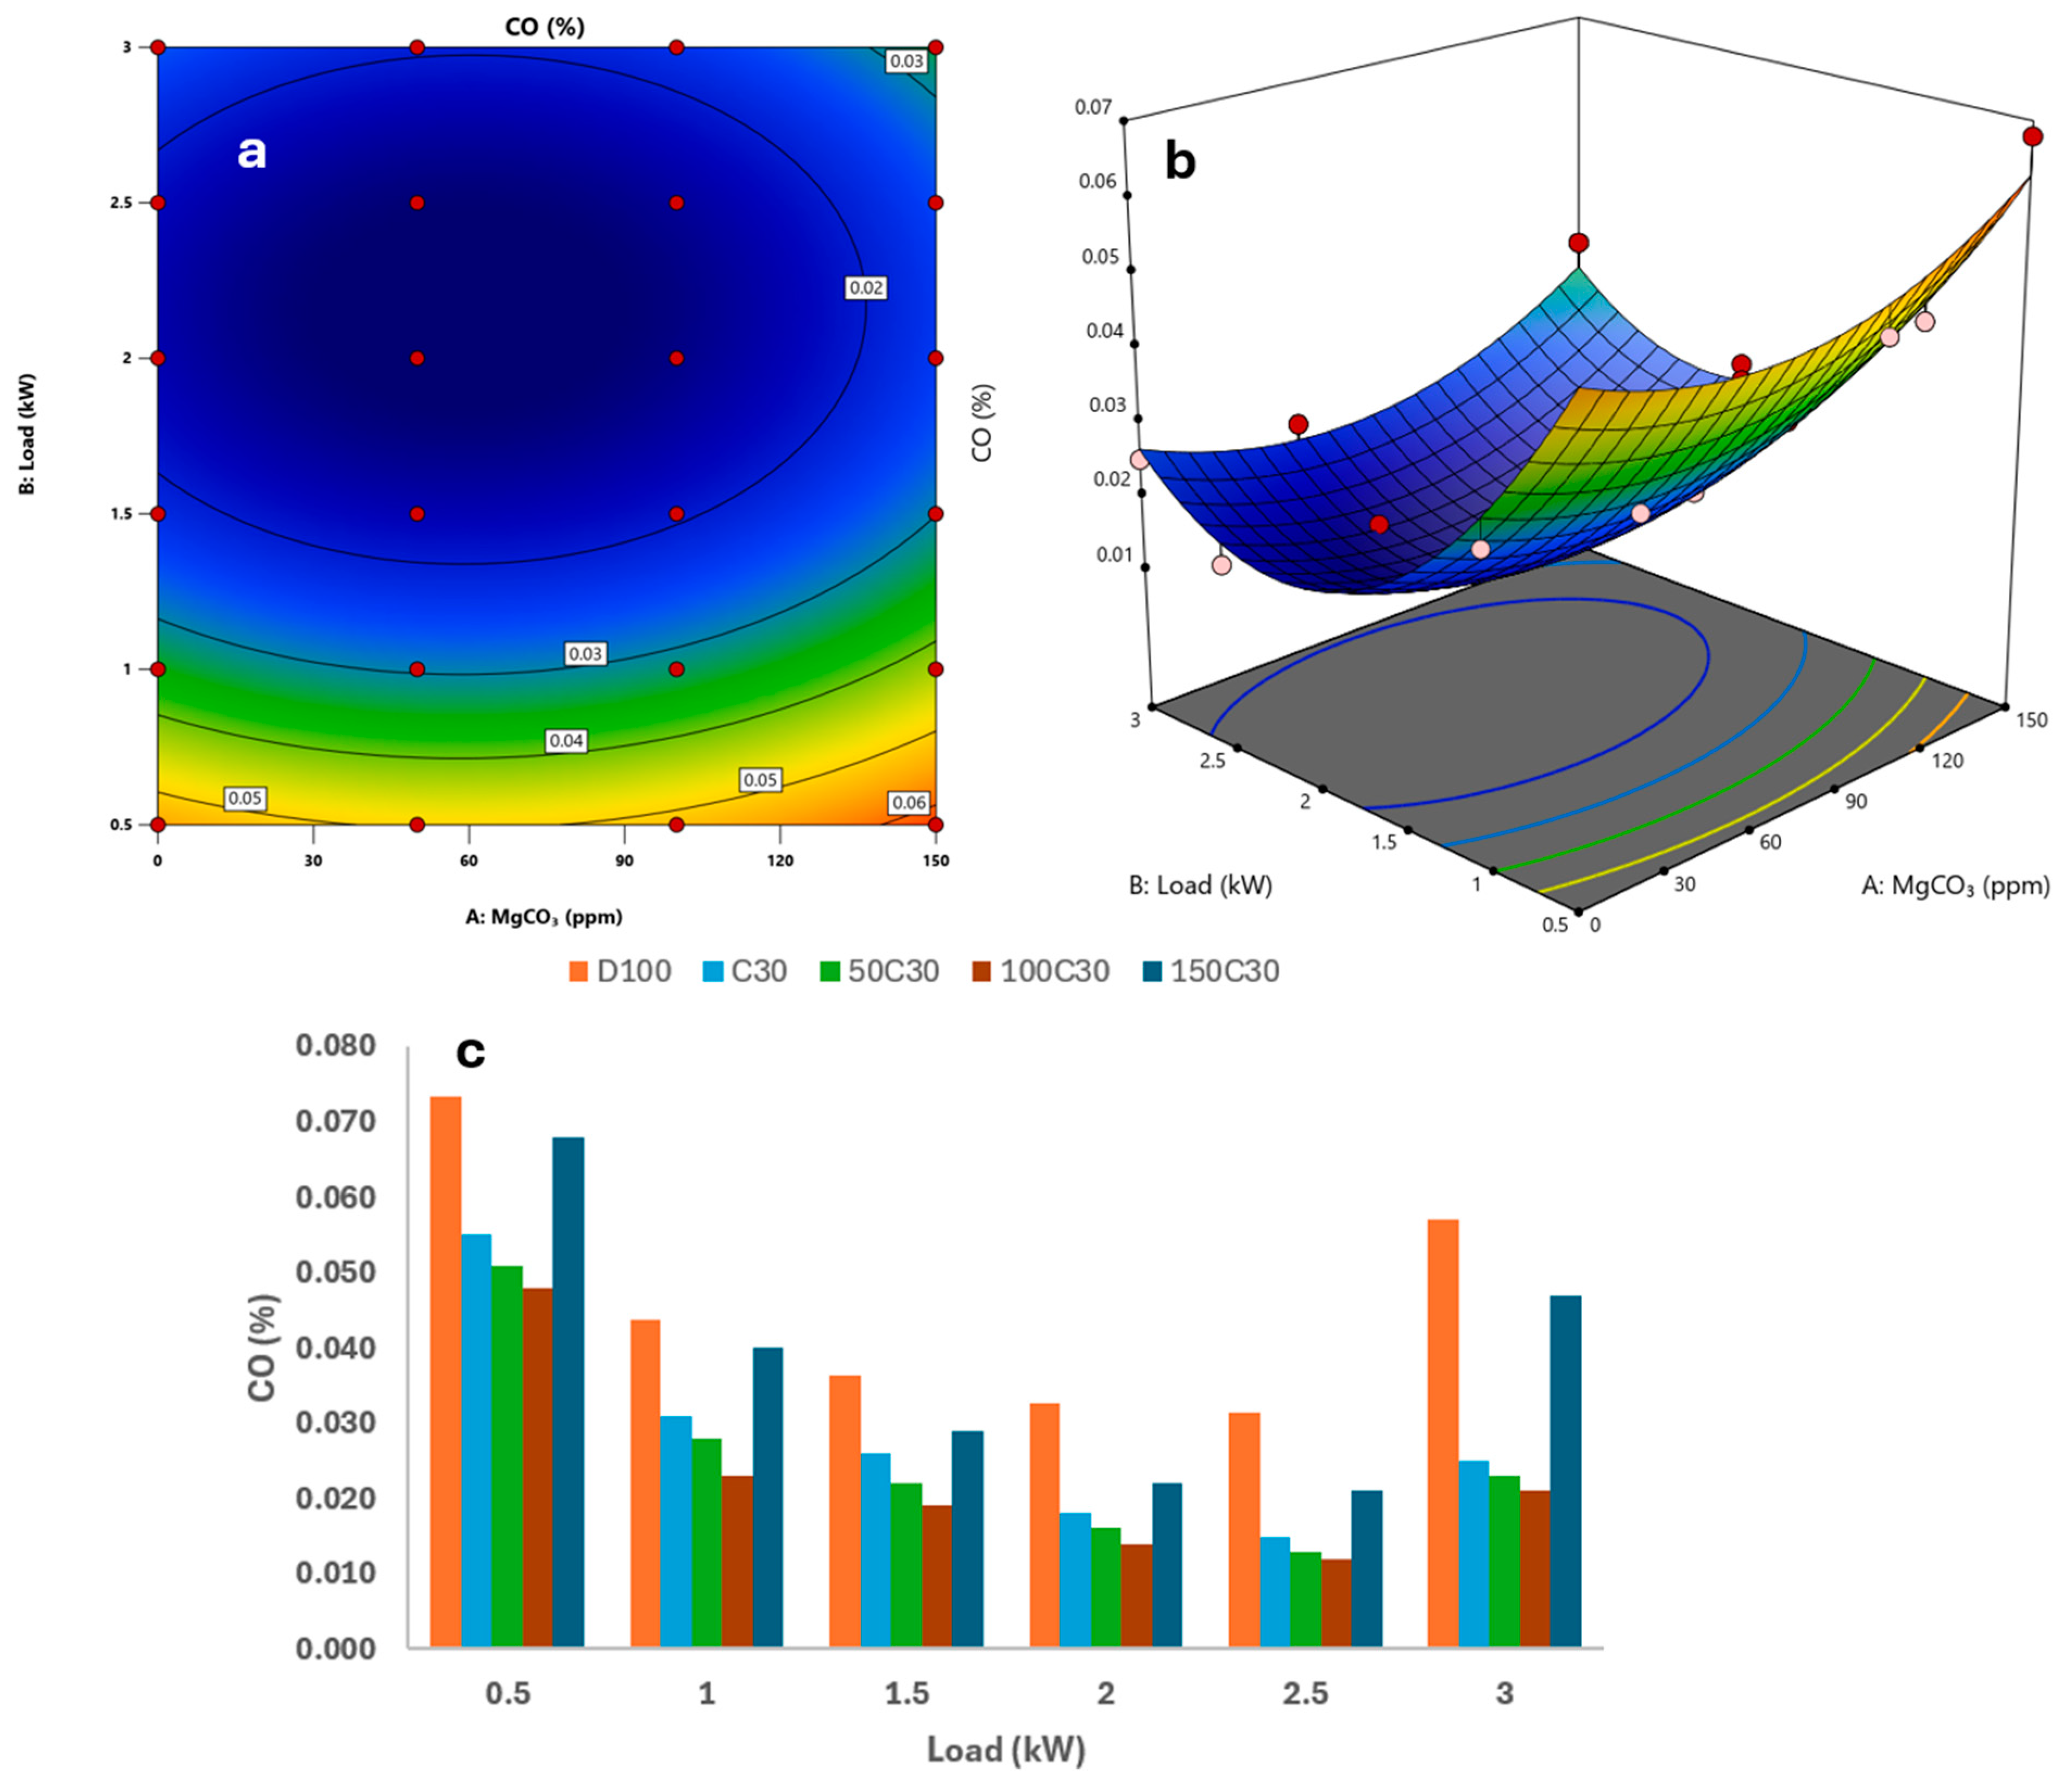
Like HC emissions, CO emissions result from incomplete combustion. CO emissions result from incomplete combustion caused by an inadequate oxygen/fuel combination inside the cylinder. As combustion improves, CO emissions decrease. All test fuels exhibit high CO emissions at low loads due to poor combustion [48]. Figure 11 displays the way CO emissions vary according to load and MgCO3. CO emissions for C30, 50C30, 100C30, and 150C30 fuels dropped by 39.27%, 48.22%, 48.11%, and 20.68% in comparison to D100 fuel, respectively. CO emissions for 50C30 and 100C30 fuels dropped by 14.57% and 15.23%, respectively, as compared to C30 fuel. In contrast to C30 fuel, 150C30 fuel generated 33.14% greater CO emissions. After a while, the additional nanoparticles disrupted fuel atomization and worsened combustion, even though they enhanced combustion by decreasing ignition latency and thereby lowering CO emissions [49]. The contour and surface graphs in Figure 11 show that the lowest CO emissions occurred at approximately 60 ppm MgCO3 and an engine load of 2–2.5 kW. Among the MgCO3-added fuels, the highest CO emissions were observed at low engine loads with the fuel containing 150 ppm MgCO3.

3.2. Optimization

Table 5 demonstrates the major statistical indicators of the constructed RSM models, including R2, adjusted R2, estimated R2, coefficient of variation (CV%), and sufficient sensitivity. The findings show that every response variable has a high degree of model adequacy. The models are not overfitted and have good predictive capacity because all responses demonstrated a high degree of agreement between the adjusted R2 and expected R2 values. The comparatively little variations in these statistical indicators across all responses provide more credence to this. CO2 and BTE had the lowest variability (3.68% and 2.99%, respectively), showing strong experimental dependability, while BSFC had slightly higher variability (12.95%). Overall, the coefficient of variation values were low to moderate. Additionally, all replies had appropriate precision values ranging from 21.09 to 60.65, which were much higher than the threshold value of 4. This indicates that the models may be utilized to explore the design space with reliability and confirms an adequate signal-to-noise ratio. All things considered, these statistical diagnostics verify that the created RSM models are reliable, statistically significant, and appropriate for forecasting engine performance and emission characteristics under various operating circumstances.
The interaction term (AB) was statistically insignificant for all responses (p > 0.05), indicating that the combined effect of MgCO3 concentration and engine load did not significantly deviate from their individual contributions within the investigated range. Quadratic effects played an important role in describing the nonlinear behaviour of the system. Both A2 and B2 terms were significant for CO, HC, CO2, and BTE (p < 0.05), confirming pronounced curvature in these response surfaces. For BSFC, only the B2 term was significant, whereas for NOx only the A2 term was significant, suggesting that the nonlinear behaviour of these responses is governed by different factors. Overall, the ANOVA results demonstrate that the developed models are statistically robust, with engine load representing the dominant factor influencing engine performance and emissions, while the effect of MgCO3 nanoparticles is response-dependent and primarily reflected through nonlinear rather than interaction effects.
The statistical significance of the developed regression models was evaluated using the F-values and p-values presented in Table 6.
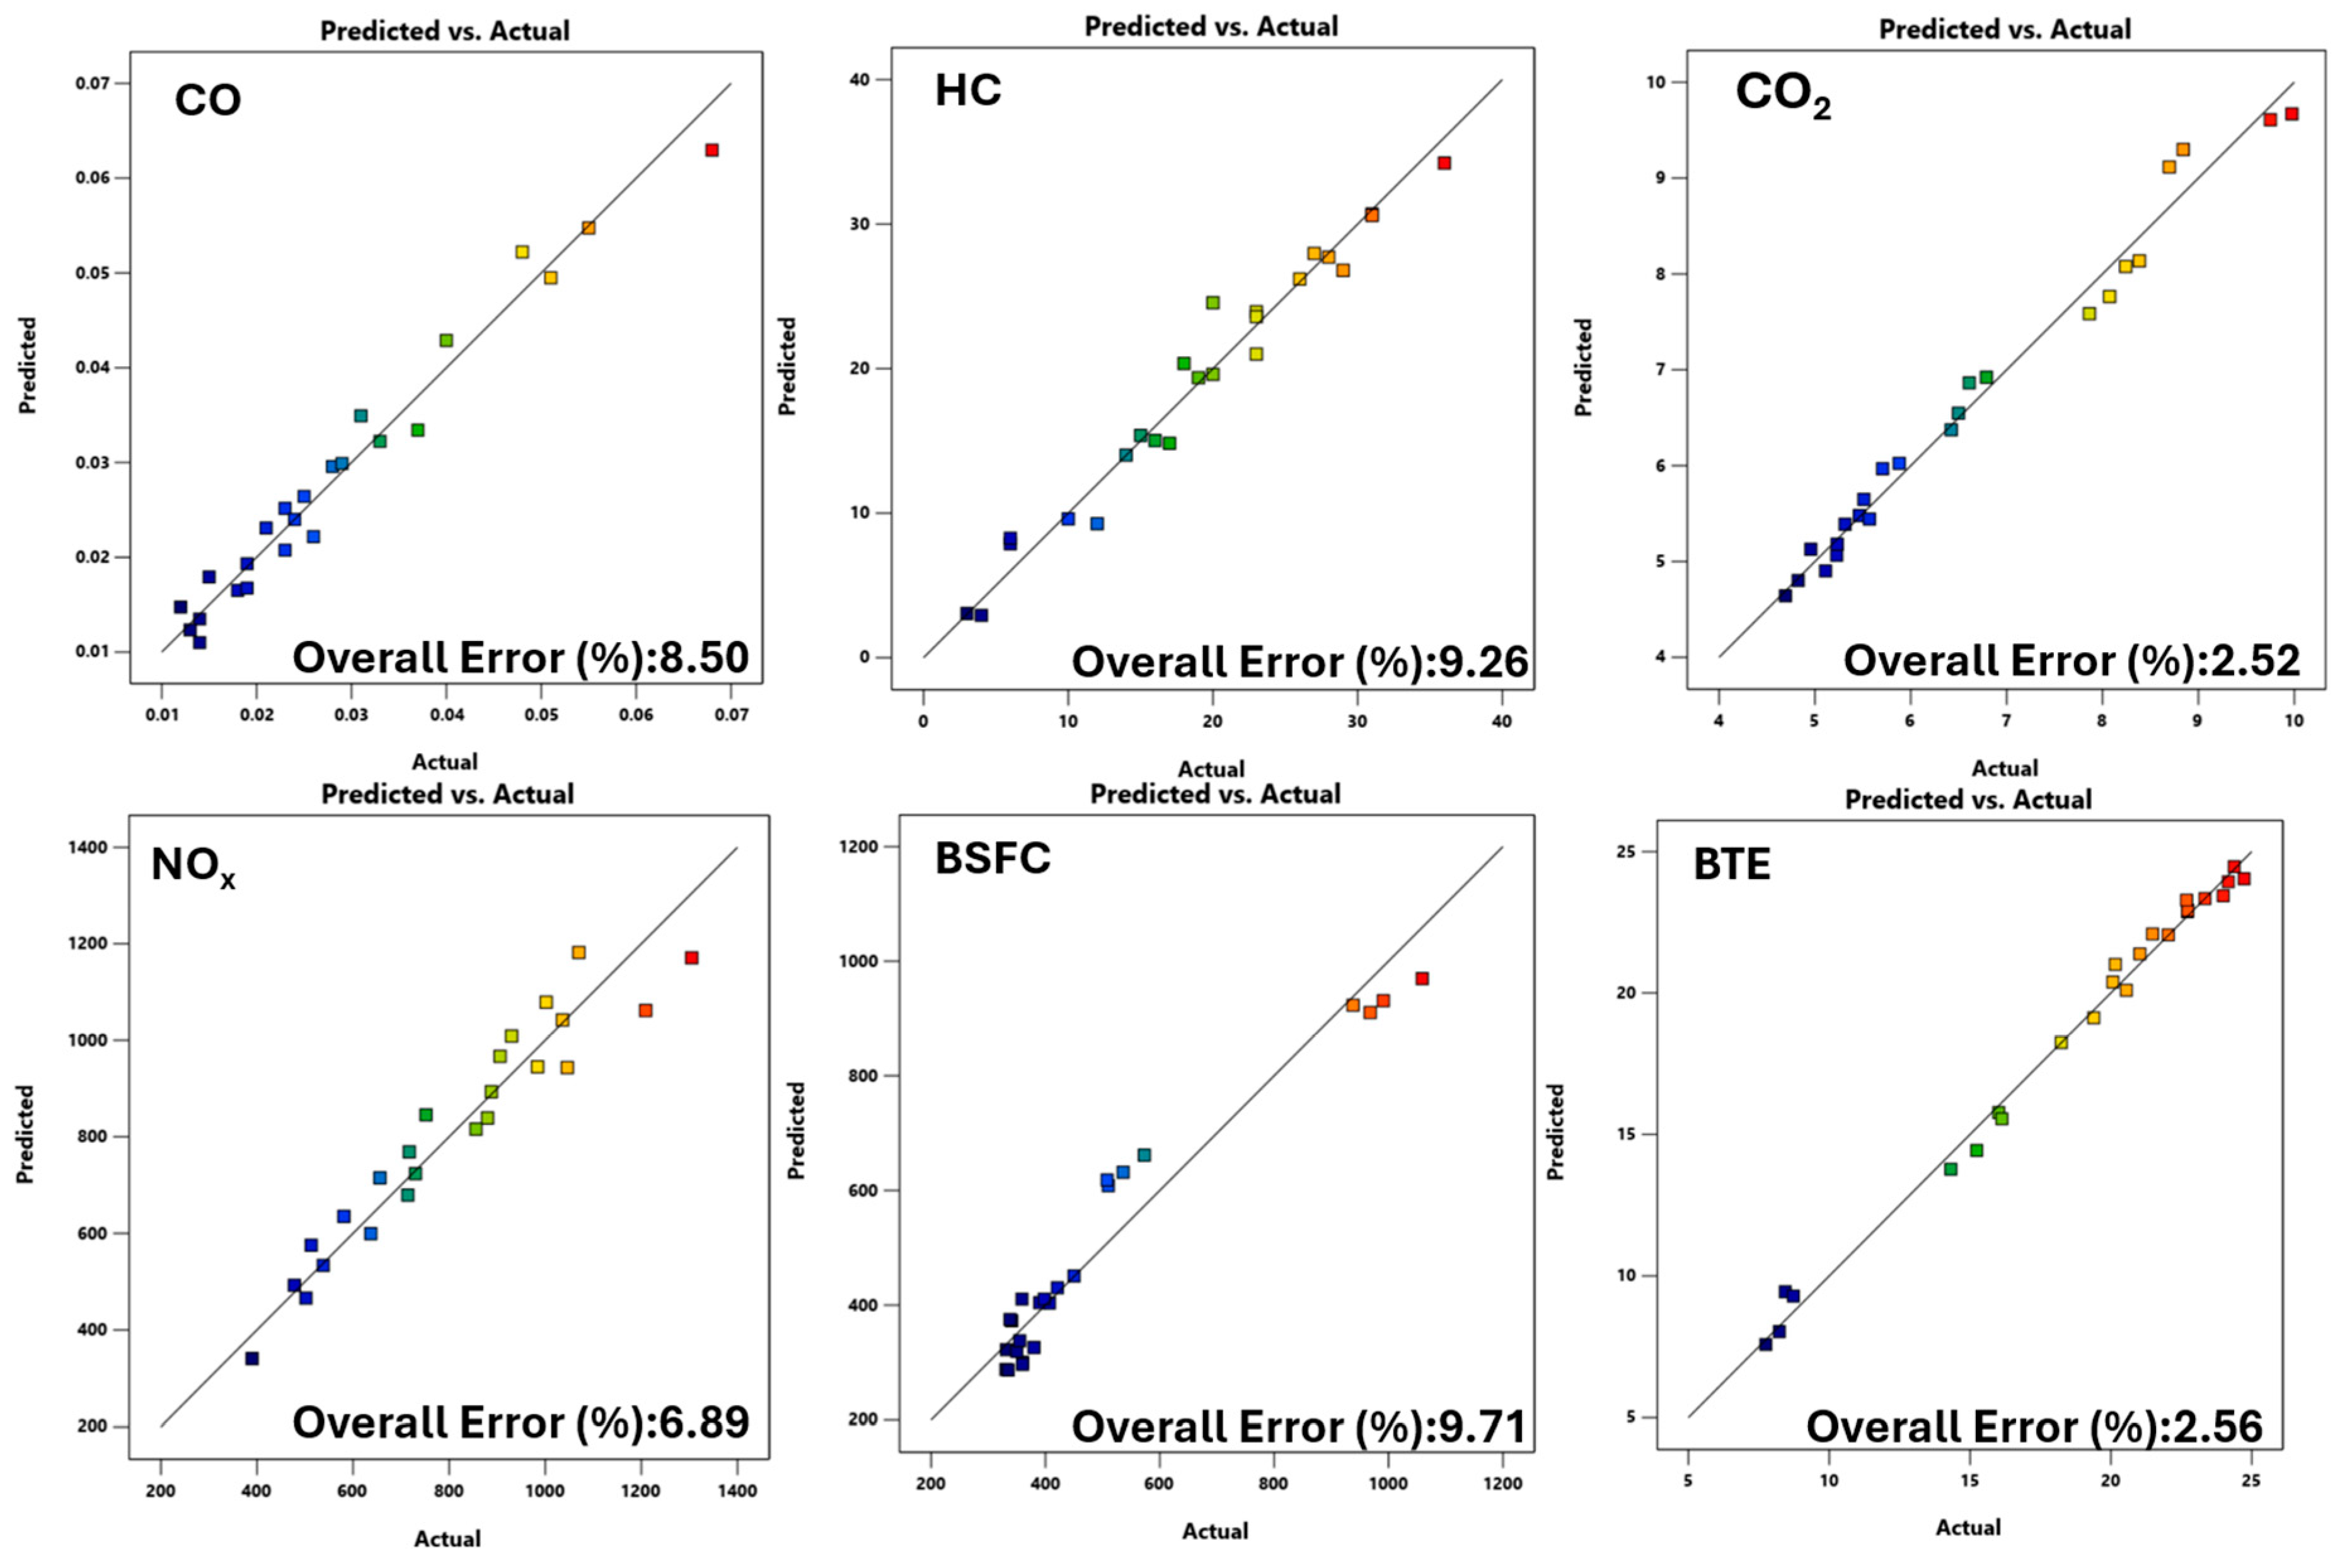
The developed quadratic regression models for CO, HC, CO2, NOx, BSFC, and BTE are presented in Equations (2)–(7). In these equations, MgCO3 represents the nanoparticle concentration (ppm), and load represents the engine load (kW). Regression equations were used to compare the RSM-predicted values with the experimental results under the actual operating conditions presented in Table 4. The comparison indicates a strong agreement between the measured and predicted data across all response variables, confirming the reliability of the developed models. The consistency between experimental observations and model outputs demonstrates that the second-order polynomial equations successfully capture the underlying behaviour of the system within the investigated design space. In addition, the error distribution illustrated in Figure 12 shows that the residuals are randomly scattered around zero without any systematic pattern. This random distribution of errors indicates that the models do not exhibit bias and that no significant trends are left unexplained. The relatively small magnitude of deviations further supports the adequacy of the regression models and suggests that the prediction errors are within acceptable limits for engineering applications. Overall, both the numerical comparison and residual analysis confirm that the RSM models provide accurate and reliable predictions for engine performance and emission characteristics under varying operating conditions.
CO = 0.081655 + −0.000184 × MgCO3 + −0.0609 × Load + −3.2 × 10⁻⁶ × MgCO3 × Load + 1.6 × 10⁻⁶ × MgCO32 + 0.0142 × Load2
HC = 0.9617 + −0.1541 × MgCO3 + 14.63 × Load + 0.0083 × MgCO3 × Load + 0.00102 × MgCO32 + −1.571 × Load2
CO2 = 4.701 + 0.014 × MgCO3 + −0.434 × Load + 6.297 × 10⁻⁵ × MgCO3 × Load + −8.642×10⁻⁵ × MgCO32 + 0.6351 × Load2
NOx = 323.44 + 3.5767 × MgCO3 + 294.11 × Load + 0.245 × MgCO3 × Load + −0.0302 × MgCO32 + −18.214 × Load2
BSFC = 1327.565 + −0.6882 × MgCO3 + −890.728 × Load + −0.1193 × MgCO3 × Load + 0.0067 × MgCO32 + 195.01786 × Load2
BTE = −0.07625 + 0.045058 × MgCO3 + 17.94361 × Load + −0.0028 × MgCO3 × Load + −0.00031 × MgCO32 + −3.431 × Load2
Figure 12 displays the discrepancy between the data derived from the regression equations and the real data. The BSFC parameter has the most inaccuracy (9.71%), whilst the CO2 parameter has the lowest error (2.52%). The CO parameter has an error rate of 8.50%, the HC parameter is 9.26%, the NOx parameter is 6.89%, and the BTE value is 2.56%. For every parameter, the error rate is less than 10%.
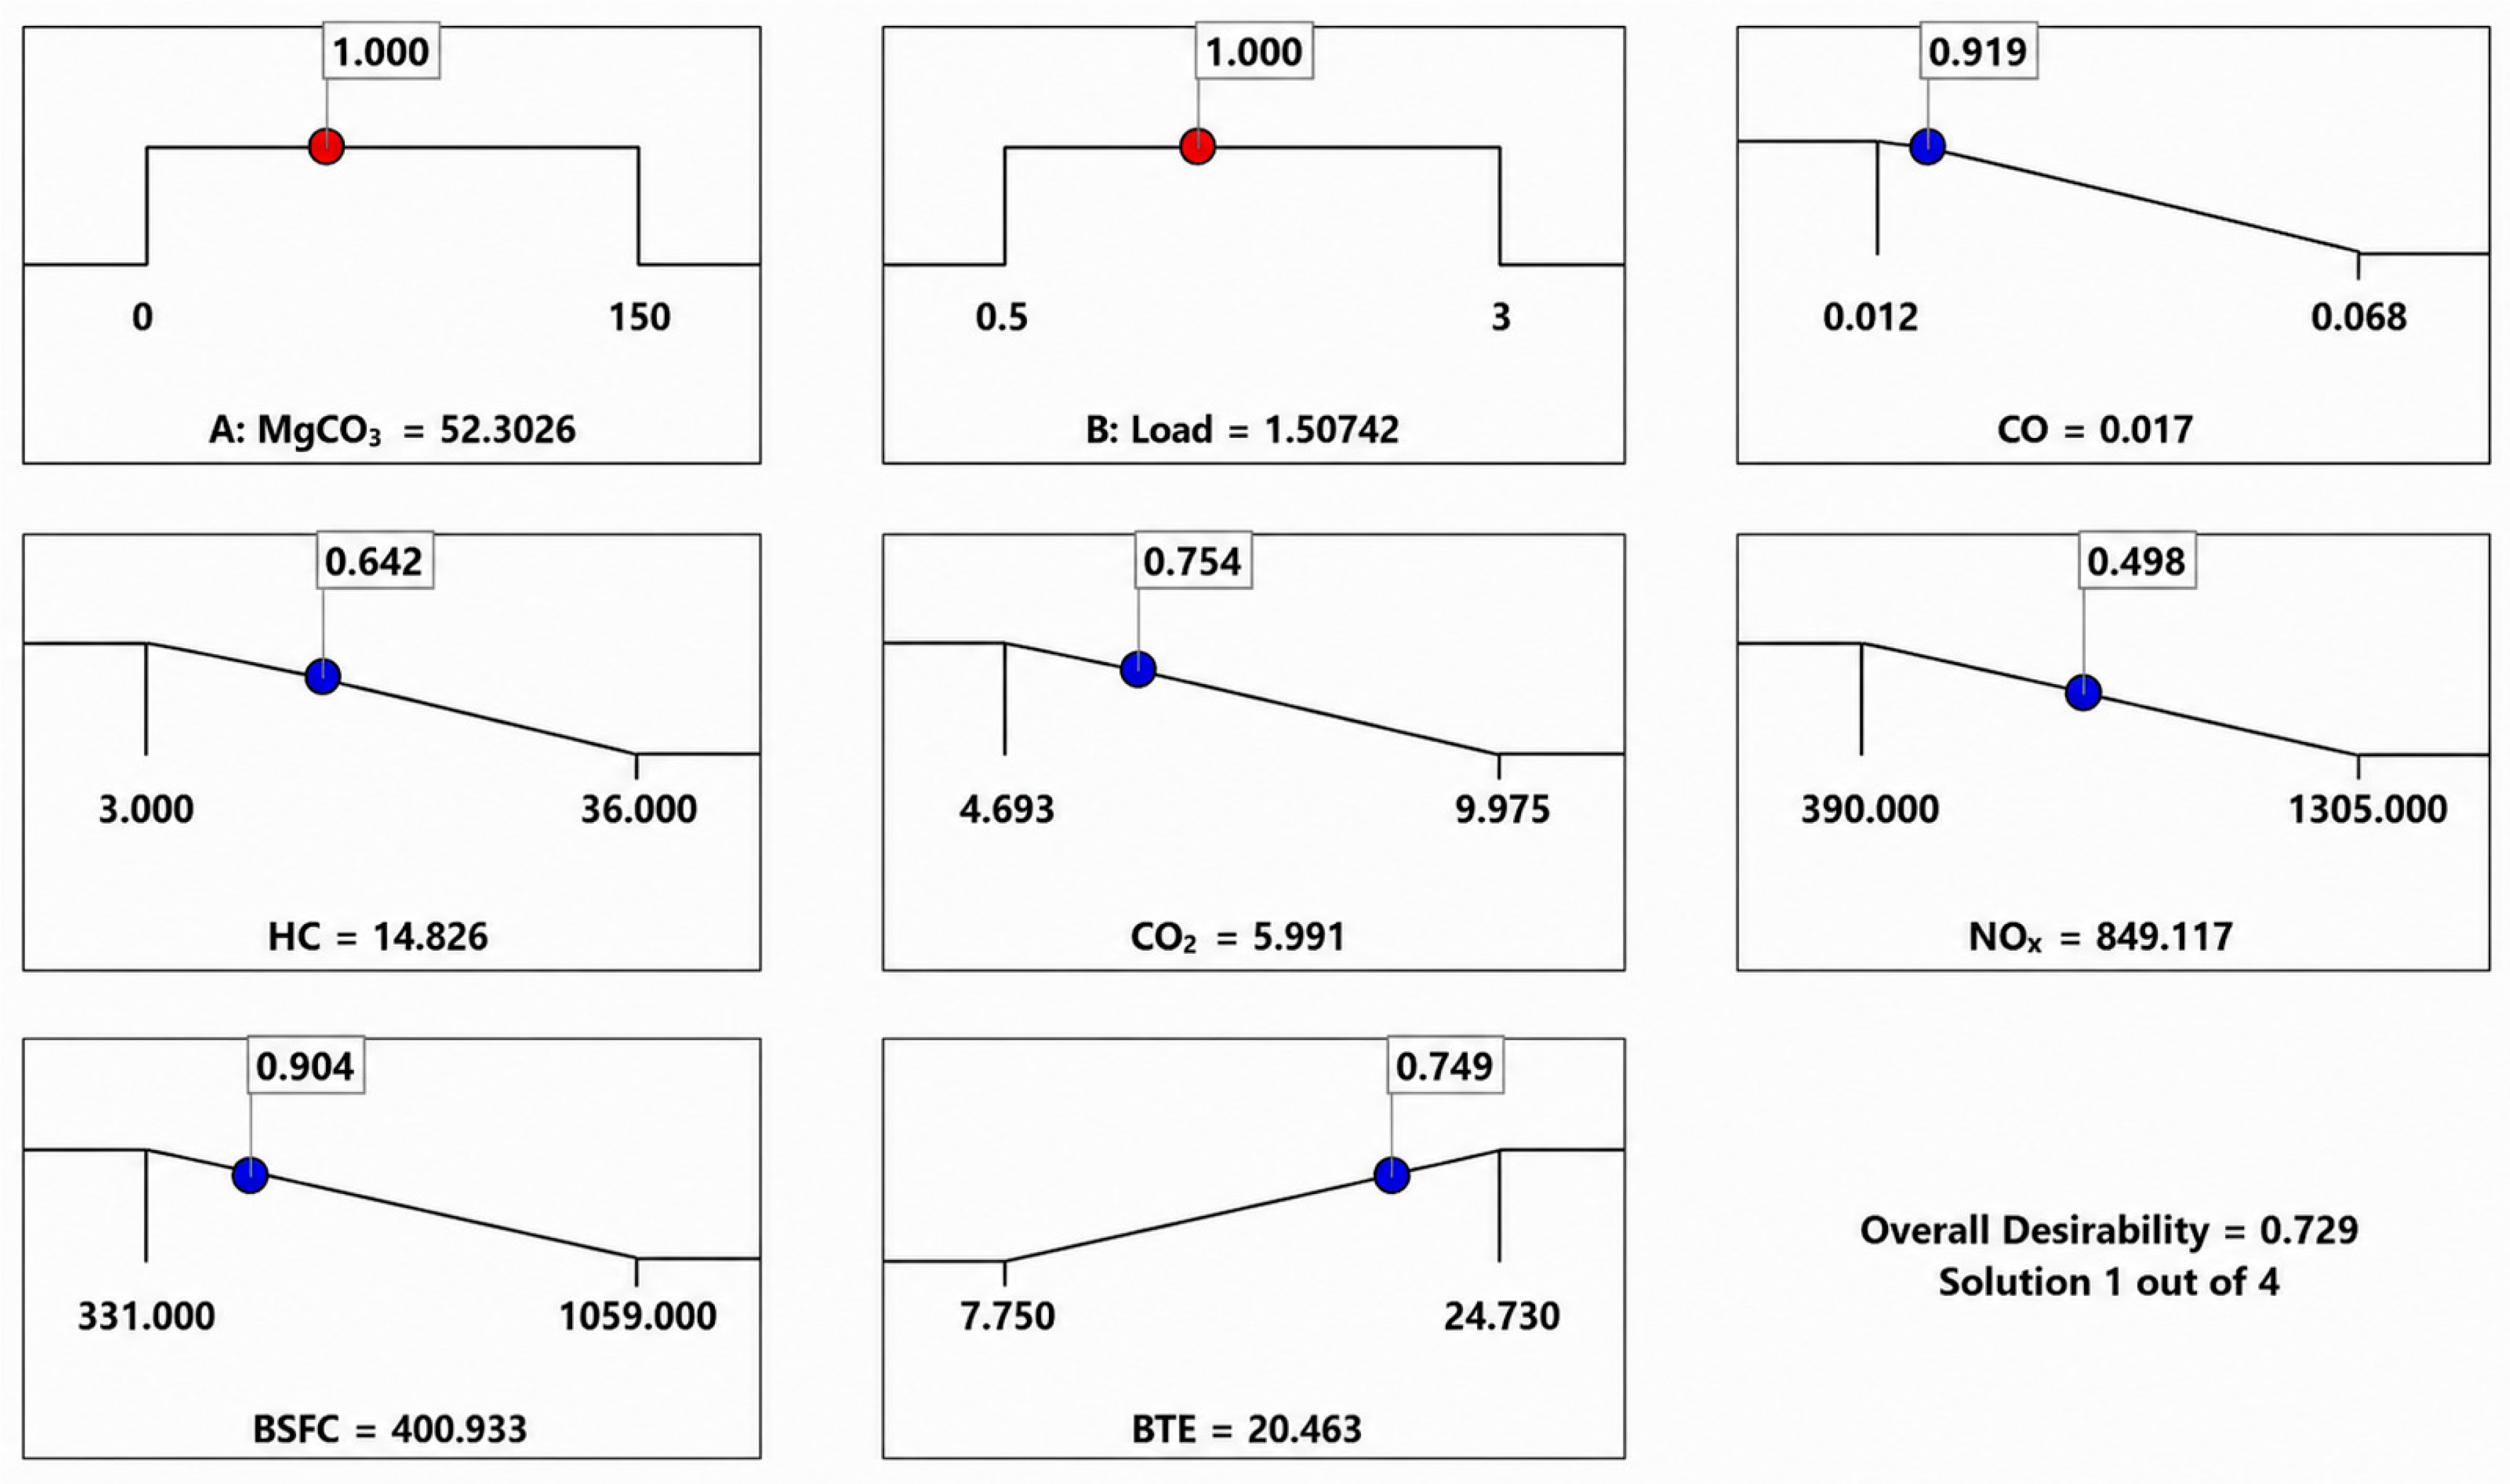
To determine ideal operating conditions, it was thought that each output parameter had equal weight and significance. This assumption’s primary goal is to maximize performance and minimize emissions under engine operating conditions. As a result, all output parameters aside from BTE were targeted for minimum values, whereas BTE was targeted for maximum values. Figure 13 depicts the optimal engine load and MgCO3 quantity. Fuel with 52.30 ppm MgCO3 reached its optimal value at a load of 1.51 kW. BSFC 400.933, NOx 849.117, BTE 20.46%, HC 14.83, CO 0.017, and CO2 5.99 were the results obtained under these operating conditions.
To assess how well the resulting optimization results matched the real experimental data, a validation experiment was carried out. The optimized MgCO3 nanoparticle concentration of 53.30 ppm was applied as 53 ppm, and the optimal engine load of 1.51 kW was applied as 1.5 kW, considering the sensitivity of the measurement devices and the engine’s operating circumstances. The generated regression equations were used to calculate the RSM prediction values corresponding to these operating circumstances. The findings of the validation experiment are compared to the values predicted by the RSM in Table 7. When the findings are analysed, NOx emissions have the most relative error (8.83%), whereas BSFC has the lowest relative error (0.71%). The fact that the computed error rates for every parameter stay below 10% indicates that the created optimization model can produce highly accurate predictions and that the RSM model effectively captures the experimental data. The current study is compared to other studies in the literature in Table 8.

4. Conclusions

This study investigated the effects of MgCO3 nanoparticle addition to cottonseed biodiesel–diesel blends on diesel engine performance and emission characteristics under different engine loads and optimized the operating conditions using RSM. Based on the experimental findings and statistical analyses, the following conclusions can be drawn.
BSFC increased by up to 16.11% for biodiesel blends compared to diesel, while nanoparticle addition reduced BSFC by up to 5.25%. BTE decreased by 7.84–13.53% for biodiesel fuels but improved by up to 5.87% with optimal MgCO3 addition. NOx emissions increased significantly, reaching up to 49.06%, while HC and CO emissions decreased by up to 42.44% and 51.93%, respectively. CO2 emissions increased by up to 17.67%, indicating improved combustion quality.
RSM analysis showed strong model adequacy with R2 values between 0.9178 and 0.9921, indicating high predictive capability. The models were statistically significant (p < 0.0001), with low CV values confirming experimental reliability.
Multi-objective optimization identified the optimum condition at 52.30 ppm MgCO3 and 1.51 kW load, yielding minimum emissions and improved efficiency. Excellent agreement between experimental and estimated values was confirmed by validation testing, with a maximum error of 8.83% for NOx and a minimum error of 0.71% for BSFC. All errors remained below 10%, confirming good model accuracy and reliable prediction capability.
Overall, the results demonstrate that the use of an appropriate amount of MgCO3 nanoparticles can partially compensate for the performance disadvantages of cottonseed biodiesel while simultaneously reducing incomplete combustion emissions. Furthermore, the successful application of RSM provides an effective approach for optimizing nanoparticle concentration and engine operating conditions to achieve a balanced improvement in engine performance and exhaust emissions.

Limitation and Future Work

This study has several limitations that should be considered. First, the investigation focused on the effects of MgCO3 nanoparticle concentration and engine load on engine performance and emissions, while detailed combustion analyses such as in-cylinder pressure and heat release rate were not performed. Second, only MgCO3 nanoparticles in cottonseed biodiesel–diesel blends were evaluated; other nanoparticle types and biodiesel feedstocks remain to be investigated. Third, the experiments were conducted at a constant engine speed, and the long-term effects of nanoparticles on engine durability were not assessed. In addition, fuel stability was evaluated only by short-term visual observation, without sedimentation, zeta potential, or particle size analyses. Finally, although the developed RSM models showed high predictive accuracy, future studies may further improve model robustness by employing alternative experimental designs such as Box–Behnken Design (BBD) or Central Composite Design (CCD).

Author Contributions

A.S. and R.Ş. conceived the study and contributed to its formal analysis. The research methodology was designed by A.S. and S.U. Software implementation and data visualization were undertaken by O.D. and A.S. Experimental investigation and data acquisition were carried out by R.Ş. and S.U. The initial manuscript draft was prepared collaboratively by O.D., A.S. and R.Ş., while critical revision and editing were performed by S.U. and O.D. Overall project administration and supervision were led by R.Ş. Funding support was secured by S.U. and O.D. All authors have read and agreed to the published version of the manuscript.

Funding

The Scientific Research Projects Coordination Unit of Bandırma Onyedi Eylül University provided financial assistance for this study under project number BAP-25-1003-003.

Institutional Review Board Statement

Not applicable.

Informed Consent Statement

Not applicable.

Data Availability Statement

Data will be made available on request.

Conflicts of Interest

The authors declare no conflicts of interest.

Nomenclature

BSFCBrake-specific fuel consumption
BTEBrake thermal efficiency
COCarbon monoxide
CO2Carbon dioxide
C0%100 diesel
C3070% pure diesel and 30% biodiesel
HCHydrocarbon
NOxNitrogen oxide
50C3050 ppm mgco3 + 70% pure diesel + 30% biodiesel
100C30100 ppm mgco3 + 70% pure diesel + 30% biodiesel
150C30150 ppm mgco3 + 70% pure diesel + 30% biodiesel
R2Correlation coefficient
MgCO3Magnesium carbonate
RSMResponse surface methodology

References

  1. Kalender, V.; Bayer, M.U.; Yavuz, M.; Yilmaz, I.T. Techno-Economic and Environmental Assessment of an RCCI Diesel Engine Fuelled with Fusel Oil Addition. Processes 2026, 14, 558. [Google Scholar] [CrossRef] [Scilit]
  2. Liang, X.; Zhao, B.; Wang, K.; Wang, Y.; Wang, Y.; Lv, X. Application of response surface methodology for the joint optimization of performance and emission characteristics of a diesel engine. Int. J. Green Energy 2021, 18, 697–707. [Google Scholar] [CrossRef] [Scilit]
  3. Bayer, M.U.; Bilgili, L.; Alkan, S.; Atak, Ü.; Çelik, V. Techno-Economic and Life-Cycle Assessment of Hydrogen–Ammonia Fuel Blends in Tugboat Engines for Sustainable Port Operations. Sustainability 2025, 17, 10285. [Google Scholar] [CrossRef] [Scilit]
  4. Rao, T.S.S.B.; Manimaran, R.; Manivannan, C.; Reddy, V.S.N.; Mehar, K. Advanced prediction and optimization of VCR engine characteristics using RSM with DFA for sustainable biofuel derived from waste lemon Peel. Sci. Rep. 2025, 15, 34661. [Google Scholar] [CrossRef] [Scilit] [PubMed]
  5. Kumar, K.S.; Muniamuthu, S.; Khan, T.M.Y.; Razak, A. Performance evaluation of a diesel engine fuelled with waste plastic pyrolysis oil, 1-butanol, and CeO2 additives under varying injection pressures. Case Stud. Therm. Eng. 2025, 72, 106284. [Google Scholar] [CrossRef] [Scilit]
  6. Bayraktar, M.; Bayramoğlu, K.; Yuksel, O. Evaluating the Greenhouse Gas Fuel Intensity of Marine Fuels Under the Maritime Net-Zero Framework. Sustainability 2025, 18, 184. [Google Scholar] [CrossRef] [Scilit]
  7. Ajith, B.S.; Patel, G.C.M.; Der, O.; Selvan, C.P.; Samuel, O.D.; Annadurai, S.; Thajudeen, K.Y.; Yadav, K.K. Microwave-assisted transesterification of hybrid Garcinia gummi-gutta and Garcinia indica oils: Optimization using RSM and meta-heuristic algorithms for high-yield biodiesel production. Biomass Bioenergy 2025, 202, 108223. [Google Scholar] [CrossRef] [Scilit]
  8. Kumar, K.S.; Inbaselvan, S.; Prakash, S.; Ragul, G.; Suriyaprakash, V. Assessing the performance of cotton seed oil blended with multi-walled carbon nanotubes doped with isopropyl alcohol in compression ignition engines. Int. J. Ambient. Energy 2026, 47, 2599257. [Google Scholar] [CrossRef] [Scilit]
  9. Zhu, C.Z.; Samuel, O.D.; Patel, G.M.; Der, O.; Abbas, M.; Hussain, F.; Ting, T.T. Enhancing CI engine performance and emission control using a hybrid RSM–Rao algorithm for ZnO-doped castor–neem biodiesel blends. Case Stud. Therm. Eng. 2025, 74, 106841. [Google Scholar] [CrossRef] [Scilit]
  10. Rao, T.S.S.B.; Manimaran, R.; Sankar, P.; Sreedhara, S.; Kottala, R.K.; Guntreddi, V. Sustainable Gossypium arboreum biodiesel production using an industrial waste heterogeneous catalyst for RCCI engine applications. Sci. Rep. 2025, 15, 38069. [Google Scholar] [CrossRef] [Scilit] [PubMed]
  11. Purnama, I.; Mutamima, A.; Aziz, M.; Wijaya, K.; Maulida, I.D.; Junaidi, J.; Sari, K.; Effendi, I.; Dini, I.R. Environmental Impacts and the Food vs. Fuel Debate: A Critical Review of Palm Oil as Biodiesel. GCB Bioenergy 2025, 17, e70043. [Google Scholar] [CrossRef] [Scilit]
  12. Savaş, A.; Uslu, S. Integrated Assessment of Non-Edible Biodiesel Production and Engine Performance and Emission Landscape under Diesel/Biodiesel Blends via RSM. Int. J. Automot. Sci. Technol. 2026, 10, 350–369. [Google Scholar] [CrossRef] [Scilit]
  13. Mangesha, Y.K.; Nallamothu, R.B.; Ancha, V.R. Effect of cottonseed biodiesel-diesel blends with dual nano additives on performance and emission: An experimental approach in a CI-Engine. Sci. Afr. 2025, 29, e02859. [Google Scholar] [CrossRef] [Scilit]
  14. Vellaiyan, S. Experimental study on energy and environmental impacts of alcohol-blended water emulsified cottonseed oil biodiesel in diesel engines. Results Eng. 2024, 24, 102873. [Google Scholar] [CrossRef] [Scilit]
  15. Chetia, B.; Debbarma, S.; Das, B. Enhancing engine performance; combustion, and emissions characteristics through CeO2-modified cottonseed biodiesel with hydrogen enrichment: A comprehensive investigation. Int. J. Hydrog. Energy 2024, 89, 1149–1165. [Google Scholar] [CrossRef] [Scilit]
  16. Kabudke, P.D.; Kharde, Y.R.; Parkhe, R.A. Experimental investigation on performance of cotton seed biofuel blended with diesel on variable compression ratio diesel engine. Mater. Today Proc. 2023, 72, 846–852. [Google Scholar] [CrossRef] [Scilit]
  17. Ağbulut, Ü.; Sarıdemir, S.; Rajak, U.; Polat, F.; Afzal, A.; Verma, T.N. Effects of high-dosage copper oxide nanoparticles addition in diesel fuel on engine characteristics. Energy 2021, 229, 120611. [Google Scholar] [CrossRef] [Scilit]
  18. Sun, S.; Xu, D.; Liang, Y.; Jiang, G.; Diao, Y.; Gong, X.; Wang, B. Effect of temperature; oxygen concentration, and CaO addition on SO2 and NOx emissions during oxygen-fuel combustion of municipal sludge. J. Energy Inst. 2022, 105, 424–432. [Google Scholar] [CrossRef] [Scilit]
  19. Patel, K.R.; Dhiman, V.D. Effect of hybrid nanoparticles MgO and Al2O3 added water-in-diesel emulsion fueled diesel engine using hybrid deep neural network-based spotted hyena optimization. Heat Transf. 2022, 51, 5748–5788. [Google Scholar] [CrossRef] [Scilit]
  20. Bitire, S.O.; Nwanna, E.C.; Jen, T.-C. The impact of CuO nanoparticles as fuel additives in biodiesel-blend fuelled diesel engine: A review. Energy Environ. 2023, 34, 2259–2289. [Google Scholar] [CrossRef] [Scilit]
  21. Muniyappan, S.; Krishnaiah, R. Experimental and artificial neural network (ANN) study on the impact of three different metal oxide nanoparticle combustion enhancers enriched on mahua biodiesel-diesel fuelled CI engine. Eng. Res. Express 2024, 6, 045567. [Google Scholar] [CrossRef] [Scilit]
  22. Mylapalli, S.; Maddi, Y.K.R.; Bikkavolu, J.R.; Murthy, B.S.; Pullagura, G.; Ravi, H.; Dennison, M.S.; Barik, D. Machine learning based analysis of diesel engine performance using Fe3O4 nanoadditive in sterculia foetida biodiesel blend. Sci. Rep. 2025, 15, 39028. [Google Scholar] [CrossRef] [Scilit] [PubMed]
  23. Aswathanrayan, M.S.; Santhosh, N.; Venkataramana, S.H.; Kumar, K.S.; Kamangar, S.; Arabi, A.I.A.; Algburi, S.; Al-sareji, O.J.; Bhowmik, A. Prediction of performance and emission features of diesel engine using alumina nanoparticles with neem oil biodiesel based on advanced ML algorithms. Sci. Rep. 2025, 15, 12683. [Google Scholar] [CrossRef] [Scilit] [PubMed]
  24. Savaş, A.; Uslu, S.; Wali, A. Magnetic Ni–Co ferrite nanoparticles as advanced fuel additives for diesel engines: Experimental performance, emission analysis and RSM optimization. Next Mater. 2026, 12, 102371. [Google Scholar] [CrossRef] [Scilit]
  25. Leo, G.M.L.; Jayabal, R.; Kathapillai, A.; Sekar, S. Performance and emissions optimization of a dual-fuel diesel engine powered by cashew nut shell oil biodiesel/hydrogen gas using response surface methodology. Fuel 2025, 384, 133960. [Google Scholar] [CrossRef] [Scilit]
  26. Ninkuu, V.; Liu, Z.; Zhou, Y.; Sun, X. The nutritional and industrial significance of cottonseeds and genetic techniques in gossypol detoxification. Plants People Planet 2024, 6, 271–286. [Google Scholar] [CrossRef] [Scilit]
  27. ASTM D240; Standard Test Method for Heat of Combustion of Liquid Hydrocarbon Fuels by Bomb Calorimeter. ASTM International: West Conshohocken, PA, USA, 2022.
  28. ASTM D93; A Standard Test Methods for Flash Point by Pensky–Martens Closed Cup Tester. ASTM International: West Conshohocken, PA, USA, 2022.
  29. ASTM D4052; Standard Test Method for Density, Relative Density, and API Gravity of Liquids by Digital Density Meter. ASTM International: West Conshohocken, PA, USA, 2022.
  30. ASTM D445; Standard Test Method for Kinematic Viscosity of Transparent and Opaque Liquids (and Calculation of Dynamic Viscosity). ASTM International: West Conshohocken, PA, USA, 2022.
  31. Canan, A. Multi-purpose optimization with response surface methodology of plastic waste cables to clean energy with graphene nanoparticles. J. Environ. Manag. 2025, 391, 126336. [Google Scholar] [CrossRef] [Scilit] [PubMed]
  32. Şirin, T.B.; Der, O.; Kuş, H.; Avdan, Ç.G.; Yüksel, S.; Etyemez, A.; Ay, M. Optimization of End Mill Geometry for Machining 1.2379 Cold-Work Tool Steel Through Hybrid RSM-ANN-GA Coupled FEA Approach. Machines 2025, 14, 15. [Google Scholar] [CrossRef] [Scilit]
  33. Canan, A. Enrichment of 3rd generation biodiesel/diesel blends with optimum boron oxide for cleaner diesel emissions by multi-objective optimization using RSM. Environ. Res. 2025, 276, 121472. [Google Scholar] [CrossRef] [Scilit] [PubMed]
  34. Manimaran, R. Optimization of Azadirachta indica leaf extract mediated cerium oxide nanoparticles synthesis, characterization, and its applications. Ind. Crops Prod. 2023, 204, 117304. [Google Scholar] [CrossRef] [Scilit]
  35. Savaş, A.; Uslu, S.; Der, O.; Uslu, G.; Şener, R. Towards Sustainable Internal Combustion Engines: Optimization of Cobalt Oxide Nano-Additive Microalgae Biodiesel Blends for Emission Mitigation and Performance Enhancement. Fire 2026, 9, 250. [Google Scholar] [CrossRef] [Scilit]
  36. Perumal, V.; Ilangkumaran, M. The influence of copper oxide nano particle added pongamia methyl ester biodiesel on the performance, combustion and emission of a diesel engine. Fuel 2018, 232, 791–802. [Google Scholar] [CrossRef] [Scilit]
  37. Kumar, K.S. Potential performance of diesel engine powered by mango seed blends + pyrolysis oil doped with zirconium catalyst. J. Therm. Eng. 2025, 11, 1671–1684. [Google Scholar] [CrossRef] [Scilit]
  38. Abdalla, I.E. Experimental studies for the thermo-physiochemical properties of Biodiesel and its blends and the performance of such fuels in a Compression Ignition Engine. Fuel 2018, 212, 638–655. [Google Scholar] [CrossRef] [Scilit]
  39. Yusuf, A.A.; Dandakouta, H.; Yahuza, I.; Yusuf, D.A.; Mujtaba, M.A.; El-Shafay, A.S.; Soudagar, M.E.M. Effect of low CeO2 nanoparticles dosage in biodiesel-blends on combustion parameters and toxic pollutants from common-rail diesel engine. Atmos. Pollut. Res. 2022, 13, 101305. [Google Scholar] [CrossRef] [Scilit]
  40. Kumar, M.; Ansari, N.A.; Gautam, R. Optimising CRDI engine performance using waste-derived biodiesel, bioethanol, and ceric oxide nanoparticles: An RSM approach for emission reduction and economic viability. Fuel 2026, 415, 138435. [Google Scholar] [CrossRef] [Scilit]
  41. Merchan-Merchan, W.; McCollam, S.; Pugliese, J.F.C. Soot formation in diffusion oxygen-enhanced biodiesel flames. Fuel 2015, 156, 129–141. [Google Scholar] [CrossRef] [Scilit]
  42. Bayindirli, C.; Celik, M.; Zan, R. Optimizing the thermophysical properties and combustion performance of biodiesel by graphite and reduced graphene oxide nanoparticle fuel additive. Eng. Sci. Technol. Int. J. 2023, 37, 101295. [Google Scholar] [CrossRef] [Scilit]
  43. Savaş, A.; Uslu, S.; Şener, R. Optimization of performance and emission characteristics of a diesel engine fueled with MgCO3 nanoparticle doped second generation biodiesel from jojoba by using response surface methodology (RSM). Fuel 2025, 381, 133658. [Google Scholar] [CrossRef] [Scilit]
  44. Şener, R.; Uslu, S.; Savaş, A. The role of magnetic maghemite (Fe2O3) nanoparticles for the improvement of 2nd generation biodiesel/diesel Blends: RSM based multi-objective optimization. Renew. Energy 2025, 249, 123211. [Google Scholar] [CrossRef] [Scilit]
  45. Mofijur, M.; Ahmed, S.F.; Ahmed, B.; Mehnaz, T.; Mehejabin, F.; Shome, S.; Almomani, F.; Chowdhury, A.A.; Kalam, M.A.; Badruddin, I.A.; et al. Impact of nanoparticle-based fuel additives on biodiesel combustion: An analysis of fuel properties, engine performance, emissions, and combustion characteristics. Energy Convers. Manag. X 2024, 21, 100515. [Google Scholar] [CrossRef] [Scilit]
  46. Ghany, F.A.; Wahono, B.; Praptijanto, A.; Putrasari, Y.; Dimyani, A.; Nur, A.; Suherman; Pratama, M.; Wardana, M.K.A. Study on the Effect of High-Concentration Oxygen Enrichment on Engine Performance and Exhaust Emissions Using Diesel Fuel and Palm Biodiesel Substitute Fuel. Energies 2024, 17, 244. [Google Scholar] [CrossRef] [Scilit]
  47. Modi, V.; Rampure, P.B.; Babbar, A.; Kumar, R.; Nagaral, M.; Bhowmik, A.; Kumar, R.; Pandey, S.; Hasnain, S.M.M.; Ali, M.M.; et al. Nanoparticle-enhanced biodiesel blends: A comprehensive review on improving engine performance and emissions. Mater. Sci. Energy Technol. 2024, 7, 257–273. [Google Scholar] [CrossRef] [Scilit]
  48. Ghadikolaei, M.A.; Cheung, C.S.; Yung, K.-F. Study of combustion, performance and emissions of diesel engine fueled with diesel/biodiesel/alcohol blends having the same oxygen concentration. Energy 2018, 157, 258–269. [Google Scholar] [CrossRef] [Scilit]
  49. Murugesan, E.; Dhairiyasamy, R.; Dixit, S.; Singh, S. The impact of nanoparticle-diesel blends on fuel properties, combustion efficiency, and emissions. Case Stud. Therm. Eng. 2025, 69, 106070. [Google Scholar] [CrossRef] [Scilit]
  50. Vellaiyan, S.; Partheeban, C.M.A. Combined effect of water emulsion and ZnO nanoparticle on emissions pattern of soybean biodiesel fuelled diesel engine. Renew. Energy 2020, 149, 1157–1166. [Google Scholar] [CrossRef] [Scilit]
  51. Arun, S.B.; Yatish, K.V.; Tigari, G.; Prashanth, G.K.; Lalithamba, H.S.; Pramoda, K. Bio-Based Plant-Extract Facilitated MgO Nanocatalyst for the Transformation of Agriculture Waste Derived-Feedstock into Biodiesel and as Nano-Additive in Diesel Engine. Renew. Energy 2026, 256, 124218. [Google Scholar] [CrossRef] [Scilit]
  52. Torkzaban, S.; Feyzi, M.; Norouzi, L. A novel biodegradable nanoparticle as a robust biodiesel antioxidant, and fuel additive for improvement of diesel engine performance and exhaust emission. Renew. Energy 2025, 242, 122345. [Google Scholar] [CrossRef] [Scilit]
  53. Savaş, A. Sustainable energy application of third-generation Spirulina microalgae biodiesel with NiO nanoparticle additives: Experimental performance, emission characteristics, and multi-response optimization. Appl. Therm. Eng. 2026, 301, 131647. [Google Scholar] [CrossRef] [Scilit]
Figure 1. The study’s schematic representation.
Fluids 11 00193 g001
Figure 2. Biodiesel production.
Fluids 11 00193 g002
Figure 3. SEM of MgCO3.
Fluids 11 00193 g003
Figure 4. MgCO3 addition.
Fluids 11 00193 g004
Figure 5. Experimental setup.
Fluids 11 00193 g005
Figure 6. BSFC distribution and response behaviour: (a) contour map, (b) surface response, and (c) comparative bar chart.
Fluids 11 00193 g006
Figure 7. BTE distribution and response behaviour: (a) contour map, (b) surface response, and (c) comparative bar chart.
Fluids 11 00193 g007
Figure 8. NOx emission distribution and response behaviour: (a) contour map, (b) surface response, and (c) comparative bar chart.
Fluids 11 00193 g008
Figure 9. CO2 emission distribution and response behaviour: (a) contour map, (b) surface response, and (c) comparative bar chart.
Fluids 11 00193 g009
Figure 10. HC emission distribution and response behaviour: (a) contour map, (b) surface response, and (c) comparative bar chart.
Fluids 11 00193 g010
Figure 11. CO emission distribution and response behaviour: (a) contour map, (b) surface response, and (c) comparative bar Chart.
Fluids 11 00193 g011
Figure 12. Error rates.
Fluids 11 00193 g012
Figure 13. Optimization graph.
Fluids 11 00193 g013
Table 1. The features of the test fuels.
PropertiesDieselBiodieselC3050C30100C30150C30MethodRef
Calorific value (MJ/kg)45.84640.08444.11744.0743.9843.87ASTM D240 [27]
Flash point (°C)5516886.887.388.389.3ASTM D93 [28]
Density (kg/m3 at 15 °C)824.87887.95843.79845.48848.01850.95ASTM D4052 [29]
Kinematic viscosity (mm2/s at 40)2.695.813.633.703.793.90ASTM D445 [30]
Cetane number51.054.252525252Calculated-
Table 2. Diesel engine specifications.
ModelLutian 3GF-ME
Injection typeDirect
Number of cylindersSingle
Cooling typeAir cooled
Engine displacement (cm3)296
Rated power (kW)3.2
Rating speed (rpm)3000
Fuel typeDiesel
Table 3. Emission gas analyzer technical specifications.
ParameterMeasurement RangeSensibility
HC0–10,000 ppm±1 ppm
CO0–10% vol0.001%
CO20–20% vol0.001%
NOx0–5000 ppm±1 ppm
Table 4. Experimental data.
MgCO3
(ppm)
Load
(kW)
CO
(%)
HC
(ppm)
CO2
(%)
NOx
(ppm)
BSFC
(g/kWh)
BTE
(%)
00.50.05564.6935029918.23
010.031145.11163753615.24
01.50.026195.46473042119.39
020.018236.42288038021.48
02.50.015287.86398435023.34
030.025318.697103635922.72
500.50.05144.9575139688.44
5010.028125.31565651016.02
501.50.019175.70675240720.07
5020.014206.61090636022.69
502.50.013238.242100233524.38
5030.023299.751107033824.17
1000.50.04835.2325389388.73
10010.033105.56971450816.13
1001.50.019155.88085639820.55
10020.014186.789104636022.73
1002.50.012208.384120933124.73
10030.021279.975130534123.99
1500.50.06864.82539010597.75
15010.040165.22747857314.32
1501.50.029235.51058145018.24
15020.024266.49771735520.16
1502.50.023318.07488833222.04
15030.037368.84293039021.03
Table 5. Fit statistics.
BSFCBTECONOxHCCO2
Std. Dev.64.710.55690.002978.81.890.2448
Mean499.5818.610.028680519.046.65
C.V. %12.952.9910.19.799.933.68
R20.94040.99210.96970.91780.96660.9827
Adjusted R20.92380.98990.96120.89490.95730.9779
Predicted R20.8830.98630.9320.85550.93730.9588
Adeq Precision21.09460.651335.994321.353733.104341.0678
Table 6. F-values and p-values of responses.
COHCCO2
F-valuep-valueF-valuep-valueF-valuep-value
Model115.04<0.0001104.08<0.0001204.55<0.0001
A-MgCO323.110.00013.550.0761.630.218
B-Load281.28<0.0001465.98<0.0001939.64<0.0001
AB0.06720.79841.060.31580.00360.9527
A246.09<0.000143.36<0.000118.690.0004
B2224.66<0.00016.450.020662.81<0.0001
NOxBSFCBTE
F-valuep-valueF-valuep-valueF-valuep-value
Model40.18<0.000156.76<0.0001452.88<0.0001
A-MgCO33.380.08270.20890.653110.210.005
B-Load174.43<0.0001197<0.00011851.57<0.0001
AB0.53080.47560.18590.67151.340.2616
A222.080.00021.610.220946.94<0.0001
B20.49870.489184.77<0.0001354.34<0.0001
Table 7. Validation.
BSFC (g/kWh)NOx (ppm)HC (ppm)
ActualPredicatedActualPredicatedActualPredicated
406403.12779847.781614.72
Error (%)0.718.837.97
CO (%)BTE (%)CO2 (%)
ActualPredicatedActualPredicatedActualPredicated
0.0180.01720.0120.415.7165.983
Error (%)7.352.014.67
Table 8. Comparison of the present study with previous studies on nanoparticle-added biodiesel fuels.
BiodieselNanoparticlesFindingsReferences
Soybean biodiesel emulsionZnOEnhanced combustion characteristics, reduced smoke, NOx, HC, and CO emissions.[50]
Butea monosperma biodiesel (B20)MgOReduced BSFC, increased BTE, and lowered CO, UHC, and NOx emissions.[51]
Waste cooking oil biodiesel (B20)Pomegranate peel carbon quantum dots (CQDs)Improved combustion efficiency, reduced fuel consumption, and decreased CO, NOx, and UHC emissions.[52]
Microalgae biodiesel blendsNiOIncreased BTE, decreased BSFC, while NOx and CO2 slightly increased.[53]
Cottonseed biodiesel (30%)MgCO3 (50–150 ppm)MgCO3 nanoparticles enhanced combustion efficiency by increasing BTE and reducing BSFC. Significant reductions in CO and HC emissions were achieved, whereas CO2 and NOx emissions showed a slight increase due to more complete combustion.This study
Disclaimer/Publisher’s Note: The statements, opinions and data contained in all publications are solely those of the individual author(s) and contributor(s) and not of MDPI and/or the editor(s). MDPI and/or the editor(s) disclaim responsibility for any injury to people or property resulting from any ideas, methods, instructions or products referred to in the content.