Article

Influence of Structural Height on the Thermo-Hydraulic Performance of a Water-Cooled Gyroid Heat Sink


by
Mohamad Ziad Saghir
1,* and
Mohammad Mansur Rahman
2
1
Department of Mechanical, Industrial and Mechatronics Engineering, Toronto Metropolitan University, 350 Victoria Street, Toronto, ON M5B2K3, Canada
2
Department of Mathematics, College of Science, Sultan Qaboos University, Al-Khod, Muscat 123, Oman
*
Author to whom correspondence should be addressed.
Fluids 2026, 11(2), 57; https://doi.org/10.3390/fluids11020057
Submission received: 7 December 2025 / Revised: 28 January 2026 / Accepted: 17 February 2026 / Published: 19 February 2026
(This article belongs to the Special Issue Thermal Fluids: Theory and Applications)

Abstract

The triply periodic minimal surface structure is receiving significant attention amongst the engineering community. The advantage of using such a structure is its ability to provide lightweight cooling to surfaces. In this paper, attention is drawn to a gyroid structure composed of a shell network and a solid network, with a porosity of 0.7. Three different flow rates, using water as the circulating fluid, are experimentally applied to cool a square surface with a base of 37.5 mm and a height of 12.7 mm. It was found that this structure provided a high cooling rate, achieving a Nusselt number around 100 with a solid lattice and 160 for a shell lattice. It is also noted that the TPMS area plays a significant role, thereby increasing the cooling rate. When the TPMS height is 90% of the initial height of 12.7 mm, the performance of both structures is found to be well accepted. Pressure drop is reduced, and the heat performance is improved. The circulating flow above the structure marginally reduced the pressure drop. The performance evaluation criteria for the shell network ranged from 95 < PEC to < 225, and for the solid network from 125 < PEC to < 155. The optimization method has been applied across the entire height range using response surface methodology. It is found that the optimum TPMS height is for an aspect ratio of 95.1%.

1. Introduction

Recent technological advancements have led to a significant increase in heat flux dissipation requirements, crucial for maintaining efficiency and preventing permanent failure in electronic systems [1]. With the rapid advancement of technologies such as artificial intelligence, the demand for high computing power has increased significantly, leading to higher transistor density per unit area. This intensification poses critical challenges for thermal management in electronic devices. As the dimensions of the surfaces become smaller, one attempts to design different mechanisms to improve cooling [2]. In addition, the size and weight of the cooling system are crucial for the aerospace industry. Many approaches have been implemented using a mini channel with circulating fluid; a porous structure identified as foam metal has been used; and, recently, triply periodic minimal surface (TPMS) using 3D printing has been applied. In all three techniques, different fluids are used such as air, water and nanofluids.
MiCrochannel Heat Sinks (MCHSs) have emerged as a solution due to their high surface-to-volume ratio and excellent thermal performance. Traditional cooling methods, such as forced or natural air cooling, are no longer sufficient to meet the demands of modern high-performance electronics [1]. MCHSs, known for their compact structure and excellent thermal performance, have become a focal point for mitigating these thermal issues. Despite their advantages, traditional MCHSs face challenges, including limited heat transfer capacity and the formation of local hotspots. Recent research efforts have aimed at enhancing the design of MCHSs to improve heat transfer efficiency and manage temperature distribution more effectively [3].
Tuckerman and Pease [4] pioneered high-aspect ratio channels for high-performance forced liquid cooling in electrical devices. This research paved the way for further research on microchannel heat sinks. After that, many researchers focused on improving the thermal performance of microchannel heat sinks. Both laminar and turbulent flow regimes were investigated for deep channel systems [5]. The primary objective was to determine the best way to optimize average temperature, pressure drop, heat transfer coefficient, Nusselt number, flow, and substrate temperature uniformity. Designed characteristics, including cross-sectional shape, pattern, header shape, and input/output ports, were among the most effective parameters in investigations [6,7,8].
Most investigations focused on improving heat transfer at the expense of increased pressure drop. This issue led to research on minimizing pressure drop while enhancing thermal performance [9,10]. The first category consists of a straight microchannel heat sink. Common problems encountered in developing flow led to research on thermal boundary-layer re-development and secondary flow generation [11]. Moreover, analyses addressed nonuniform temperature distribution in a straight microchannel heat sink. Utilizing various configurations and designs ensures tackling this issue through illustration, oblique fin, double-layer microchannel, and different pin-fins [12,13,14].
Prajapati [15] numerically investigated the influence of fin height (ranging from 0.4 mm to 1.0 mm) on the thermal and hydraulic performance of rectangular microchannel heat sinks using single-phase water flow. Simulations were conducted for Reynolds numbers (Re) of 100–400 and heat fluxes of 100–500 kW/m2, revealing that fin height significantly impacts heat transfer and pressure drop. Results show that a fin height of 0.8 mm optimizes performance, achieving higher heat transfer rates (up to 10% more than a fully closed 1.0 mm fin configuration) while maintaining moderate pressure drops. Kou et al. [16] investigated the optimization of microchannel heat sink performance by adjusting channel width and height using a three-dimensional numerical model. The research focuses on minimizing thermal resistance across varying flow powers and channel dimensions, employing simulated annealing for optimization. Results indicate that larger flow areas, higher flow powers, and reduced substrate thickness significantly lower thermal resistance, with optimal channel widths identified for different configurations.
Hajialibabei et al. [17] presented an experimental and numerical study of the heat transfer performance of wavy-channel heat sinks with varying channel heights, focusing on the impact of the open space above the channels while keeping the heat sink height constant. The research evaluates temperature distribution, Nusselt number, flow characteristics, and performance evaluation criteria (PEC) under different heat fluxes and flow rates. Results show that reducing the channel height to 10 mm enhances heat transfer by 7.84% due to improved flow mixing in the open space, while further reductions to 7 mm and 4 mm degrade performance by increasing temperatures. The study identifies 10 mm as the optimal height, with PEC values ranging from 1.08 to 1.22, making it suitable for cooling electronic devices. The findings are validated through COMSOL (version 6.2) simulations and experimental data, underscoring the importance of channel height adjustments in wavy heat sink designs. Bandhari and Prajapati [18] presented a numerical study of the thermal performance of open microchannel heat sinks with variable square pin-fin heights, focusing on the impact of the open space above the fins while maintaining a constant channel height. The study highlighted the importance of balancing fin height and open space to maximize thermal performance while minimizing pressure drop, making the 1.5 mm fin height the most effective design for microchannel heat sinks.
Zhou and Catton [19] studied the thermal and hydraulic performance of plate-pin-fin heat sinks with different pin cross-sections (square, circular, elliptic, NACA, and dropform). It was indicated that adding pin-fins significantly enhances heat transfer compared to conventional plate-fins, but also increases pressure drop. Streamlined pin shapes—especially elliptic and NACA profiles—with an optimal pin width ratio (≈0.4 of the fin spacing) provide the best overall performance by balancing heat transfer enhancement and pressure losses, outperforming traditional plate-fin heat sinks. Zhao et al. [20] examined the heat transfer and fluid flow characteristics of enhanced heat sink configurations using numerical (CFD) analysis. The study shows that modifying fin or pin geometry can substantially improve heat dissipation compared to conventional designs, though often at the cost of increased pressure drop. Optimized geometries achieve a better trade-off between thermal performance and pumping power, making them suitable for compact and high-heat-flux electronic cooling applications. Chiu et al. [21] investigated numerically and experimentally the liquid-cooling efficiency of heat sinks with micro-pin-fins. It was found that the effective thermal resistance reached an optimum value across various pressure drops and was not sensitive to porosity for sparsely packed pin-fins. Later, Hussein [22] investigated heat transfer enhancement techniques for finned or pin-fin heat sinks using numerical (CFD) analysis. The researchers evaluated how geometric modifications influence temperature distribution, heat transfer rate, and pressure drop. Results showed that optimized fin or pin configurations significantly improve thermal performance compared to conventional designs, while highlighting the importance of balancing heat transfer enhancement against increased flow resistance for practical cooling applications.
Shih et al. [23] investigate the impact of height on the heat transfer performance of aluminum-foam heat sinks under impinging-jet flow conditions, revealing two conflicting effects: reducing the height decreases flow resistance, allowing more cooling air to reach the heated surface, but also reducing the heat transfer area between the air and the solid phase. Experimental results show that the Nusselt number initially increases with decreasing height-to-diameter ratio (H/D) but then declines after reaching an optimal point (H/D = 0.23 for the tested samples). The research also explores non-local thermal equilibrium (NLTE) phenomena, demonstrating that temperature differences between the solid and gas phases are significant at low Reynolds numbers and smaller dimensionless heights (H/D ≤ 0.31). Additionally, lower porosity and pore density enhance convective heat transfer. The study provides empirical correlations for Nusselt and Reynolds numbers. It highlights the superior performance of metal foams compared to flat surfaces, offering insights for optimizing heat sink designs in electronic cooling applications.
Berbee and Ellzey [24] studied the importance of aspect ratio on the flow over a facing step. Their focus was mainly on the boundary layer. Later, Shuja and Yilbas [25] investigated the effects of porosity and aspect ratio on a rectangular porous block. They indicated that increasing the aspect ratio enhances the Nusselt number while lowering the Grashof number. Lanzerstorfer and Kuhlmann [26] investigated the three-dimensional instability of the flow over a forward-facing step. A three-dimensional linear stability analysis showed that the stability boundary is a smooth, continuous function of the step aspect ratio.
Within the TPMS structure, there are a family of structures that are found to be important for heat removal. These structures are classified as either shell or solid. The difference between these two structures lies in their surface area. In the shell structure, the walls are thin and act like fins. Amongst them, the family of gyroids is found to be common for such applications. The TPMS structure is generated using different available software. In the current study, the MSLattice software by Al Ketan et al. [27] is used.
Saghir and Kilic [28] used a gyroid aluminum-silver structure with a porosity of 0.7 to investigate heat removal from a small hot surface. The dimension of this surface is identical to the size of a computer chip. In their study, Xu et al. [29] investigated a new family of triply periodic minimal surfaces, in particular, shell lattices. They showed the importance of a shell structure when compared to a solid structure. Yeranee and Rao [30] did a review of recent investigations on flow and heat transfer enhancement in cooling channels embedded with TPMSs. Ansari and Duwig [31] investigated the thermal performance of a gyroid triply periodic minimal surface (TPMS) heat sink (GHS) for electronic cooling, comparing it to a conventional pin-fin heat sink (PHS) across various porosities and flow rates. The GHS design demonstrates superior thermal performance due to its intricate helical flow structure and large heat transfer surface area, resulting in lower thermal resistance and temperature non-uniformity, especially under non-uniform heating conditions with random hotspots. However, the GHS also exhibits higher pressure drops, leading to increased pumping power.
Triply periodic minimal surfaces have proven effective for uniform cooling, but at the expense of high pressure drop [28]. Two critical parameters were monitored during the study: the average Nusselt number and the performance evaluation criterion (PEC). The latter has the advantage of assessing both thermal and hydraulic effects. To overcome the pressure drop, in the presence of the TPMS structure, it is interesting to investigate the flow structure and identify means to reduce it. As demonstrated in the literature review, reducing the fin height can enhance heat removal and minimize pressure drop. Since the TPMS exhibits a pressure drop, the question raised is whether reducing the structure height, allowing the flow to circulate above the TPMS, can reduce the pressure drop. Does the gap left between the structure height and the wall have any importance in cooling? To answer this question, this paper examines heat enhancement at different TPMS heights. The aspect ratio is the ratio of the original structure’s height to its width. It is essential to investigate the flow within and above the structure and whether, depending on the aspect ratio, it may significantly affect the cooling rate.
In this paper, a numerical investigation is conducted to assess the flow structure for different TPMS heights within a cavity. The novelty of this work is to investigate a means to reduce the pressure drop while maintaining a high heat enhancement. Section 2 presents the experimental setup for calibrating the numerical model at a height of 12.7 mm. Section 3 presents the numerical modelling used to compare the numerical data with the experimental temperature measurements. Section 4 demonstrates the numerical model’s accuracy, followed by Section 5, which predicts heat enhancement as a function of TPMS height. Optimization is conducted in Section 6, followed by the conclusion in Section 7.

2. Experimental Setup

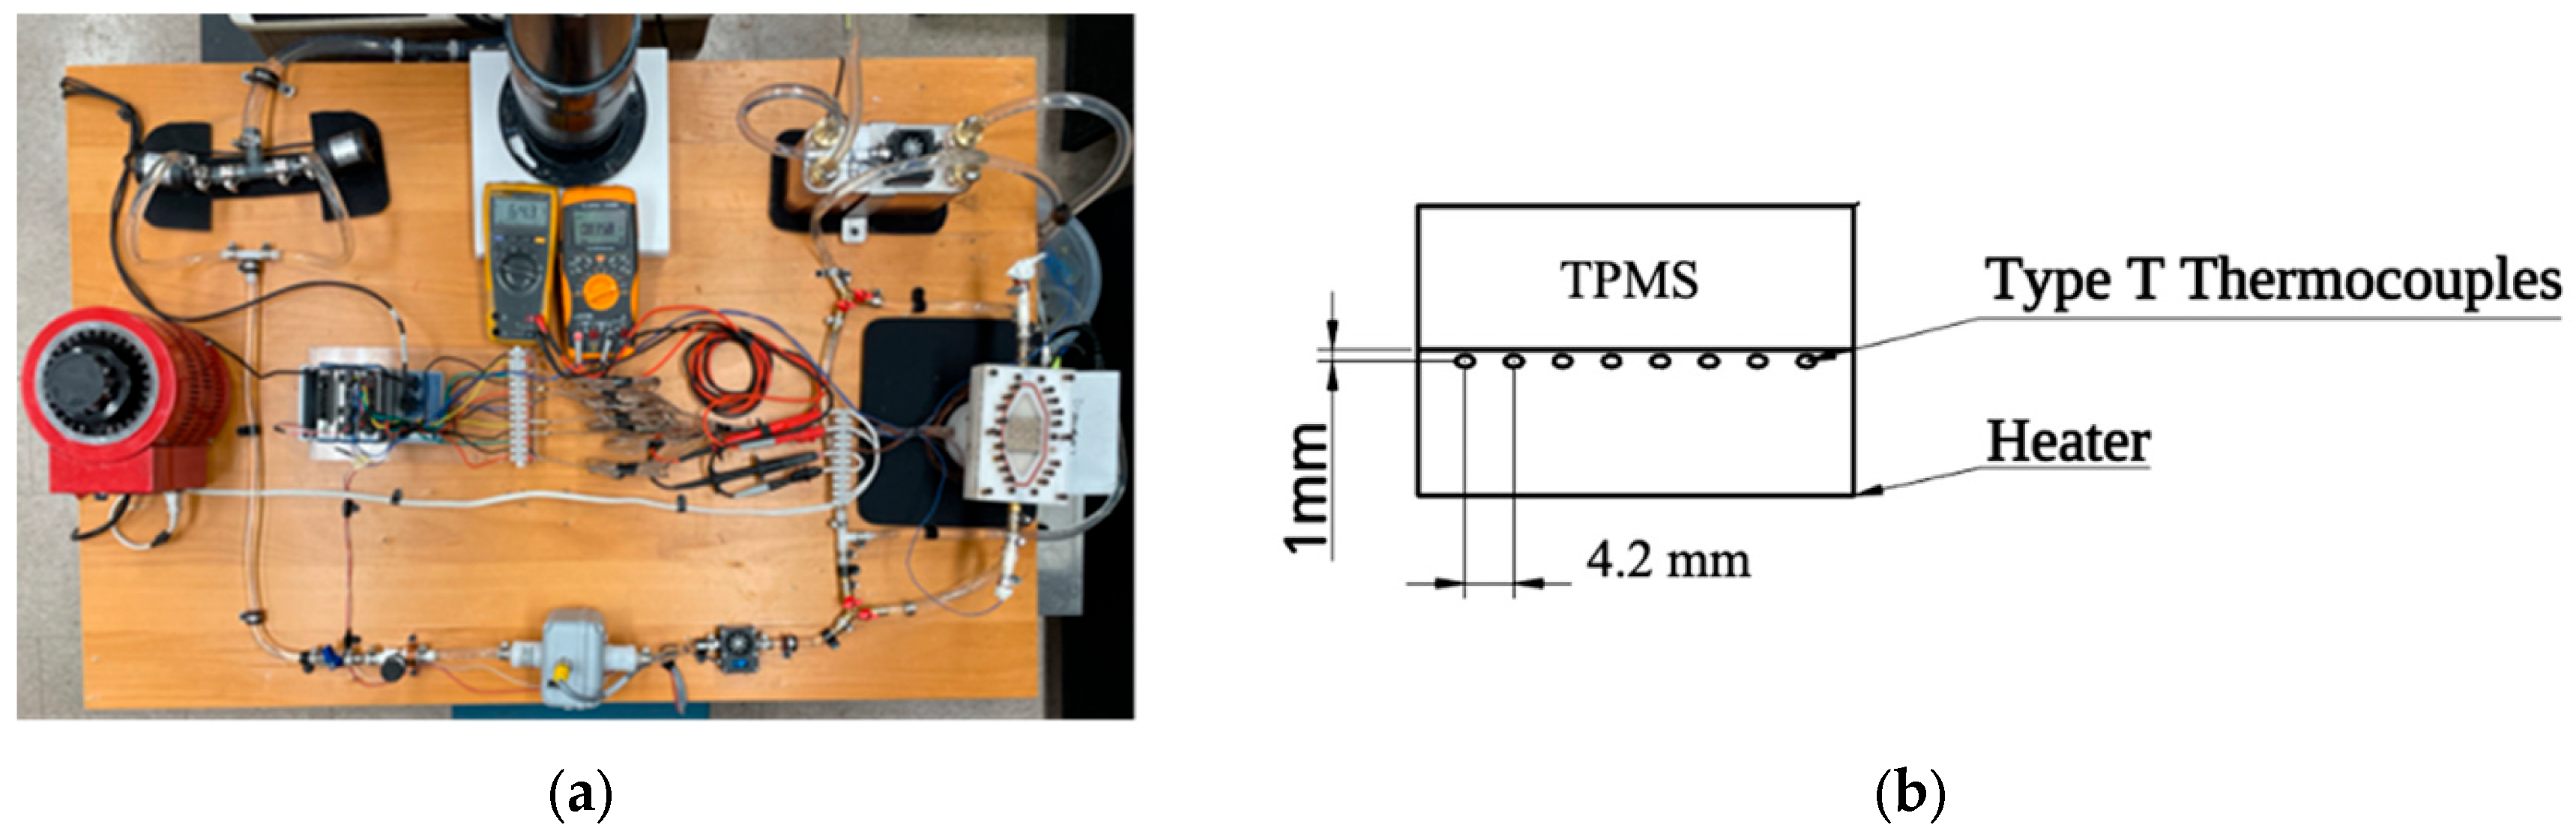
Figure 1 presents the experimental setup and the graphical test section. A pump with a controlled flow rate is used to force fluid through the test section. The flow rate is selected to maintain laminar flow. The heat is generated using a voltmeter and an ammeter, and the heat flux is fixed at 38,400 W/m2. A water bath is used to maintain a low temperature at the entrance of the test section. A heated aluminum block located below the test section (see Figure 2) is used in the experiment. Thermocouples are located 1 mm below the interface between the heated block and the test section (see Figure 1b). In total, nine thermocouples were used: one at the inlet, seven below the interface, and one at the outlet. The test section has the dimensions of an Intel Core i7 computer processor. The base is square, 37.5 mm long, and the height is 12.7 mm. The aluminum heated block and the TPMS structure have identical dimensions. More details about the experiment can be found in [28].
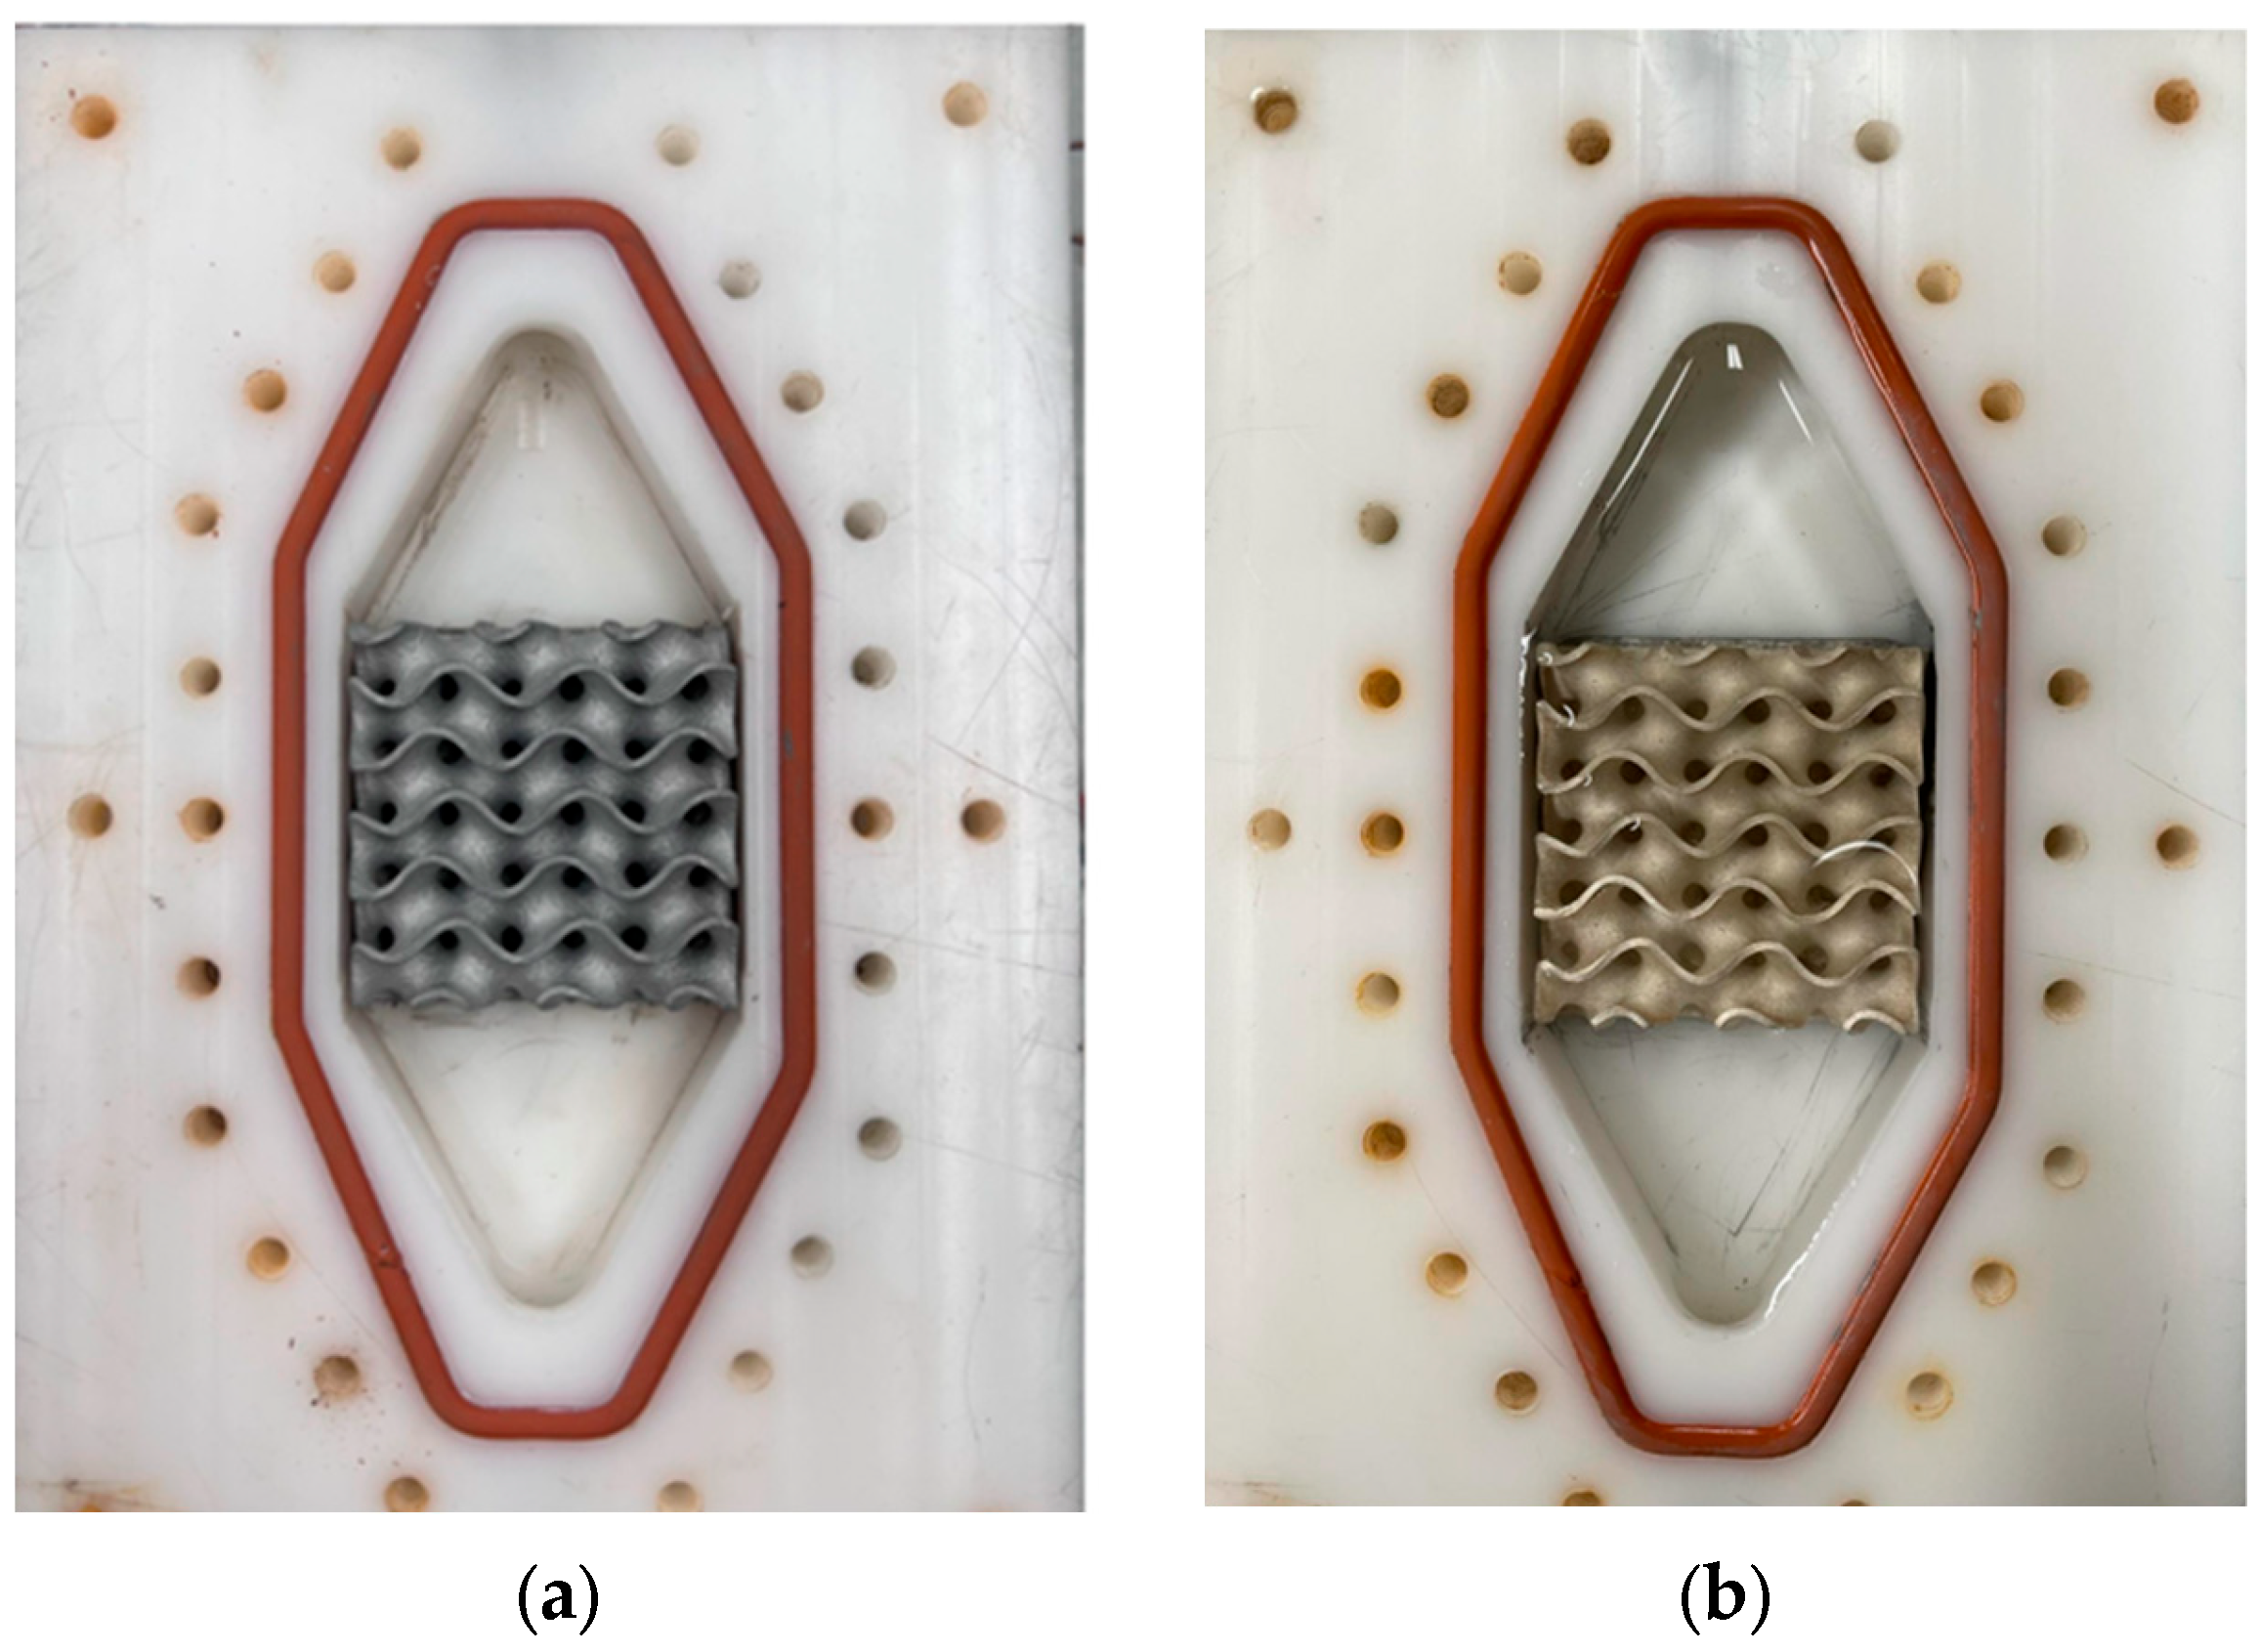
Figure 2 presents the test section with the aluminum TPMS and silver TPMS. As shown, the flow enters from one side of the hexagon and exits from the opposite side. Fluid circulates through the structure and absorbs heat conducted from the heated block. Thermo-paste is added between the TPMS structure and the heated block. The test section is made of an isolating material to stop heat leakage. A transparent plastic sheet covers the top of the test section, and multiple screws secure it. Two flow rates were applied during the experiment: 3.74 cm3/s and 19.85 cm3/s, corresponding to Reynolds numbers of 500 and 2500, respectively. The heat flux applied to the aluminum block remains constant at 38,400 W/m2. The inlet temperature may vary slightly between runs.

Uncertainty Analysis

Uncertainty analysis is conducted within the apparatus’s components used in the experimental data collection. The error-propagating components of the device are the flowmeter and the T-type thermocouples. For the flowmeter, the error was determined through calibration to be 0.44% (USGPM). The uncertainty was obtained through the calibration processes for the T-type thermocouple, yielding an uncertainty of 0.75% (°C). The uncertainty of the non-dimensional parameters, such as the Nusselt number and the temperature, is detected as the temperature and the flow rate fluctuate. For instance, for the local Nusselt number
N u = h x · D k
Here, D is the hydraulic diameter defined as four times the surface area of the TPMS at the entry divided by the perimeter, and the Reynolds number is given by:
R e = u i n · D ν
Additionally, there exist several parameters which are dimensional, such as the local heat transfer coefficients expressed in W/m2.C given by:
h x = q T x T i n = q T x
As we can see, the calculations in all the cases above rely on the experimental results. The uncertainty of the average Nusselt number would be obtained as follows:
δ N u = ( N u x · δ x ) 2 + + ( N u y · δ y ) 2 + + ( N u z · δ z ) 2
where hx represents the local heat transfer coefficient over the heater surface, Tx represents the local surface temperature, Tin represents the water inlet temperature, D represents the hydraulic diameter, and uin represents the inlet water velocity throughout the test section. The kinematic viscosity of the fluid is ν , and k represents the thermal conductivity of water. The maximum uncertainty in the local Nusselt number was 2.6%. Table 1 shows the physical properties of the fluid used in the experimental setup. The experiment will start when the inlet temperature reaches a steady state.

3. Finite Element Formulation and Boundary Conditions

The numerical modelling is conducted using COMSOL software. COMSOL uses the finite element method, with a segregated solver. The fluid is assumed to be Newtonian, and a steady-state condition is adopted. Table 1 presents the physical properties of the fluids under consideration. The flow is considered incompressible, and with the specified flow rate, it is laminar.
The full Navier–Stokes equations, combined with the continuity and energy equations, were solved numerically. The TPMS is modelled as a solid structure in the flow domain. This approach makes the model very complex. The reason is that one may observe channels with closed ends inside the structure. Thus, this requires redirecting the flow to the lower-pressure location. One may observe some high flow inside the structure, then the flow decreases. This non-uniform flow allows the fluid to circulate longer inside the structure, removing additional heat. The issue with solving this set of equations makes convergence more challenging. To overcome this situation, the fluid equations are solved assuming zero flow initially. The model is solved again upon convergence, using the flow field results as the initial condition. The new set of equations consists of the flow field formulation and the energy equation. This approach enabled fast, accurate convergence. The convergence criteria are set when the residues containing variables such as the three velocities, pressure, and temperature are below 10−6. In addition, the refined mesh can accurately solve this problem, but at the expense of processing time.

3.1. Mathematical Formulation of the System

Continuity equation
. ( ρ f V ) = 0
Navier–Stokes formulation in the x, y and z directions
V . ( ρ f V ) = p + . ( μ f V )
Energy formulation
V · ( ρ f C p T ) = · ( k f T )
Heat conduction
· ( k s T ) = 0
In the model, the TPMS is made using a solid gyroid network. The gravity term is removed since it is a forced-convection condition, and gravity is neglected.

3.2. Boundary Conditions of the System

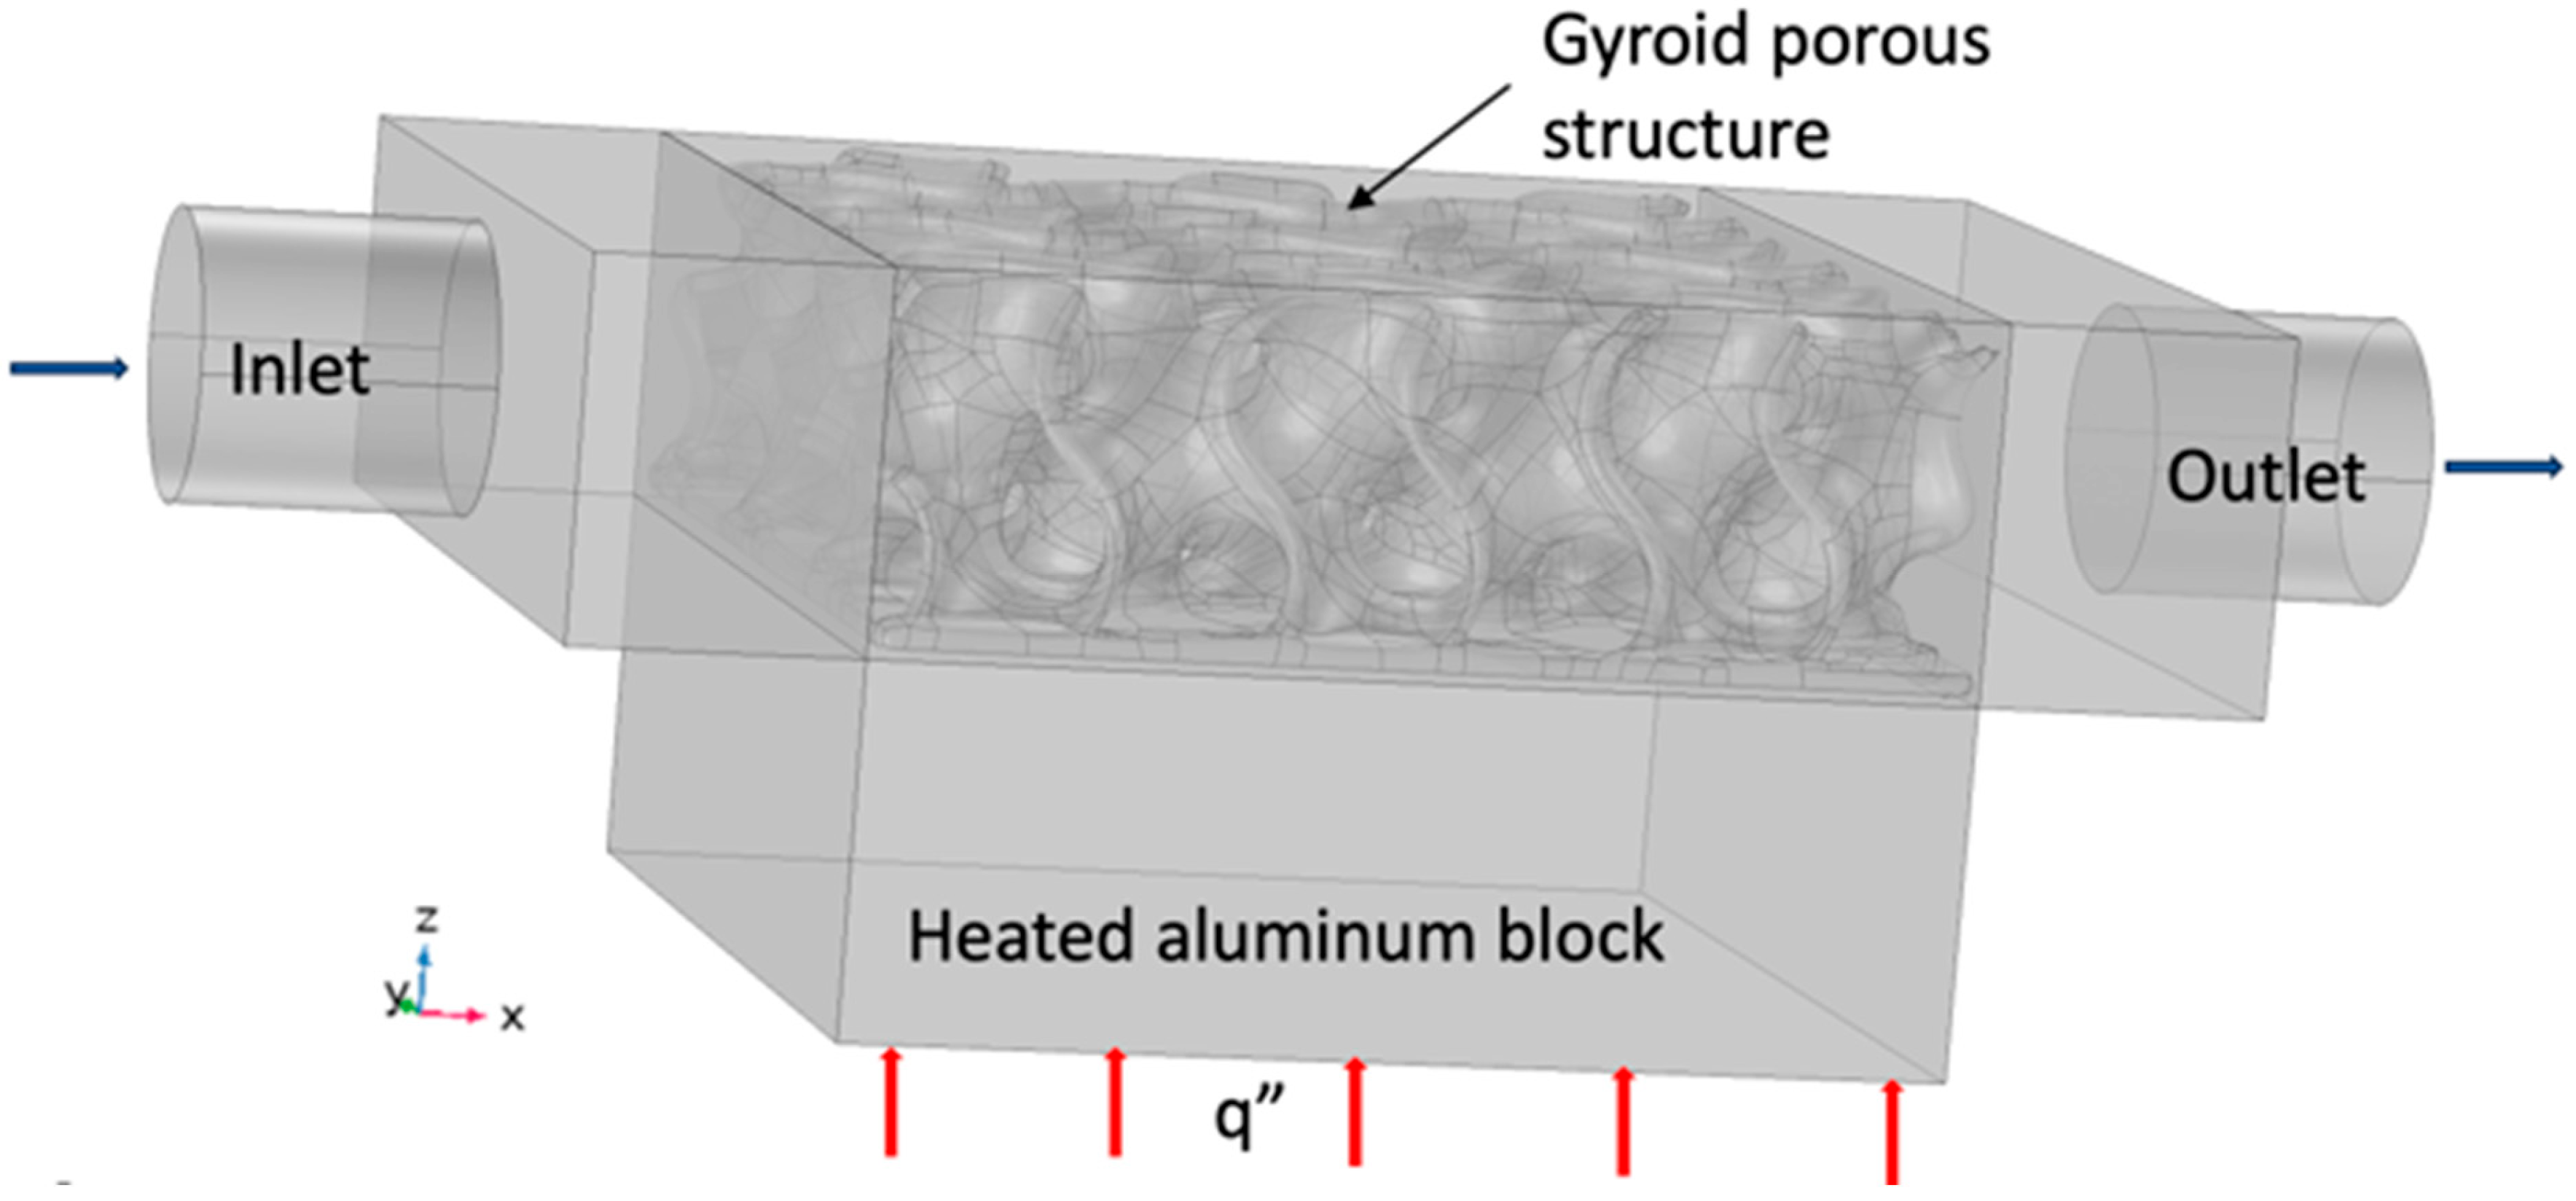
Figure 3 shows the boundary condition used in the model. The inlet and the outlet cylinders have a diameter of 1 cm. The red arrows indicate the location of the heat flux, which has a constant value of 38,400 W/m2. At the inlet, the fluid temperature is Tin; the inlet velocity is uin; and at the outlet, the temperature is Tout. All model boundaries, except where heat flux is applied, are insulated and treated as adiabatic. Thus, the boundary condition in equation form is
(i)
The velocity u = uin in the x direction is applied at the inlet.
(ii)
At the inlet, the temperature of the fluid enters the test section at T = Tin.
(iii)
At the outlet, an open boundary is applied where the stresses are equal to zero.
(iv)
The bottom surface of the aluminum block is heated with a heat flux q”, as shown in red.
(v)
All external surfaces are assumed adiabatic, T S u r f a c e n = 0 , and for the flow, no-slip boundary conditions are applied.
Figure 3. Boundary conditions used in the model.
Fluids 11 00057 g003
Multiple parameters are evaluated to assess the importance of this structure in heat removal. The current model’s porosity is set at 0.7 when this structure is designed. Permeability is not known and does not need to be investigated, as the TPMS is modelled as a solid structure. The first important parameter to evaluate is the Nusselt number, as defined earlier, along with the performance evaluation criterion (PEC). Pressure drop plays a crucial role in the design of a cooling system. This is represented by the friction factor, which is defined as
f = 0.5 p D ρ L u i n 2
It is interesting to combine the thermal and the hydraulic effects by evaluating the performance evaluation criteria (PEC), defined as
P E C = N u f 1 3
These non-dimensional parameters will be assessed during the analysis. A mesh sensitivity analysis has been conducted to ensure the model’s accuracy. A standard mesh level is adopted, consisting of 1,338,201 elements. These elements are composed of tetrahedral elements and boundary elements. For more detailed information, the reader is invited to examine reference [28].

4. Comparison Between the Experimental Data and the Numerical Model

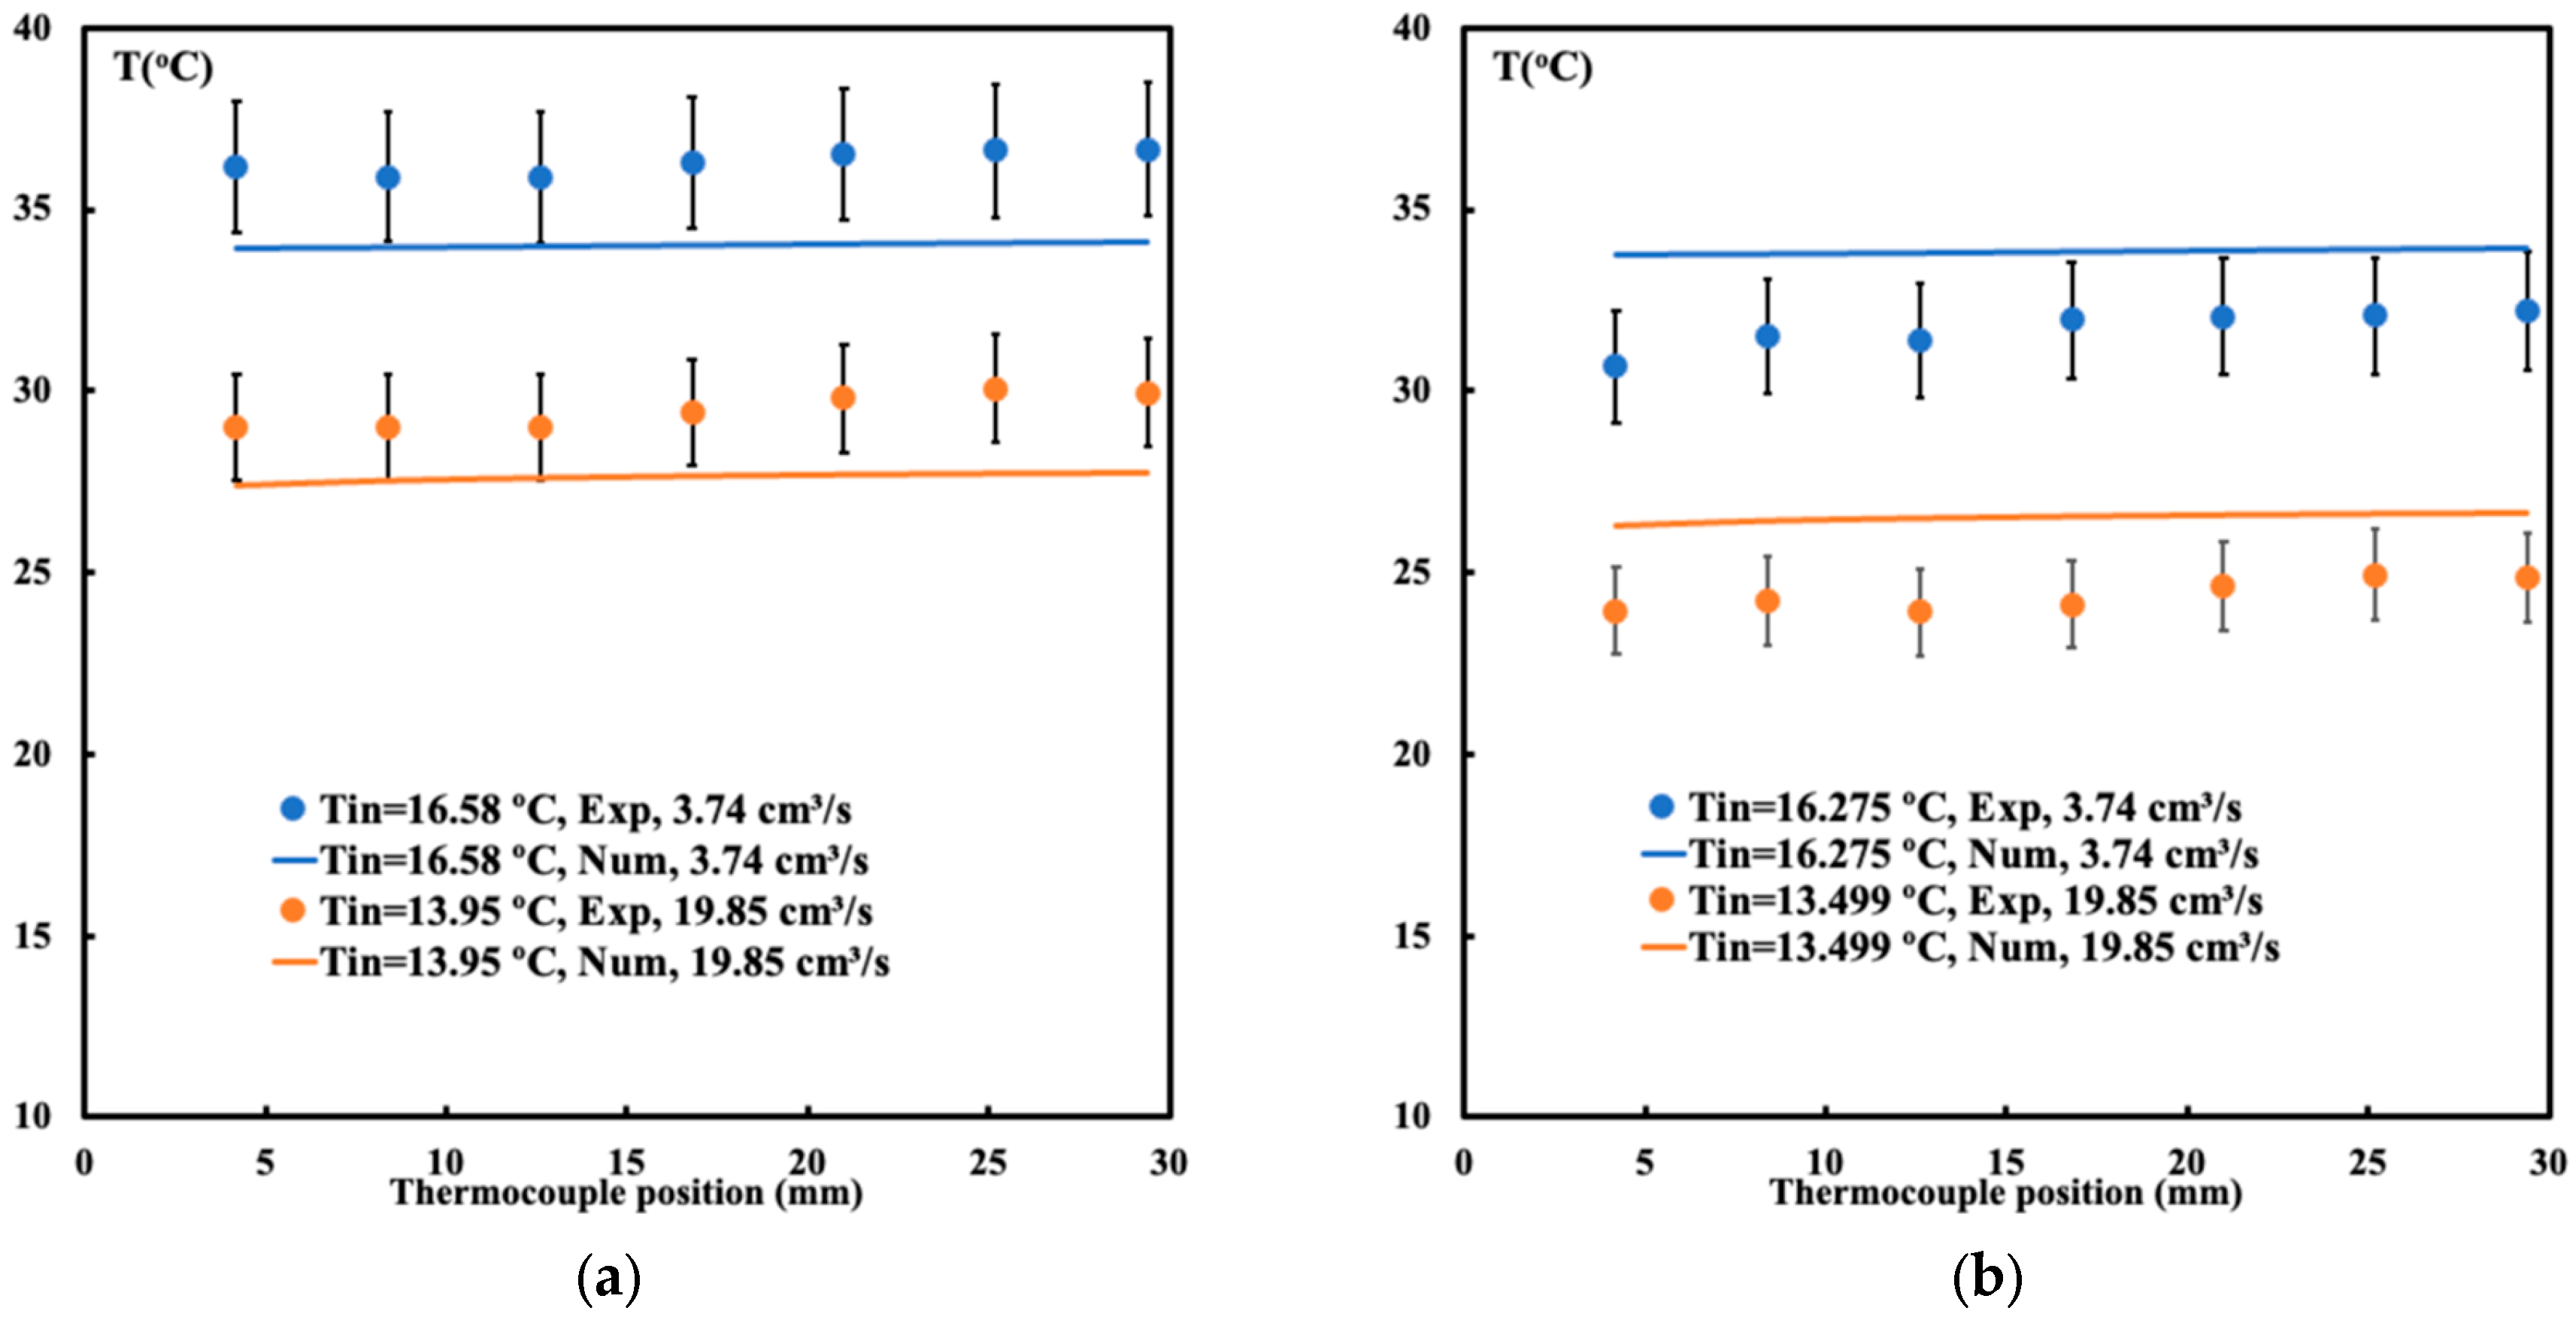
An experiment was conducted by Saghir and Kilic [28] examining the heat of removal using an aluminum and silver TPMS with a porosity of 0.7. The sample base is 3.75 cm square and 1.27 cm high. Different flow rates were applied with a heat flux of 38,400 W/m2. The two flow rates under consideration were 3.74 cm3/s and 19.85 cm3/s. The inlet temperatures of the experimental measurement and the numerical boundary conditions are identical. Figure 4 compares the two methods. In Figure 4a, aluminum is used as the TPMS material, whereas in Figure 4b, a silver structure is used. A good agreement is obtained between the two approaches.
The silver shown in Figure 4b displays a lower temperature measurement due to its high thermal conductivity. However, both experimental and numerical studies indicate a flat temperature distribution due to the developing small boundary layer. These results demonstrate the accuracy of the numerical model in investigating further the heat enhancement.

5. Heat Removal for Different TPMS Heights in the Cavity

In previous work by Saghir et al. [28], the TPMS structure occupied the entire free volume, as shown in Figure 3. Thus, the flow circulates inside the structure toward more effective cooling. On the one hand, heat removal is enhanced using TPMS compared to a metal foam structure, but the pressure drop is greater. To overcome this problem, it is worth examining the cooling effect of TPMS when the flow circulates within and above the structure. This approach may regulate the pressure drop and provide reasonable cooling. To achieve this approach, different TPMS structure heights will be investigated, and the aspect ratio, being the ratio of the TPMS under investigation to the original TPMS height, will vary from 1 to 0.5. The structure with a different aspect ratio will occupy the same volume in the test section. This means that when the aspect ratio is below 1, the flow will circulate within the structure and above it.

Solid TPMS Versus Shell TPMS Network

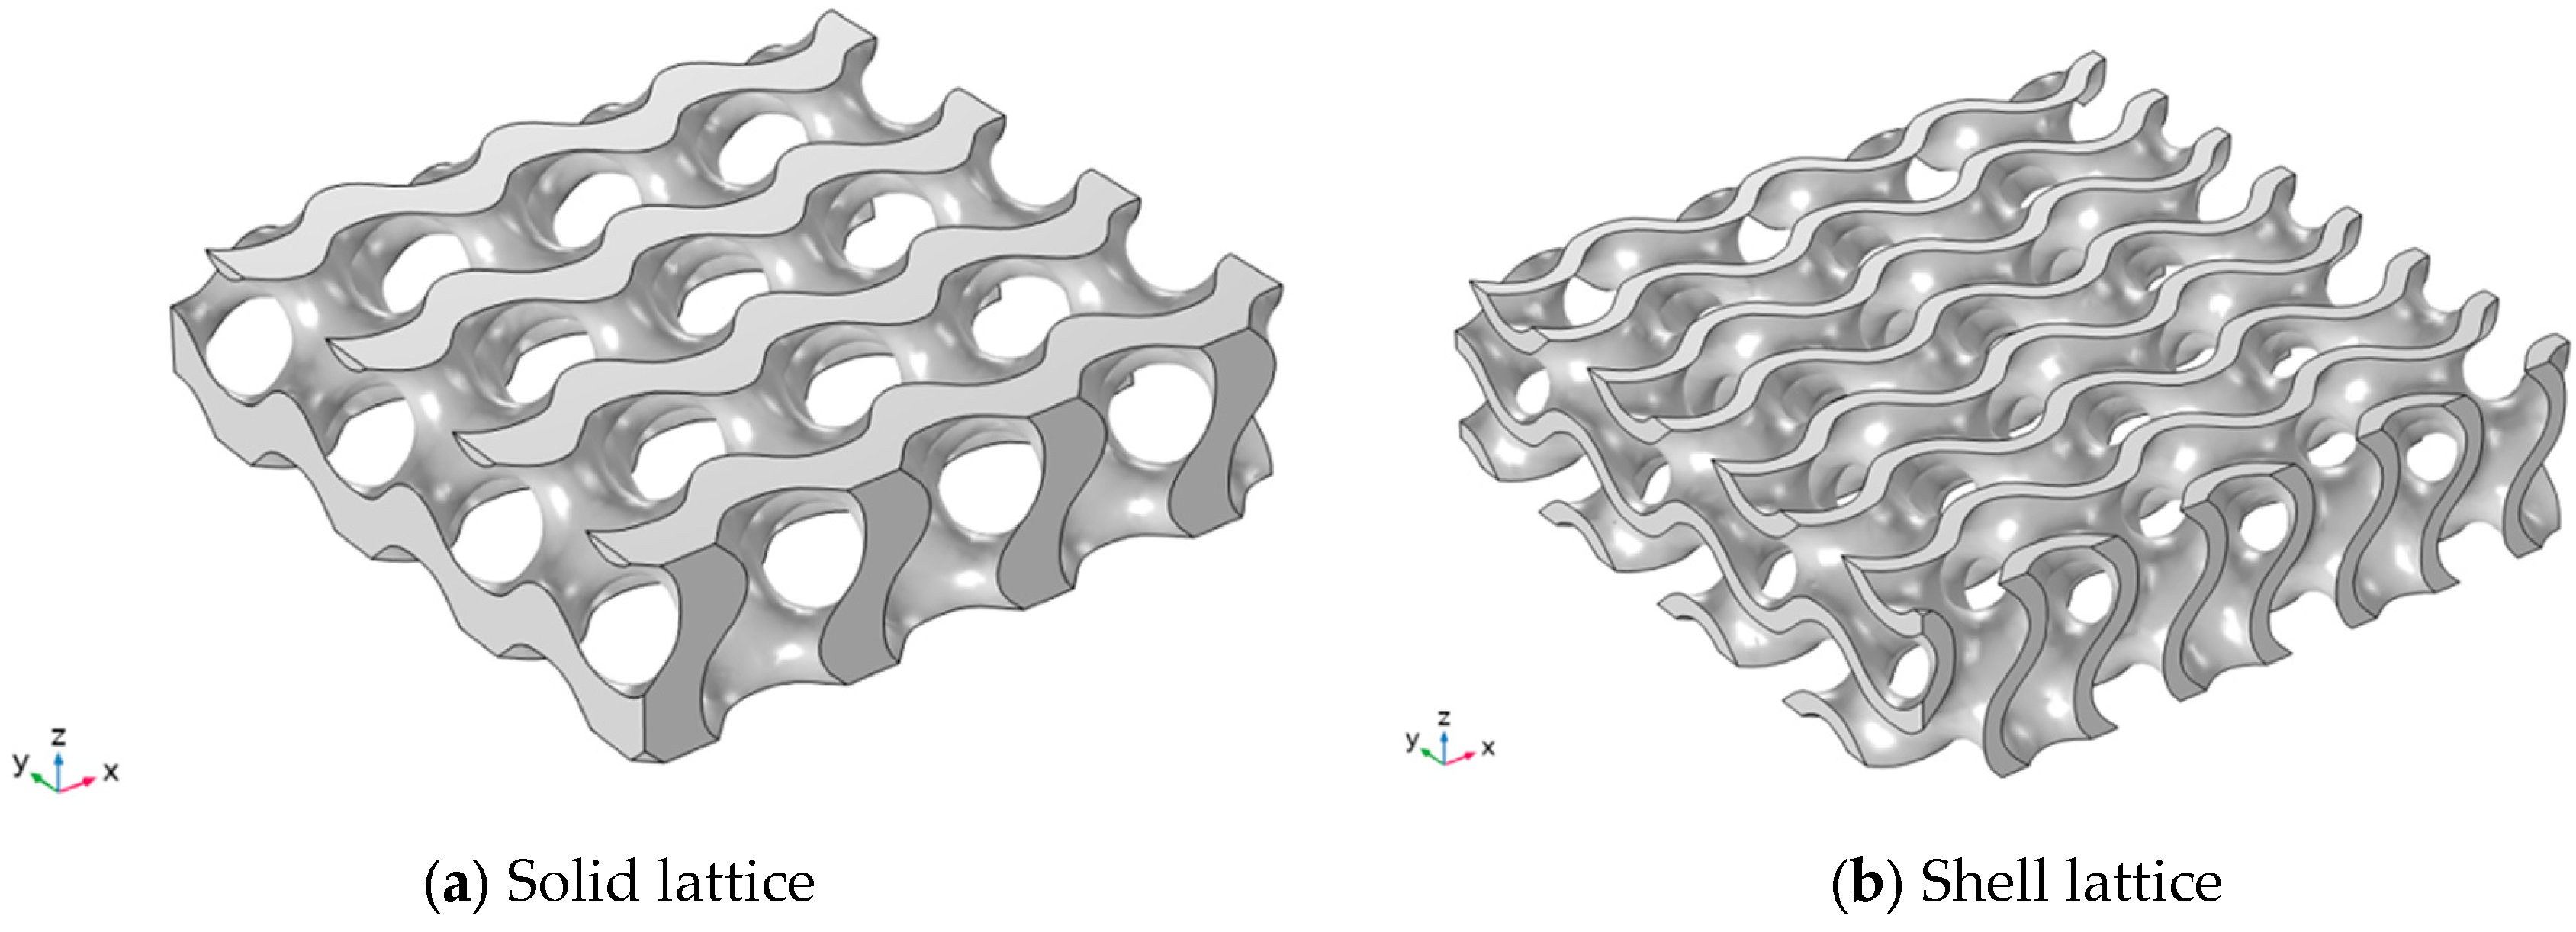
Two types of structure can arise during the preparation of a triply periodic minimal surface. These are solid lattices and shell lattices. Shell TPMS (triply periodic minimal surface) structures and solid lattices are both advanced structural concepts. Still, they differ significantly in their applications and advantages: shell TPMS are thin, curved structures based on minimal surfaces, often used in lightweight and high-performance applications such as heat exchangers and impact absorbers, while solid lattices are typically more traditional, robust structures that provide general structural support and strength. In this contest, an analysis will be conducted to examine the heat-enhancement performance of these two structures over a range of aspect ratios. Figure 5 shows the difference between a solid lattice and a shall lattice. The porosity is 0.7, and the aspect ratio in this figure is AR = 1.
As shown in Figure 5, the shell lattice has a surface area of 9.6 × 10⁻³ m2, whereas the solid lattice has a surface area of 5.6 × 10⁻³ m2. Surface area is a crucial parameter to consider for effective heat removal. Additionally, as shown in Figure 5b, the shell lattice wall thickness affects the structure’s porosity. Table 2 presents the surface area of the lattices under study as a function of the aspect ratio. It is noticeable that the shell structure has a larger surface area, which will lead to better heat enhancement.
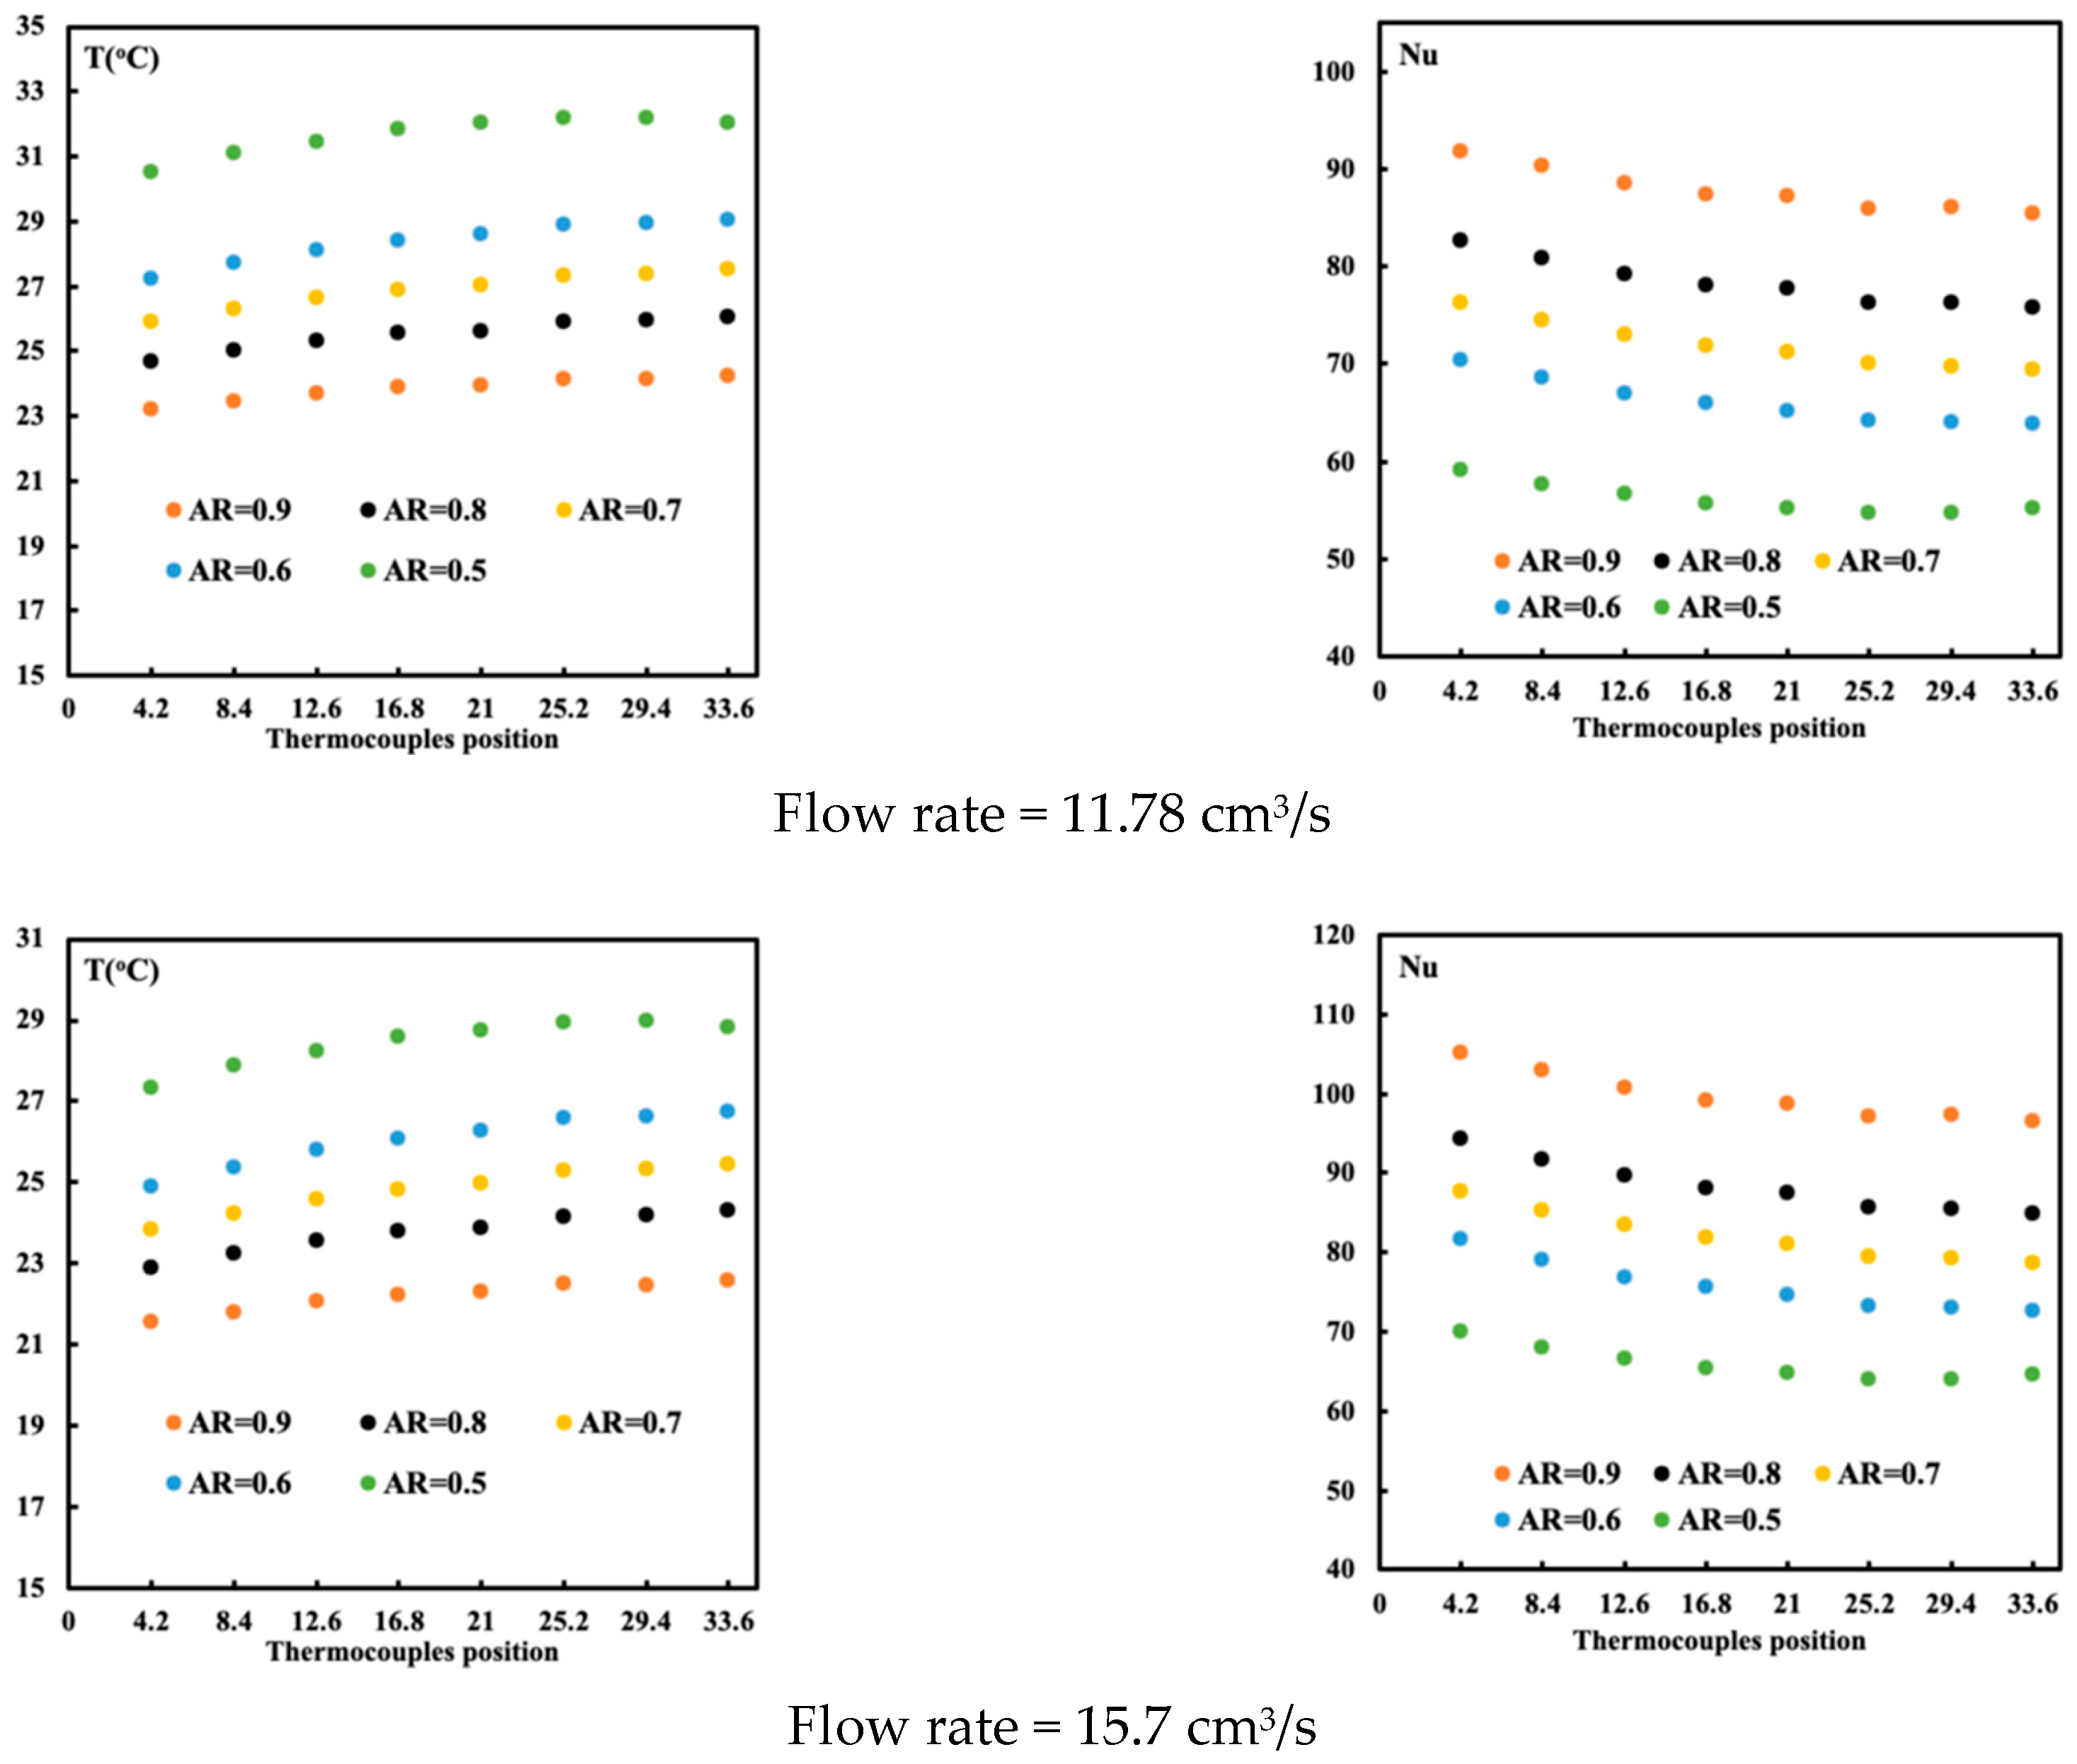
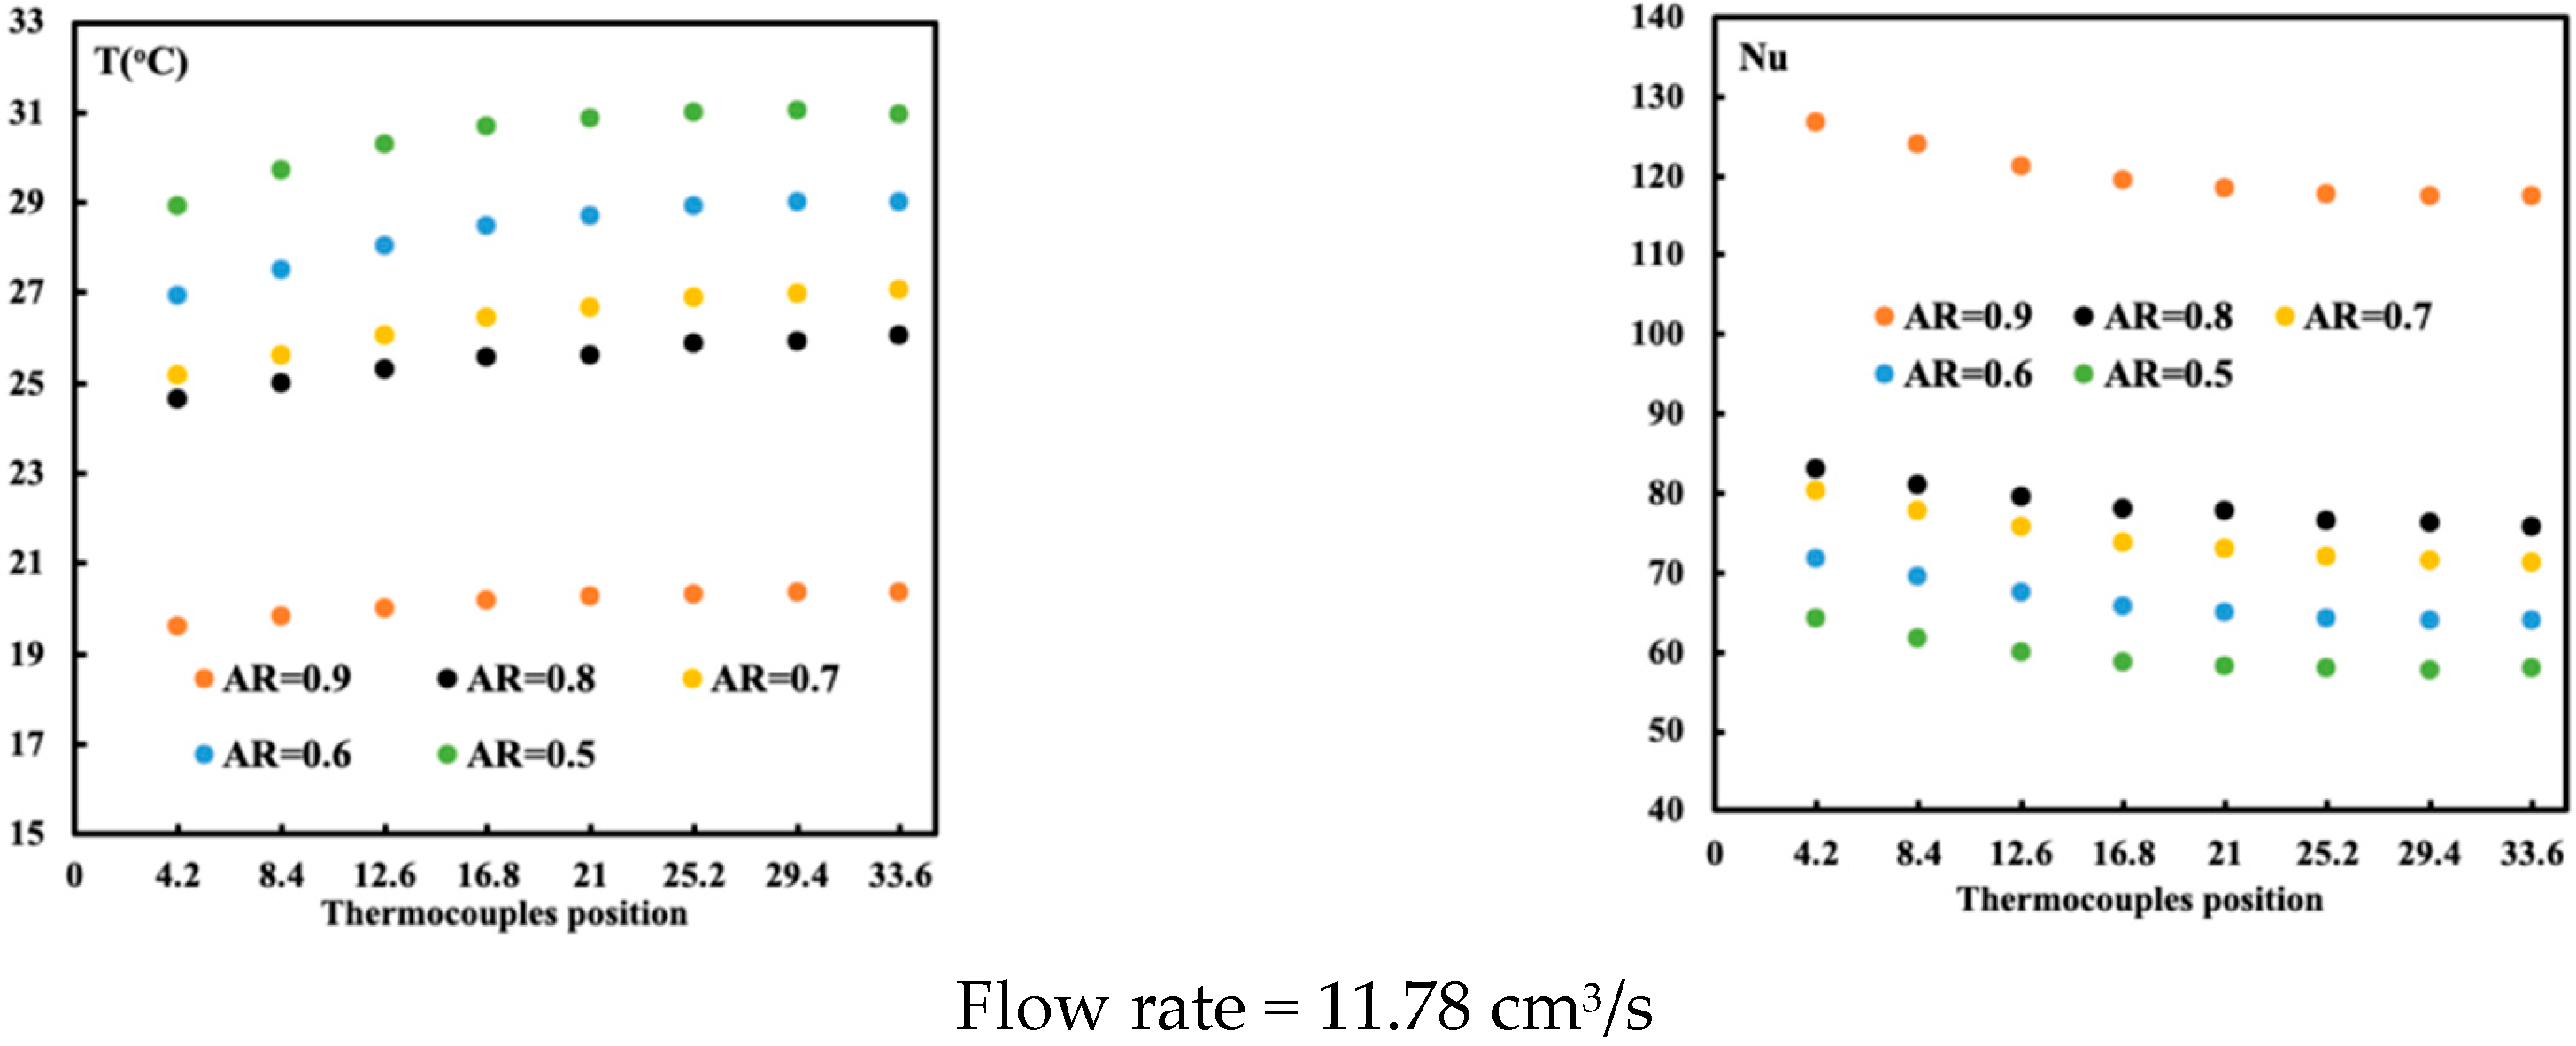
Figure 6 presents the variation in temperature and Nusselt number for the three flow rates of 11.78 cm3/s, 15.7 cm3/s, and 19.6 cm3/s, which correspond to Reynolds numbers of 1500, 1990, and 2500, respectively, for the solid lattice. The five aspect ratios are studied, ranging from 0.9 to 0.5. The inlet temperature is held constant throughout the runs with Tin set to 10 °C. The base of the lattice is square with a length of 3.75 cm, and the lattice height varies from 1.143 cm (i.e., AR = 0.9) to 0.635 cm (AR = 0.5). As the aspect ratio is below one, the flow may also circulate on top of the lattice. The intention is to determine whether the pressure drop decreases as the flow opening increases. As shown in Figure 6, when the aspect ratio is less than one, the temperature profile is no longer uniform, unlike when the aspect ratio equals one. This finding is not suitable as uniform cooling is more important. The second observation is that at 21 mm from the flow entrance, a drop in the temperature suggests some better cooling at this point. The flow profile should be examined to determine the cause of this sudden cooling. As flow rates increase, the over-temperature profile decreases, indicating improved cooling. A decrease in the Nusselt number and a nonlinear variation are apparent. From this figure, at an aspect ratio (AR) equal to 0.9, the best cooling is detected.
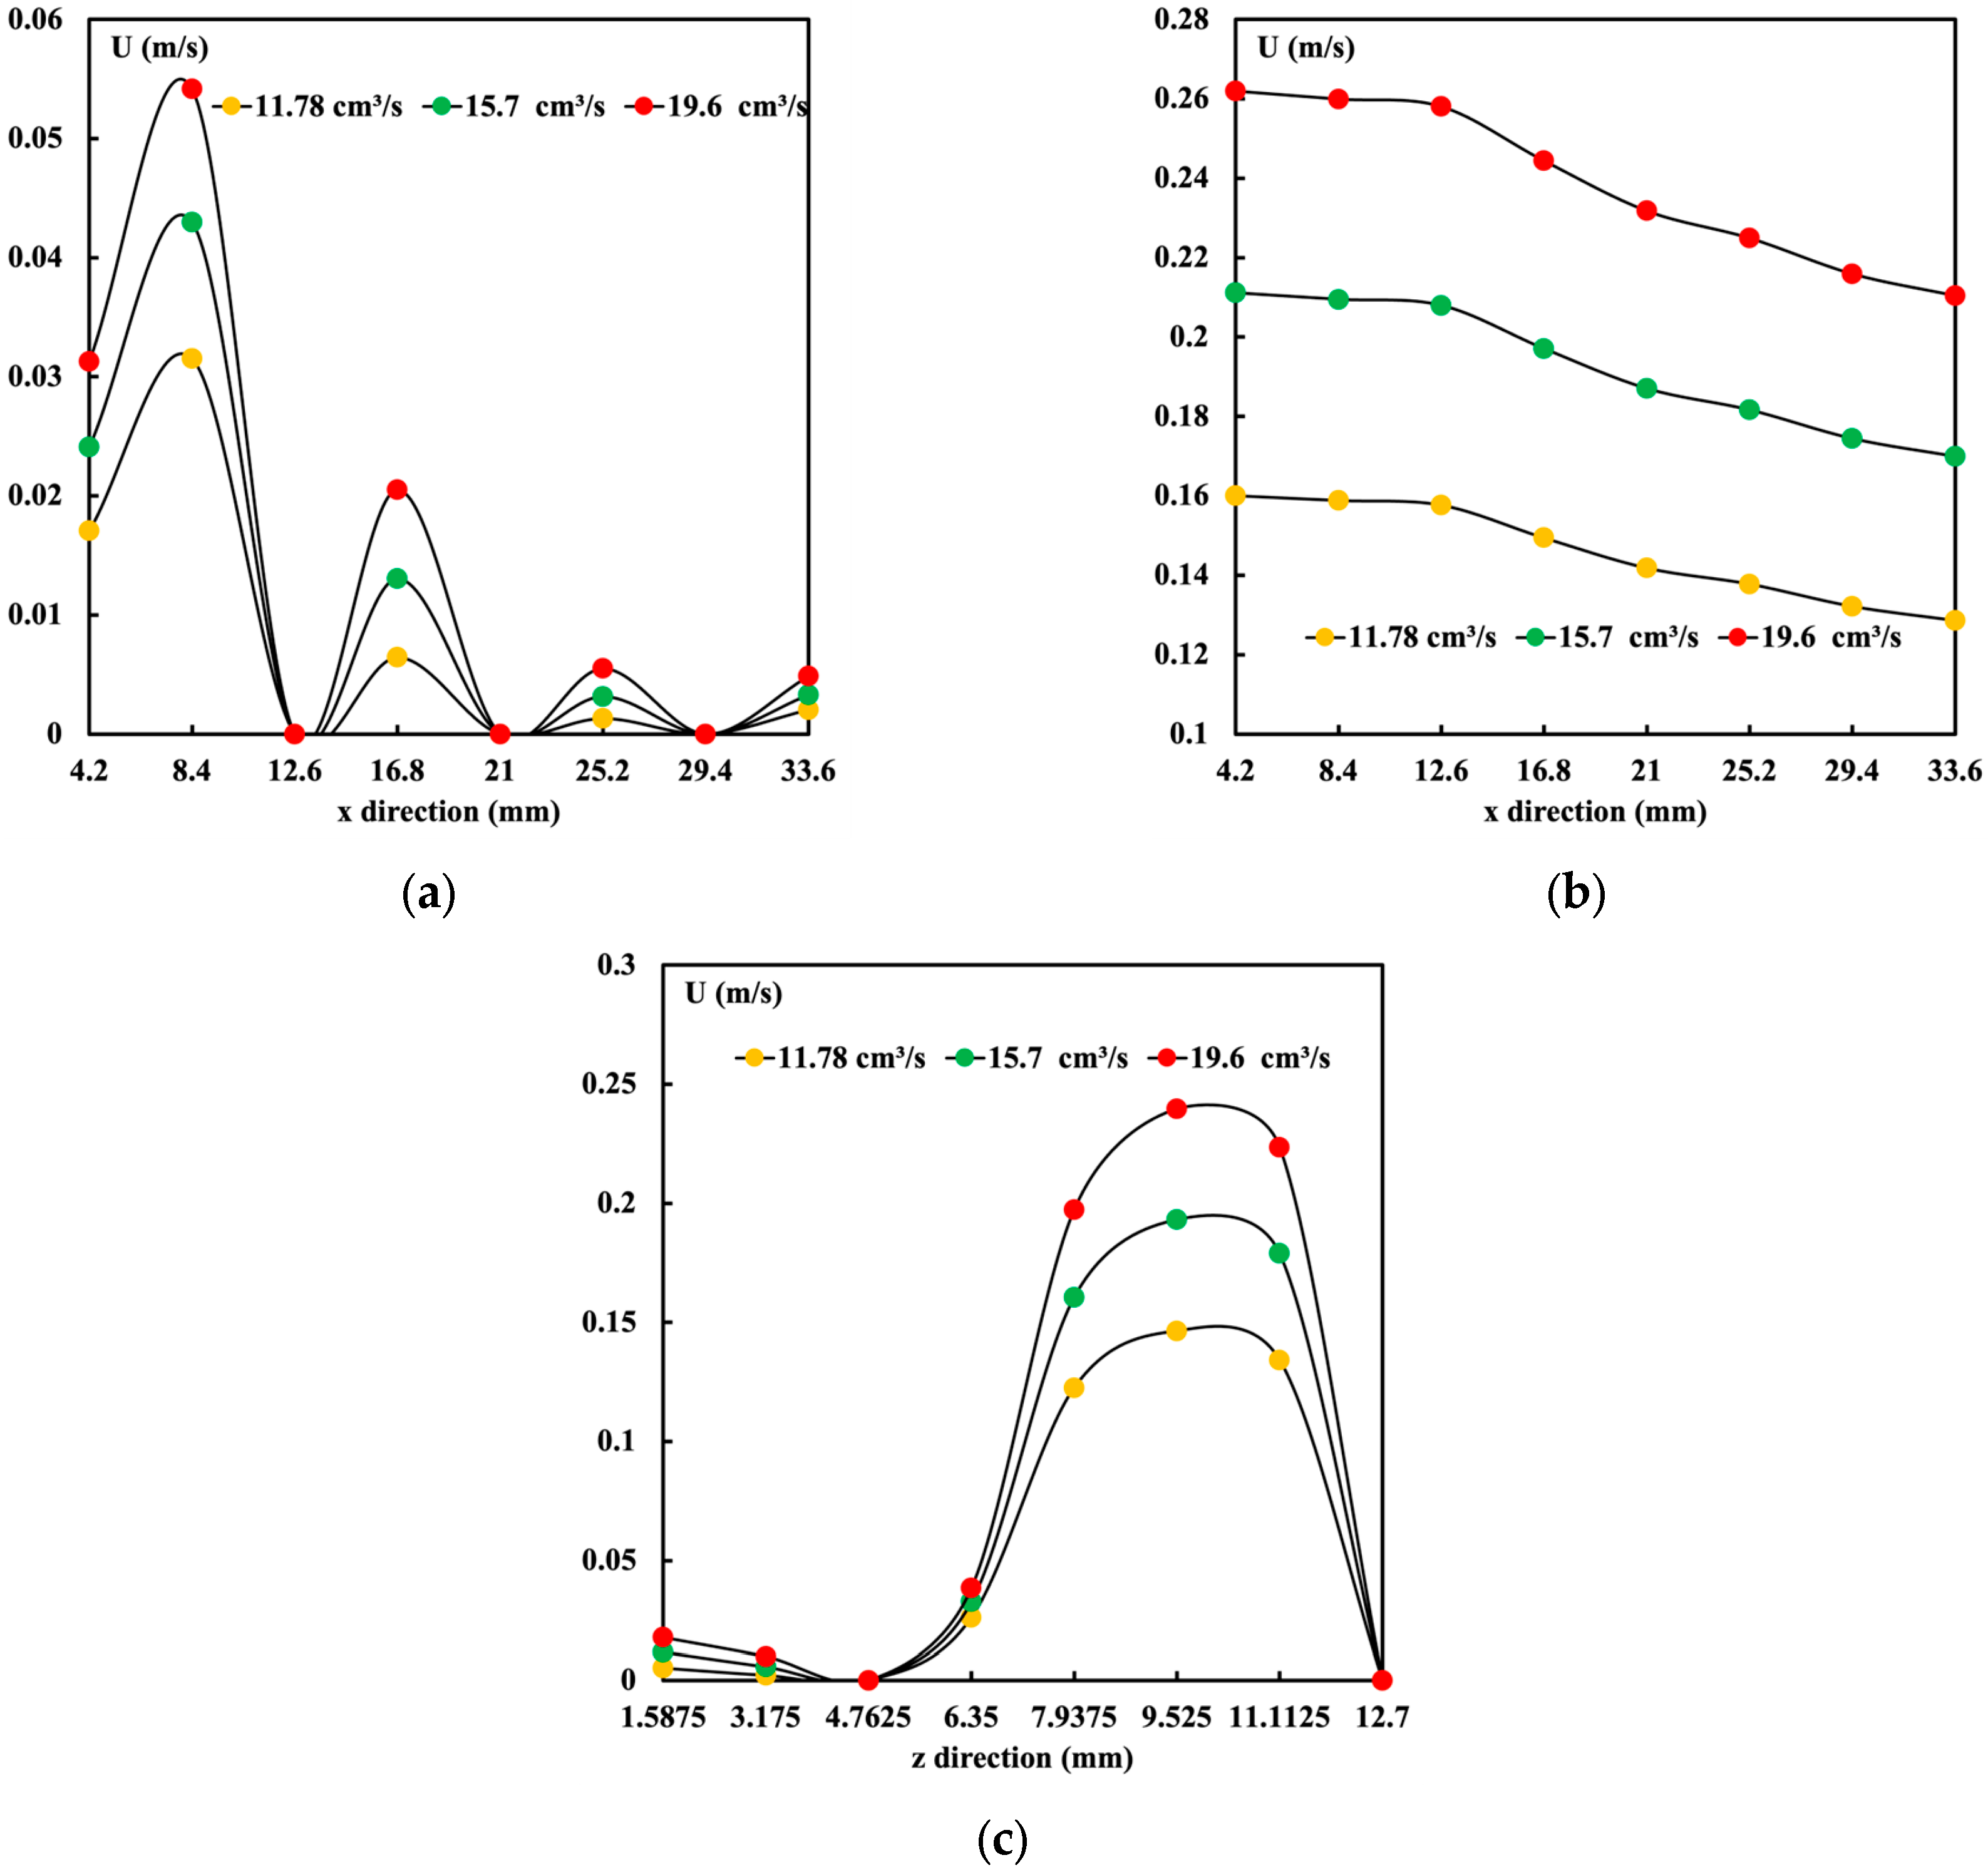
For the TPMS application, it has been demonstrated that a uniform temperature distribution and continuous operation can be obtained numerically. As stated earlier, when the aspect ratio is less than 1, the flow can rise above the structure and, depending on local pressure, penetrate it. This creates a nonlinear temperature distribution. However, for the case of a solid gyroid network, as shown in Figure 6, there appears to be a discontinuity in the temperature distribution for any flow rate. It is detected at x = 12.6 mm. To further investigate this discontinuity, Figure 7 presents the average velocity along the flow direction at z = 12.7 mm/4 (Figure 7a) and at z = (3/4) × 12.7 mm (Figure 7b) for different flow rates and an aspect ratio (AR) = 0.5. As shown in Figure 7a, the velocity is zero at the structure’s exit; thus, the flow is zero. If one carefully observes the flow at x = 12.6 mm, the zero velocity indicates the presence of a solid structure. This will act as a fin at this point, extracting heat and resulting in a drop in temperature.
Furthermore, Figure 7b presents the flow above the structure, as this case corresponds to an aspect ratio of 0.5. It is noticeable that the flow circulates along the flow, then drops in velocity magnitude, indicating that it penetrates through the structure toward the exit. The pressure distribution has been studied and is not shown here. It suggests that when the aspect ratio (AR) is 0.9, the pressure drop improves. However, this improvement is not noticeable as the aspect ratio decreases further to 0.5. Figure 7c presents the flow along the z direction at the middle of the cavity. A parabolic velocity profile in the free zone above the structure is detected. Again, the location where zero velocity is found indicates the presence of the structure. At a high flow rate, the findings are more noticeable.
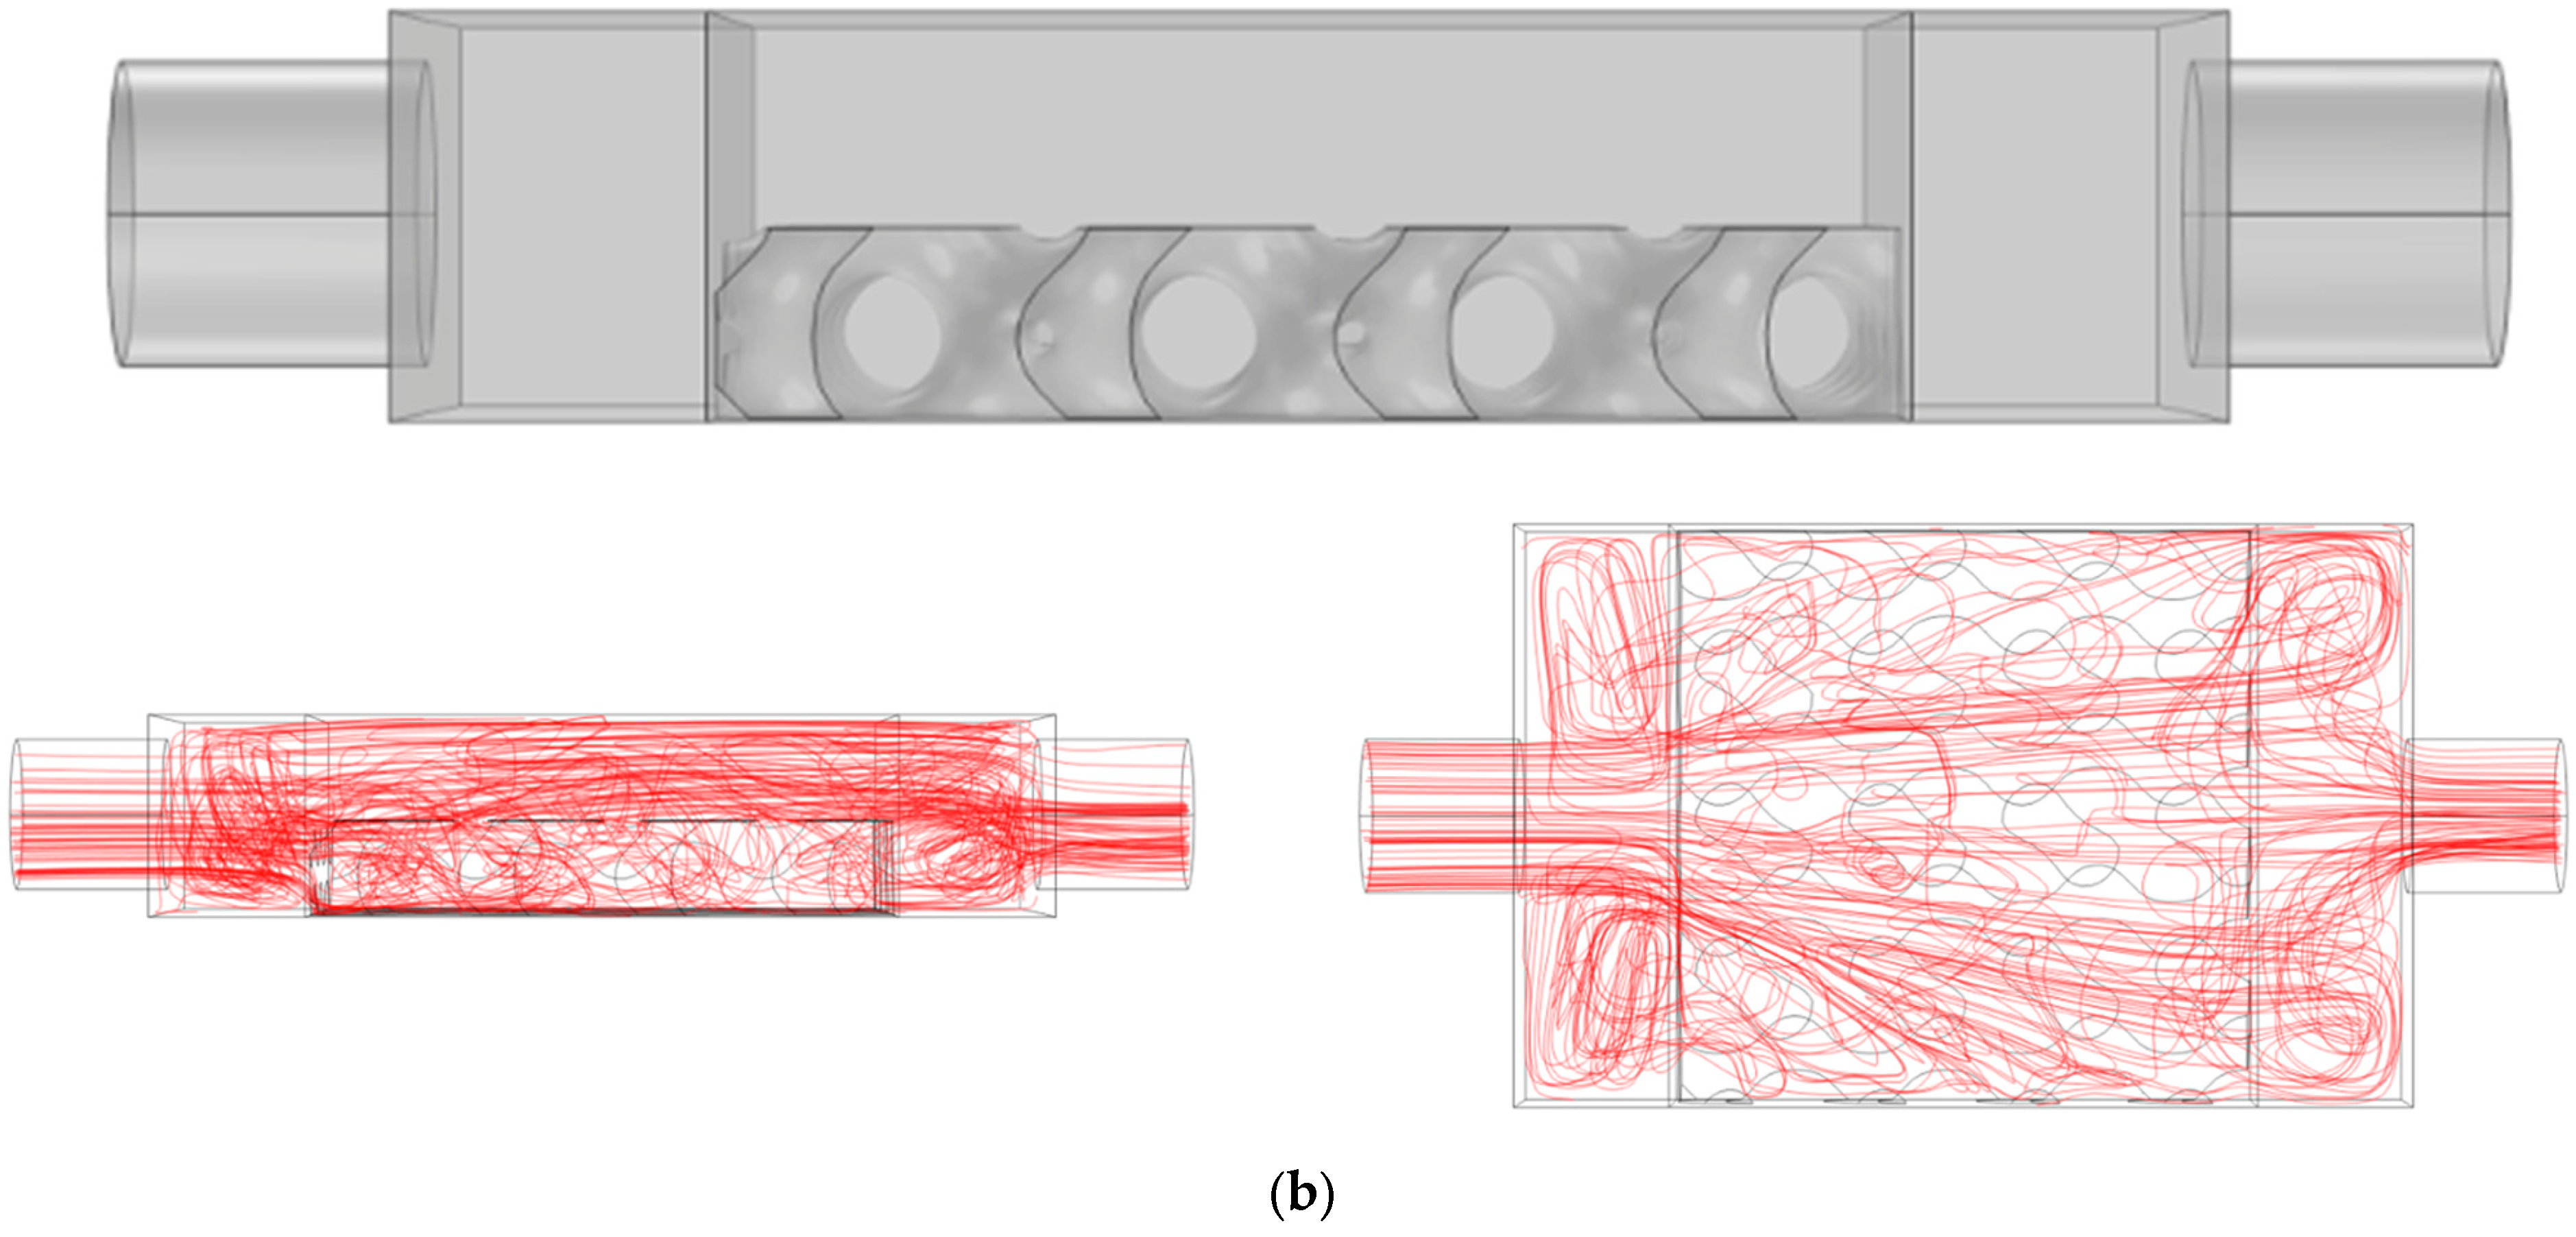
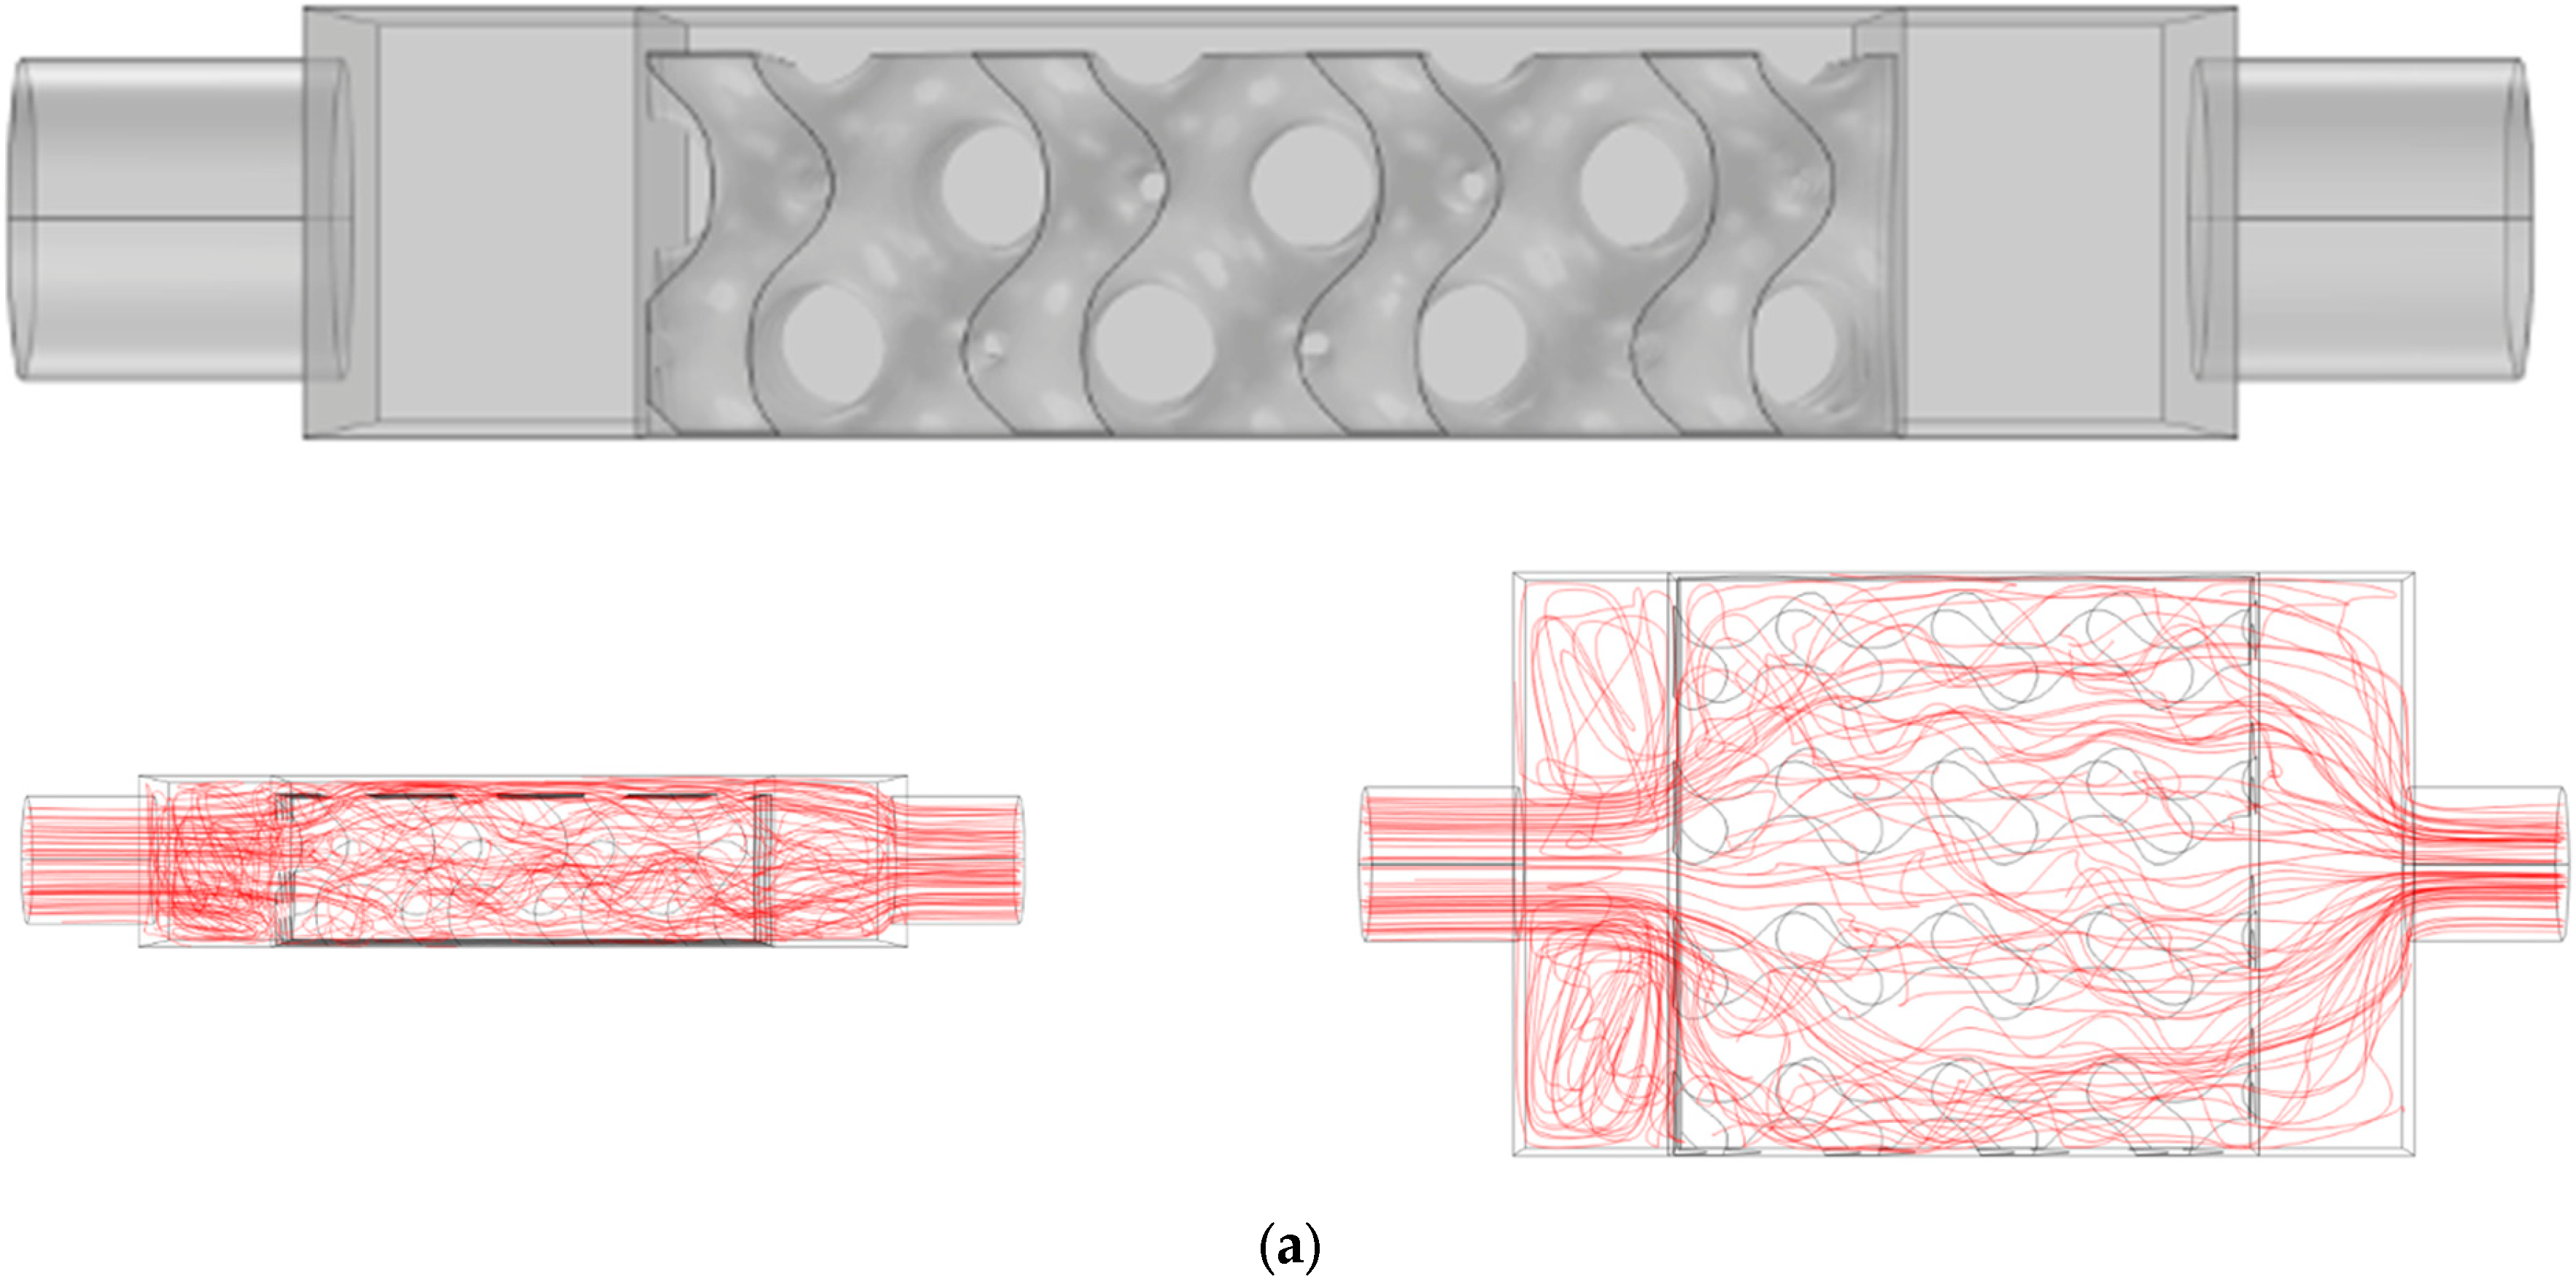
To further investigate the flow behaviour, Figure 8 presents iso-streamlines for the two aspect ratios, AR = 0.9 and AR = 0.5, in the presence of a solid network. For an aspect ratio of 0.9, the flow moves uniformly toward the exit. When the aspect ratio decreases to 0.5, the flow becomes more active above the structure, leading to some backflow, and it is evident that it penetrates from the free zone into the structure toward the exit. This type of flow structure did not improve the pressure distribution or enhance heat removal. It is noticeable that when the aspect ratio is AR = 0.5, strong backflow occurs in both mixing chambers, unlike the case with AR = 0.9.
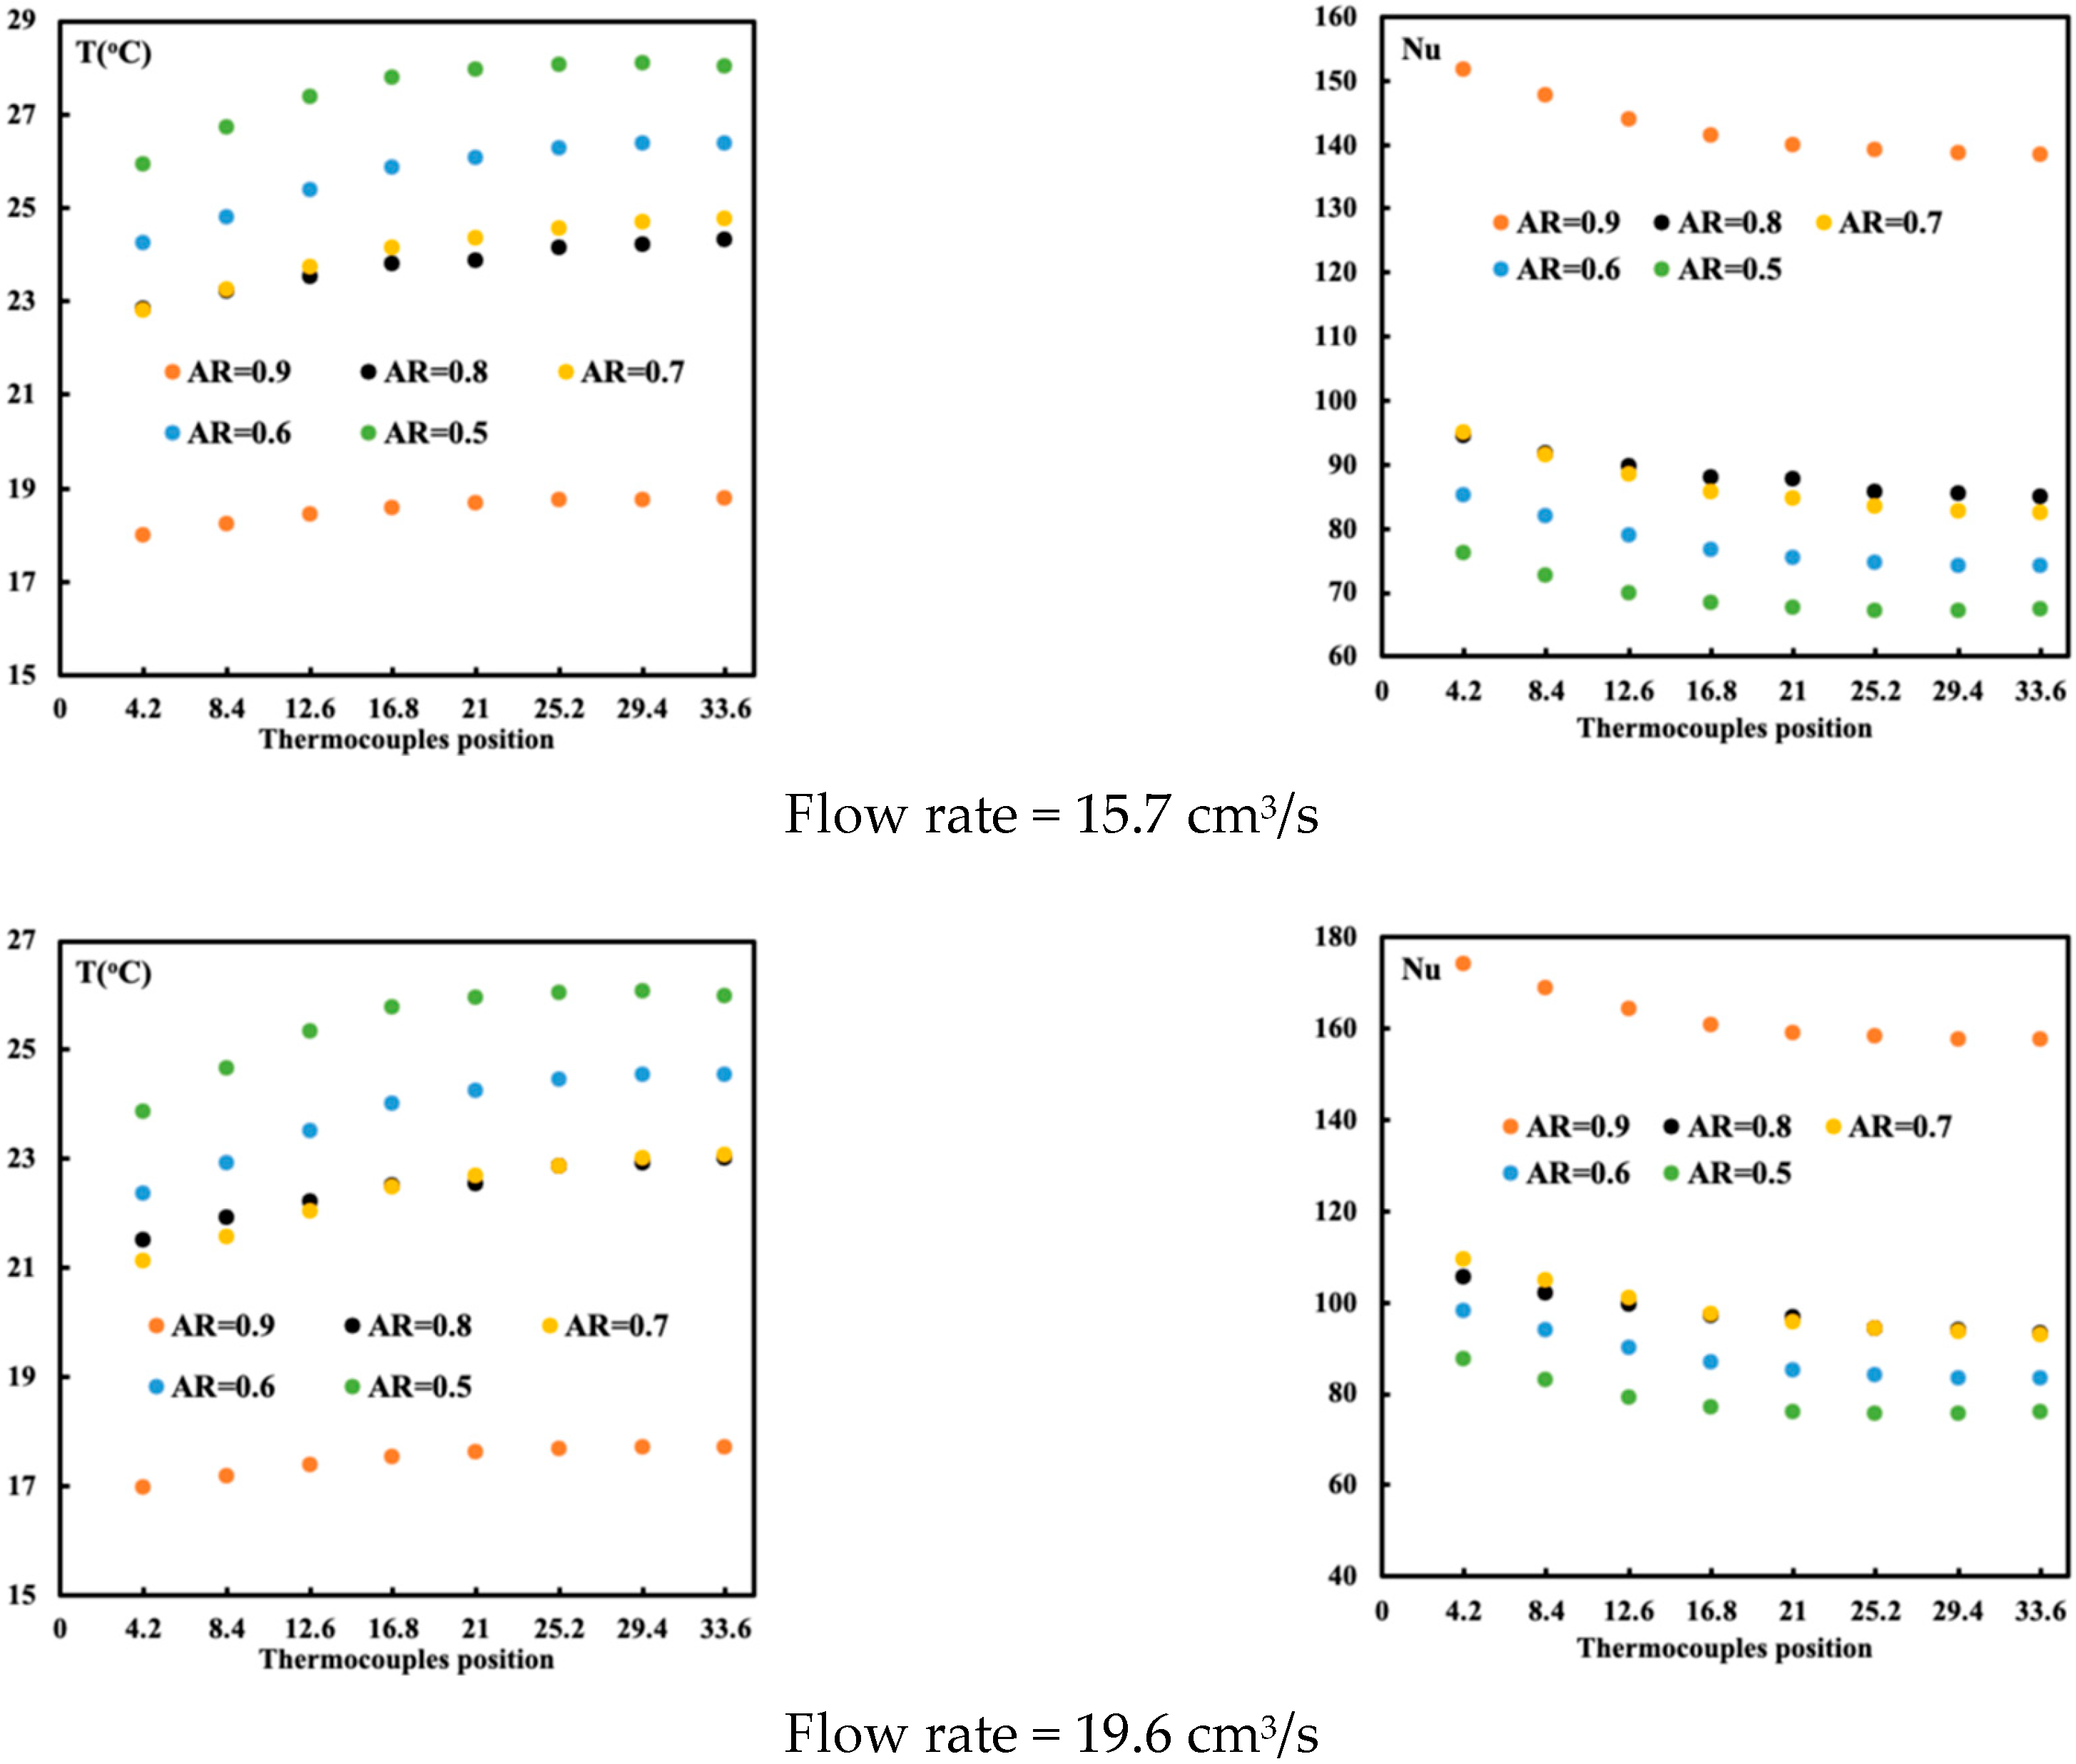
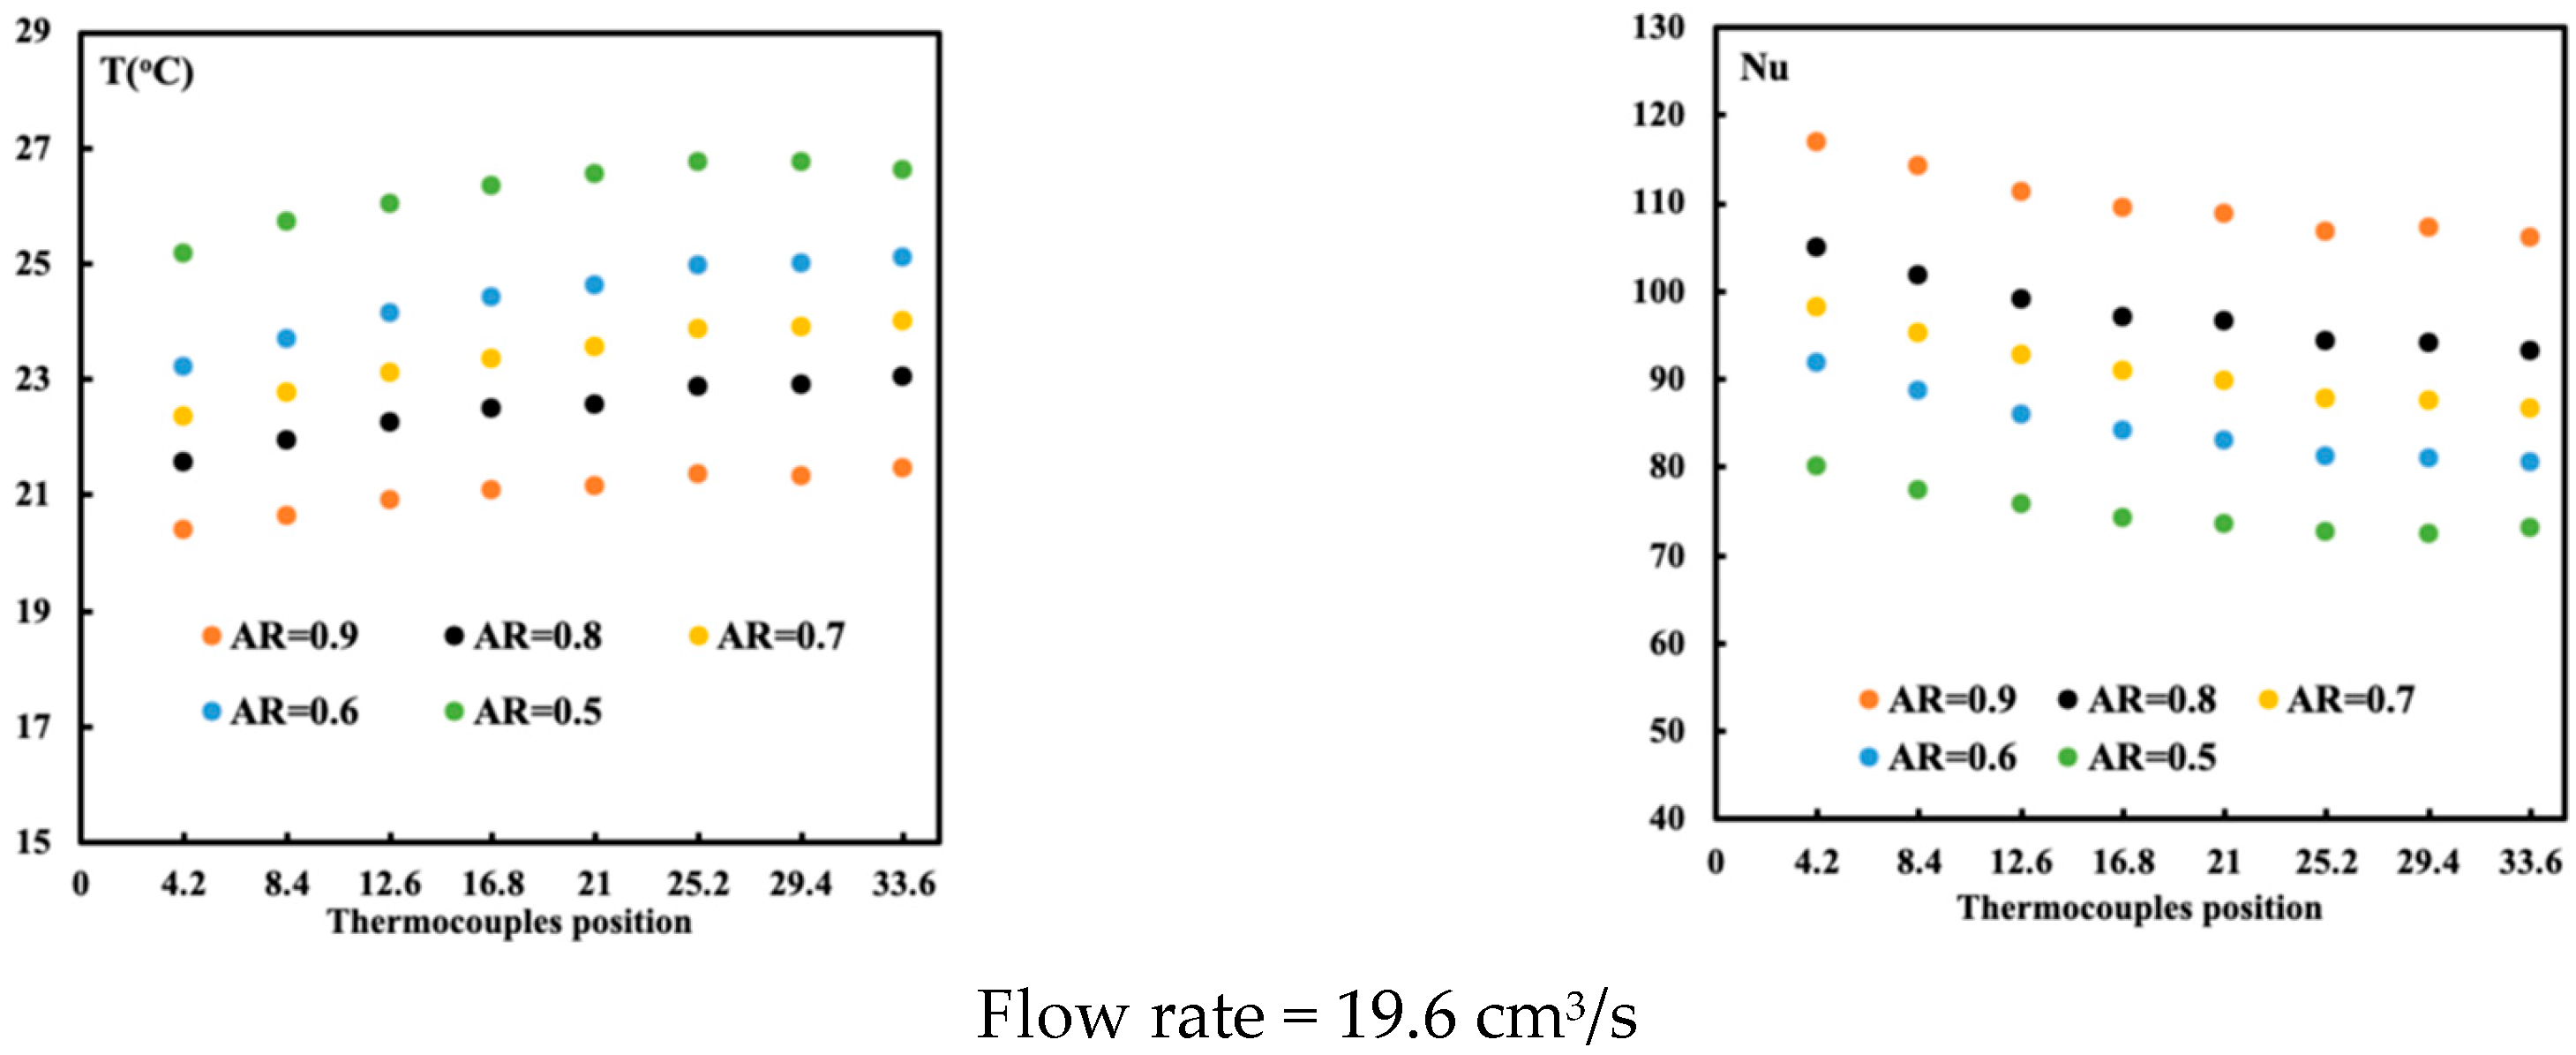
As shown in Figure 9, the same conditions are applied when the gyroid is made of shell lattices. As shown in Table 1, the surface area of the solid lattice is less than that of the shell lattice. That means the shell lattice can remove more heat than the solid lattice. Similarly, three different flow rates were used, and two essential observations were found. The first is the nonlinearity of the temperature profile as the aspect ratio decreases, and the flow circulation, to be confirmed, differs from 21 mm onward. The temperature and thus the Nusselt number are higher in the solid lattice than in the fluid. The temperature is lower in the shell lattice case and, therefore, a greater Nusselt number is observed when compared to the solid lattice. Again, at the aspect ratio of 0.9, better cooling is occurring.
Additionally, it is observed that for aspect ratios AR = 0.7 and AR = 0.8, the temperature variation is similar. The flow and structure of the TPMS may be the reason for this behaviour and will be investigated further. It appears that shell TPMS can provide uniform cooling at an aspect ratio of 0.9, contrary to the solid lattice case.
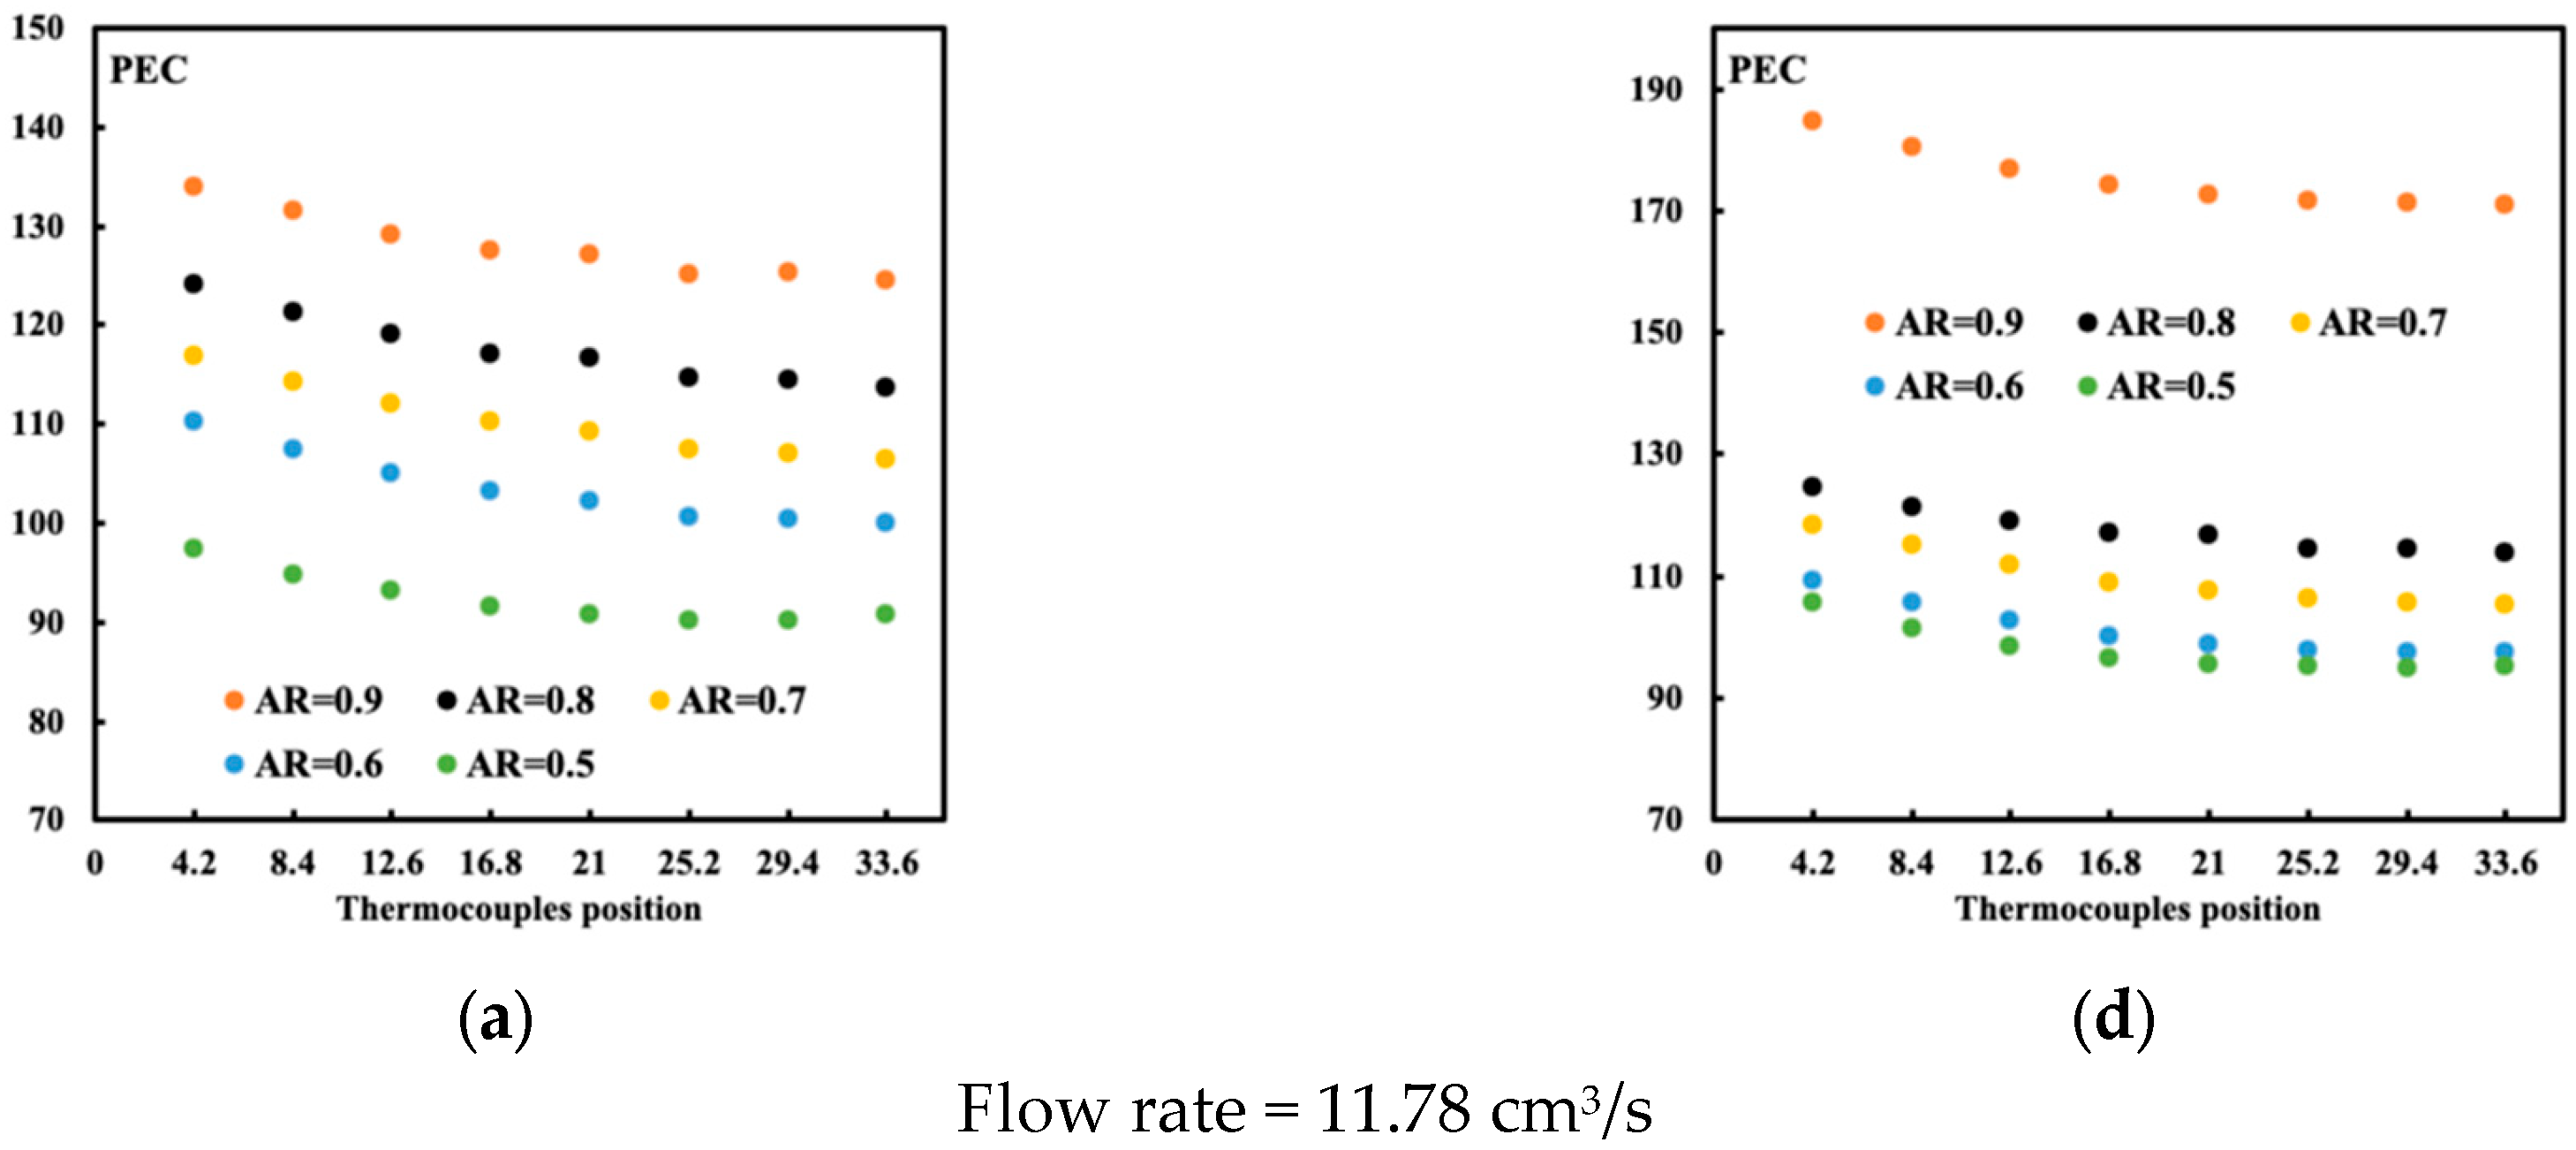
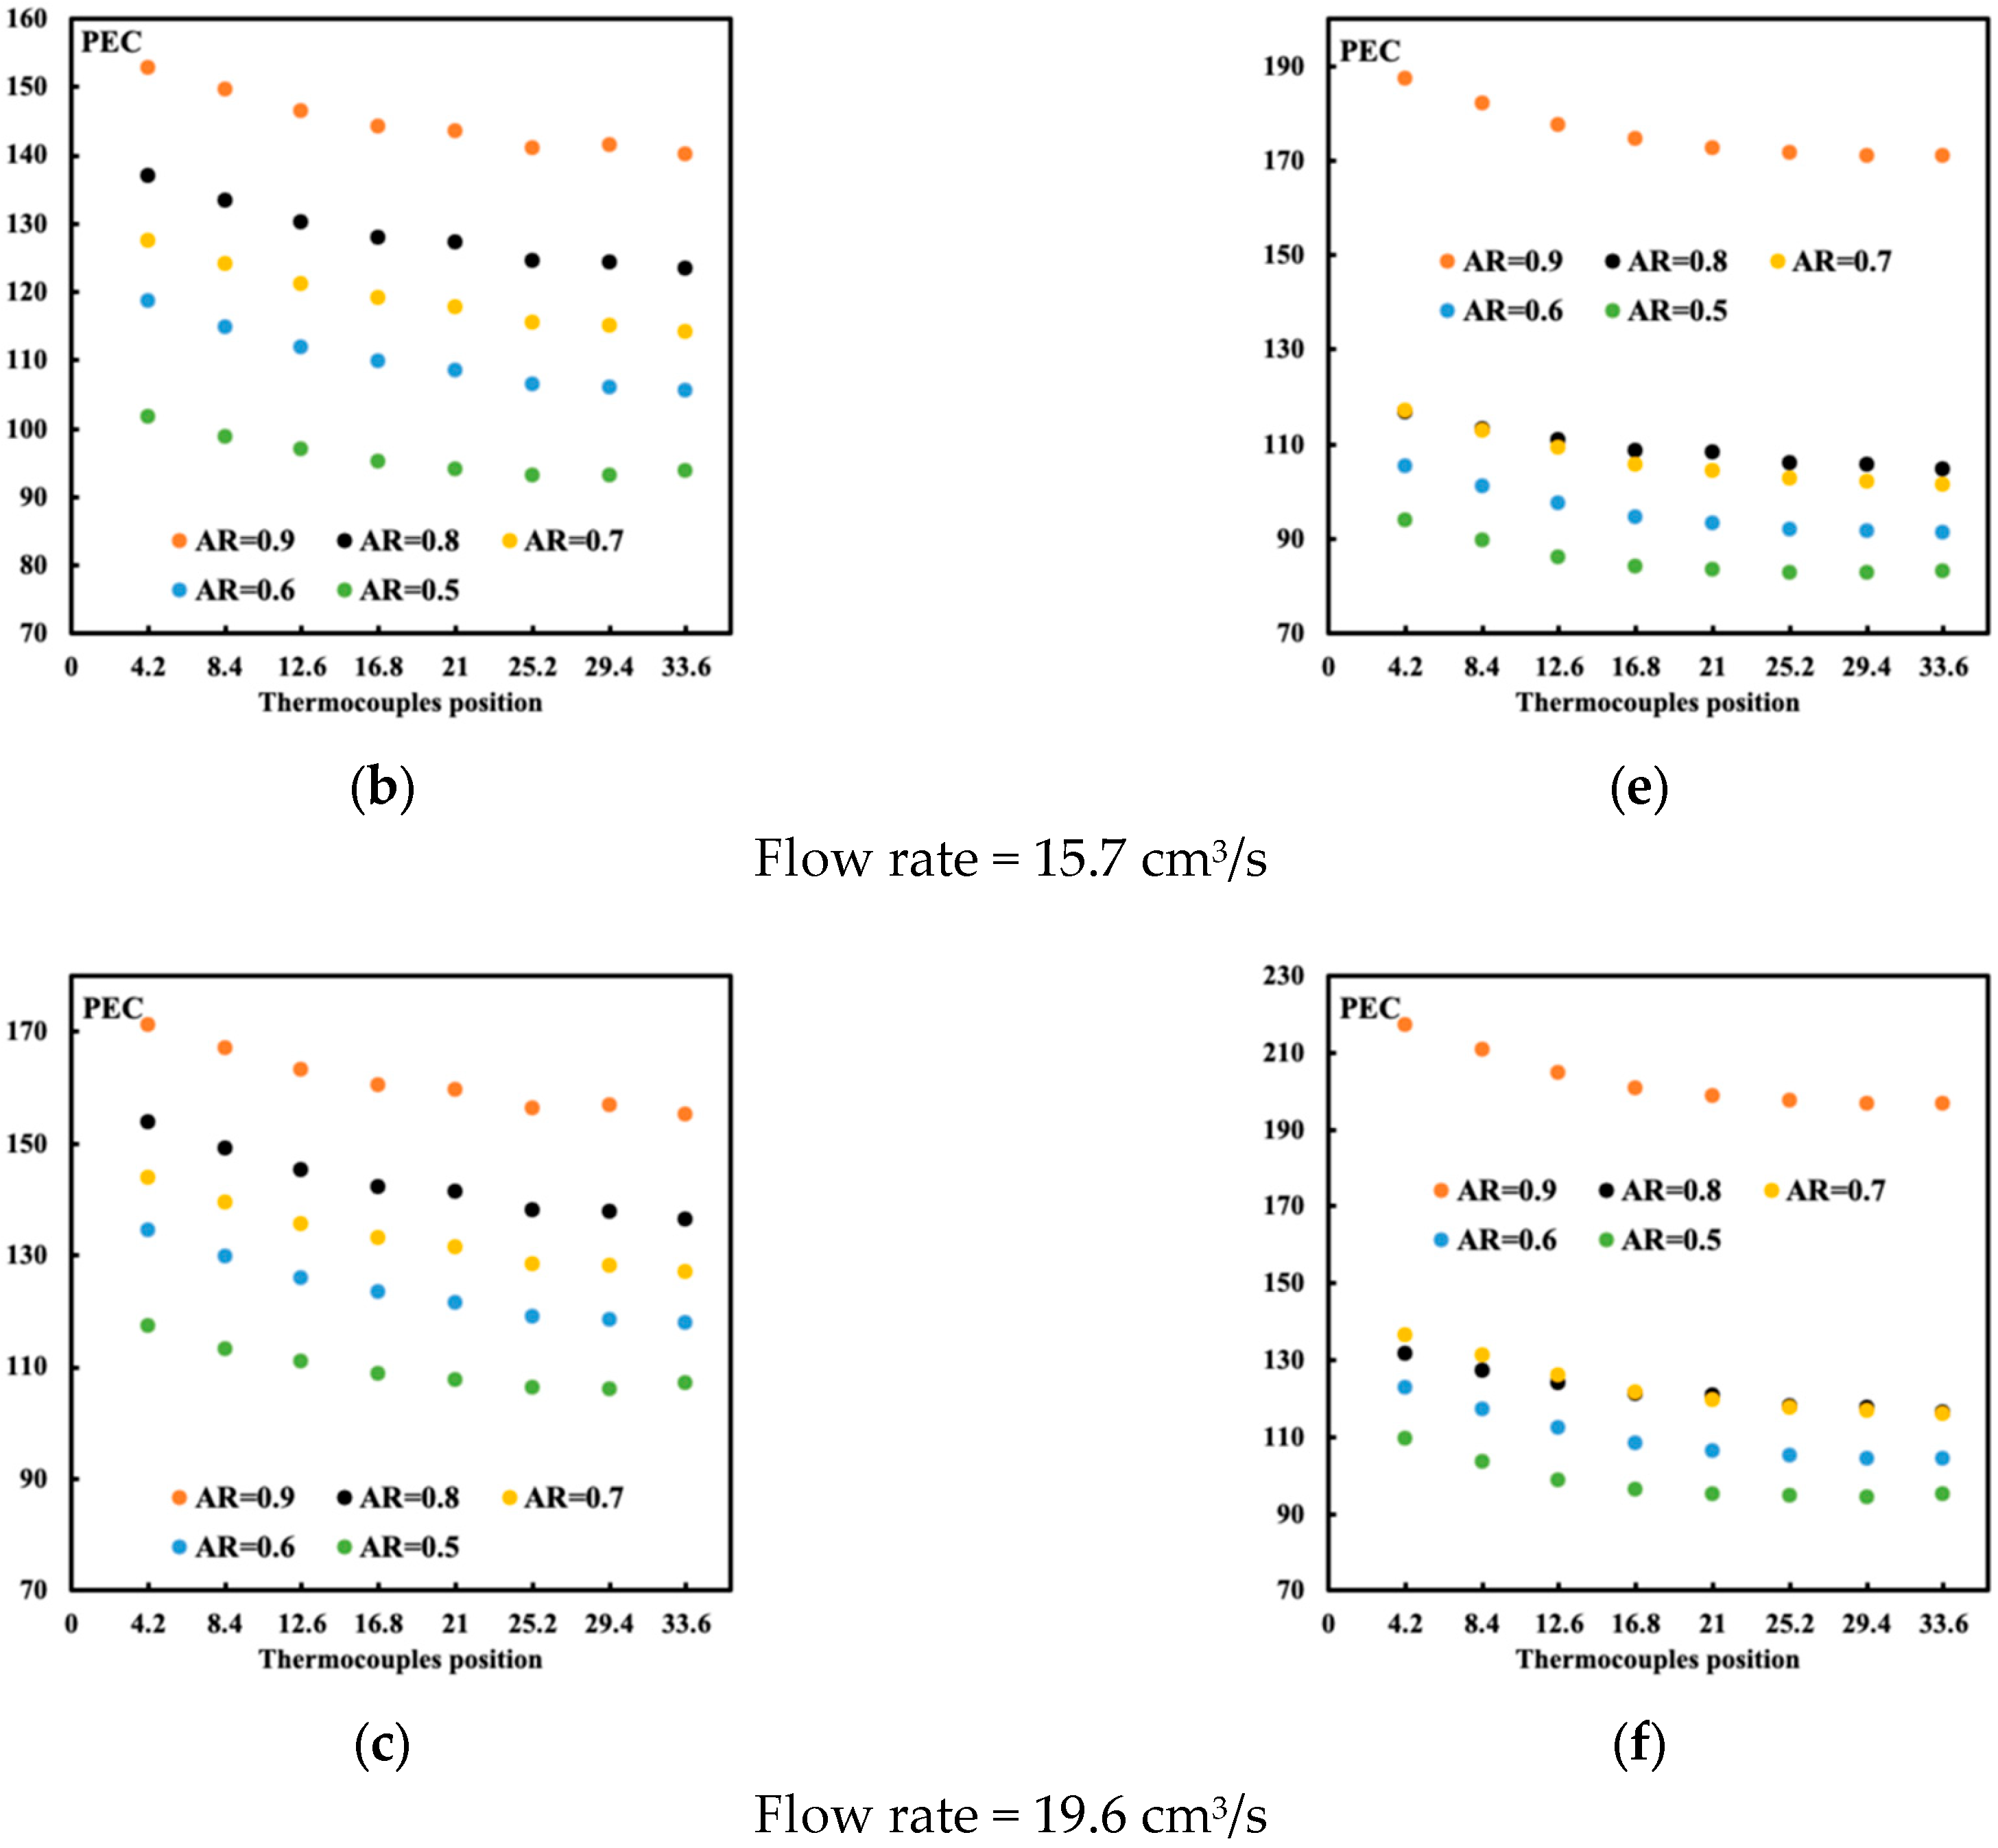
Figure 10 presents the performance evaluation criteria for both structures. This parameter is essential because it combines the thermal effect, represented by the Nusselt number, with the hydraulic effect, described by the friction factor. As you are aware, the friction factor is directly proportional to the pressure drop. From the harvested data, the pressure drops for both lattices are approximately the same, with no advantage to either.
The only difference is the change in Nusselt number. Because the Nusselt number for the shell structure is higher than that for the solid structure, the performance evaluation criteria are also higher, as shown in Figure 10. Additionally, the improvement in pressure drop for both cases is marginal; thus, reducing the structure size does not solve the problem. Similarly, flow behaviour is found to be similar when the solid lattice is replaced with a shell lattice. There is some minor difference in the flow intensity, but in general, there is no difference with the solid lattice.

6. Optimization

Based on the two cases under investigation, it is essential to determine the average variation in the Nusselt number with flow rate and aspect ratio. The findings indicate that the shell network had a higher Nusselt number and better performance, as measured by the evaluation criterion. This is due to the shell wall acting like thin fins, allowing the heat to be removed effectively. Response surface methodology has been used to determine the optimal flow rate and aspect ratio for maximum Nusselt and PEC numbers. The two factors studied are the flow rate and the aspect ratio. The two responses are the average Nusselt number and the performance evaluation criterion (PEC). Table 3 provides the fit statistic for the Nusselt number. The predicted R2 of 0.9458 is in reasonable agreement with the adjusted R2 of 0.9668, i.e., the difference is less than 0.2.
Table 4 provides the fit statistic for the PEC number. The predicted R2 of 0.9822 is in reasonable agreement with the adjusted R2 of 0.9888, i.e., the difference is less than 0.2.
Based on the numerical data—that is, the higher the aspect ratio, the better the heat enhancement—two models are proposed. The model for the average Nusselt number applies to all flow rates and an aspect ratio between 0.8 and 1. Equations (11) and (12) present the average Nusselt number and PEC as a function of the aspect ratio, ranging from 0.8 to 1.
N u a v e r a g e = 1612.483 23.8131 ( f l o w   r a t e ) + 4001.865 ( A R ) + 27.404 ( f l o w   r a t e ) ( A R ) + 0.0867 ( f l o w   r a t e ) 2 2323.301 ( A R ) 2
P E C a v e r a g e = 2366.708 48.385 ( f l o w   r a t e ) + 6127.496 ( A R ) + 36.755 ( f l o w   r a t e ) ( A R ) + 0.0606 ( f l o w   r a t e ) 2 3555.660 ( A R ) 2
As shown in both equations, the variation in the Nusselt number and PEC with the flow rate and aspect ratio is nonlinear. Both follow the same variable format. These equations are valid for 0.8     A R   1.0 . Further investigation into the optimization showed that the optimal condition for the shell structure is an aspect ratio of 0.951, yielding an average Nusselt number of 165.63 and an average PEC of 207.859. Allowing a small gap between the TPMS structure and the cavity reduces the pressure drop, thereby increasing the PEC value.

7. Conclusions

The triply periodic minimal surface’s structure demonstrated the usefulness of this porous setup in cooling surfaces. The advantage of heat enhancement in the presence of the TPMS is the uniform cooling it provides. The disadvantage here is the high pressure drop compared to other porous structures. In this paper, the change in aspect ratio is studied numerically to determine whether the heat enhancement persists while achieving a lower pressure drop. The aspect ratio is defined as the model’s height relative to its original height in the experiment. In the experimental setup, the cavity contains the TPMS, which has a height of 12.7 mm and a square base of 37.5 mm. This TPMS fits the same-sized cavity. The model is tested against experimental data at a height of 12.7 mm. In this case, no flow passes the top of the cavity, but all the fluid penetrates through the structure. To provide confidence in the numerical model, an experiment was conducted with an aspect ratio of 1, and the results were compared with the numerical code. This numerical code was then used to predict the heat enhancement at a lower TPMS height.
Two different networks were used in the model: the first, a solid network; the second, a shell network. As shown in the manuscript, the shell network has a higher surface area than the solid network. The following findings were obtained:
  • The shell network, having a larger surface area, provided a better cooling rate than the solid network.
  • The cooling is not uniform, unlike in the experimental case, due to the flow circulation above the structure.
  • The performance criteria are higher for the shell network, with the best case occurring at an aspect ratio of 0.951.
  • At an aspect ratio below 0.9, the solid network outperformed the shell network across all flow rates. This is due to the pressure drop.
  • The pressure drop decreased when the aspect ratio was set to 0.951. No further improvement is noticed as the aspect ratio is lower.
  • The flow pattern is found to be similar whether a solid network or a shell network is used. As the aspect ratio reaches 0.5, a flow penetration from the free region into the structure becomes noticeable.
  • The optimal case occurs when the TPMS is a shell network, and the optimal aspect ratio is 0.951.

Author Contributions

Conceptualization, M.Z.S. and M.M.R.; methodology, M.Z.S. and M.M.R.; software, M.Z.S. and M.M.R.; validation, M.Z.S.; formal analysis, M.Z.S. and M.M.R.; investigation, M.Z.S. and M.M.R.; resources, M.Z.S.; writing—original draft preparation, M.Z.S.; writing—review and editing, M.Z.S. and M.M.R. All authors have read and agreed to the published version of the manuscript.

Funding

Natural Research Council of Canada RGPIN-2020-07021, Sultan Qaboos University IG/SCI/M/26/413.

Institutional Review Board Statement

Not applicable.

Informed Consent Statement

Not applicable.

Data Availability Statement

The original contributions presented in the study are included in the article; further inquiries can be directed to the corresponding author.

Conflicts of Interest

The authors declare no conflicts of interest.

Abbreviations

ANOVAAnalysis of variance
CpSpecific heat capacity (J/kg·K)
DHydraulic diameter (m)
fFriction factor (dimensionless)
hxLocal Heat transfer coefficient (W/m2·K)
kThermal conductivity (W/m·K)
LLength (m)
NuLocal Nusselt number (dimensionless)
pPressure (Pa)
PECPerformance evaluation criterion (dimensionless)
q″Heat flux (W/m2)
TTemperature (K)
TinInlet temperature (K)
TPMSTriply periodic minimal surface
uVelocity in x-direction (m/s)
uinInlet velocity (m/s)
vVelocity in y-direction (m/s)
wVelocity in z-direction (m/s)
xCartesian coordinate in x-direction (m)
yCartesian coordinate in y-direction (m)
zCartesian coordinate in z-direction (m)
Greek symbols
μDynamic viscosity (kg/m.s)
ρDensity (kg/m3)

References

  1. Bhandari, P.; Rawat, K.S.; Prajapati, Y.K.; Padalia, D.; Ranakoti, L.; Singh, T. A review on design alteration in micro-channel heat sink for augmented thermohydraulic performance. Ain Shams Eng. J. 2024, 15, 102417. [Google Scholar] [CrossRef]
  2. Wang, Q.; Tao, J.; Cui, Z.; Zhang, T.; Chen, G. Passive enhanced heat transfer, hotspot management and temperature uniformity enhancement of electronic devices by micro heat sinks: A review. Int. J. Heat Fluid Flow 2024, 107, 109368. [Google Scholar] [CrossRef]
  3. Saghir, M.Z.; Hajialibabaei, M.; Al-Ketan, O. Optimization of the TPMS Heat Exchanger Toward Cooling the Heat Sink. Processes 2025, 13, 1786. [Google Scholar] [CrossRef]
  4. Tuckerman, D.B.; Pease, R.F.W. High-performance heat sinking for VLSI. IEEE Electron Device Lett. 2005, 2, 126–129. [Google Scholar] [CrossRef]
  5. Harms, T.M.; Kazmierczak, M.J.; Gerner, F.M. Developing convective heat transfer in deep rectangular microchannels. Int. J. Heat Fluid Flow 1999, 20, 149–157. [Google Scholar] [CrossRef]
  6. Alihosseini, Y.; Targhi, M.Z.; Heyhat, M.M.; Ghorbani, N. Effect of a micro heat sink geometric design on thermohydraulic performance: A review. Appl. Therm. Eng. 2020, 170, 114974. [Google Scholar] [CrossRef]
  7. Xia, G.; Ma, D.; Zhai, Y.; Li, Y.; Liu, R.; Du, M. Experimental and numerical study of fluid flow and heat transfer characteristics in microchannel heat sink with complex structure. Energy Convers. Manag. 2015, 105, 848–857. [Google Scholar] [CrossRef]
  8. Xia, G.; Liu, Q.; Qi, J.; Xu, J. Influence of surfactant on friction pressure drop in a manifold microchannel. Int. J. Therm. Sci. 2008, 47, 1658–1664. [Google Scholar] [CrossRef]
  9. Mohammed, H.A.; Gunnasegaran, P.; Shuaib, N.H. Influence of channel shape on the thermal and hydraulic performance of microchannel heat sink. Int. Commun. Heat Mass Transf. 2011, 38, 474–480. [Google Scholar] [CrossRef]
  10. Gao, J.; Hu, Z.; Yang, Q.; Liang, X.; Wu, H. Fluid flow and heat transfer in microchannel heat sinks: Modelling review and recent progress. Therm. Sci. Eng. Prog. 2022, 29, 101203. [Google Scholar] [CrossRef]
  11. Lee, Y.J.; Singh, P.K.; Lee, P.S. Fluid flow and heat transfer investigations on enhanced microchannel heat sink using oblique fins with parametric study. Int. J. Heat Mass Transf. 2015, 81, 325–336. [Google Scholar] [CrossRef]
  12. He, Z.; Yan, Y.; Zhang, Z. Thermal management and temperature uniformity enhancement of electronic devices by micro heat sinks: A review. Energy 2021, 216, 119223. [Google Scholar] [CrossRef]
  13. Chamoli, S.; Lu, R.; Chen, H.; Cheng, Y.; Yu, P. Numerical optimization of design parameters for a modified double-layer microchannel heat sink. Int. J. Heat Mass Transf. 2019, 138, 373–389. [Google Scholar] [CrossRef]
  14. Yang, D.; Jin, Z.; Wang, Y.; Ding, G.; Wang, G. Heat removal capacity of laminar coolant flow in a microchannel heat sink with different pin fins. Int. J. Heat Mass Transf. 2017, 113, 366–372. [Google Scholar] [CrossRef]
  15. Prajapati, Y.K. Influence of fin height on heat transfer and fluid flow characteristics of rectangular microchannel heat sink. Int. J. Heat Mass Transf. 2019, 137, 1041–1052. [Google Scholar] [CrossRef]
  16. Kou, H.S.; Lee, J.J.; Chen, C.W. Optimum thermal performance of microchannel heat sink by adjusting channel width and height. Int. Commun. Heat Mass Transf. 2008, 35, 577–582. [Google Scholar] [CrossRef]
  17. Hajialibabaei, M.; Saghir, M.Z.; Dincer, I.; Bicer, Y. Experimental and numerical study on heat transfer performance of wavy channel heat sink with varying channel heights. Int. Commun. Heat Mass Transf. 2023, 148, 107044. [Google Scholar] [CrossRef]
  18. Bhandari, P.; Prajapati, Y.K. Thermal performance of open microchannel heat sink with variable pin fin height. Int. J. Therm. Sci. 2021, 159, 106609. [Google Scholar] [CrossRef]
  19. Zhou, F.; Catton, I. Numerical evaluation of flow and heat transfer in plate–pin fin heat sinks with various pin cross-sections. Numer. Heat Transf. Part A Appl. 2011, 60, 107–128. [Google Scholar] [CrossRef]
  20. Zhao, J.; Huang, S.; Gong, L.; Huang, Z. Numerical study and optimizing on micro square pin-fin heat sink for electronic cooling. Appl. Therm. Eng. 2016, 93, 1347–1359. [Google Scholar] [CrossRef]
  21. Chiu, H.C.; Hsieh, R.H.; Wang, K.; Jang, J.H.; Yu, C.R. The heat transfer characteristics of liquid cooling heat sink with micro pin fins. Int. Commun. Heat Mass Transf. 2017, 86, 174–180. [Google Scholar] [CrossRef]
  22. Hussein, H.A. Numerical hydrothermal evaluation of heat transfer in a multi–mini-channel heat sink: Effect of square pin fins. Results Eng. 2023, 20, 101403. [Google Scholar] [CrossRef]
  23. Shih, W.H.; Chiu, W.C.; Hsieh, W.H. Height effect on heat-transfer characteristics of aluminum-foam heat sinks. J. Heat Transf. 2006, 128, 530–537. [Google Scholar] [CrossRef]
  24. Berbee, J.G.; Ellzey, J.L. The effect of aspect ratio on the flow over a rearward-facing step. Exp. Fluids 1989, 7, 447–452. [Google Scholar] [CrossRef]
  25. Shuja, S.Z.; Yilbas, B.S. Flow over rectangular porous block in a fixed width channel: Influence of porosity and aspect ratio. Int. J. Comput. Fluid Dyn. 2007, 21, 297–305. [Google Scholar] [CrossRef]
  26. Lanzerstorfer, D.; Kuhlmann, H.C. Three-dimensional instability of the flow over a forward-facing step. J. Fluid Mech. 2012, 695, 390–404. [Google Scholar] [CrossRef]
  27. Al-Ketan, O.; Abu Al-Rub, R.K. MSLattice: A free software for generating uniform and graded lattices based on triply periodic minimal surfaces. Mater. Des. Process. Commun. 2021, 3, e205. [Google Scholar] [CrossRef]
  28. Saghir, M.Z.; Kilic, G.A. Experimental forced convection study using a triply periodic minimal surface porous structure with a nanofluid: Comparison with numerical modeling. Appl. Sci. 2024, 14, 7594. [Google Scholar] [CrossRef]
  29. Xu, Y.; Pan, H.; Wang, R.; Du, Q.; Lu, L. New families of triply periodic minimal surface-like shell lattices. Addit. Manuf. 2023, 77, 103779. [Google Scholar] [CrossRef]
  30. Yeranee, K.; Rao, Y. A review of recent investigations on flow and heat transfer enhancement in cooling channels embedded with triply periodic minimal surfaces (TPMS). Energies 2022, 15, 8994. [Google Scholar] [CrossRef]
  31. Ansari, D.; Duwig, C. A gyroid TPMS heat sink for electronic cooling. Energy Convers. Manag. 2024, 319, 118918. [Google Scholar] [CrossRef]
Figure 1. Experimental setup. (a) Experimental table, (b) Thermocouples location.
Fluids 11 00057 g001
Figure 2. Test section. (a) Aluminum TPMS, (b) silver TPMS.
Fluids 11 00057 g002
Figure 4. Comparison between experimental data and numerical results. (a) Aluminum TPMS, (b) silver TPMS.
Fluids 11 00057 g004
Figure 5. Two types of lattices: (a) solid structure, (b) shell structure.
Fluids 11 00057 g005
Figure 6. Temperature and Nusselt number distribution for different aspect ratios and flow rates (solid network).
Fluids 11 00057 g006aFluids 11 00057 g006b
Figure 7. Detailed velocity profile in different directions for solid network case and aspect ratio (AR) = 0.5 (a) in the TPMS section, (b) in the flow section, (c) along the middle vertical section.
Fluids 11 00057 g007
Figure 8. Iso-streamline for the solid network. (a) AR = 0.9, (b) AR = 0.5.
Fluids 11 00057 g008aFluids 11 00057 g008b
Figure 9. Temperature and Nusselt number distribution for different aspect ratios and flow rates (shell network).
Fluids 11 00057 g009aFluids 11 00057 g009b
Figure 10. PEC distribution for different aspect ratios and flow rates. (ac) Solid network, (df) shell network.
Fluids 11 00057 g010aFluids 11 00057 g010b
Table 1. Physical properties of the material and fluid used [28].
Fluid and Materials ρ (kg/m3) μ (kg/m.s)Cp(J/kg.K)k(W/m.K)
Distilled Water998.20.00100141280.613
Table 2. Lattice’s surface area.
Aspect Ratio (AR)Solid LatticeShell Lattice
0.96.08 × 10−3 m210.87 × 10−3 m2
0.85.60 × 10−3 m29.60 × 10−3 m2
0.74.97 × 10−3 m28.64 × 10−3 m2
0.64.48 × 10−3 m27.37 × 10−3 m2
0.53.62 × 10−3 m26.42 × 10−3 m2
Table 3. Fit statistics for the average Nusselt number.
Std. Dev4.48R20.9737
Mean131.41Adjusted R20.9668
CV%3.41Predicted R20.9458
Adeq Precision35.6119
Table 4. Fit statistics for the average PEC number.
Std. Dev3.23R20.9911
Mean164.56Adjusted R20.9888
CV%1.96Predicted R20.9822
Adeq Precision62.7563
Disclaimer/Publisher’s Note: The statements, opinions and data contained in all publications are solely those of the individual author(s) and contributor(s) and not of MDPI and/or the editor(s). MDPI and/or the editor(s) disclaim responsibility for any injury to people or property resulting from any ideas, methods, instructions or products referred to in the content.