Abstract
This article presents a collection of schlieren visualizations captured using a custom-built, laboratory-based imaging system, designed to explore a wide range of flow and refractive phenomena. The experiments were conducted as a series of observational case studies, serving as educational bloc notes for students and researchers working in fluid mechanics, optics, and high-speed imaging. High-resolution images illustrate various phenomena including shockwave propagation from bursting balloons, vapor plume formation from volatile liquids, optical surface imperfections in transparent materials, and the dynamic collapse of soap bubbles. Each image is accompanied by brief experimental context and interpretation, highlighting the physical principles revealed through the schlieren technique. The resulting collection emphasizes the accessibility of flow visualization in a teaching laboratory, and its value in making invisible physical processes intuitively understandable.
1. Schlieren Configurations
To capture the diverse phenomena presented in this study, several schlieren configurations were employed, including a classical Z-type setup [1], a U-type compact configuration, and a single-mirror Toepler-type arrangement. All setups utilize mirror-based optics, which offer key advantages over lens-based schlieren systems, particularly in terms of chromatic aberration elimination, higher light throughput, and broader spectral compatibility. The Z-type layout, with its symmetric mirror configuration, provides excellent image quality and is ideal for high-sensitivity and quantitative measurements. The U-type system, adapted for limited laboratory space, maintains comparable optical path lengths while reducing the system footprint. The single-mirror Toepler configuration offers a simple and portable alternative, particularly useful for quick diagnostics or in constrained setups, albeit with some trade-offs in sensitivity and field uniformity. Collectively, these mirror-based configurations enable versatile schlieren imaging across a wide range of scenarios without the optical dispersion issues inherent to lens systems.
In the following sections, the presented experiments are explicitly linked to the corresponding schlieren configuration in the order of appearance. Figure 1 presents the Z-type configuration, Figure 2 shows a U-type configuration employed solely due to space limitations in the laboratory, and Figure 3 illustrates a less common single-mirror arrangement used here to enhance image magnification for reduced-scale phenomena.
The Z-type arrangement (Figure 1) served as the baseline system and was employed for most visualizations, including vapor plumes and evaporation (Figure 4, Figure 5, Figure 6 and Figure 7), combustion and thermal flows (Figure 8, Figure 9, Figure 10, Figure 11, Figure 12, Figure 13 and Figure 14), reactive releases such as vinegar–baking soda and bubble ruptures (Figure 15, Figure 16, Figure 17, Figure 18 and Figure 19), and balloon burst acoustics (Figure 20, Figure 21 and Figure 22). The supersonic jet experiment was performed with both the Z-type (Figure 23a) and the Toepler single-mirror system (Figure 3; Figure 23b,c). The compact U-type layout (Figure 2) was specifically used for the turbulent underexpanded jet (Figure 24), where the laboratory constraints required both source and camera on the same side of the bench. Several additional turbulent jet and thermal plume studies were then conducted with the Z-type configuration (Figure 25, Figure 26, Figure 27, Figure 28 and Figure 29), followed by optical surface inspections (Figure 30, Figure 31 and Figure 32).
1.1. The Z-Type Schlieren Configuration
The primary configuration employed in this study is a Z-type schlieren system, constructed using two parabolic mirrors with an effective focal length (EFL) of 1524 mm [2] and a Phantom VEO 710L [3] high-speed camera as the imaging device. This classical two-mirror layout remains the most robust and versatile configuration for laboratory schlieren experiments, owing to its high optical sensitivity, excellent spatial resolution, and the elimination of chromatic aberrations inherent in lens-based systems.
A collimated beam is generated by the first mirror, passes through the test area, and is refocused by the second mirror onto a cutoff device, either a knife edge or a custom color schlieren filter, placed at the focal point. The resulting image intensity variations correspond to the first spatial derivative of the refractive index in the direction perpendicular to the cutoff. This allows visualization of subtle gas density gradients, shockwaves, or thermal plumes, depending on the test scenario.
In the current setup, the test section is located between the mirrors, and the phenomena typically span optical path lengths (L) on the order of a few millimeters to several centimeters, depending on the physical extent of the refractive index gradients (e.g., vapor jets, boundary layers, shock fronts). The long focal length mirrors provide a very narrow minimum detectable deflection angle, on the order of 26 microradians, which translates, for a 2 cm path length, to a minimum detectable density gradient of ~5.8 kg/m4 under standard atmospheric conditions.
This high sensitivity makes the Z-type setup particularly effective for capturing dynamic phenomena at high temporal and spatial resolutions.
As an educational reference, it is important to emphasize several key considerations in setting up a schlieren system. The choice of mirrors is critical: mirrors with too short a focal length (FL) limit sensitivity, reduce the field of view, and introduce stronger aberrations, whereas long-FL mirrors (≥1.5 m) allow finer detection of refractive index gradients. Alignment of the optical components must also be performed with care, as small misalignments of the knife edge or cutoff filter can introduce image artifacts or asymmetries. The sensitivity of a schlieren system can be derived from its geometry using the relation from Equation (1),
where w is the cutoff width at the focal plane, f the mirror focal length, and L the path length of the test region. This shows that sensitivity increases with longer focal length and greater optical path length. Pitfalls in practical use also include the choice of light source (which must be point-like and collimatable), unwanted vibrations, and stray light, all of which can reduce contrast. Including these considerations provides guidance for reproducing and understanding schlieren experiments in an educational setting.
The system is mounted on an optical bench with incremental alignment stages for precise positioning of the mirrors, knife edge, and camera, enabling easy reconfiguration for both monochromatic knife-edge schlieren and color schlieren experiments. A schematic representation of the Z-type configuration used in this study is presented in Figure 1.
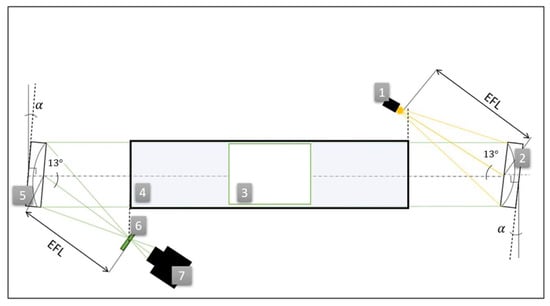
Figure 1.
Schematic representation of a Z-type schlieren configuration. (1) Point-like light source; (2) first parabolic mirror; (3) experimental area; (4) test area; (5) second parabolic mirror; (6) knife-edge; (7) camera lens and high-speed camera.
1.2. The U-Type Schlieren Configuration
A variation of the Z-type setup, referred to here as the U-type schlieren configuration [4], was also employed in the turbulent jet experiment presented in Figure 24. In this layout, the same pair of 1524 mm focal length parabolic mirrors are used to produce a collimated beam and refocus it, but both the light source and the camera are positioned on the same side of the optical system. While the optical layout still forms a collimated-light test area, the compact “U-like” external geometry improves access to the test section and reduces bench length, making this configuration practical for tabletop experiments, and in the present case eases the access to the study phenomena. Although careful alignment is required to minimize alignment-induced distortions, this configuration still exhibits the inherent aberrations of off-axis mirrors. Nevertheless, it retains the high sensitivity and resolution of the traditional Z-type setup and is fully compatible with both knife-edge and color schlieren methods. This configuration is presented in Figure 2.
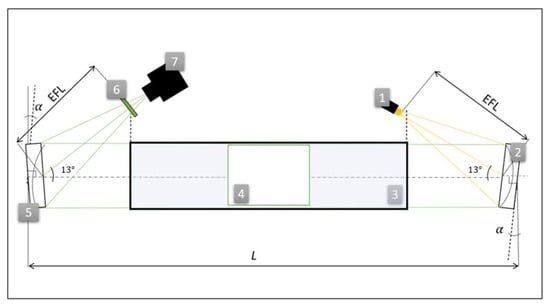
Figure 2.
Schematic representation of a U-shaped schlieren configuration used in the experiment. (1) point-like light source; (2) first parabolic mirror; (3) test area; (4) test section used; (5) second parabolic mirror; (6) green-purple gradient filter; (7) high-speed camera with camera lens. This configuration has been used in the experiment presented in Figure 24.
1.3. The Toepler Schlieren Configuration
For the supersonic jet found in Figure 23b,c, a single-mirror Toepler-type schlieren configuration [5] was implemented using one of the same 1524 mm focal length parabolic mirrors as used in the Z-type system. In this setup, a point light source is placed slightly off-axis and collimated by the parabolic mirror, then reflected back through the test area and focused directly onto the knife edge or color filter. The camera is aligned along the same axis as the source. This minimalist arrangement is especially advantageous for quick experiments, confined spaces, and educational demonstrations, offering a reduced footprint while retaining meaningful sensitivity. Although the effective path length through the test region is typically shorter, the angular sensitivity remains high due to the long focal length mirror. The minimum detectable deflection angle in this configuration is approximately 2.62 × rad (0.0015°). With this geometry, the system is able to detect density gradients as low as 7.74 kg/m4, which is sufficient to visualize many moderate refractive disturbances such as vapor plumes, thermal gradients, or CO2 release from common chemical reactions. Moreover, this configuration was used for placing the test area closer to the focal point to increase the apparent magnification, enhancing the visibility of localized phenomena despite the lower path length. A schematic of this configuration is presented in Figure 3.
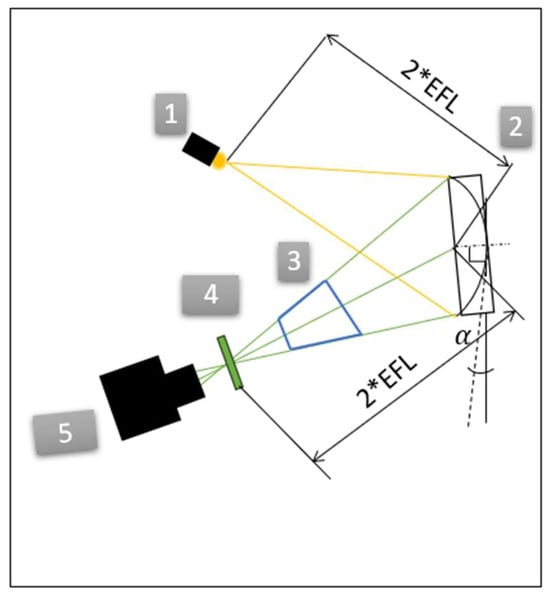
Figure 3.
Schematic representation of a Toepler schlieren configuration used in the experiment. (1) point-like light source; (2) single parabolic mirror; (3) test region; (4) anti-reflective knife edge; (5) high-speed camera with camera lens. This configuration has been used in the experiment presented in Figure 18.
To support the experimental investigations described in this study, a range of optical, mechanical, and recording components were employed. These elements were carefully selected to ensure high sensitivity, precise alignment, and compatibility with high-speed schlieren imaging. The core of the system is a Z-type mirror configuration, complemented by flexible configurations such as a U-type layout and a single-mirror Toepler variant. Additional resources include light sources, optical cutoffs, and flow generation tools tailored to specific phenomena. Table 1 summarizes the main equipment and resources used throughout the experimental campaign.

Table 1.
Equipment and resources used in the present study.
The laser-pumped white light source [6] was selected over a conventional LED because its ~0.5 mm emitting spot provides a point-like source required for schlieren imaging, while its reduced divergence allows more efficient collimation by the parabolic mirrors, resulting in brighter and higher-contrast images.
The following section presents a curated selection of schlieren images captured during the experimental campaign. Each set of images illustrates a distinct physical phenomenon, ranging from fluid evaporation and thermal plumes to shockwave propagation and gas release. These visualizations demonstrate the system’s ability to resolve subtle refractive index gradients and provide qualitative insight into the dynamic behavior of otherwise invisible flows.
Detailed schlieren imaging and camera parameters for each experiment are provided in Supplementary Table S1. Selected high-speed schlieren sequences are also provided as Supplementary Videos (Videos S1–S20), corresponding to the image figures presented in this article. See Supplementary Table S1 for full mapping between videos and experiments.
2. Vapor Plumes and Evaporation Phenomena
2.1. Ethanol and Acetone Evaporation
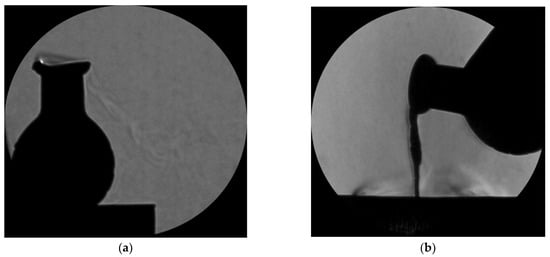
Figure 4.
Schlieren visualization of 70% ethanol solution vapor under two different conditions: (a) Passive evaporation from the neck of an open bottle. The vapor descends gradually due to the higher density of ethanol vapor relative to air. The plume appears more stable and stratified compared to pure acetone, influenced by slower evaporation and room convection (ambient temperature ≈ 25 °C, with AC airflow); (b) Vapor released during the active pouring of the 70% ethanol solution onto a table surface. The increased liquid–air contact accelerates evaporation, generating a denser, more chaotic vapor front that spreads laterally and forms visible refractive layers along the surface. It can be observed that for the pouring images the AC was turned off, providing a more uniform background. Camera settings and schlieren configuration details are presented in the Supplementary Table S1.
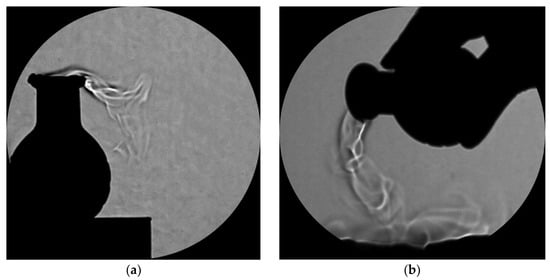
Figure 5.
Comparison of acetone vapor behavior under two conditions: (a) Schlieren visualization of acetone vapor emerging passively from the neck of an open bottle. The vapor descends due to its higher density relative to ambient air, forming a layered, slowly diffusing plume shaped by natural convection (ambient temperature ≈ 25 °C, with AC airflow). (b) Vapor plume generated during active pouring of acetone onto a table surface. The rapid release and spreading of vapor result in a more turbulent, expansive structure, with dense refractive index gradients visible near the liquid–air interface and along the spreading front. It can be observed that for the pouring images the AC was turned off, providing a more uniform background. Camera settings and schlieren configuration details are presented in the Supplementary Table S1.
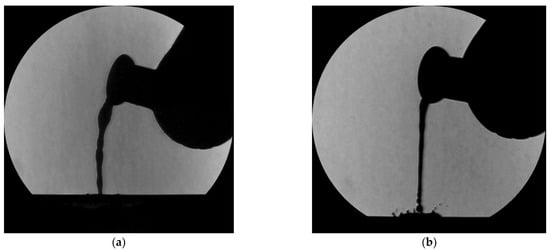
Figure 6.
Schlieren visualization of two dense, low-volatility liquids during pouring: (a) water and (b) apple vinegar. In both cases, the liquid jet is sharply delineated due to the strong refractive index contrast between the liquid and surrounding air, making the stream itself highly visible. However, no noticeable vapor plumes are present, as both liquids exhibit low volatility under ambient conditions. This figure was deliberately included as a negative case, to contrast with the clear vapor plumes observed for more volatile substances such as acetone (Figure 5). It highlights how the schlieren system effectively outlines liquid–air interfaces while also confirming the absence of airborne density gradients under these conditions. Images captured in still air, with AC turned off, ambient temperature ≈ 25 °C, liquid at room temperature. Camera settings and schlieren configuration details are provided in Supplementary Table S1.
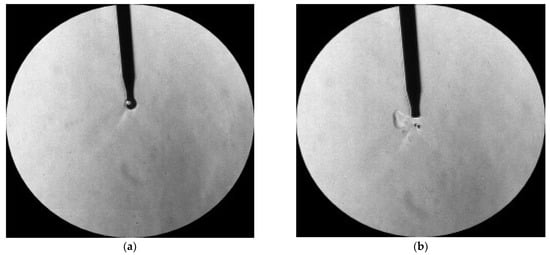
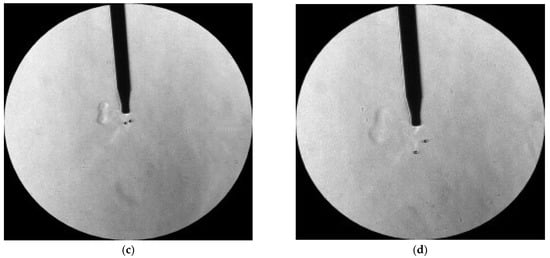
Figure 7.
Sequence of schlieren images showing the formation and rupture of an ethanol-filled bubble during pipetting. The bubble, formed at the tip of the pipette while drawing ethanol, as shown in (a), contains a small volume of vapor-saturated gas. Upon bursting in (b), the bubble collapses into two droplets, releasing the enclosed vapor into the surrounding air, process represented in (c,d). The schlieren frames capture both the rapid membrane rupture and the resulting outward gas diffusion, visible as a transient, low-density plume expanding from the breakup point. This sequence highlights the sensitivity of the schlieren system to small-scale impulsive gas release events, even when driven by microscale fluid instabilities. Images captured in still air, no AC, ambient temperature ≈ 25 °C, liquid at room temperature. Camera settings and schlieren configuration details are presented in the Supplementary Table S1. The schlieren visualizations clearly illustrate the refractive behavior during phase change, particularly in the case of volatile substances like acetone and ethanol. As these liquids evaporate, sharp refractive index gradients develop due to the transition from liquid to vapor, making the phase change optically detectable. The resulting vapor plumes exhibit distinct directionality, influenced by the density of the vapor relative to air and the ambient convection currents. Acetone tends to generate more turbulent and expansive plumes, while ethanol forms smoother, layered flows. These differences highlight how fluid volatility, vapor density, and environmental conditions shape the turbulence and structure of evaporative flows.
2.2. Candle Flame and Human Thermal Plume
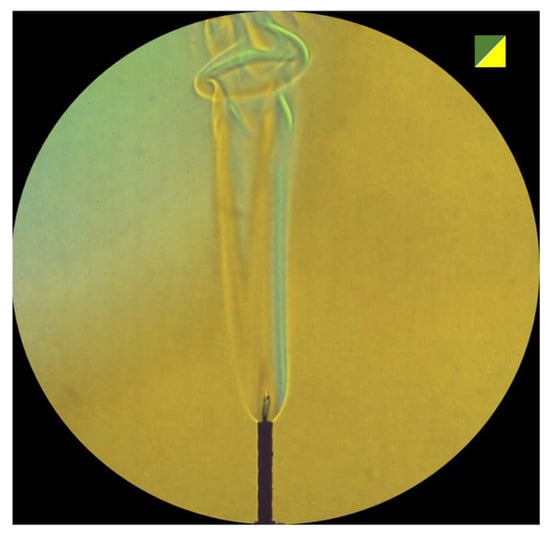
Figure 8.
Color schlieren image of a birthday cake candle flame, captured using a diagonally split color filter composed of green and yellow halves separated by a white transition line (top right). The flame generates a well-defined laminar thermal plume in the lower region, where hot air rises steadily due to buoyant convection. In the upper portion of the image, the plume transitions to a more turbulent regime, exhibiting small-scale instabilities and lateral oscillations. The color shift across the filter highlights the magnitude and direction of refractive index gradients, with smooth color bands in the laminar zone and more irregular patterns in the turbulent region. Image captured in still air, no AC, ambient temperature ≈ 25 °C, liquid at room temperature. Camera settings and schlieren configuration details are presented in the Supplementary Table S1.
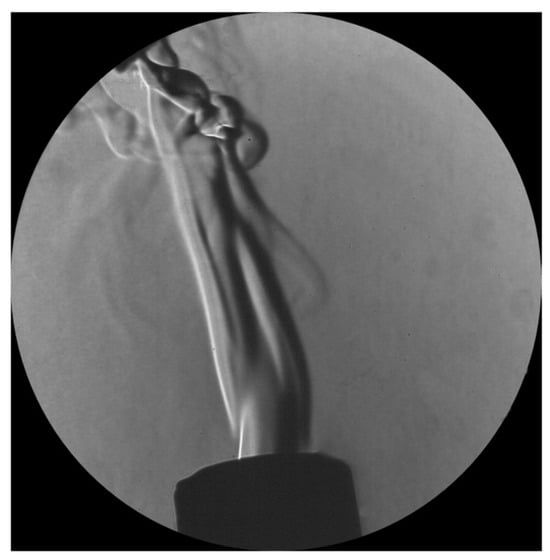
Figure 9.
Schlieren image of a soy wax candle flame, captured using a traditional knife-edge cutoff. The image reveals a strong upward thermal plume generated by buoyant convection of hot gases above the flame. Compared to the structure observed with color schlieren, the knife-edge technique emphasizes gradient directionality along the cutoff axis, resulting in high-contrast visualization of the rising flow. The plume exhibits a steady laminar core near the flame and increasing unsteadiness farther from the source, where small turbulent structures begin to develop due to entrainment and ambient air interaction. The distinct wax composition may also influence the combustion characteristics and heat distribution. Image captured in still air, no AC, ambient temperature ≈ 25 °C, liquid at room temperature. Camera settings and schlieren configuration details are presented in the Supplementary Table S1.
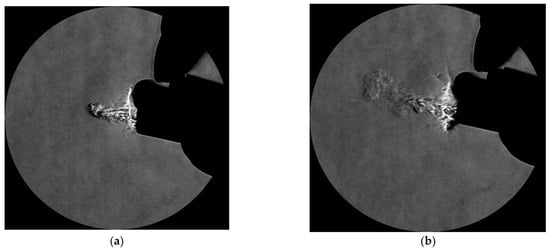
Figure 10.
Schlieren image of a lighter in operation, capturing both the initial spark and the pressurized gas jet emitted from the nozzle: (a) a bright central region marks the high-temperature ignition zone where the spark initiates combustion; immediately downstream of the nozzle, a series of faint periodic density variations are visible, resembling the structure of compressible jet features (often associated with Mach diamonds), though in this case they are more consistent with subsonic-to-transitional underexpanded flow, (b) surrounding the core jet, the gas mixes with ambient air, forming a turbulent shear layer with visible refractive gradients caused by temperature and composition differences. These frames highlight the interaction between ignition, rapid gas release, and turbulent mixing in small-scale combustion initiation (see VS1 in Supplementary Files).
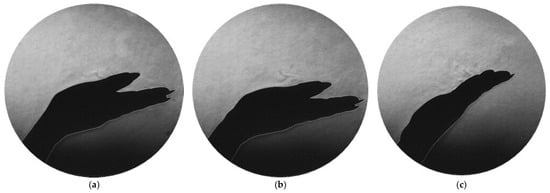
Figure 11.
Schlieren visualization of a human hand introduced into the imaging field produces a visible thermal plume as heat is transferred to the surrounding air. The rising flow is smooth and buoyant, demonstrating the body’s passive heat loss and natural convection from the skin surface (see VS2 in Supplementary Files). (a) presents a smaller thermal plume accentuated in (b,c) by different hand movements.
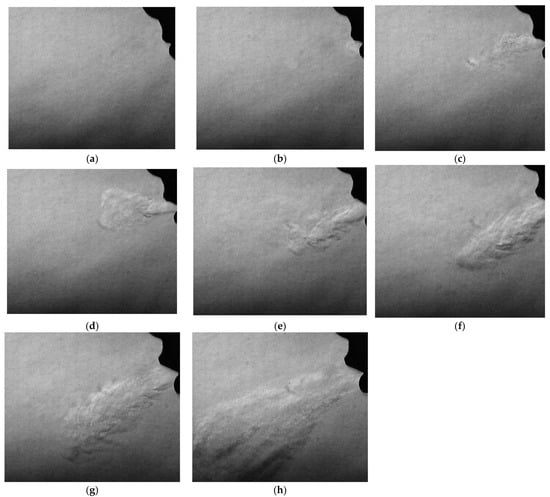
Figure 12.
Schlieren visualization of human-generated thermal and convective flow: side-profile images of a person exhaling, revealing a warm, coherent jet of air emitted through the nose and mouth. (a) presents the initial environment, right before exhalation, (b) presents the beginning of the exhalation plume, and from (c–h) consecutive exhalation frames are illustrated, representing how the exhaled plume follows a directed path, influenced by body posture and ambient airflow, and exhibits moderate turbulence as it diffuses into the surrounding atmosphere. The images underscore the sensitivity of the schlieren system to subtle temperature-driven refractive index gradients from the human body (see VS3 in Supplementary Files).
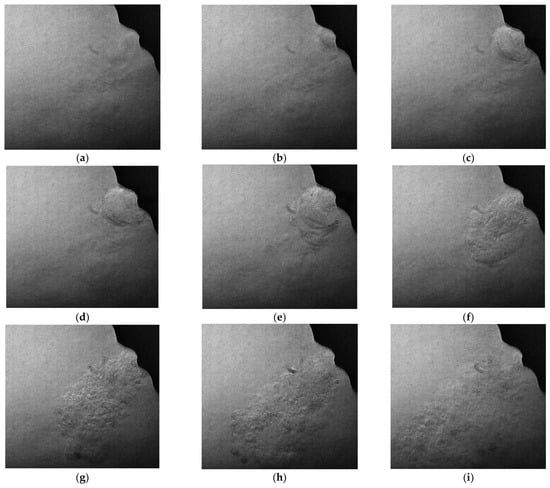
Figure 13.
Schlieren visualization of airflow during a human cough. (a) Presents the frame containing a bit of exhalation plume produced right before the cough, (b) presents the formation of the a high-velocity jet of warm air being expelled forward from the mouth, forming a turbulent, rapidly expanding plume, which is more centered around the mouth, as depicted in (c,d), while frames from (e–i) highlight how the flow exhibits strong directional momentum and wide dispersion, illustrating the potential for airborne particle transport during unprotected respiratory events. This type of experiments underscores how even modest temperature differences produce detectable refractive index gradients, and how environmental and physiological factors influence heat dissipation. The ability to observe and compare such phenomena in real time demonstrates the educational and diagnostic potential of schlieren imaging in studying thermal transfer, boundary layers, and passive airflow from living systems (see VS4 in Supplementary Files).
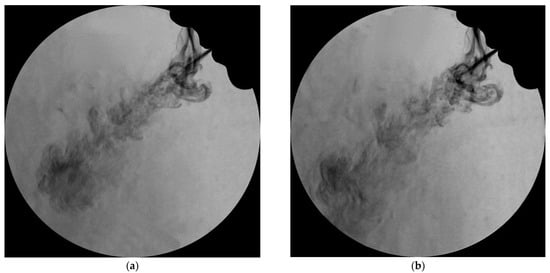
Figure 14.
Two consecutive schlieren frames capturing the expulsion of cigarette smoke through both the nose and mouth of a subject. (a) presents an earlier frame of smoke exhalation, with the jet less dispersed in the surrounding air, while (b) is the consecutive frame, presenting a more dispersed moth jet air and a more defined vortex in the exhaled smoke from the nostrils. The exhaled smoke from the nostrils forms two low-velocity, symmetrical plumes that remain relatively close to the face, characterized by gentle buoyant rise and moderate spreading. In contrast, the mouth-originated jet appears more forceful and concentrated, propagating farther from the subject and exhibiting a more pronounced axial direction and turbulent structure. While schlieren primarily reveals refractive index gradients, in this case the visualization is dominated by absorption and scattering from smoke particulates, highlighting the limitations of the technique when applied to particulate-laden flows. This example is included for its illustrative value in contrasting nasal versus oral exhalation dynamics; however, safer alternatives such as incense sticks or e-cigarette vapor can be used for equivalent demonstrations without the drawbacks of cigarette smoke (see VS5 in Supplementary Files).
3. Gas Generation and Reactive Flows
3.1. Vinegar and Baking Soda Reaction
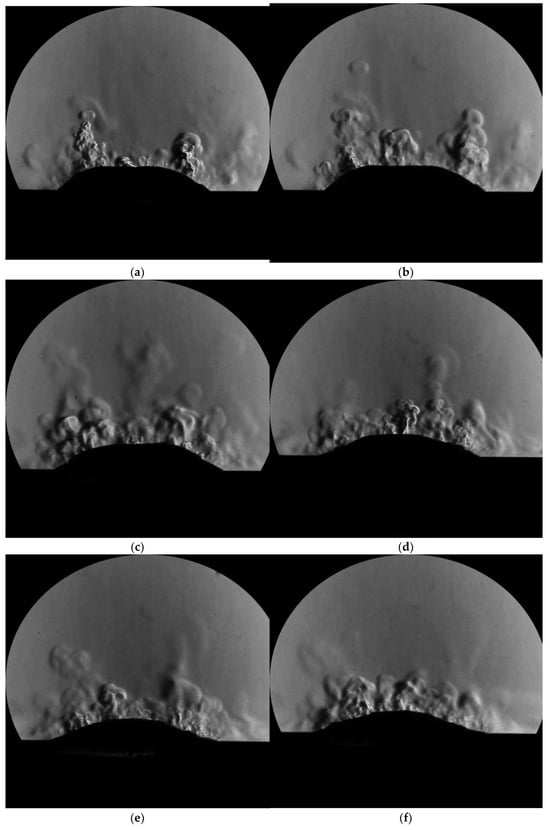
Figure 15.
Schlieren sequence showing the reaction between vinegar and a localized deposit of baking soda, captured from a lateral perspective. (a) presents how upon contact, the acetic acid in the vinegar reacts with the sodium bicarbonate, generating a visible burst of CO2 gas that expands outward and upward in the surrounding air. (b–f) highlight how over the sequence, the schlieren images reveal the initial impulse-driven gas release, followed by the formation of a buoyant plume characterized by layered diffusion and mild turbulence. Notably, the solid mass of baking soda visibly shrinks as the reaction progresses, indicating progressive material consumption. The frames highlight both the gas evolution dynamics and the evolving interface between reactants and air under ambient laboratory condition (see VS6 in Supplementary Files).
3.2. Soap Bubble Popping
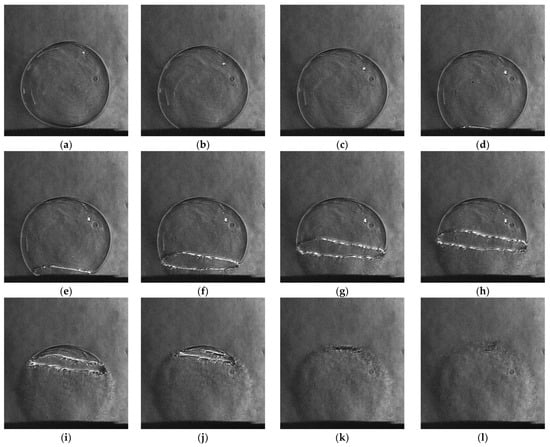
Figure 16.
Sequential schlieren frames capturing the rupture of a low-soap-content bubble upon contact with a solid surface. (a–c) present the bubble, composed primarily of water with a thin film structure, (d) presents how the bubble initiates rupture at the point of contact with the table, and (e–l) present schlieren images which reveal a rapid collapse of the bubble membrane, followed by the emission of a small vapor plume or density disturbance, likely due to air release and local pressure equalization. Compared to soap-rich bubbles, the thinner film results in faster rupture dynamics and reduced structural resilience, producing a more abrupt and compact event. The sequence highlights the ability of schlieren imaging to visualize subtle impulse flows and transient gas–liquid interactions at fine spatial and temporal scales (see VS7 in Supplementary Files).
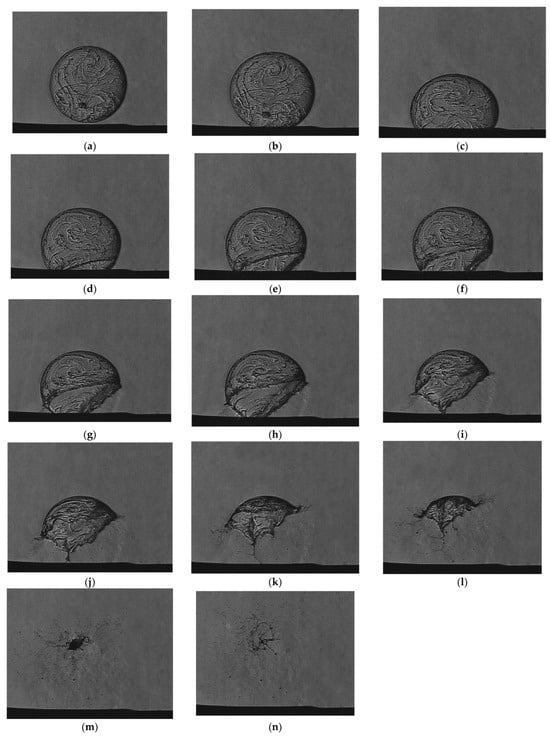
Figure 17.
Schlieren sequence showing the rupture dynamics of a soap-enriched bubble upon interaction with a solid surface. (a–c) present the initial structure of the bubble and the contact with the table, while (d) presents the initiation of the rupture, which continues throughout frames (e–n). Compared to the low-soap case, this bubble exhibits a thicker and more elastic film, allowing for greater deformation before rupture. Upon contacting the table, the bubble flattens significantly before the membrane shatters more gradually, producing an extended and visually rich sequence of film breakup. The schlieren frames capture the clear tearing of the soap film and the subsequent release of internal gas, visible as a low-density plume expanding from the bubble interior. The delayed and more structured breakage reflects the stabilizing effect of increased surfactant concentration, which temporarily resists surface tension forces before yielding in a more dramatic fashion (see VS8 in Supplementary Files).
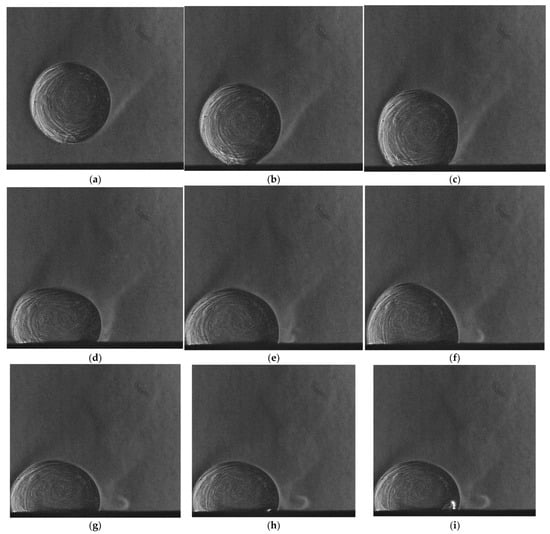
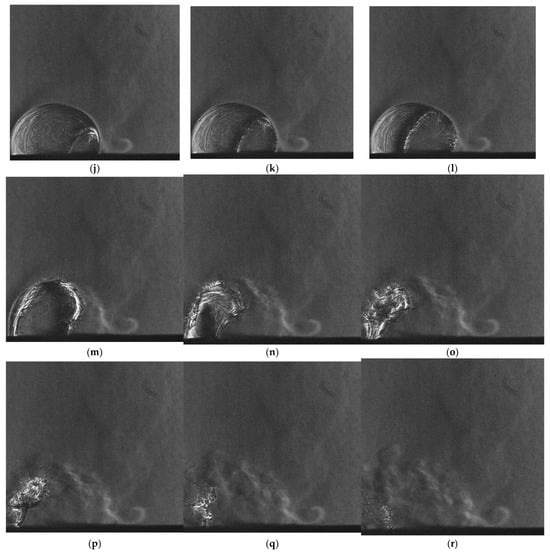
Figure 18.
Schlieren visualization of a deforming and rupturing soap bubble with vapor plume trail. This sequence captures the temporal evolution of a bubble undergoing progressive deformation upon gentle contact with a solid surface. Frames (a,b) present the bubble with its initial structure, (c) represents initial contact of the bubble with the table, while (d–g) presents the deformation of the bubble upon table contact. Rupture starts in frame (h) and the process is presented throughout frames (i–r). Due to the increased elasticity and stabilizing effects of the soap film, the bubble retains its integrity over multiple frames, gradually flattening and stretching. Schlieren imaging highlights internal vortical structures, subtle film undulations, and localized refractive index gradients within the soap membrane. As the bubble approaches mechanical failure, the collapse initiates from the lower section, releasing internal air in a coherent and directed fashion. The resulting disturbance propagates outward, leaving a visible, time-resolved refractive trail in the surrounding medium. This sequence demonstrates how surfactant-modified surface tension influences deformation pathways, rupture symmetry, and the dynamics of the bubble (see VS9 in Supplementary Files).
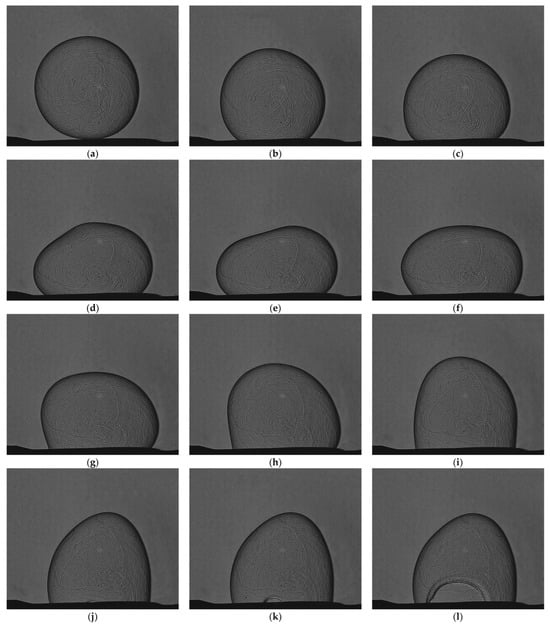
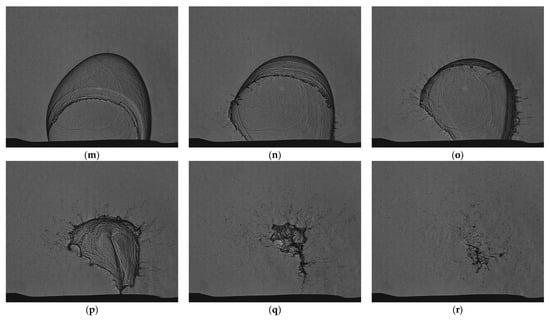
Figure 19.
Schlieren visualization of a large-diameter bubble represented in its initial structure in frames (a,b), with moderate to high soap concentration, captured during deformation and rupture. The increased film elasticity and surface tension balance allow the bubble to undergo substantial deformation upon contact with the table surface, presented here in frames (c–i), while frames (j–r) present the rupture timeline. Structural features of the soap film—such as curvature, thickness gradients, and internal stresses—are more clearly observable due to the enhanced refractive contrast provided by the schlieren setup. The rupture occurs after significant compression, with the membrane collapsing in a more controlled and slower manner, releasing a distinct plume of internal gas. This sequence illustrates how bubble size and soap concentration affect rupture dynamics, deformation thresholds, and the spatial extent of the emitted refractive disturbance (see VS10 in Supplementary Files).
4. Shockwave Visualization
4.1. Balloon Burst Acoustic Waves
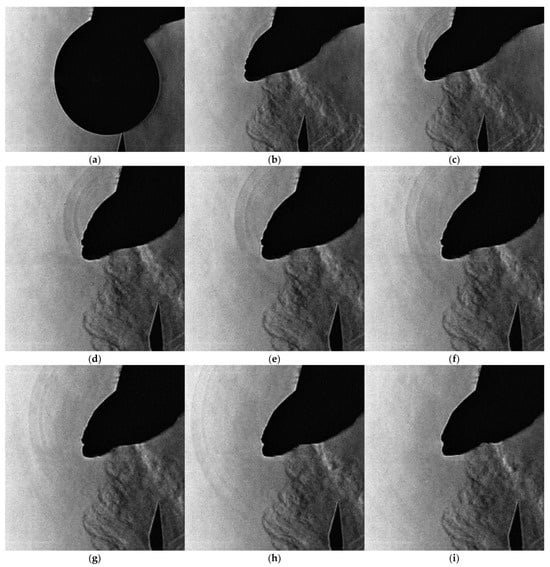
Figure 20.
Schlieren visualization of a rapidly punctured air balloon, highlighting the release of compressed air and associated wave phenomena. (a) presents the ballon before puncturing, while (b–i) sequence capture the rupture of an air-filled balloon following contact with a sharp object. The schlieren imaging reveals shear-layer development and membrane recoil, accompanied by the emission of concentric, onion-like acoustic waves characterized by weak refractive gradients. These waves differ from typical shock fronts and instead reflect the system’s sensitivity to low-amplitude pressure disturbances. The observed asymmetry in the released flow suggests directional puncture and confinement effects, while the layered wave patterns illustrate the dynamic interplay between gas expansion, structural rupture, and ambient air entrainment (see VS11 in Supplementary Files).
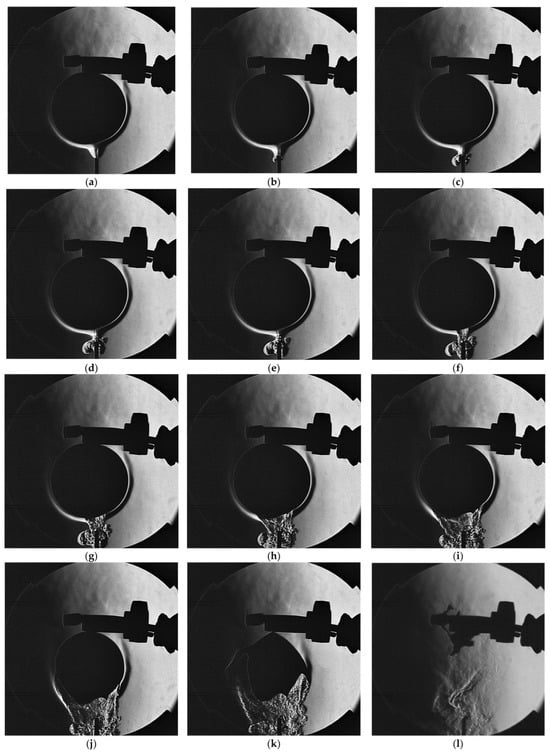
Figure 21.
High-speed schlieren visualization of a flame-induced rupture of an air-filled balloon. This sequence captures the rupture dynamics of an air-inflated balloon exposed to direct contact with a candle flame. The sequence starts with (a) the balloon held against the flame, before the rupture, while (b) presents the initial rupture and the following frames (c–l) show how the localized heating weakens the balloon’s lower membrane, leading to a delayed structural failure followed by rapid tearing. The schlieren technique reveals both thermal and pressure-driven effects: a rising thermal plume from the flame, followed by the sudden release of compressed air upon membrane rupture. The escaping gas generates a sharp refractive disturbance and complex shear-layer structures, while the balloon’s elastic recoil drives asymmetric deformation. Notably, the rupture is thermally initiated rather than mechanically triggered, allowing visualization of pre-failure softening, expansion wave fronts, and post-rupture turbulent mixing in the surrounding air (see VS12 in Supplementary Files).
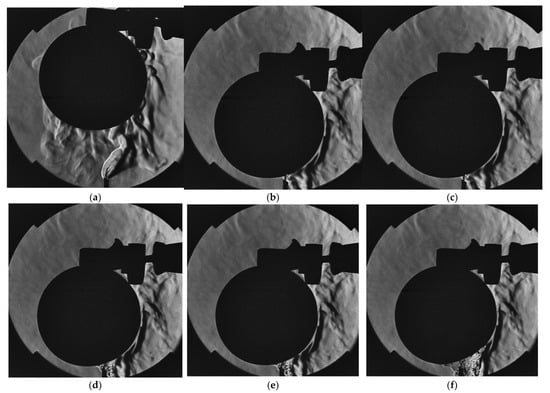
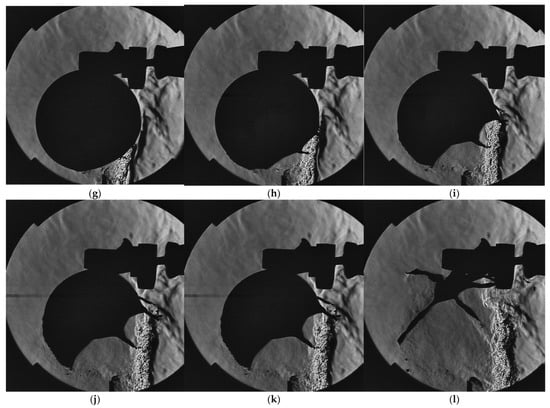
Figure 22.
High-speed schlieren visualization of a flame-extinguishing rupture of an air-filled balloon heated on one side. In this sequence, the balloon is subjected to localized thermal stress from a candle flame positioned beneath one quadrant of its surface. (a) frame of the initial balloon structure, (b) initial rupture, (c–l) rupture evolution. The asymmetric heating leads to uneven film weakening, resulting in a delayed rupture initiated precisely at the point of flame contact. Upon failure, the sudden release of compressed air produces complex refractive structures that sweep upward and outward, interacting directly with the candle flame. The high-velocity outflow extinguishes the flame, as evidenced by the abrupt disruption of the thermal plume. The schlieren images clearly reveal the pre-rupture thermal softening, the directional recoil of the balloon material, and the post-rupture air-jet dynamics, emphasizing the interplay between heat, elasticity, and compressible flow in thermally triggered mechanical failure (see VS13 in Supplementary Files).
4.2. Supersonic Compressed Air Jet
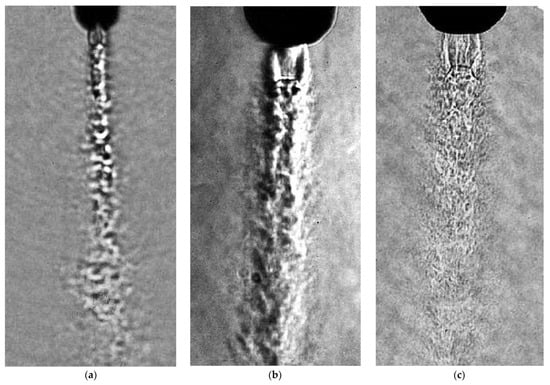
Figure 23.
Schlieren and shadowgraph visualizations of a supersonic compressed air jet exiting a convergent-divergent nozzle at 10 (a), 12 (b), and 15 (c) bar supply pressure. These images capture the complex flow structures produced by a highly underexpanded supersonic jet discharging into ambient air. The nozzle generates a jet with clearly defined shock-cell patterns—commonly referred to as shock diamonds or Mach disks [9]—resulting from periodic compressions and expansions downstream of the exit. The schlieren technique reveals distinct features such as shear-layer instabilities, shock–shock interactions, and mixing layers. The clarity of the image and the resolution is highly influenced by the schlieren configuration used. For example, (a) has been taken in the Z-type configuration, while (b,c) are taken in single-mirror.
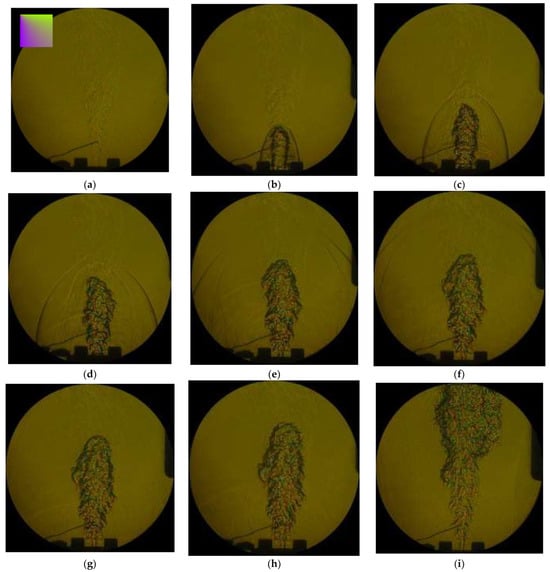
Figure 24.
Color-filtered schlieren visualization of a turbulent water vapor jet [6]. This high-speed sequence shows the evolution of a turbulent underexpanded air jet, captured using traditional schlieren imaging with a color filter applied at the knife edge. The chromatic encoding highlights refractive index gradients, allowing finer visualization of density fluctuations, shear layers, and turbulent mixing structures. (a) Presents the initial frame, without the jet, in (b–d), the jet exhibits a relatively symmetric core with visible compression waves and bow-shaped refractive features. As the sequence progresses in frames presented in (e–i), instabilities develop along the jet boundaries, leading to large-scale turbulent structures and increased mixing with the ambient air. The use of a color filter enhances contrast and helps distinguish subtle features such as vortex roll-ups, shock interactions, and internal wavefronts, providing a clearer view of the dynamic flow field in a compressible regime (see VS14 in Supplementary Files). The jet visualization setup uses the U-configuration due to space limitations in the laboratory environment. Even though there was enough space to align a U-type schlieren, the jet is encapsulated in a vacuum chamber (not active in this case), whose position is fixed in the laboratory setup. The U-type proved to be efficient in this case, despite the pitfalls of optical aberrations introduced by the off-axis mirrors tilted in the same direction.
5. Turbulent Jets

Figure 25.
Schlieren visualization of hot air emitted from a heat gun at approximately 200 °C, captured using two different optical cutoff methods: (a) monochromatic schlieren image using a knife edge oriented vertically. The image highlights the turbulent thermal plume with strong gradients indicating intense mixing and unsteady buoyant rise of the hot jet into ambient air. Fine details of eddies and plume instability are clearly resolved due to the high angular sensitivity of the knife edge. (b) Color schlieren image using a dual-filter cutoff, composed of pink and mint green sectors split horizontally. The directionality of the refractive index gradient is encoded as hue variation, offering a qualitative understanding of flow structure. The color transition boundary in the cutoff filter enhances sensitivity to vertical deflections, emphasizing the thermal stratification and turbulence development along the plume’s centerline (see VS15 in Supplementary Files).
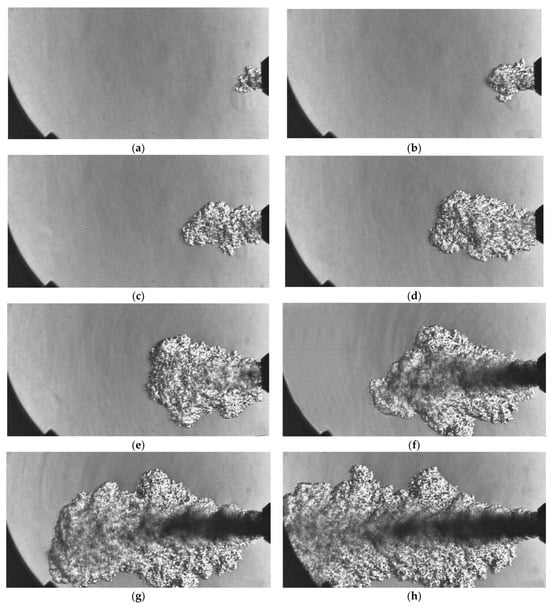
Figure 26.
Schlieren visualization of the gas jet emitted from an airsoft grenade (Ultrair Power Gas, propane-based). The sequence captures several frames of the high-speed, underexpanded jet as it exits the grenade’s nozzle. (a) presents the initial gas release, which forms the jet presented in the next consecutive frames, from (b–h). The schlieren system reveals a dense, collimated central core, bordered by shear-layer structures and expanding turbulent mixing zones. A series of refractive gradients indicate rapid density variations as the compressed propane-butane mixture interacts with ambient air. The dark central region of the jet corresponds to areas with steep refractive index gradients, likely caused by a combination of lower temperature of the expanding gas (due to the Joule-Thomson cooling effect), high gas density, and flow acceleration resulting in pressure drop and condensation effects. The result is a striking contrast between the cold, dense jet core and the surrounding warmer ambient air. Small-scale turbulent structures are visible further downstream, marking the transition to fully mixed flow (see VS16 in Supplementary Files).
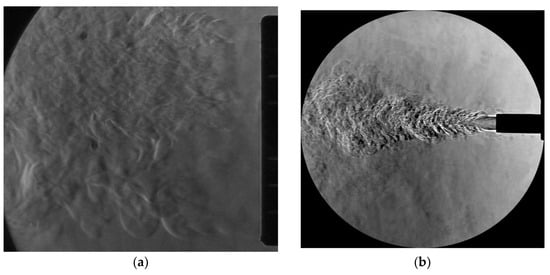
Figure 27.
Schlieren visualization of warm air exiting a laminar flow device: (a) top view; (b) side view. Although the initial portion of the jet is relatively stable and exhibits limited refractive index contrast due to low velocity gradients, the elevated temperature of the air (~200 °C) induces a strong density gradient that becomes more pronounced downstream. As the hot jet rises and interacts with ambient air, it transitions into a clearly visible turbulent plume, characterized by swirling structures and fluctuating flow boundaries. This image demonstrates the effect of thermal buoyancy on otherwise laminar flows, where temperature-driven instabilities dominate the visualization farther from the outlet (see VS17 and VS18 in Supplementary Files).
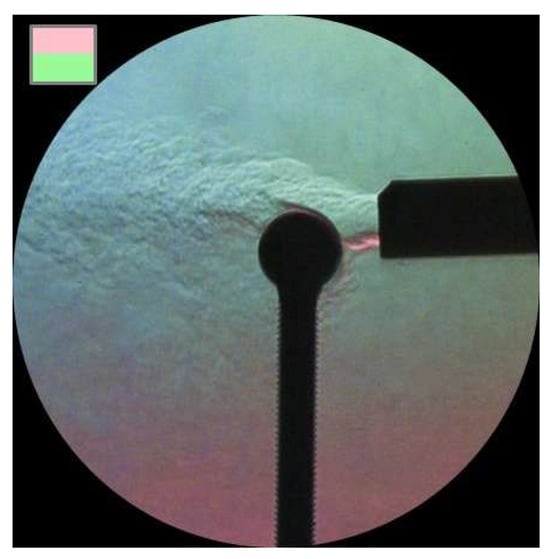
Figure 28.
Color schlieren visualization of a laminar hot air jet (~200 °C) impinging on a metal cylinder, with flow from right to left. A semicircular refractive index gradient appears upstream of the cylinder as the air heats up through conduction. This thermal boundary layer creates a distinct optical path difference, made visible through a dual-color schlieren cutoff filter (mint green and magenta). Flow detachment and early turbulence are visible near the stagnation point (see VS19 in Supplementary Files).
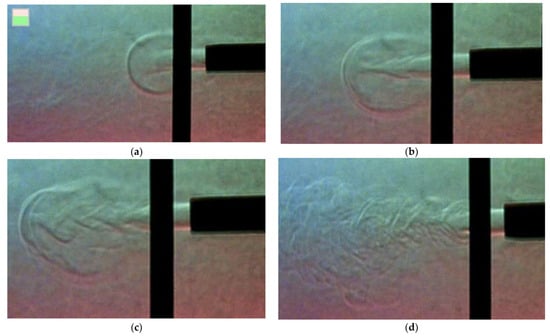
Figure 29.
High-speed schlieren visualization of vortex shedding from a heated vertical PTFE cylinder exposed to a laminar hot air jet. The images capture sequential frames of the flow field at approximately 200 °C. As the jet impinges on the cylinder, from the intial frames (a,b) the boundary layer separates on both sides, leading to alternating vortex formation downstream, as presented by (c,d). This alternating structure, visible as distinct density gradient lobes, is characteristic of the early stages of a von Kármán vortex street. The experiment highlights the transition from steady laminar flow to periodic unsteady wake shedding, driven by thermal buoyancy and shear-layer instabilities (see VS20 in Supplementary Files).
6. Optical Surface Analysis
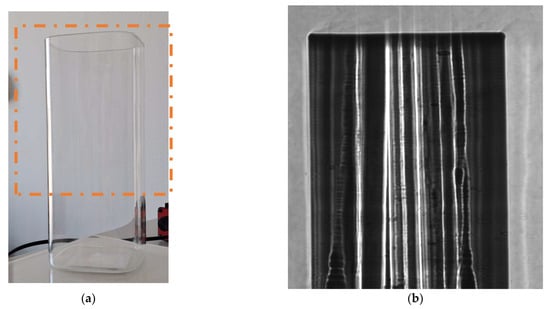
Figure 30.
Comparison between (a) the glass vase under normal illumination, appearing fully transparent and defect-free, with the orange rectangle representing the area od the cylinder visualized with schlieren in (a), and (b) the same vase visualized using schlieren imaging. The schlieren image reveals numerous internal refractive index variations, including vertical striations and localized distortions that are invisible to the naked eye. These features likely result from stress gradients, inhomogeneities in the glass, or surface imperfections introduced during the manufacturing process. This highlights the utility of schlieren techniques in non-destructive evaluation of optically transparent materials.
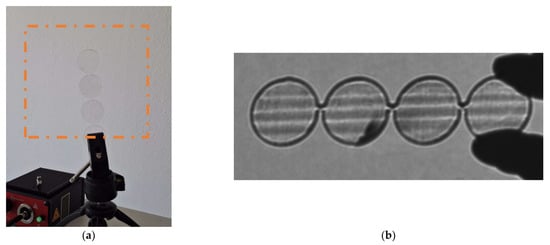
Figure 31.
Comparison between (a) a transparent plexiglass sample with circular cutouts under normal illumination, showing no apparent defects, with the orange rectangle representing the area visualized with schlieren and (b) the same sample imaged with schlieren technique. The schlieren image reveals significant internal optical inhomogeneities and stress-induced fringes within each circular aperture. These variations, invisible in natural light, indicate non-uniform refractive index distributions likely caused by machining stress, residual strain, or surface imperfections. This highlights the value of schlieren imaging in identifying internal flaws in optical plastics that would otherwise go undetected.
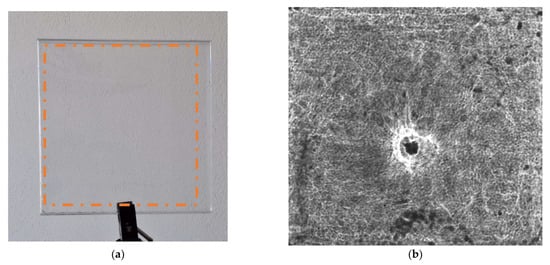
Figure 32.
Schlieren visualization of a transparent plastic tray reveals a dense field of optical imperfections, including surface scratches, subsurface stress patterns, and localized inhomogeneities. While the tray appears clear to the naked eye under normal lighting, as shown in (a) the schlieren system accentuates refractive index gradients resulting from mechanical wear, thermal distortion, and material inconsistencies, revealed in (b). The bright central artifact likely corresponds to a puncture or deep scratch acting as a local scattering center, with radiating stress fringes indicating residual strain distribution across the tray.
7. Insights and Educational Relevance of the Observed Phenomena
The extensive series of schlieren visualizations presented in this work spans a diverse range of physical processes, including evaporation, combustion, gas release, heat transfer, supersonic jet expansion, and optical surface inspection. Each phenomenon, ranging from ethanol and acetone vapor behavior to the dynamics of soap bubble rupture and flame-induced balloon failure, offers a unique opportunity for scientific observation and pedagogical application. For instance, the schlieren imagery of human respiration and cough propagation highlights the system’s utility in public health education, while the visualization of high-speed jets and shock structures under different pressure ratios provides valuable insights into compressible flow behavior for aerodynamics instruction.
Moreover, the imaging of seemingly transparent objects such as plexiglass cutouts and plastic trays emphasizes the diagnostic sensitivity of schlieren techniques in detecting subtle refractive index gradients, making it an effective tool for teaching optical quality assessment. The structured progression from basic thermal plumes (e.g., candle flames and heated hands) to complex interactions (e.g., vortex shedding from heated cylinders) illustrates both the scalability and adaptability of the schlieren system. The inclusion of high-speed imaging further enhances the temporal resolution of rapidly evolving phenomena, supporting its application in dynamic fluid mechanics and thermodynamics education. Collectively, these experiments form a visual and conceptual atlas for understanding flow and refractive processes in a compelling and accessible manner.
Supplementary Materials
The following supporting information can be downloaded at: https://www.mdpi.com/article/10.3390/fluids10090243/s1, Table S1: Experiment parameters; Videos: VS1–VS20: VS1—https://doi.org/10.5281/zenodo.16567117, VS2—https://doi.org/10.5281/zenodo.16567809, VS3—https://doi.org/10.5281/zenodo.16568320, VS4—https://doi.org/10.5281/zenodo.16568828, VS5—https://doi.org/10.5281/zenodo.16569299, VS6—https://doi.org/10.5281/zenodo.16570564, VS7—https://doi.org/ 10.5281/zenodo.16570932, VS8—https://doi.org/ 10.5281/zenodo.16571021, VS9—https://doi.org/10.5281/zenodo.16571309, VS10—https://doi.org/10.5281/zenodo.16571445, VS11—https://doi.org/10.5281/zenodo.16571807, VS12—https://doi.org/10.5281/zenodo.16572003, VS13—https://doi.org/10.5281/zenodo.16572207, VS14—https://doi.org/10.5281/zenodo.16572562, VS15—https://doi.org/10.5281/zenodo.16572779, VS16—https://doi.org/10.5281/zenodo.16572796, VS17—https://doi.org/10.5281/zenodo.16572878, VS18—https://doi.org/10.5281/zenodo.16572982, VS19—https://doi.org/10.5281/zenodo.16573154, VS20—https://doi.org/10.5281/zenodo.16573277.
Author Contributions
Conceptualization, E.G.P.; methodology, E.G.P.; investigation, E.G.P. and R.A.R.; resources, E.G.P. and R.A.R.; data curation, E.G.P.; writing—original draft preparation, E.G.P. and R.A.R.; writing—review and editing, E.G.P. and V.D.; project administration, E.G.P. and V.D. All authors have read and agreed to the published version of the manuscript.
Funding
This work was carried out through the “Nucleu” Program, within the framework of the National Plan for Research, Development and Innovation 2023–2026, supported by the Romanian Ministry of Research, Innovation and Development, project number PN23.12.06.02.
Institutional Review Board Statement
Not applicable.
Informed Consent Statement
Not applicable.
Data Availability Statement
The original contributions presented in this study are included in the article. Further inquiries can be directed to the corresponding authors.
Acknowledgments
The authors acknowledge the use of ChatGPT 4.0 (OpenAI, https://chat.openai.com) for language improvement purposes only. The authors have reviewed and edited the output and take full responsibility for the content of this publication.
Conflicts of Interest
The authors declare no conflicts of interest. The funders had no role in the design of the study; in the collection, analyses, or interpretation of data; in the writing of the manuscript; or in the decision to publish the results.
References
- Settles, G.S. Schlieren and Shadowgraph Techniques: Visualizing Phenomena in Transparent Media; Springer: Berlin, Germany, 2001; pp. 1–406. [Google Scholar]
- Edmund Optics. Precision Parabolic Mirrors. Available online: https://www.edmundoptics.com/f/precision-parabolic-mirrors/11895/ (accessed on 20 July 2025).
- Vision Research. Phantom VEO 710 High-Speed Camera Datasheet; Vision Research Datasheets, Rev. 3 June 2023. Available online: https://komiweb.co.kr/2015/images/data/DS_WEB-VEO710.pdf (accessed on 25 July 2025).
- Prisăcariu, E.-G.; Prisecaru, T. Quantitative Color Schlieren for an H2–O2 Exhaust Jet Developing in Air. Fluids 2024, 9, 19. [Google Scholar] [CrossRef]
- Settles, G.S.; Hargather, M.J. A Review of Recent Developments in Schlieren and Shadowgraph Techniques. Meas. Sci. Technol. 2017, 28, 042001. [Google Scholar] [CrossRef]
- Technologie Manufaktur. Laser-Pumped White Light Source. Available online: https://www.technologie-manufaktur.de/en/laser-pumped-white-light-source/ (accessed on 13 July 2025).
- ActionSportGames A/S. ULTRAIR Power Gas (570 mL)—Green Gas Propellant for Airsoft, Composition: ~90% Propane, ~10% Butane. ActionSportGames Official Product Page. Available online: https://www.airsoft-cluj.ro/ultrair-high-power-propellent-gas-570-ml.html (accessed on 19 August 2025).
- Tamron SP AF 70–200 mm F2.8 Di LD (IF) Macro Review. Available online: https://www.dpreview.com/reviews/tamron-70-200-2p8-c16/6 (accessed on 19 August 2025).
- Jugroot, M.; Groth, C.P.T.; Thomson, B.A.; Collings, B. Numerical Investigation of Interface Region Flows in Mass Spectrometers: Neutral Gas Transport. J. Phys. D Appl. Phys. 2004, 37, 1289–1300. [Google Scholar] [CrossRef]
Disclaimer/Publisher’s Note: The statements, opinions and data contained in all publications are solely those of the individual author(s) and contributor(s) and not of MDPI and/or the editor(s). MDPI and/or the editor(s) disclaim responsibility for any injury to people or property resulting from any ideas, methods, instructions or products referred to in the content. |
© 2025 by the authors. Licensee MDPI, Basel, Switzerland. This article is an open access article distributed under the terms and conditions of the Creative Commons Attribution (CC BY) license (https://creativecommons.org/licenses/by/4.0/).