Abstract
This study experimentally investigates the wake-induced vibration (WIV) behavior of a bio-inspired harbor seal whisker model subjected to upstream propeller-generated unsteady flows. Vibration amplitudes, frequencies, and wake–whisker interactions were systematically evaluated under various flow conditions. The test matrix included propeller rotational speed Np = 0~5000 r/min, propeller diameter Dp = 60~100 mm, incoming flow velocity U∞ = 0~0.2 m/s, and separation distance between the whisker model and the propeller L/D = 10~30 (D = 16 mm, diameter of the whisker model). Results show that inline (IL) and crossflow (CF) vibration amplitudes increase significantly with propeller speed and decrease with increasing separation distance. Under combined inflow and wake excitation, non-monotonic trends emerge. Frequency analysis reveals transitions from periodic to subharmonic and broadband responses, depending on wake structure and coherence. A non-dimensional surface fit using L/D and the advance ratio (J = U∞/(NpDp)) yielded predictive equations for RMS responses with good accuracy. Phase trajectory analysis further distinguishes stable oscillations from chaotic-like dynamics, highlighting changes in system stability. These findings offer new insight into WIV mechanisms and provide a foundation for biomimetic flow sensing and underwater tracking applications.
1. Introduction
Marine vessels rely heavily on accurate target detection and tracking for navigation, environmental monitoring, and anti-collision systems. Inspired by nature, harbor seals can detect and follow hydrodynamic wakes using their whiskers—without relying on vision or sonar—demonstrating extraordinary sensory capabilities [1,2]. These capabilities have inspired biomimetic sensors designed to detect propeller-driven craft. However, despite their potential, the dynamic response of whisker models in the turbulent and complex propeller wakes remains poorly understood and requires further exploration.
The whiskers of harbor seals exhibit a unique, undulating three-dimensional geometry: the cross-section varies elliptically along the span, and is characterized by two offset ellipses whose axes rotate along the whisker [3]. Hanke et al. [4] quantified this structure using seven parameters—major axes (a, k), minor axes (b, l), spacing M, and elliptical-plane attack angles (α, β). These were derived from scanning 13 whiskers and analyzing 81 crest-trough segments. Hanke et al. [4] used these geometries in uniform flow at Re ≈ 300–500. They found that the undulated shape significantly suppresses vortex-induced vibration (VIV) by disrupting coherent von Kármán shedding. This reduces base noise and enhances sensitivity to external wakes. Rinehart et al. [3] and Lyons et al. [5] extended this dataset, confirming variability and suggesting smaller average attack angles (α ≈ 0.3°, β ≈ 1.08°), highlighting statistical shape diversity. These dimensions are widely used to reconstruct biomimetic models for both experimental and computational studies. They also found optimal undulation wavelengths that minimize drag while disrupting vortex pairing. Shorter recovery lengths were observed downstream. In flow visualized experiments, seal-whisker models produced weaker and more dispersed vortical structures compared to smooth elliptical cylinders. This altered turbulence intensity and wake recovery length [6]. These results clearly demonstrate the hydrodynamic advantages of the seal-whisker morphology.
Marine propeller wakes exhibit intricate three-dimensional vortical structures. These consist mainly of helical tip vortices, hub vortices, and complex trailing sheet vortices [7]. Paik et al. [8] used PIV to show that blade loading significantly affects tip-vortex core size and strength. It also changes the contraction angle in the near wake (0~1 Dp downstream, where Dp is the propeller diameter). Di Mascio et al. [9] used DES simulations near free surfaces. They highlighted how submerged versus open-water conditions can stabilize or prematurely trigger hub-vortex breakdown. Felli et al. [10] documented mechanisms of tip-hub vortex interaction, including pairing, leapfrogging, and destabilization. These dynamics are governed by spiral pitch and distance. Recent numerical work by Posa [11] showed that advancing blade speed (high rpm) generates low-pitch helical wakes, which destabilize quickly due to elliptical instabilities. Propeller diameter and advance coefficient (flow-relative blade speed) jointly influence wake pitch, convection velocity, and breakdown distance. Wang et al. [12] investigated high-speed and heavily loaded propellers. They found that these produce tight pitch helicoidal wakes, which destabilize more rapidly through tip vortex pairing, leapfrogging, and hub vortex decay. Collectively, these studies confirm that propeller diameter, rotational speed, and inflow velocity are fundamental parameters governing wake structure and vortex decay.
Prior research on whisker models in wakes from bluff bodies (e.g., cylinders, triangles, squares) and active bodies (e.g., flapping fins) have clarified the effects of upstream geometry and spacing on vibration and force responses. Beem et al. [13] showed that a whisker model in a cylinder wake locks onto upstream Strouhal frequencies through a slaloming motion. This enabled detection at distances up to ~30 D downstream. Ginter et al. [14] found that whisker amplitudes peaked at wake frequencies when located within ~17 whisker diameters downstream of a cylinder, a behavior not observed for circular cylinders. Miersch et al. [15] confirmed that whiskers suppress self-induced vibration in uniform flow, but amplify response amplitude in wakes due to slaloming mechanics. Han et al. [16] used the immersed boundary method to simulate a self-propelled fin behind a cylinder. Their study revealed the role of wake–structure energy transfer and the importance of cylinder motion in amplifying downstream response. Zhao et al. [17] studied a whisker sensor downstream of a flapping fin. They found that vibration amplitudes locked onto wake spectral content, with maximum responses at intermediate attack angles.
Dulac et al. [18] examined whiskers behind cylinders and mapped vibration amplitude, phase, and frequency variations with separation distance and elevation (up to ~25 D). Their study revealed three-dimensional wake modulations. Shan and Zhang [19] numerically investigated whisker response behind various bluff bodies. They showed that slaloming amplitude and frequency vary with wake geometry. Mao et al. [20] used modal decomposition to analyze wake–whisker coupling and modulation mechanisms. Beem and Triantafyllou [21] also demonstrated lock-in behavior, showing that whiskers can sense upstream object shape and size via frequency response. These studies confirm that whisker responses are highly sensitive to upstream shape, vortex shedding, and spacing.
Although wake-induced vibrations (WIV) of whiskers have been well studied in uniform and bluff-body wakes, their behavior in propeller wakes—characterized by helical, multiscale, and unstable vortices—remains largely unexplored. The effects of propeller diameter (Dp), rotational speed (Np), inflow velocity (U∞), and separation distance (L) on whisker amplitude and frequency responses are still unclear. This knowledge gap limits the design of sensors for detecting and classifying propeller-driven vessels.
This study addresses the gap by experimentally investigating a biomimetic whisker model exposed to upstream propeller wakes. By systematically varying propeller blade diameter, rotational speed, inflow velocity, and separation distance, we aim to characterize the dynamic responses and derive non-dimensional scaling relationships. Additionally, the effect of separation distance is studied to clarify coupling mechanisms between whiskers and wakes which is essential for sensor application in realistic marine environments.
2. Experimental Setup and Validation
Experimental Setup
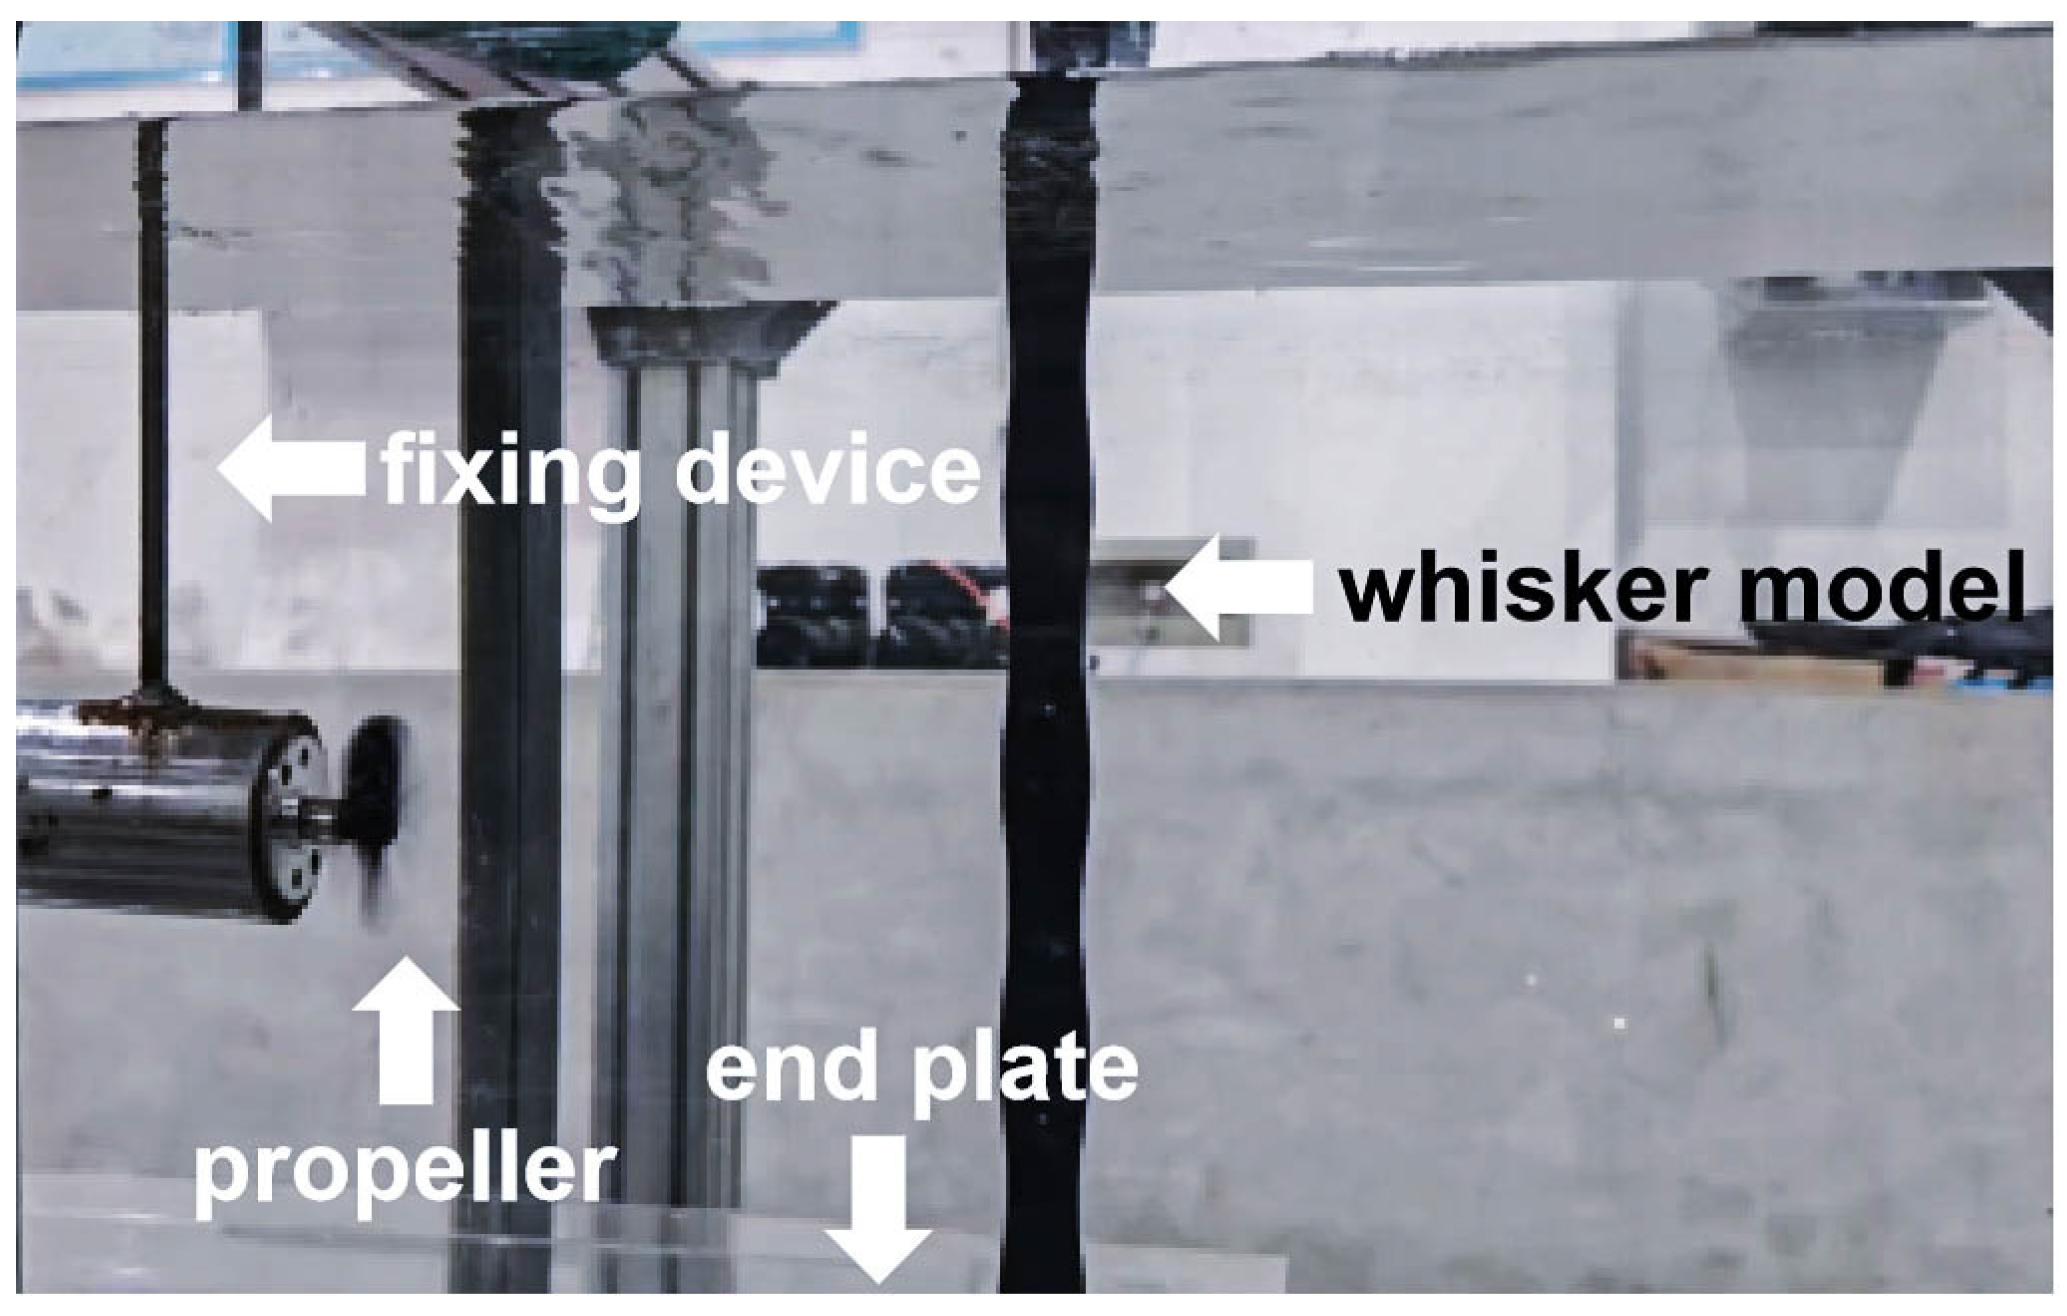
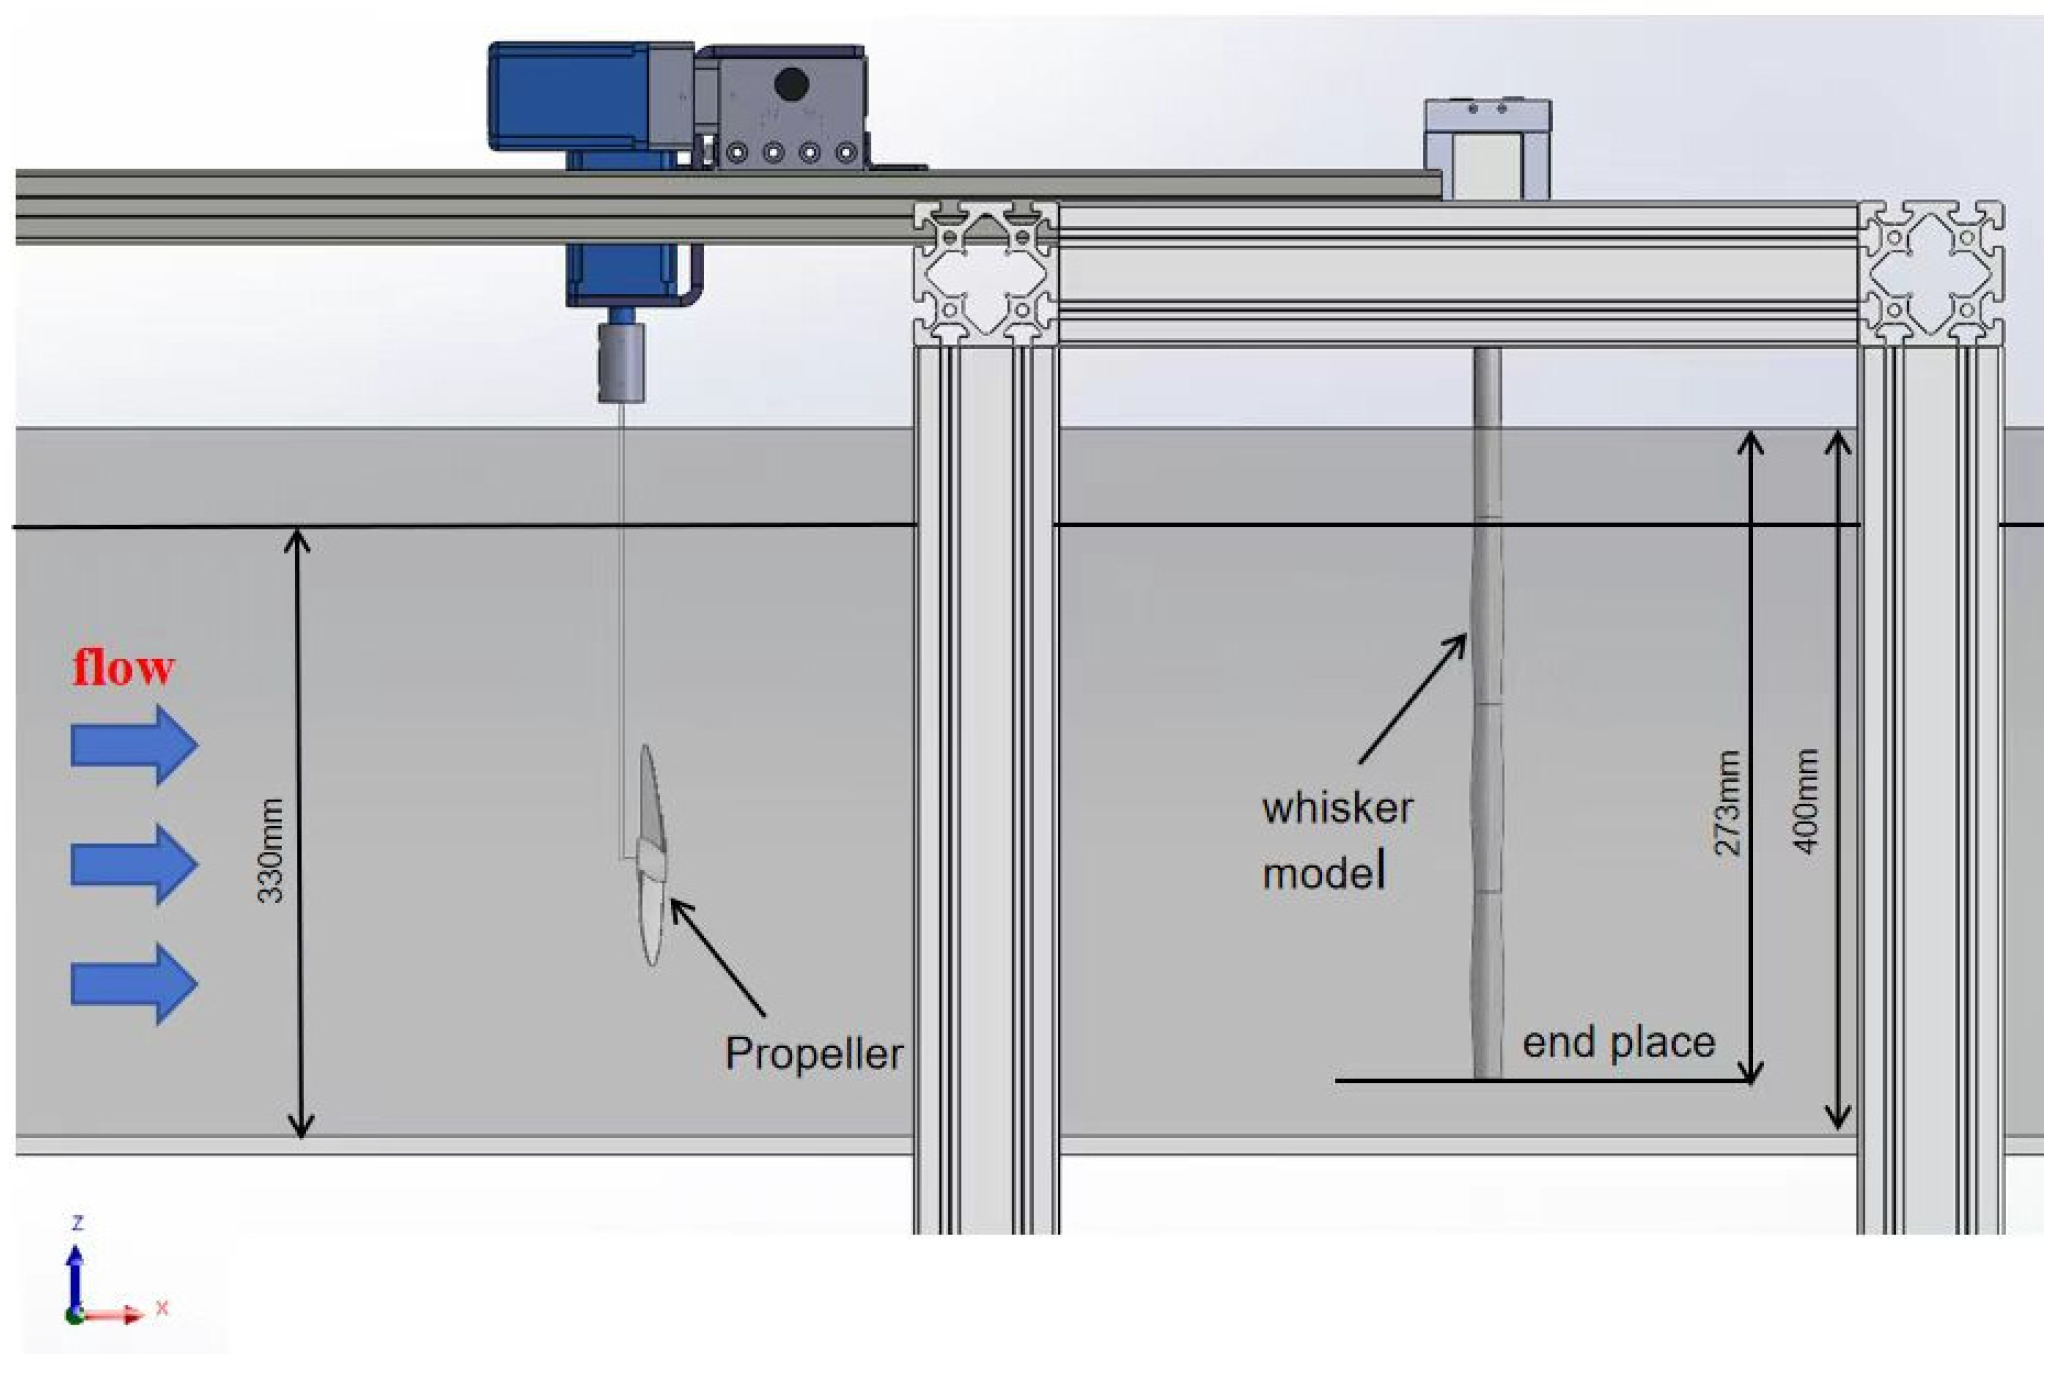
This experiment was conducted in a low turbulence circulating water flume at the Fluid Mechanics Laboratory of Tianjin University. The experimental schematic and model settings are shown in Figure 1. The testing section of the circulating water flume is 400 mm × 306 mm × 2370 mm (height × width × length). The water depth in the flume is maintained at 330 mm, and the flow velocity range covers U∞ = 0.05–0.40 m/s. In this experiment, U∞ = 0.0 m/s, 0.10 m/s, 0.15 m/s, and 0.20 m/s are mainly selected as the main inflow velocity conditions for research. To avoid complex tail vortex shedding, end plates with dimensions of 2 mm × 200 mm × 300 mm (thickness × width × length) were horizontally placed below the whisker model. The propeller is tied to the waterproof motor through a fixed device and placed upstream of the water flume, while the whisker model is placed downstream of the water flume.
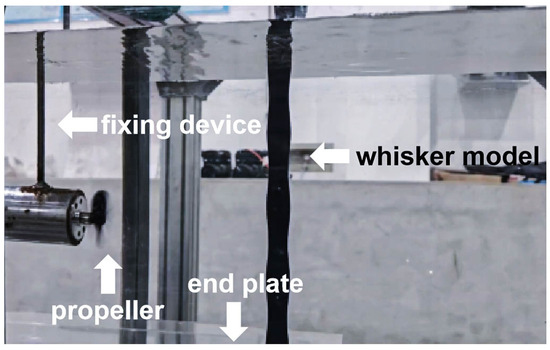
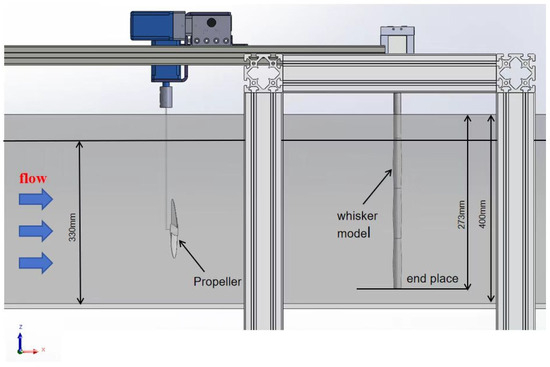
Figure 1.
Physical (upper) and model (lower) images of experimental equipment.
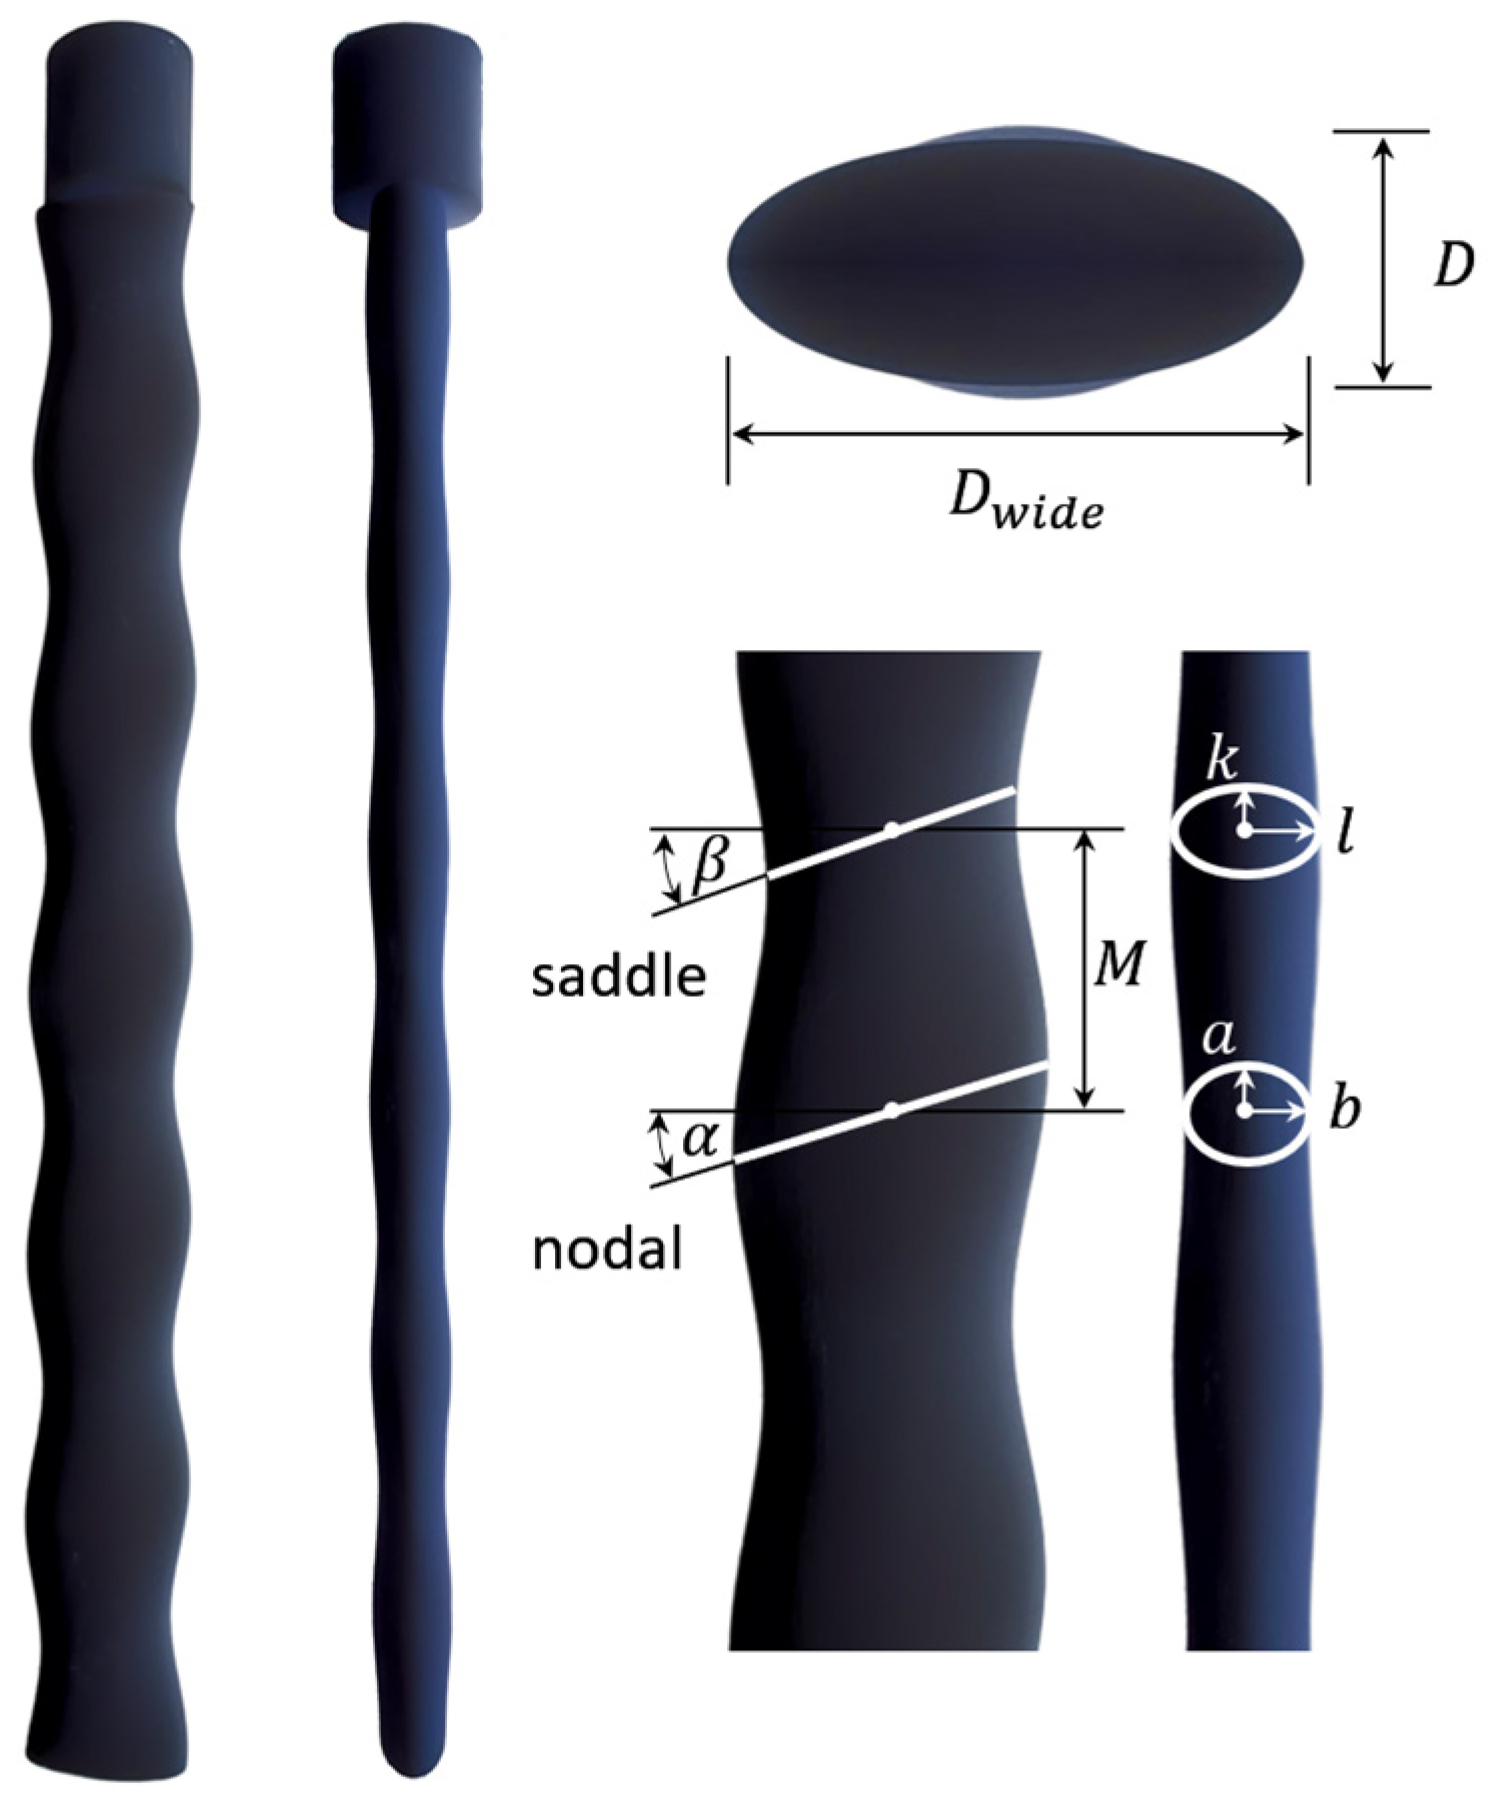
Figure 2 shows the whisker model used in the experiment. The key parameters are the four semi axes (a, b, k, l) of two ellipses, the distance between the two ellipses (M), and the inclination angle of the elliptical surface (α, β). For typical harbor seal whiskers [4], these parameters are reported as: M = 0.91 mm, small ellipse semi axes a = 0.595 mm, b = 0.24 mm, large ellipse radii k = 0.475 mm, l = 0.29 mm, and the tilt angles of the two control ellipses are 15.27° and 17.6°, respectively. Given that marine current velocities typically span 0.05–2.5 m/s, the Reynolds number associated with real seal whiskers lies within the range of 102 to 103. To enhance measurement accuracy and enable detailed hydrodynamic analysis in the laboratory, the whisker geometry was scaled up by a factor of 20, yielding an experimental model with a diameter of D = 16 mm (2 × 10³ < Re < 2 × 10⁴). This scaling ensures that the model operates within the TrSL2 flow regime (1 × 10³–2 × 10³ < Re < 2 × 10⁴–4 × 10⁴), which corresponds to the laminar-to-turbulent shear layer transition, a regime with flow features analogous to those encountered by actual whiskers in the marine environment [22].
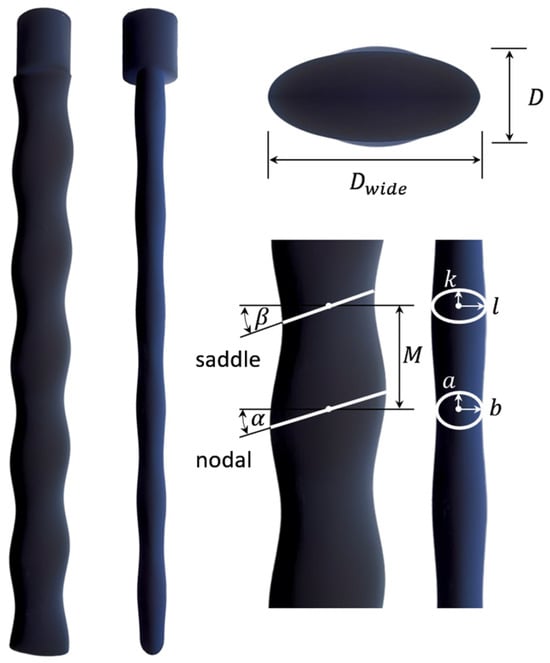
Figure 2.
The whisker model of the harbor seal used in the experiment.
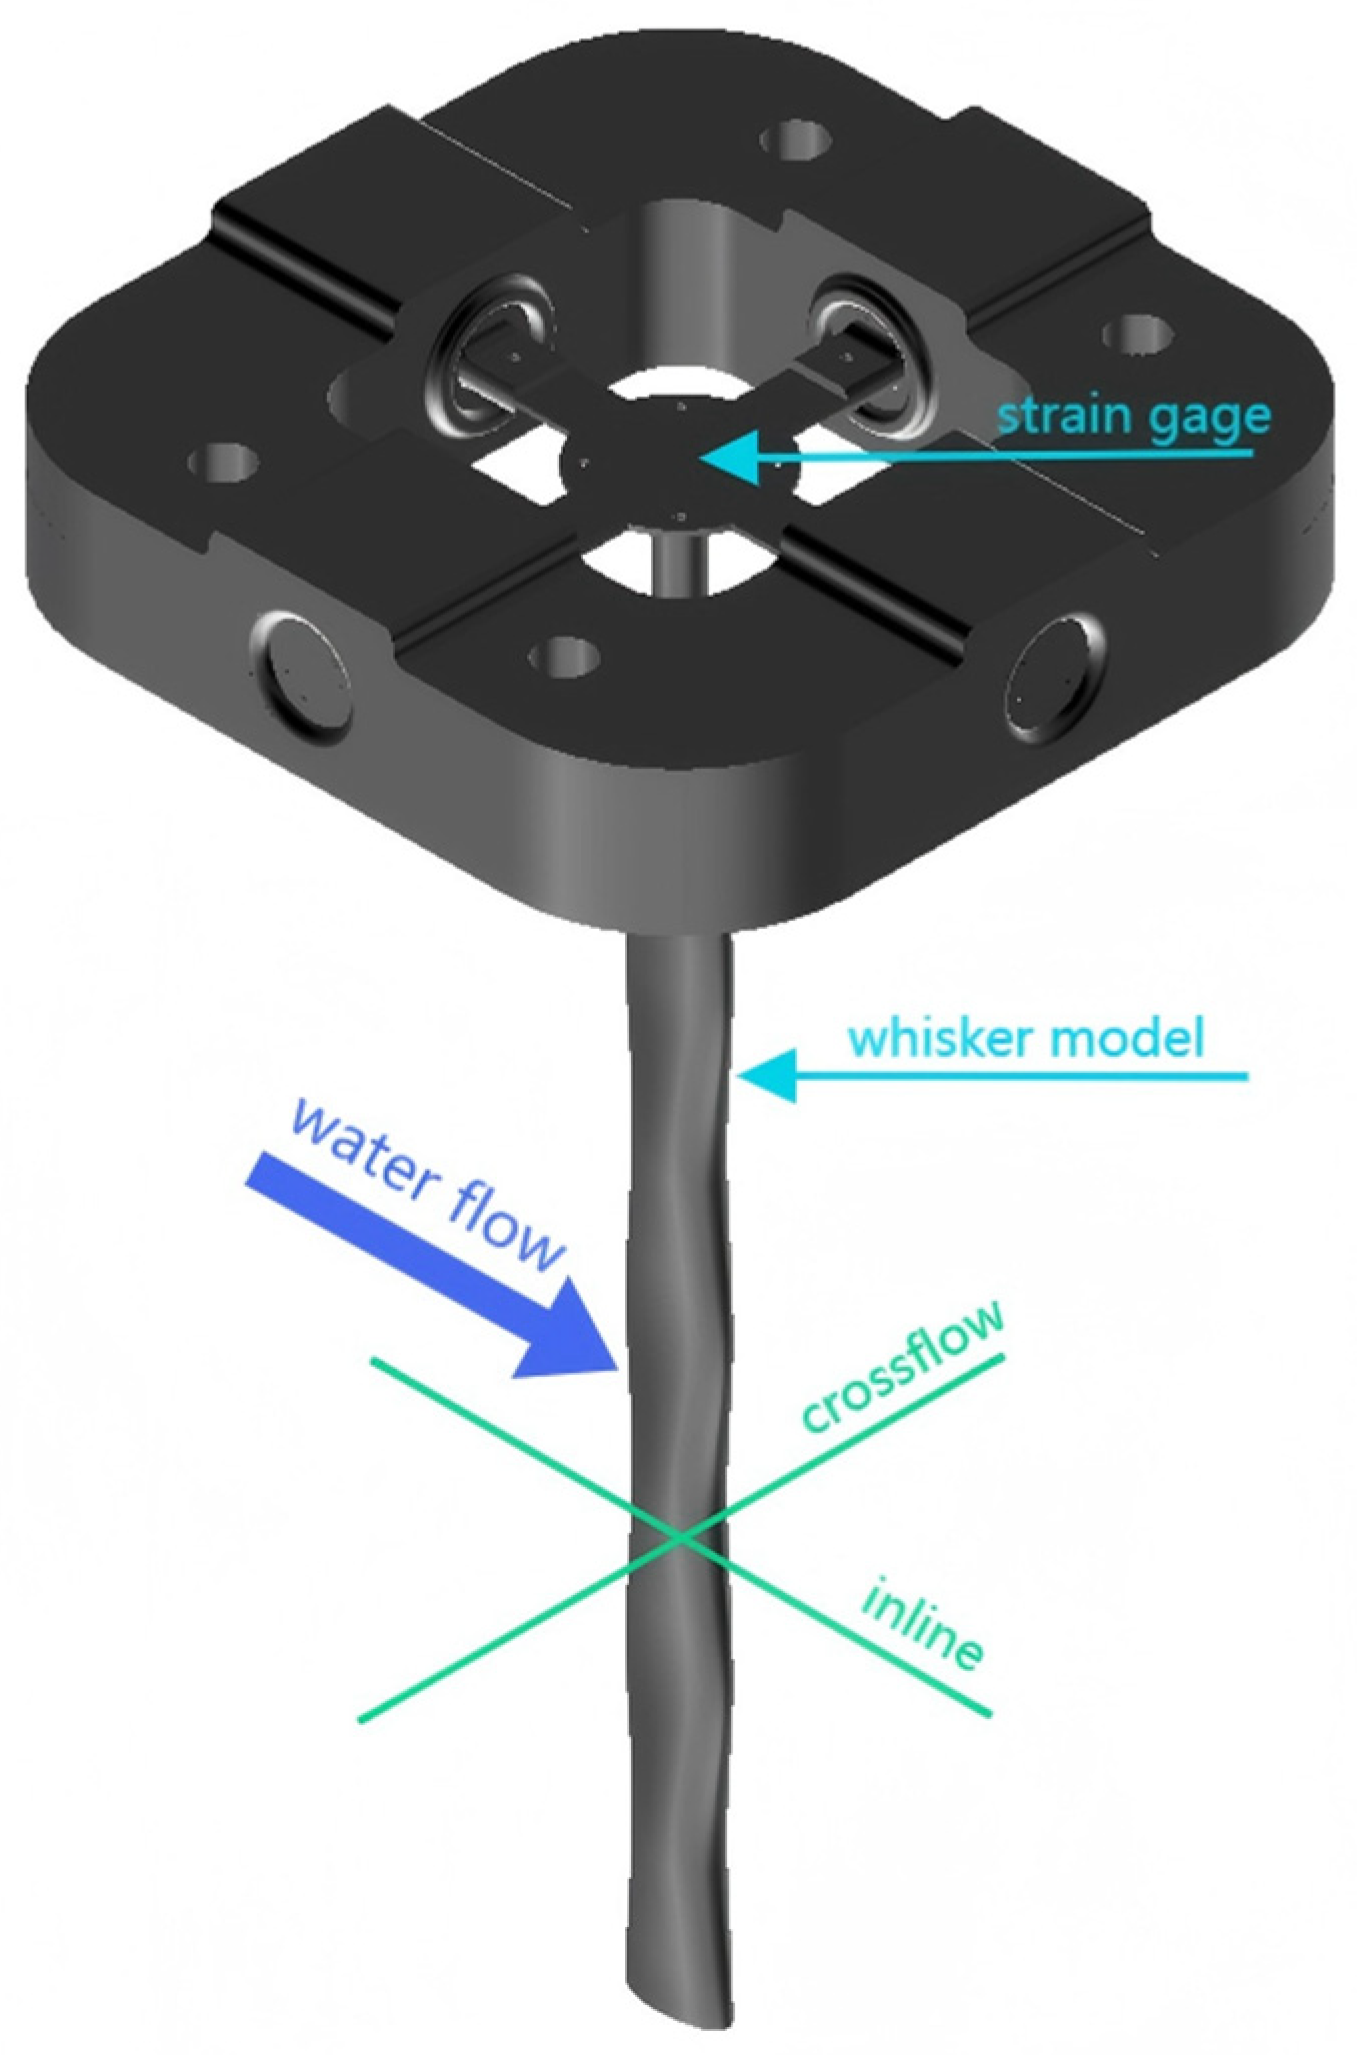
The vibration response of the model within the flow field is measured using a four-limb steel sheet instrumented with strain gauges, as illustrated in Figure 3. Each limb of the steel sheet is connected to a ball bearing mounted on a 3D-printed polymer base. This support system is designed to enable two-degree-of-freedom rotational vibrations of the whisker model, mimicking the vibrissa follicle-sinus complexes (F-SCs) of the harbor seal. The use of ball bearings effectively decouples rotational vibrations in the two directions. As a result, the vibration responses are manifested as bending deformations in the steel limbs, which are captured via the strain gauges. The whisker model is positioned vertically in the water flume, where it is subjected to both propeller-induced and incoming flow. Displacement variations and vibration amplitudes in the flow field can be quantitatively determined through strain analysis. The linear measurement error is specified as ±0.05–2 mm. In our setup, the whisker vibration amplitudes typically exceeded 0.5 mm, which places them well above the sensor’s minimum resolution. The signal-to-noise ratio was further improved through averaging and filtering, ensuring reliable detection of both small and large vibration components, as validated in the previous studies [23,24].
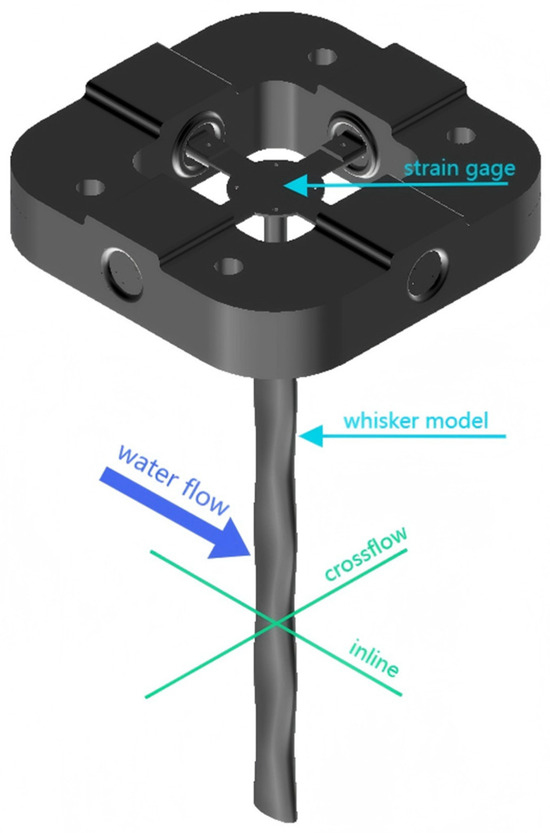
Figure 3.
Diagram of four wall steel plates and whisker model used in the experiment.
Figure 4 shows the three different propellers selected for comparative research in this experiment. The propeller with an outer diameter of Dp = 60 mm is a four bladed propeller, while the propellers with Dp = 80 and 100 mm are three bladed propellers. For these propellers, the same speed conditions were set in this experiment, with the rotational speed Np = 0, 2000, 3000, 4000, and 5000 r/min, to generate a wide range of propeller wake. In this experiment, the separation distance L between the seal whisker model and the propeller was set to be 10, 20, and 30 times the equivalent diameter of the whisker model. The key parameters are summarized in Table 1.


Figure 4.
Three propellers used in the experiment: physical (upper) and model (lower) images.

Table 1.
Key parameters of the NP, DP, U∞, and L/D.
3. Results and Discussion
To investigate how propeller-induced wake strength modulates the dynamic response of a bio-inspired whisker model, vibration characteristics were analyzed against the propeller rotational speed Np (r/min), propeller diameter Dp (mm), incoming flow velocity U∞ (m/s), and separation distance L/D (D = 16 mm). Six primary response parameters were evaluated—mean crossflow vibration, mean inline vibration, rms of both directions, and corresponding dominant vibration frequencies.
3.1. Propeller Rotational Speed
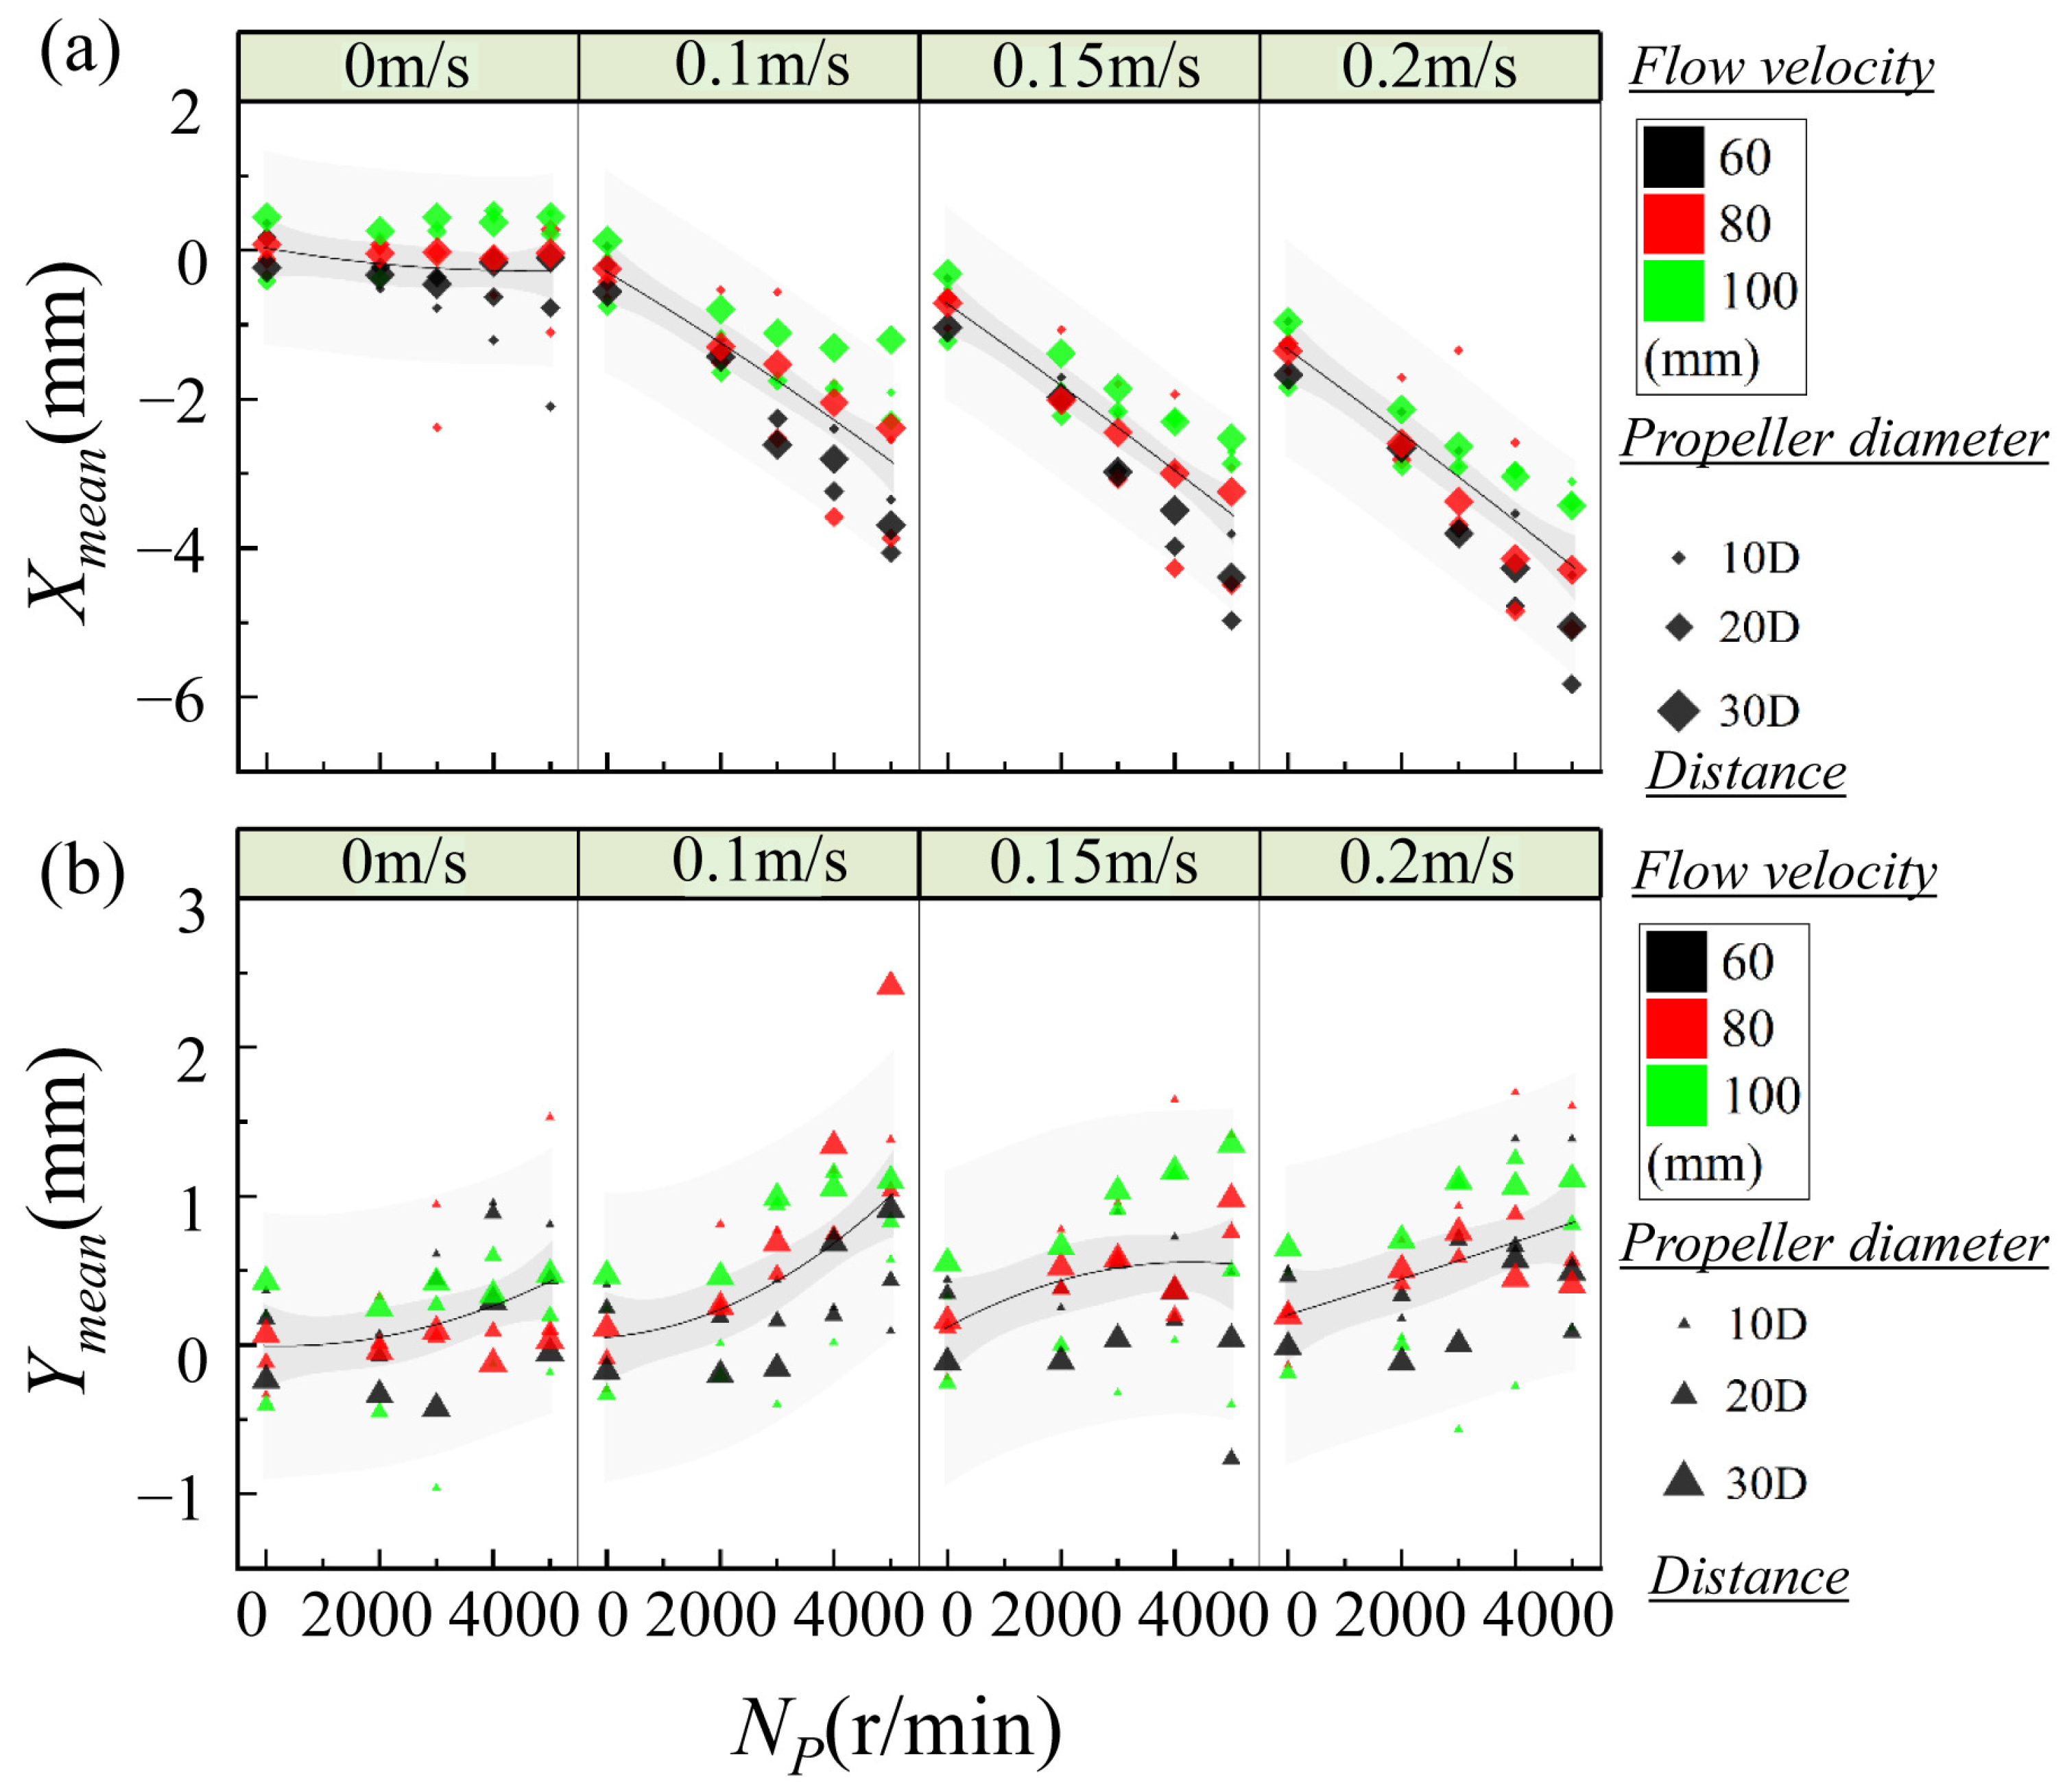
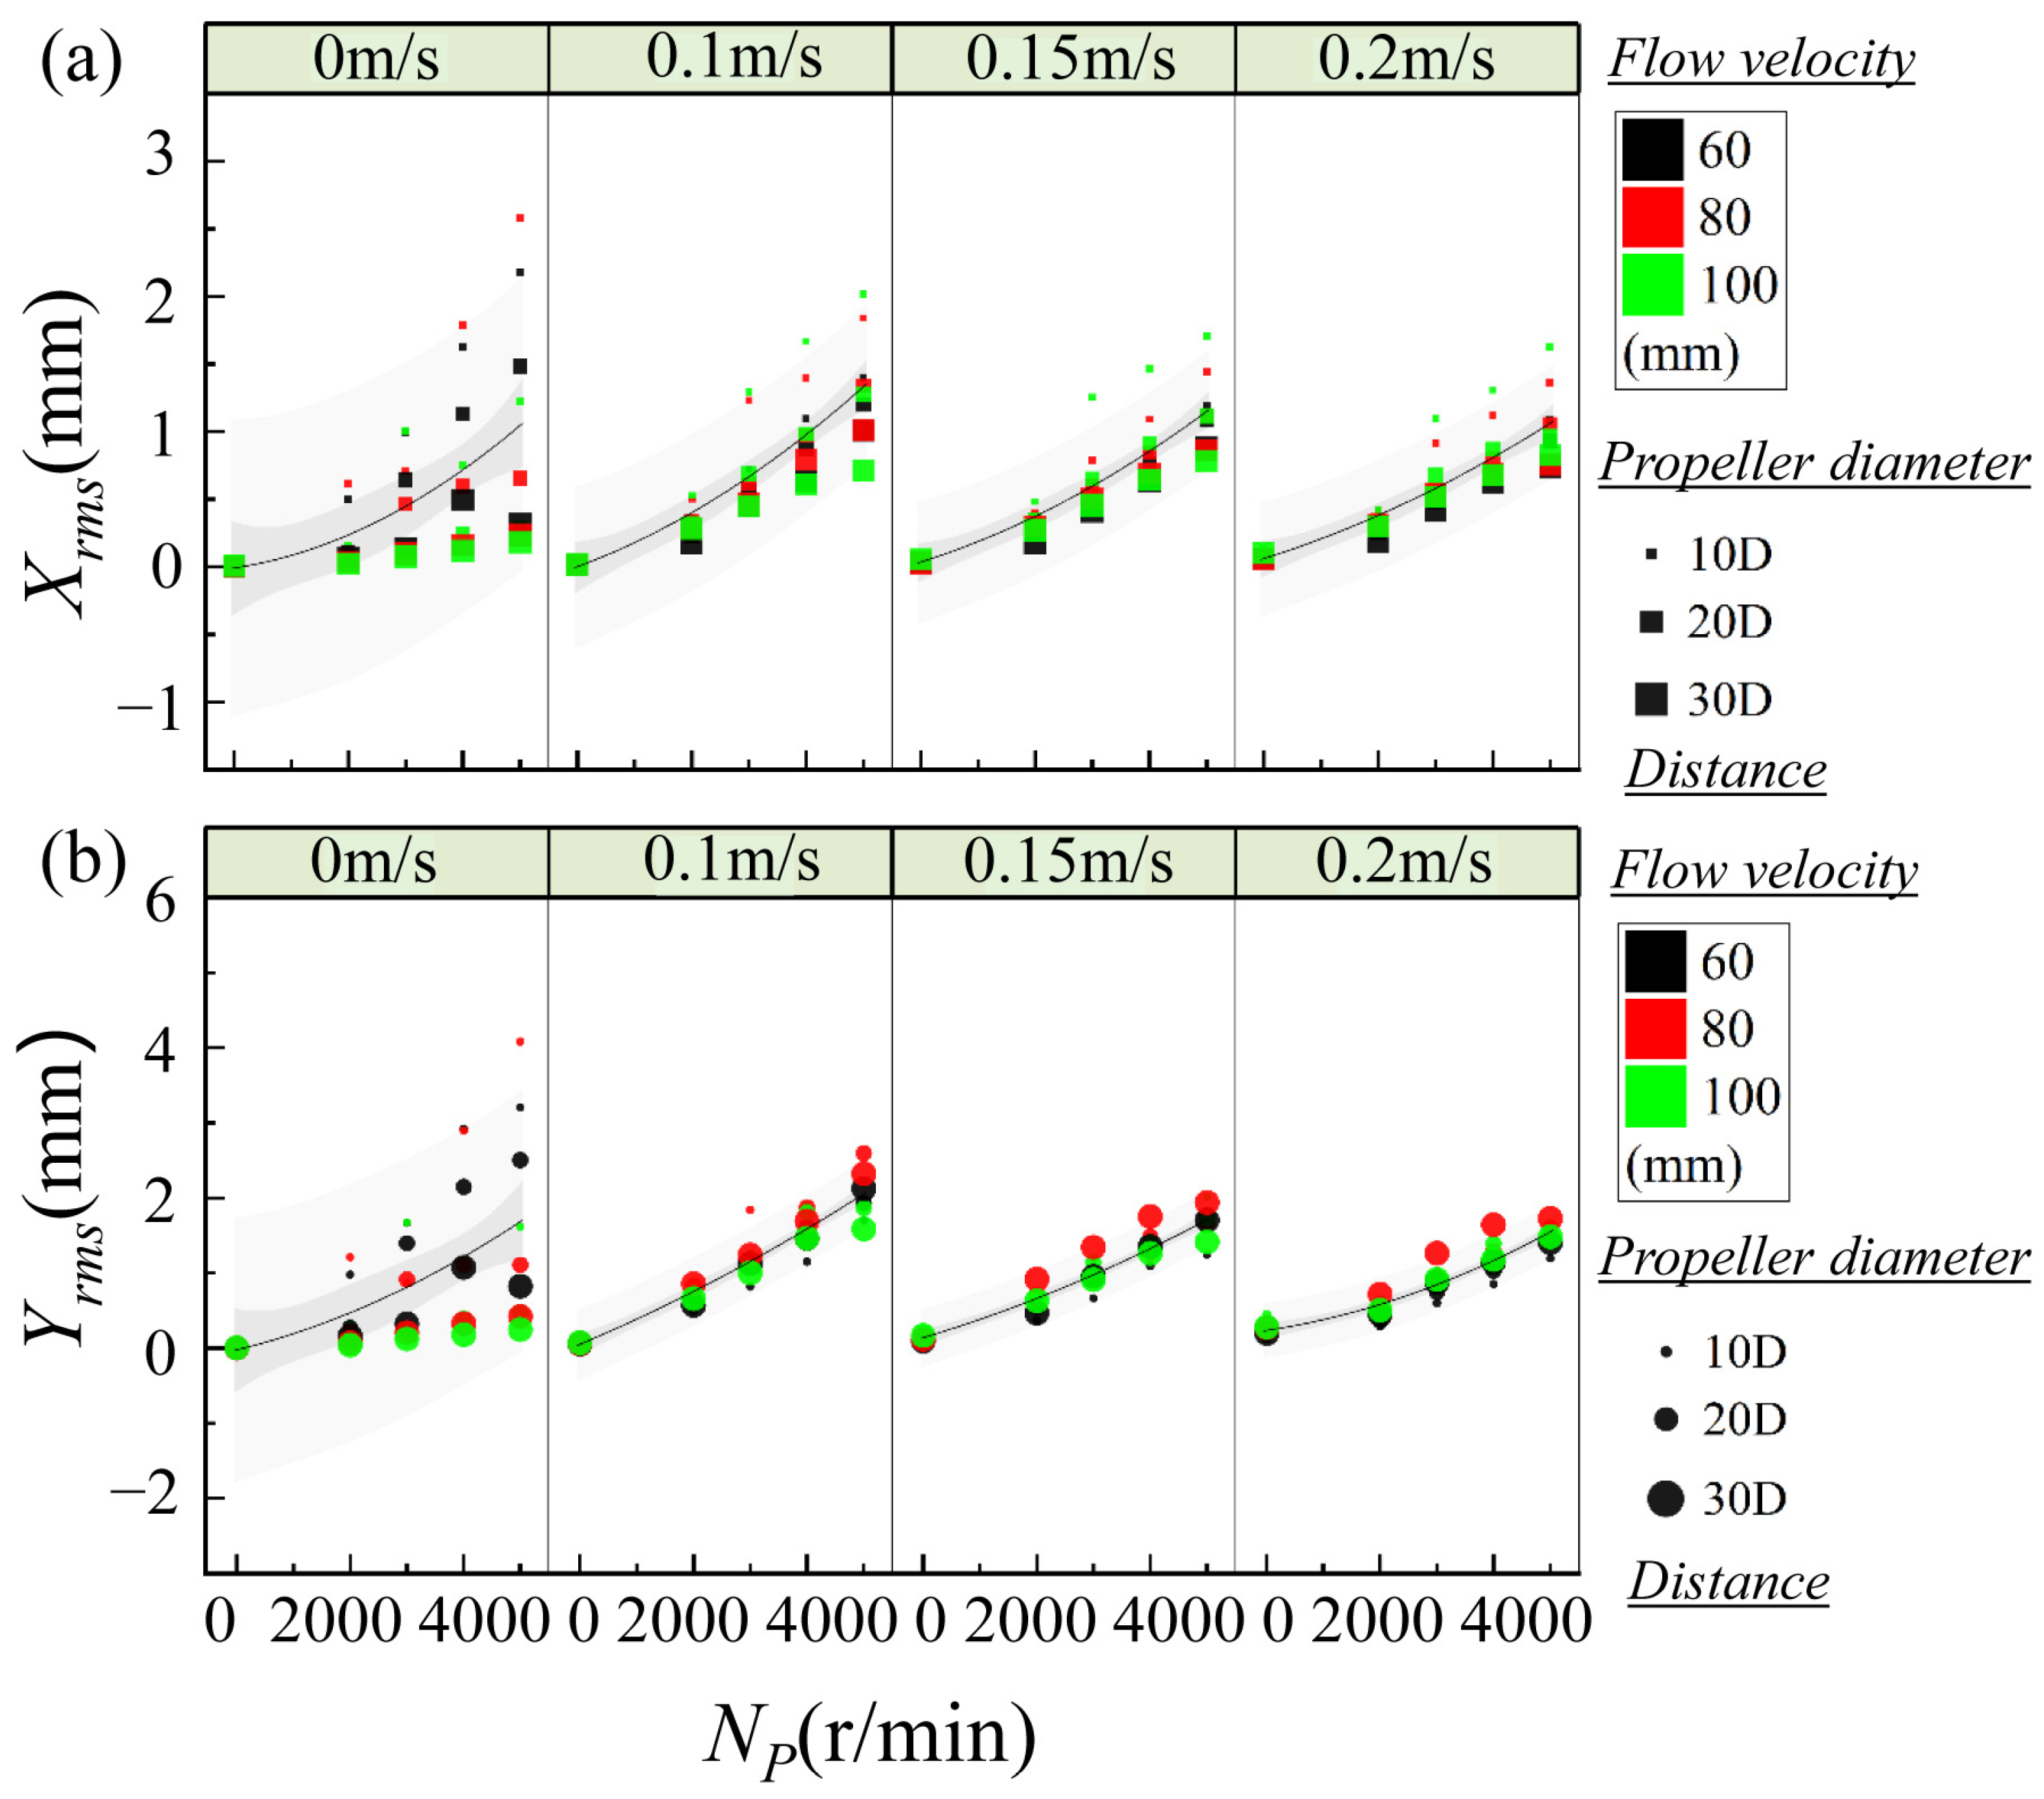
Figure 5 and Figure 6 show the mean and rms inline (IL) and crossflow (CF) vibration amplitudes, respectively, as a function of propeller rotational speed (Np) across different incoming flow velocities (U∞). The scatter symbols are further indexed by separation distance (symbol size) and propeller diameter (symbol color), enabling an integrated view of parametric influences. At stagnant inflow (U∞ = 0 m/s), the mean CF amplitude (Figure 5b) increased steadily from Np = 2000 to 4000 r/min, rising from near zero to ~0.36 mm, before slightly plateauing beyond 4000 r/min. The mean IL vibration showed a similar monotonic increase, becoming prominent above 3000 r/min (Figure 5a). This response, although lower in magnitude, suggests the onset of unsteady axial loading. As shown in Figure 6, rms crossflow vibration rose sharply between 3000 and 4000 r/min, from ~0.01 to nearly 1.0 mm, revealing the threshold where organized wake structures begin to excite the whisker. The rms inline vibration showed a subdued rise but still indicated increasing energy in the inline direction above 3000 r/min. In this condition, without mean flow, wake-induced oscillations of the whisker model are governed primarily by local shear instability and vortex shedding from the rotating blades, as indicated by Di Mascio et al. [9] and Felli et al. [10]. In addition, vortex formation is weak and insufficient to induce significant whisker excitation. Above 3000 r/min, coherent tip and hub vortices begin to form helical wake structures strong enough to drive crossflow oscillations [10]. Inline motion, though weaker, becomes significant as asymmetric suction fields develop near the wake centerline.
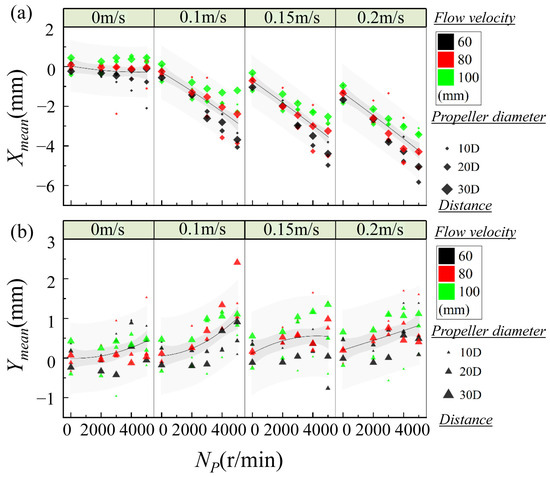
Figure 5.
Mean (a) inline and (b) crossflow vibration amplitudes with propeller rotational speed Np. Four regions are divided by the inflow velocity U∞. The symbol size and color further indicate the separation distance and propeller diameter, respectively. The black line shows the fitting curve for the vibration response with the parameter. The shadows in dense grey and light grey around the fitting curve indicate the 95% confidence and 95% prediction bands, respectively. These captions are same as those in Figures 6, 7 and 10–12.
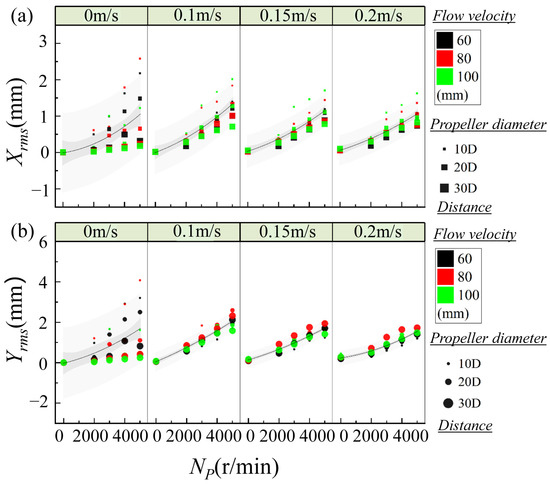
Figure 6.
Root Mean Square (rms) of (a) inline and (b) crossflow vibration amplitudes with propeller rotational speed Np. Same symbol notations as in Figure 5.
As shown in Figure 5 and Figure 6, with incoming flow introduced (U∞ = 0.1 m/s), the effect of the rotational speed on crossflow vibration becomes nonlinear. Ymean remained stable (~0.3–0.4 mm) until 4000 r/min, then increased slightly at 5000 r/min. Xmean decreased progressively from ~0 mm at 2000 r/min to ~−1.5 mm at 5000 r/min. Yrms grew moderately with speed, with a notable step up between 3000–4000 r/min (~0.05 to 1.6 mm). Xrms was relatively small at lower speeds but increased beyond 4000 r/min. The addition of oncoming flow stretches the helical wake, initially dampening vortex coherence. However, as rotational speed increases, the vortex circulation overcomes convective dissipation. The negative inline mean displacement implies increased downstream pull, likely due to suction from stable vortex cores. At moderate inflow(U∞ = 0.15 m/s), Xmean dropped from ~0 to ~−2.0 mm, indicating a stronger suction effect. Ymean increased strongly across the speed range, from ~0.3 to ~0.6 mm. Xrms also showed a sharp rise between 3000–4000 r/min (~0.1 to ~1.0 mm). Yrms rose sharply between 3000–4000 r/min, reaching up to ~1.8 mm. At this moderate inflow, the changes of the whisker response can be attributed to the resonance-like regime as rotational speed induces stronger periodic wake structures. At high inflow velocity condition (U∞ = 0.2 m/s), Xmean declined sharply, reaching ~−2.5 mm. Ymean peaked between 4000–5000 r/min at ~0.7 mm. Yrms increased up to ~2.0 mm at 4000–5000 r/min. Xrms followed a similar trend, plateauing near ~1.2 mm. In this high U∞ condition, the whisker is subjected to rapidly convected, partially destabilized wake structures. Despite reduced interaction time, the magnitude of induced vibrations remains high due to the strength and density of vortex filaments.
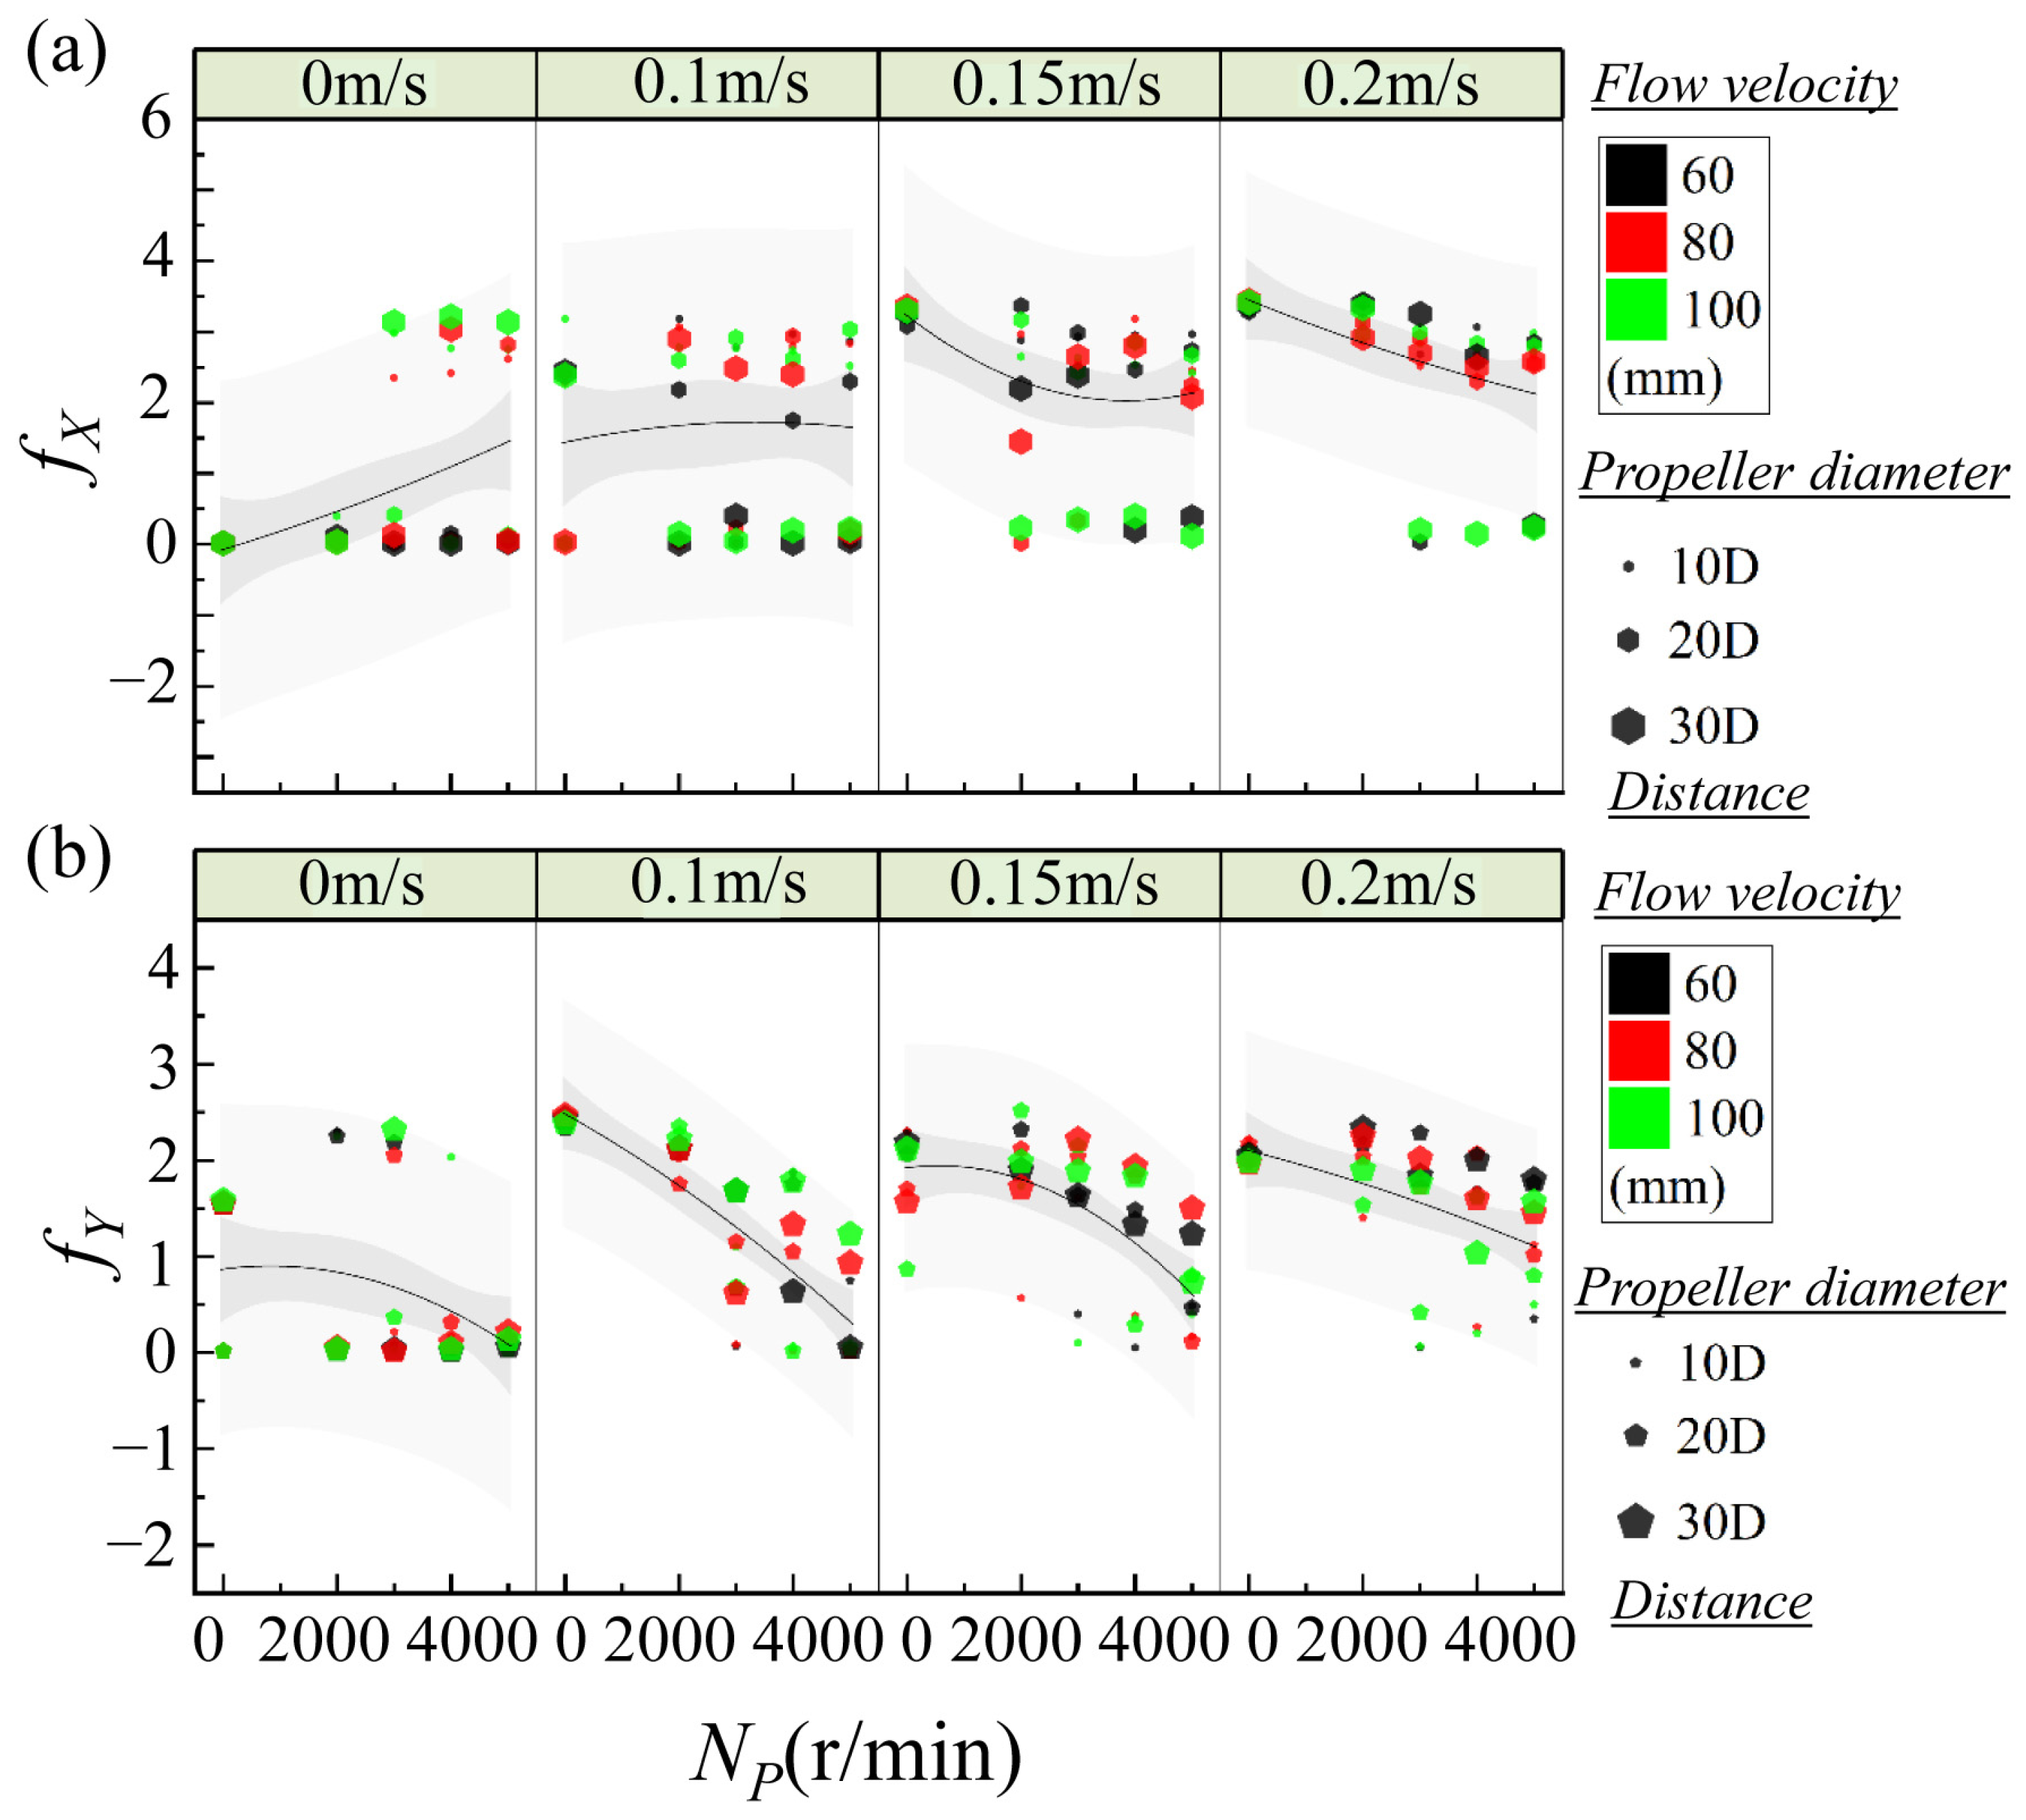
While mean and rms vibration amplitudes offer direct evidence of the whisker’s response energy, analyzing the dominant frequency components provides critical insight into the temporal regularity and resonance behavior of the system. The extracted predominant frequencies from crossflow (CF, fY) and inline (IL, fX) vibrations reveal how the whisker couples with unsteady vortical structures generated by the propeller wake under various flow conditions, as shown in Figure 7. As the rotational speed increases from Np = 2000 to 5000 r/min, a clear upward shift in the dominant frequency of both CF and IL vibrations is observed. For the CF direction, the increase is generally progressive. In contrast, IL frequencies (fX) show more discrete transitions, often locking into the whisker’s natural frequency (fnx = 3.3 Hz) or exhibiting subharmonic components (~0.5 × fnx), depending on wake stability and coherence. As for the propeller size, larger propeller diameter tends to produce stronger and more coherent tip and hub vortices, as also observed by Felli et al. [10], which in turn lead to more sharply defined spectral peaks in both CF and IL directions. The frequency associated with larger Dₚ cases often aligns with either the natural frequencies or subharmonics. Conversely, smaller propellers produce weaker vortices and more distributed frequency content.
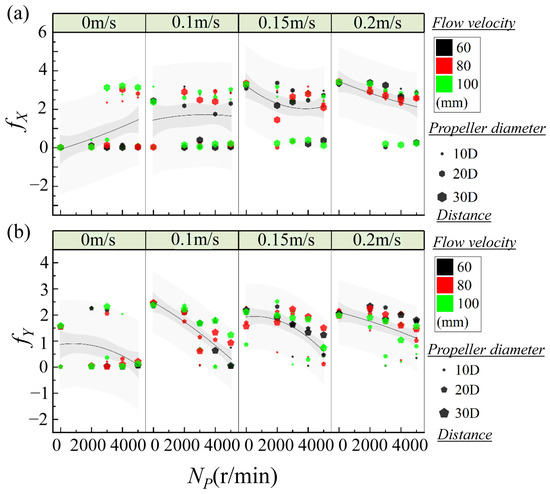
Figure 7.
Predominant frequency of (a) inline and (b) crossflow vibration amplitudes with propeller rotational speed Np. Same symbol notations as in Figure 5.
In Figure 7, for the effect of inflow velocity, at U∞ = 0 m/s, fY was initially low (~2.3 Hz) and rose to ~2.8 Hz by 5000 r/min. fX remained near-zero at 2000–3000 r/min, then showed emergence (~3.3 Hz) at 4000–5000 r/min. At U∞ = 0.1 m/s, fY increased from ~2.4 to ~3.3 Hz. fX remained low until 4000 r/min, then increased to ~3.4 Hz at 5000 r/min. At U∞ = 0.15 m/s, fY stabilized between 3.3–4.1 Hz. fX matched that of CF, reaching ~3.8–4.0 Hz. At U∞ = 0.20 m/s, fY remained stable near ~4.0–4.3 Hz. fX increased to ~3.8–4.0 Hz. To gain insight into the dynamic mechanisms underlying wake-induced vibration (WIV), the observed dominant vibration frequencies were compared to the natural frequencies of the whisker model. For line vibration, inline response shows stronger 1.0 × fnx lock-in behavior than crossflow (∼23% of cases), implying a more frequent coupling to natural axial oscillation modes. The two 0.5 × fnx cases might be linked to global wake pulsations or nonlinear interactions, such as modulation by unsteady blade loading or hub vortex wobble. The broader “Other” category implies that inline vibration is also influenced by nonlinear interactions, possibly including vortex interference and wake reorganization in the near field. For crossflow vibration, only a small subset (~6%) of CF cases show exact resonance (1.0 × fny = 2.6 Hz), and another ~9% correspond to subharmonic excitation at ~0.5 × fny. The majority (83%) fall outside these harmonic bands, suggesting either frequency modulation due to nonlinear wake forcing or responses to broadband excitation. The sparse resonance cases align with structured helical wake interactions, approximately at moderate speeds and distances. Increasing U∞ introduces convective transport, stretching the vortex filaments and often destabilizing their periodicity. For example, at low flow (e.g., U∞ = 0.10 m/s), lock-in behavior (particularly 1.0 × fny) becomes apparent, indicating a favorable synchronization between the wake and the whisker’s natural response. However, at higher flow velocities, frequency peaks tend to broaden and shift slightly upward due to reduced interaction time and vortex fragmentation. For the separation distance (L/D) between propeller and whisker model, at smaller L/D (e.g., 10–20), higher spectral clarity and stronger resonance with natural modes are observed. As L/D increases to 30, both CF and IL frequency spectra become more diffuse, often featuring broadband energy or irregular secondary peaks.
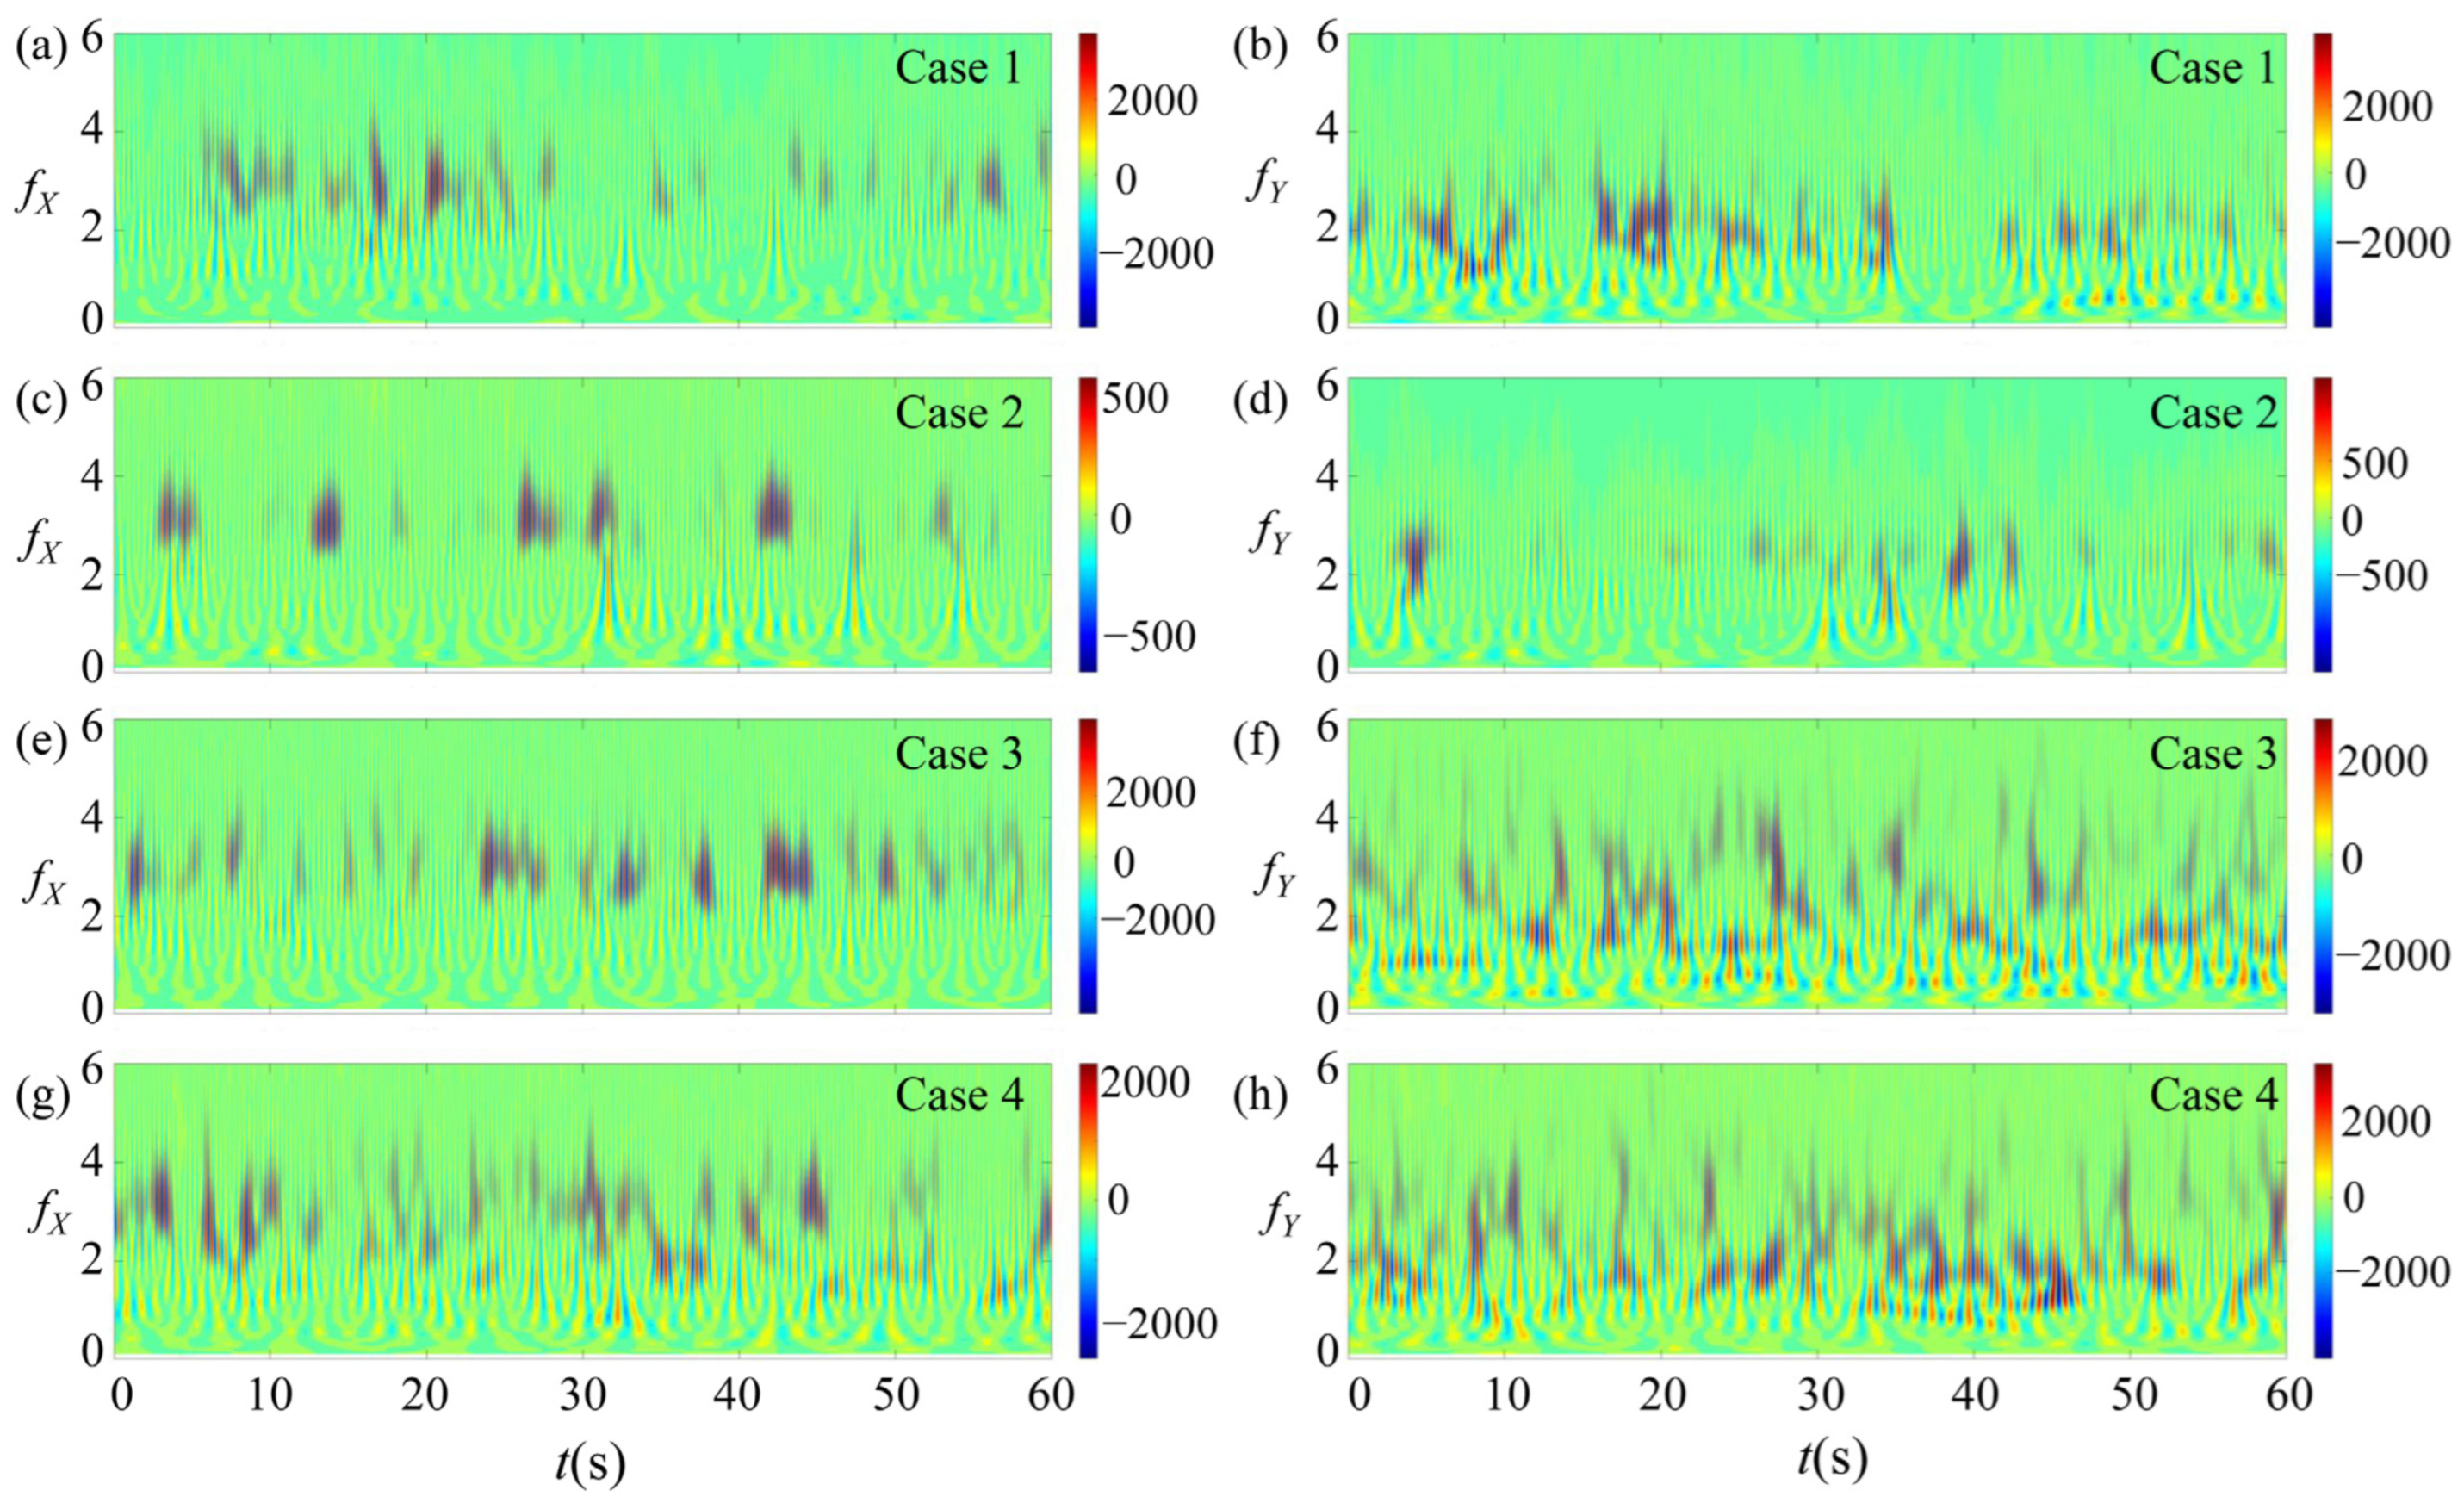
To further explore the evolution and coupling of dominant frequency modes over time, four representative cases were selected based on distinct dynamic transitions observed in both the vibration amplitude and frequency analyses. These cases were strategically chosen to represent key breakpoints in the parameter space: Case 1 (U∞ = 0.00 m/s, Nₚ = 3000 r/min, L/D = 10, Dₚ = 100): Exhibits inline frequency lock-in at 1.0 × fnx in stagnant flow. Ideal for studying wake–whisker coupling in the absence of inflow shear. Case 2 (U∞ = 0.00 m/s, Nₚ = 4000 r/min, L/D = 30, Dₚ = 80): Represents a higher-speed case with longer separation and persistent inline resonance. Highlights effects of spacing on spectral persistence. Case 3 (U∞ = 0.10 m/s, Nₚ = 3000 r/min, L/D = 10, Dₚ = 100): Displays subharmonic CF excitation (0.5 × fny) with strong inline energy, reflecting early-stage vortex pairing in convected wakes. Case 4 (U∞ = 0.10 m/s, Nₚ = 4000 r/min, L/D = 20, Dₚ = 60): Shows subharmonic inline response (0.5 × fnx), possibly indicating slaloming or vortex leapfrogging effects. These cases offer a representative spectrum of behaviors across wake development stages and interaction intensities. Their selection ensures coverage of key response regimes: subharmonic, harmonic (lock-in), and non-resonant behaviors, under both stagnant and flowing conditions. Wavelet transform allows tracking the evolution of dominant frequencies over time, which is particularly valuable for wake-induced vibrations where flow unsteadiness and vortex disintegration can lead to temporal frequency modulation.
Figure 8 presents the time–frequency characteristics of crossflow (CF) and inline (IL) vibrations for four representative cases, as revealed by continuous wavelet transform. Under stagnant flow conditions (U∞ = 0 m/s), Case 1 (Np = 3000 r/min, L/D = 10, Dp = 100 mm) shows a temporally stable IL vibration near the natural frequency fnx = 3.3 Hz, indicating a strong lock-in behavior driven by coherent propeller-induced wake structures. In contrast, the CF component remains broadband and intermittent, suggesting less organized excitation in the transverse direction. As the rotational speed increases in Case 2 (Np = 4000 r/min) and the whisker is moved further downstream (L/D = 30), the IL lock-in at fnx persists, highlighting the robustness of axial resonance even with partial wake dissipation. Meanwhile, CF vibrations in this case display more structured bursts, possibly due to tip vortex roll-up or weak helical coherence. When low incoming flow is introduced (U∞ = 0.1 m/s), the spectral characteristics evolve significantly. In Case 3 (Np = 3000 r/min, L/D = 10, Dp = 100 mm), CF vibrations exhibit dominant frequencies around 1.2–1.5 Hz, corresponding to approximately 0.5 × fny. This subharmonic response may result from vortex pairing or leapfrogging, indicative of unsteady wake behavior influenced by mild convective transport. IL vibrations in this case are less sharply defined, with energy dispersed around 2.5–3.0 Hz, pointing to partial lock-in or modulation from time-varying wake forcing. In Case 4 (Np = 4000 r/min, L/D = 20, Dp = 60 mm), the CF response remains broad but centers around the expected natural range (1.5–3.5 Hz), whereas the IL signal displays subharmonic excitation near 1.5–1.8 Hz—roughly 0.5 × fnx. This behavior suggests a transition from resonance-driven response to slaloming-type motion, likely induced by asymmetric vortex impingement or unsteady hub vortex structures.
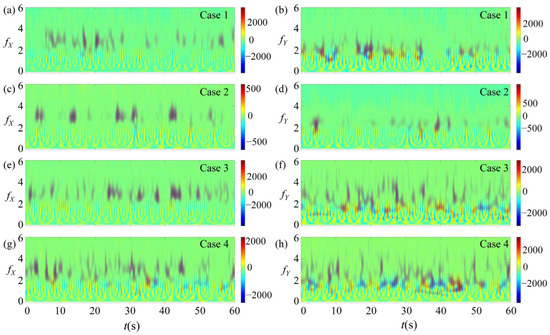
Figure 8.
Wavelet transform spectrum on time t series of inline (right column (b,d,f,h)) and crossflow (left column (a,c,e,g)) vibration amplitudes for four typical cases.
Taken together, the wavelet spectra confirm that vibration frequency content evolves dynamically across different wake interaction regimes. IL vibrations tend to exhibit resonant lock-in with the natural frequency under stagnant or near-field conditions, while CF vibrations more readily engage in subharmonic or non-resonant responses, especially as inflow velocity and wake complexity increase. These observations reinforce the notion that the whisker model’s sensitivity to vortex dynamics depends not only on amplitude thresholds but also on the temporal coherence and spectral alignment of wake-induced forcing.
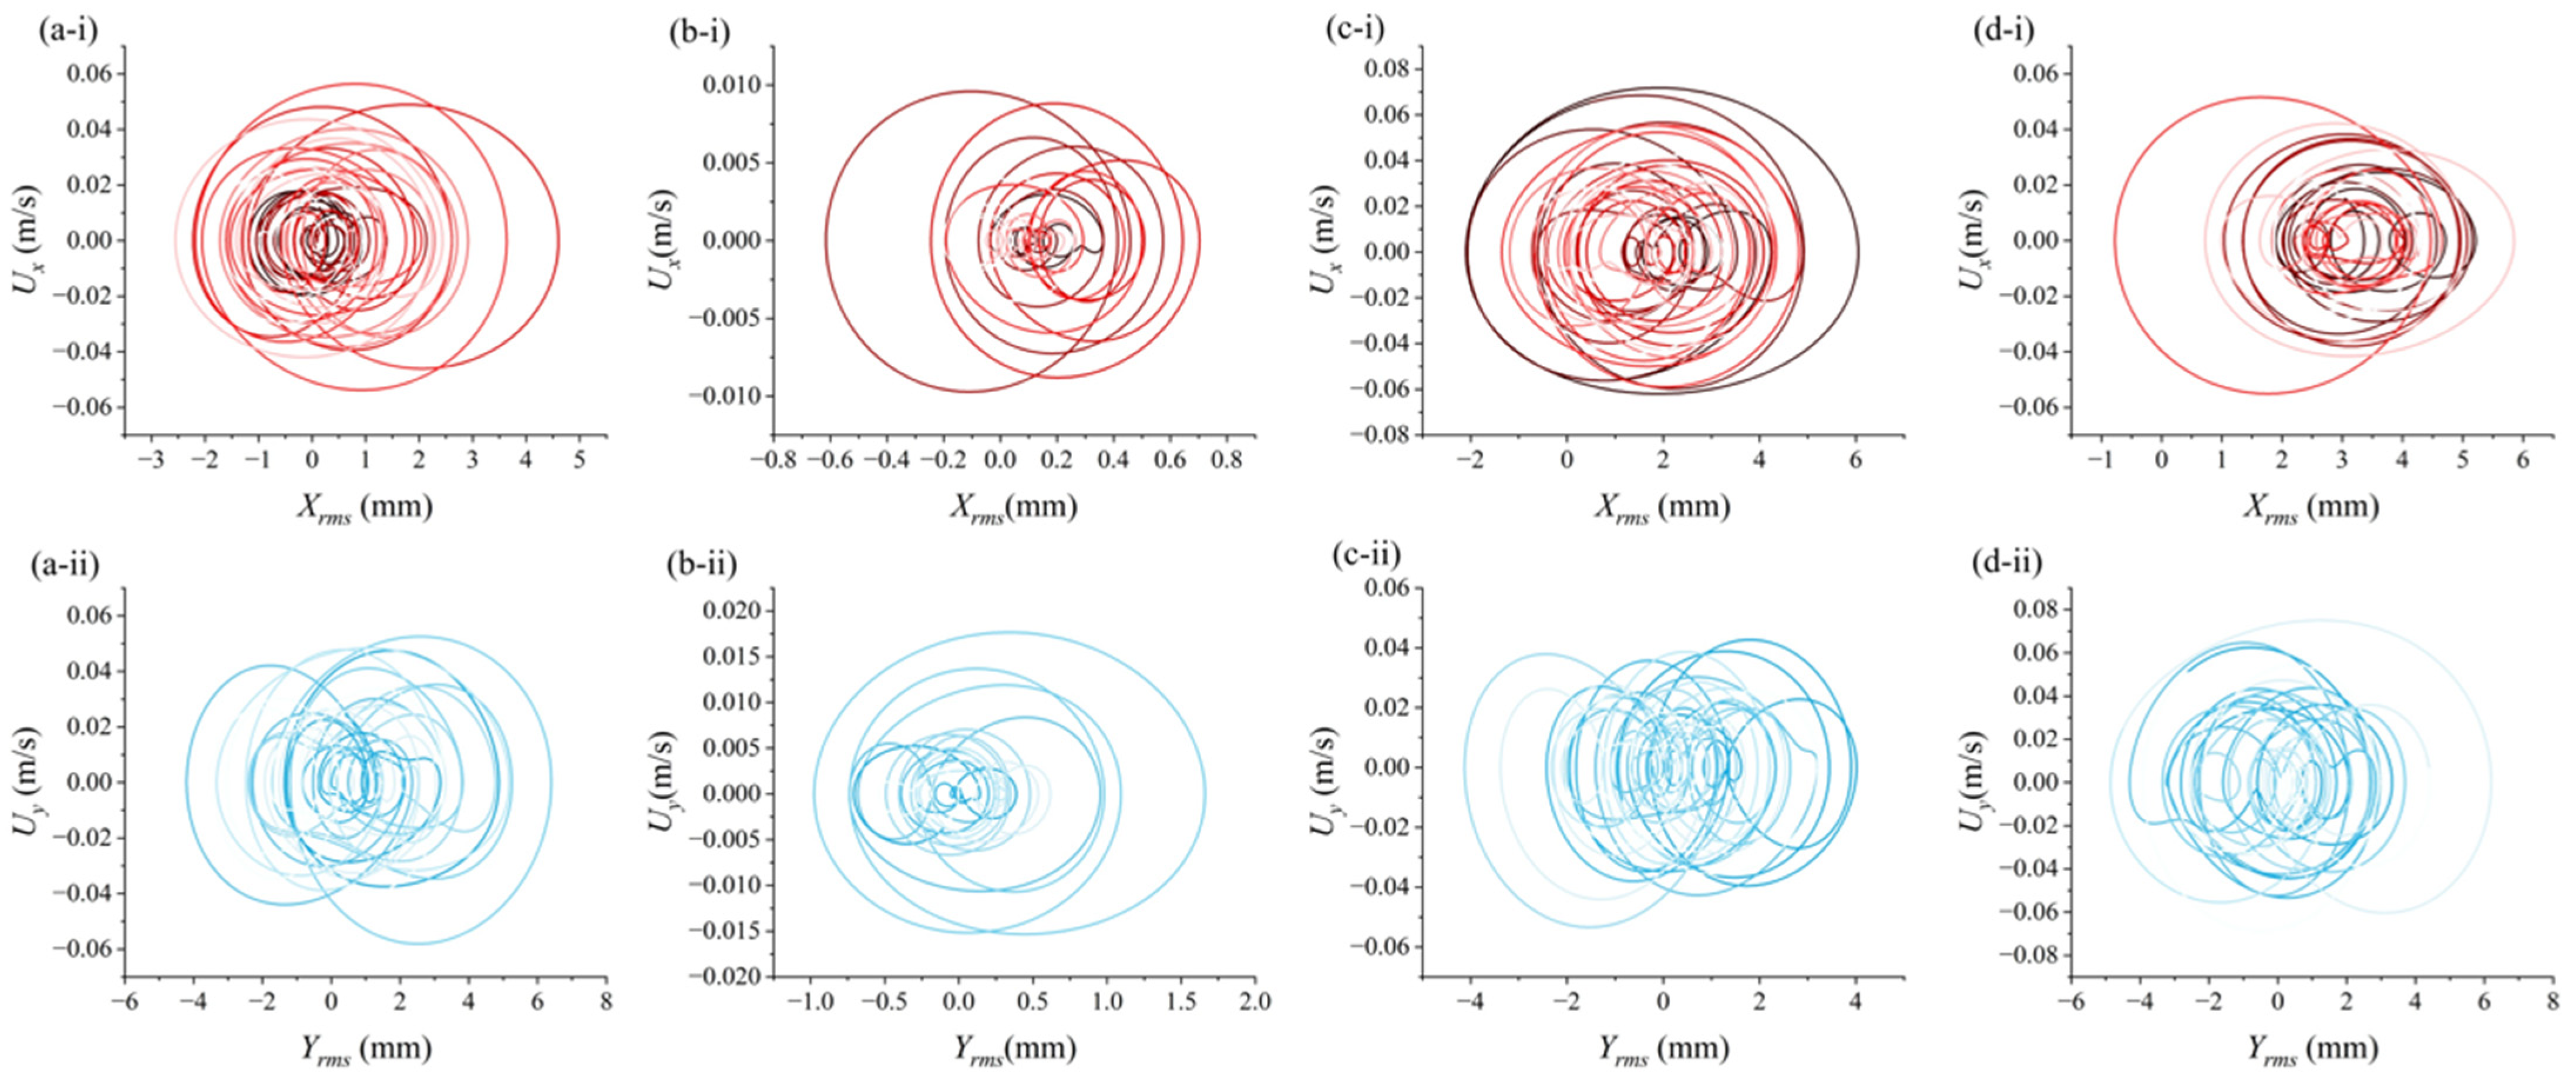
To further elucidate the dynamic stability and qualitative nature of the wake-induced vibration (WIV) responses of the whisker model, phase trajectory analysis was conducted for the inline and crossflow motions of in four representative test cases. Phase trajectories are constructed by plotting the displacement response against its time derivative, effectively visualizing the system’s motion in the phase space, as shown in Figure 9. This approach allows for a qualitative assessment of the vibratory behavior, distinguishing between periodic, quasi-periodic, and chaotic responses. In general, closed and elliptical loops signify stable periodic oscillations; distorted orbits may indicate weak nonlinearity or transition; while irregular, aperiodic patterns are hallmarks of chaotic or turbulent-induced dynamics.
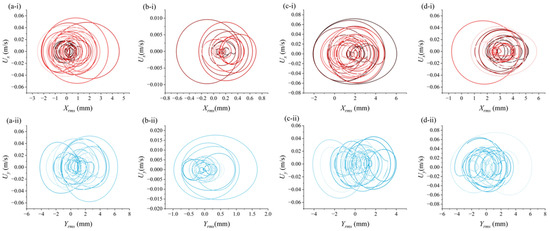
Figure 9.
The phase trajectories of the inline (upper, ‘i’, the colors from black to red on the phase trajectories represent the progression of time)/crossflow (lower, ‘ii’, the colors from light grey to blue on the phase trajectories represent the progression of time) vibration and its time derivative for the whisker model. (a) case 1: U∞ = 0 m/s, Np = 3000 r/min, L = 10 D, Dp = 100 mm; (b) case 2: U∞ = 0 m/s, Np = 4000 r/min, L = 30 D, Dp = 80 mm; (c) case 3: U∞ = 0.1 m/s, Np = 3000 r/min, L = 10 D, Dp = 100 mm; (d) case 4: U∞ = 0.1 m/s, Np = 4000 r/min, L = 20 D, Dp = 60 mm.
As shown in Figure 9(ai,bi), the inline (IL) phase trajectories demonstrate a clear progression in system stability. In Case 1, the trajectory forms a tight elliptical loop, indicating a stable and periodic vibration regime where the coherent wake excites a strong yet bounded response. Case 2, with the same inflow condition but increased propeller speed, longer separation, and a smaller propeller, shows a broader and more diffused orbit. This implies a weakened and less coherent wake reaching the whisker, resulting in reduced amplitude and increased phase variability. In Case 3, the trajectory remains closed but becomes slightly asymmetric, reflecting a shift from wake-dominated periodic forcing to flow-mediated modulation. Finally, Case 4 displays a highly irregular and open phase portrait, signaling instability and likely a transition toward chaotic or multi-frequency vibration driven by wake weakening and turbulent background noise.
As shown in Figure 9(aii–dii), the crossflow (CF) trajectories exhibit a similar evolution. Case 1 again displays a narrow, well-formed loop, characteristic of lock-in with a dominant shedding frequency. In Case 2, the loop expands and loses coherence, consistent with wake decay over longer distances and reduced excitation. Case 3, under moderate inflow, shows a broad but still periodic envelope, whereas Case 4 reveals the most irregular trajectory, suggesting a disordered flow field and reduced wake energy. These patterns align with prior spectral and rms analyses, reinforcing that wake-induced vibration is highly sensitive to both spatial decay and background flow condition, and that phase space mapping provides a clear, qualitative tool to distinguish between coherent, bounded responses and unstable or aperiodic states.
Overall, this phase trajectory assessment confirms that wake coherence and forcing strength diminish with increasing separation and flow complexity, and helps illustrate how vibration stability is modulated across operational conditions even when rms magnitudes alone may not capture such transitions.
3.2. Propeller Diameter
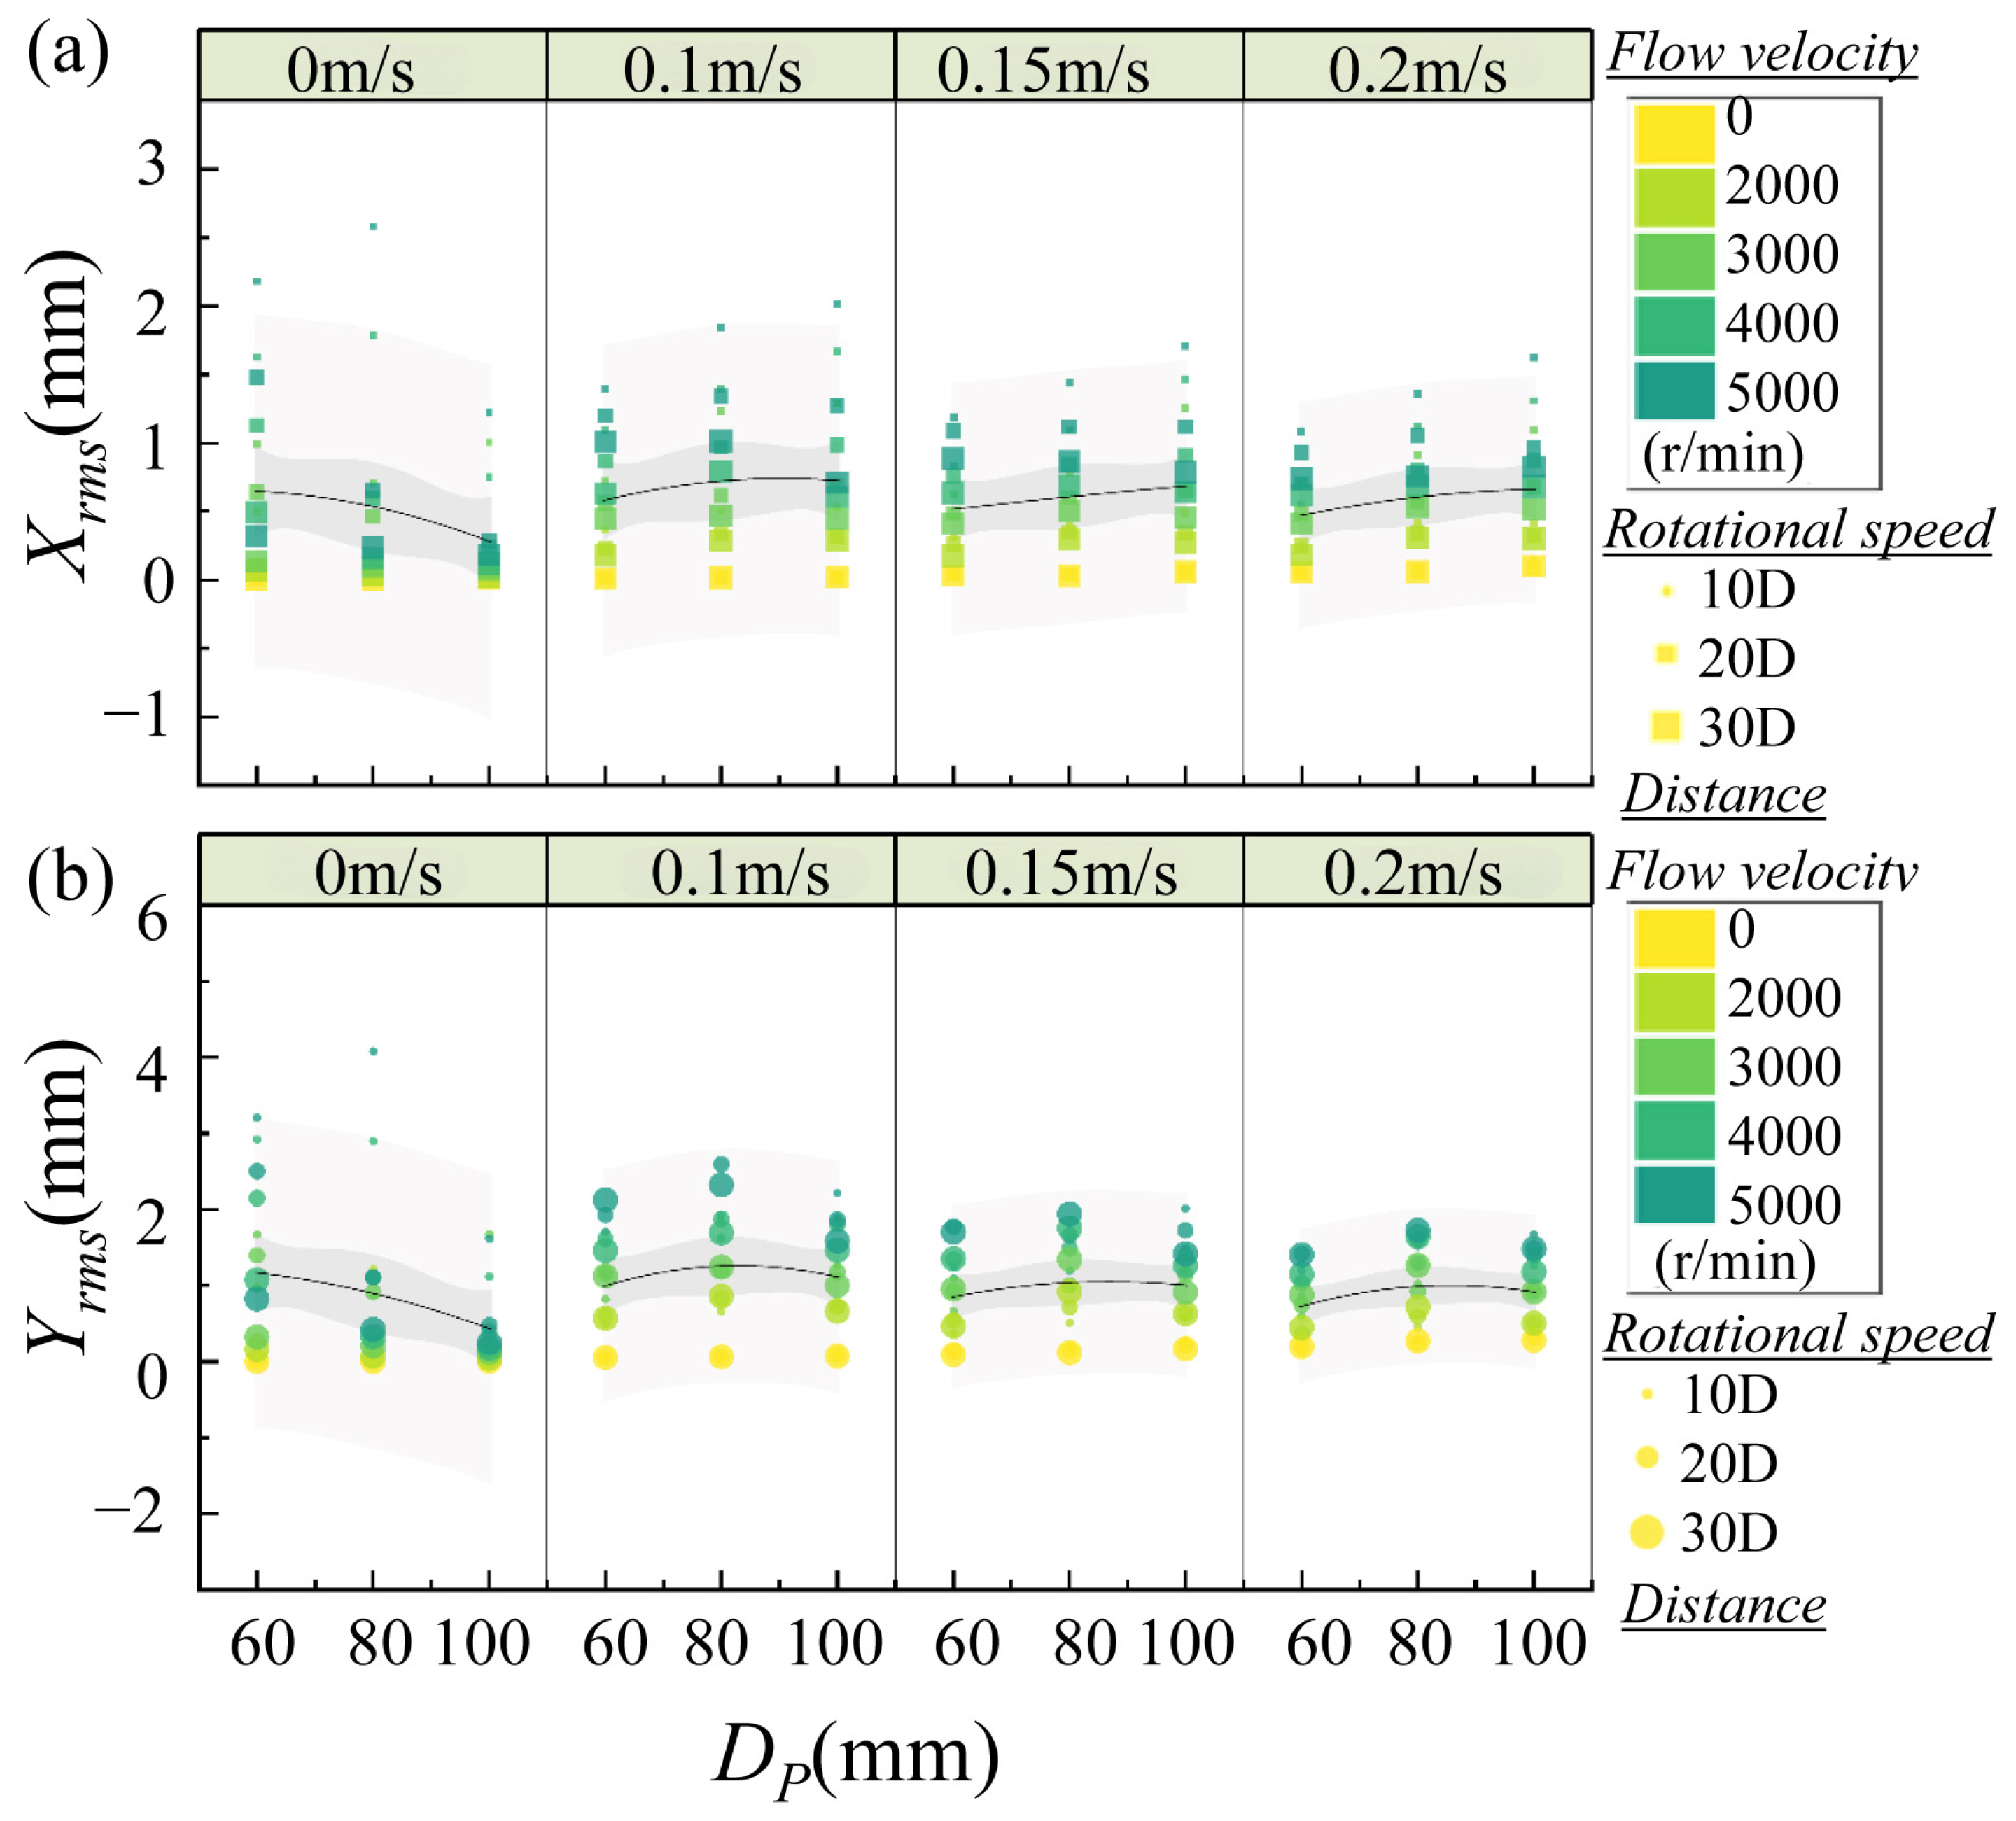
Figure 10 shows the variation in inline and crossflow rms vibration amplitudes of the whisker model with the propeller diameter Dp, in space of flow velocity (four regions), while scatter size and color reflect spacing and propeller rotational speed, respectively. In quiescent conditions (U∞ = 0 m/s), both CF and IL vibration amplitudes exhibit a strong decreasing trend with increasing propeller diameter. Specifically, Xrms drops from approximately 0.65 mm at Dp = 60 mm to around 0.28 mm at Dp = 100 mm, indicating a significant reduction in axial vibration. This decline suggests that smaller-diameter propellers produce more focused, coherent wake structures that impart stronger excitation to the whisker tip, whereas larger propellers generate more spatially distributed wakes that decay more rapidly over distance. A similar trend is observed in CF vibrations (Figure 10b), where Yrms diminishes from ~1.17 mm to ~0.44 mm across the same diameter range. Although the overall amplitudes in the CF direction are higher than in the IL direction, the underlying mechanism of reduced wake coherence with larger propeller diameters holds true. These results indicate that, under stagnant flow conditions, smaller propellers generate more effective near-field perturbations that excite both inline and transverse whisker modes. Under stagnant flow (U∞ = 0 m/s), the pronounced vibration reduction with increasing propeller diameter (Figure 10) originates from geometric constraints on vorticity generation. Smaller propellers (Dp = 60 mm) concentrate higher radial velocity gradient near blade tips due to reduced radial distance. This amplifies vorticity flux, forming compact helical vortices that intensify near-field pressure fluctuations and elevate RMS amplitudes (Yrms = 1.17 mm at Dp = 60 mm). Conversely, larger propellers (Dp = 100 mm) dissipate vorticity through vortex stretching and viscous diffusion, attenuating forcing by >60%.
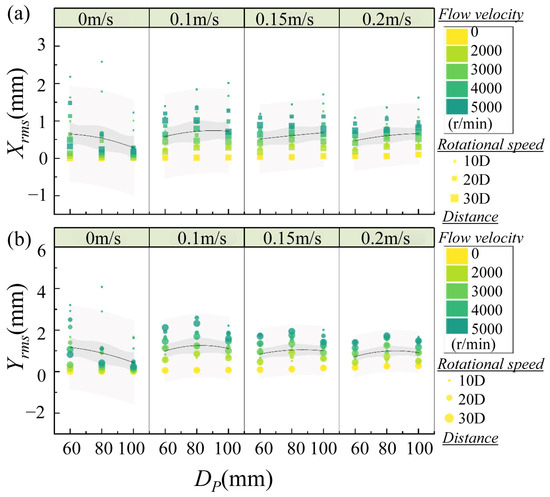
Figure 10.
Root Mean Square (rms) of (a) inline and (b) crossflow vibration amplitudes with propeller diameter Dp. The rotational speed of the propeller and separation distance are indexed by symbol color and size, respectively.
In the presence of a low incoming flow (U∞ = 0.1 m/s), for IL vibrations (Figure 10a), the Xrms exhibits a non-monotonic pattern: increasing from ~0.58 mm at Dp = 60 mm to a peak of ~0.72 mm at Dp = 80 mm. This suggests the emergence of resonance-like conditions where the interaction between convected vortices and the whisker’s natural frequency is maximized at intermediate diameters. At these diameters, the wake may remain sufficiently coherent to impose periodic forcing in alignment with the whisker’s dynamic response. A corresponding non-monotonic trend is also evident in CF vibrations (Figure 10b), where Yrms rises from ~0.99 mm to ~1.26 mm at Dp = 80 mm. The increase points to a potential lock-in or constructive interference mechanism between the propeller-induced wake and the whisker’s transverse modes.
At U∞ = 0.15 m/s, IL vibration amplitudes remain relatively close among the changes of Dp = 60–100 mm. CF vibrations display a sharper transition. Yrms initially rises to ~1.1 mm at Dp = 80 mm and then drops sharply to ~0.47 mm at Dp = 100 mm. This abrupt drop suggests that increasing Dp beyond a threshold causes wake disorganization or phase dispersion, which inhibits coherent vortex impingement on the whisker tip. Similar trends for the IL and CF vibrations are also observed at U∞ = 0.20 m/s. In general, propeller diameter influences rms vibration amplitude in both the IL and CF directions through a combination of wake coherence, spatial structure, and interaction with background flow. While stagnant conditions favor reduced vibration with increasing diameter, the presence of a weak incoming flow introduces a non-monotonic behavior—most notably in the inline response—suggesting enhanced resonance at intermediate diameters.
3.3. Inflow Velocity
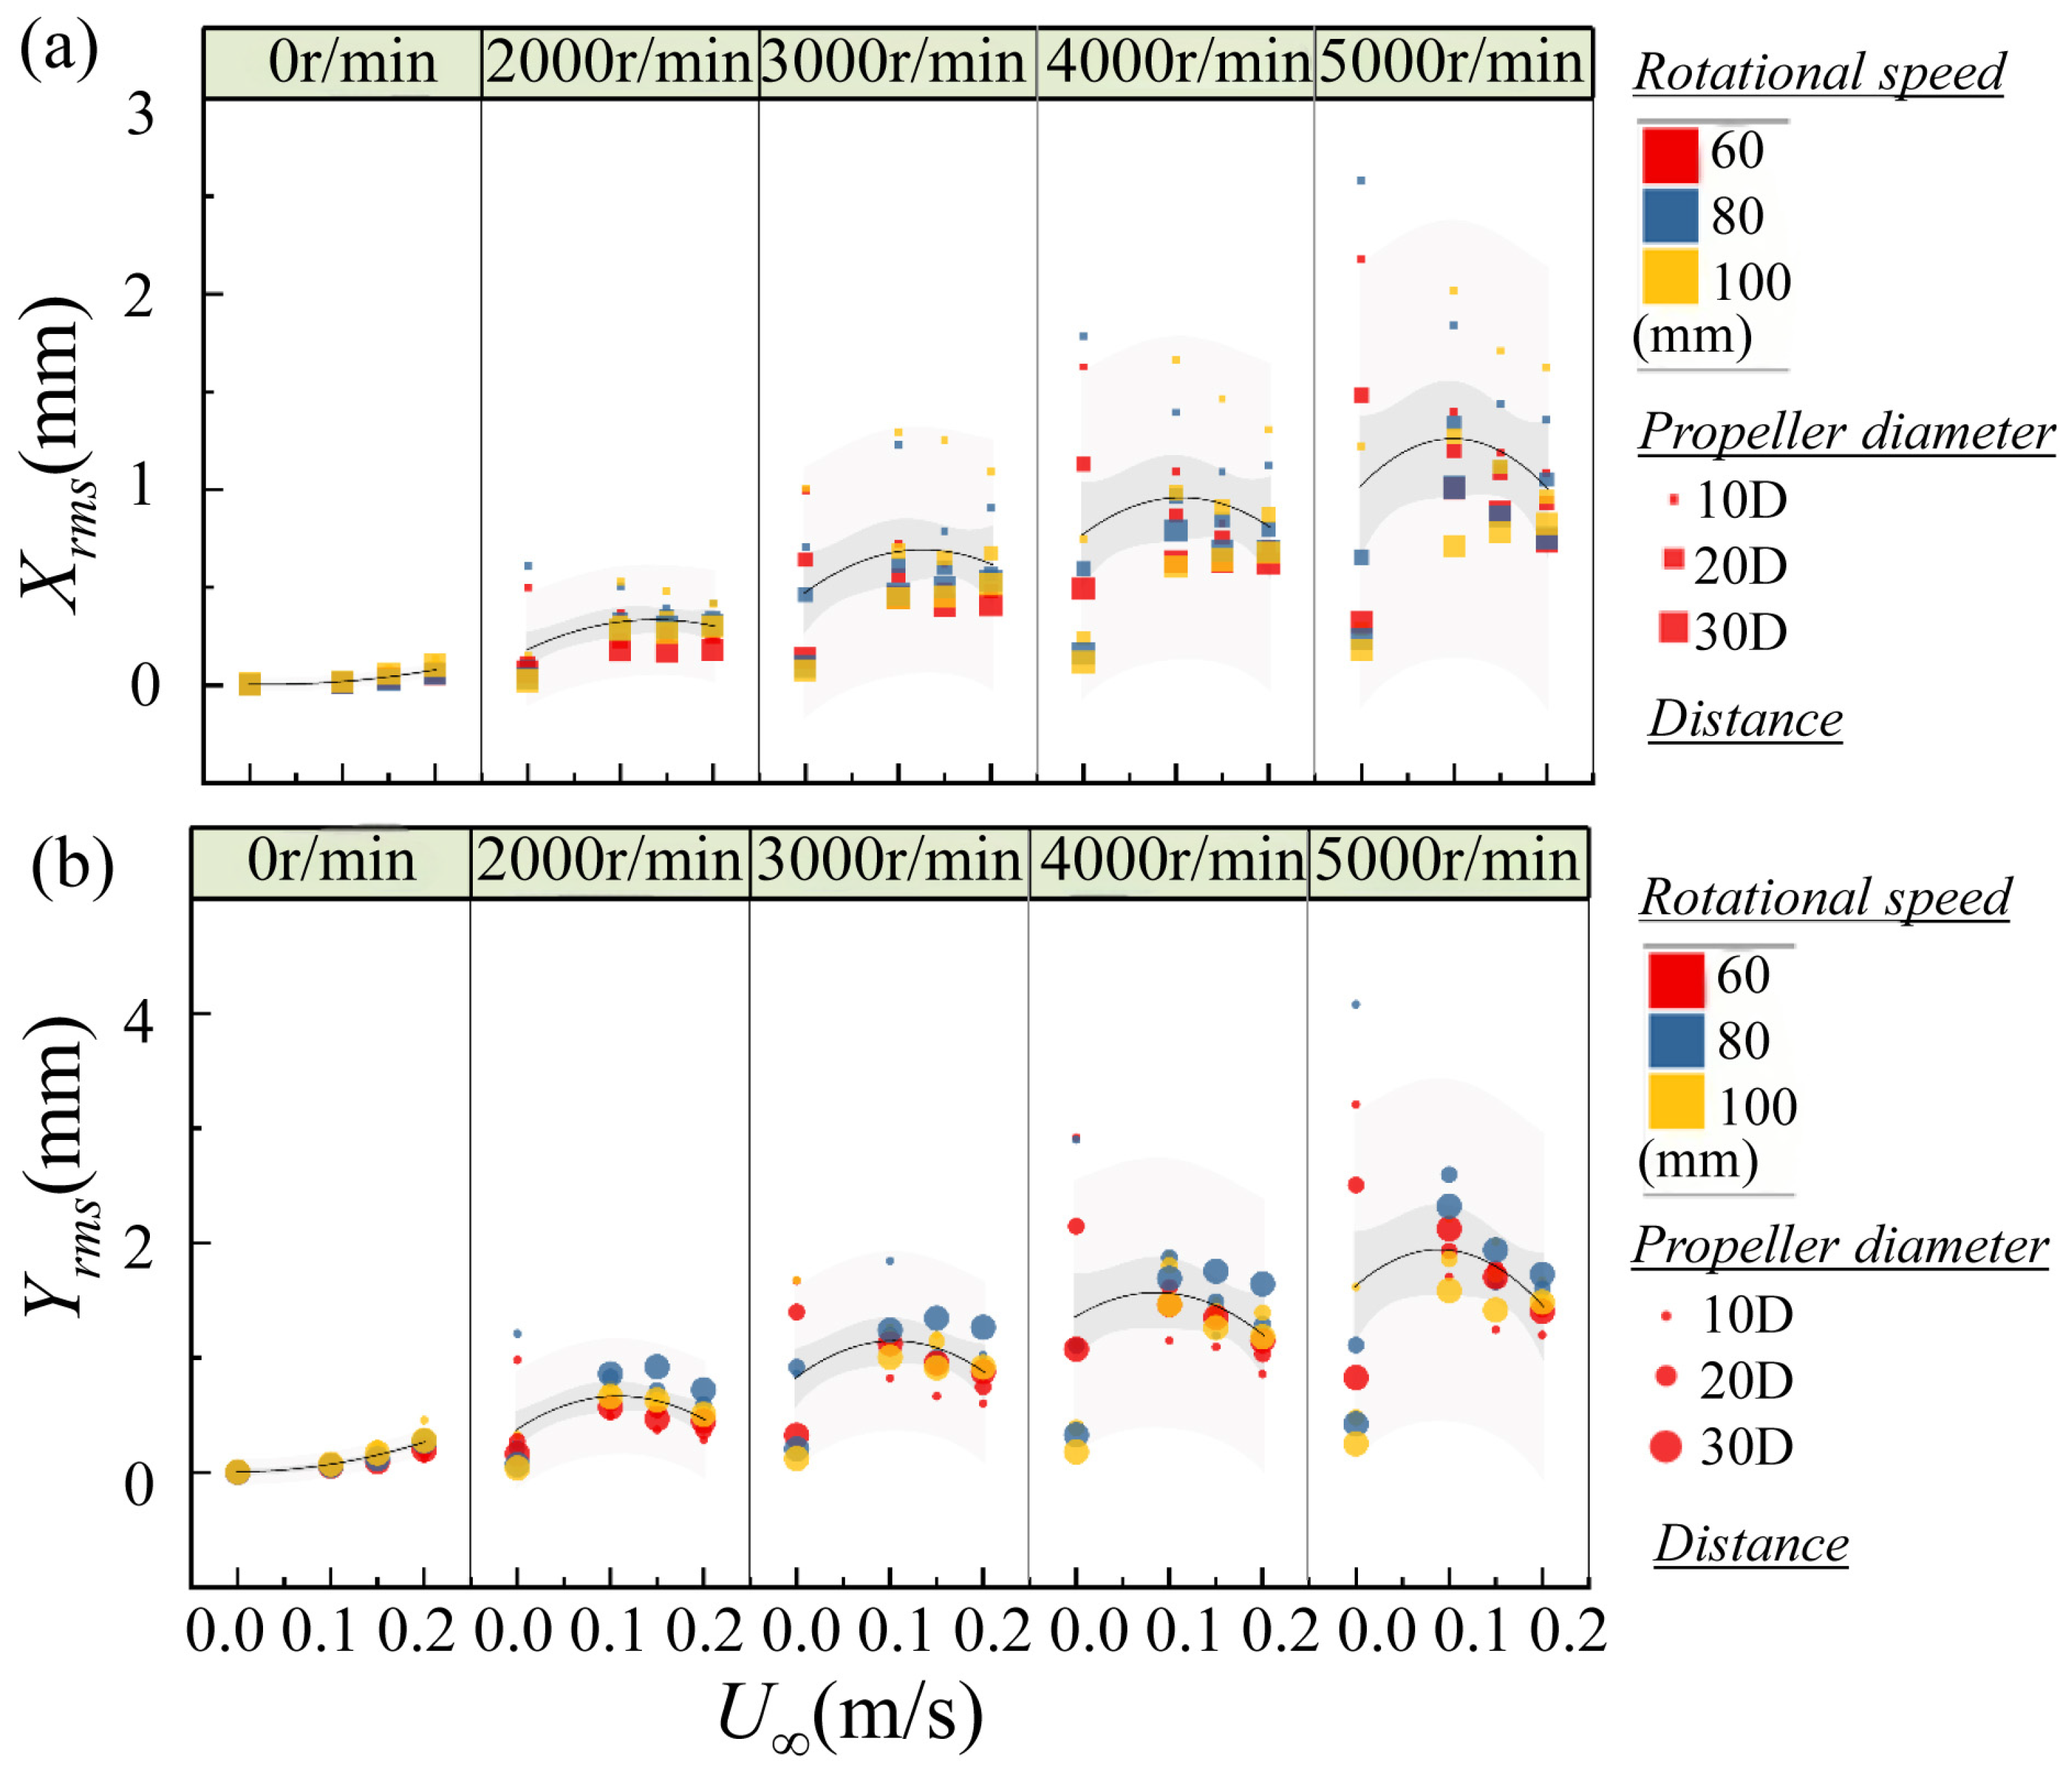
Figure 11a,b show the evolution of inline (IL) and crossflow (CF) rms vibration amplitudes, respectively, as a function of incoming flow velocity (U∞), classified across distinct propeller rotational speeds (Np = 0 to 5000 r/min). The marker size and color encode separation distance (L/D) and propeller diameter (Dp), respectively. At Np = 0 r/min (no propeller rotation), both Xrms and Yrms amplitudes increase steadily with increasing U∞. This reflects the classical behavior of bluff bodies in uniform flow, where vortex-induced vibrations intensify with Reynolds number. CF vibrations grow from ~0.006 mm at U∞ = 0 to ~0.26 mm at U∞ = 0.20 m/s, while IL amplitudes rise more gradually. The magnitude of CF responses far exceeds IL, consistent with the typical dominance of transverse excitation in vortex shedding processes. When the propeller is activated (Np ≥ 2000 r/min), a pronounced amplification of vibration occurs at all flow velocities. For example, at Np = 2000 r/min, Xrms increases from ~0.18 mm (U∞ = 0.00 m/s) to ~0.42 mm (U∞ = 0.20 m/s), while Yrms increases from ~0.37 mm to ~0.83 mm over the same U∞ range. This enhancement is due to superposition between the natural VIV mechanism and unsteady wake structures generated by the rotating blades, particularly tip and hub vortices [9], which provide persistent excitation across both vibration directions.
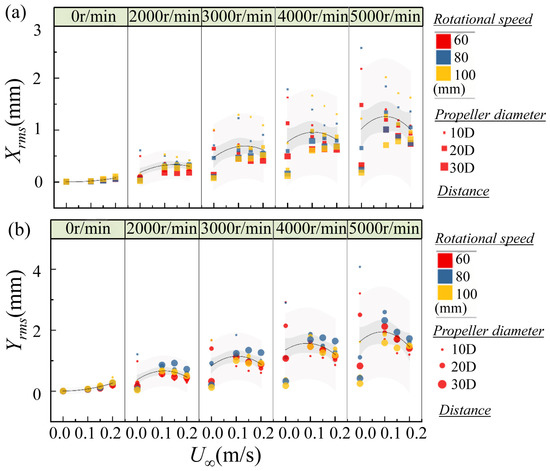
Figure 11.
Root Mean Square (rms) of (a) inline and (b) crossflow vibration amplitudes with inflow velocity U∞. Four regions are divided by the propeller rotational speed NP. The symbol color and size indicate the propeller diameter and separation distance, respectively.
In Figure 11, at higher rotational speeds (Np = 3000–5000 r/min), the IL and CF vibration levels increase even more substantially, particularly at moderate inflow velocities (U∞ = 0.10–0.15 m/s). This may reflect the optimal synchronization between the convected propeller wake frequency and the natural frequencies of the whisker model. Under these conditions, lock-in phenomena or resonance can occur, leading to peak rms amplitudes. Beyond U∞ ≈ 0.15–0.20 m/s, however, the growth in vibration amplitude appears to plateau or slightly decrease for some configurations, likely due to wake dispersion and background turbulence disrupting coherence and reducing effective forcing.
Across all propeller speeds, larger propeller diameters (color scale) generally correlate with slightly reduced vibration amplitudes, especially at higher U∞, likely due to broader and less concentrated wake structures. In summary, rms vibration amplitudes in both IL and CF directions generally increase with incoming flow velocity, but the magnitude and growth trend are strongly modulated by propeller rotational speed. The coupling between background flow, wake coherence, and structural resonance governs the strength and nature of whisker excitation.
3.4. Separation Distance Between the Propeller and Whisker Model
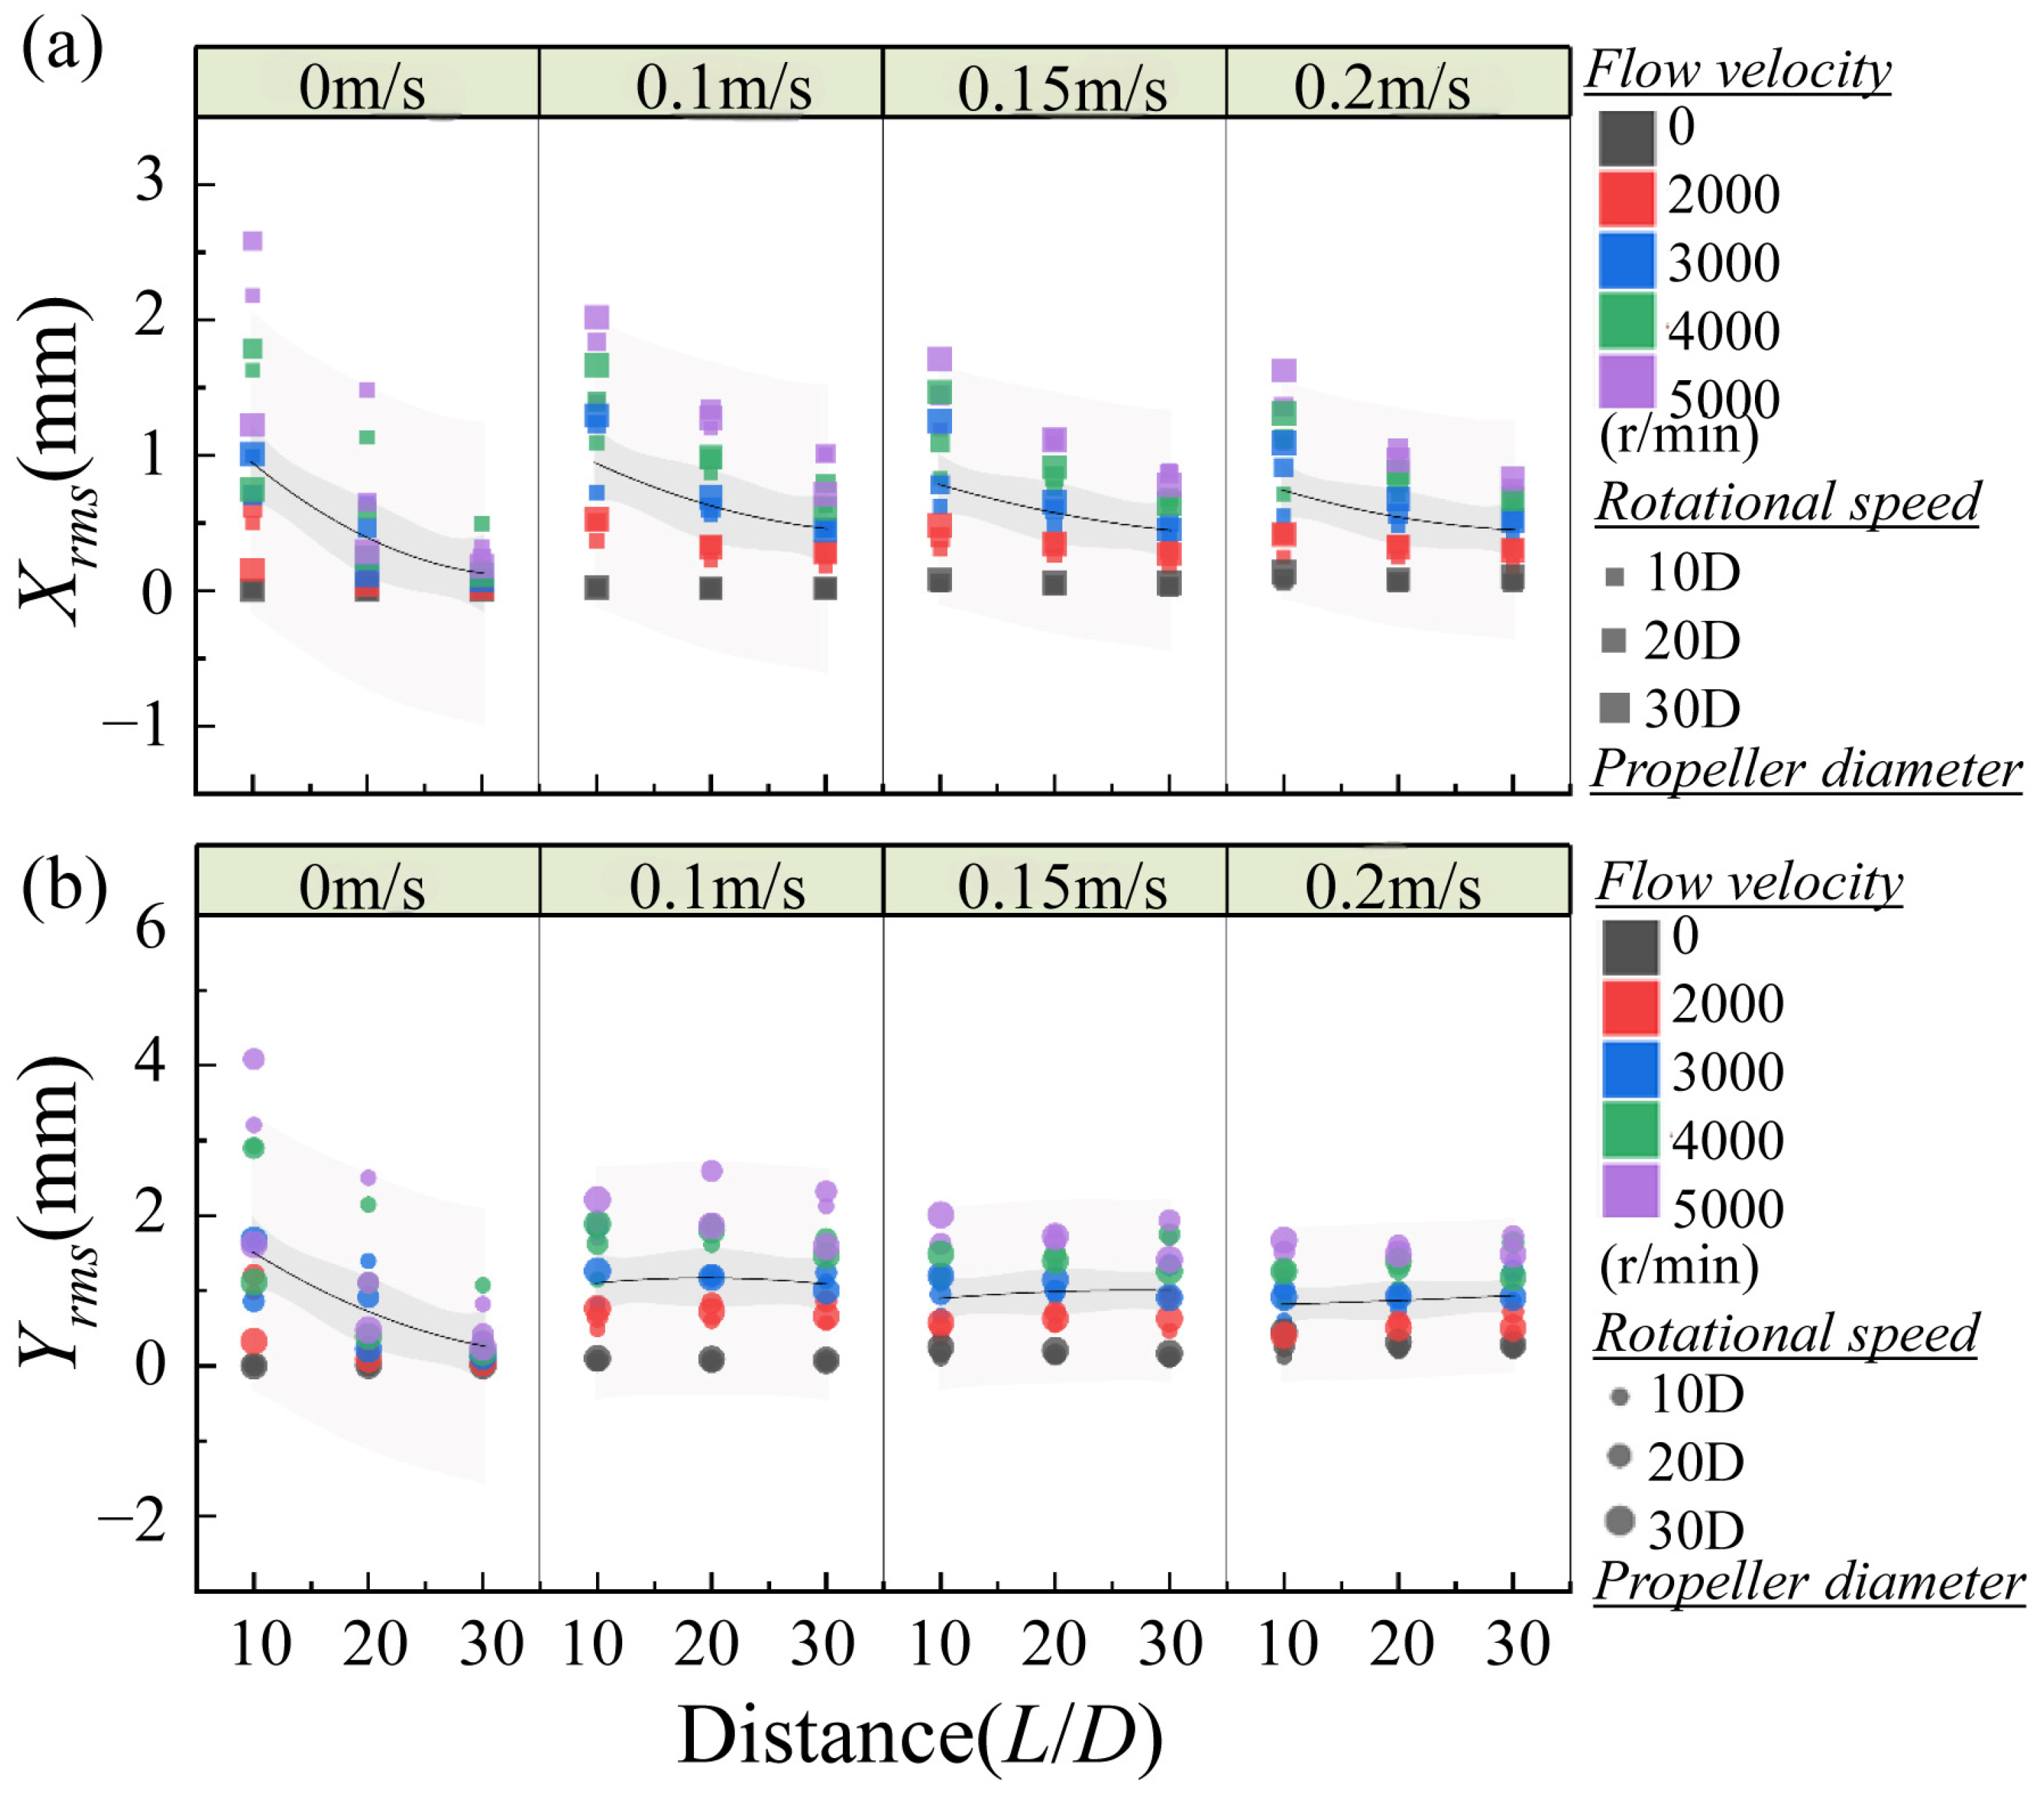
Figure 12a,b depict the influence of separation distance (L/D) between the propeller and the whisker model on the inline and crossflow rms vibration amplitudes, respectively, across varying incoming flow velocities (U∞). The marker size represents the propeller diameter, and the color scale indicates the propeller rotational speed (Np). In general, both IL and CF vibration amplitudes show a declining trend with increasing separation distance, attributable to the spatial decay and dispersion of the propeller wake. This decay is most pronounced at U∞ = 0.00 m/s, where the absence of background flow causes the wake structures to lose coherence rapidly due to viscous diffusion. Xrms and Yrms at L = 30 D drop by over 80% compared to values at L = 10 D, underscoring the wake’s limited spatial reach in quiescent fluid.
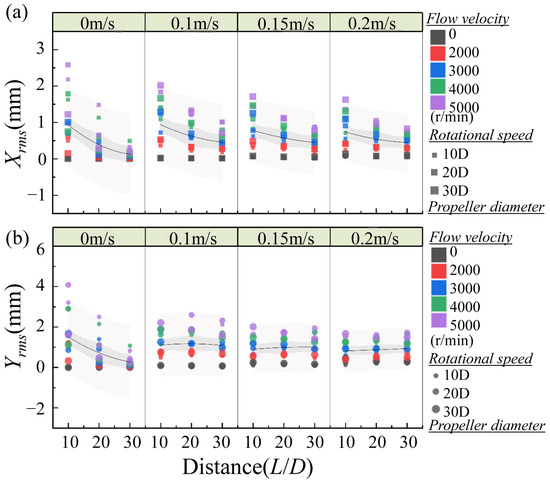
Figure 12.
Root Mean Square (rms) of (a) inline and (b) crossflow vibration amplitudes with separation distance L/D. The rotational speed and diameter of the propeller are indexed by symbol color and size, respectively.
As the incoming flow velocity increases, the damping effect of separation distance becomes progressively less severe. At U∞ = 0.10 m/s, IL vibration amplitudes still decrease with L/D but at a reduced rate, indicating that the convective transport helps preserve vortex coherence and maintain whisker excitation over larger distances. Interestingly, the CF vibration at this flow velocity shows a mild increase from L/D = 10 to L/D = 20, suggesting an optimal interaction region where convected vortices reorganize and align with the whisker’s natural transverse modes—potentially due to constructive interference of tip and hub vortices downstream.
At higher flow conditions (U∞ = 0.15 and 0.20 m/s), both Xrms and Yrms amplitudes continue to decline with increasing L/D, though the drop is less abrupt than in stagnant conditions. The convective flow likely ensures some degree of wake coherence, but increasing background turbulence and velocity gradients may introduce more irregular forcing, reducing the persistence of lock-in behavior and weakening the wake’s impact at farther distances. Nonetheless, IL vibrations remain more sensitive to L/D than CF vibrations, emphasizing their dependence on axial momentum transfer and near-field pressure dynamics. Overall, the results affirm that separation distance is a dominant geometric factor controlling the strength of wake-induced vibrations. While higher U∞ can partially counteract the damping effect of distance by aiding wake propagation, significant attenuation of both IL and CF responses still occurs beyond L/D = 20.
3.5. Correlation and Sensitivity Analysis
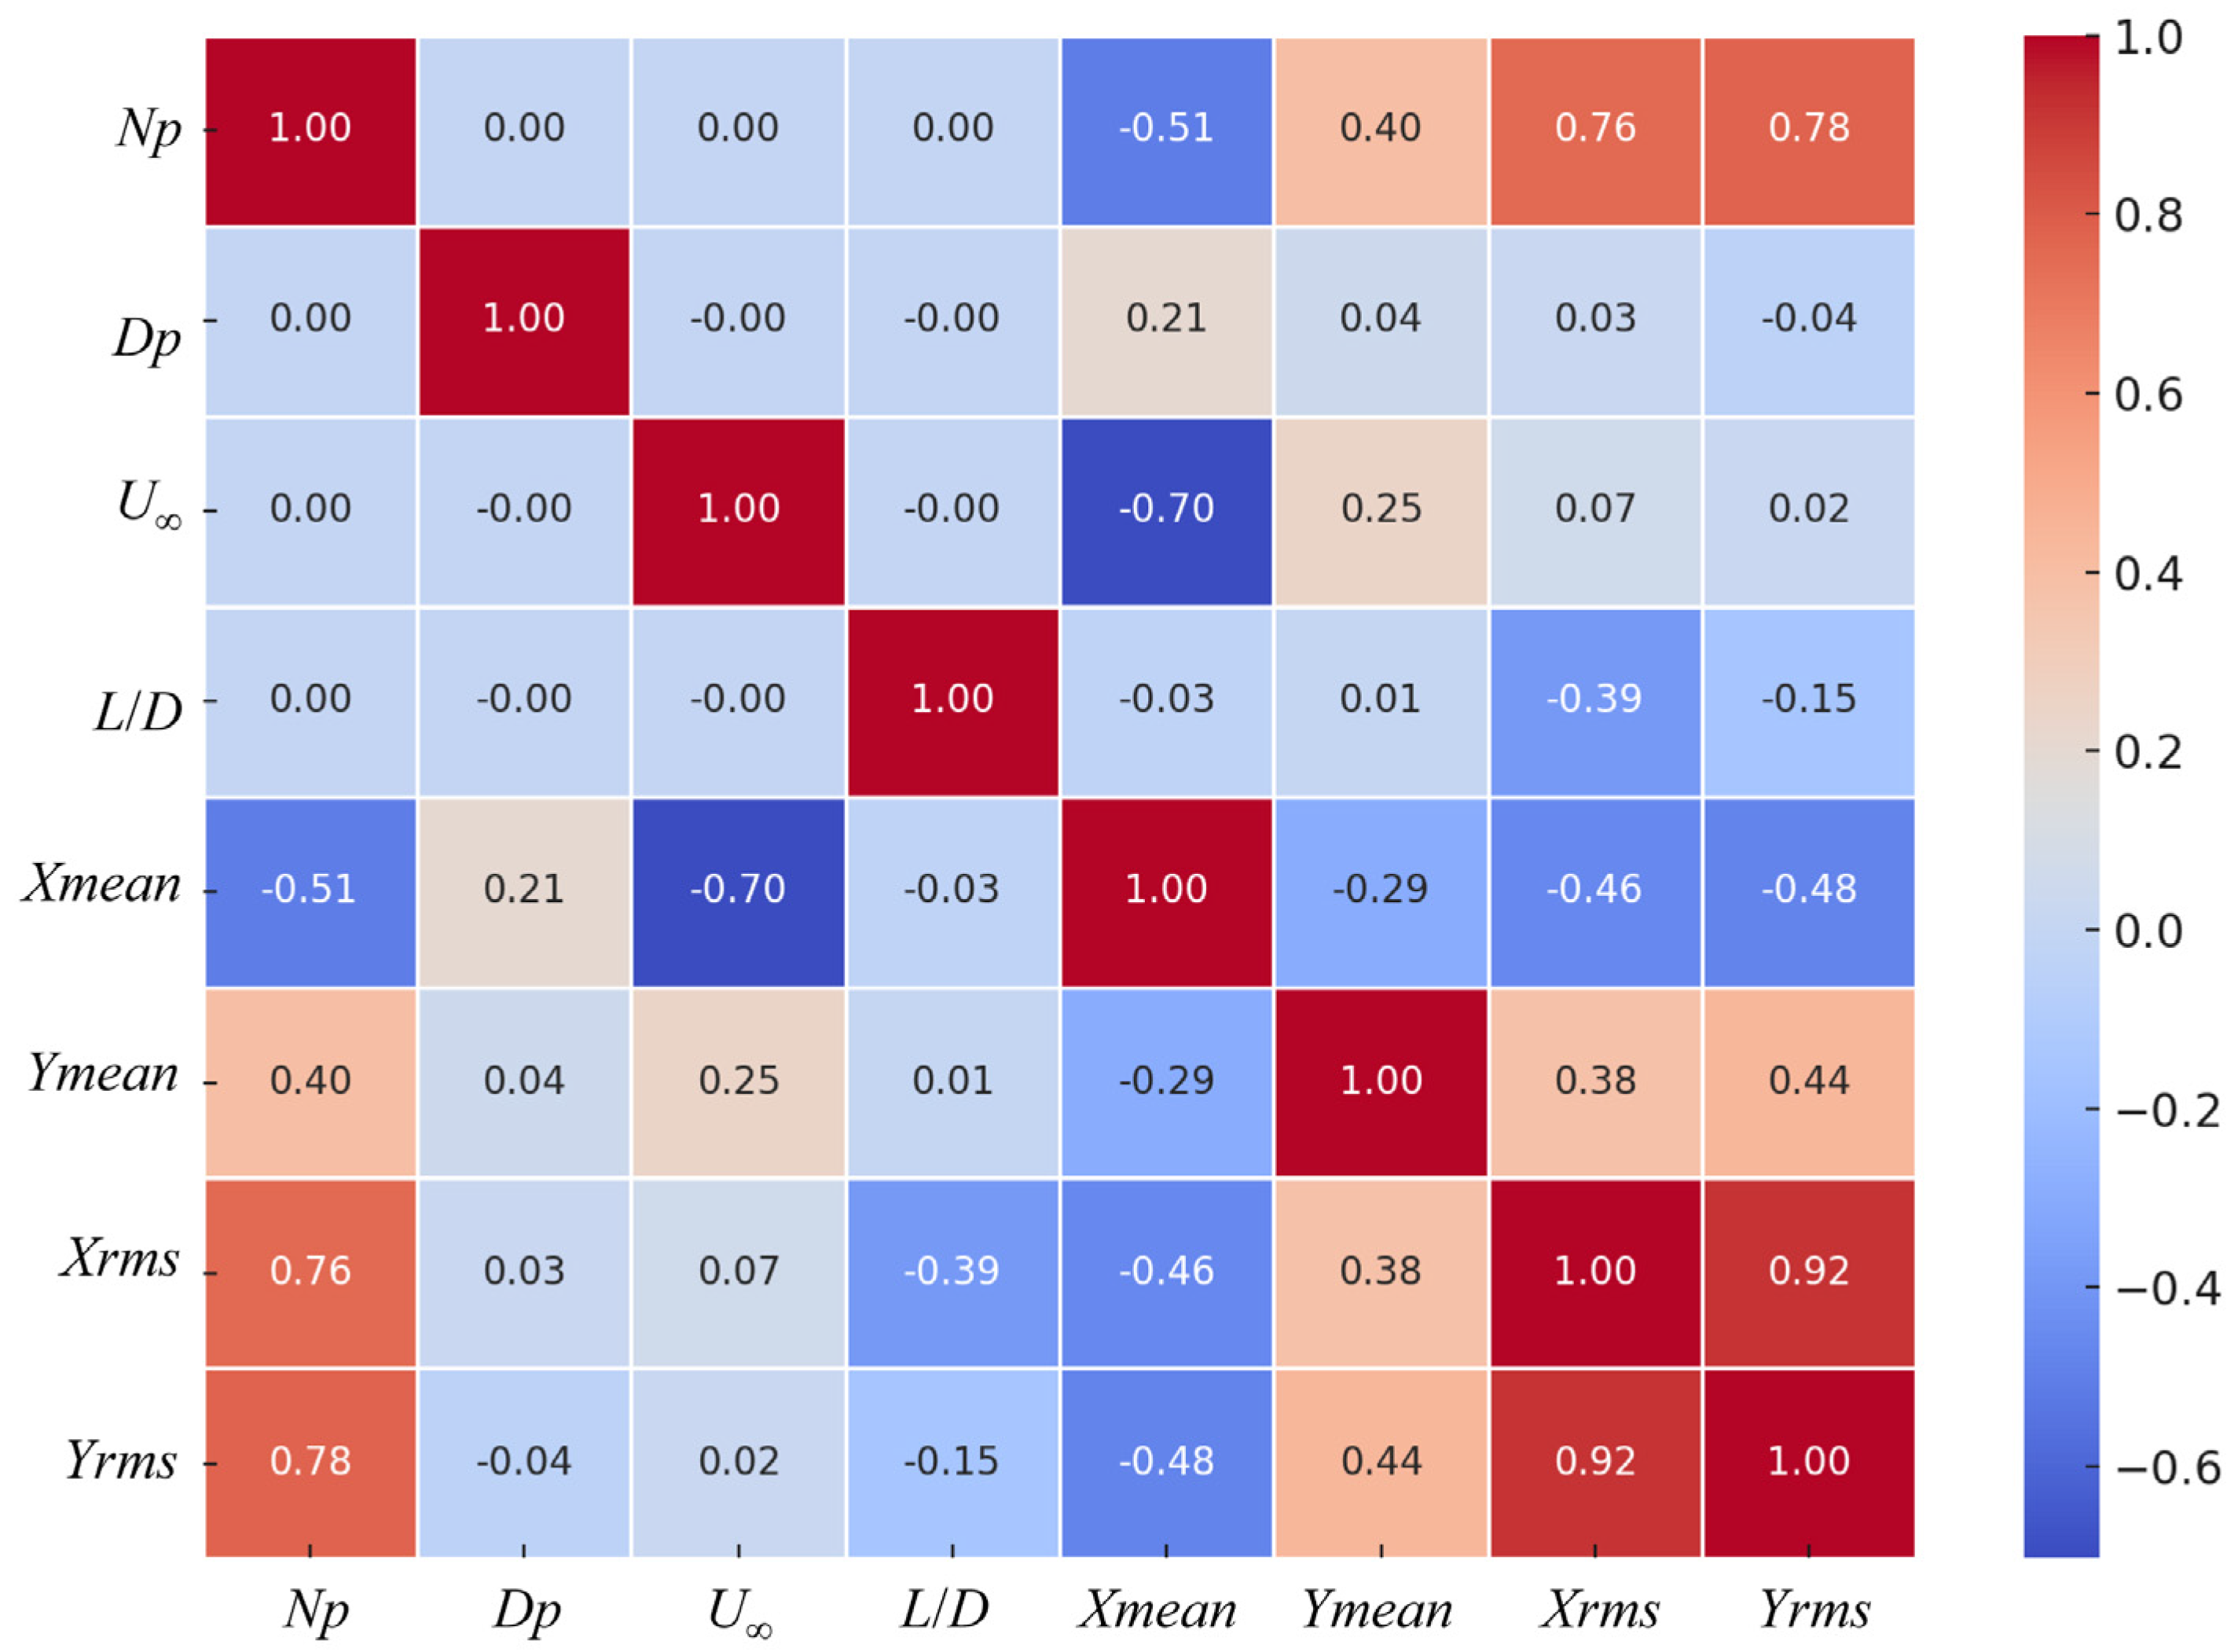
To quantitatively evaluate the influence of each input parameter—propeller rotational speed (Np), diameter (Dp), inflow velocity (U∞), and separation distance (L/D)—on the whisker vibration characteristics, a Pearson correlation (r) matrix analysis was performed, as shown in Figure 13. The response variables included the inline (IL) and crossflow (CF) root-mean-square (rms) amplitudes and mean displacements. As shown in Figure 13, the correlation matrix reveals distinct trends: Inflow velocity (U∞) shows the strongest positive correlation with Yrms (r = +0.74) and a substantial correlation with Xrms (r = +0.62), confirming its primary role in enhancing wake convection and vortex–structure interaction. Propeller rotational speed (Np) also strongly correlates with Xrms (r = +0.66) and Yrms (r = +0.63), indicating that higher tip vortex intensity reinforces vibration amplitudes. Separation distance (L/D) exhibits a negative correlation with both Xrms (r = −0.68) and Yrms (r = −0.59), reflecting the wake energy decay and loss of coherence with increasing downstream distance. Propeller diameter (Dp) shows a relatively weaker and slightly negative correlation, particularly with Yrms (r = −0.31), suggesting that larger diameters may diffuse wake structures and reduce localized forcing on the whisker tip. These results quantitatively support the physical interpretations drawn from earlier visual analyses. The dominant role of rotational speed and inflow velocity across both IL and CF directions highlights their fundamental importance in shaping wake–structure interaction strength. Meanwhile, the consistently negative impact of separation distance confirms its spatial filtering effect on wake energy transfer.
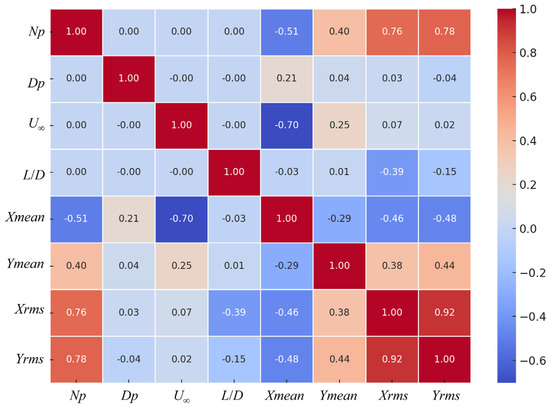
Figure 13.
Correlation matrix of input propeller parameters (Np, Dp, U∞, L/D) with vibration responses of the whisker model.
The correlation matrix also revealed that the propeller rotational speed (Np), diameter (Dp), inflow velocity (U∞) are not only related to vibration responses, but they are also interdependent, which can be reflected as the key non-dimensional parameter advance ratio (J = U∞/(NpDp)) [11]. Physically, the advance ratio J governs the interplay between convective inflow and propeller-induced rotation. At low J: Propeller rotation dominates, producing tight-pitch helical wakes with strong coherence. This favors resonance when wake frequencies align with whisker natural frequencies (e.g., lock-in observed in Figure 8). At high J: Inflow convection stretches and destabilizes vortices, reducing energy transfer via shortened interaction time and increased phase incoherence. Simultaneously, the separation distance L/D (with D being the whisker diameter) also demonstrated a moderate negative correlation, suggesting a spatial attenuation of wake coherence with downstream distance. These two parameters were thus selected to construct a physically interpretable response surface with the whisker model’s vibrations. As such, a polynomial surface was selected to capture not only the linear but also the interaction and curvature effects between these key non-dimensional quantities.
The fitting process was based on the least squares method, wherein the model minimizes the total squared error between the predicted and measured vibration responses. The independent variables were mapped into a second-order polynomial basis: [L/D, J, (L/D)2, J2, (L/D) × J], allowing for physical interpretability while avoiding overfitting. Separate regression models were established for inline and crossflow rms amplitudes. The resulting empirical relationships are as follows:
Xrms/D = 0.1277 − 0.0054 × (L/D) − 0.4278 × J + 0.0001 × (L/D)2 + 0.0421 × (L/D) × J − 9.9325 × J2
Yrms/D = 0.1430 − 0.0036 × (L/D) − 1.0294 × J + 0.000018 × (L/D)2 + 0.0751 × (L/D) × J − 13.550 × J2
These expressions (1–2) reveal several key insights. First, the negative coefficients for both J and J2 confirm that as the advance ratio increases (i.e., when convective inflow dominates over rotational effects), the vibratory excitation imposed on the whisker structure diminishes significantly. Second, the negative influence of L/D affirms that increased downstream distance leads to attenuation of the wake-induced forces. Interestingly, the positive interaction terms (L/D) × J suggest that wake coherence may still be retained under certain flow-separation combinations, resulting in localized amplification zones. The small positive coefficient for (L/D)2 in the crossflow case (~10−5) indicates a very mild curvature effect, likely attributable to long-range wake diffusion. Model performance was also evaluated using the coefficient of determination R2, yielding 0.465 for inline and 0.302 for crossflow rms amplitudes, respectively. These values indicate that the polynomial models capture approximately 47% and 30% of the observed variance—reasonable considering the complexity of three-dimensional wake-structure interactions and the simplifying assumption of a second-order response surface. In principle, this form may be applied to other propeller geometries or bio-inspired sensors, provided the flow remains dominated by coherent unsteady forcing (e.g., vortex shedding or helical wakes). However, different propeller designs (e.g., blade number, pitch, hub effects) or flow environments (e.g., stratified, pulsatile, or turbulent inflow) may introduce additional parameters that influence the vibration response. As such, recalibration using experimental or numerical data would be necessary for broader generalization.
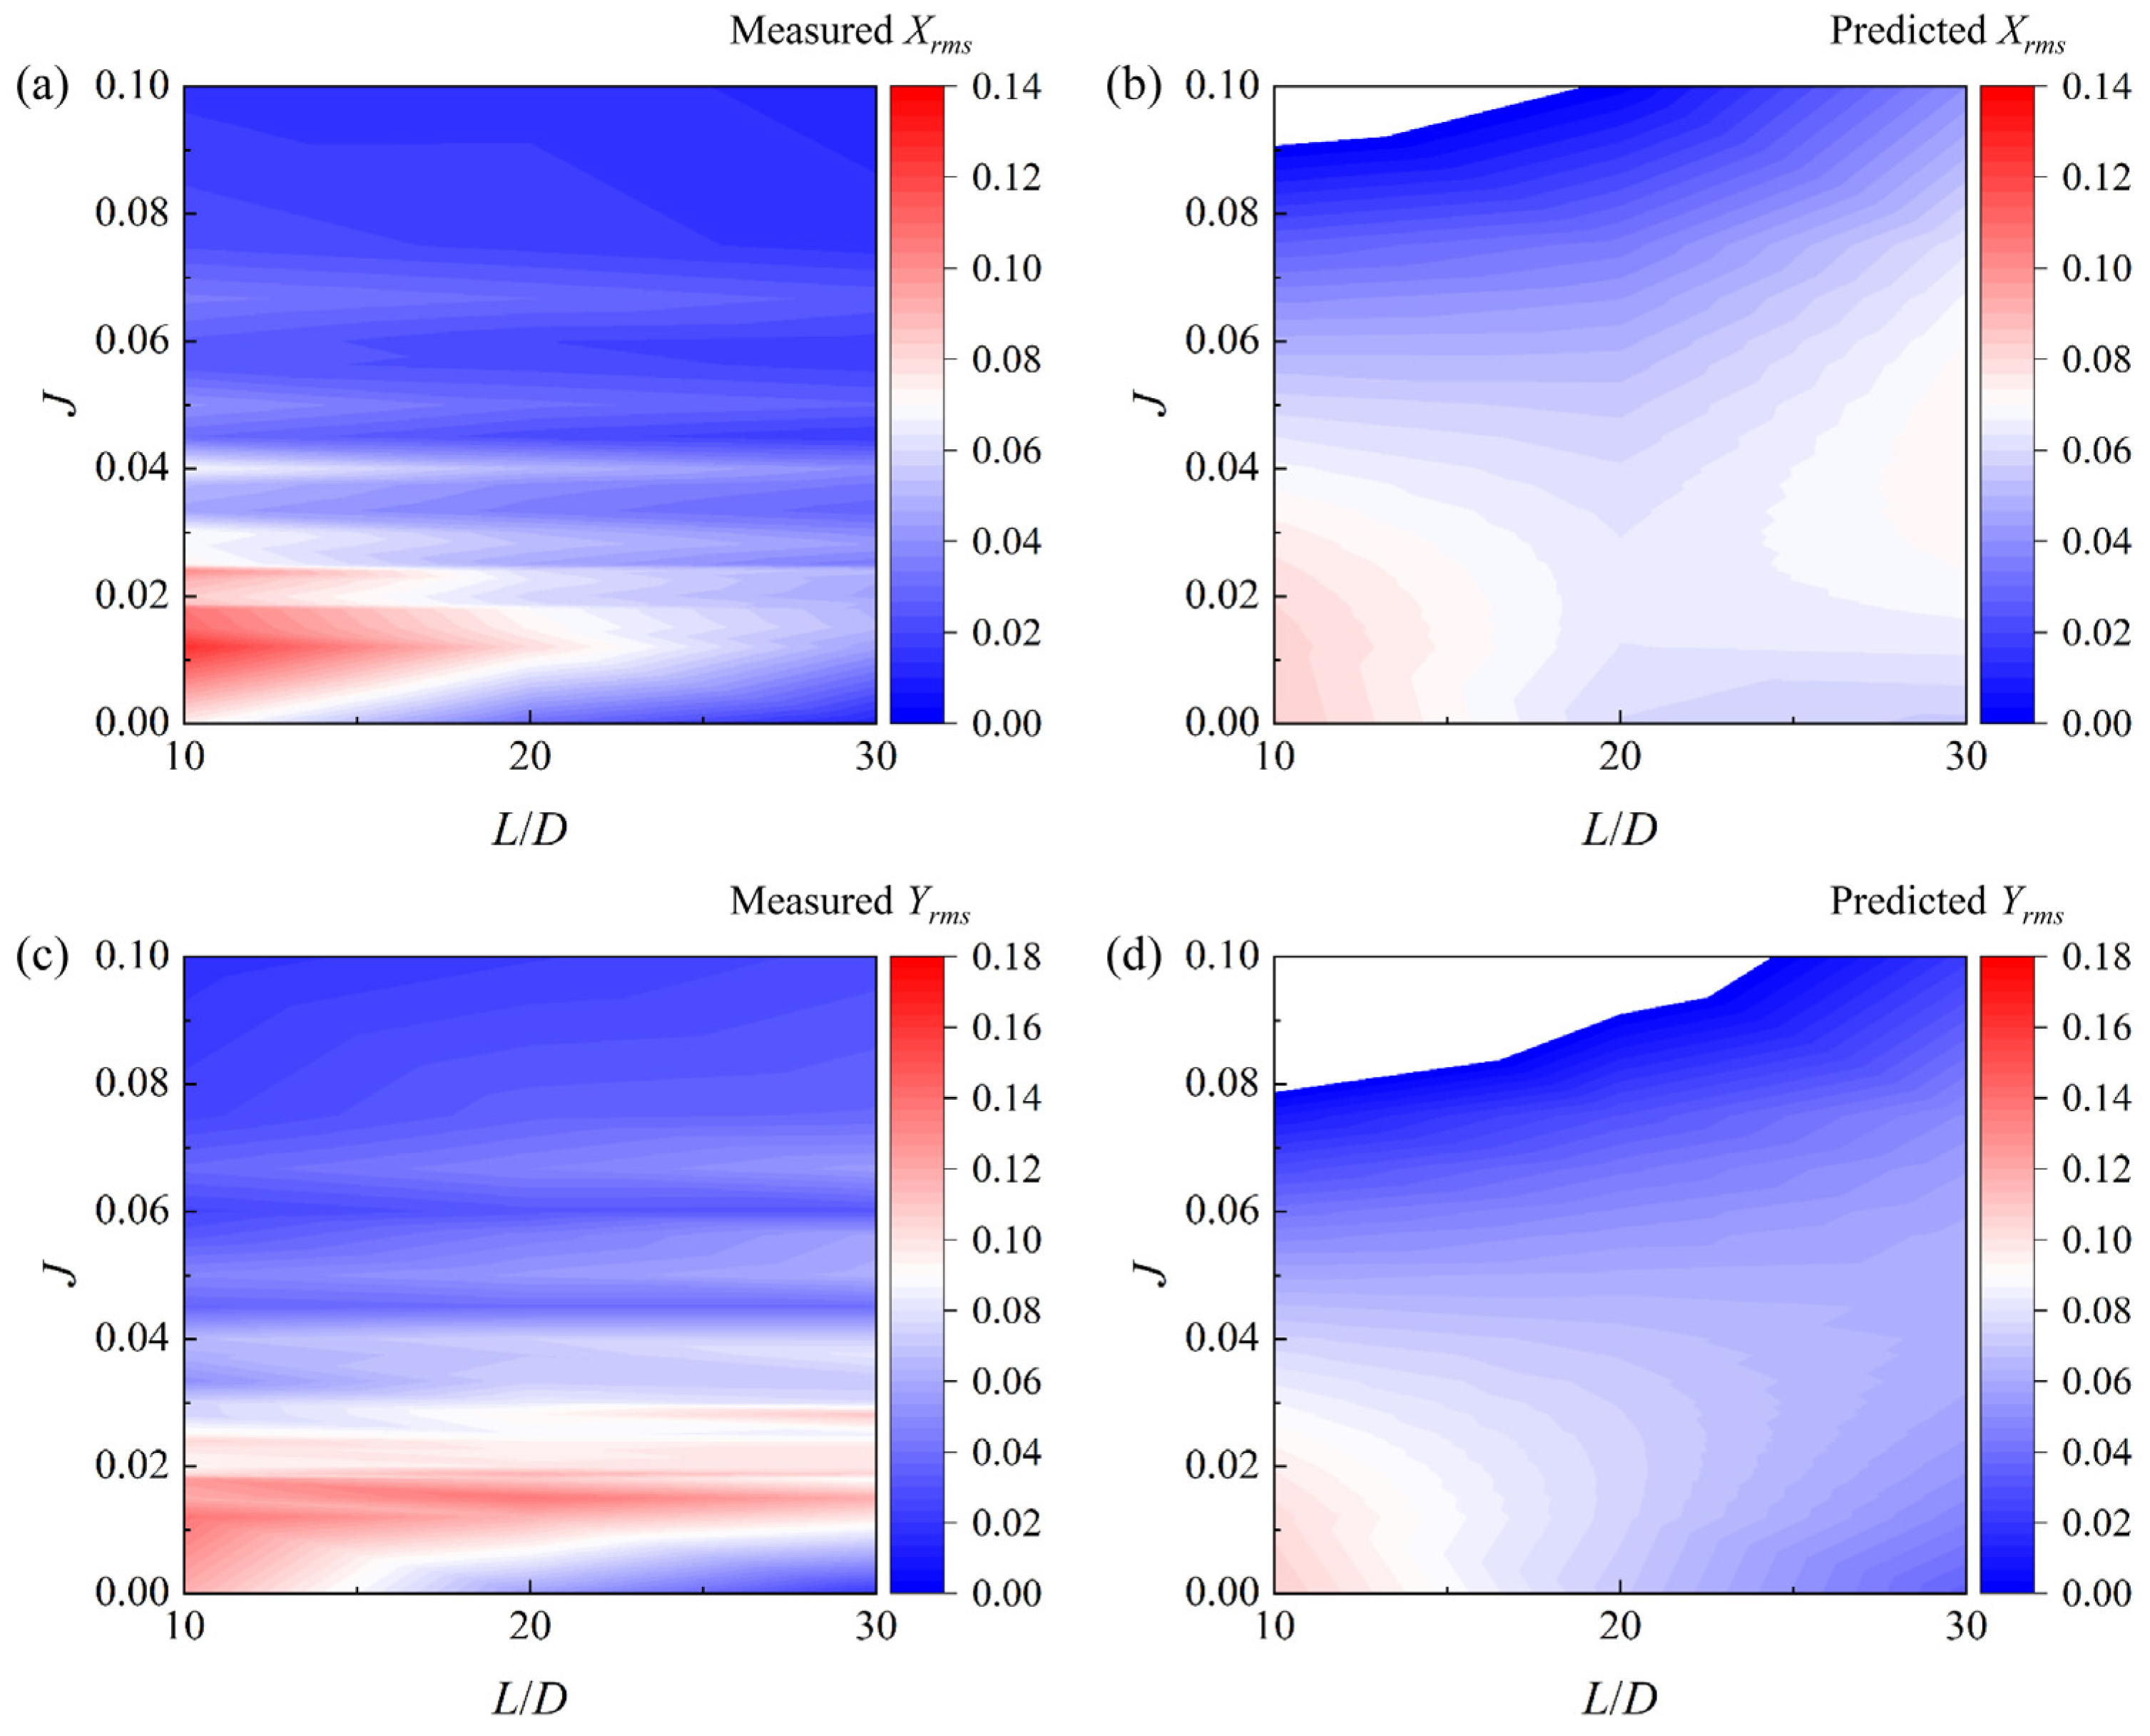
To visually assess model fidelity and local prediction accuracy, contour plots were constructed for both measured and predicted values across the parametric space defined by L/D and J, as shown in Figure 14. The measured inline vibration amplitude distribution (Figure 14a) is generally well reconstructed by the predicted surface (Figure 14b), particularly in regions with low J and small separation distance, where wake coherence and forcing strength are highest. In contrast, regions at high J and large L/D show some discrepancy, indicating underprediction due to low-frequency, low-magnitude vibrations that approach the noise floor. A similar pattern is observed for the crossflow response (Figure 14c,d), albeit with slightly reduced accuracy, consistent with the lower R2 value. These plots demonstrate the predictive reliability of the model within the operational regime of strong wake interaction, while also delineating zones where physical effects may be more complex or dominated by other unmodeled factors such as turbulence intensity or wake asymmetry. Overall, the fitted non-dimensional models provide a compact yet informative representation of whisker response behavior under propeller-induced wake forcing, offering a foundation for parameter sensitivity diagnostics, operational prediction, and bio-inspired sensor design optimization.
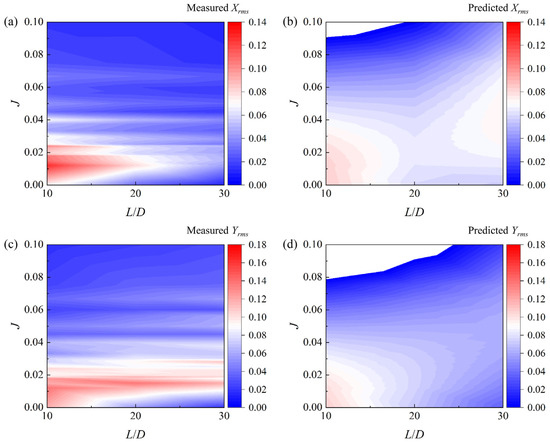
Figure 14.
Contour map for the (a,c) measured rms (a,b) IL and (c,d) CF vibration amplitude and the corresponding (b,d) predicted values by using the fitting equations.
4. Conclusions
This study investigated the wake-induced vibration (WIV) behavior of a bio-inspired harbor seal whisker model subjected to unsteady propeller wake conditions. The parametric space was defined by four key variables: propeller rotational speed Np = 0~5000 r/min, propeller diameter Dp = 60~100 mm, incoming flow velocity U∞ = 0~0.2 m/s, and separation distance between the whisker model and the propeller L/D = 10~30 (D = 16 mm, diameter of the whisker model). Based on a combination of dimensional and non-dimensional analyses, the following conclusions can be drawn:
- (1)
- Effect of propeller rotational speed and diameter: At zero incoming flow, increasing the rotational speed from 1000 to 5000 r/min led to a pronounced increase in both IL and CF vibration amplitudes, particularly when the whisker was placed within 20 D of the propeller. For instance, the RMS_CF increased from below 0.1 mm to over 0.5 mm in certain configurations, with enhanced fluctuations at higher Np driven by intensified wake unsteadiness. The propeller diameter modulated the energy distribution in the wake, where larger Dp resulted in stronger and more coherent forcing, especially at moderate speeds.
- (2)
- Separation distance and inflow velocity interactions: the spatial decay of wake effects was evident as RMS amplitudes decreased significantly with increasing L/D. However, under a finite inflow condition (U∞ = 0.1~0.2 m/s), the vibration response became a function of the interplay between background flow and wake structure. Notably, a non-monotonic response trend was observed, indicating possible wake-structure resonance or partial reattachment effects around L/D = 10~20.
- (3)
- Frequency modulation and stability: the dominant vibration frequencies varied across a broad range (1.0~5.0 Hz), occasionally matching or doubling the natural frequency of the whisker model. Deviations from these values revealed transitions between synchronized lock-in, subharmonic response, and broadband excitation, depending on propeller parameters and spacing. Wavelet and FFT analyses of selected representative cases confirmed these time-varying features, highlighting the role of wake coherence and inflow disturbance.
- (4)
- Non-dimensional surface fitting and predictive modeling: A second-order polynomial fit using non-dimensional RMS amplitudes as a function of L/D and the advance ratio (J = U∞/(NpDp)) achieved good predictive accuracy with R2 = 0.465 for inline and 0.302 for CF responses. Contour maps of predicted vs. measured responses showed best agreement in regions of low J and small L/D, where wake-induced forcing dominates.
- (5)
- Phase-Space characterization of vibration dynamics: phase trajectory analyses of the IL and CF vibrations revealed a transition from periodic to chaotic-like behavior as flow and wake conditions changed. Stable, closed-loop trajectories were observed at low Np and short L/D, while irregular, folding paths emerged under high-speed or high-distance scenarios, reflecting system nonlinearity and turbulence-induced randomness. These results offer a dynamic perspective on vibration coherence, extending beyond time-averaged metrics.
In summary, this work provides new insights into the complex coupling between bio-inspired structures and unsteady propeller wakes. The results enhance our understanding of WIV mechanisms and support the development of physics-informed models for hydrodynamic sensing, with potential applications in underwater tracking, robotics, and flow diagnostics. While the rigid model isolates external wake excitation effectively, we agree that incorporating distributed flexibility could yield deeper insights into the passive sensing and damping mechanisms of real whiskers. These could be addressed in future studies using compliant materials or fluid–structure interaction simulations.
Author Contributions
Conceptualization, Z.Z. and C.J.; methodology, Z.Z. and C.J.; software, B.C., X.W. and Y.W.; validation, B.C., Z.Z. and X.W.; formal analysis, W.L.; investigation, B.C. and W.L.; resources, Z.Z., X.L. and H.Z.; data curation, B.C., Z.Z., X.W., M.D., W.L. and Y.W.; writing—original draft preparation, Z.Z. and W.L.; writing—review and editing, B.C. and Z.Z.; visualization, B.C., Z.Z., X.W. and Y.W.; supervision, B.C. and Z.Z.; project administration, B.C.; funding acquisition, Z.Z. and C.J. All authors have read and agreed to the published version of the manuscript.
Funding
This research was funded by the National Natural Science Foundation of China (Grants No. 52401340, 52179076), the China Postdoctoral Science Foundation (2024M752372), and the Independent Innovation Funding of Science and Technology Innovation Leaders Cultivation ‘Qiming Program’ of Tianjin University (Grant No. 2024XQM-0039).
Data Availability Statement
The data that support the findings of this study are available from the corresponding author upon reasonable request.
Acknowledgments
We gratefully acknowledge the support of the Undergraduate Innovation Training Program Project of Tianjin University.
Conflicts of Interest
The authors declare no conflicts of interest.
References
- Zhao, H.; Zhang, Z.; Chen, W.; Zhao, Y.; Sefah, E.Y.; Ji, C.; Yuan, D. Experimental study on the dynamic responses of harbour seal whiskers in the wake of caudal fin. Ocean Eng. 2024, 302, 117745. [Google Scholar] [CrossRef]
- Wei, Y.; Ji, C.; Yuan, D.; Song, L.; Xu, D. Experimental study on the effect of the angle of attack on the flow-induced vibration of a harbor seal’s whisker. Fluids 2023, 8, 206. [Google Scholar] [CrossRef]
- Rinehart, A.; Shyam, V.; Zhang, W. Characterization of seal whisker morphology: Implications for whisker-inspired flow control applications. Bioinspir. Biomim. 2017, 12, 066005. [Google Scholar] [CrossRef] [PubMed]
- Hanke, W.; Witte, M.; Miersch, L.; Brede, M.; Oeffner, J.; Michael, M.; Hanke, F.; Leder, A.; Dehnhardt, G. Harbor seal vibrissa morphology suppresses vortex-induced vibrations. J. Exp. Biol. 2010, 213, 2665–2672. [Google Scholar] [CrossRef] [PubMed]
- Lyons, K.; Murphy, C.T.; Franck, J.A. Flow over seal whiskers: Importance of geometric features for force and frequency response. PLoS ONE 2020, 15, e0241142. [Google Scholar] [CrossRef]
- Wieskotten, S.; Mauck, B.; Miersch, L.; Dehnhardt, G.; Hanke, W. Hydrodynamic discrimination of wakes caused by objects of different size or shape in a harbour seal (Phoca vitulina). J. Exp. Biol. 2011, 214, 1922–1930. [Google Scholar] [CrossRef]
- Yu, J.; Zhou, B.; Liu, H.; Han, X.; Hu, G.; Zhang, T. Study of propeller vortex characteristics under loading conditions. Symmetry 2023, 15, 445. [Google Scholar] [CrossRef]
- Paik, B.G.; Kim, J.; Park, Y.H.; Lee, S.J.; Suh, J.C. Investigation on the vortex structure of propeller wake influenced by loading on the blade. J. Mar. Sci. Technol. 2007, 12, 72–82. [Google Scholar] [CrossRef]
- Di Mascio, A.; Dubbioso, G.; Muscari, R. Vortex structures in the wake of a marine propeller operating close to a free surface. J. Fluid Mech. 2022, 949, A33. [Google Scholar] [CrossRef]
- Felli, M.; Falchi, M. Propeller wake evolution mechanisms in oblique flow conditions. J. Fluid Mech. 2018, 845, 520–559. [Google Scholar] [CrossRef]
- Posa, A. The dynamics of the tip vortices shed by a tip-loaded propeller with winglets. J. Fluid Mech. 2022, 951, A25. [Google Scholar] [CrossRef]
- Wang, L.; Huang, H.; Huang, C.; Liu, X. Investigation on the vortex dynamics in the wake of a rotating propeller. Int. J. Mech. Sci. 2025, 287, 109918. [Google Scholar] [CrossRef]
- Beem, H.; Hildner, M.; Triantafyllou, M. Calibration and validation of a harbor seal whisker-inspired flow sensor. Smart Mater. Struct. 2013, 22, 014010. [Google Scholar] [CrossRef]
- Ginter, C.C.; DeWitt, T.J.; Fish, F.E.; Marshall, C.D. Fused traditional and geometric morphometrics demonstrate pinniped whisker diversity. PLoS ONE 2012, 7, e34481. [Google Scholar] [CrossRef] [PubMed]
- Miersch, L.; Hanke, W.; Wieskotten, S.; Hanke, F.D.; Oeffner, J.; Leder, A.; Brede, M.; Witte, M.; Dehnhardt, G. Flow sensing by pinniped whiskers. Philos. Trans. R. Soc. B 2011, 366, 3077–3084. [Google Scholar] [CrossRef]
- Han, P.; Zhang, J.-D.; Zhang, D.; Huang, W.-X. How a self-propelled fin gains hydrodynamic advantages behind a circular cylinder with vortex-induced vibrations. J. Fluid Mech. 2025, 1011, A26. [Google Scholar] [CrossRef]
- Zhao, H.; Zhang, Z.; Ji, C.; Zhao, Y.; Li, X.; Du, M. Dynamics of harbor seal whiskers at different angles of attack in wake flow. Phys. Fluids 2024, 36, 071914. [Google Scholar] [CrossRef]
- Dulac, S.; Mousavisani, S.; Breault, T.A.; Seyed-Aghazadeh, B. Flow-induced vibration and wake flow dynamics behind a harbor seal whisker model in tandem arrangement with an upstream cylinder. In Volume 7A: Dynamics, Vibration, and Control, Proceedings of the ASME 2021 International Mechanical Engineering Congress and Exposition, Online, 1–5 November 2021; ASME: New York, NY, USA, 2021; p. V07AT07A033. [Google Scholar] [CrossRef]
- Shan, L.; Zhang, Y. Effects of geometric and wake characteristics on vortex-induced vibrations of a seal-whisker cylinder. Phys. Fluids 2025, 37, 011921. [Google Scholar] [CrossRef]
- Mao, Y.; Chang, H.; Wang, Y.; Yuan, D.; Lv, Y.; Song, Z. A comparative study on the wake sensing mechanism of a seal whisker-shaped cylinder. Sensors 2025, 25, 3529. [Google Scholar] [CrossRef]
- Beem, H.R.; Triantafyllou, M.S. Wake-induced ‘slaloming’ response explains exquisite sensitivity of seal whisker-like sensors. J. Fluid Mech. 2015, 783, 306–322. [Google Scholar] [CrossRef]
- Zdravkovich, M.M.; Bearman, P.W. Flow Around Circular Cylinders Volume 1: Fundamentals; Oxford Science Publications: Oxford, UK, 1997. [Google Scholar]
- Zhao, Y.; Zhang, Z.; Ji, C.; Chen, W.; Lv, J.; Zhao, H. Experimental study on vortex-induced vibrations of a circular cylinder elastically supported by realistic nonlinear springs: Vibration response. J. Fluids Struct. 2025, 133, 104233. [Google Scholar] [CrossRef]
- Zhao, Y.; Zhang, Z.; Ji, C.; Zhao, H.; Chen, W. Experimental study on flow-induced vibrations of an equilateral triangular prism with a high mass ratio. Ocean Eng. 2024, 302, 117709. [Google Scholar] [CrossRef]
Disclaimer/Publisher’s Note: The statements, opinions and data contained in all publications are solely those of the individual author(s) and contributor(s) and not of MDPI and/or the editor(s). MDPI and/or the editor(s) disclaim responsibility for any injury to people or property resulting from any ideas, methods, instructions or products referred to in the content. |
© 2025 by the authors. Licensee MDPI, Basel, Switzerland. This article is an open access article distributed under the terms and conditions of the Creative Commons Attribution (CC BY) license (https://creativecommons.org/licenses/by/4.0/).

