1. Introduction
Rising sea levels from melting ice caps due to global warming poses severe threats to coastal regions. As water levels rise, coastal lines experience stronger wave activity and larger tidal surges. Increased wave energy leads to the erosion of beaches, dunes, and bluffs, as well as instability at the bases of offshore wind turbines. To address growing concerns related to rising sea levels, the OBS was developed [
1]. OBS consists of an assembly of concrete modules, as shown in
Figure 1a. When stacked, these modules serve various functions, including securing the foundations of offshore wind turbines and marinas as well as forming artificial reefs and large-scale port facilities. The mechanism diagram is shown in
Figure 1b to illustrate the working mechanism of OBS. More importantly, OBS mitigates the force of incoming waves by dissipating wave energy, which reduces wave heights and ultimately limits erosion damage to offshore structures. As a base support for offshore wind turbines, the hollow structure of OBS also functions as a water reservoir, further enhancing its stability.
The objective of this study is first to validate the effectiveness of the OBS in dissipating wave energy and then to improve the structural stability of the system. Significant advancements in ocean wave simulation have been achieved, primarily through research involving wave tank experiments. A wave tank is a long, narrow container equipped with a wave generator at one end. Common wave generator designs include piston, flap, paddle, and wedge types, which are used to create controlled waves within the tank [
2,
3,
4]. These traditional methods have led to important discoveries and insights, contributing to the development of offshore wind turbine foundations.
Setting up physical wave tanks presents several challenges. The financial cost of these facilities is substantial, and the space required to accommodate them further increases overall expenses. Additionally, constructing and testing prototypes is time-consuming. Early design iterations often do not guarantee success, potentially requiring redesigns and additional testing. Given these constraints, researchers have explored alternatives that maintain the quality and reliability of results. The simulation of OBS structures in Numerical Wave Tanks (NWTs) has emerged as a promising approach for cost-effective and efficient preliminary assessments, closely mirroring real-world conditions.
Many studies have investigated wave generation using a digital piston wave maker. Kim et al. programmed a wave maker to replicate the water movements at the edge of the wave generator, thereby creating fully three-dimensional waves [
5,
6]. The generated waves enter from one side by moving the water in sync with the wave maker. At the end of the tank, a damping zone was introduced to absorb the waves and reduce reflections. Similarly, Wang et al. [
7] used a piston wave maker to generate the desired incident waves. Numerical methods were developed to solve Navier–Stokes equations with fully nonlinear boundary conditions for simulating the three-dimensional NWT. A finite analytical method was used to implement this model, enabling the analysis of wave generation and propagation. Gomes et al. [
8] investigated regular gravity waves using two different numerical methods. They simulated wave generation via a wave function at the inlet and employed the Volume of Fluid (VOF) model to simulate wave propagation within the wave tank. Liang et al. [
9] conducted simulations of a piston-type wave generator to produce a series of irregular waves. Using the Finite Volume Method (FVM), their simulation results were compared with experimental wave tank data, revealing strong consistency between the two.
Numerous techniques are available to simulate wave propagation. Li et al. [
10] explored three distinct methods for modeling waves in two-phase CFD solvers: the Internal Wave Generator method, the Spectral Wave Explicit Navier–Stokes Equations method, and the Relaxation Zone method. The first two techniques generate and focus waves within a specific region, while the third enables viscous coupling throughout the entire domain. Separately, Choi et al. [
11] investigated several common waves exit strategies during wave propagation in free surface simulations. They considered factors such as extended meshes, linear damping sources, increased viscosity, and wave reduction schemes. Their study compared the propagation of regular incident waves with the attenuation of radiative waves. Building upon existing techniques, Bihs et al. [
12] developed a three-dimensional NWT to study wave propagation and wave loads. Their findings highlighted an improved density interpolation mechanism, which enhanced the accuracy of wave hydrodynamics simulations.
The value of these NWTs becomes evident when examining wave–structure interactions. Offshore structures, due to their constant exposure, must withstand and operate under relentless wave forces. Researchers have made significant advances in simulating these interactions using NWTs. For example, Kuai et al. [
13] analyzed wave forces on cylindrical structures, highlighting the importance of vortex shedding behind these cylinders under wave impact. Kumar and Bhattacharjee [
14] conducted a comprehensive study on breakwaters, focusing on the hydrodynamic performance and wave attenuation capabilities of seawalls. Using a two-dimensional NWT, they demonstrated that submerged breakwaters significantly reduce wave energy without obstructing shoreline views or access.
Leveraging the Reynolds-Averaged Navier–Stokes (RANS) equations coupled with the Renormalization Group (RNG) k-ε model, Yong and Mian [
15] investigated a surface-piercing structure in a two-dimensional NWT. They revealed the complex effects of wave–current interactions on such structures, emphasizing the increased stresses experienced under simultaneous wave and current forces—an important consideration for structural design and maintenance. Hu et al. [
16] used OpenFOAM to investigate wave-structure interactions, introducing a new wave theory to establish boundary conditions for modeling extreme wave scenarios. Subsequent studies have shown that wave energy decreases as it passes over permeable submerged breakwaters, shifting to higher frequencies and increasing turbulence near the water–structure interface [
17]. Another study identified a relationship between draft and horizontal wave forces for regular waves impacting fixed truncated cylinders [
18]. Akarni et al. [
19] developed a numerical model using the Boundary Element Method (BEM) to analyze wave interactions with submerged plates, considering both linear and second-order wave theories. Similarly, Wang et al. [
20] applied the Reynolds-Averaged Navier–Stokes (RANS) equations along with the k-ε turbulence model to evaluate wave loads on offshore bridge box-girder superstructures. Their results indicated that floating breakwaters significantly reduce the wave loads acting on such structures. They also developed a neural network-based model to predict maximum wave forces in the presence of floating breakwaters. Further, Tong et al. [
21] introduced an enhanced numerical method—the Adaptive Harmonic Polynomial Cell (AHPC) Method—to improve simulations of 3D nonlinear wave–structure interactions involving embedded boundaries. Compared to standard BEM techniques, this method offers greater accuracy and efficiency while mitigating issues such as spurious oscillations in the computed forces.
Accurate and stable calculations are important when using NWTs. One of the major challenges in this context is achieving precise wave generation. The development and advancement of NWTs have significantly enhanced the understanding of the hydrodynamic behavior of structures and their interactions under various wave conditions. Even though there are lot of research on NWTs, to the best of authors knowledge, there is no literature has been published on CFD investigation of OBS. This research investigates the potential of an ocean brick structure within NWTs using the commercial software Ansys Fluent. Follow by the second-order Stokes waves theory, numerical investigations were conducted under different wave conditions (wave amplitude, period, and wave length) for both linear and nonlinear “depth” NWTs. First, the Volume of Fluid (VOF) model is used to generate waves in both linear and nonlinear NWTs, and the results are validated against analytical solutions to ensure accuracy. Subsequently, the interaction between waves and the OBS model is studied within an NWT that replicates an experimental setup. The simulation uses real-world dimensions, resulting in a more realistic representation. The generated wave is validated using an analytical solution, the simulation results in the nonlinear NWT with the OBS are compared against experimental data. Based on the findings, a modified brick geometry is proposed. This modified OBS design shows greater potential to reduce wave energy and enhance structural stability, making it a more effective support system for offshore wind turbines.
2. Numerical Methods
2.1. Porous Medium
Many offshore and coastal structures benefit from the use of porous surfaces, which provide additional resistance to wave forces. Coarse gravel beds are a prime example; they allow water to flow through while offering a stable foundation for structures such as piers and jetties. These porous layers help dissipate wave energy, reducing erosion and enhancing the stability of the structure. Such design choices play a critical role in creating durable and resilient coastal infrastructure.
The parameter ε represents the porosity of a porous medium, which is a ratio of the volume of void to the total volume , .
A complete solid structure would possess a porosity of 0, indicating no voids. While a volume comprised entirely of voids would have a porosity of 1. The residual component of the porous medium, which is not occupied by voids, constitutes the “skeletal” structure of the material, .
The porosity of a medium is determined by its relationship with density: , where is porous medium density and is the density of material forming its skeleton.
Various models have been formulated to elucidate the dynamics of flow through porous media and compute the associated pressure drop as fluids traverse these mediums. Often, these mathematical representations derive from empirical observations and findings.
Darcy pioneered a unidimensional empirical approach to characterize laminar flow within porous media [
22].
where
represent the flux per unit area,
denote the permeability,
μ be the dynamic viscosity and Δ
p stands for the pressure gradient in the flow direction. Darcy’s law is conventionally employed to articulate fluid movement in porous media that are microscopically disordered yet macroscopically homogeneous [
23]. Darcy’s formulation does not consider inertial effects. Its applicability is primarily restricted to flows exhibiting low Reynolds numbers.
For turbulent flow within porous media, one must account for both viscous and inertial effects, as they induce more intricate nonlinear patterns in the flow behavior. Recognizing this complexity, Forchheimer introduced an additional term to Darcy’s original formulation, ensuring that this nonlinearity was duly considered. Forchheimer’s equation is widely acknowledged as the evolved extension of Darcy’s law, specifically tailored for scenarios with elevated flow rates. The Forchheimer equation is expressed in Equation (5) [
24].
where
is the non-Darcy coefficient.
Two different porous media used to support the OBS are simulated using the porous media model. As wave-induced flow develops at the bottom of the tank, it passes through these porous layers, which offer partial resistance due to increased viscous and inertial effects. These effects contribute to the development of turbulence in the flow direction near the porous media. This resistance generates a back pressure in the flow, which is calculated using the Forchheimer equation, as previously described.
2.2. Generation of Numerical Waves
The propagation of waves is facilitated by a user-defined function to generate a wave on the left end within the NWT. In this study, the velocity components are determined using the second-order Stokes wave theory. Stoke’s second-order wave theory is a form of a linear wave theory with an additional higher-order term.
As per Horko [
25], the motion of free surface elevation
in the Stokes theory can be written as:
The velocity components in x and z direction can be expressed as:
where
is the wave number,
is the wave frequency,
z is the change in position in the free water surface to the sea floor,
A is the amplitude of the wave,
T is the time period,
L is the wavelength, and
H is the water depth.
Wavelength is calculated using Equation (6) [
26] based on water depth and time period. The generated wavelength in NWT is independent of wave height.
2.3. VOF Model
In the NWT, the Volume of Fluid (VOF) model is employed to capture water–air interactions [
27]. The VOF model is specifically designed for immiscible fluids, meaning fluids that cannot mix. It simulates the behavior of these distinct fluids using a shared set of momentum equations while tracking the volume fraction of each fluid within a computational cell. Its ability to maintain clear phase separation makes it a valuable tool for studying interactions between immiscible fluids in dynamic environments.
In VOF model, each fluid’s movement is tracked using a volume fraction variable, which indicates the portion of a computational cell occupied by a specific fluid. The volume fraction of air or water in each cell is represented by αa (αw) and the possibilities:
αa = 0: Devoid from air.
αa = 1: Filled with air.
0 < αa < 1: Partially filled with water and air. Since the mixture is filled with only air and water, so αa + αw = 1.
To monitor the interface between two phases, the continuity equation is solved for the phase volume fractions:
Here,
represents a transfer of mass from air to water, and
denotes the transfer of mass from water to air.
Sαa and
Sαw are typically assumed to be zero and can also represent a continuous or user-defined mass source for every phase. To determine the velocity field across the entire domain, the momentum equation is defined using each phase’s characteristics, such as density (
) and viscosity (
) shown in Equations (9) and (10).
Shared field calculation does have its drawbacks. For starters, when there is a significant difference in the speeds of two phases, it might not be very accurate, especially near the boundary where the two meet. Additionally, it can struggle to capture tiny details or rapid changes at these interfaces.
2.4. Turbulence Model
The Shear Stress Transport (SST) k-omega turbulence is employed due to its ability to accurately model both near-wall and free flow. It is a combination of the k-omega near the wall and the k-epsilon for free flow, providing a seamless transition between the two regions [
28]. This combination allows the model to effectively capture complex flow structure interactions, especially when dealing with free surface flows and wave generation.
The SST k- model is governed by Equations (11) and (12).
Turbulent kinetic energy (
k) equation:
Specific dissipation rate (
) equation:
where
ρ is the density of fluid,
xi and
xj are spatial coordinates,
ui is velocity in xi direction, t is time,
μ is viscosity,
μt is eddy viscosity,
Gk,
Gb are the production of turbulent kinetic energy due to mean velocity gradients and buoyancy, respectively,
Sk,
Sω are user-defined source terms, and the model constants
α,
β,
β*,
σk, and
σω are derived from experimental data and empirical correlations [
28].
3. Model Setup and Validation
Simulations are first conducted in a linear-depth NWT as a baseline case. The resulting surface elevations are compared with analytical solutions for validation purposes. Numerical analyses are then performed in a nonlinear-depth NWT, both with and without an OBS, and the wave amplitudes are collected to evaluate the brick’s effectiveness in reducing wave energy. To verify the model’s accuracy, pressure data from eight locations are extracted from the simulation results, and are compared with corresponding experimental data. Finally, a modified brick design is proposed, and simulation results using the modified brick are compared with those from the traditional design to assess its effectiveness in wave energy reduction.
3.1. Model Setup and Boundary Conditions
3.1.1. Linear Depth NWT
A NWT with dimensions of 25 m in length, 3 m in width, and 1.5 m in depth is used in the simulation. Detailed boundary settings are given in
Figure 2. The front, back, and bottom walls are considered as no-slip boundary conditions, indicating that the fluid velocity at the interface with these solid surfaces is zero [
29]. The left boundary of the computational domain is set as a velocity inlet with wave inflow applied through a UDF. The right end of the NWT is defined as a pressure outlet; the top boundary is specified as a pressure inlet open to the atmosphere
A structured grid is utilized for meshing, with an element size of 0.1 m. To accurately capture free surface interactions, the mesh is refined around the interface. The total number of cells in the NWT is 656,500, and is shown in
Figure 3.
3.1.2. Nonlinear Depth NWT
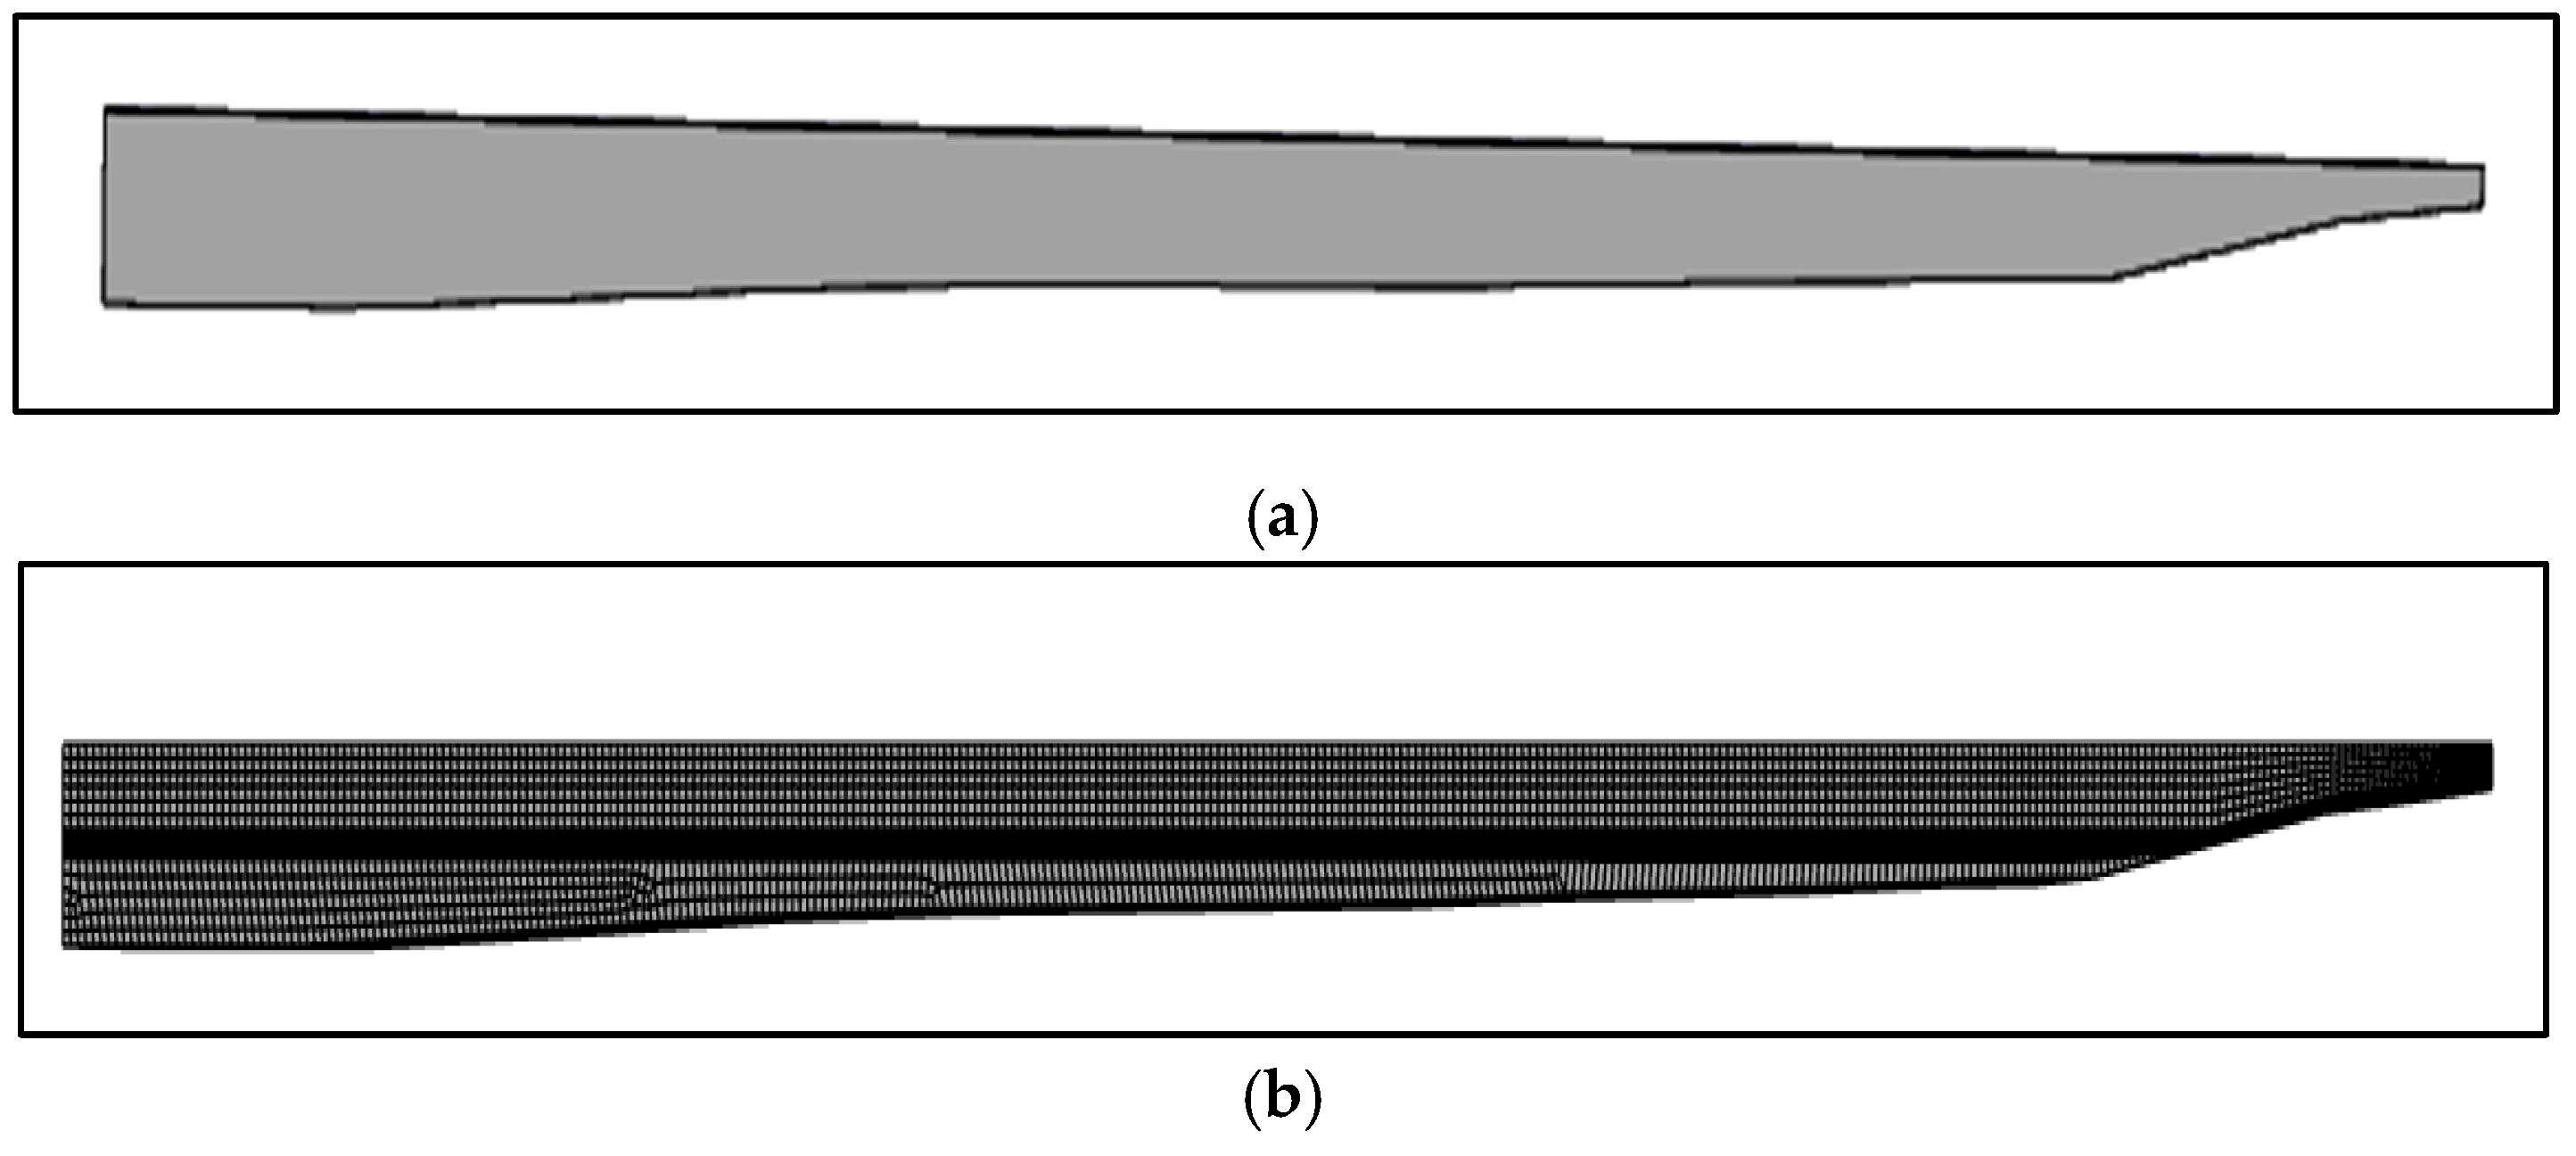
The nonlinear depth NWT of the length has a length of 321.24 m, a width of 40 m, and an initial depth of 6.81 m. The depth varies nonlinearly based on the equation −0.0047x
4 + 0.1061x
3 − 0.7717x
2 + 1.4198x + 6.1129, which defines the sea bottom profile shown in
Figure 4a. This configuration matches the experimental setup. A structured grid is used for meshing, with a base element size of 0.75 m, the grid is refined 1 m above and below the water surface to accurately capture the free surface interactions. In this region, the mesh is progressively refined using a ratio of 1.05, as illustrated in
Figure 4.
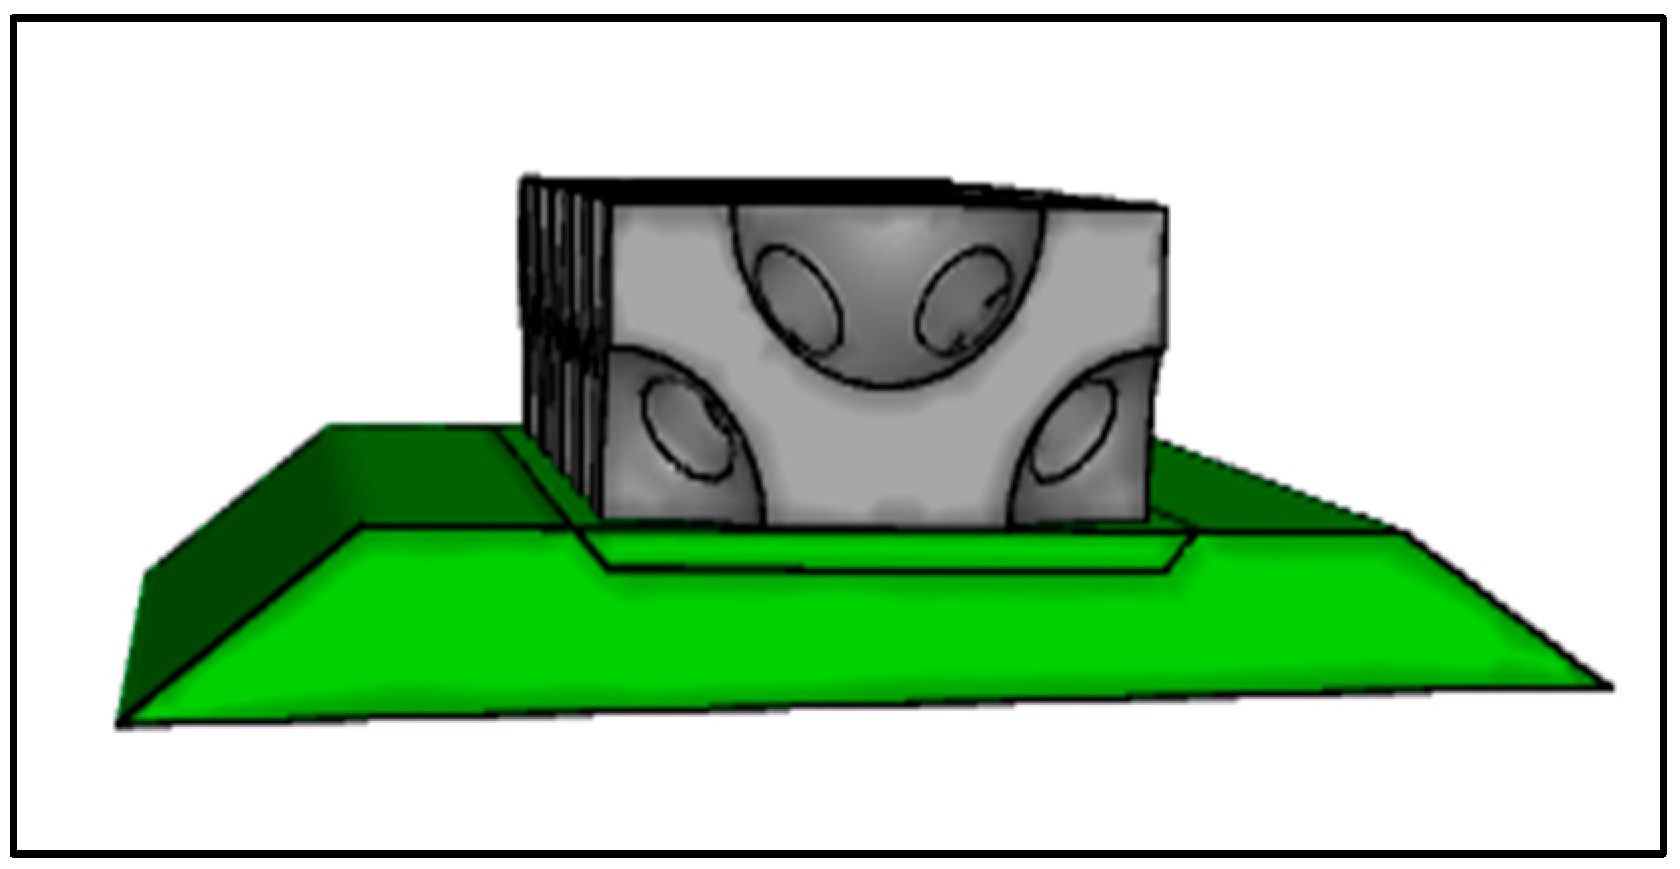
The OBS experimental setup consists of 20 bricks arranged in two rows and 10 columns. Each brick measures 4 m × 4 m × 4 m and is placed on two underlying layers: a main rock bed and a rice grain bed, with porosity of 0.47 and 0.40, respectively. The Main rock bed is located at the bottom, with a rice grain bed positioned above it. The bricks are arranged on top of these layers to represent real-life base support system on the seashore, as shown in
Figure 5.
The entire OBS is placed 87 m from the inlet in the nonlinear depth NWT as shown in
Figure 6.
Each brick was submerged to a height of 2.9 m from its bottom, with the origin positioned transversally at the center of the brick arrangement, measured from the base of the brick. In the experimental setup, pressure sensors were mounted at eight different locations, as shown in
Table 1.
3.2. Mesh Independent Study
A mesh independent study is conducted using different element sizes, as shown in
Table 2. Multiple simulation trials confirm that the results remain consistent regardless of mesh size.
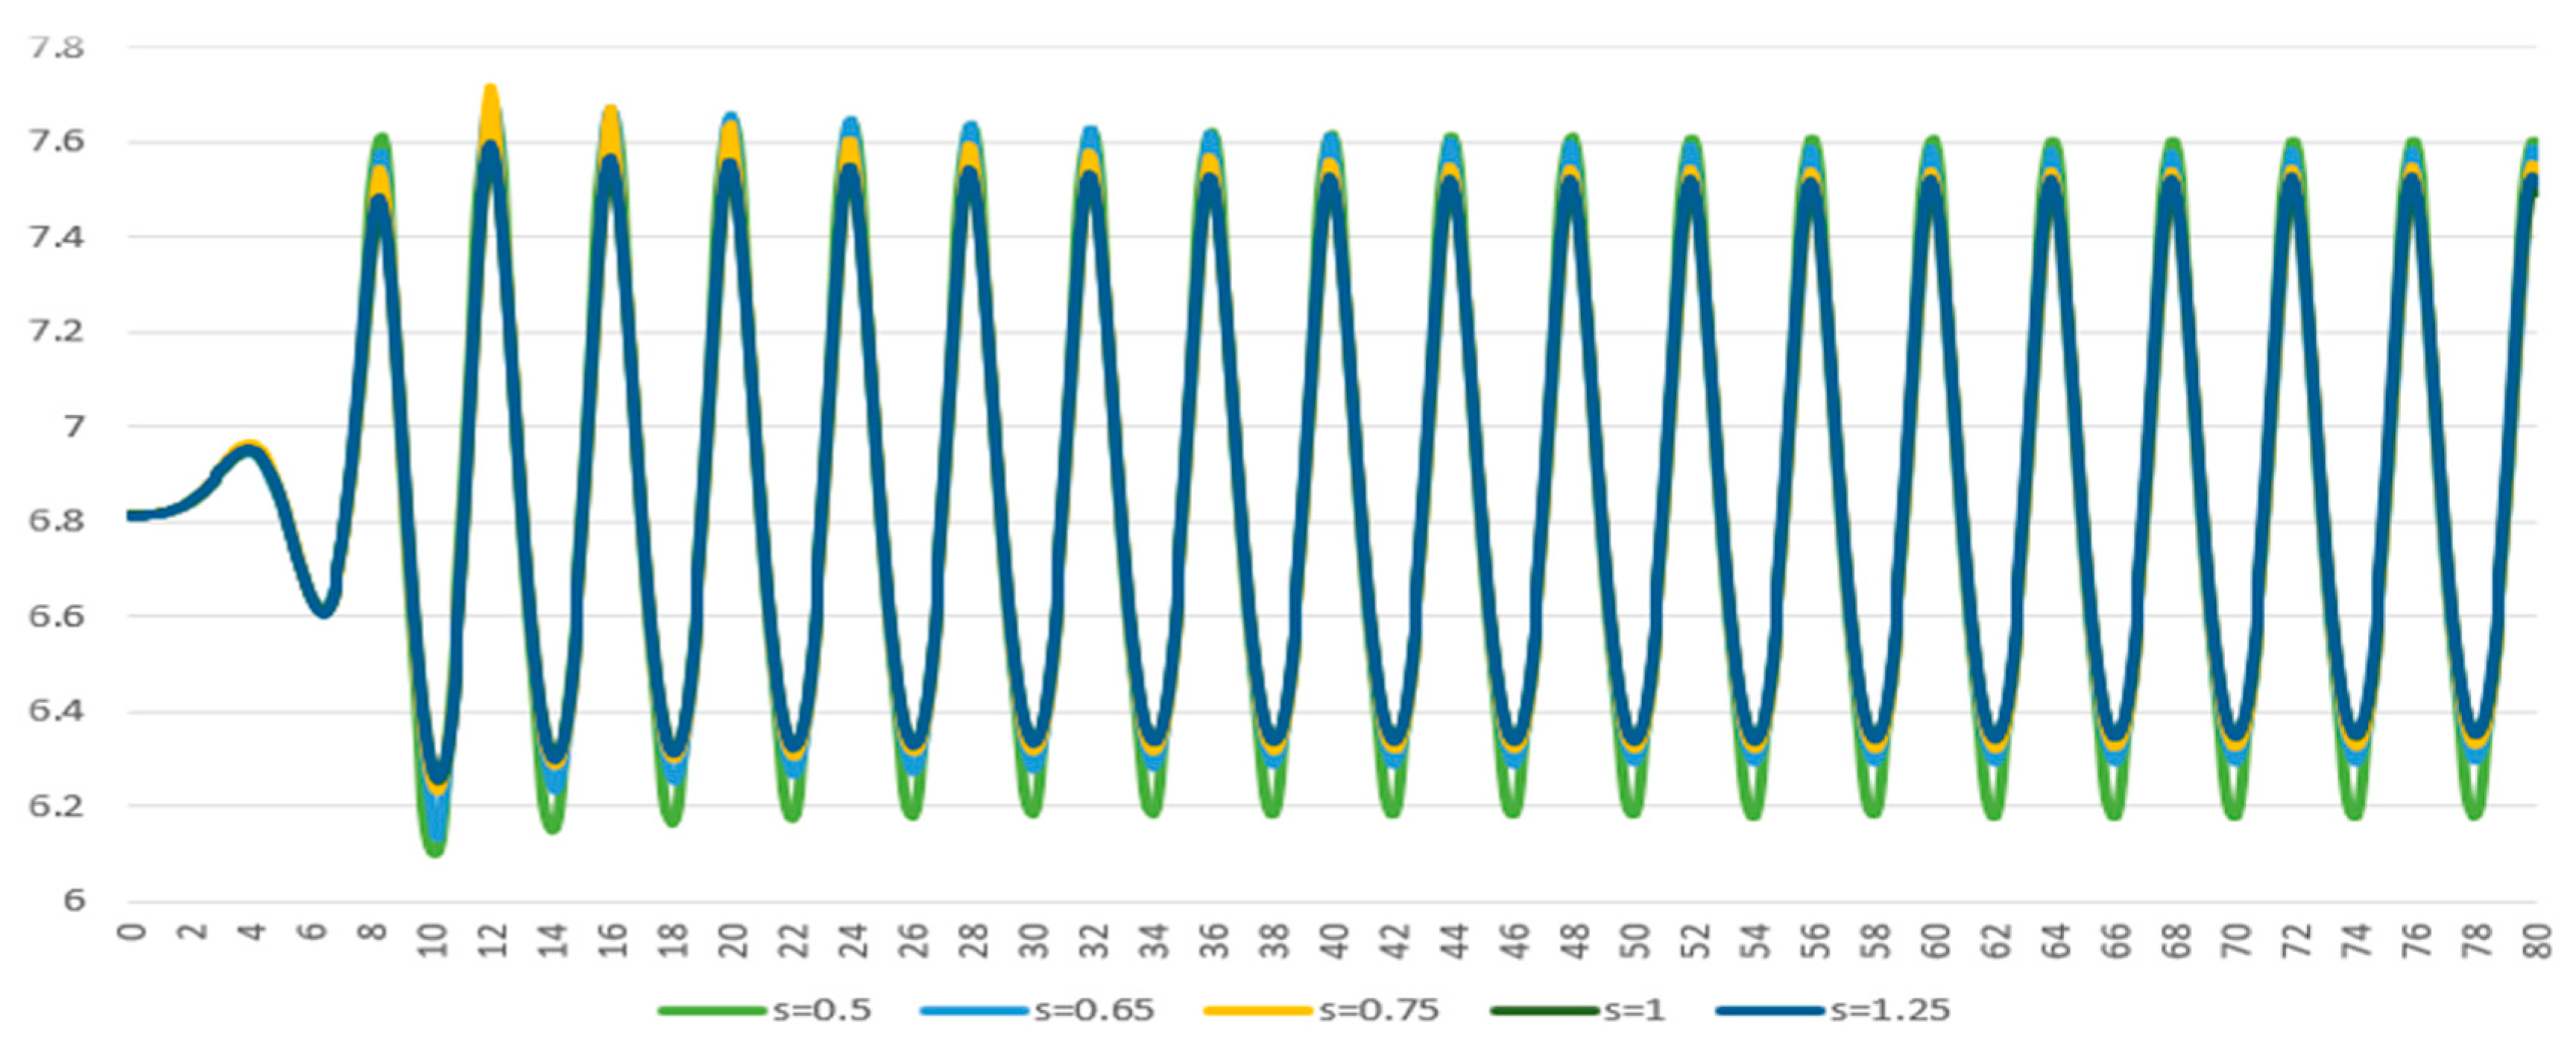
All mesh sets are tested using constant wave parameters: A = 0.785 m and T = 4 s. The wave generator is employed to reproduce wave propagation, with the incident velocity defined using a UDF based on Stokes’ second-order wave theory. Data is collected at x = 25 m, where free surface elevations are recorded without placing OBS in NWT, as shown in
Figure 7.
Free surface wave amplitudes are recorded after the wave stabilizes in the NWT. The measured average amplitudes for each element size are presented in
Table 3 and compared with the analytical amplitude of 0.77 m. The mesh size of 1.25 m yields the largest error at 23.32% while the 0.5 m mesh produces the smallest error at 6.39%.
For the element size of 0.5 m, the mesh count is 1,462,880, which is relatively high and significantly increases the computational cost. Introducing the OBS into the tank further increases both the mesh count and computational cost substantially.
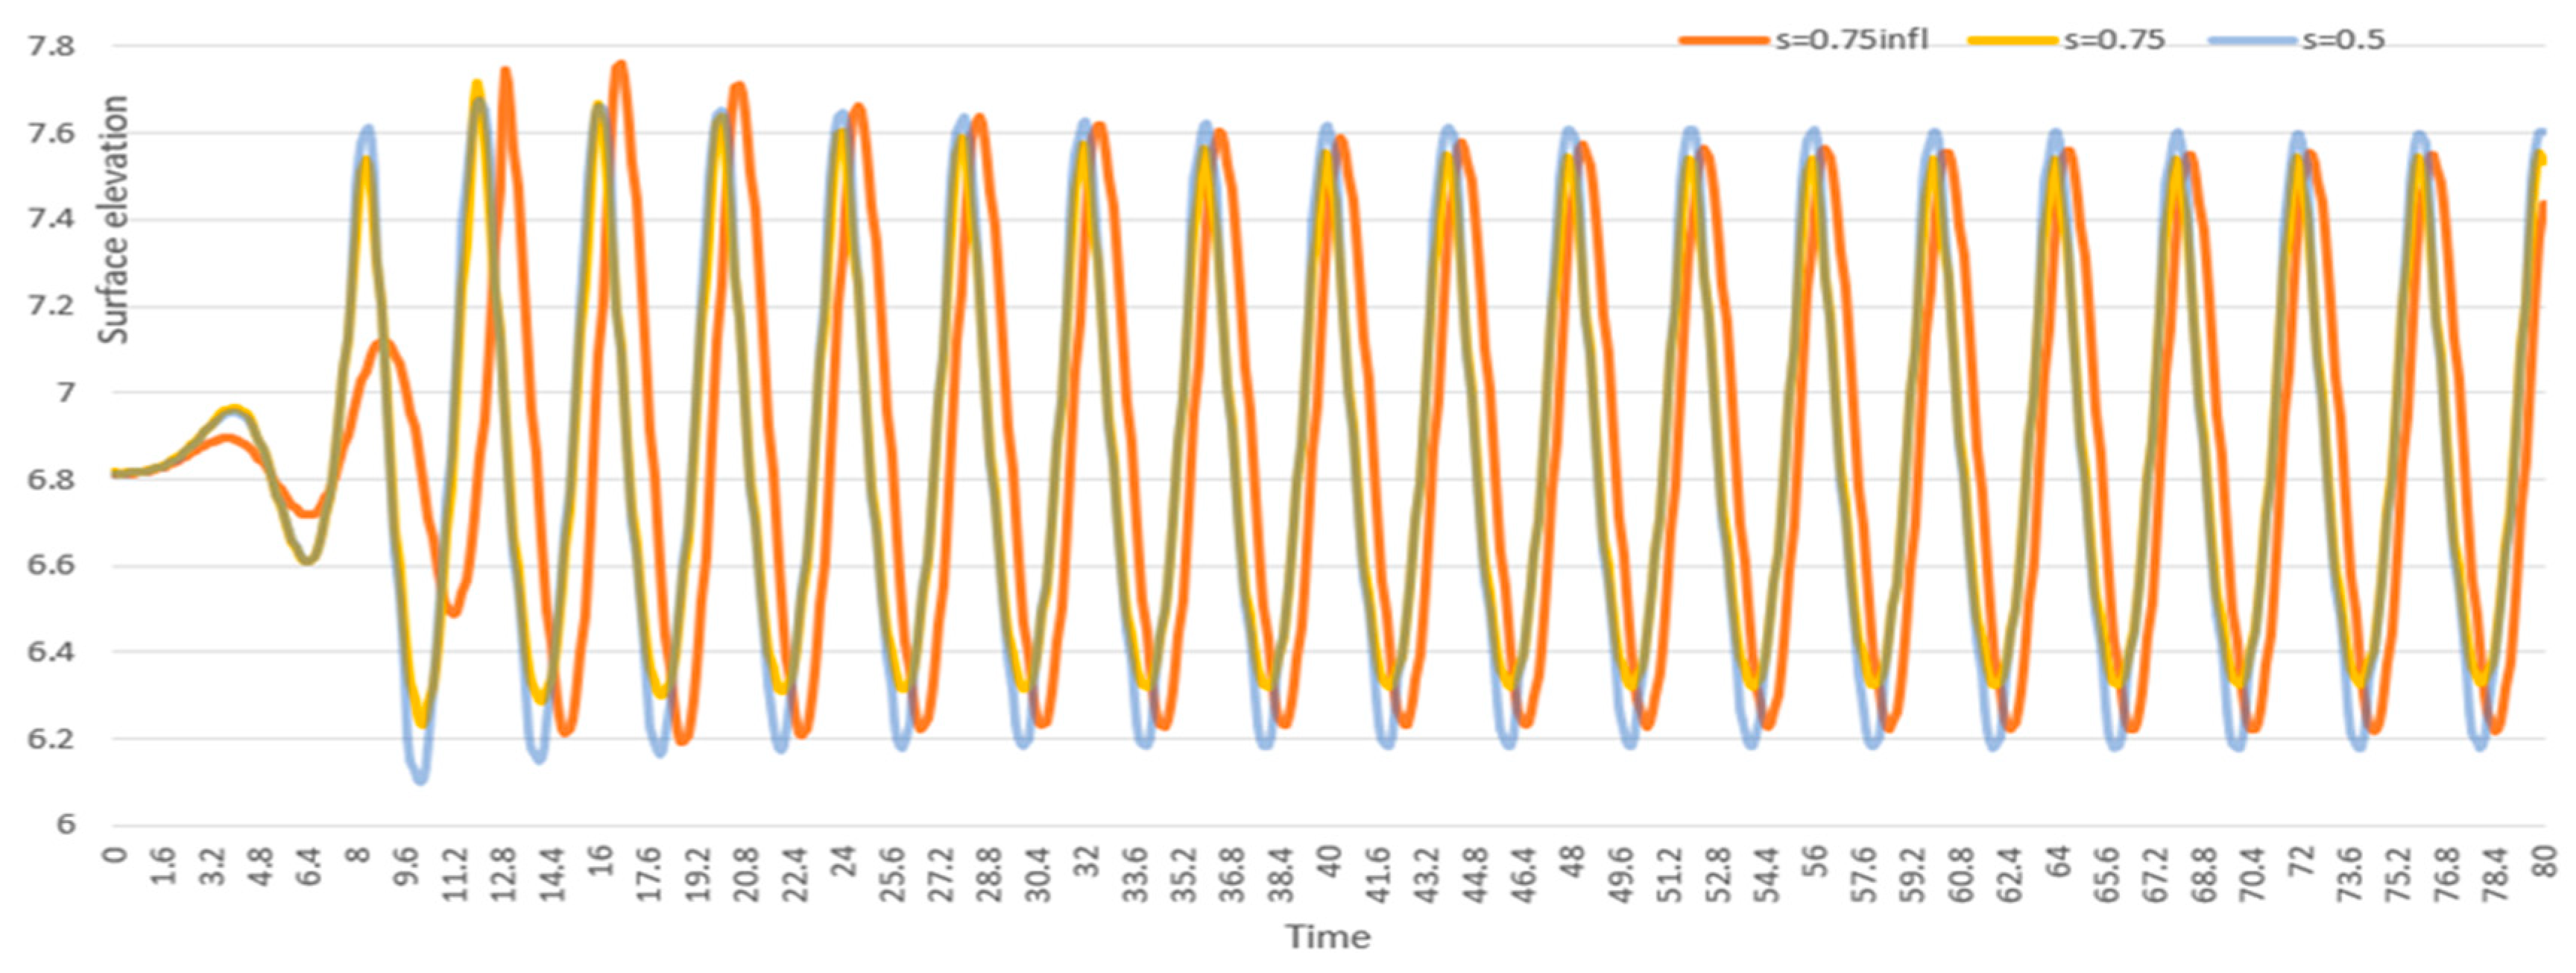
To maintain optimal performance by keeping mesh count and computational cost reasonable, it is important to improve the mesh quality at the air-water interface. For this purpose, the mesh is refined in a region extending one meter above and one meter below the interface. Within this zone, the grid is progressively refined using a ratio of 1.05. An element size of 0.75 m is used in the simulation. Surface elevation data at location x = 25 m in the NWT is collected and compared for mesh element sizes of 0.5 and 0.75 without mesh refinement. The results are shown in
Figure 8 for the same location.
Data is collected after the wave gets stabilized in the NWT. The difference in mesh count and wave amplitude error, compared to the analytical value of 0.77 m, are presented in
Table 4. When comparing the mesh size of 0.5 m and 0.75 m with interface refinement, the mesh count is reduced by 465,300, with only a 0.3% difference in wave amplitude. This result indicates that mesh refinement at the interface significantly improves computational accuracy while reducing the overall mesh size.
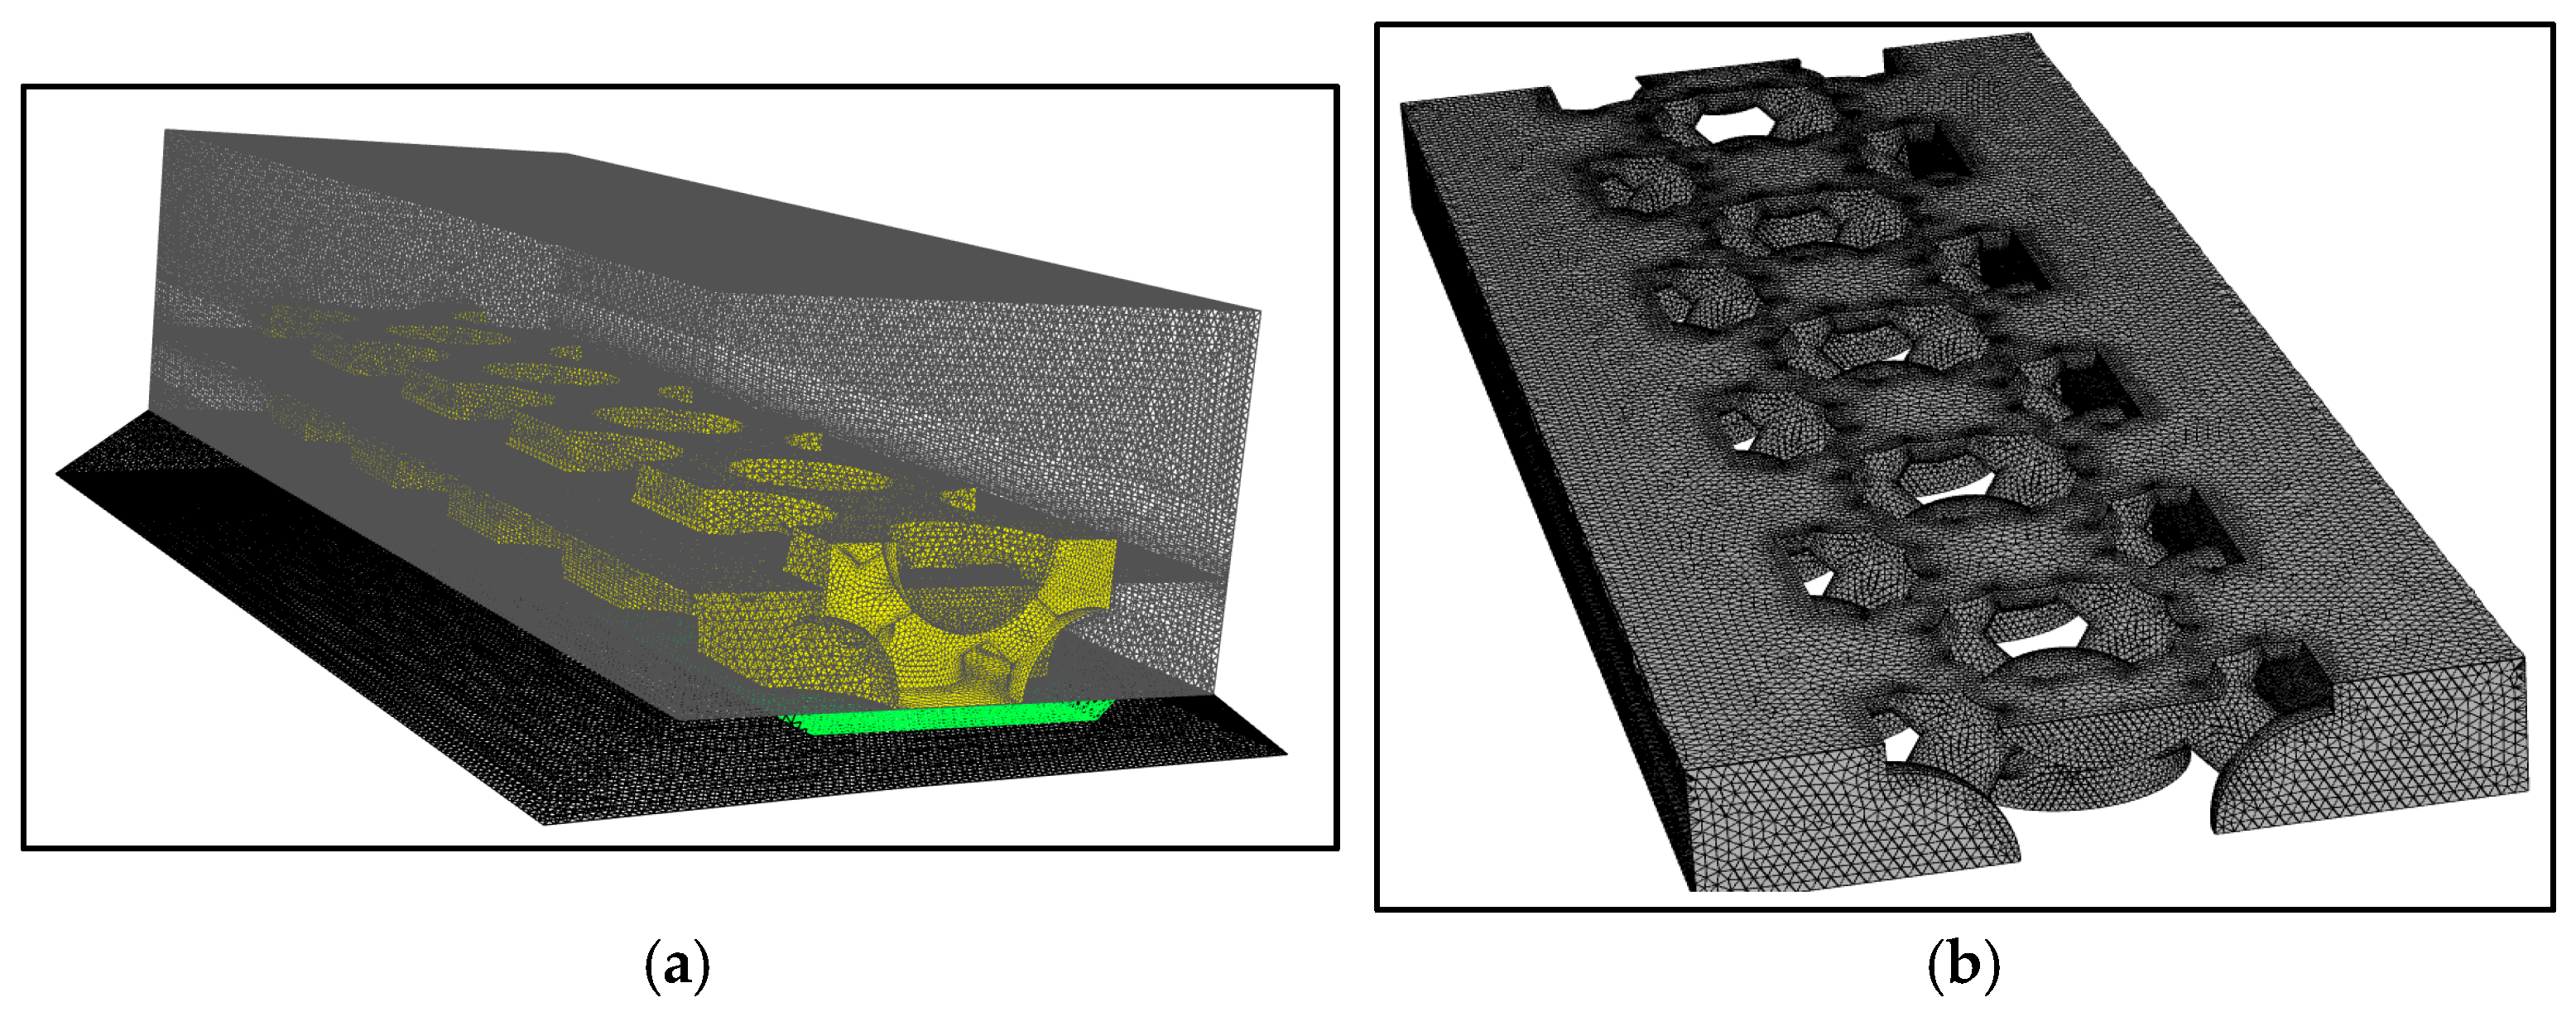
The mesh size of 0.75 with refinement at the air-water interface is chosen to further study the wave interaction with OBS in NWT. The entire NWT model is meshed using hexahedral elements. Additional mesh refinement is applied around the structure by introducing tetrahedral elements near the OBS and porous beds to capture enhanced detail, as shown in
Figure 9. Consequently, the total mesh count increases to 1,550,000 cells.
Tetrahedral elements with size 0.1 m are chosen for the mesh zone surrounding the OBS and porous medium, as shown in
Figure 10a. The capture curvature feature is applied with a minimum element size of 0.02 m to better approximate the spherical and conical regions near the bricks. The flow adjacent to a wall surface forms a boundary characterized by velocity gradients dominated by viscous effects. The y+ value indicates the relative importance of viscous forces within the boundary flow sublayer and the turbulence effects. The y+ value is expected to be within the 50–500 range to accurately capture boundary flow for the SST k-omega model. The current mesh achieves a y+ value of 259 in the wake zone near the OBS and porous region. To maintain an appropriate y+ value, the mesh gradually transitions from larger to smaller elements, as illustrated in the cross-sectional interface between the OBS and water in
Figure 10b.
3.3. Validation
Firstly, validation is conducted in the linear depth NWT using a wavelength of 3.51 m, wave amplitude of 0.1 m, time-period of 2 s, and a still water depth (free surface) of 1 m.
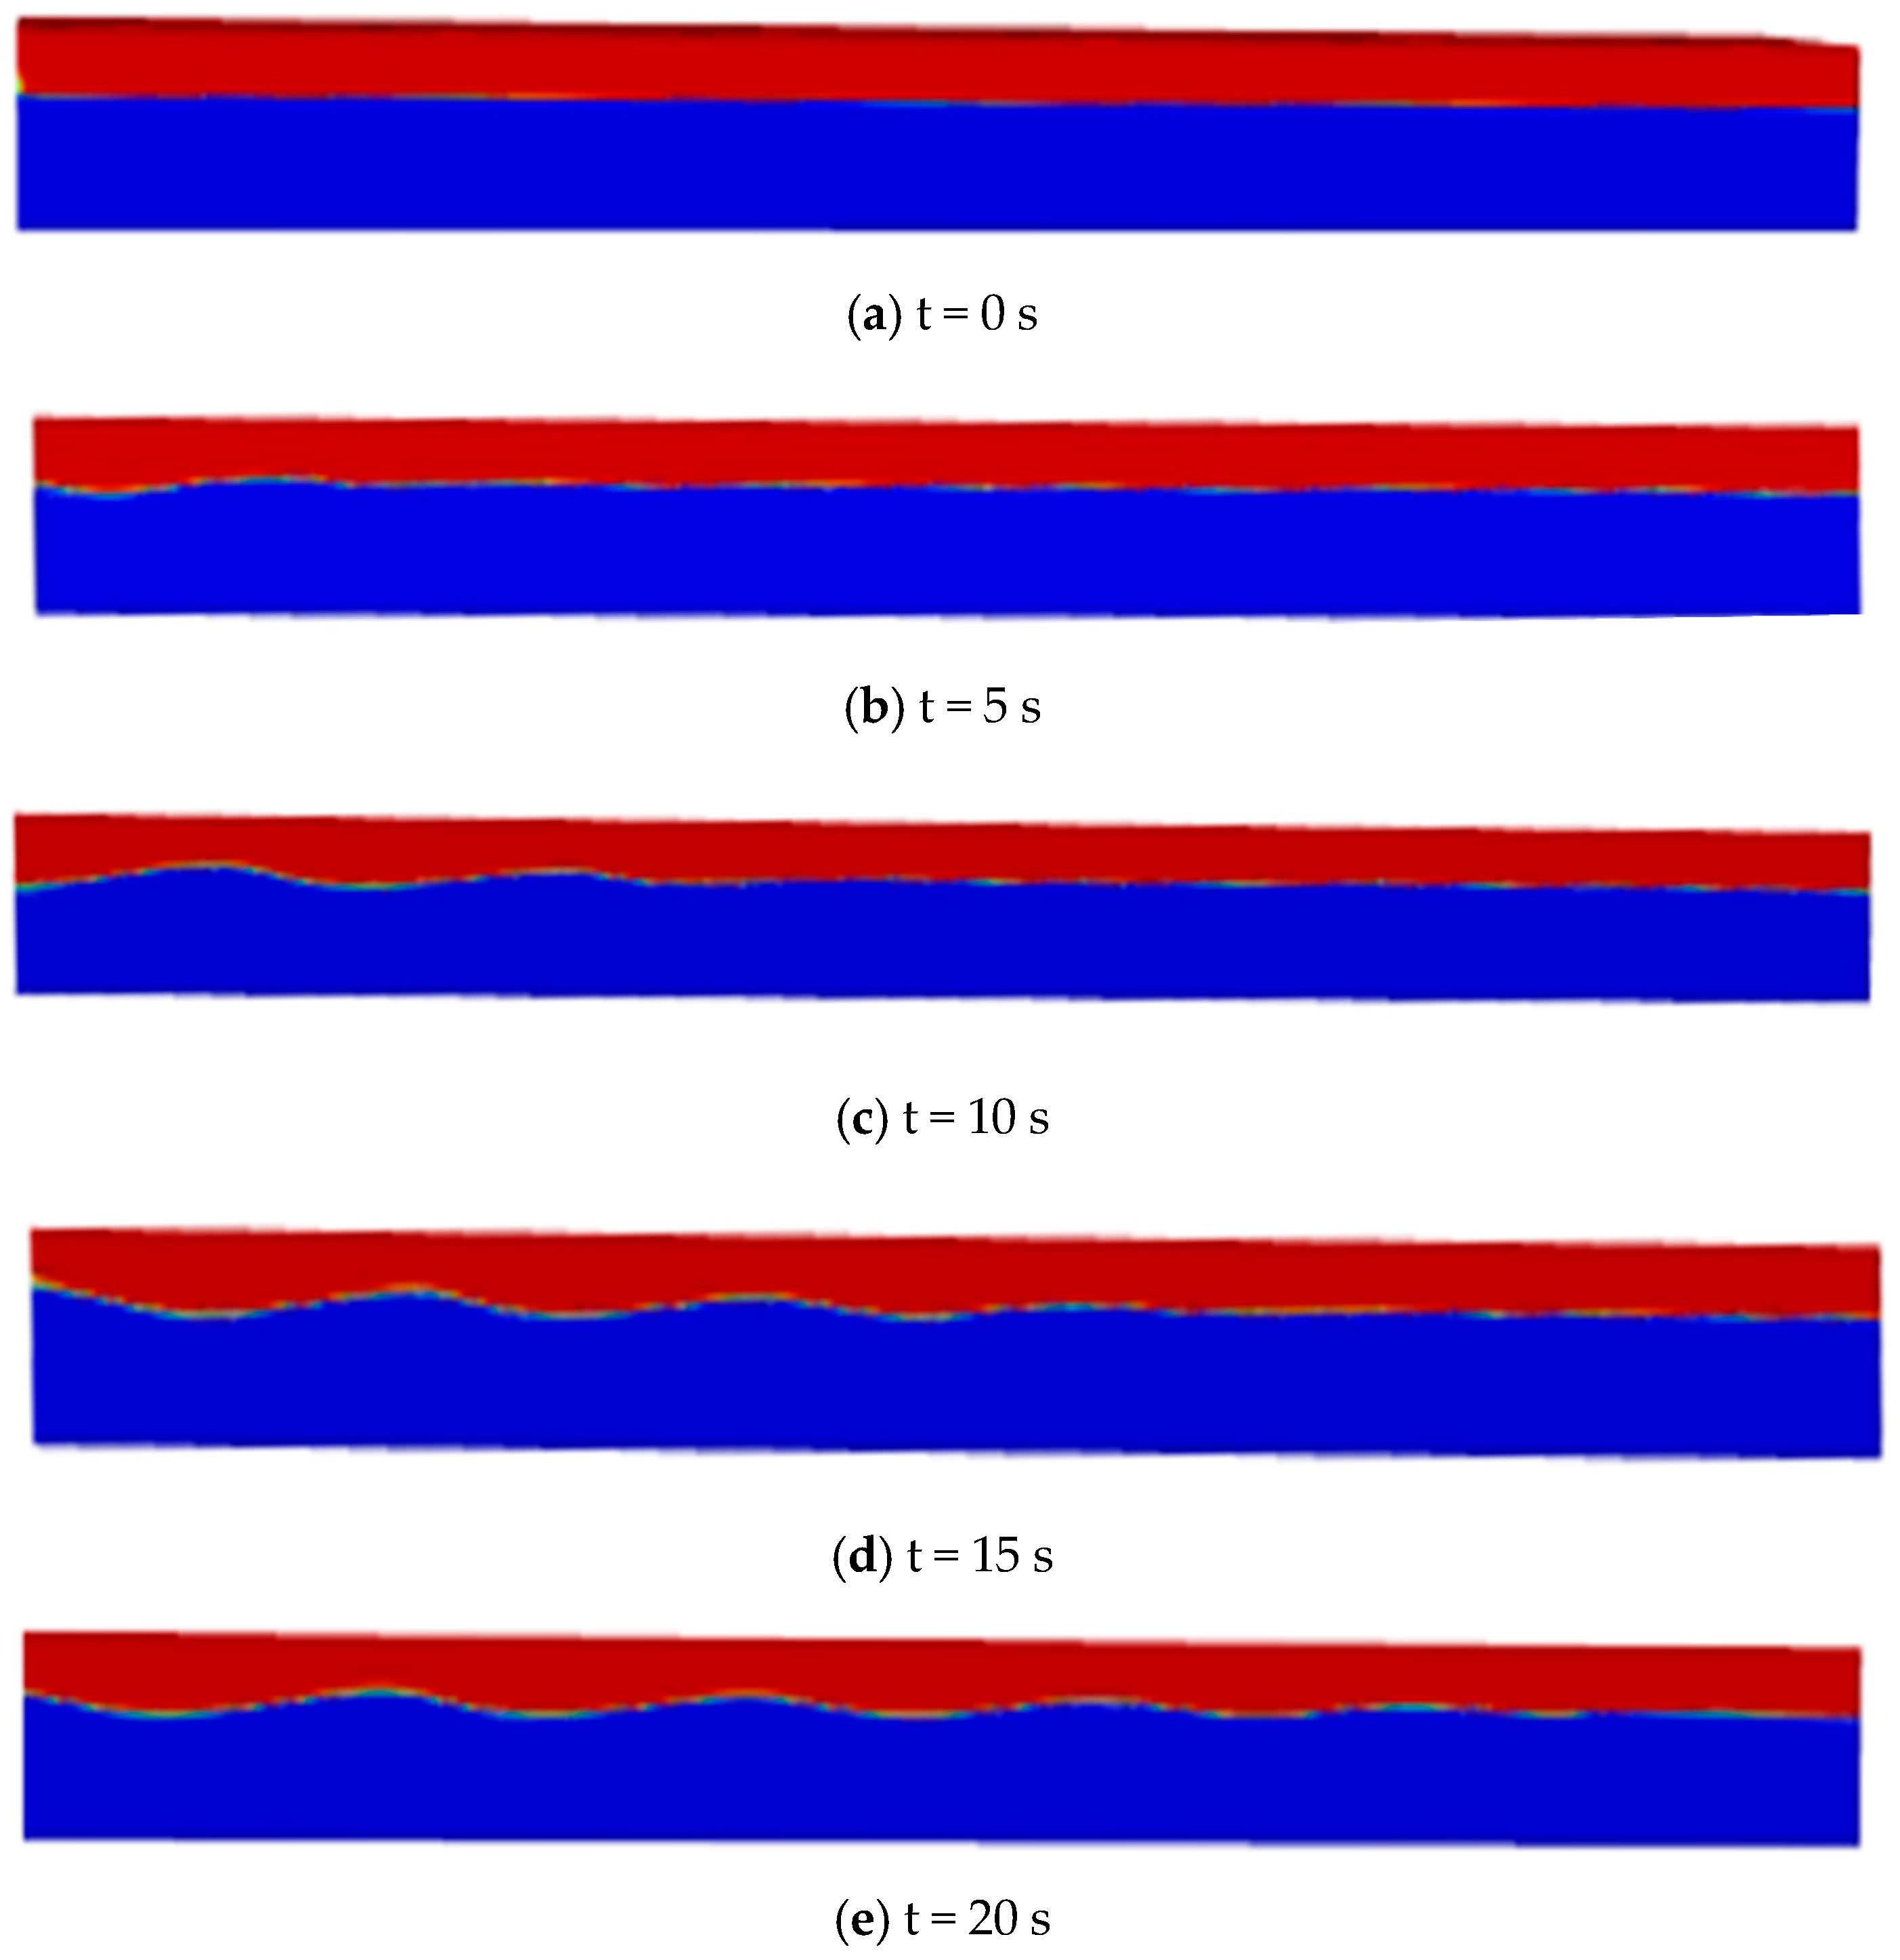
In
Figure 11, the blue-colored region signifies water, while the red-colored region indicates air.
Figure 11 illustrates wave propagation at various time steps.
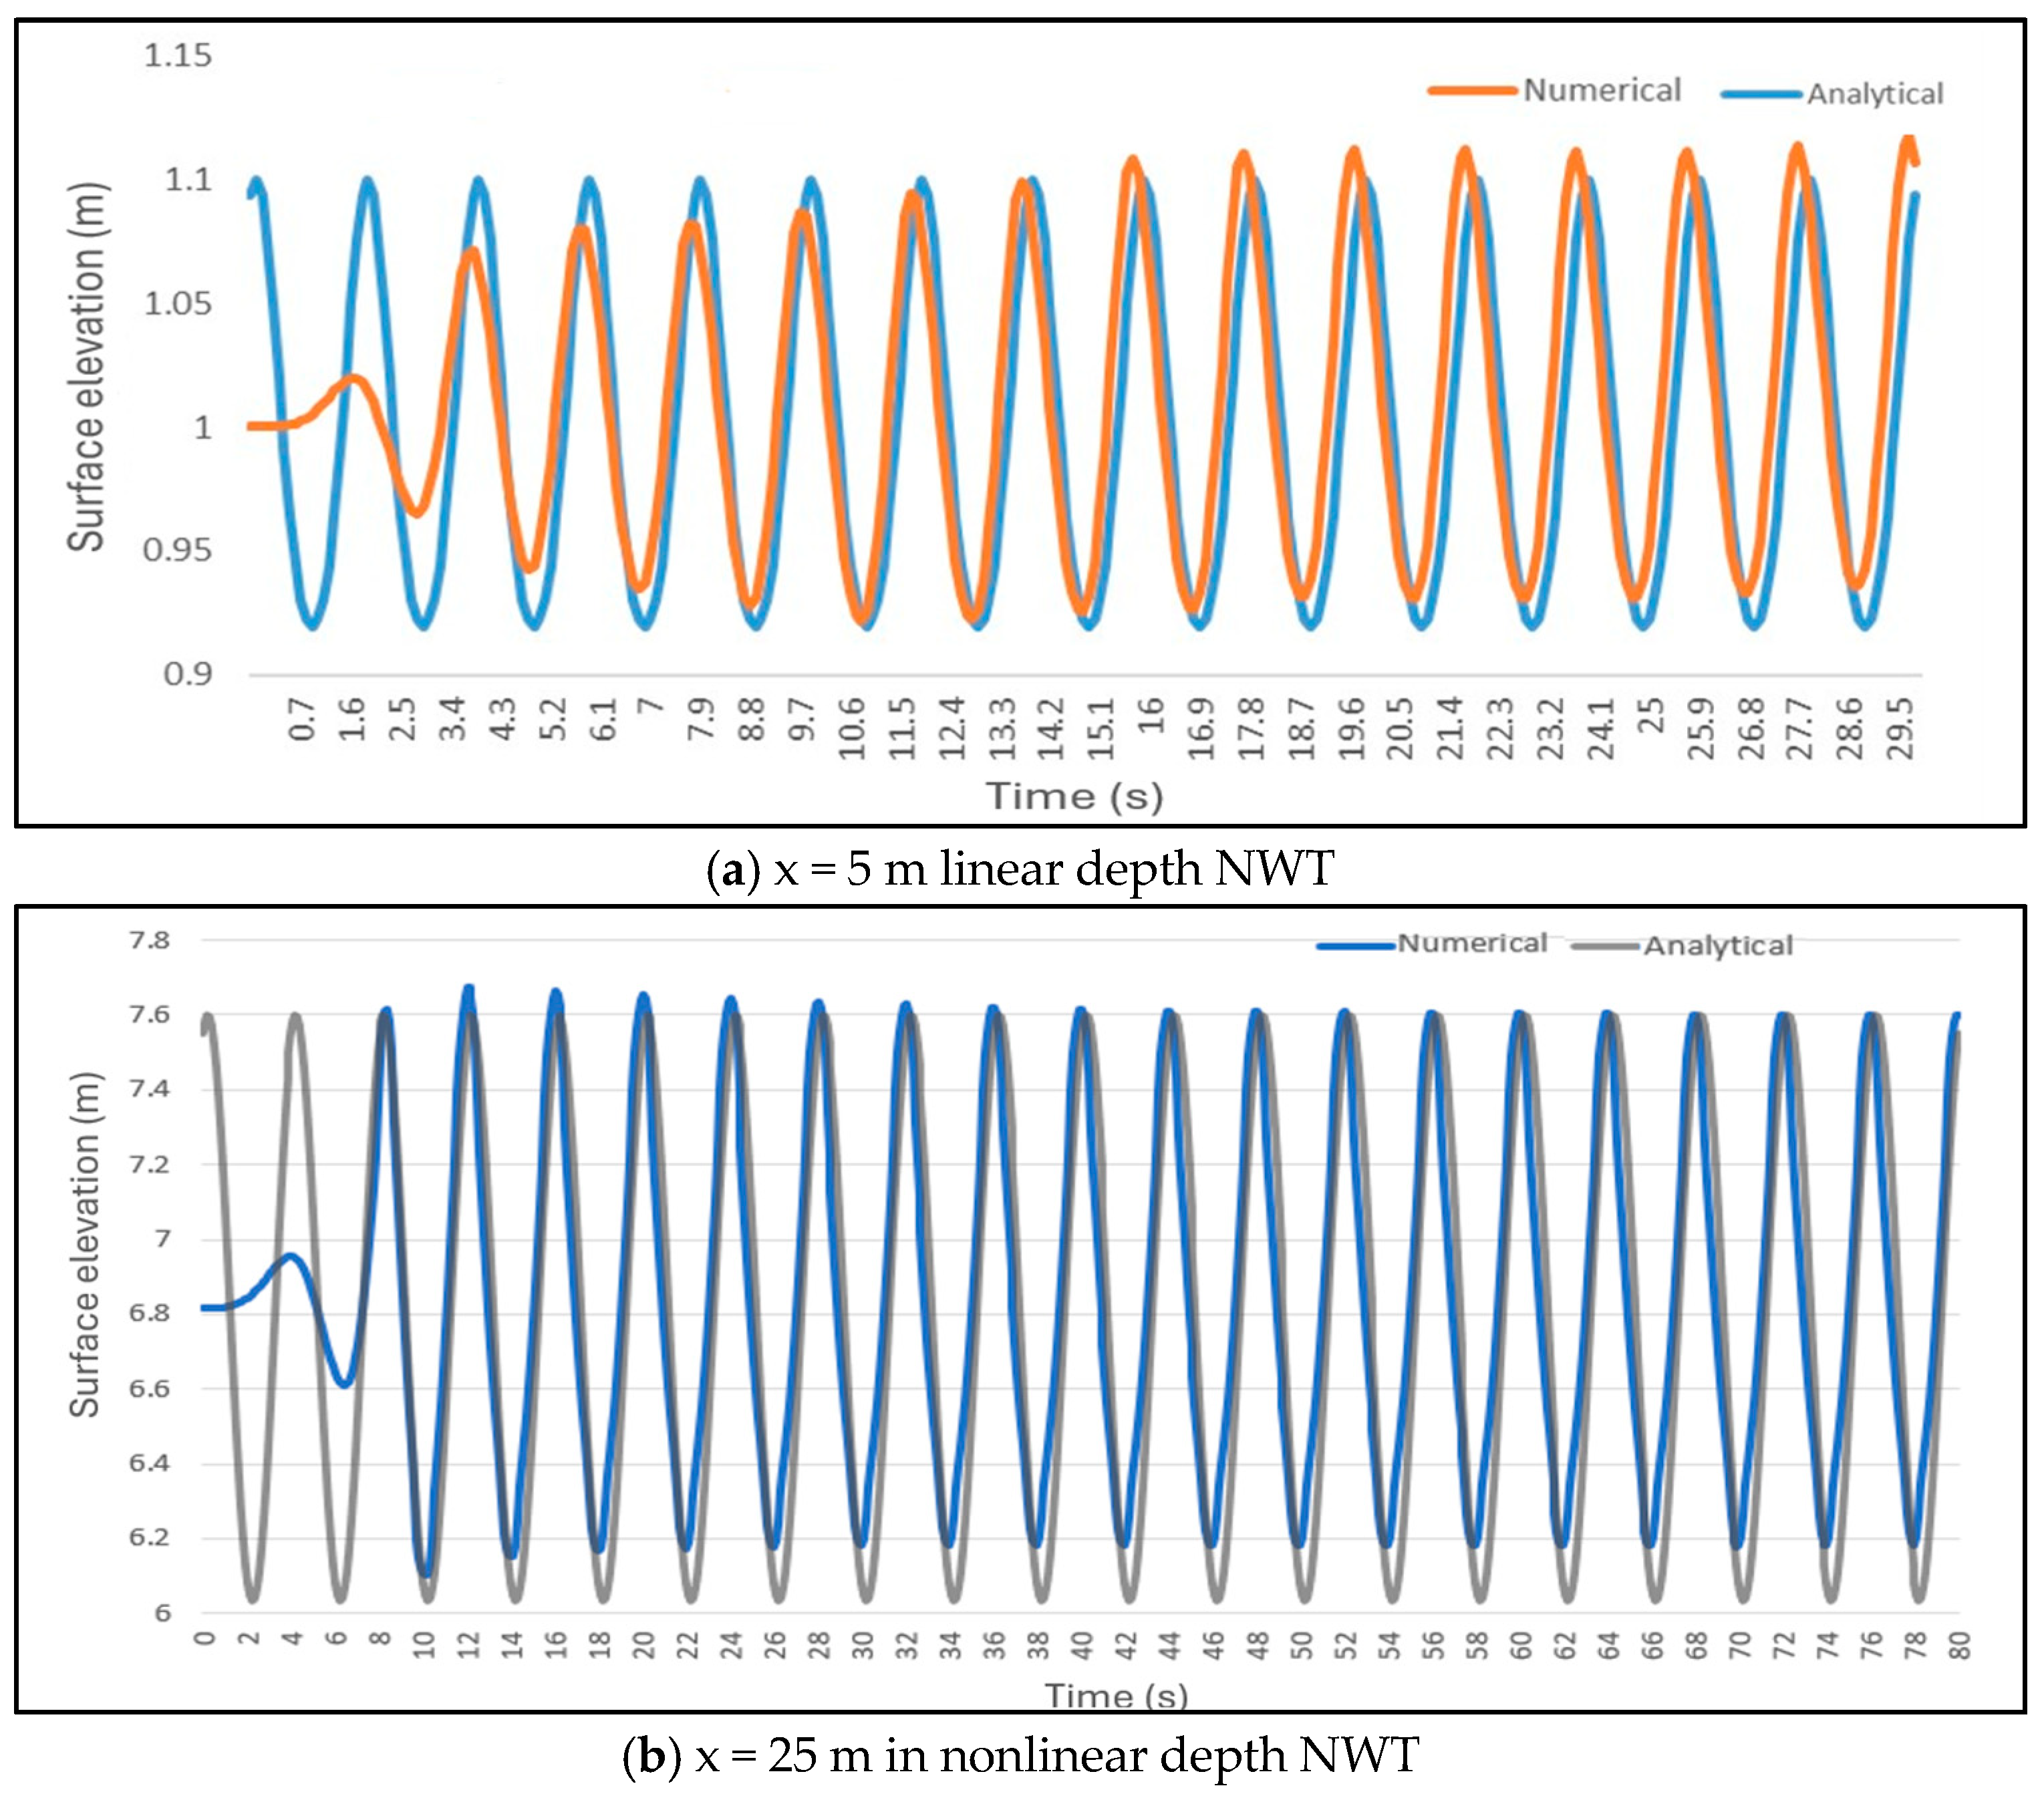
To validate the current numerical setup for simulating intermediate-depth gravity waves, the free surface elevation in the NWT is compared with the analytical solution, please refer to Equation (6), based on Stokes second order wave theory [
25].
Figure 12a shows the free surface elevation of numerical wave collected at x = 5 m for wave characteristics of A = 0.1 m and T = 2 s in linear depth NWT.
Figure 12b presents data collected at x = 25 m for wave characteristics A = 0.785 m and T = 4 s in nonlinear depth NWT. In both cases, the free surface elevations were recorded without introducing the OBS into the NWT.
At first, the free surface elevations produced in both NWTs are lower than those predicted by the analytical solution. However, after a certain period, the wave profiles stabilize and align with the numerical results, though some elevation is observed near the end of the tank due to wave reflections. In both cases, the analytical wave amplitude differs by approximately 0.05 m from the average numerical wave amplitude after stabilization. The percentage error difference is 6% for nonlinear NWT and 5% for linear NWT. These validation results confirm the effectiveness of the simulated numerical wave approach in generating intermediate gravity waves based on the Stokes second-order wave theory.
5. Discussion and Conclusions
In this study, a 3D numerical model is implemented to simulate wave propagation in both linear and nonlinear NWTs that mimic ocean wave behavior. Interactions between waves and the OBS are investigated through numerical analysis. The proposed NWT is verified by comparing the numerical results with the second-order Stokes analytical solution. Validation of the OBS simulation is achieved by comparing the numerical results with experimental data, showing good agreement—particularly in regions of highest pressure.
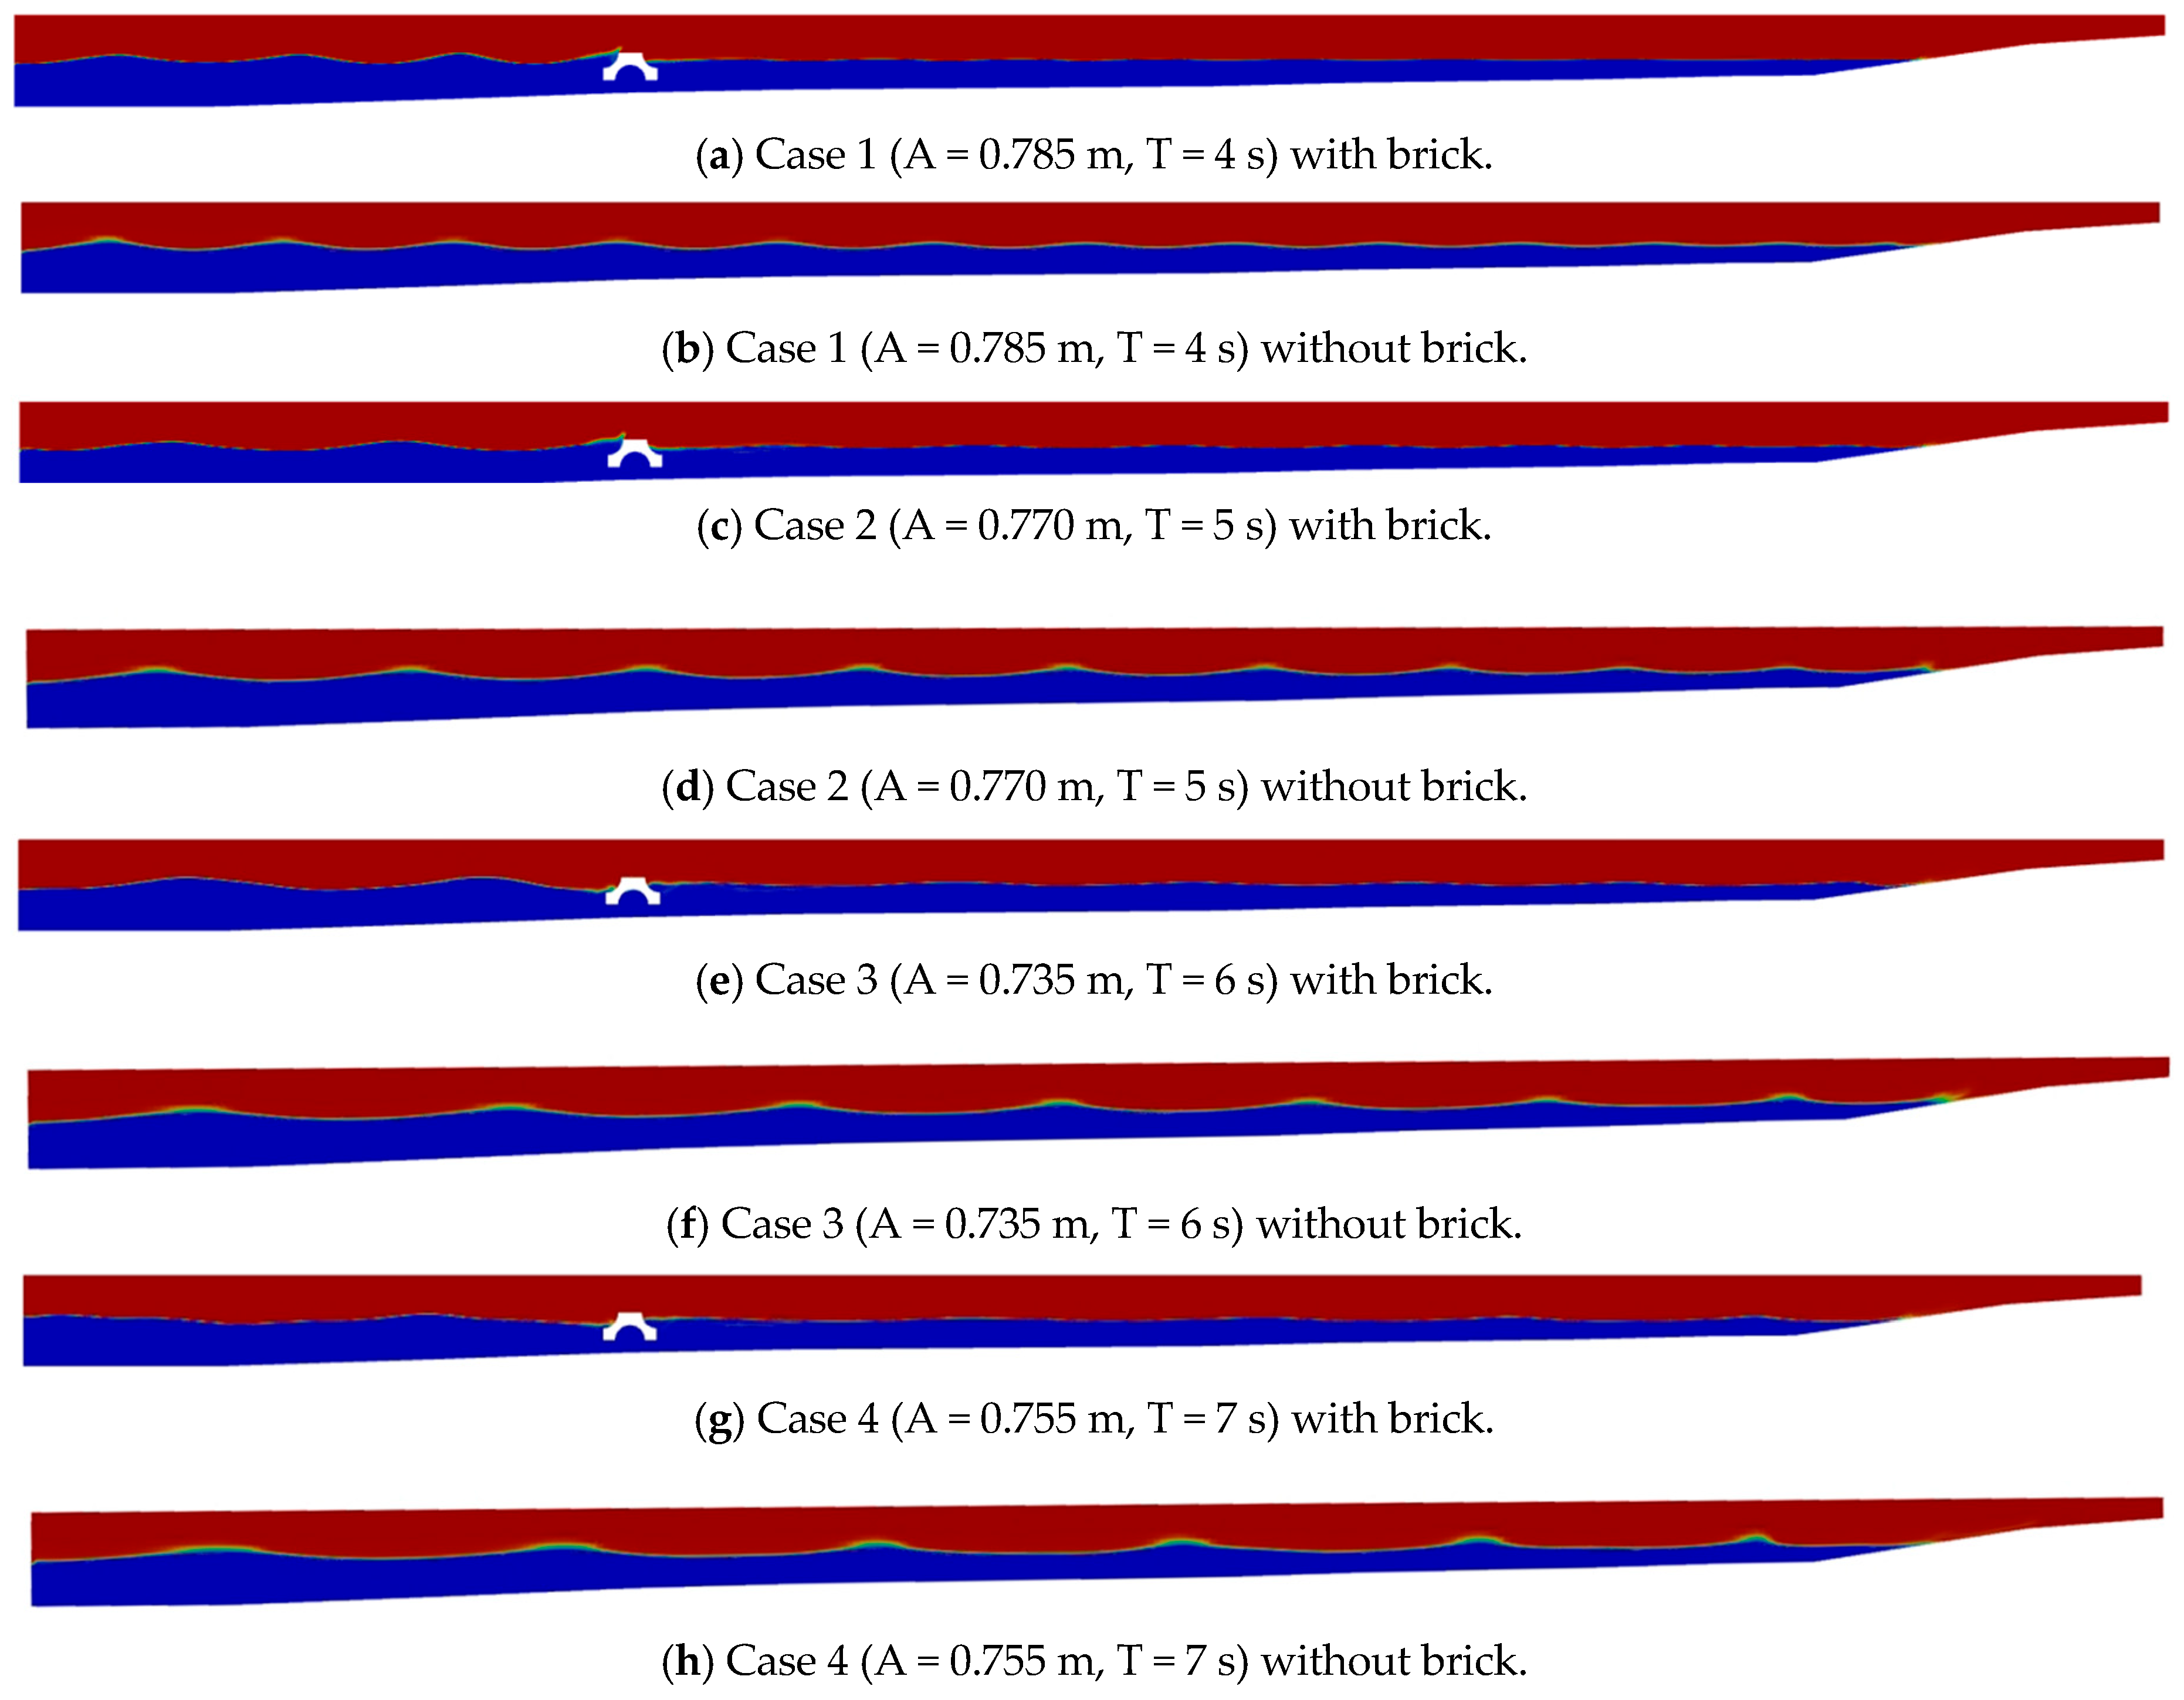
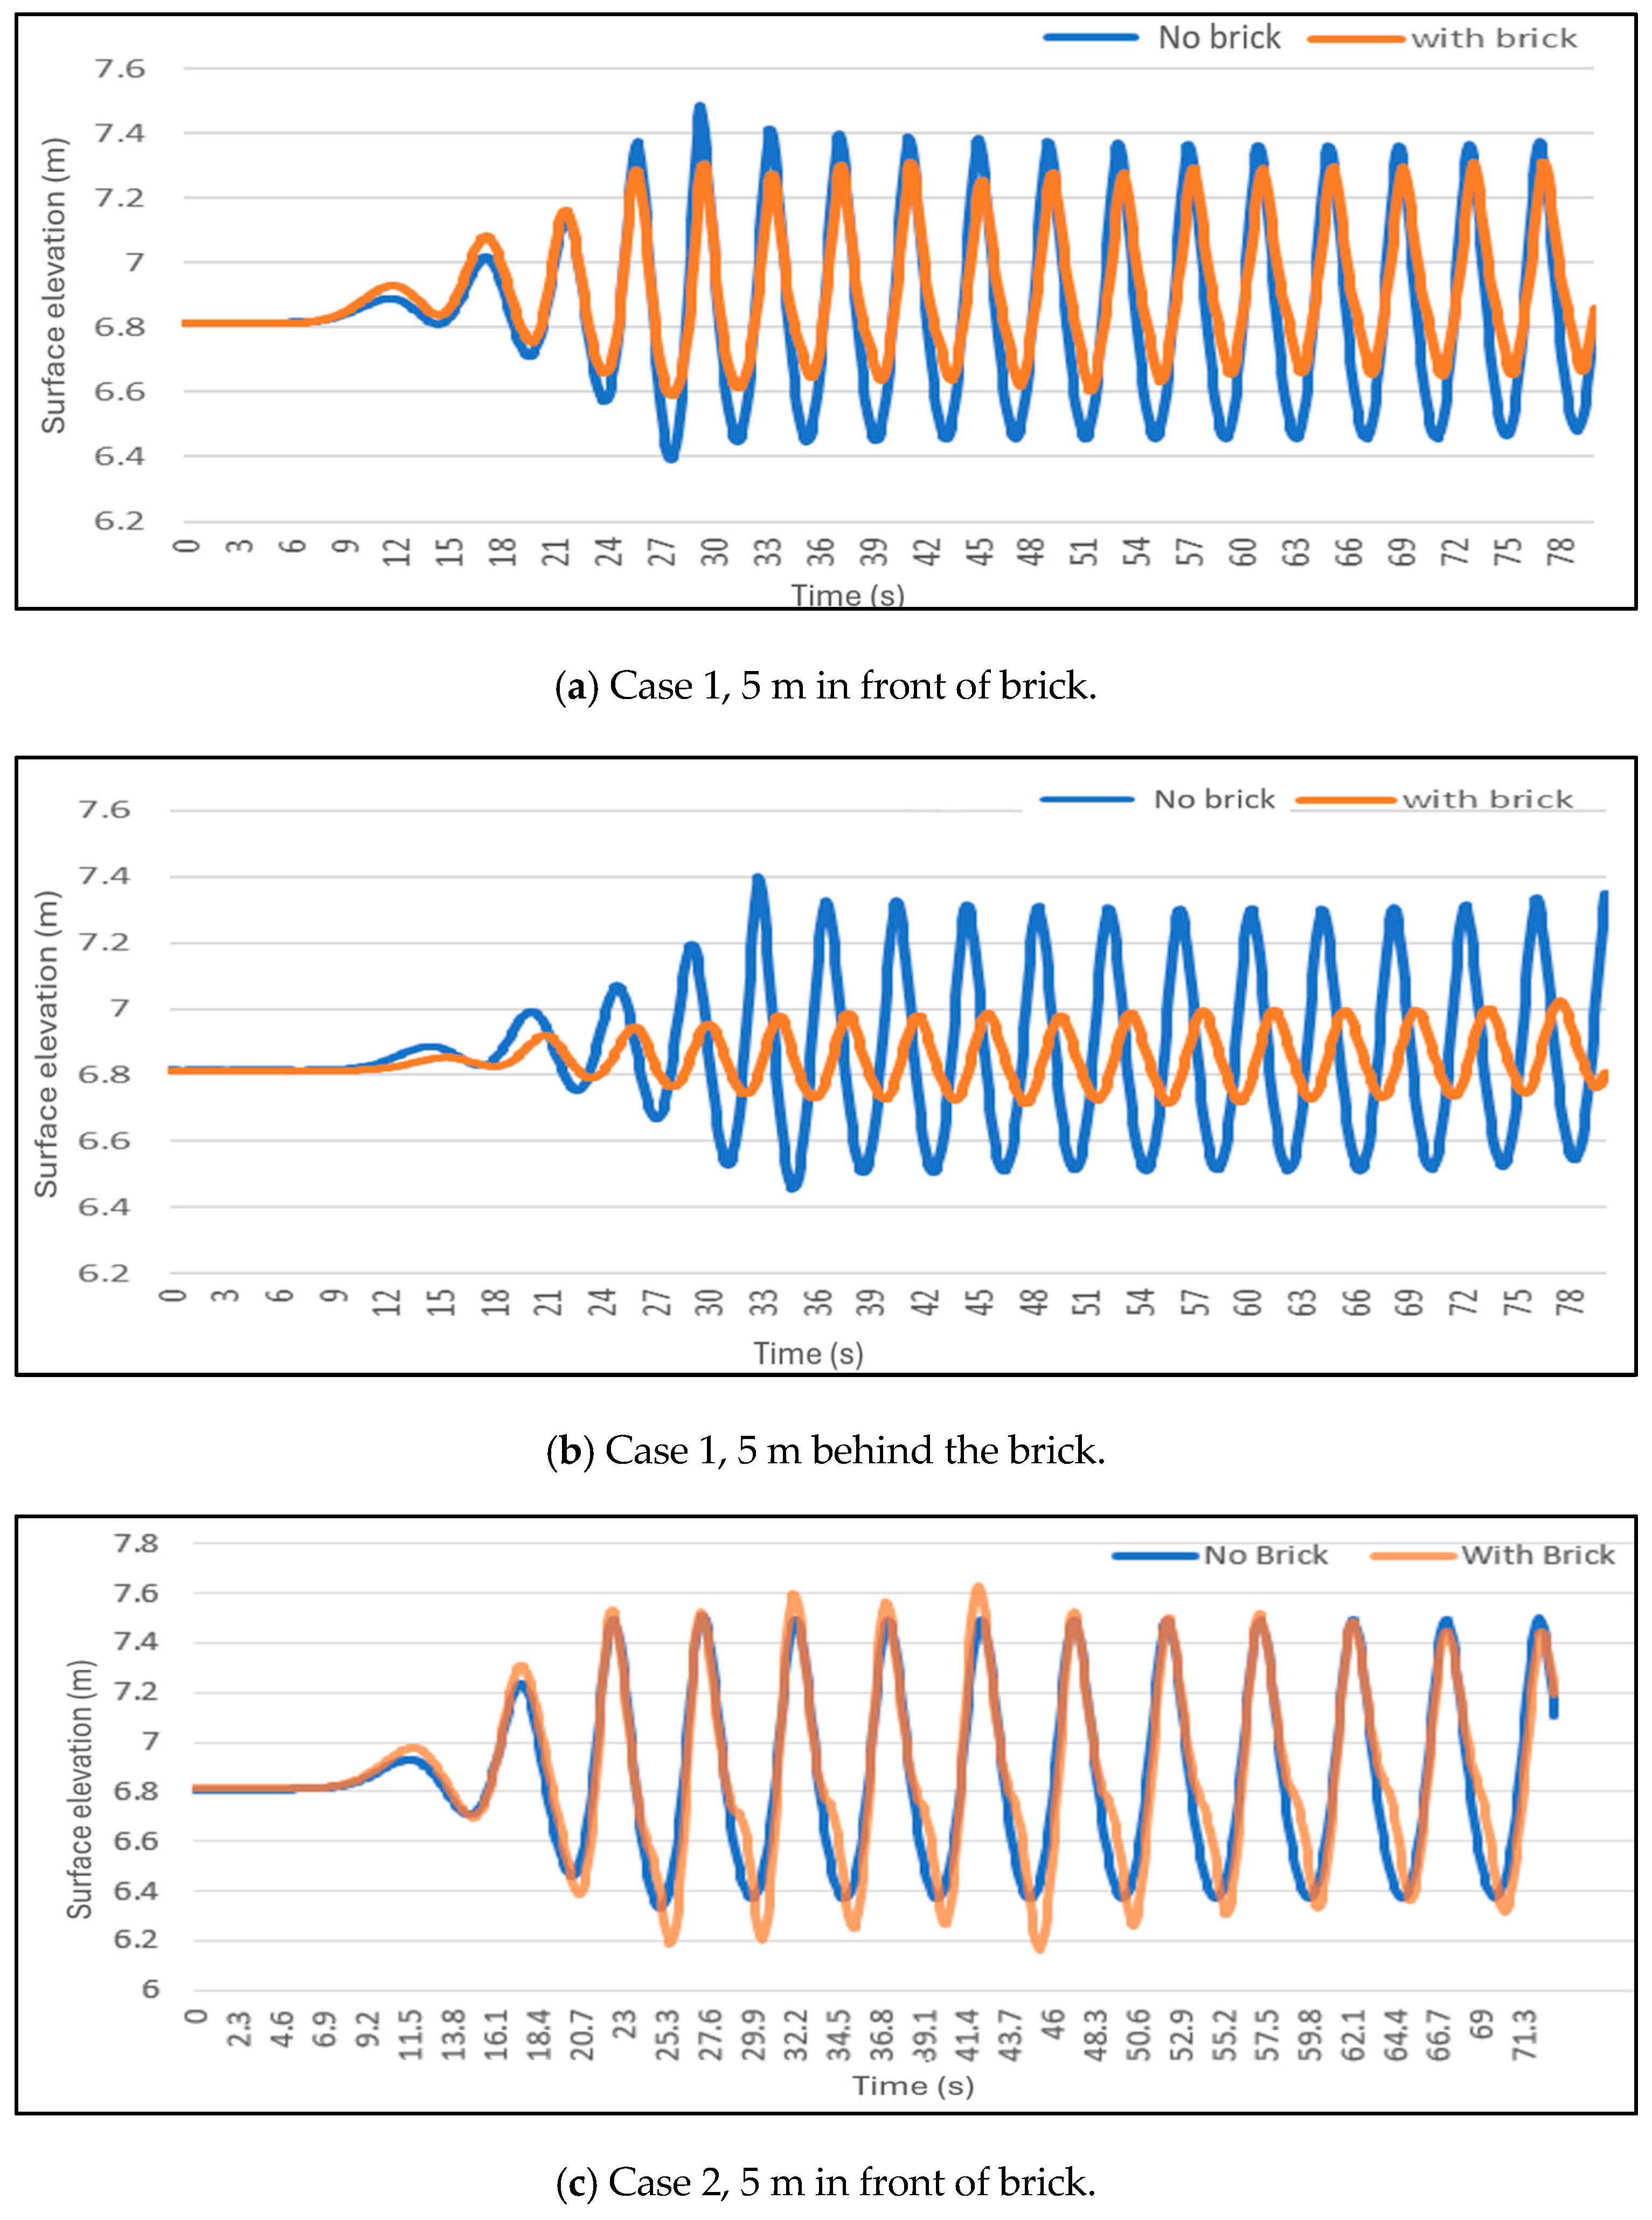
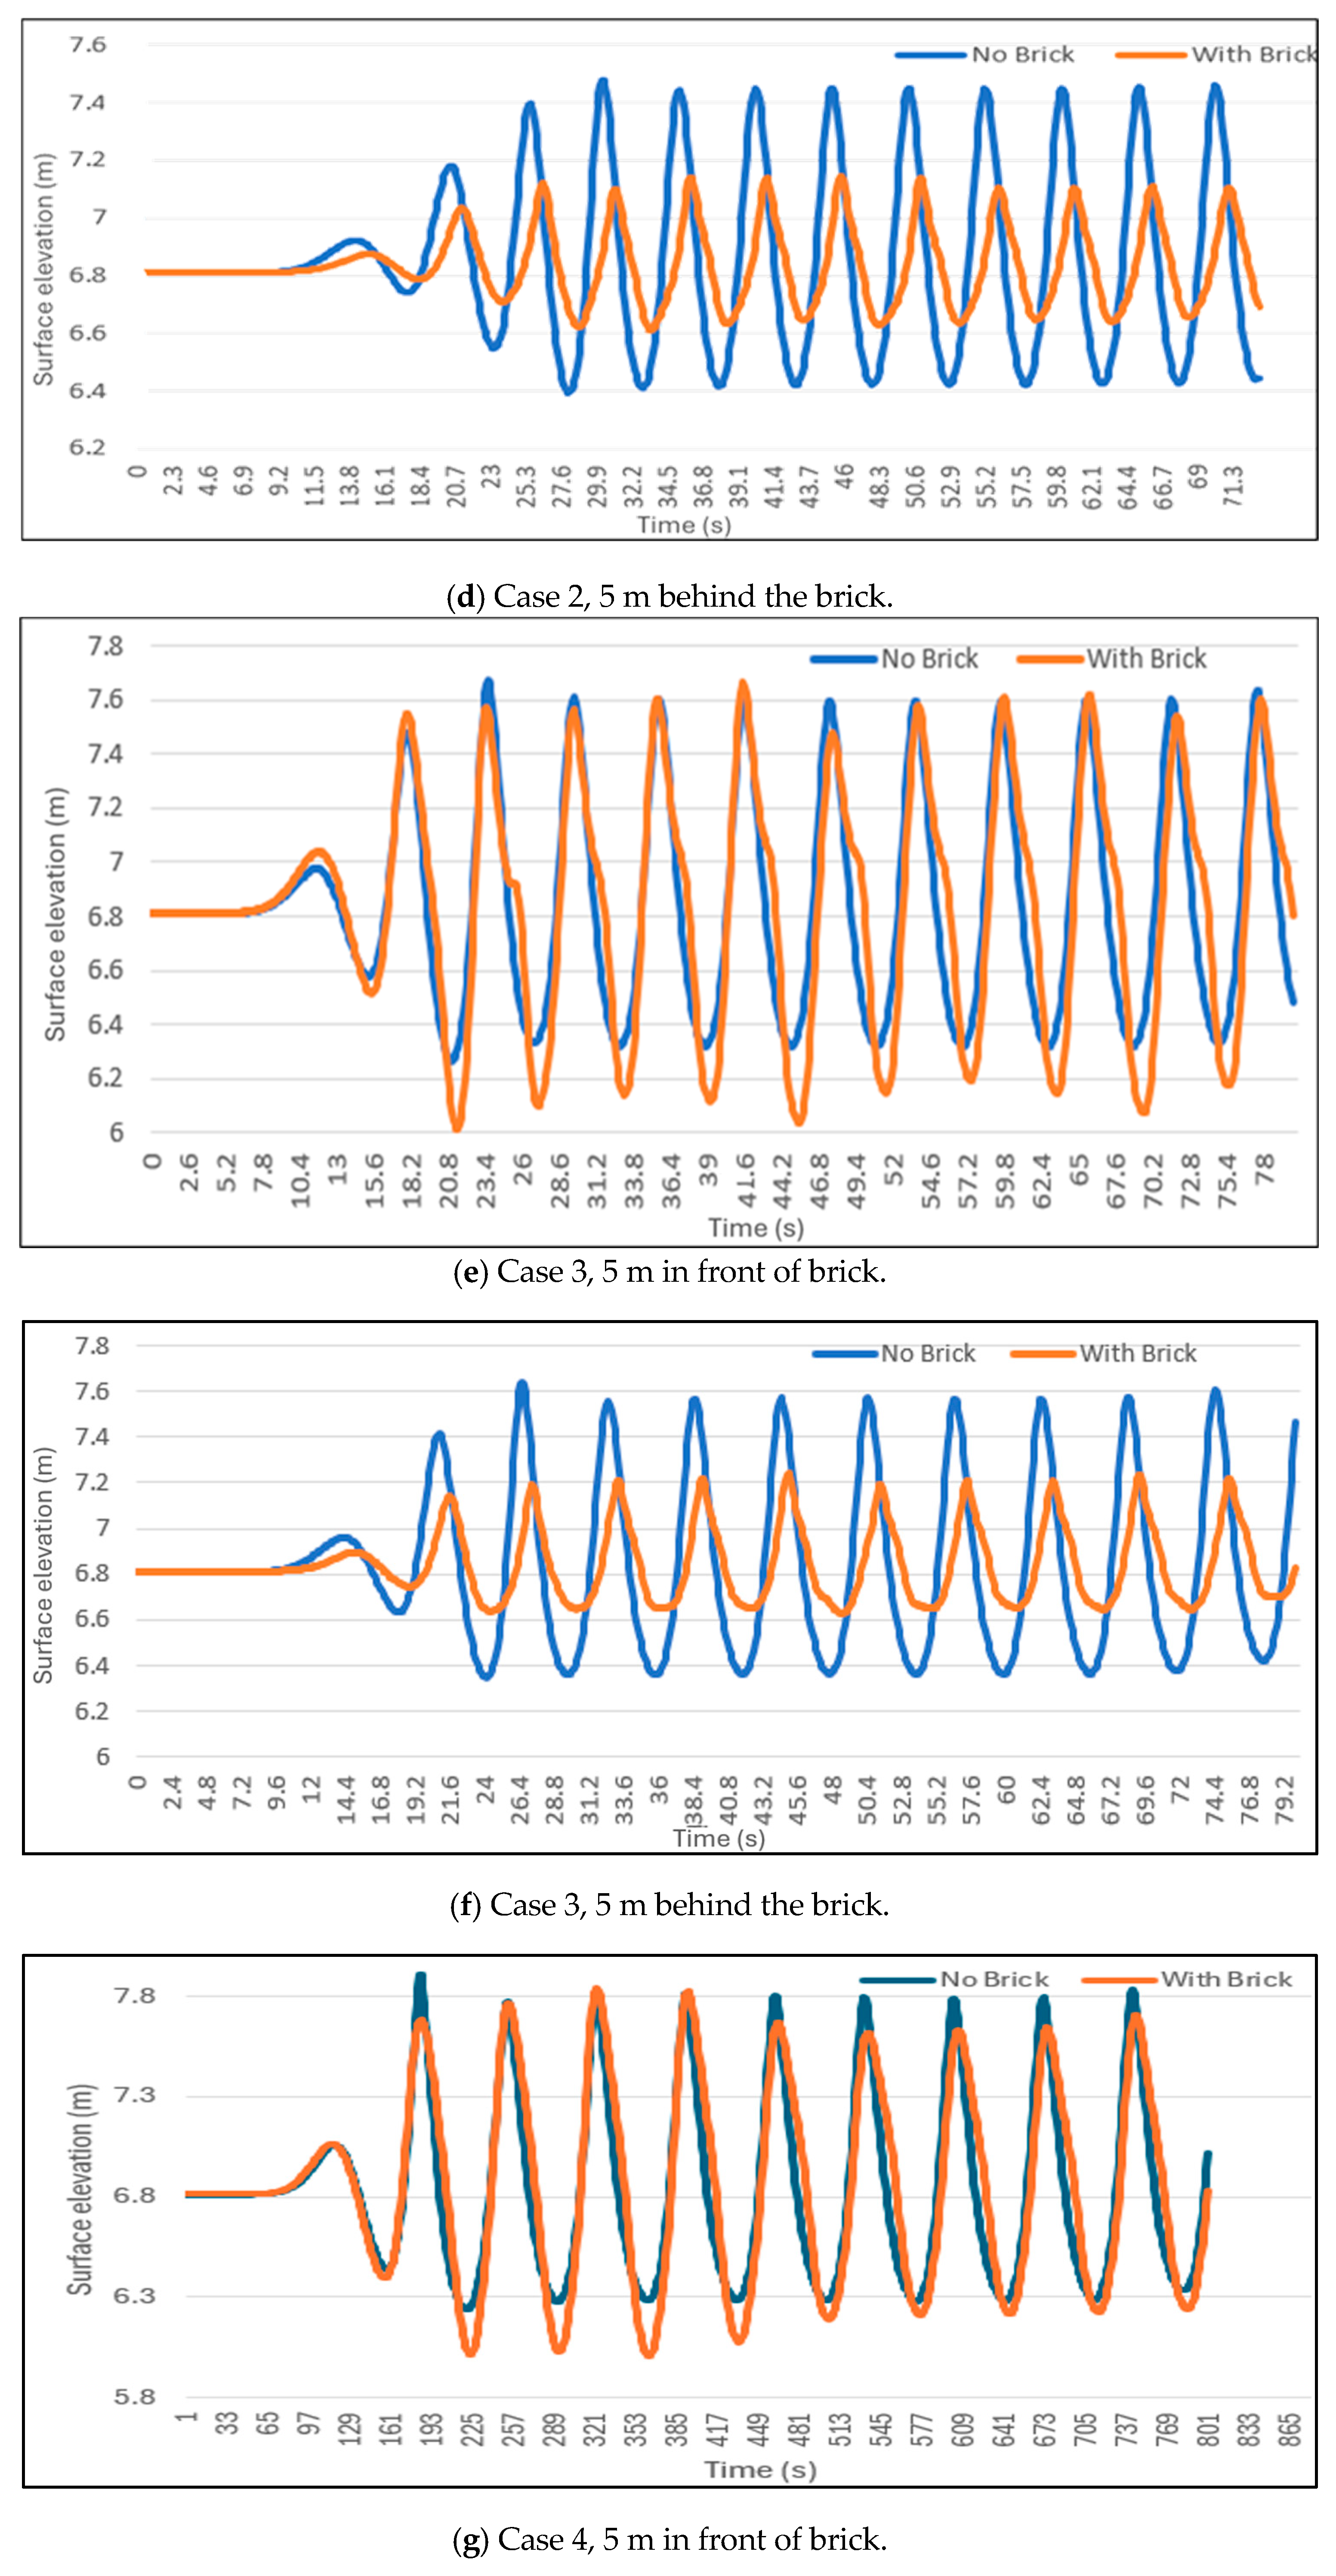
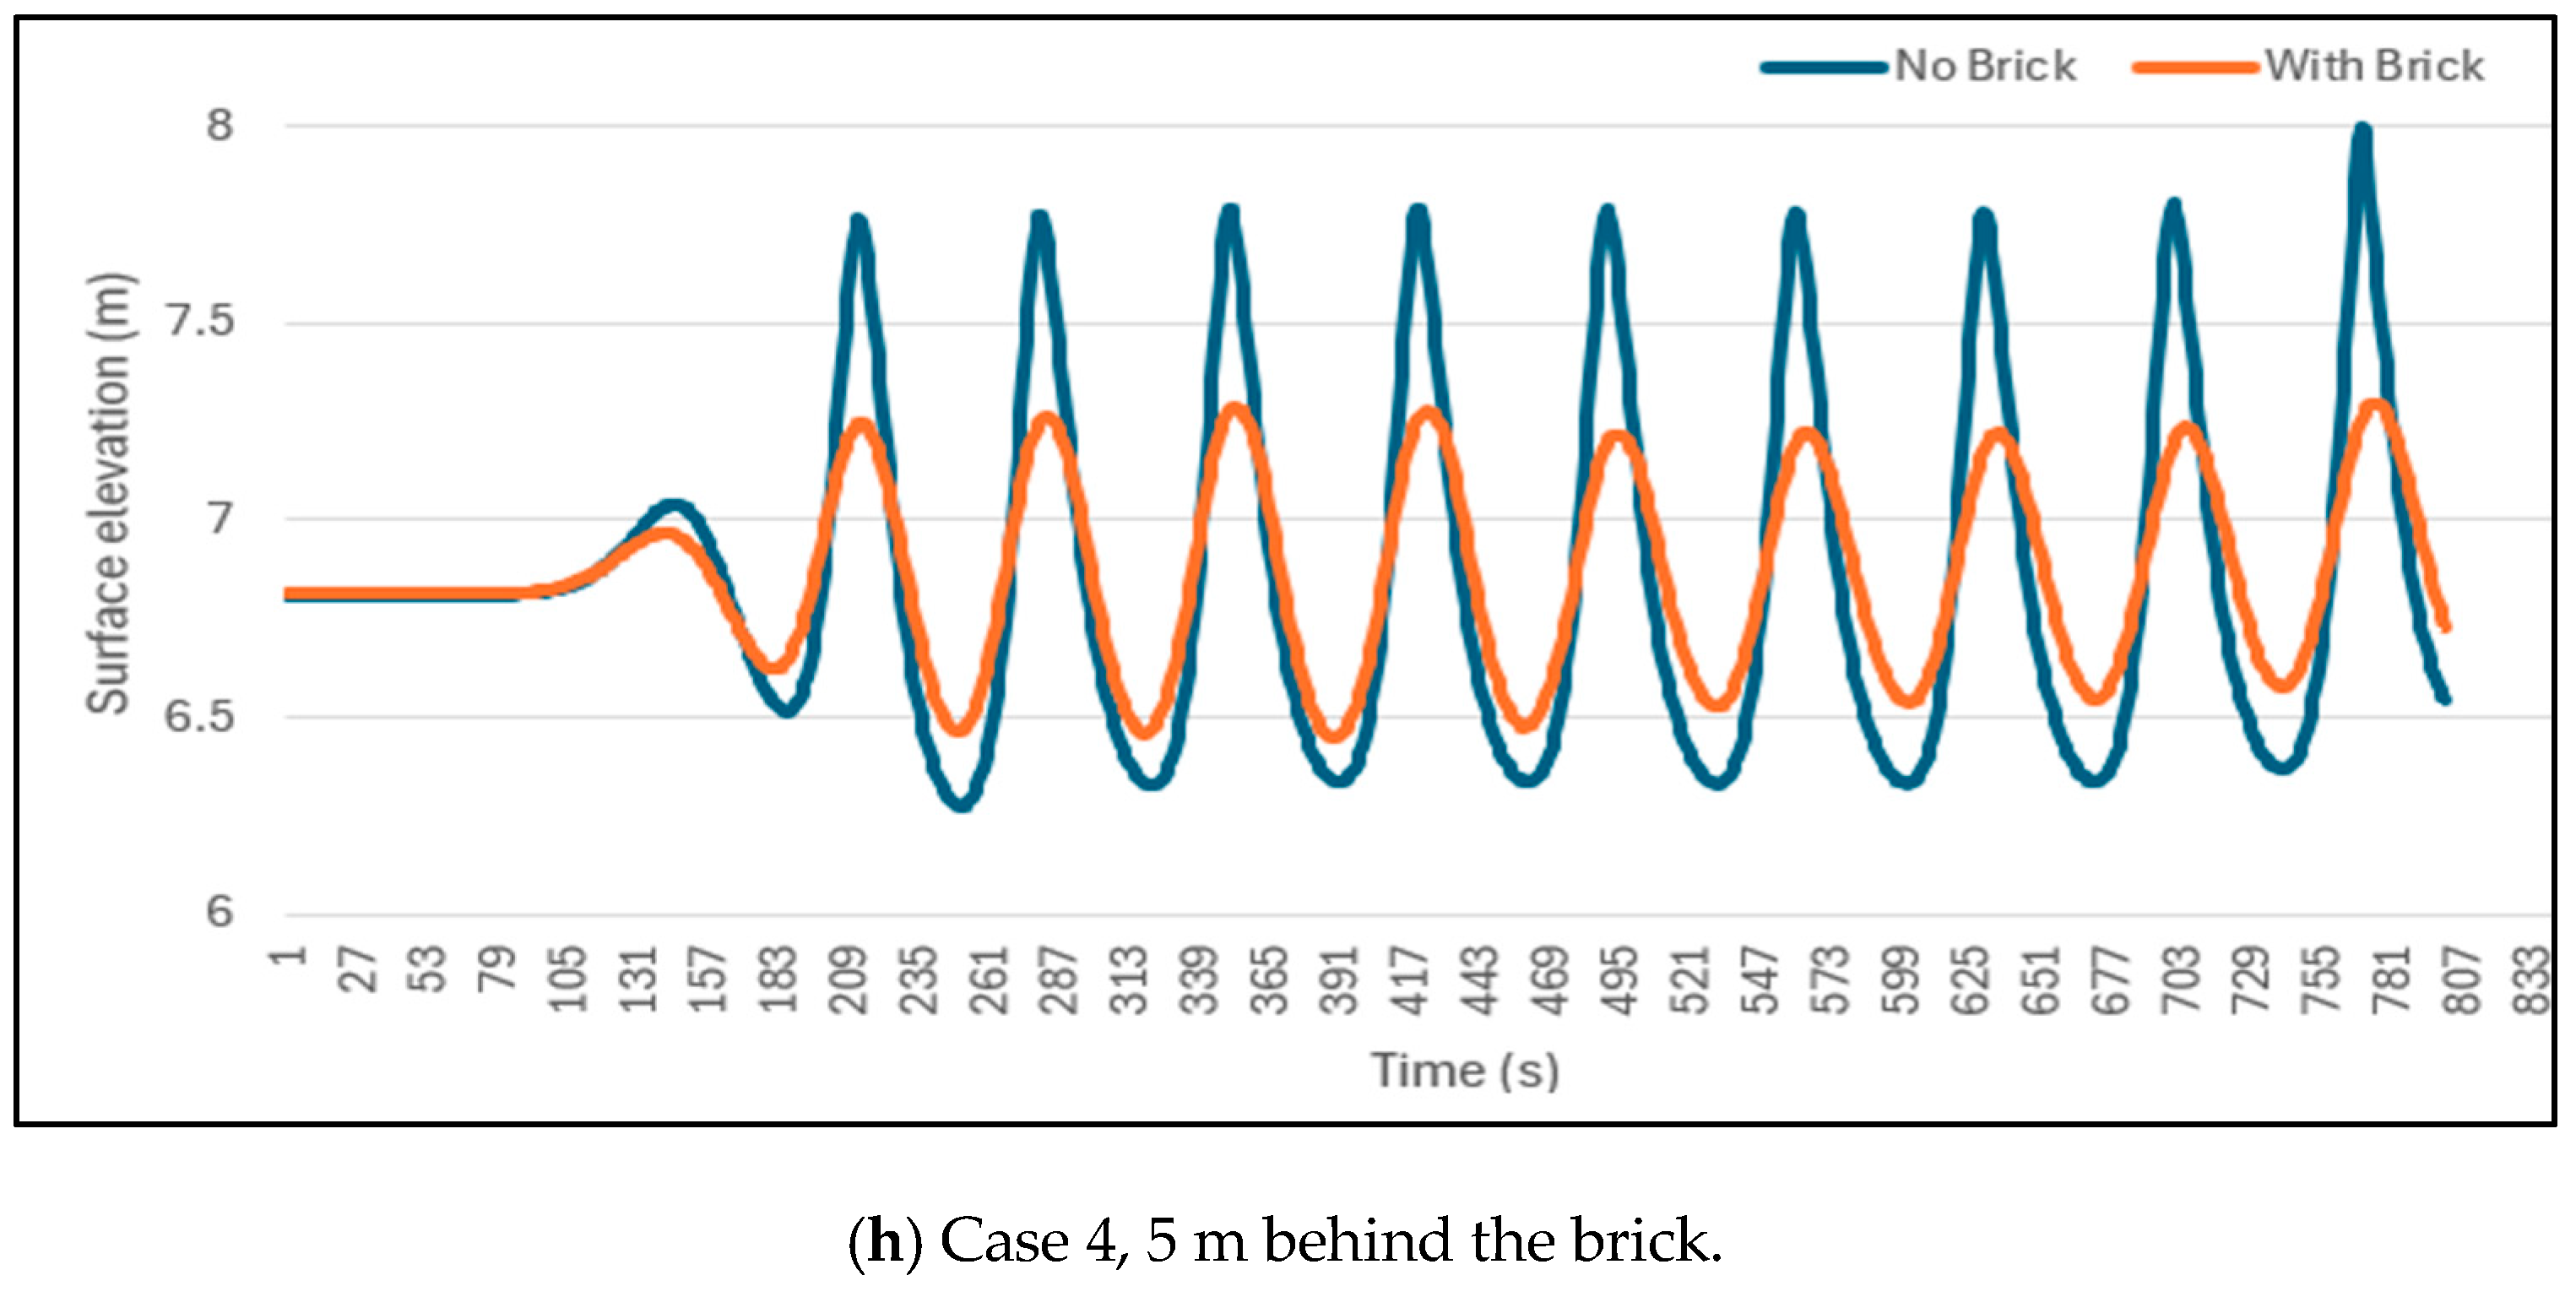
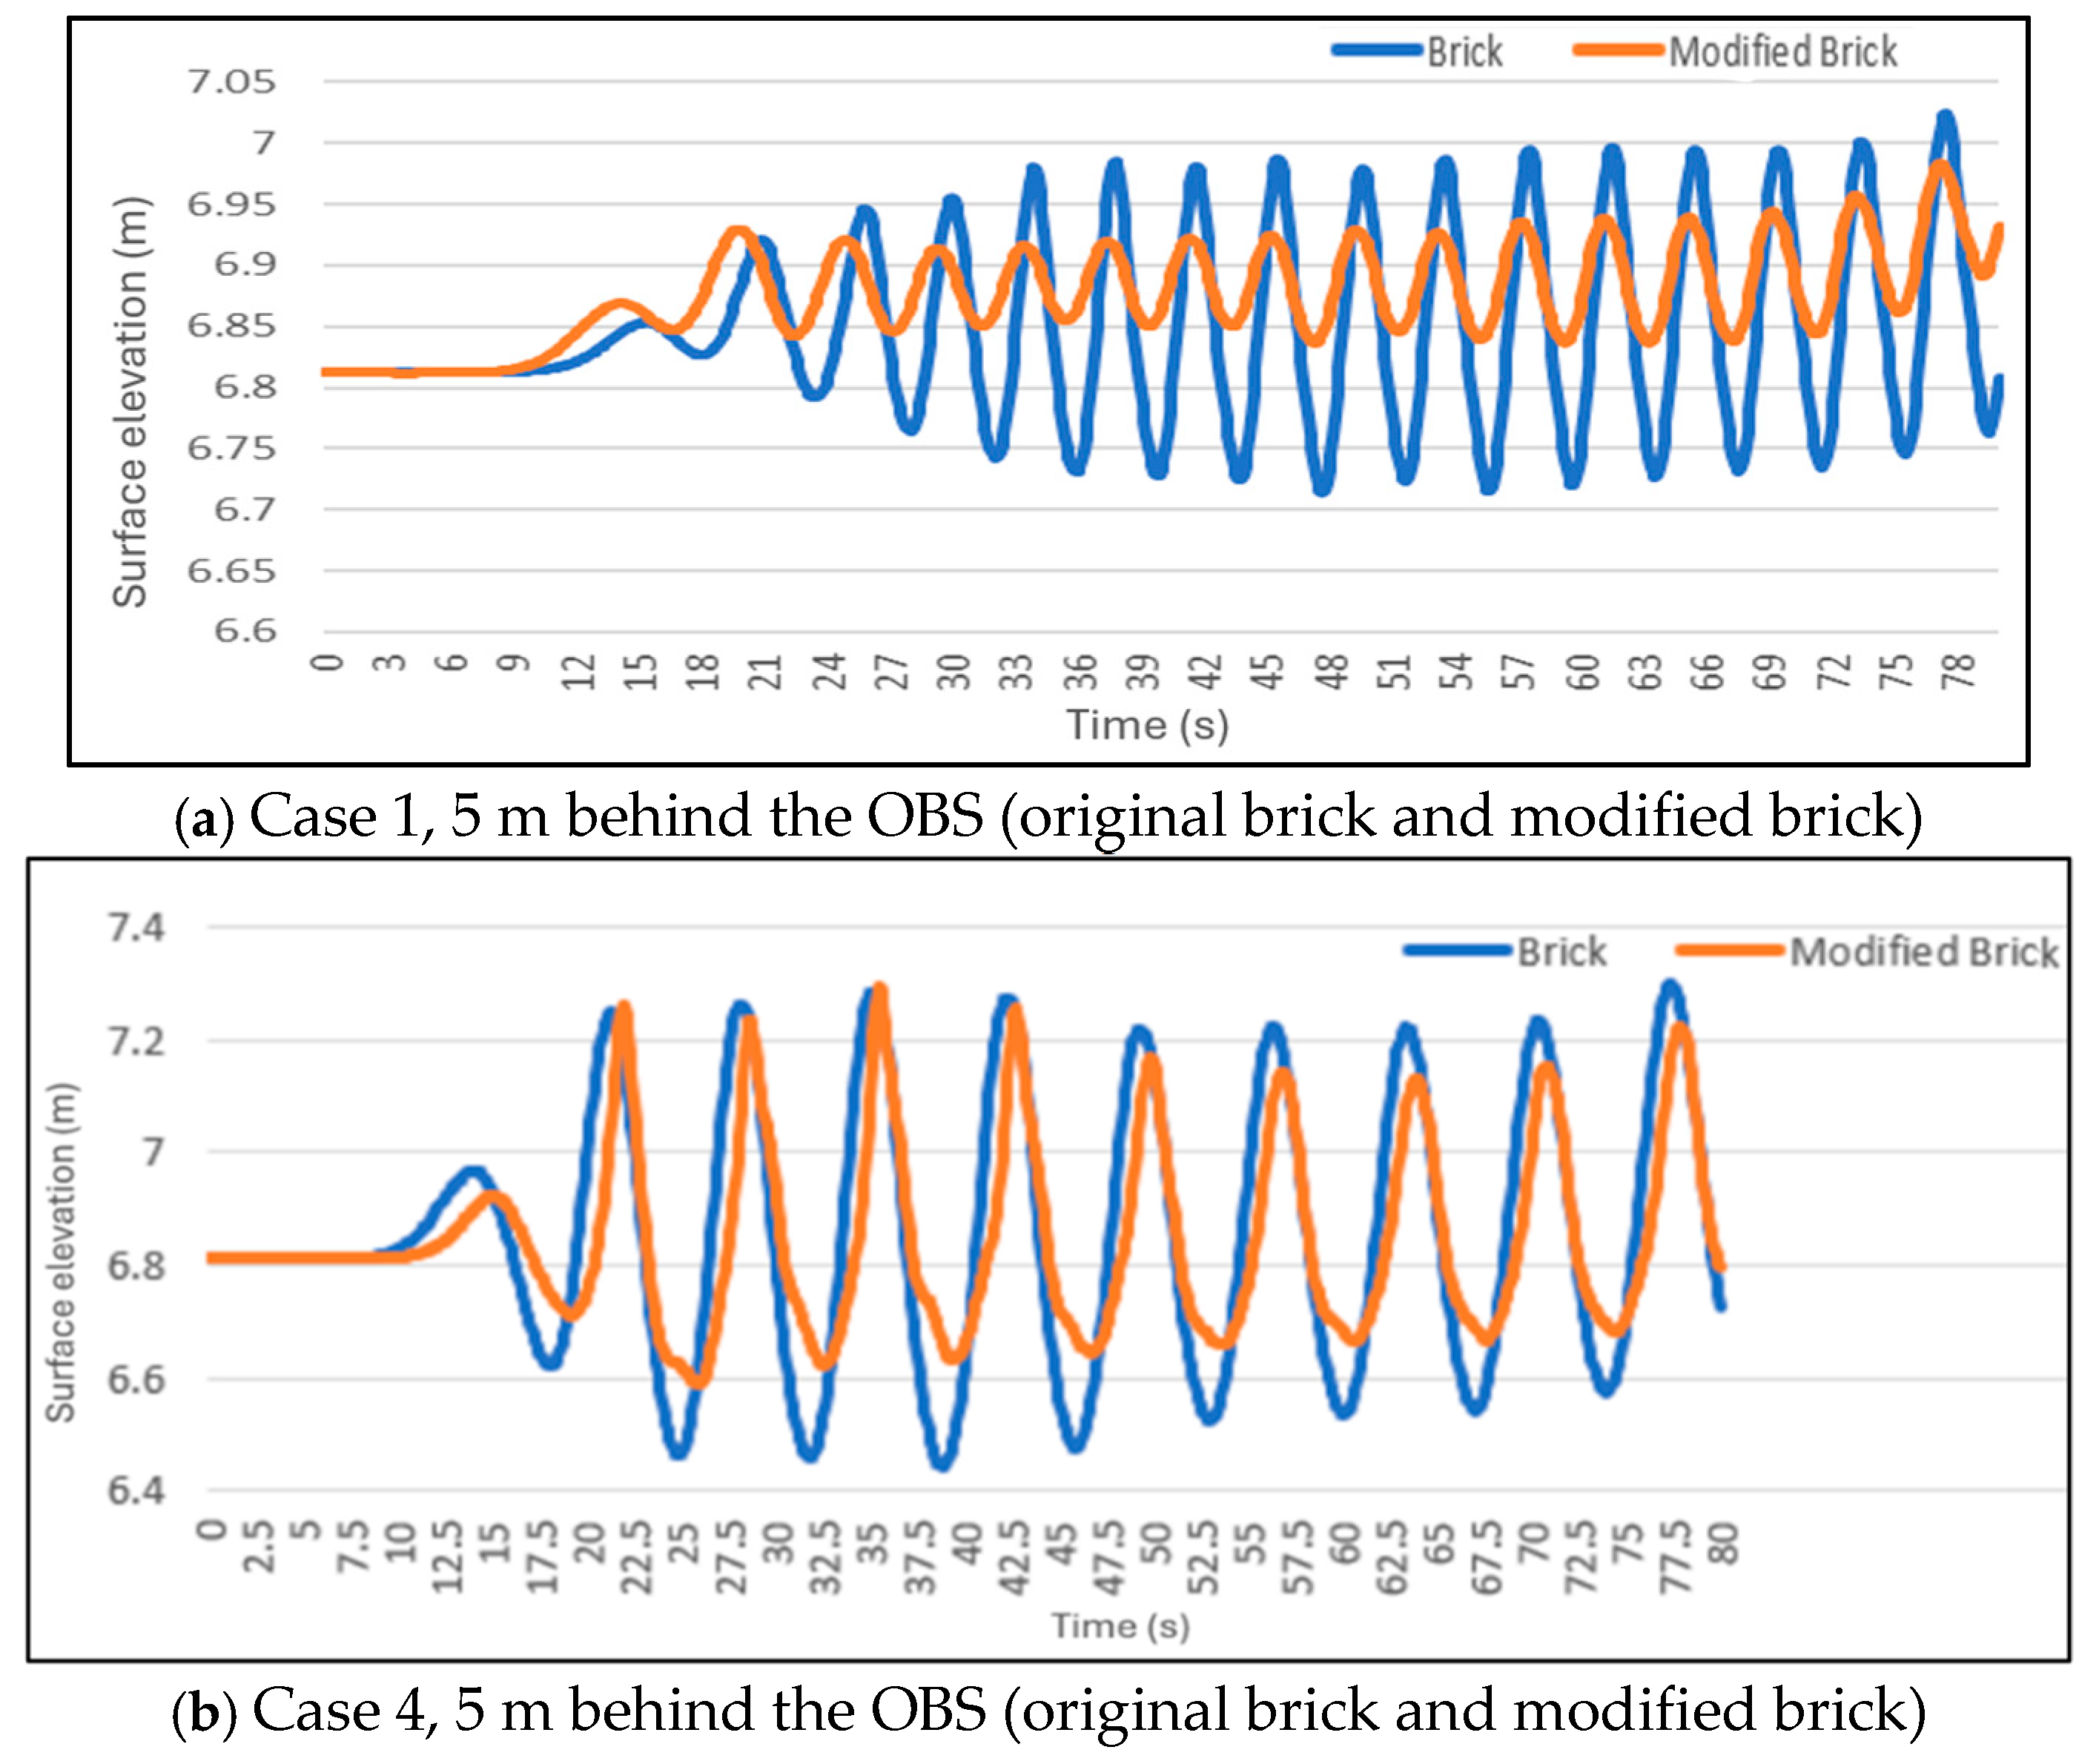
Comparison of surface elevations demonstrates that the OBS functions as an effective barrier, significantly reducing the amplitude of incoming waves and helping to mitigate coastal erosion. The nonlinear NWT is further used to evaluate a modified OBS design. Moreover, the numerical model is fully utilized by incorporating real-world, full-scale data and applying it in a comprehensive, large-scale NWT simulation. The wave amplitude reduction can reach 70% for a wave with an amplitude of 0.785 m and a period of 5 s.
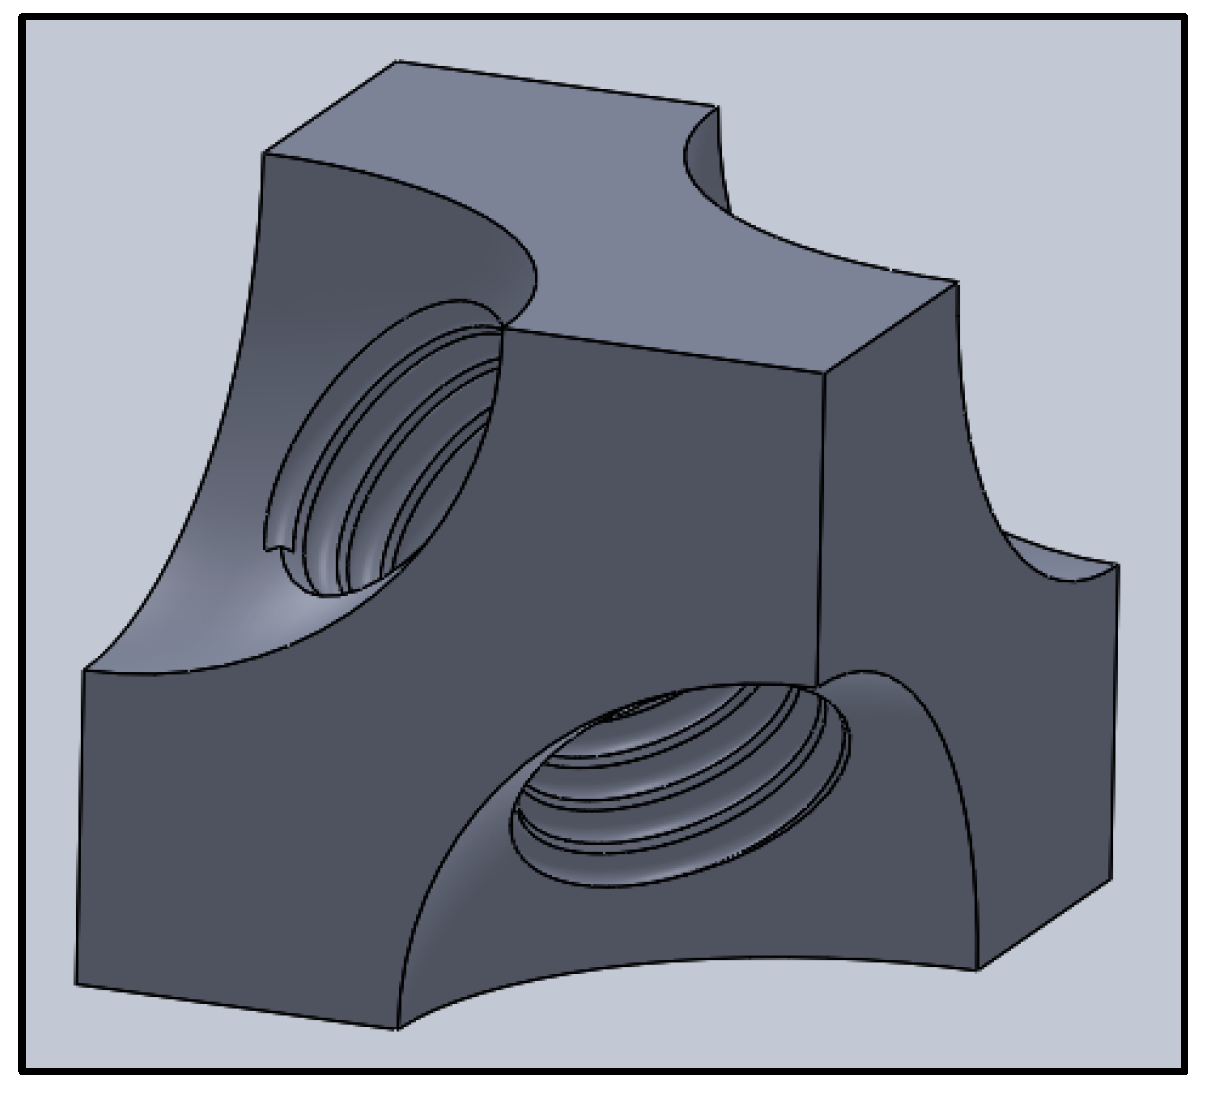
Results indicate that the modified brick more effectively reduces wave amplitudes and enhances the stability of the OBS in oceanic environments compared to the original design. For the same wave input, the modified brick geometry effectively reduces wave energy, decreasing wave amplitude by 89.2%.
Research is underway, both numerically and experimentally, to further explore the effects of the OBS on wave amplitude reduction. Future work will focus on two main aspects: the influence of geometric parameters and the effects of different wave conditions. For OBS geometric parameters, in the case of the original OBS, we will exam the effect of scaling up the brick size in both simulations and experiments to evaluate its potential for enhancing attenuation of longer wavelengths; for the modified OBS, we will study the impact of thread depth, pitch, and shrinkage ratio on wave attenuation. For wave parameters, we plan to test longer and irregular waves through both numerical simulations and experimental setups.
The current findings of this research are expected to provide valuable insights for continuously improving the design of OBS, enhancing wave attenuation, and increasing the stability of OBS platforms for offshore wind turbine applications.


