Article

Numerical Study of Transverse Jet in Supersonic Flowfield Using Reynolds Stress Model Based Detached Eddy Simulation

1
School of Aeronautics, Northwestern Polytechnical University, Xi’an 710072, China
2
National Key Laboratory of Aircraft Configuration Design, Xi’an 710072, China
*
Author to whom correspondence should be addressed.
Fluids 2025, 10(9), 229; https://doi.org/10.3390/fluids10090229
Submission received: 26 June 2025 / Revised: 26 August 2025 / Accepted: 27 August 2025 / Published: 29 August 2025
(This article belongs to the Section Mathematical and Computational Fluid Mechanics)

Abstract

This study investigated the aerodynamic structures generated by transverse jet injection in supersonic flows around high-speed vehicles. The unsteady evolution of these structures was analyzed using an improved delayed detached Eddy simulation (IDDES) approach based on the Reynolds stress model (RSM). The simulations successfully reproduced experimentally observed shock systems and vortical structures. The time-averaged flow characteristics were compared with the experimental results, and good agreement was observed. The flow characteristics were analyzed, with particular emphasis on the formation of counter-rotating vortex pairs in the downstream region, as well as complex near-field phenomena, such as flow separation and shock wave/boundary layer interactions. Time-resolved spectral analysis at multiple monitoring locations revealed the presence of a global oscillation within the flow dynamics. Within these regions, pressure fluctuations in the recirculation zone lead to periodic oscillations of the upstream bow shock. This dynamic interaction modulates the instability of the windward shear layer and generates large-scale vortex structures. As these shed vortices convect downstream, they interact with the barrel shock, triggering significant oscillatory motion. To further characterize this behavior, dynamic mode decomposition (DMD) was applied to the pressure fluctuations. The analysis confirmed the presence of a coherent global oscillation mode, which was found to simultaneously govern the periodic motions of both the upstream bow shock and the barrel shock.

1. Introduction

High-speed vehicles employ transverse jet technology during flight to provide additional control moments and thrust. This enables rapid maneuvering and attitude adjustments in high-speed flight regimes, thereby enhancing the overall maneuverability and flexibility of the vehicle [1,2,3,4]. It is worth noting that the interaction between transverse jet flows and invoked supersonic flows induces multi-scale flow phenomena, as illustrated in Figure 1, including shock/boundary layer interactions, flow separation and vortex evolution. These phenomena significantly impact the aerodynamic characteristics and maneuverability of high-speed vehicles. It is worth noting that regarding such complex flow phenomena in transverse jets, the German Aerospace Center (DLR) has established a comprehensive multi-parameter database through systematic wind tunnel tests. This database includes the effects of Reynolds number, angle of attack and jet-to-free-stream pressure ratio. Building upon this database, Gnemmi and Schäfer [5] employed a combined experimental–numerical approach to reveal the influence mechanisms of cold jet–crossflow interactions on missile control effectiveness. Subsequently, Stahl et al. [6] investigated supersonic flowfield interactions with transverse jets under varying Reynolds numbers and total pressure ratios using wall pressure measurements and oil-flow visualization techniques. However, these studies primarily focused on surface data prediction and validation of numerical solutions, without obtaining detailed flow structures for the crossflow/jet interaction regions in high-speed vehicles.
Computational fluid dynamics (CFD) provides an effective approach for analyzing such complex flows; yet, it faces critical challenges in high-speed jet interaction simulations: (1) high-Reynolds-number flows demand prohibitively fine grid resolutions, making direct numerical simulation (DNS) and large-Eddy simulation (LES) computationally prohibitive for most practical engineering applications [7]. Xiao et al. [8] and Zhang et al. [9] have systematically revealed the regulatory mechanism of pressure ratio on the evolution of flow structures, with a particular focus on the enhanced phenomenon of counter-rotating vortex pairs in the jet shear layer under high-pressure-ratio conditions; (2) Reynolds-averaged Navier–Stokes (RANS) methodologies suffer from turbulence modeling limitations, failing to accurately resolve transient vortical structures. This limitation is exemplified in Lai et al.’s CFD/RBD/JET coupling study [1], which, while effectively predicting overall vehicle dynamics, demonstrated insufficient capability in capturing the intricate vortex dynamics within the transverse jet interaction zone. In contrast, the hybrid RANS/LES method serves as an effective alternative that has demonstrated superior performance in engineering applications [10,11,12,13]. Specifically, detached Eddy simulation (DES) [14,15,16] and its variants—delayed detached Eddy simulation (DDES) [17] and improved delayed detached Eddy simulation (IDDES) [18,19]—are typical hybrid RANS/LES methods extensively employed in jet–crossflow interaction. Gao et al. [20] employed the detached Eddy simulation method based on the realizable k-ε model to investigate transverse jets in supersonic crossflow, revealing the influence of crossflow temperature on shock wave structures and the periodic fluctuations in pressure and temperature in the flow structures. Yang et al. [21] developed an improved high-order non-linear filtering scheme, significantly enhancing the accuracy of DES/LES in simulating transverse jet flow structures in supersonic crossflow. Their approach successfully captured the complex shock–vortex interactions. Smith et al. [22] demonstrated that the hybrid RANS/LES method outperforms traditional RANS models in predicting jet trajectories and wall pressure distributions.
This study employs the IDDES method to numerically investigate transverse jet interaction characteristics, with particular focus on characterizing multi-scale flow features, given the current scarcity of high-fidelity numerical data for these complex transient vortex structures. To address these challenges, the present investigation implements an IDDES approach incorporating the Reynolds stress model (RSM) to systematically evaluate the evolutionary mechanisms of complex vortex systems in transverse jet flows. Meanwhile, the dynamic mode decomposition (DMD) method [23,24,25,26,27] is introduced to perform multi-scale analysis of flow characteristics. This method can effectively identify the dynamic characteristics of jet penetration depth and coherent vortex structures by extracting dominant frequencies and corresponding spatial modes. The paper is organized as follows.
In Section 2, the numerical method is briefly introduced, including the baseline solver and turbulent modeling. In the forthcoming Section 3, the results of the RSM-based IDDES simulation of high-speed vehicle configuration are discussed. To validate the time-averaged aerodynamic data predicted by the IDDES method, the experimental data are used for comparison. Subsequently, the qualitative description of the mean flow structures is provided, with an analysis of the fundamental structure of transverse jets within supersonic crossflows. In Section 4, a qualitative analysis of the instantaneous flow structures is conducted, followed by DMD of the pressure field to ascertain the principal frequencies and dominant flow characteristics. Finally, spectral analysis is performed on points of interest within the flow structures to enhance the understanding of the unsteady oscillations in different regions of the flow.

2. Baseline Solver and Turbulence Modeling

2.1. Baseline Solver

The in-house hybrid mesh three-dimensional (3D) Navier–Stokes solver, HUNS3D, solves the case in this paper. This solver has been extensively validated in numerical simulations at high Reynolds numbers, including simulation of the vortex system in a takeoff and landing transport aircraft configuration [14], predictions of sonic booms [28], analyses of aerodynamic elasticity [29] and examinations of multi-body separation [30], among other multi-disciplinary coupled problem analyses. The HUNS3D solver employs a cell-centered finite volume method and accommodates a variety of grid cell types. Consider the integral form of three-dimensional Reynolds-averaged Navier–Stokes (RANS) equations in three Cartesian coordinates:
t Ω Q d V + Ω F c · n d S = Ω F ν · n d S
where Q = ρ ¯   ρ ¯ u ~ 1   ρ ¯ u ~ 2   ρ ¯ u ~ 3   ρ ¯ E ~ T is a vector of conservative variables; ρ ¯ is the fluid density; E ~ is the total energy; and u ~ 1 ,     u ~ 2 ,     u ~ 3 are the velocity components in the Cartesian coordinates x , y , z , respectively. Ω is the control volume bounded by the closed surface Ω , and dS is a surface element. In addition, ¯ denotes the Reynolds-averaged value for RANS and the filtered value for LES. ~ is the Favre-averaged or Favre-filtered value. The vectors
F c · n = V · n ρ ¯ ρ ¯ u ~ 1 ρ ¯ u ~ 2 ρ ¯ u ~ 3 ρ ¯ H ~ + p ¯ 0 n x n y n z 0   a n d   F ν · n = 0 τ ¯ x x n x + τ ¯ x y n y + τ ¯ x z n z τ ¯ y x n x + τ ¯ y y n y + τ ¯ y z n z τ ¯ z x n x + τ ¯ z y n y + τ ¯ z z n z Θ ¯ x n x + Θ ¯ x n y + Θ ¯ x n z
where H is the total enthalpy, and n = n x n y n z is the unit normal vector along the outward direction of the surface, and
Θ ¯ x = u ~ 1 τ ¯ x x + u ~ 2 τ ¯ x y + u ~ 3 τ ¯ x z q ¯ x Θ ¯ y = u ~ 1 τ ¯ y x + u ~ 2 τ ¯ y y + u ~ 3 τ ¯ y z q ¯ y Θ ¯ z = u ~ 1 τ ¯ z x + u ~ 2 τ ¯ z y + u ~ 3 τ ¯ z z q ¯ z
in which τ i j = τ i j l ρ ¯ R ~ i j . Furthermore, τ i j l is the laminar viscous stress, which is solved by the Newtonian viscosity law, and ρ ¯ R ~ i j is the turbulence stress tensor, which is solved by the turbulence modeling. q ¯ k = q ¯ k l + q ¯ k t is the summation of the laminar heat flux and turbulence heat flux.

2.2. Turbulence Modeling

The turbulent stress tensor within the viscous flux represents the unresolved component of the Reynolds stresses, which must be determined through appropriate turbulence modeling. In the detached Eddy simulation method, the RANS simulation is employed to resolve this component, while the subgrid part is solved using LES. Subsequently, a mixing length function is utilized to integrate the modeling of both types of turbulent stresses within a unified control equation. The following section offers a concise introduction to the Reynolds stress model utilized in this paper, along with its corresponding DES methodology.

2.2.1. Reynolds Stress Model (RSM)

In the detached Eddy simulation methodology, the turbulent stress terms ρ ¯ R ~ i j represent the Reynolds stresses in the RANS branch and the subgrid stresses in LES. Contrary to the Eddy viscosity models based on the Boussinesq hypothesis, the RSM directly solves the transport equations for turbulent stresses. The RSM model employed in this study is the SSG/LRR-ωRSM turbulence model developed by the German Aerospace Center (DLR). This model, obtained by Radespiel and Eisfeld et al. [31] through the combination of the Speziale–Sarkar–Gatski (SSG) model and the Launder–Reece–Rodi (LRR) model, has garnered extensive application in the aeronautical flow. The principal equations of the SSG/LRR-ω RSM model are given by
t ρ ¯ R ~ i j + x k ρ ¯ U ~ k R ~ i j = ρ ¯ P i j + ρ ¯ Π i j ρ ¯ ε i j + ρ ¯ D i j + ρ ¯ M i j
t ρ ¯ ω + x k ρ ¯ U ~ k ω = γ ν t R ¯ i j U ~ i j β ω ρ ¯ ω 2 + ρ ¯ D i j + x k μ ¯ + σ ω μ t ω x k + 2 ( 1 F 1 ) ρ ¯ ω σ ω 2 k ~ x k ω x k
The first term on the right side of Equation (4) is the production term ρ ¯ P i j = [ ρ ¯ U ~ i , k R ~ k j + ρ ¯ U ~ j , k R ~ k i ] , and the third term is the dissipation term ρ ¯ ε i j = 2 ρ ¯ ε δ i j / 3 , while the other terms need to be modeled. Detailed information on the other terms in Equations (4) and (5) can be found in reference [31]. In order to close the Reynolds stress transport equation, the measured value of the isotropic dissipation rate ε needs to be provided. The SSG/LRR-ω model uses the turbulent kinetic energy k and the mixing length l D E S for estimation. Finally, the tensor ρ ¯ ε i j can be determined by
ρ ¯ ε i j = 2 3 ρ ¯ k ~ 1.5   l D E S δ i j
where the turbulent kinetic energy k ~ = R ~ k k / 2 , and l D E S is presented in the next section.

2.2.2. Improved Delayed Detached Eddy Simulation (IDDES)

The DES method is a hybrid simulation technique that integrates the RANS and LES methods, initially developed by Spalart and co-workers. The method’s core principle involves the strategic modification of dissipation terms within the RANS turbulence model. This modification is designed to preserve the RANS model’s attributes in proximity to the wall while facilitating subgrid-scale dissipation, characteristic of LES, in areas away from the wall. The adjustment of these dissipation terms is performed using a mixing length function, the formulation of which varies among different DES implementations. This work employs an improved delayed DES (IDDES) method to address potential occurrences of grid-induced separation (GIS) and logarithmic layer mismatch (LLM), difficulties intrinsically linked to traditional DES techniques. This improvement renders the IDDES method more effective in dealing with complex flow separations and vortex structures, particularly when simulating flow characteristics in applications such as high-speed aircraft. The expression for the mixing length in IDDES is given by
l I D D E S = f ¯ d 1 + f e l R A N S + ( 1 f ¯ d ) l L E S
The definitions of the blending function f ¯ d and elevating function f e can be found in Ref. [31]. The RANS length scale l R A N S of the RSM model is the wall distance d and the LES length scale l L E S = C D E S Δ . Specifically, C D E S is formulated as C D E S = F 1 C D E S , L R R + ( 1 F 1 ) C D E S , S S G . In our team’s previous work [19], C D E S was calibrated for isotropic turbulence, with CDES,SSG = 0.30 and CDES,LRR = 0.5. The blending function F 1 can also be found in the same reference [19]. Δ is determined by Δ = m i n ( max C ω d , C ω Δ m a x , d ω n , Δ m a x ) to avoid the mismatch of logarithmic layers, where C ω = 0.15, Δ m a x = m a x ( Δ x , Δ y , Δ z ) , and d ω n is the grid step in the wall’s normal direction.

3. Simulation Details

3.1. Geometry and Computational Mesh

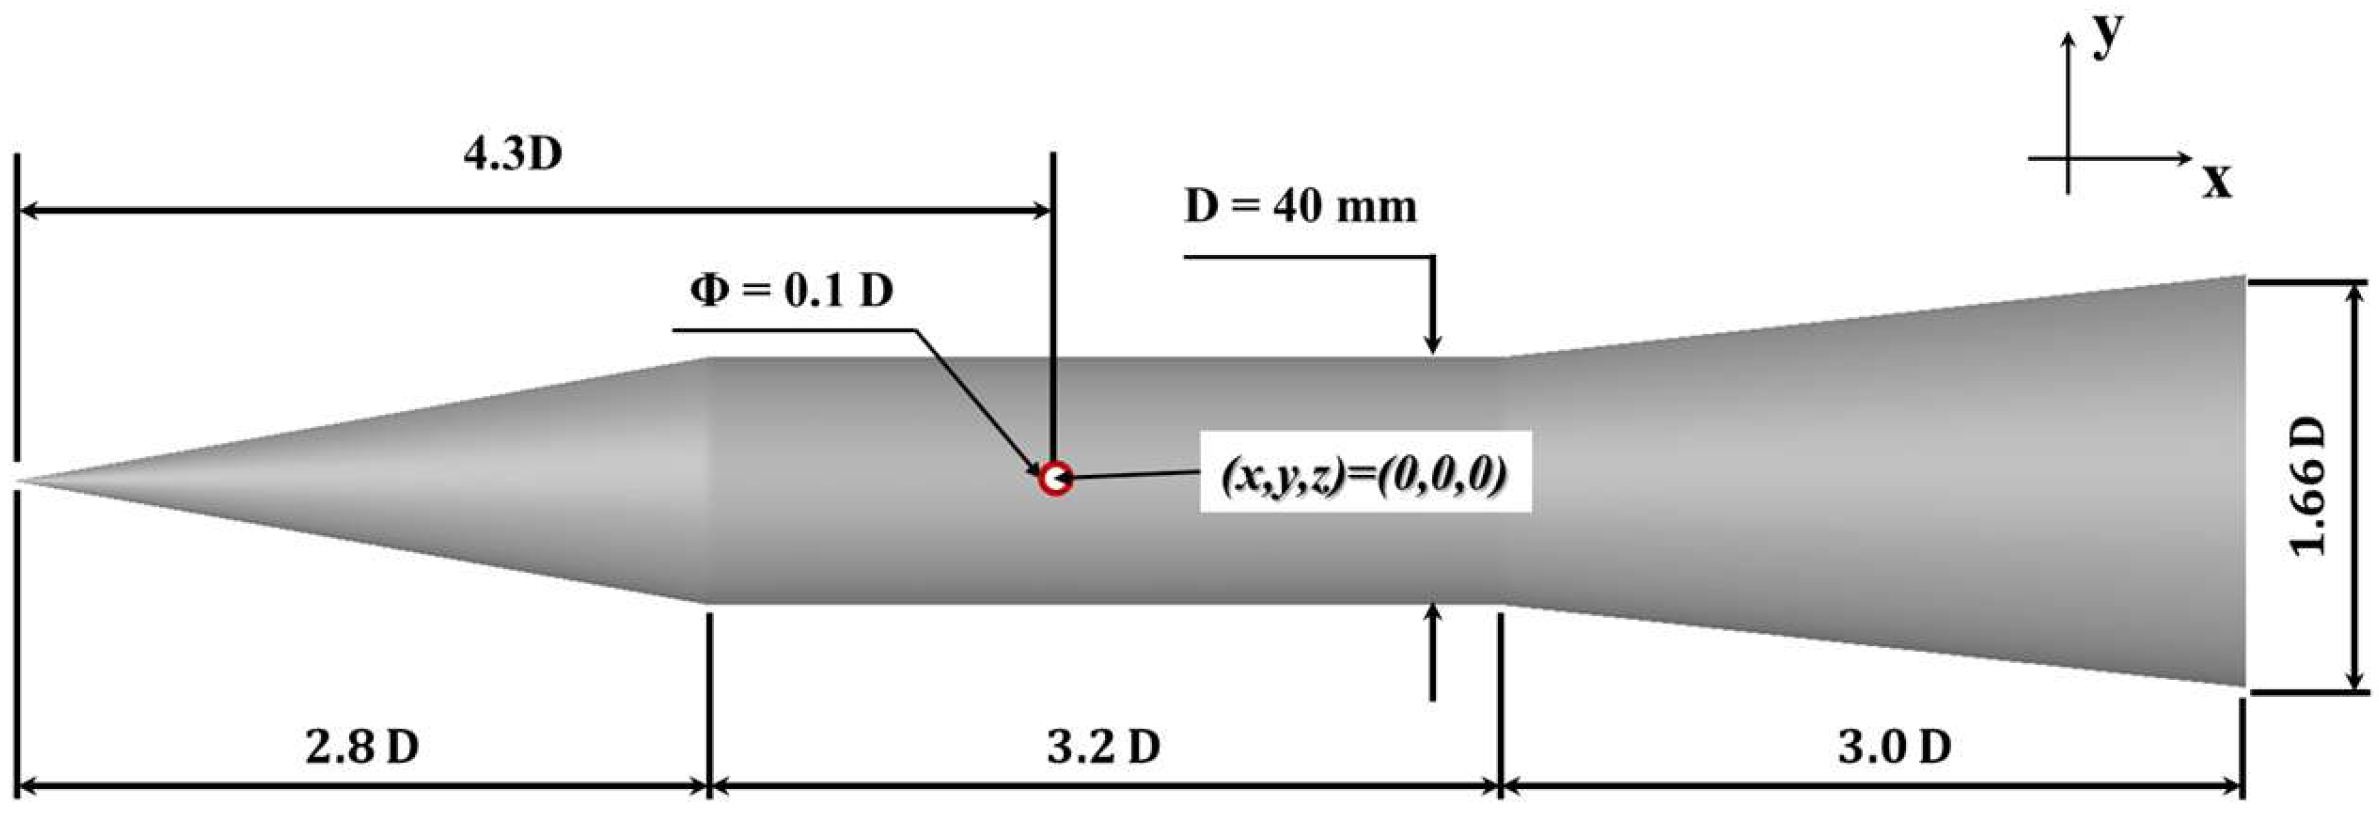
The model employed in this study is a circular cross-section body, representing a simplified configuration of a high-speed vehicle composed of classical components, including a conical nose, cylindrical fuselage and flare. The wind tunnel model is illustrated in Figure 2 and was subjected to experimental investigation in the supersonic wind tunnel of ISL. This model features a cylindrical fuselage with a diameter of D = 40 mm and a length of 3.2D, a conical nose measuring 2.8D in length, a flared afterbody with a base diameter of 1.66D and a length of 3D, as well as a transverse jet nozzle with a diameter of 4 mm positioned 4.3D downstream of the nose. The numerical analysis conducted on the flow over this configuration aims to clarify the flow mechanisms associated with the interaction of transverse jets around a high-speed vehicle and to evaluate the numerical simulation capabilities of computational fluid dynamics solvers. As depicted in Figure 3, the computational domain utilized for the numerical simulations in this study is exclusively focused on the interaction between the crossflow and the transverse jet, without consideration of the flow characteristics at the bottom of the model.
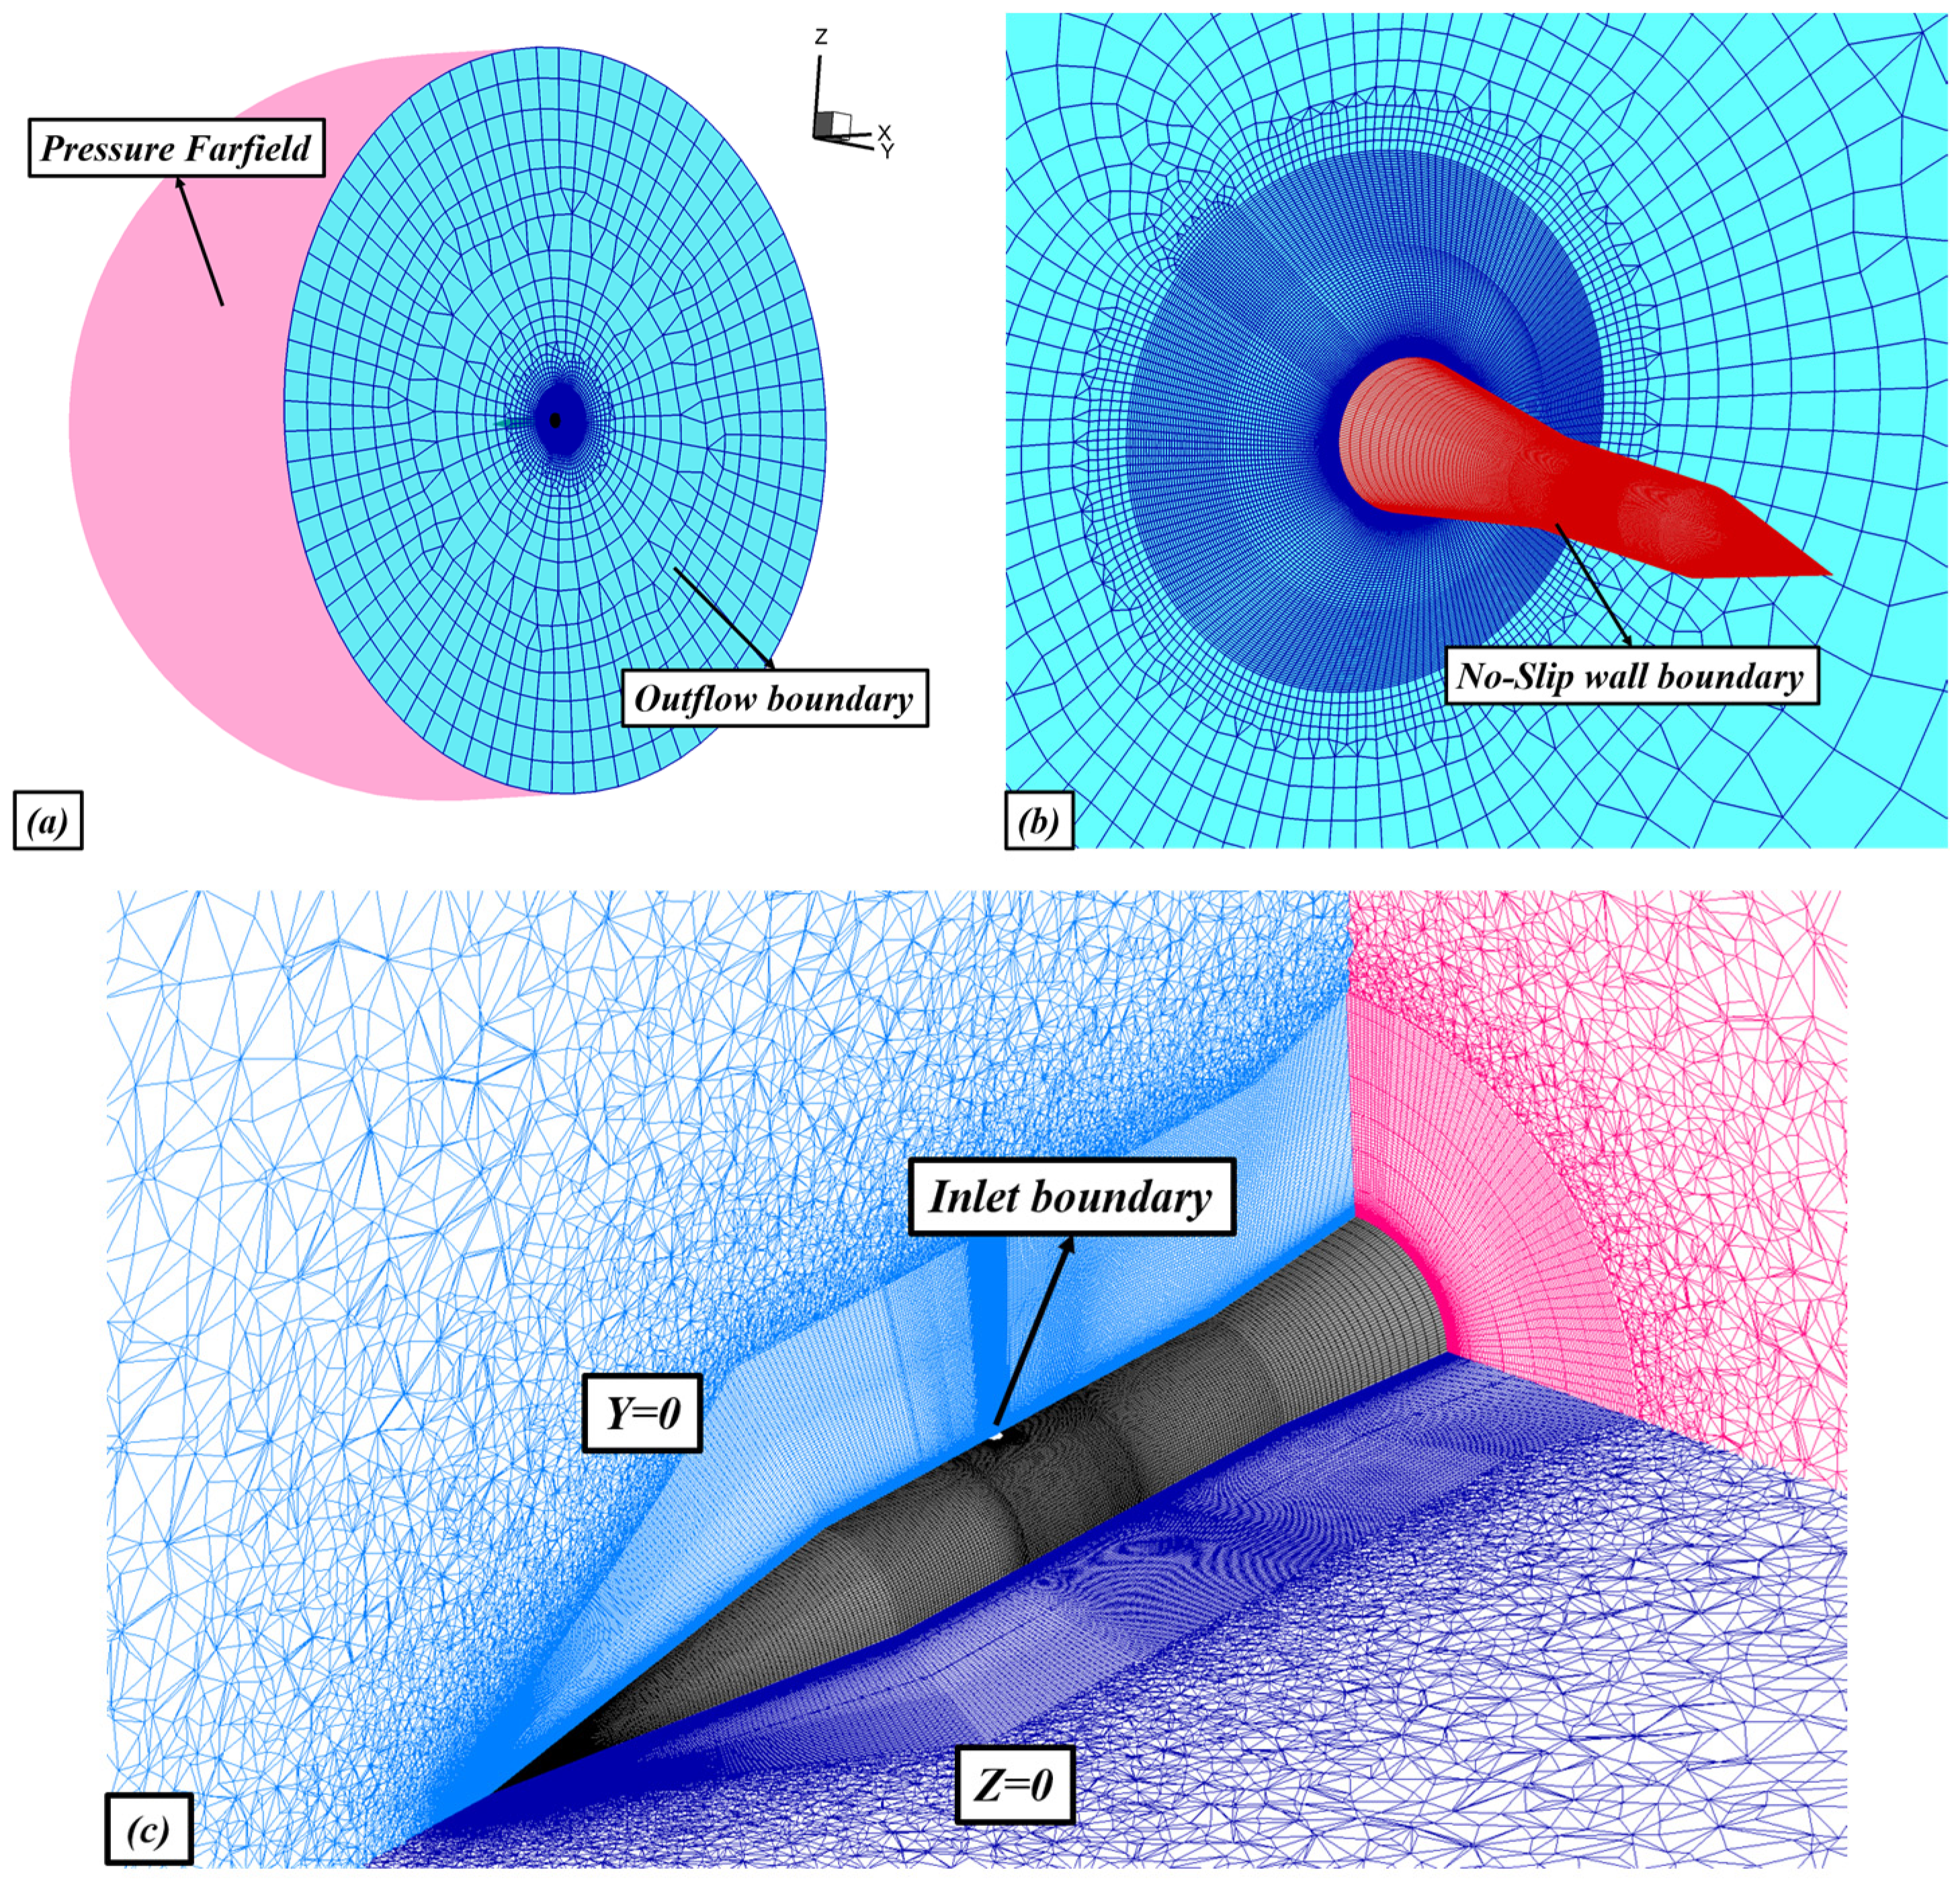
Figure 4 illustrates the computational grid and the associated boundary conditions utilized in this paper. The outer boundary condition uses the pressure far-field condition, while the inner boundaries are viscous wall boundary conditions. Figure 4b,c depict the distribution of the surface and cross-sectional grids, respectively. The grid design is engineered to ensure that the first layer of the boundary grid maintains a spacing of y+ < 1, which is critical for resolving the flow gradients within the viscous sublayer. Moreover, in the key flow regions of the transverse jet case (e.g., near the jet orifice and the downstream jet wake), the grid achieves x+ = 95 and z+ = 85. These values, along with the y+ < 1 criterion, align with established LES guidelines for wall-bounded turbulence [32], validating that the grid adequately resolves the relevant flow scales and justifying its suitability for the present simulation. The spatial grid distribution in the y = 0 plane indicates the implementation of a structured grid in proximity to the surface, facilitating the precise capture of the interaction between the crossflow and the jet. Given that the most intense flow interaction is anticipated in the vicinity of the jet nozzle, the spatial grid was appropriately refined in this region for the test case under consideration.
Figure 5 provides a detailed distribution of the surface grid, with particular emphasis on the grid configuration in the vicinity of the nose and around the nozzle. As shown in Figure 5c, the mesh surrounding the jet nozzle has undergone refinement to enable the precise resolution of the intricate flow structures characteristic of these regions.

3.2. Flow Conditions and Numerical Setup

3.2.1. Crossflow and Jet Flow

The boundary conditions for the crossflow are consistent with those outlined in the existing literature [5]. The fluid enters the computational domain through the upstream conical surface at a Mach number M a . Based on wind tunnel measurements, a Reynolds number of 2.1   × 106, a Mach number of M a = 3, a static temperature of T = 103.2 K and a static pressure of P = 1.949   × 104 Pa were established. Velocity vectors, static temperature T and static pressure P are specified at the grid within the far-field region, with an incoming angle of attack set to 0 degrees. A supersonic outlet condition is implemented for cells in the outlet region.
Based on experimental measurements, the total pressure at the jet exit P 0 , j can be obtained, along with assessment of the gas velocity exiting the nozzle (at M a j ). The total pressure in this study is expressed through the total pressure ratio Pr, defined as the ratio of the jet total pressure to the static pressure of the crossflow. According to the experimental specifications, the computations are performed for a nozzle exit Mach number of 1.0 with a pressure ratio of Pr = 97, where the jet static temperature is set to T s , j = 223 K at a total temperature ratio of 2.59.

3.2.2. Numerical Setup

The in-house HUSN3D solver conducts all case studies presented in this paper, as previously stated. The HUNS3D solver employs non-dimensional Navier–Stokes equations with characteristic parameters normalized by free-stream conditions: temperature, viscosity coefficient and density are scaled by free-stream values, while the characteristic length corresponds to the reference length for Reynolds number calculation, and the characteristic velocity is set as the free-stream speed of sound, yielding dimensionless physical quantities throughout this study. Steady-state conditions are resolved utilizing the Reynolds stress model (RSM) within Reynolds-averaged Navier–Stokes (RANS) simulations (referred to as RSM-RANS), while unsteady conditions are addressed through the improved delayed detached Eddy simulation (RSM-IDDES) approach. Numerical discretization is performed using a cell-centered finite volume method. A second-order Roe discretization scheme is employed to compute the discrete convective fluxes F c · n d S . As detailed in the preceding section, the Mach number of the crossflow is set to 3.0, and the Reynolds number is 2.1   × 106. A second-order central scheme is utilized for the discretization of viscous fluxes F v · n d S . The Green–Gauss method is applied to obtain the solution gradient, thereby ensuring second-order accuracy. Given the presence of shock and complex shock interactions within the flow, a Venkatakrishnan limiter is implemented to suppress non-physical oscillations in the flow dynamics. Numerical simulation results indicate that this limiter effectively maintains second-order accuracy in smooth regions while successfully suppressing oscillations at discontinuities. Steady-flow simulations are conducted using an implicit backward Euler scheme based on lower–upper symmetric Gauss–Seidel (LU-SGS) relaxation, while the corresponding second-order fully implicit dual-time scheme is employed for unsteady-flow simulations.

3.3. Numerical Validation Studies

3.3.1. Grid Independence

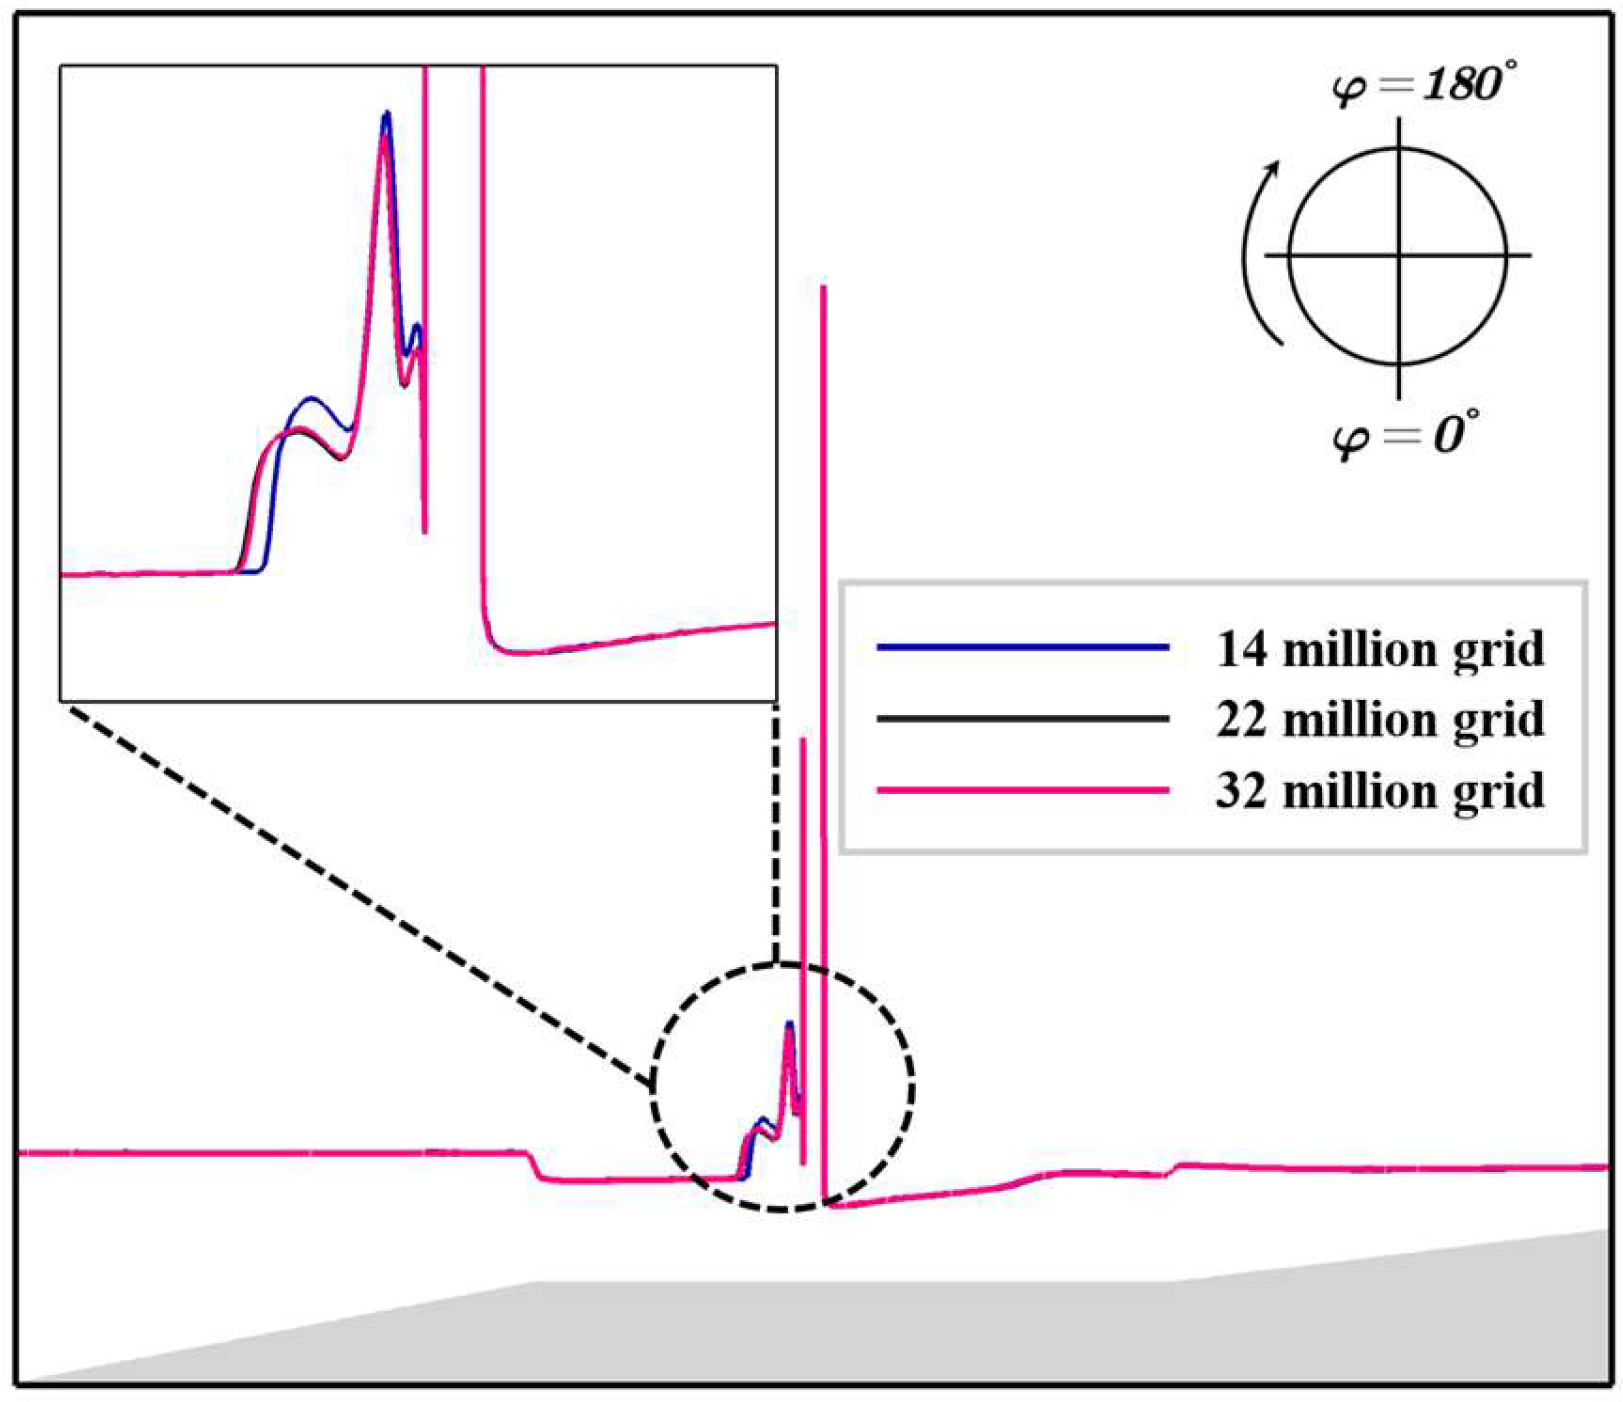
The grid independence assessment for the DES methodology implemented in this study requires special consideration of the fundamentally different behaviors between steady RANS and unsteady LES regions. For the high-speed vehicle configuration under investigation, a systematic grid convergence study was performed using three systematically refined grids containing 1.4 × 10⁷ (coarse), 2.2 × 10⁷ (medium) and 3.2 × 10⁷ (fine) cells, respectively. As quantitatively demonstrated in Figure 6, the key flow parameters exhibit progressive convergence with grid refinement. Of particular significance is the excellent agreement observed between the medium (2.2 × 10⁷ cells) and fine (3.2 × 10⁷ cells) grid solutions in all critical flow regions, satisfying the established criteria for grid independence. However, in the LES-resolved regions where DES transitions to subgrid-scale modeling, the concept of grid independence fundamentally differs from conventional steady-state analyses. The inherent scale-resolving capability of DES means that finer grids will naturally resolve additional turbulent structures. In the present study, grid verification primarily focuses on the convergence trends of key parameters (such as surface pressure coefficient distribution and drag coefficient). The final selection of a grid size of 2.2 × 10⁷ elements achieves an optimal balance between numerical accuracy and computational efficiency.

3.3.2. Time Step Verification

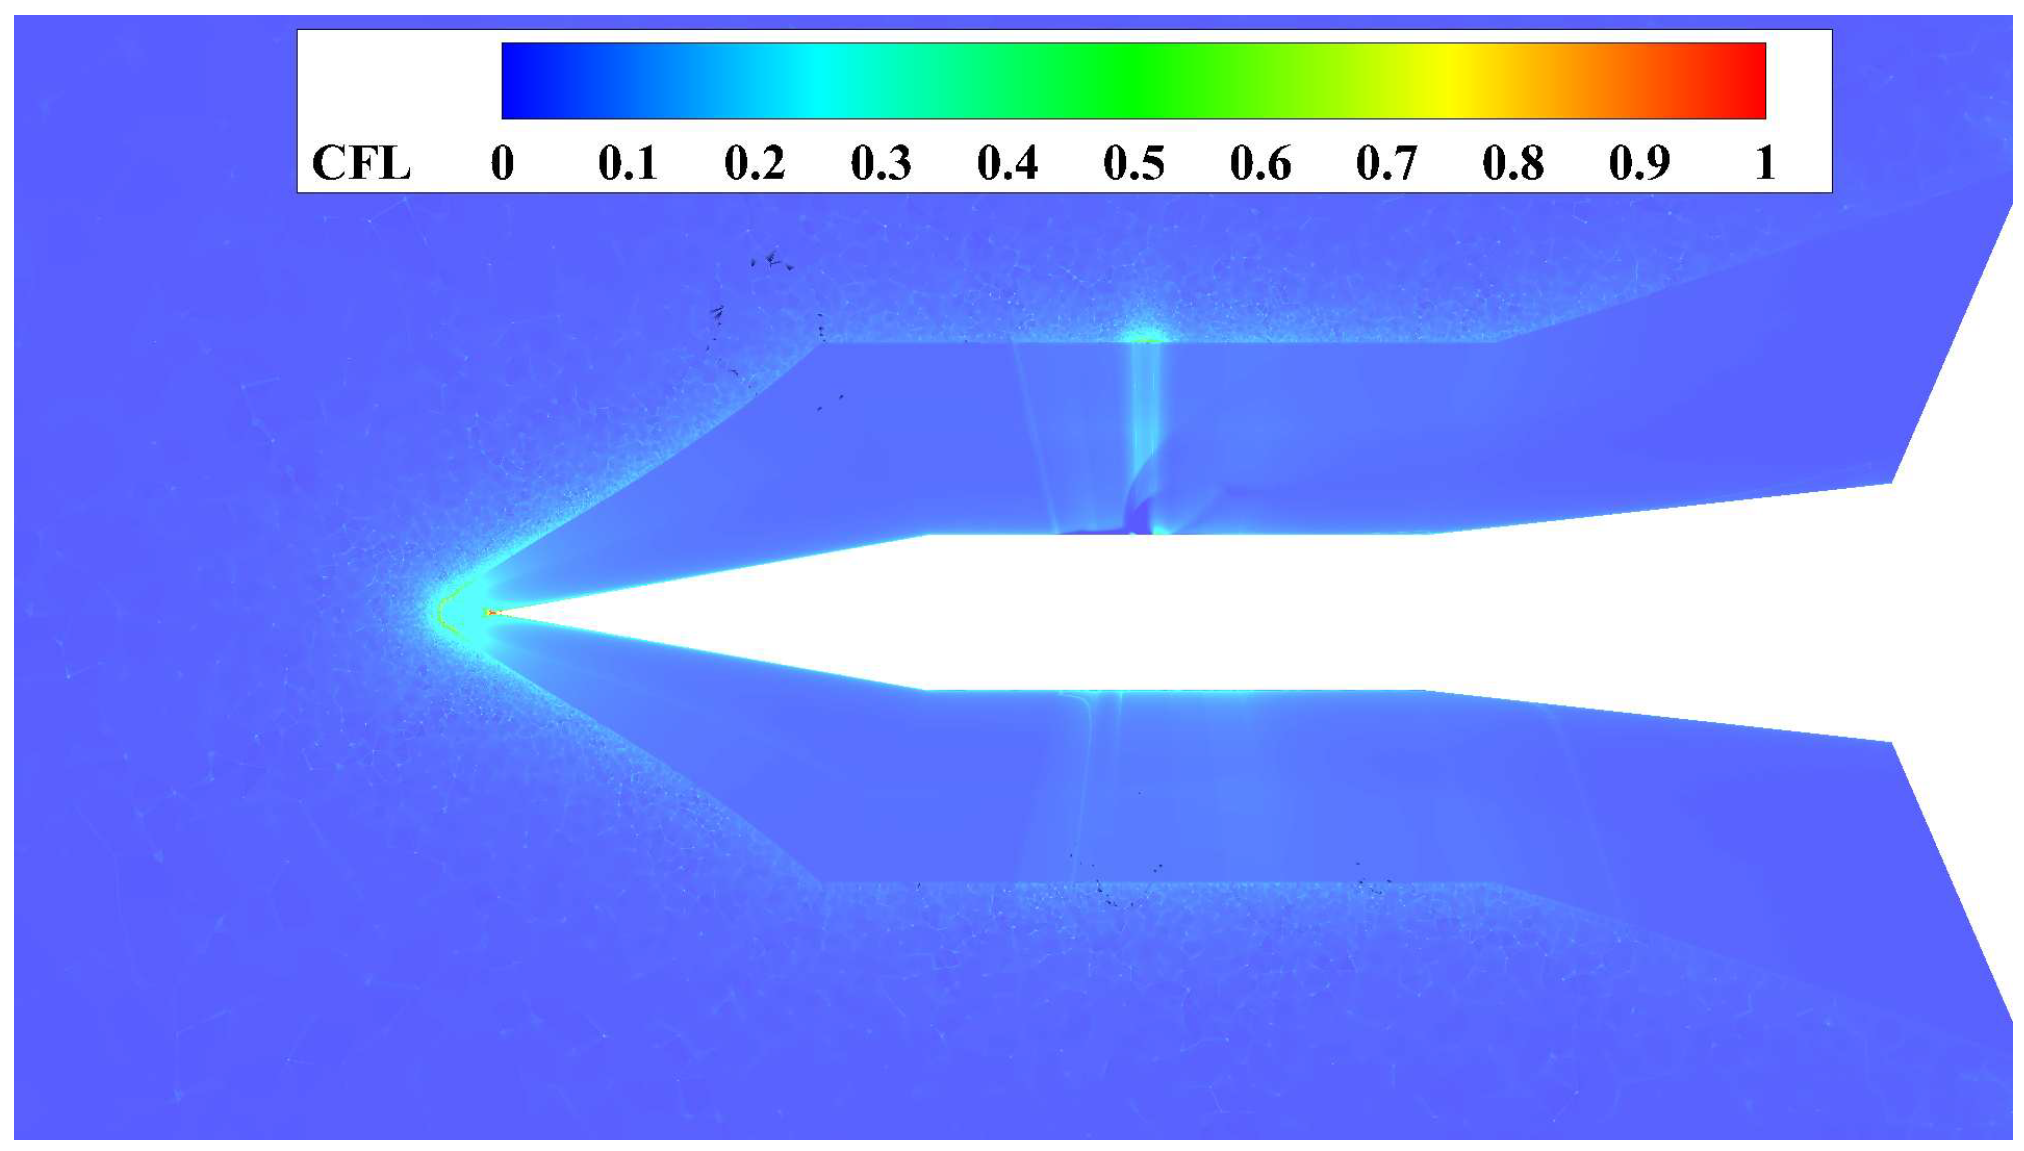
Recognizing the critical importance of temporal resolution in unsteady simulations, we implemented rigorous measures to ensure the validity of time step selection despite computational constraints. The chosen time step of Δt = 1 × 10⁻⁷ s was determined through careful consideration of both theoretical requirements and practical limitations: (a) it represents an order-of-magnitude reduction compared to the characteristic flow timescale, ensuring adequate temporal resolution; (b) as demonstrated in Figure 7, the convective CFL numbers remain strictly below unity throughout all critical flow regions. The current selection was rigorously validated through these fundamental measures, ensuring reliable results within the constraints of high-fidelity DES simulations. The chosen time step provides an optimal balance between computational feasibility and physical accuracy for the present investigation.

3.3.3. Statistical Convergence Analysis

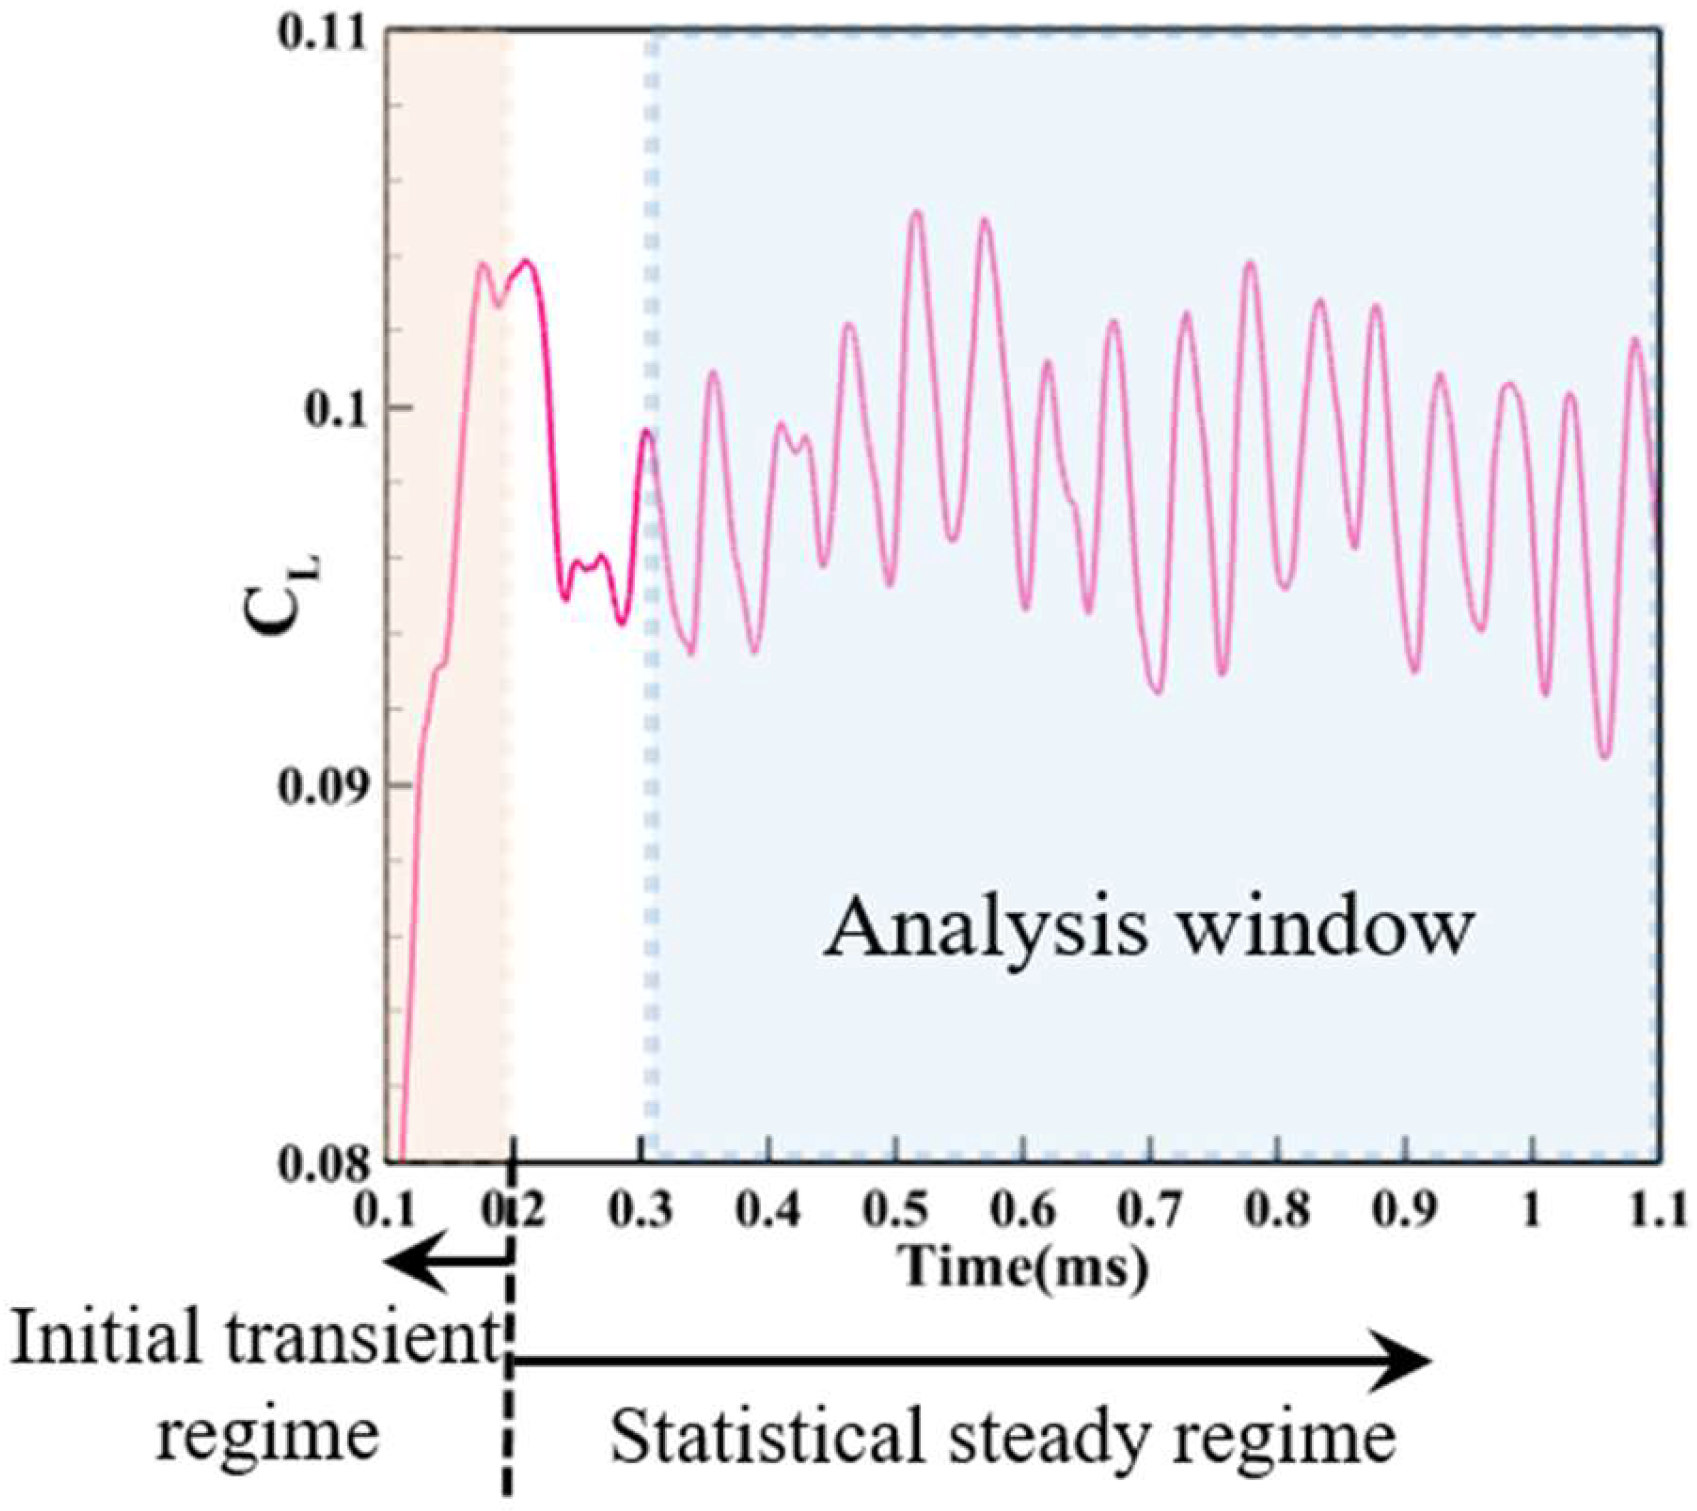
The statistical convergence of the simulation is validated through the lift coefficient C L history shown in Figure 8. The curve exhibits two distinct regimes: an initial transient phase (0–0.2 ms), where C L undergoes rapid growth with strong fluctuations, followed by a statistically steady regime, where oscillations stabilize with consistent amplitude (±0.01). The analysis window (0.3–1.1 ms, highlighted region) captures 16 complete oscillation periods, yielding a mean C L = 0.09816 with 95% confidence interval of [0.09809, 0.09823]. This confirms that the simulation has adequately resolved the characteristic flow timescales and achieved statistical stationarity, satisfying the convergence criteria.

3.3.4. Experimental Verification

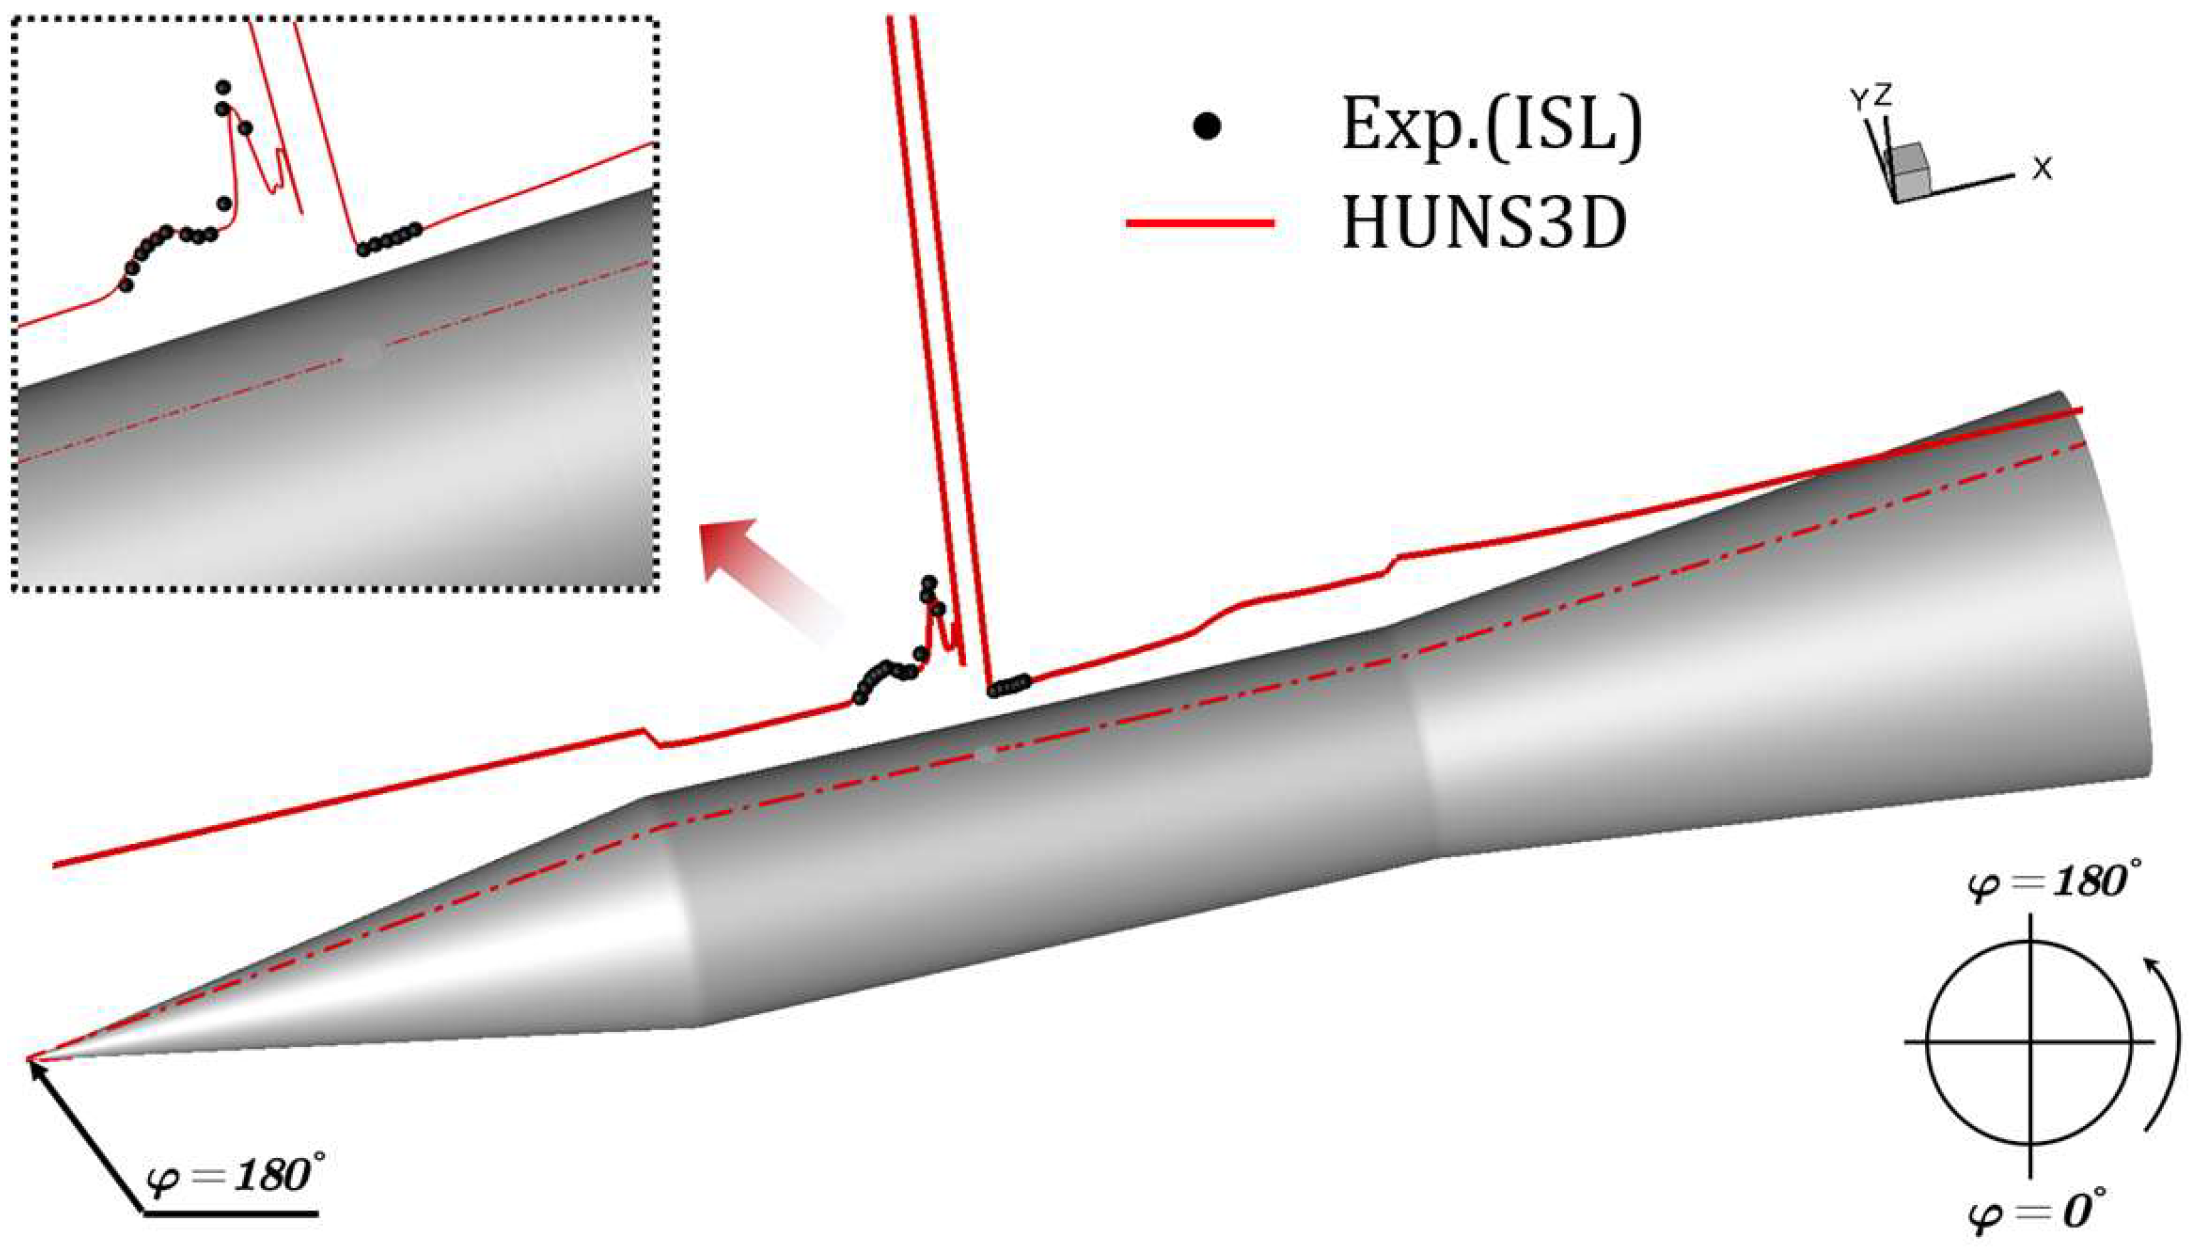
Figure 9 presents a comparison of the time-averaged surface pressure coefficient obtained from the RSM-IDDES method against experimental data, with the cross-section positioned at the symmetry plane (y = 0). The experimental data were derived from the supersonic wind tunnel at ISL. Overall, the numerical simulation results for Cp show good agreement with the experimental data. In the primary separation region, the Cp values closely match the experimental data. However, some discrepancies are observed between the numerical results and the experimental data in the second separation region. Despite these differences, the two sets of data exhibit strong agreement in the flow behavior near the downstream region of the jet. In conclusion, the RSM-IDDES method demonstrates acceptable predictive accuracy for the time-averaged surface Cp under complex interference conditions involving crossflow and transverse jet injection.
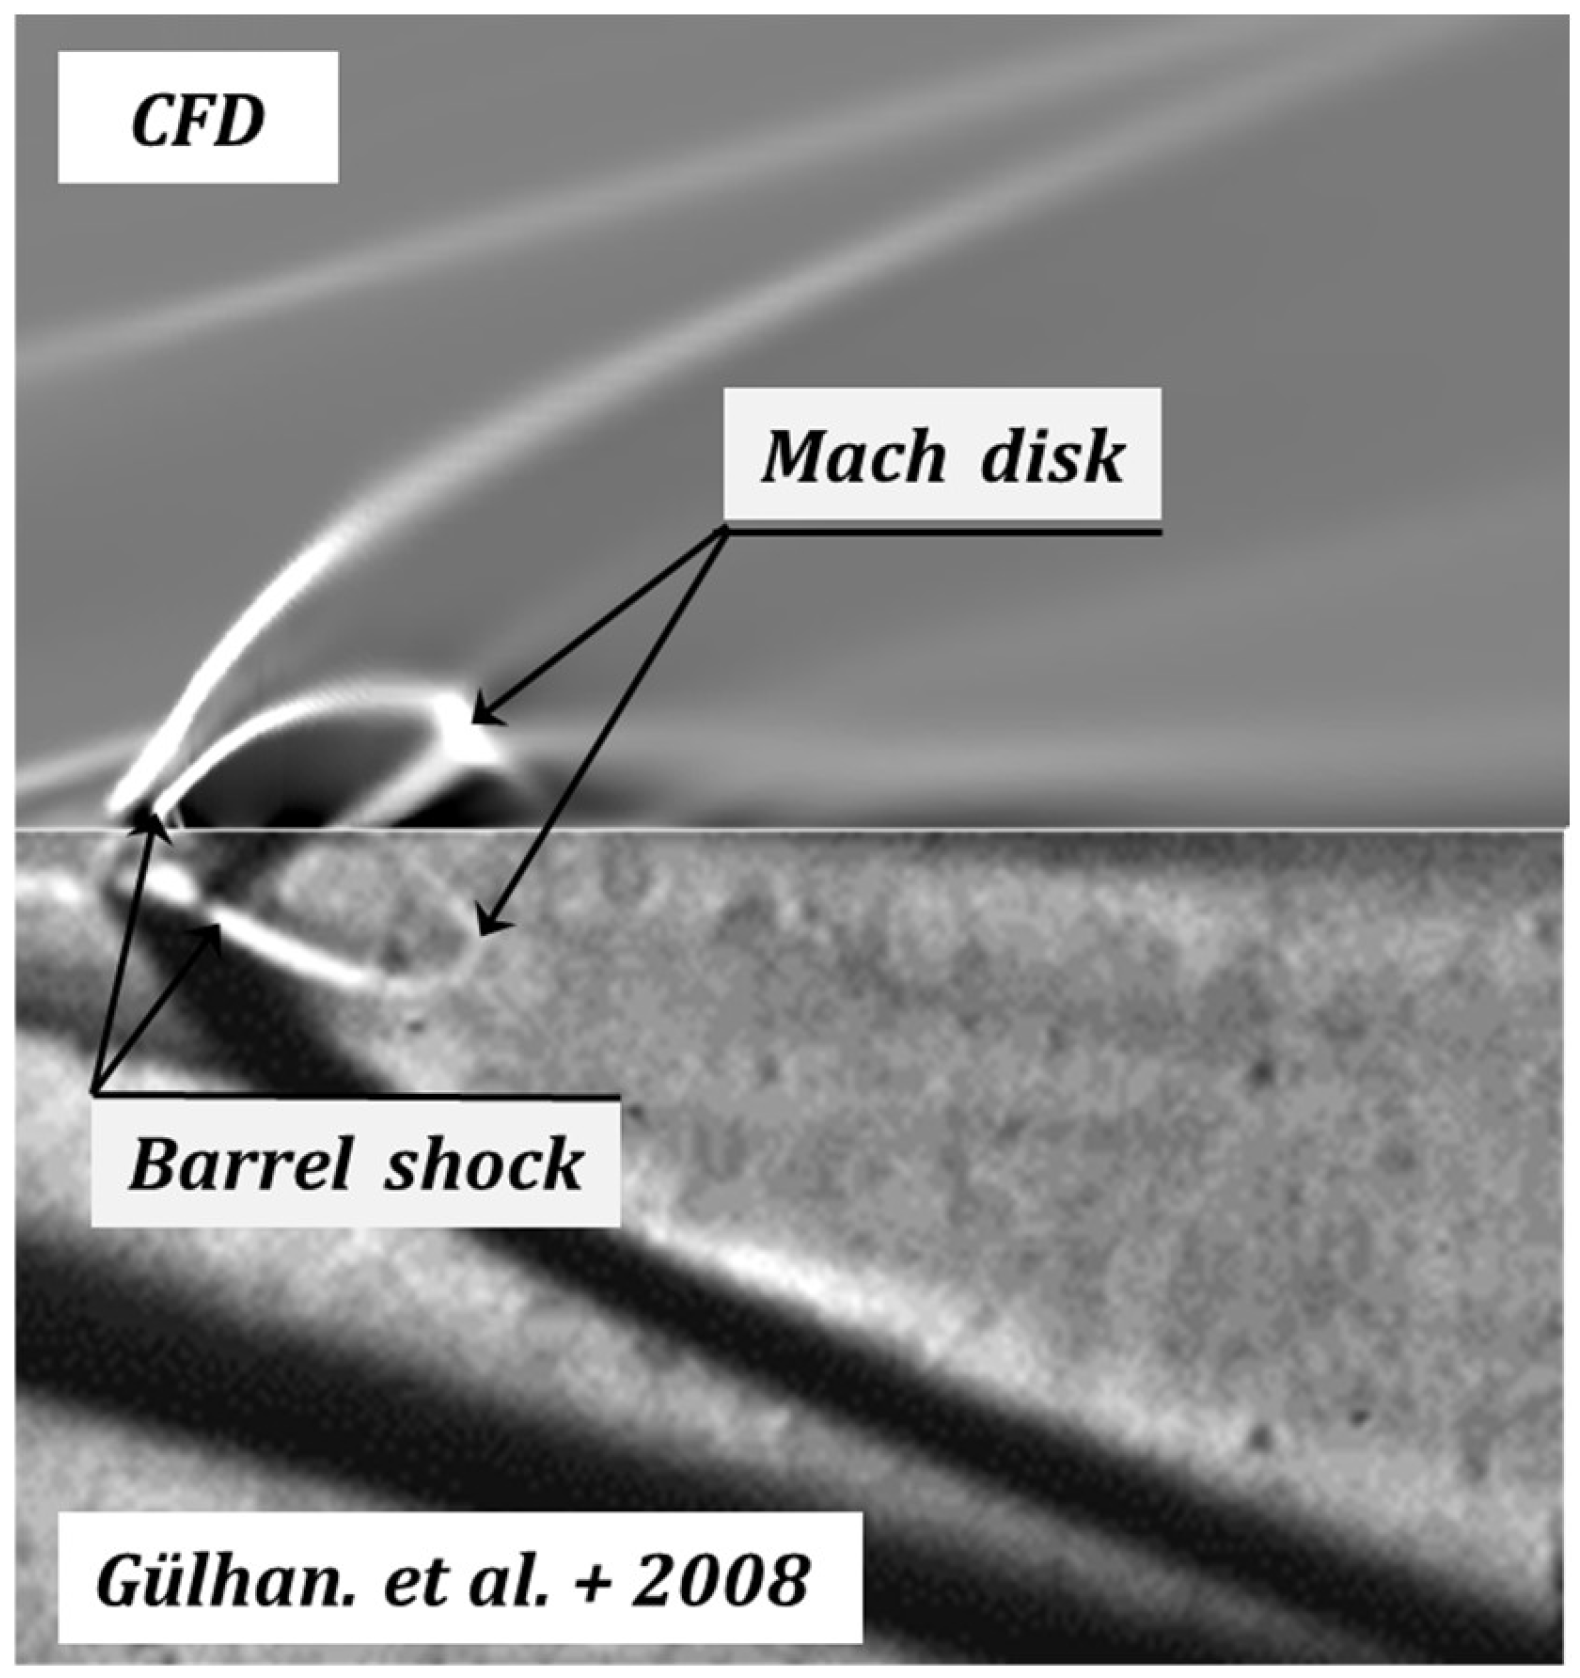
To validate jet-related flow features, numerical schlieren images were compared against experimental schlieren data for Pr = 100 from Ref. [6]. Figure 10 shows that the numerically simulated jet penetration length and barrel shock distance agree well with experimental results, thereby confirming the model’s ability to capture jet–crossflow interaction physics. While our primary focus remains on Pr = 97, this cross-validation for Pr = 100 strengthens confidence in the numerical method’s ability to capture jet–crossflow interaction physics.

4. Numerical Results and Discussion

In this section, this paper provides a detailed analysis of the complex flow structures generated by the interaction between the transverse jet and crossflow. When the jet thruster is activated, gas is expelled from it, causing interference with the surrounding crossflow of the missile. A schematic representation of the complex flow phenomena formed by the interaction between the transverse jet and the supersonic crossflow is shown in Figure 1. This section will utilize the previously introduced RSM-IDDES method to carry out a high-fidelity simulation analysis of this intricate flow.

4.1. Time-Averaged Flowfields

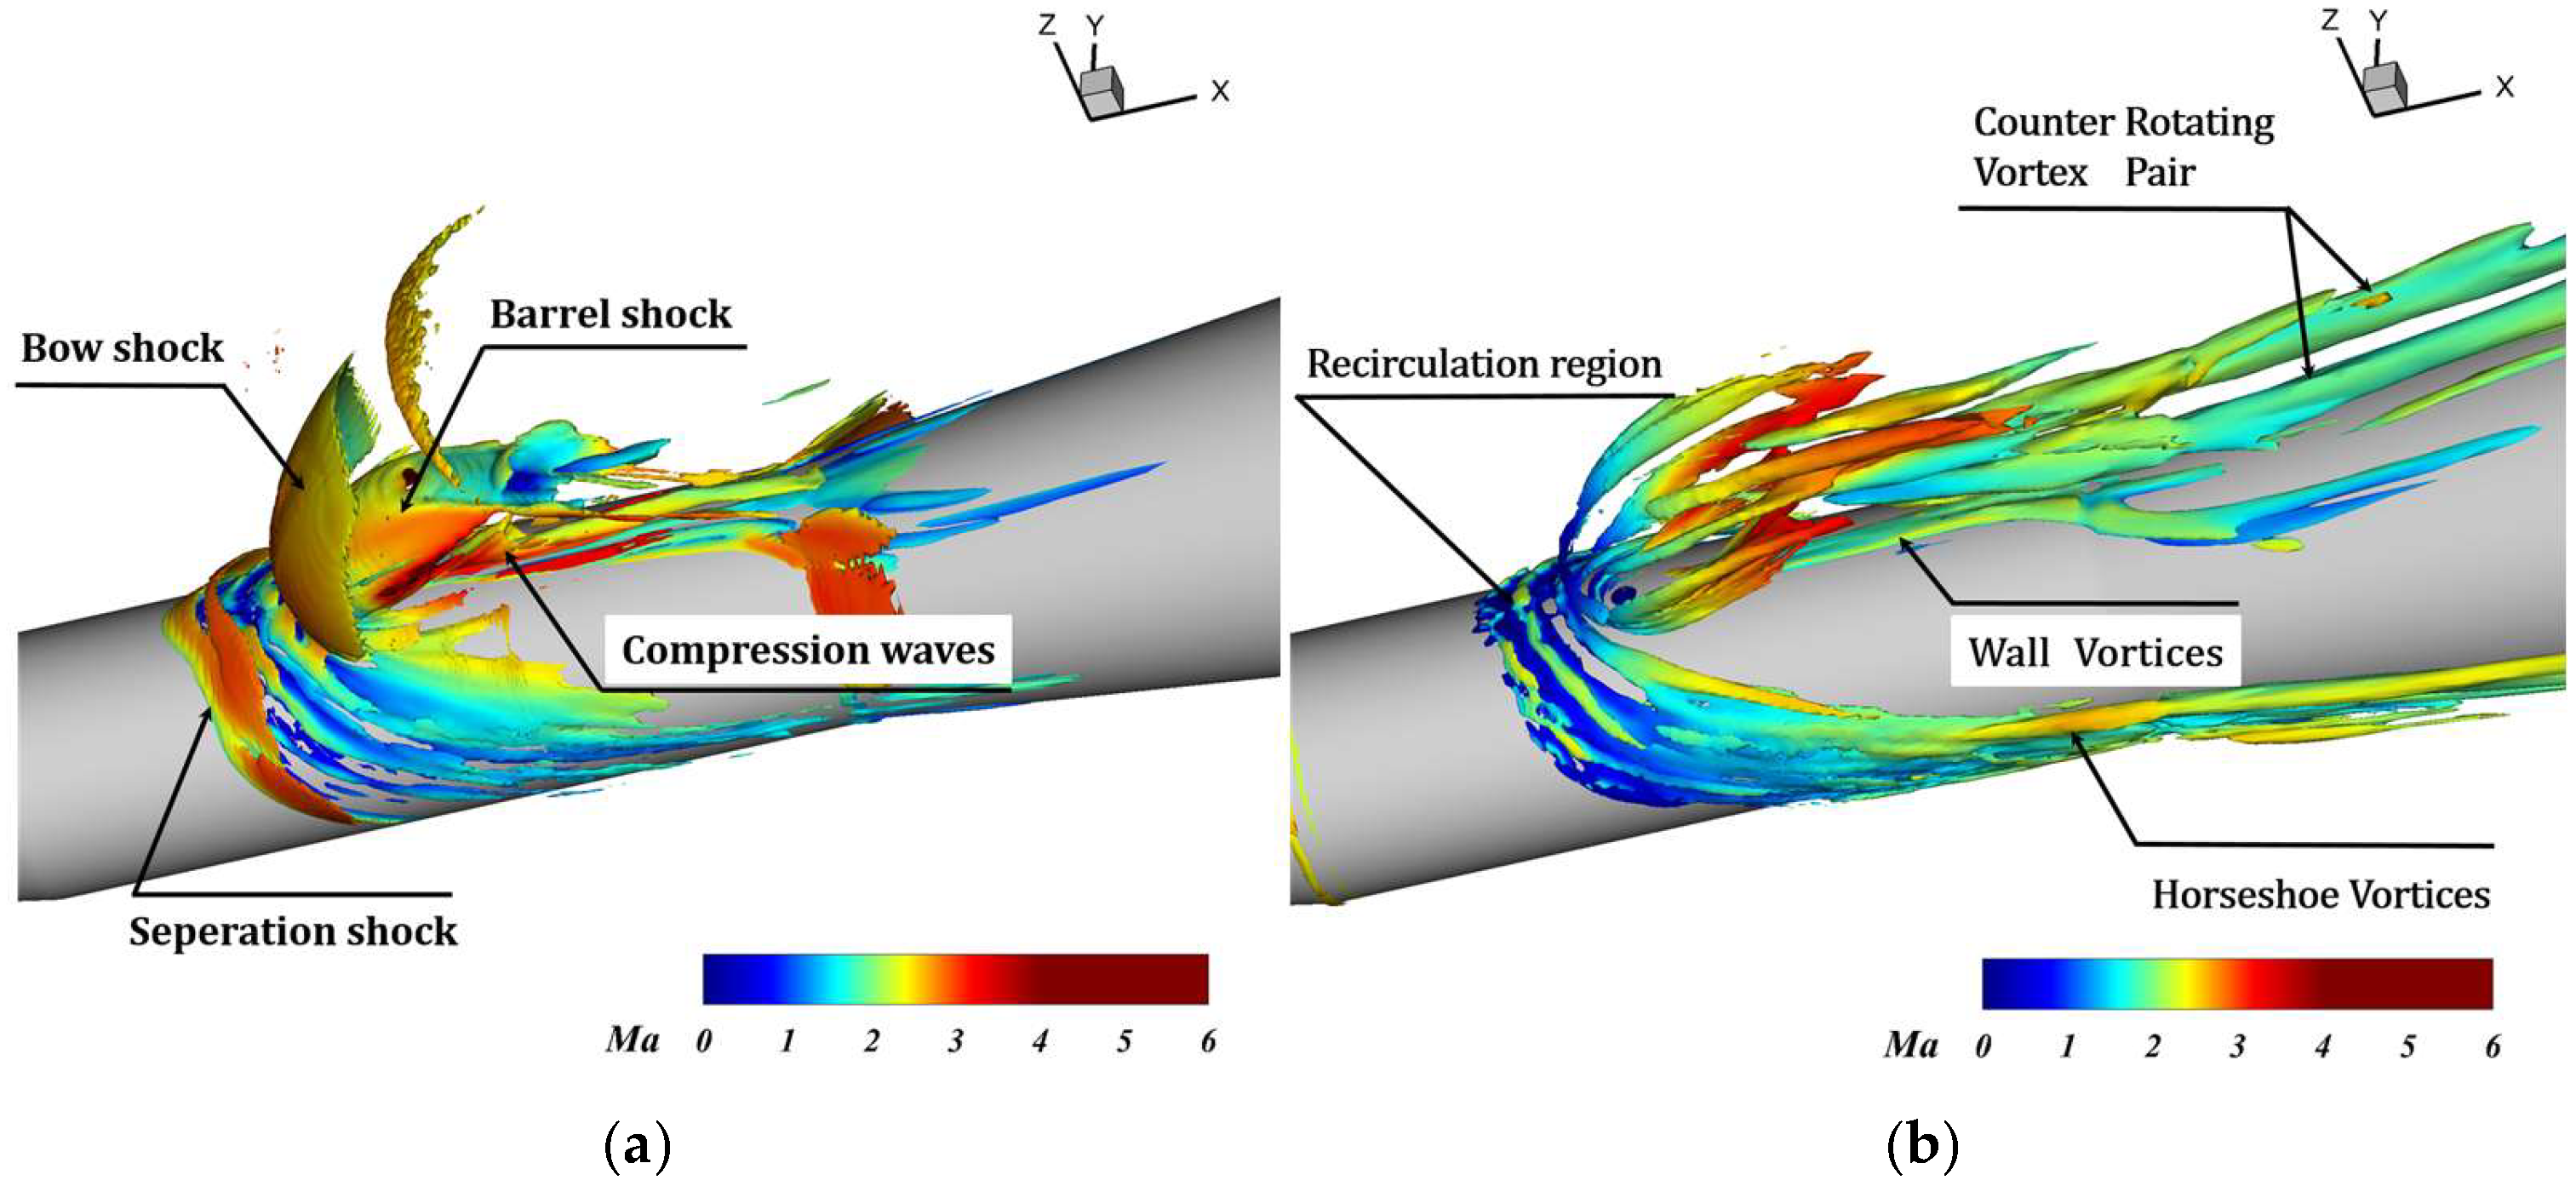
Figure 11 presents a three-dimensional perspective view of the mean flow structures of a sonic jet in supersonic crossflow, with the central plane (y = 0) displaying mean pressure. Figure 11b provides an enlarged view of the flow structures near the jet nozzle, combined with streamline visualization on the central plane. A region of extremely high pressure is observed behind the bow shock and in the near-wall region upstream of the jet, resulting in an adverse pressure gradient near the wall. This adverse pressure gradient causes the crossflow boundary layer to separate, thereby inducing the formation of separation shocks ahead and above the main separation zone. Additionally, a secondary separation zone is present near the upstream jet. Within the streamline pattern in the jet wake, a singular point is evident, originating from the reattachment of the crossflow after bypassing the jet. This phenomenon has also been observed in studies of incompressible crossflow jets [33] and in numerical simulations of sonic jets in supersonic crossflow. Figure 12 illustrates the three-dimensional flow structure of a transverse jet in supersonic crossflow. The Q-criterion ( Q = 1 2 ( Ω 2 S 2 ) [34], where Ω is the vorticity tensor, and S is the strain rate tensor, is employed due to its simplicity in implementation. In this paper, threshold values of Q = 10 and Q = −70 are implemented to identify vorticity-dominated and shear-dominated flow regions, respectively. Figure 12a first displays the isosurfaces of negative Q, representing regions dominated by shear in the mean flow structures. This is consistent with the flow structure analysis on the central plane in Figure 11, where complex shock leads to the formation of three-dimensional reattachment shocks. Figure 12b shows the isosurfaces of positive Q, representing regions dominated by vorticity in the mean flow structures. The interaction between the bow shock and the boundary layer results in separation, forming a recirculation zone and a horseshoe vortex ahead of the bow shock’s base. These are generated by the interaction between the incoming flow boundary layer and the jet, and they remain in a position close to the jet wall. In the near-field region of the jet, from the upstream to the sides of the jet, hanging vortices are formed by the inclined mixing layer between the crossflow and the transverse jet. In contrast, in the far-field region downstream of the jet, two pairs of counter-rotating vortices are clearly visible, which are commonly referred to as the counter-rotating vortex pair (CVP) structures in the literature.
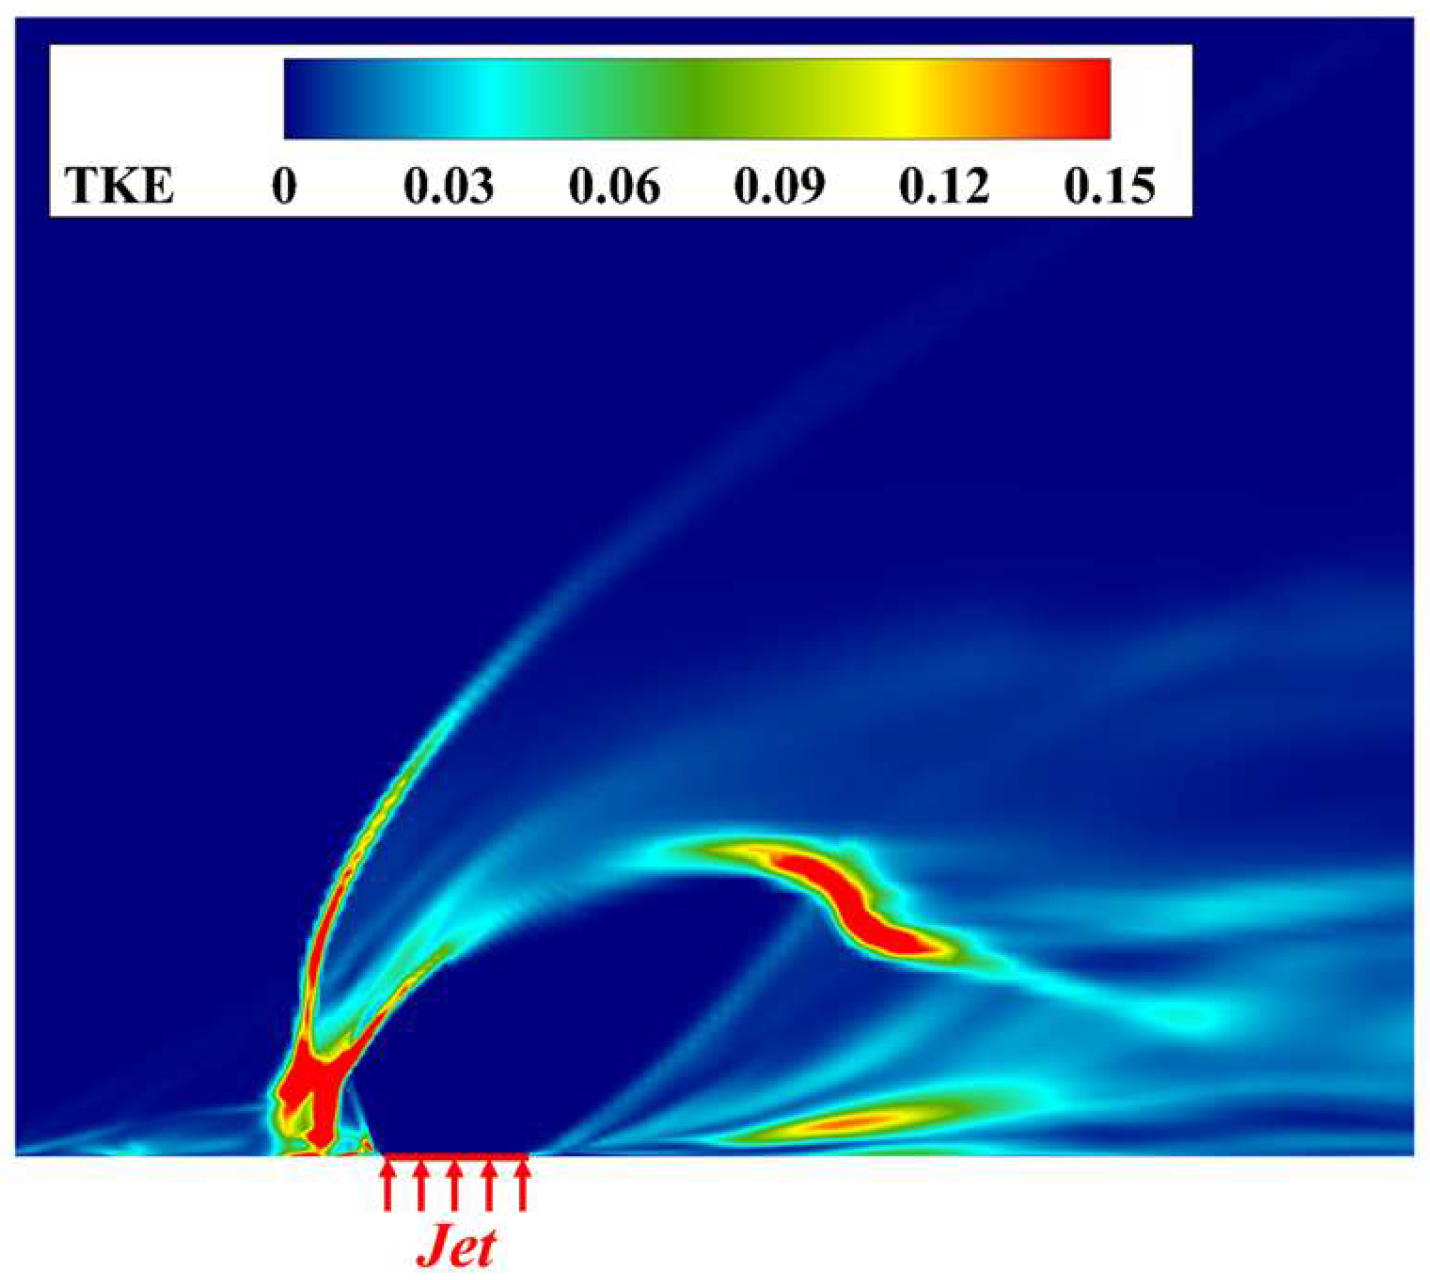
For a jet issuing from a vehicle into a supersonic crossflow, the shearing process between the jet layer and the windward shear layer generates strong turbulent fluctuations, significantly affecting the flow characteristics. Additionally, the shock wave motion associated with the compression process further intensifies the flow fluctuations, and these fluctuations are reflected in the turbulent statistics. Figure 13 shows the typical contour lines of the turbulent kinetic energy (TKE), defined as k = ( u i u i ¯ ) / 2 , where u i u i ¯   represents Reynolds-averaged turbulent velocity fluctuations (streamwise u 1 , transverse u 2 , spanwise u 3 ). The relatively high TKE is primarily concentrated in the jet deflection region and around the bow shock, indicating that these locations exhibit the most intense turbulent activity and serve as key regions where jet interference drives the evolution of flow structures (e.g., counter-rotating vortex pair, separation bubble). Specifically, in regions where the shear interaction between the jet and the main flow is intense, the velocity difference there induces a strong shear effect, and the turbulent energy is intensely generated and dissipated. For the non-jet interference regions, the turbulent kinetic energy is relatively low, forming a sharp contrast with the jet interference regions, highlighting the strong disturbance of the transverse jet on the local flow.
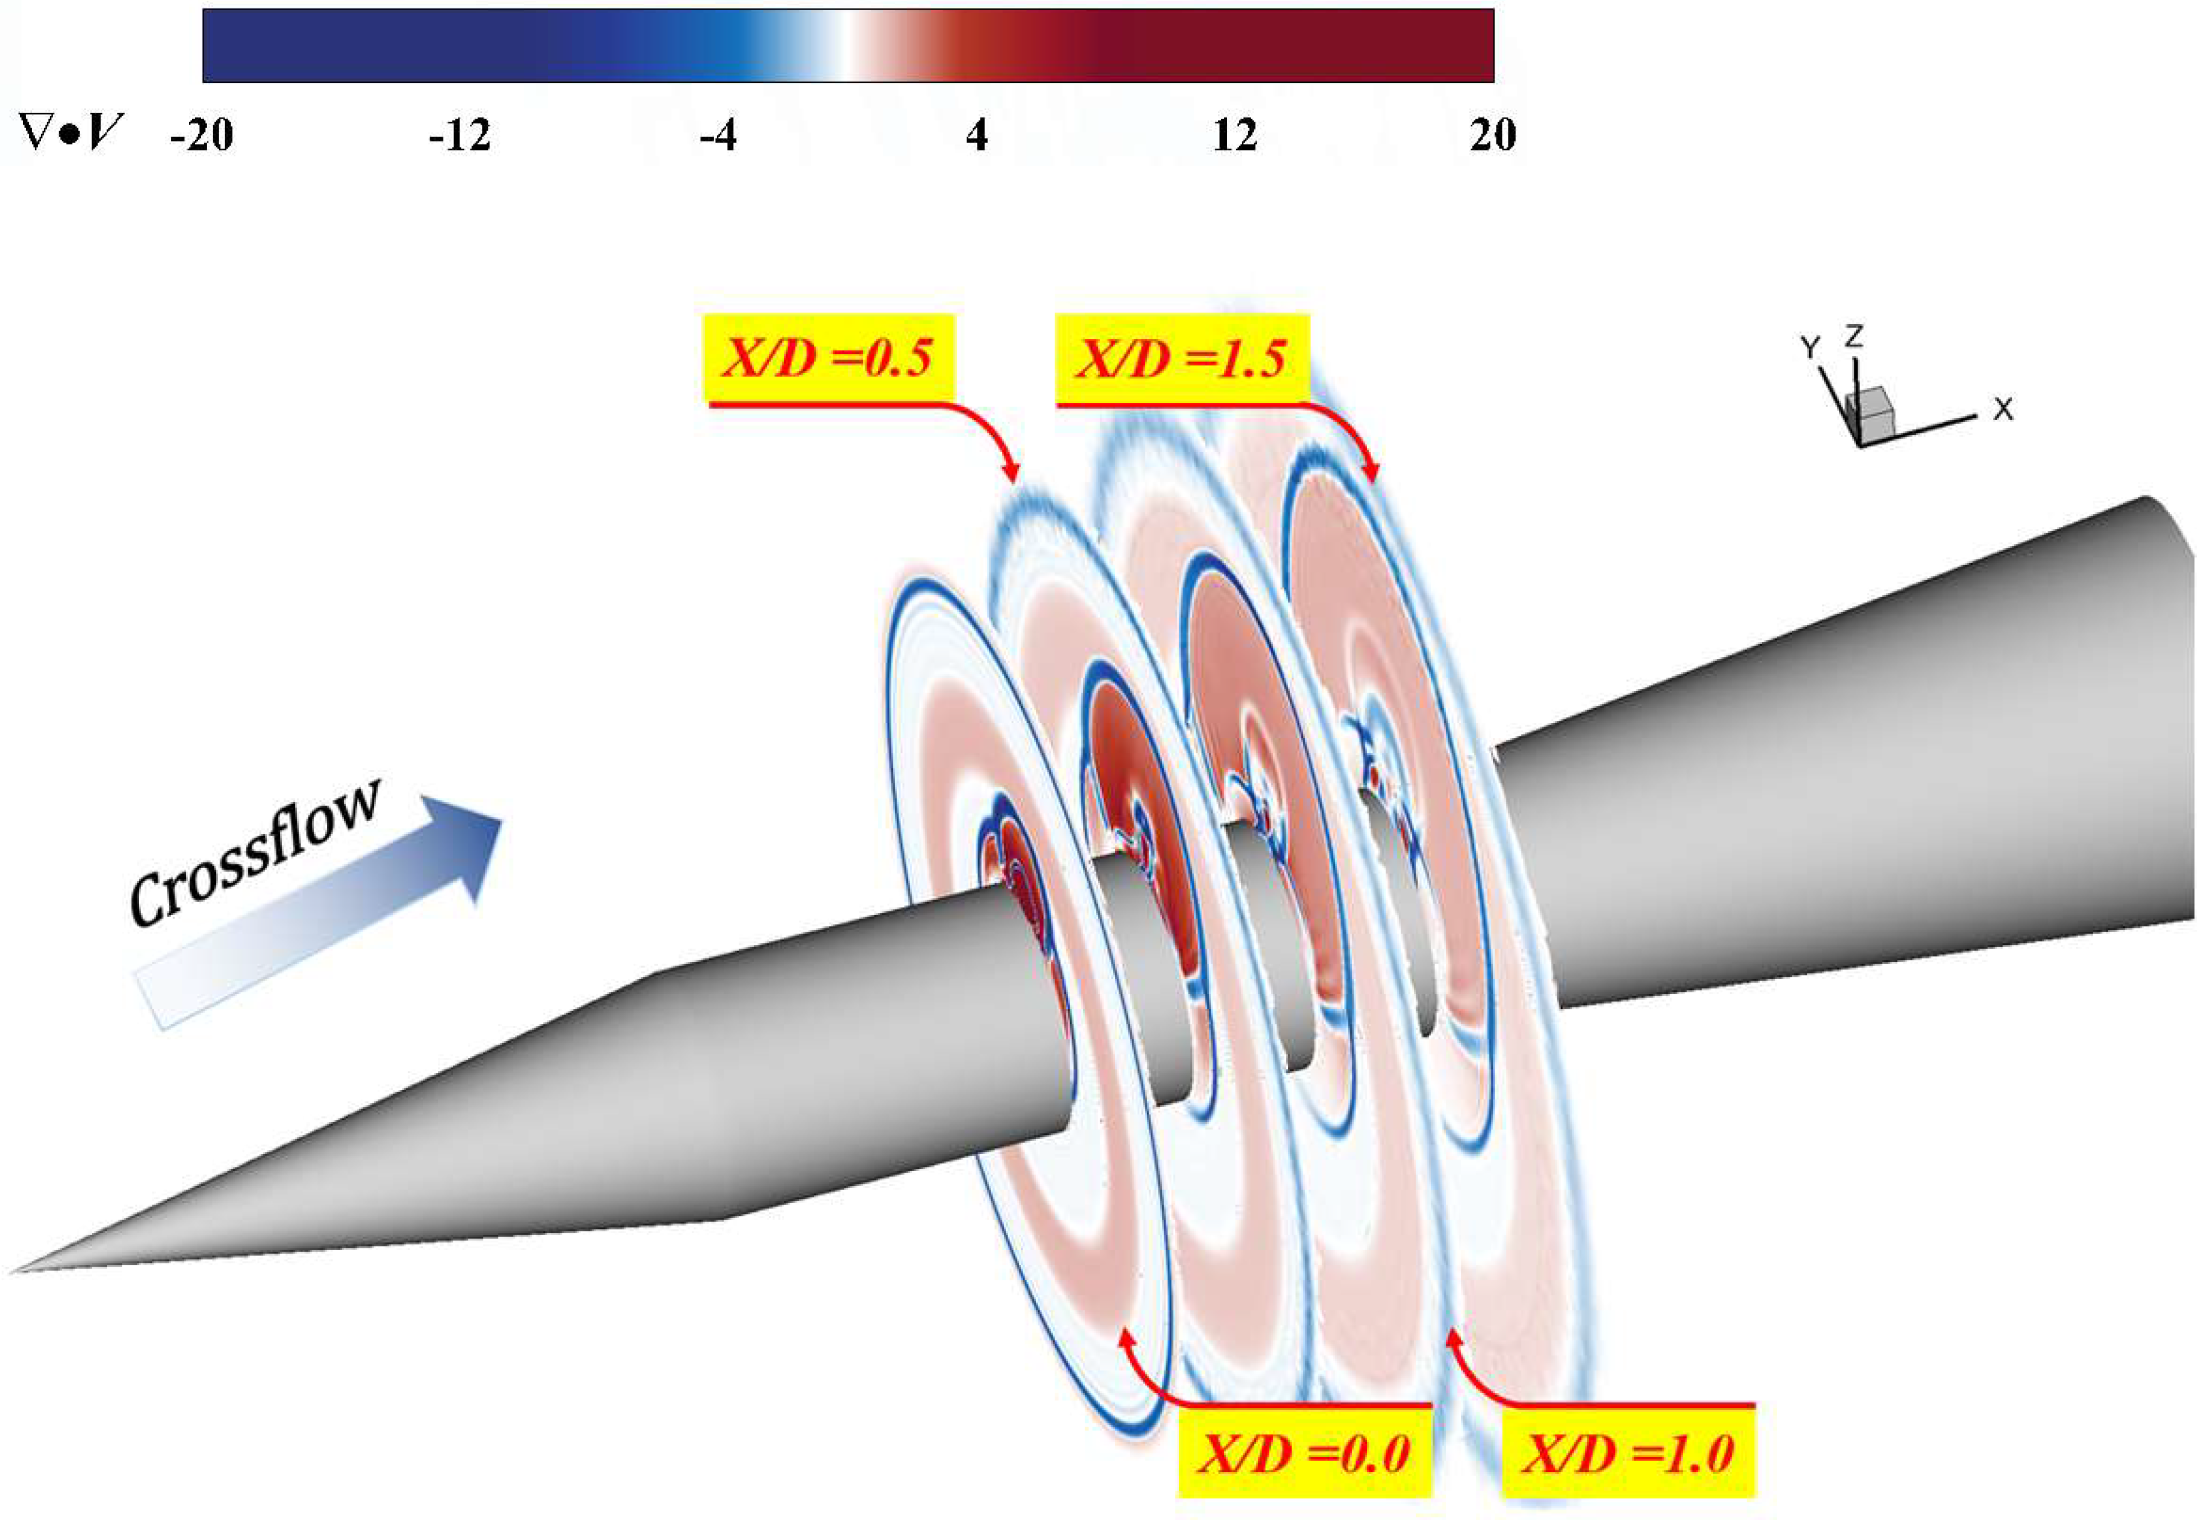
Figure 14 presents the distribution of velocity divergence along four cross-sections in the flow direction. The velocity divergence distribution reveals three distinct shock waves along the radial direction: the outermost is the bow shock wave from the incoming flow; the innermost is the barrel shock wave of the jet; and the middle one is the separation shock wave formed in the upstream separation zone of the jet. Along the flow direction, the bow shock wave expands in range and weakens in intensity. The barrel shock wave of the jet nearly vanishes at x = 1.0, being replaced by the compression wave downstream of the Mach disk, as confirmed by Figure 14. Figure 15 illustrates the distribution of the x-component of vorticity ( ω x ) for the four cross-sections. Figure 15a demonstrates the strong vorticity near the outer edge of the jet, attributed to the shear layer between the crossflow and the jet. Additionally, a smaller hanging vortex emerges from the side-sloping shear layer adjacent to the jet exit, persisting in a quasi-steady state while evolving downstream before rapid dissipation. Further downstream, a rich array of vortex structures is observed. Figure 15b (x = 0.5) illustrates large-scale vortex structures formed by shear layer instability propagating along the jet boundary, while Figure 15c (x = 1.0) reveals a distinct CVP structure. As these vortex structures convect downstream, they interact with the CVP, weakening and breaking down until at Figure 15d (x = 1.5), only a stable CVP remains, with other vortex structures having almost completely dissipated.
In summary, as anticipated, the mean field of this problem reveals a rather complex flow evolution process: numerous shock waves and vortices are identified, which may play a significant role in the overall mixing between the jet and the free stream.

4.2. Unsteady-Flow Features and Temporal Spectra

The unsteady characteristics of the flow can directly affect the stability of jet control and structural safety in the practical application of transverse jet control for high-speed vehicles. However, previous research has mainly focused on predicting and validating time-averaged surface loads, while obvious deficiencies remain in understanding the transient evolution of spatial flow structures and their underlying physical mechanisms. These transient flow characteristics, particularly the interaction mechanisms between shock waves and vortex structures, as well as the propagation mechanisms of pressure fluctuation, are the key factors that determine the efficiency of jet control. The present study employs DMD and spectral analysis to systematically investigate unsteady-flow characteristics, with particular emphasis on revealing the coupling mechanisms between shock oscillations and vortex structure evolution, as well as delineating the propagation pathways of pressure disturbances and their impact on jet control performance.
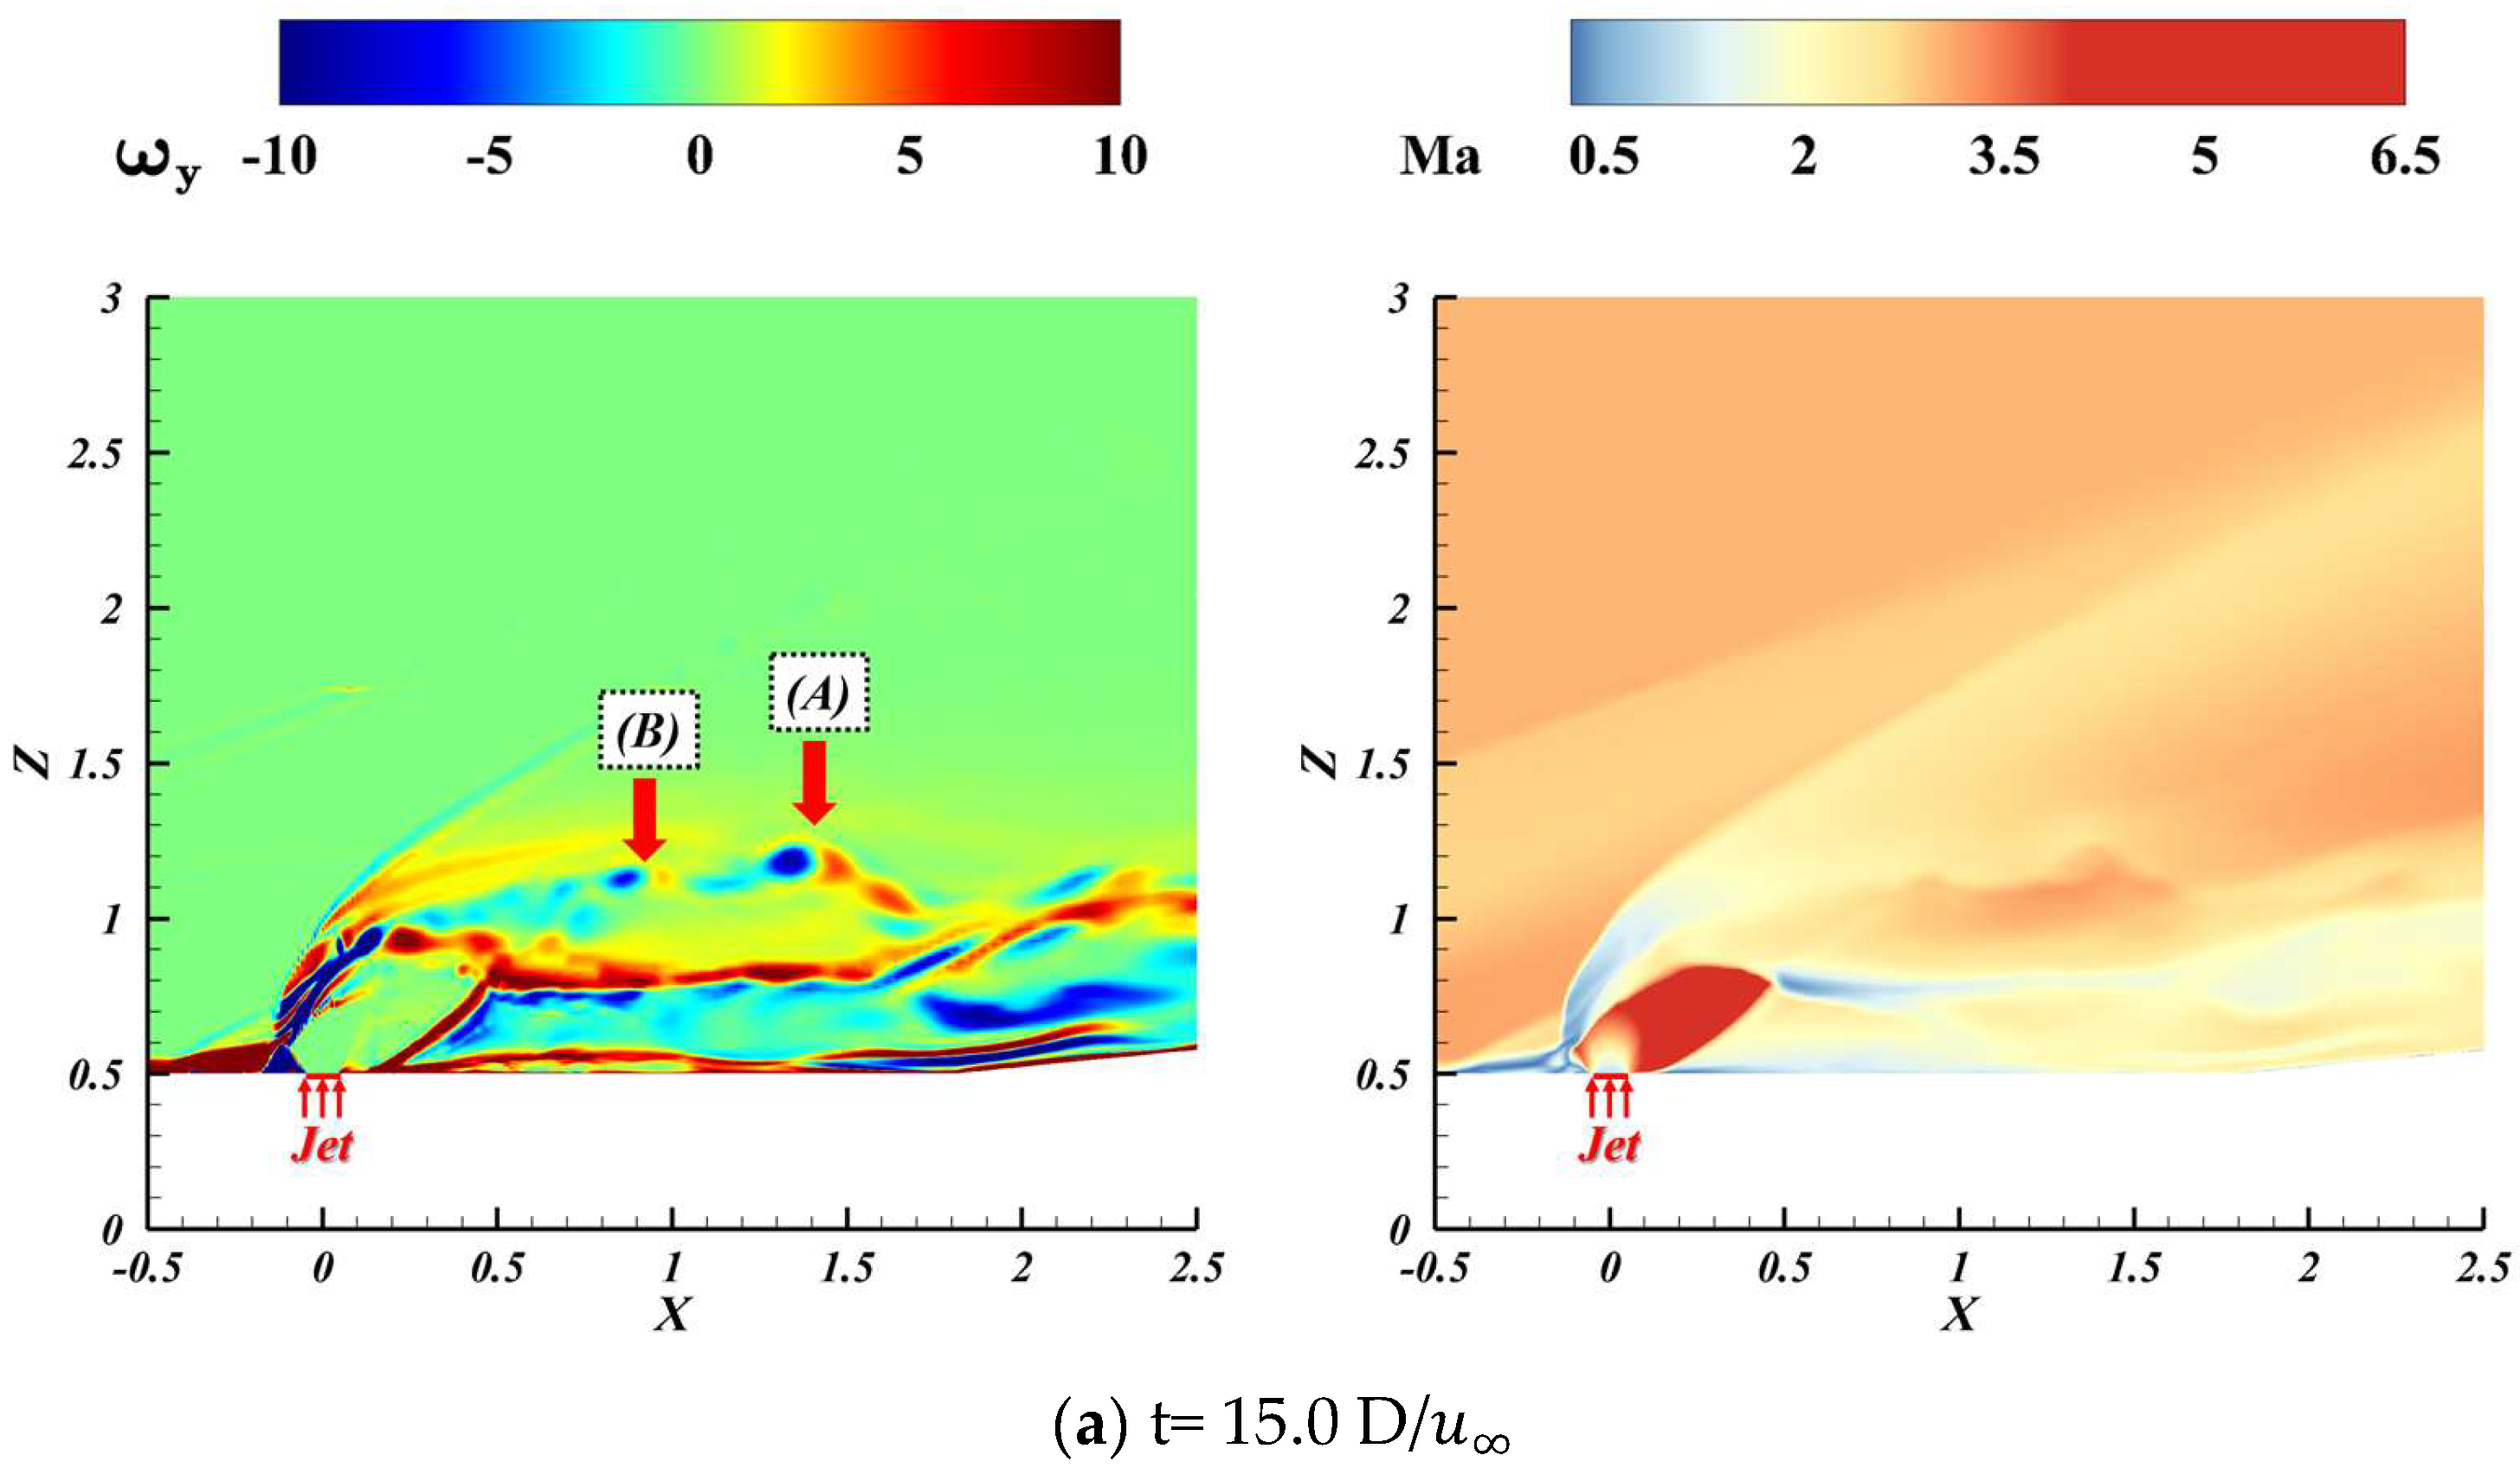
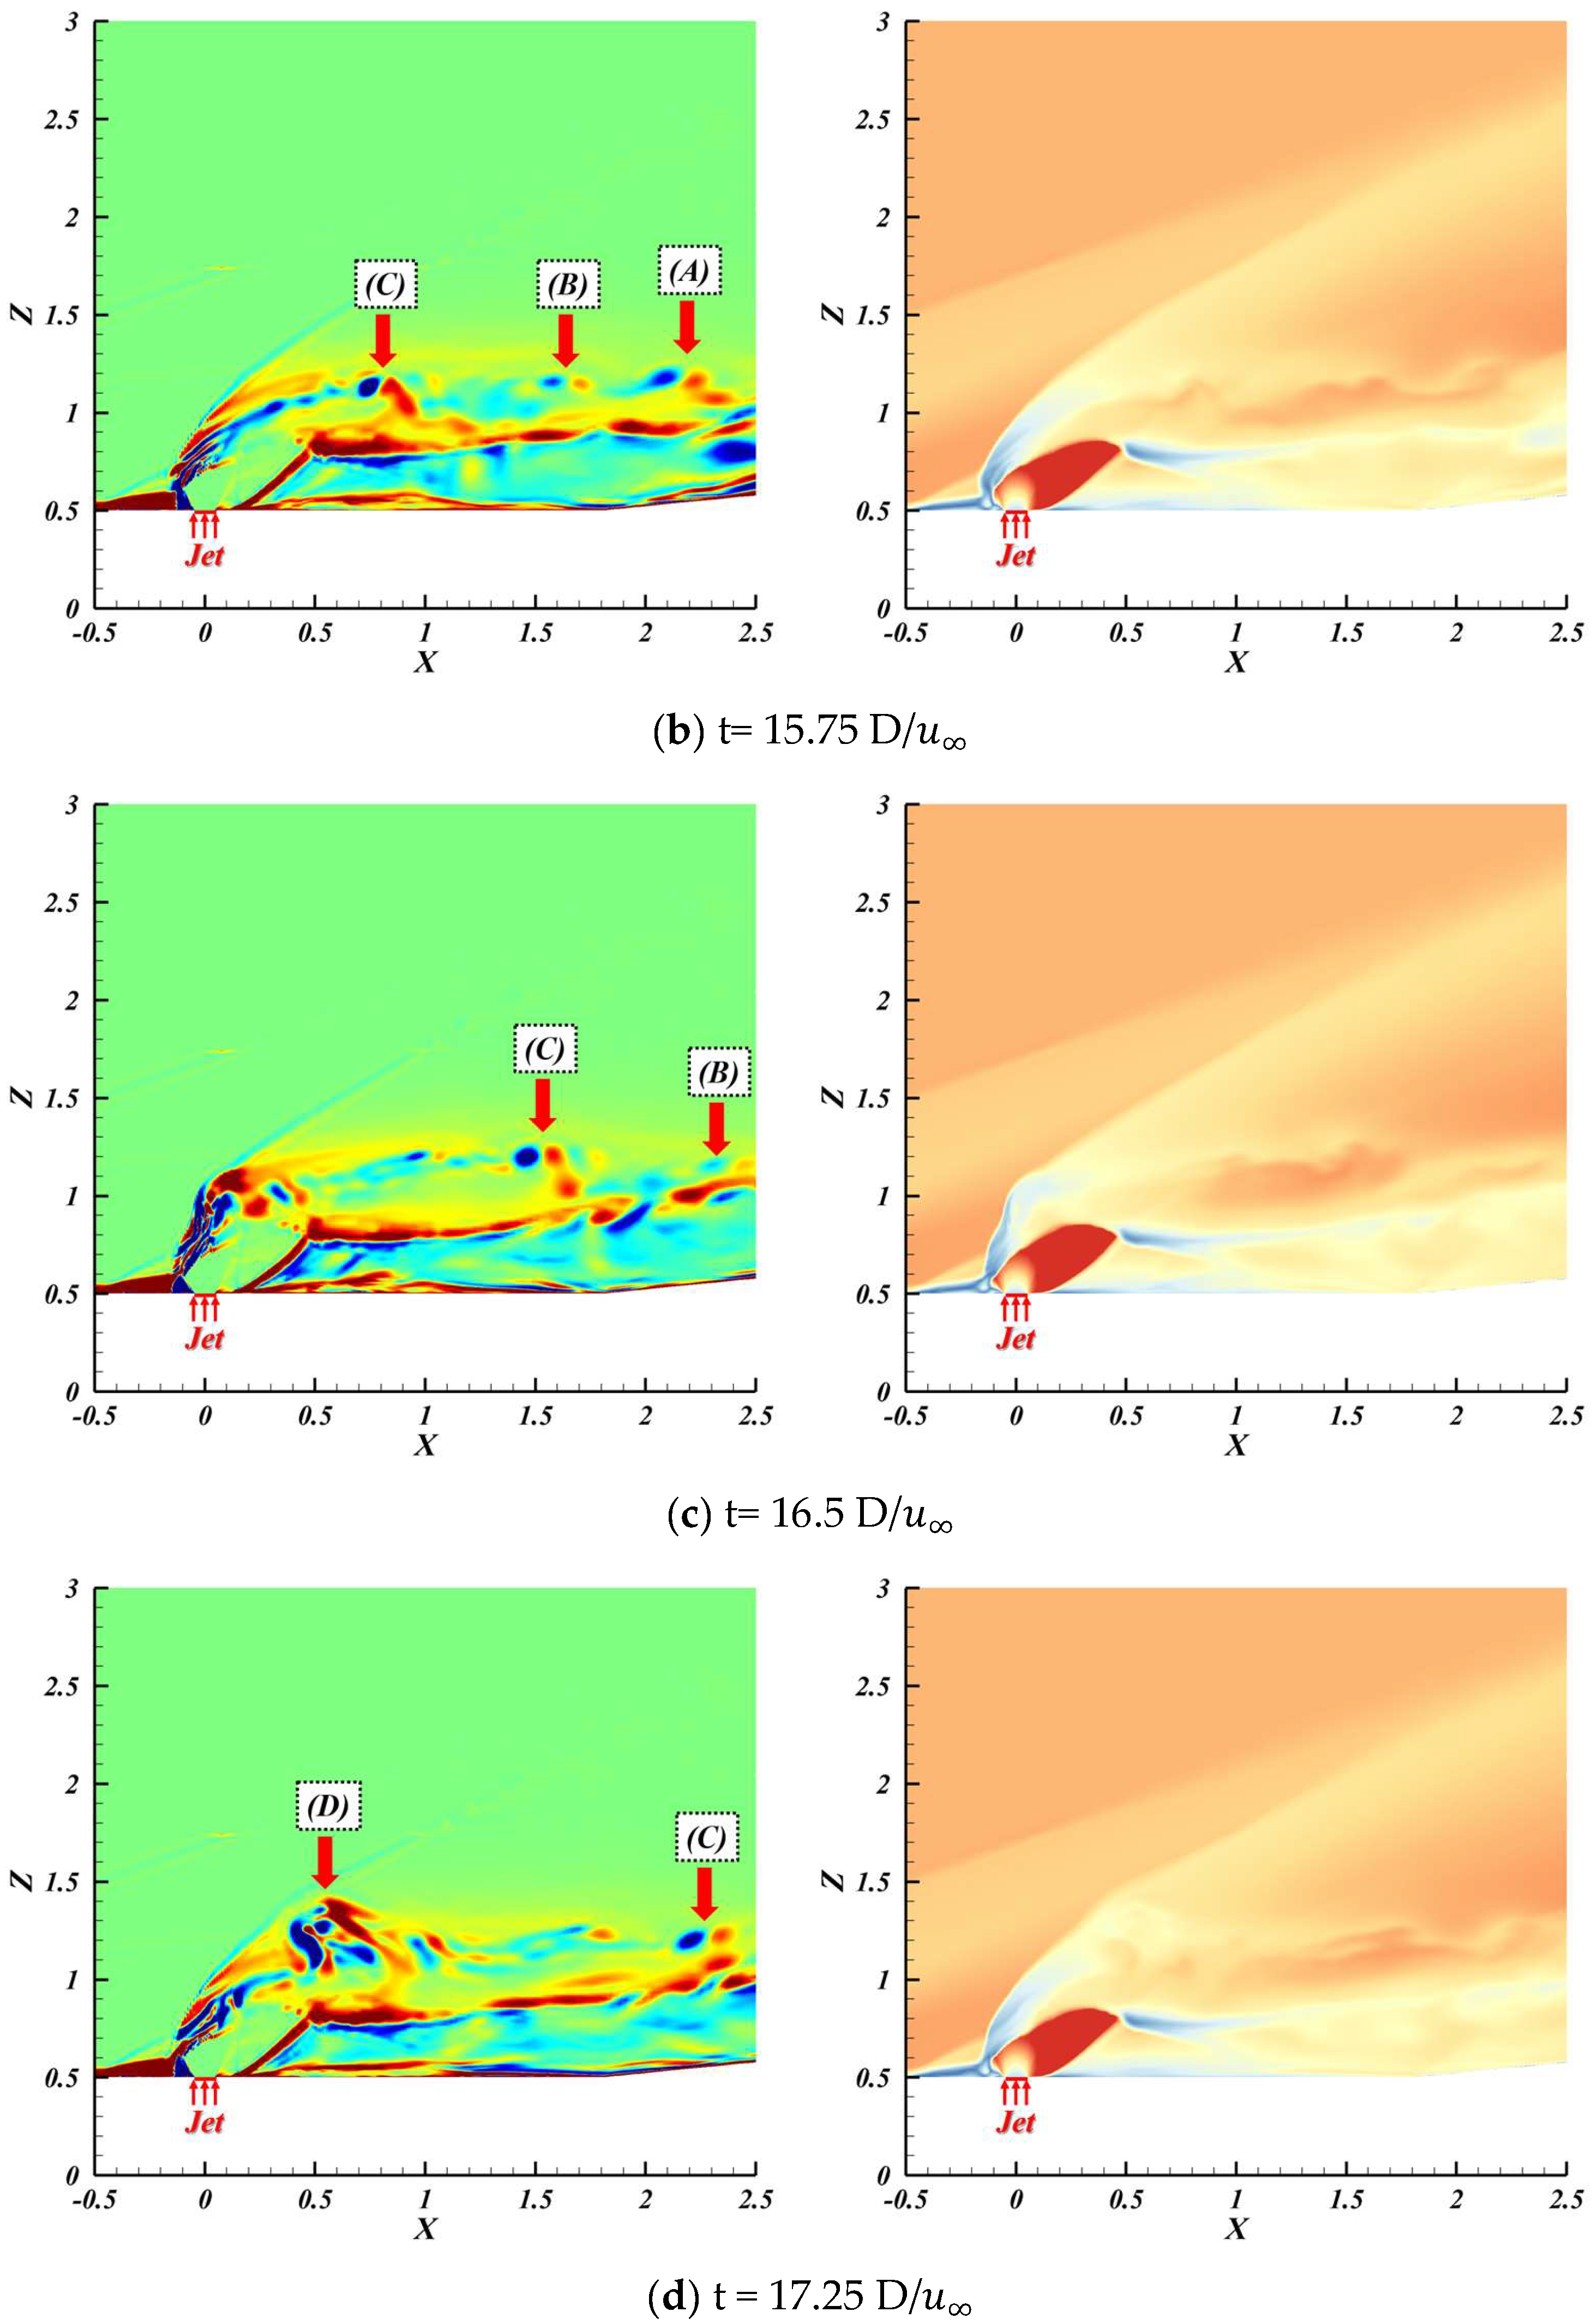
Figure 16 presents the distribution of spanwise vorticity ( ω y ) and Mach number on the symmetry plane (y = 0) at different moments. From the vorticity contour, it is evident that two counter-rotating vortices exist near the wall upstream of the jet. In conjunction with Figure 11, it is known that the region of positive vorticity represents the flow separation induced by the bow shock, which further induces a series of compression waves merging into a separation shock. The Mach number contour reveals that these two features constitute a λ shock. The region of negative vorticity corresponds to the second separation zone depicted in Figure 11. On the windward side of the jet, the interaction between the crossflow and the jet forms a shear layer, which rolls up into vortices that detach from the upstream boundary of the jet and shed downstream. Downstream of the jet, distinct quasi-ordered flow structures emerge. The vorticity contour indicates that these structures originate from two sources: one is the instability of the shear layer on the windward side of the jet; the other is the instability of the shear layer between the jet passing through the Mach disk and the surrounding crossflow downstream of the jet. To analyze the relationship of these unsteady motions in the flow dynamics, this study proceeds to conduct modal analysis on the flow dynamics to help improve our comprehension of these flow oscillation mechanisms.
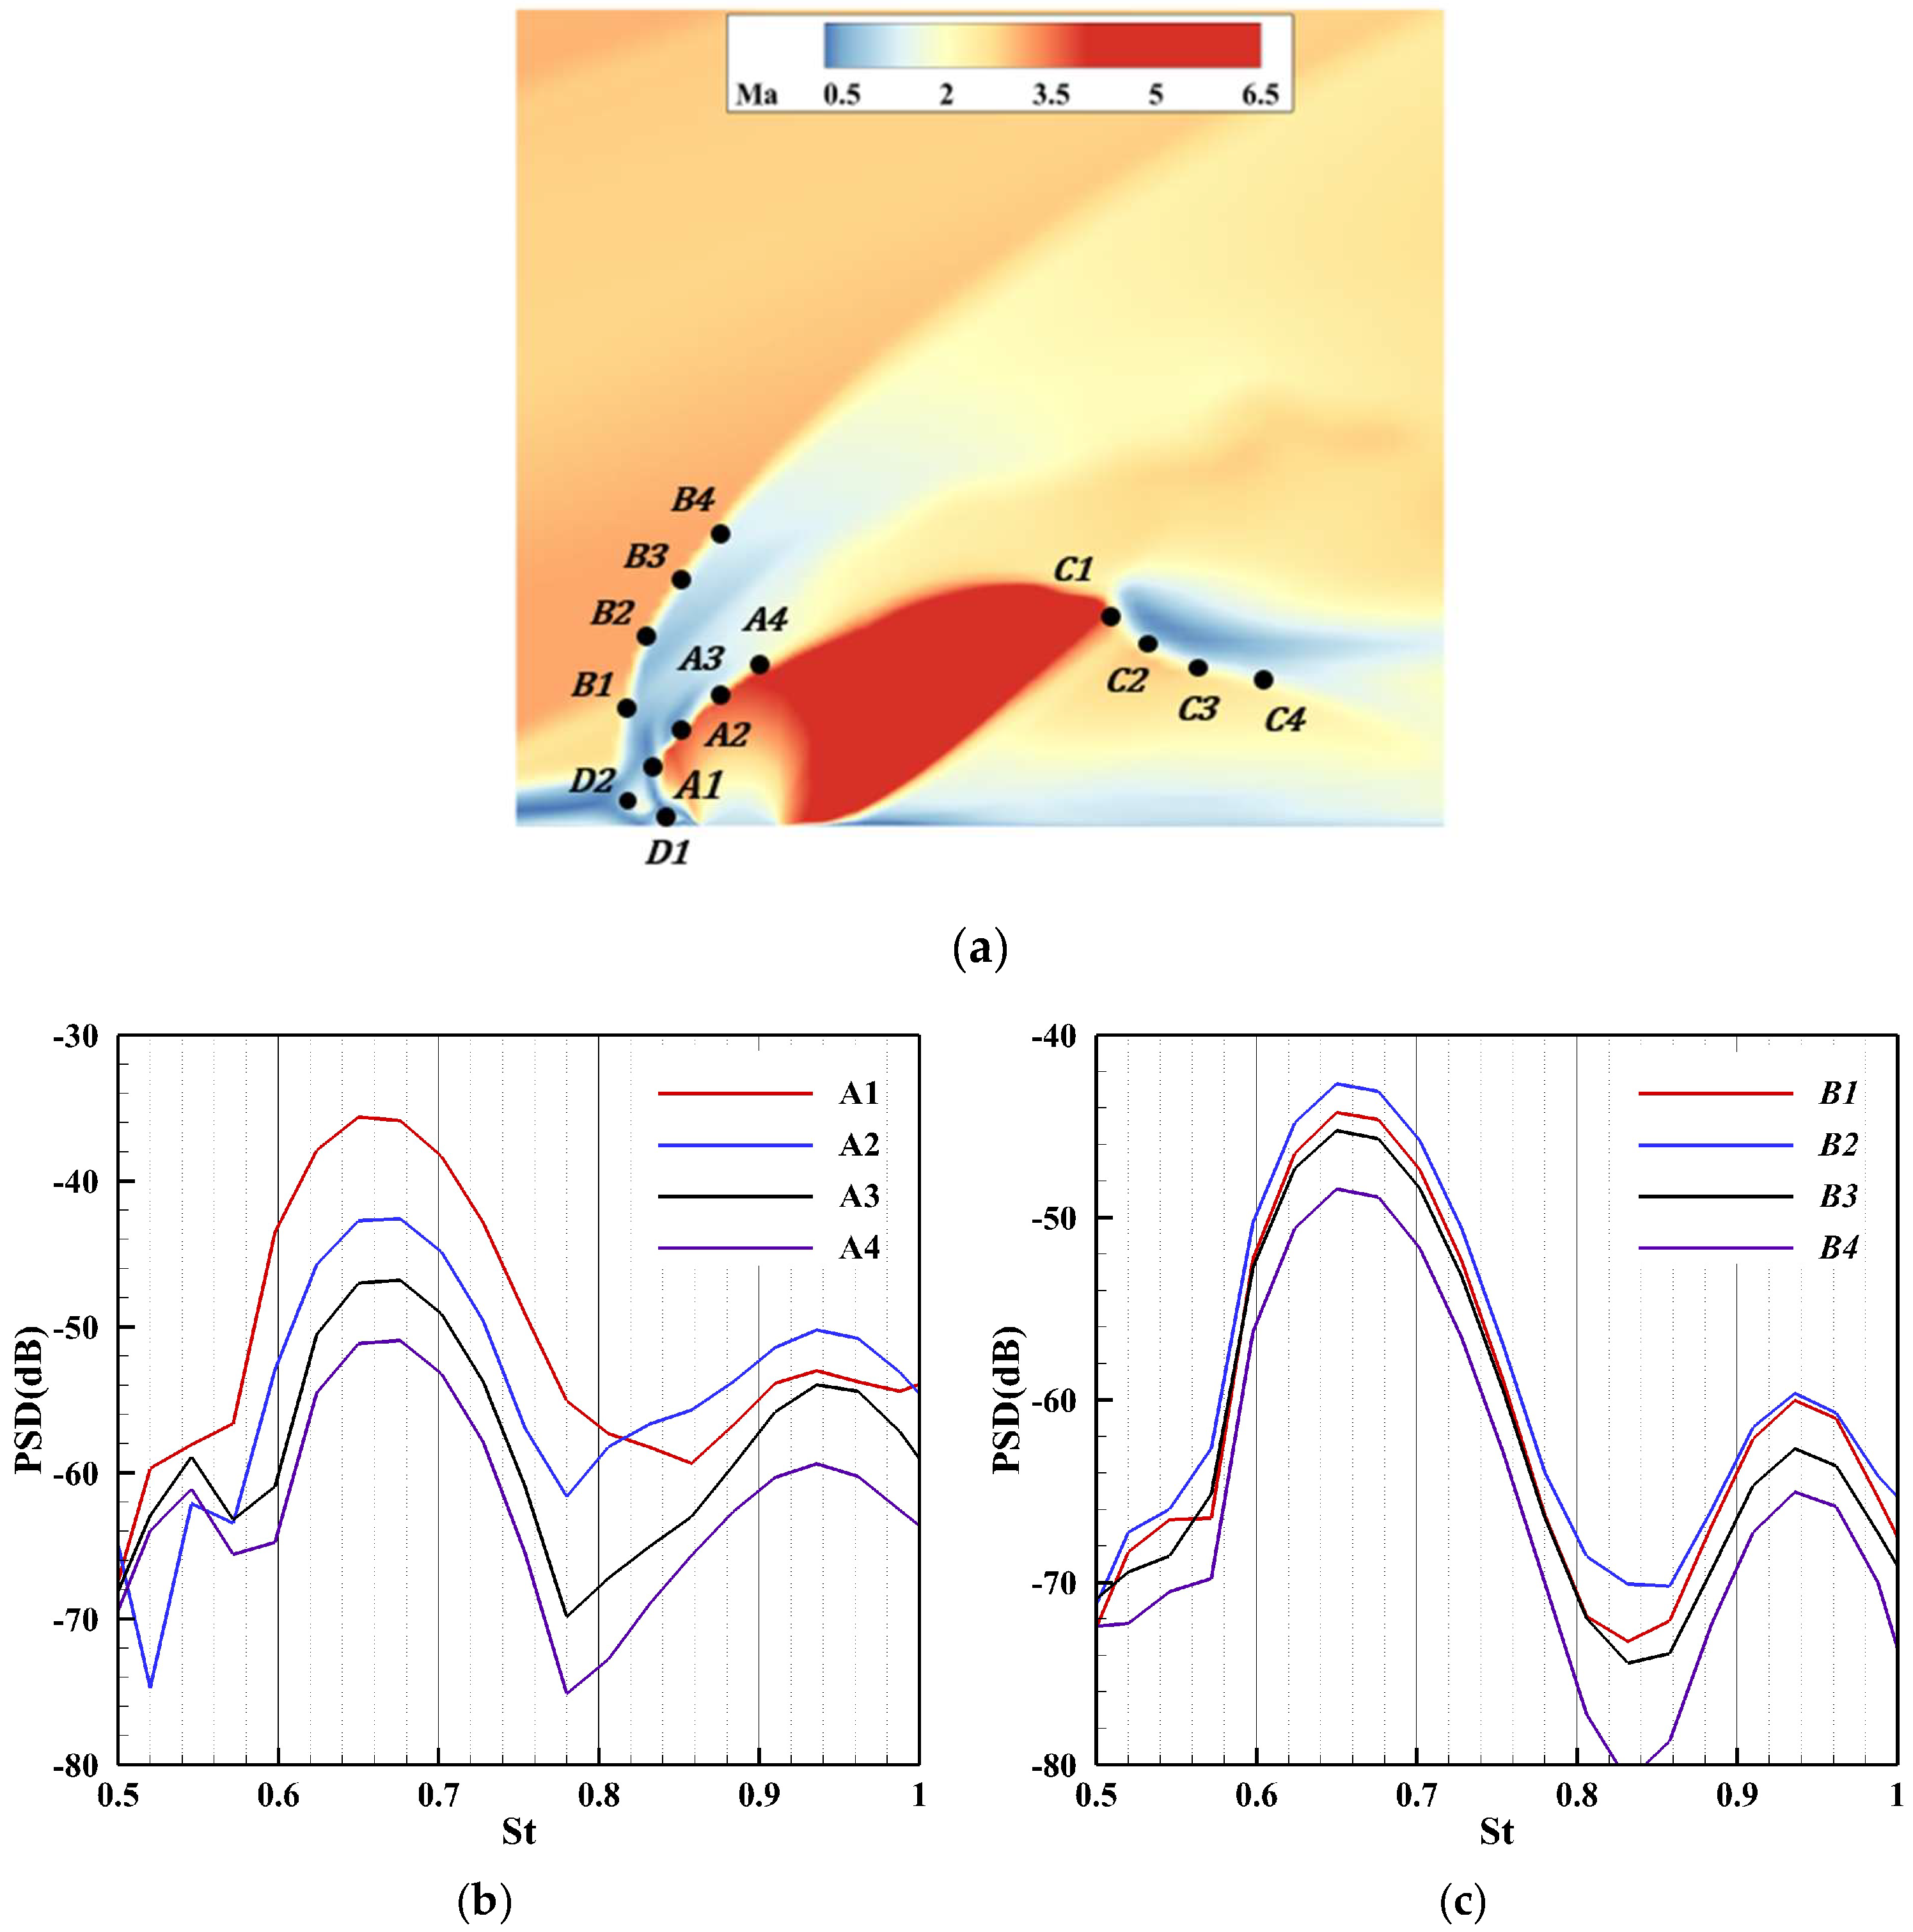
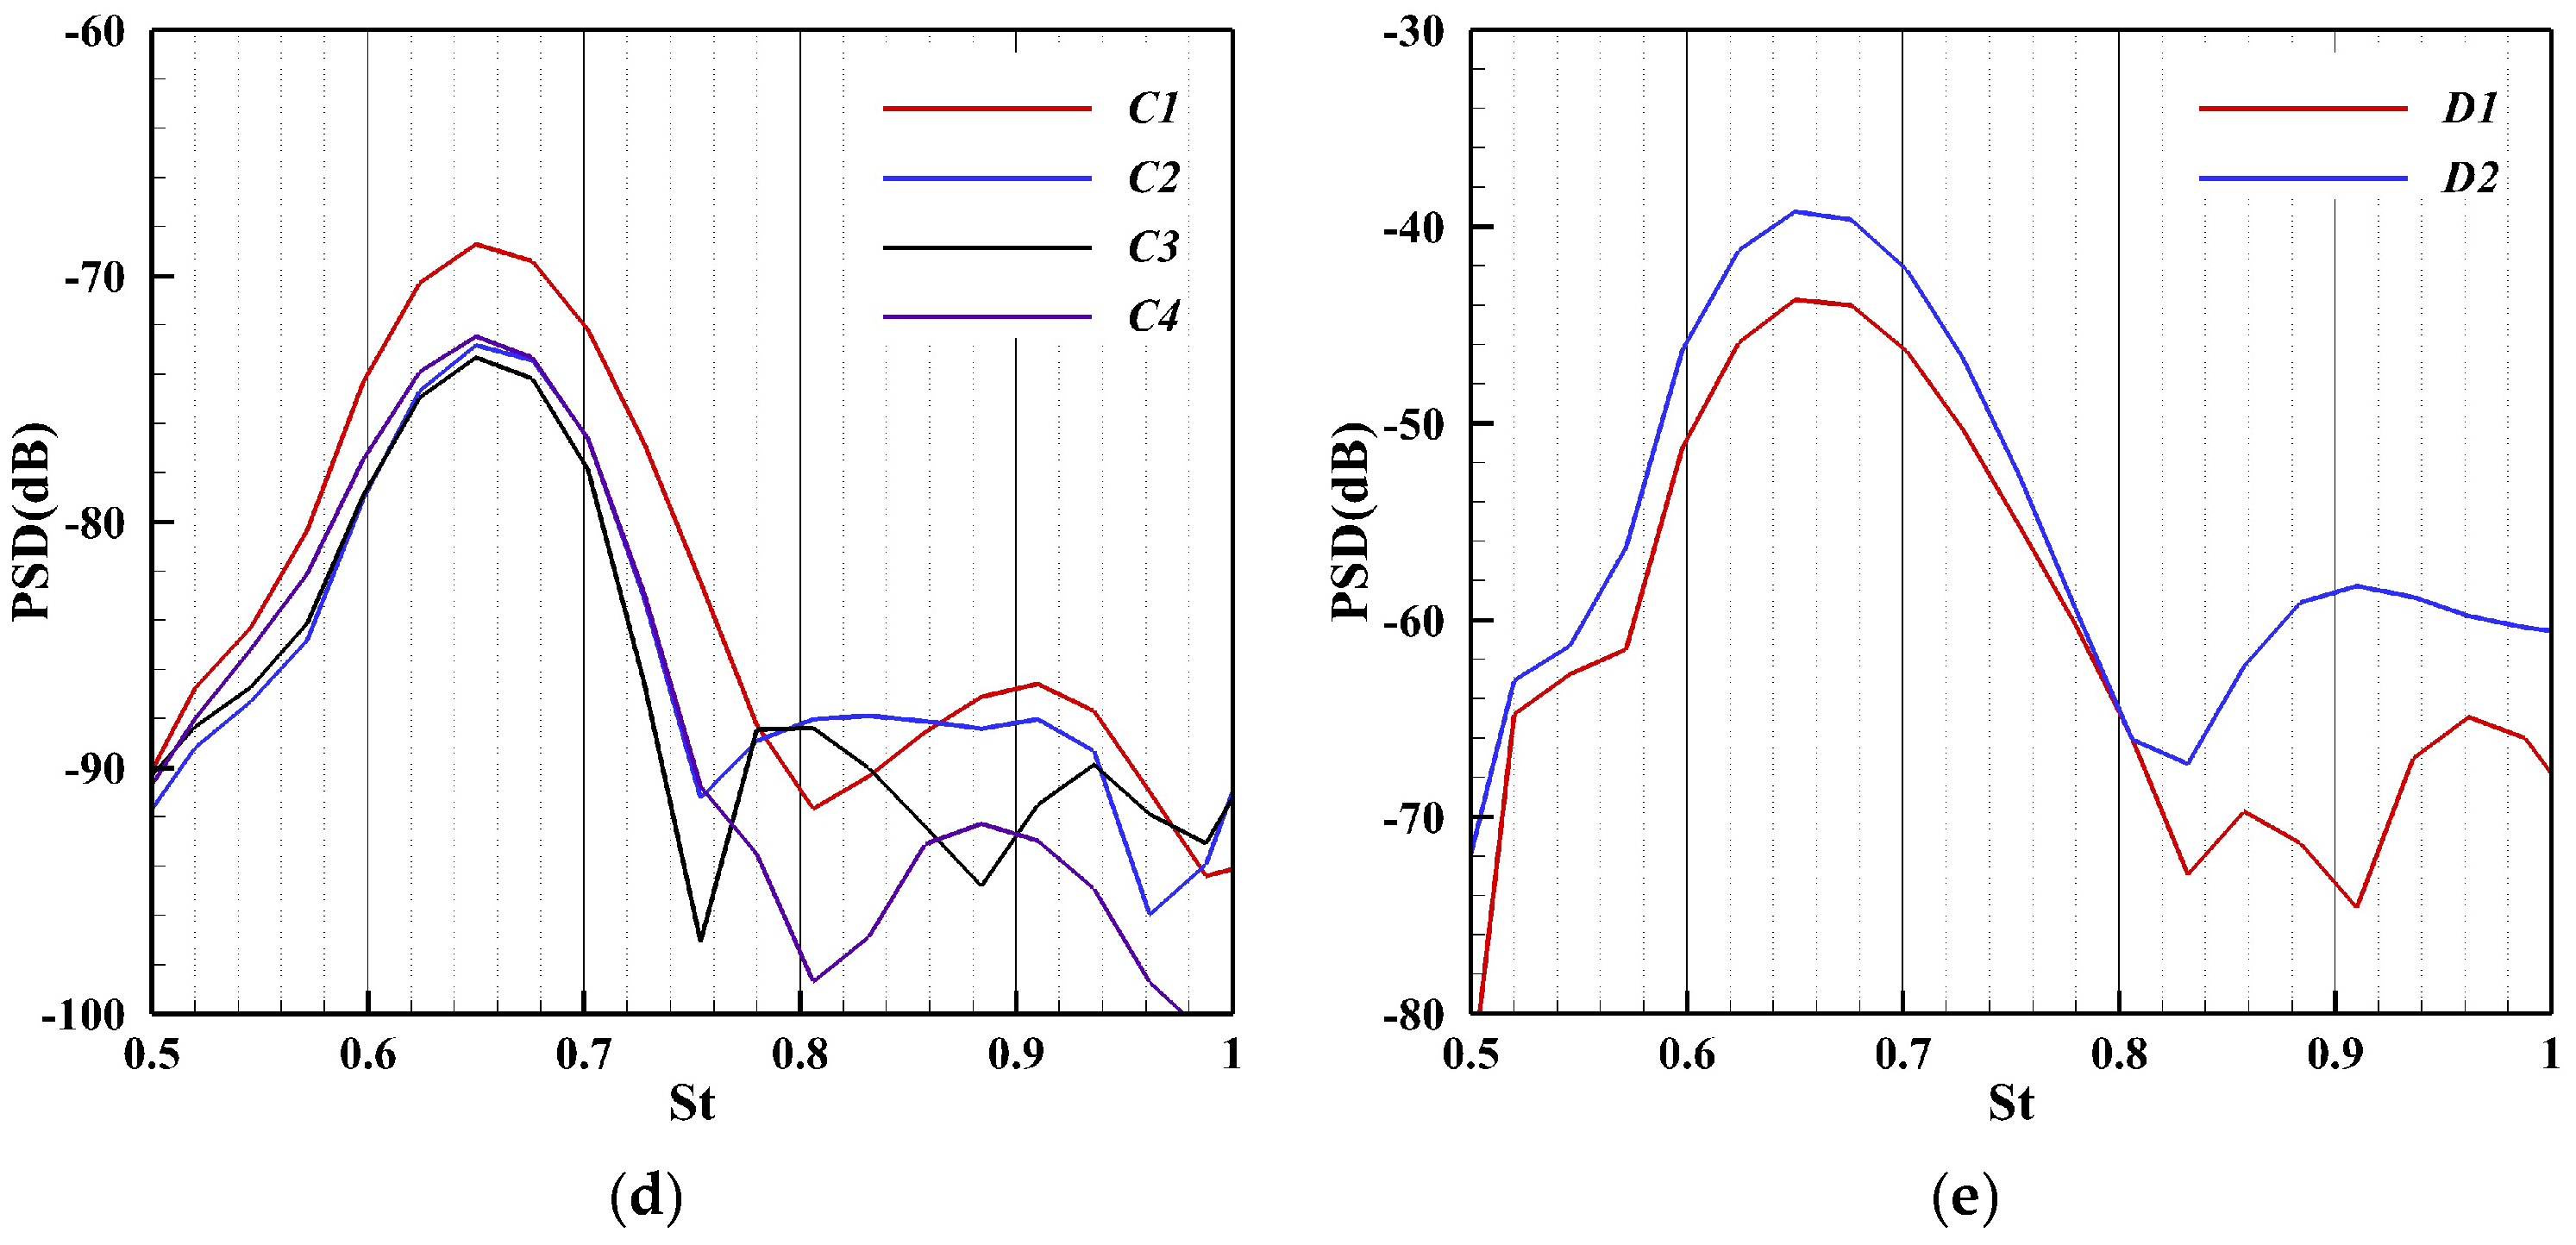
In this section, four specific regions were carefully selected for spectral analysis, as depicted in Figure 17a. The Strouhal number (St = fD/ u , where f is frequency, D is characteristic length, and u is free-stream velocity) is used as the non-dimensional frequency in this study. The spectral analysis demonstrates consistent dominant-frequency behavior across different flow domains. As shown in Figure 17b, the barrel shock region exhibits a spectral peak at St = 0.65. Similarly, Figure 17c confirms this characteristic frequency in the bow shock domain. Further downstream measurements near the Mach disk, presented in Figure 17d, maintain this spectral signature with identical St = 0.65 peaks across all monitoring points. This recurrence is due to the unsteady oscillations of the windward barrel shock. These oscillations cause large-scale changes in the Mach disk and make the downstream shear layer shed at the same frequency. This observation implies that in disparate regions, both upstream and downstream of the jet, the St = 0.65 mode exerts a dominant influence, indicative of the flow system’s oscillatory behavior at a singular, global frequency. To further reveal the underlying mechanisms of flow oscillation, this investigation selected two points within Region D (Figure 17e), situated in the second separation zone upstream of the jet, for spectral analysis. The spectral peaks obtained from these points also clustered around St = 0.65, thereby suggesting a strong correlation between the pressure fluctuations within the separation zone and the large-scale oscillations of the barrel shock and bow shock.
Through spectral analysis of points in four distinct regions, as discussed previously, it was observed that a dominant frequency, remarkably similar across these points, is present in their spectra. This suggests an underlying correlation in the pressure field oscillations among these points. However, the relationship between the oscillation of the barrel shock and that of the bow shock, as well as the pressure fluctuation within the recirculation zone, requires further investigation. This study employs the cross-correlation of unsteady pressure signals to ascertain the propagation direction of pressure disturbances. For two pressure signals pi and pj, with a time delay τ, the covariance coefficient can be defined as
C i j τ = t = p i t p j t + τ t = p i t p i t t = p j t p j t
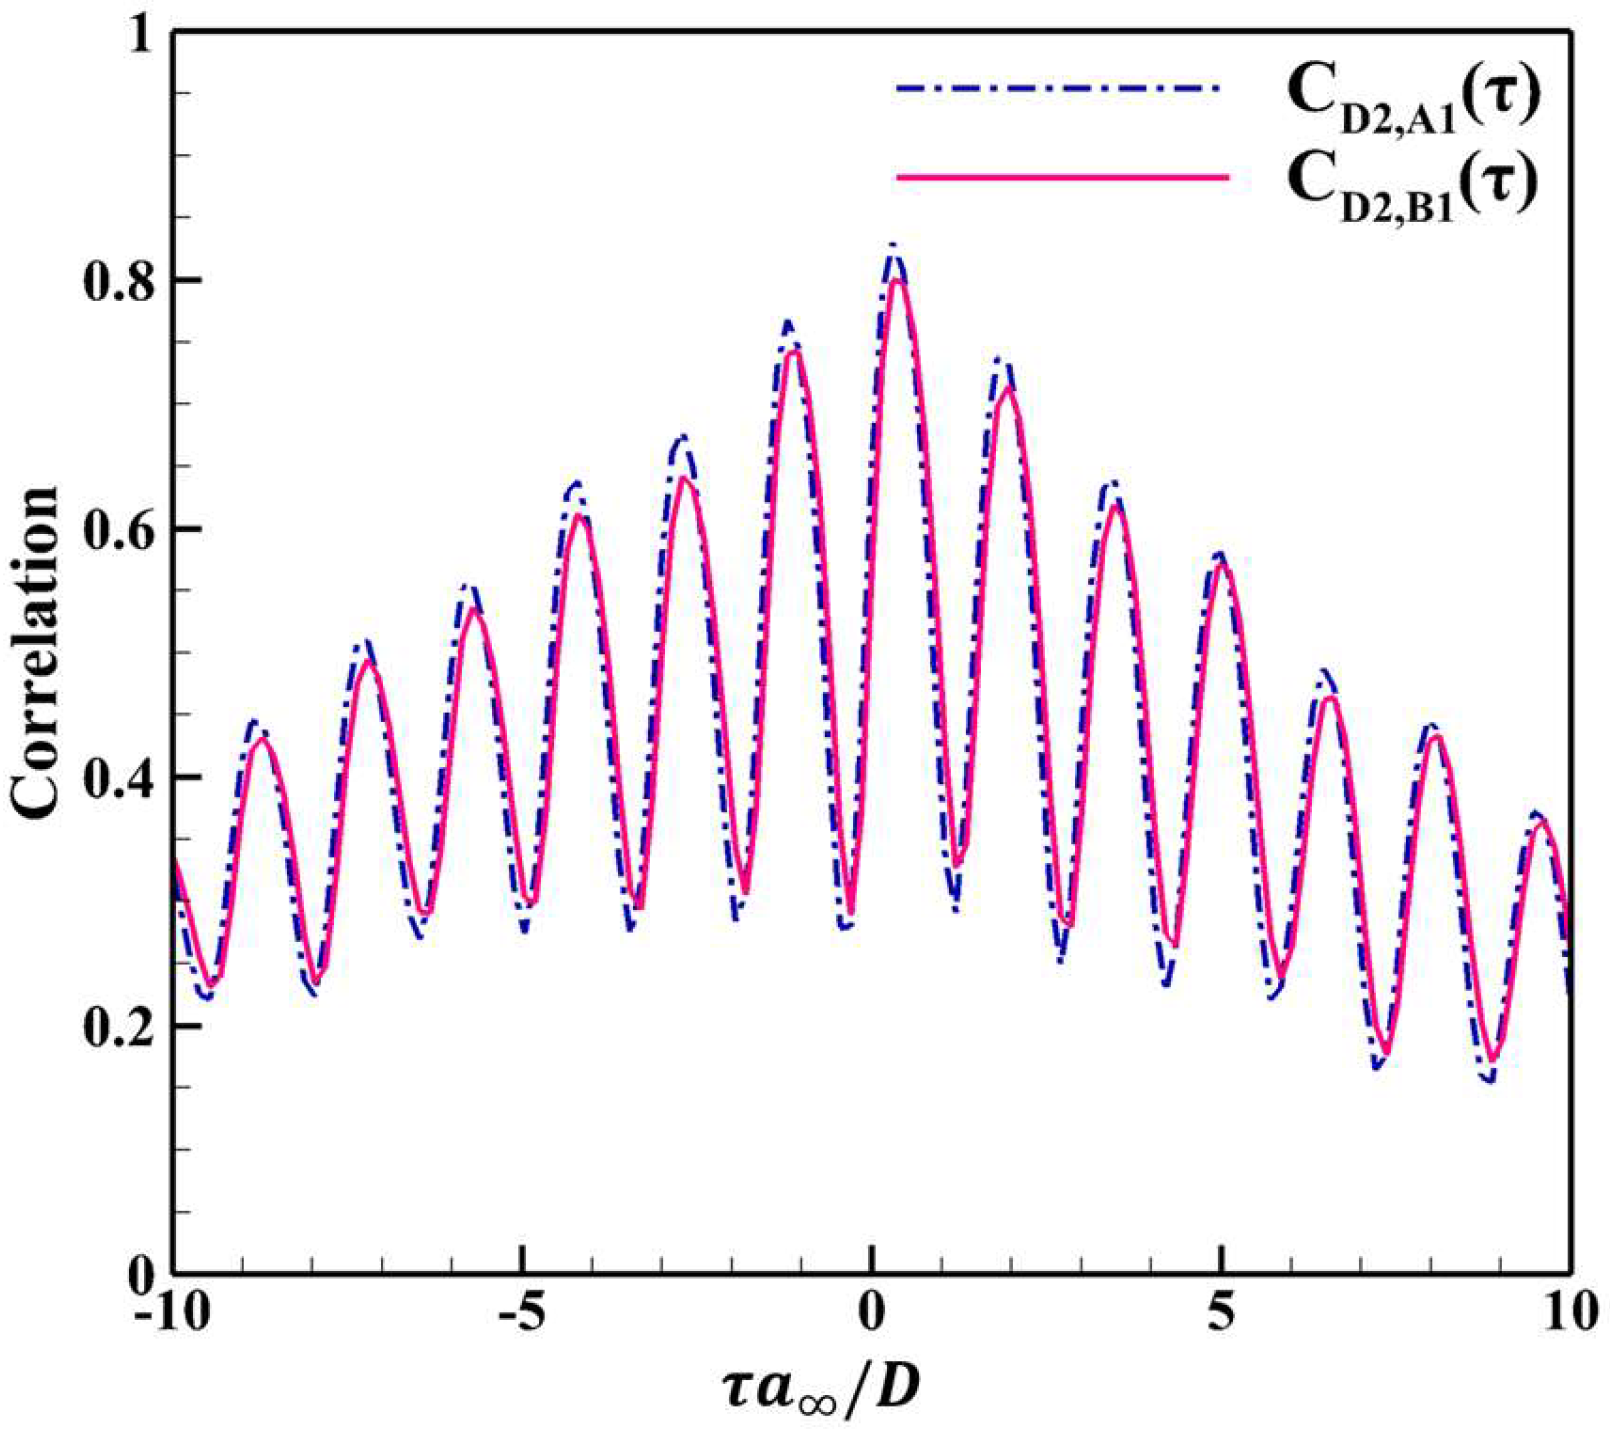
Cross-correlation analyses were subsequently conducted on point D2 located in the recirculation zone, point A1 located in the barrel shock and point B1 in the bow shock. The corresponding results are shown in Figure 18. The figures demonstrate a positive time delay between points D2 and B1, indicating a strong correlation between the large-scale oscillations of the bow shock and the pressure fluctuations in the recirculation zone. Similarly, a positive time delay is observed between points D2 and A1, suggesting that pressure disturbances propagate from the recirculation zone toward the barrel shock. Moreover, the oscillations in the recirculation zone further induce fluctuations in the jet boundary near the nozzle lip. Kawai et al. [35], utilizing large-Eddy simulation (LES) to analyze the mixing mechanisms of jets in supersonic crossflows, discovered that when the pressure within the recirculation zone increases, the expansion on the windward side of the nozzle diminishes to maintain pressure equilibrium at the jet boundary. Conversely, a decrease in pressure results in an increased expansion on the windward side. The oscillation of the jet boundary near the lip and the fluctuation of the bow shock may lead to instability in the windward shear layer, thereby generating large-scale vortex structures that propagate downstream. As these vortices develop downstream, their interaction with the barrel shock may produce two critical effects. On the one hand, the pressure fluctuations caused by the instability of the shear layer may affect the recirculation zone in the windward subsonic region. On the other hand, the interaction between these vortices and the barrel shock not only induces significant oscillations in the shock itself but also causes synchronous oscillations of the Mach disk, ultimately resulting in periodic vortex shedding downstream of the Mach disk.
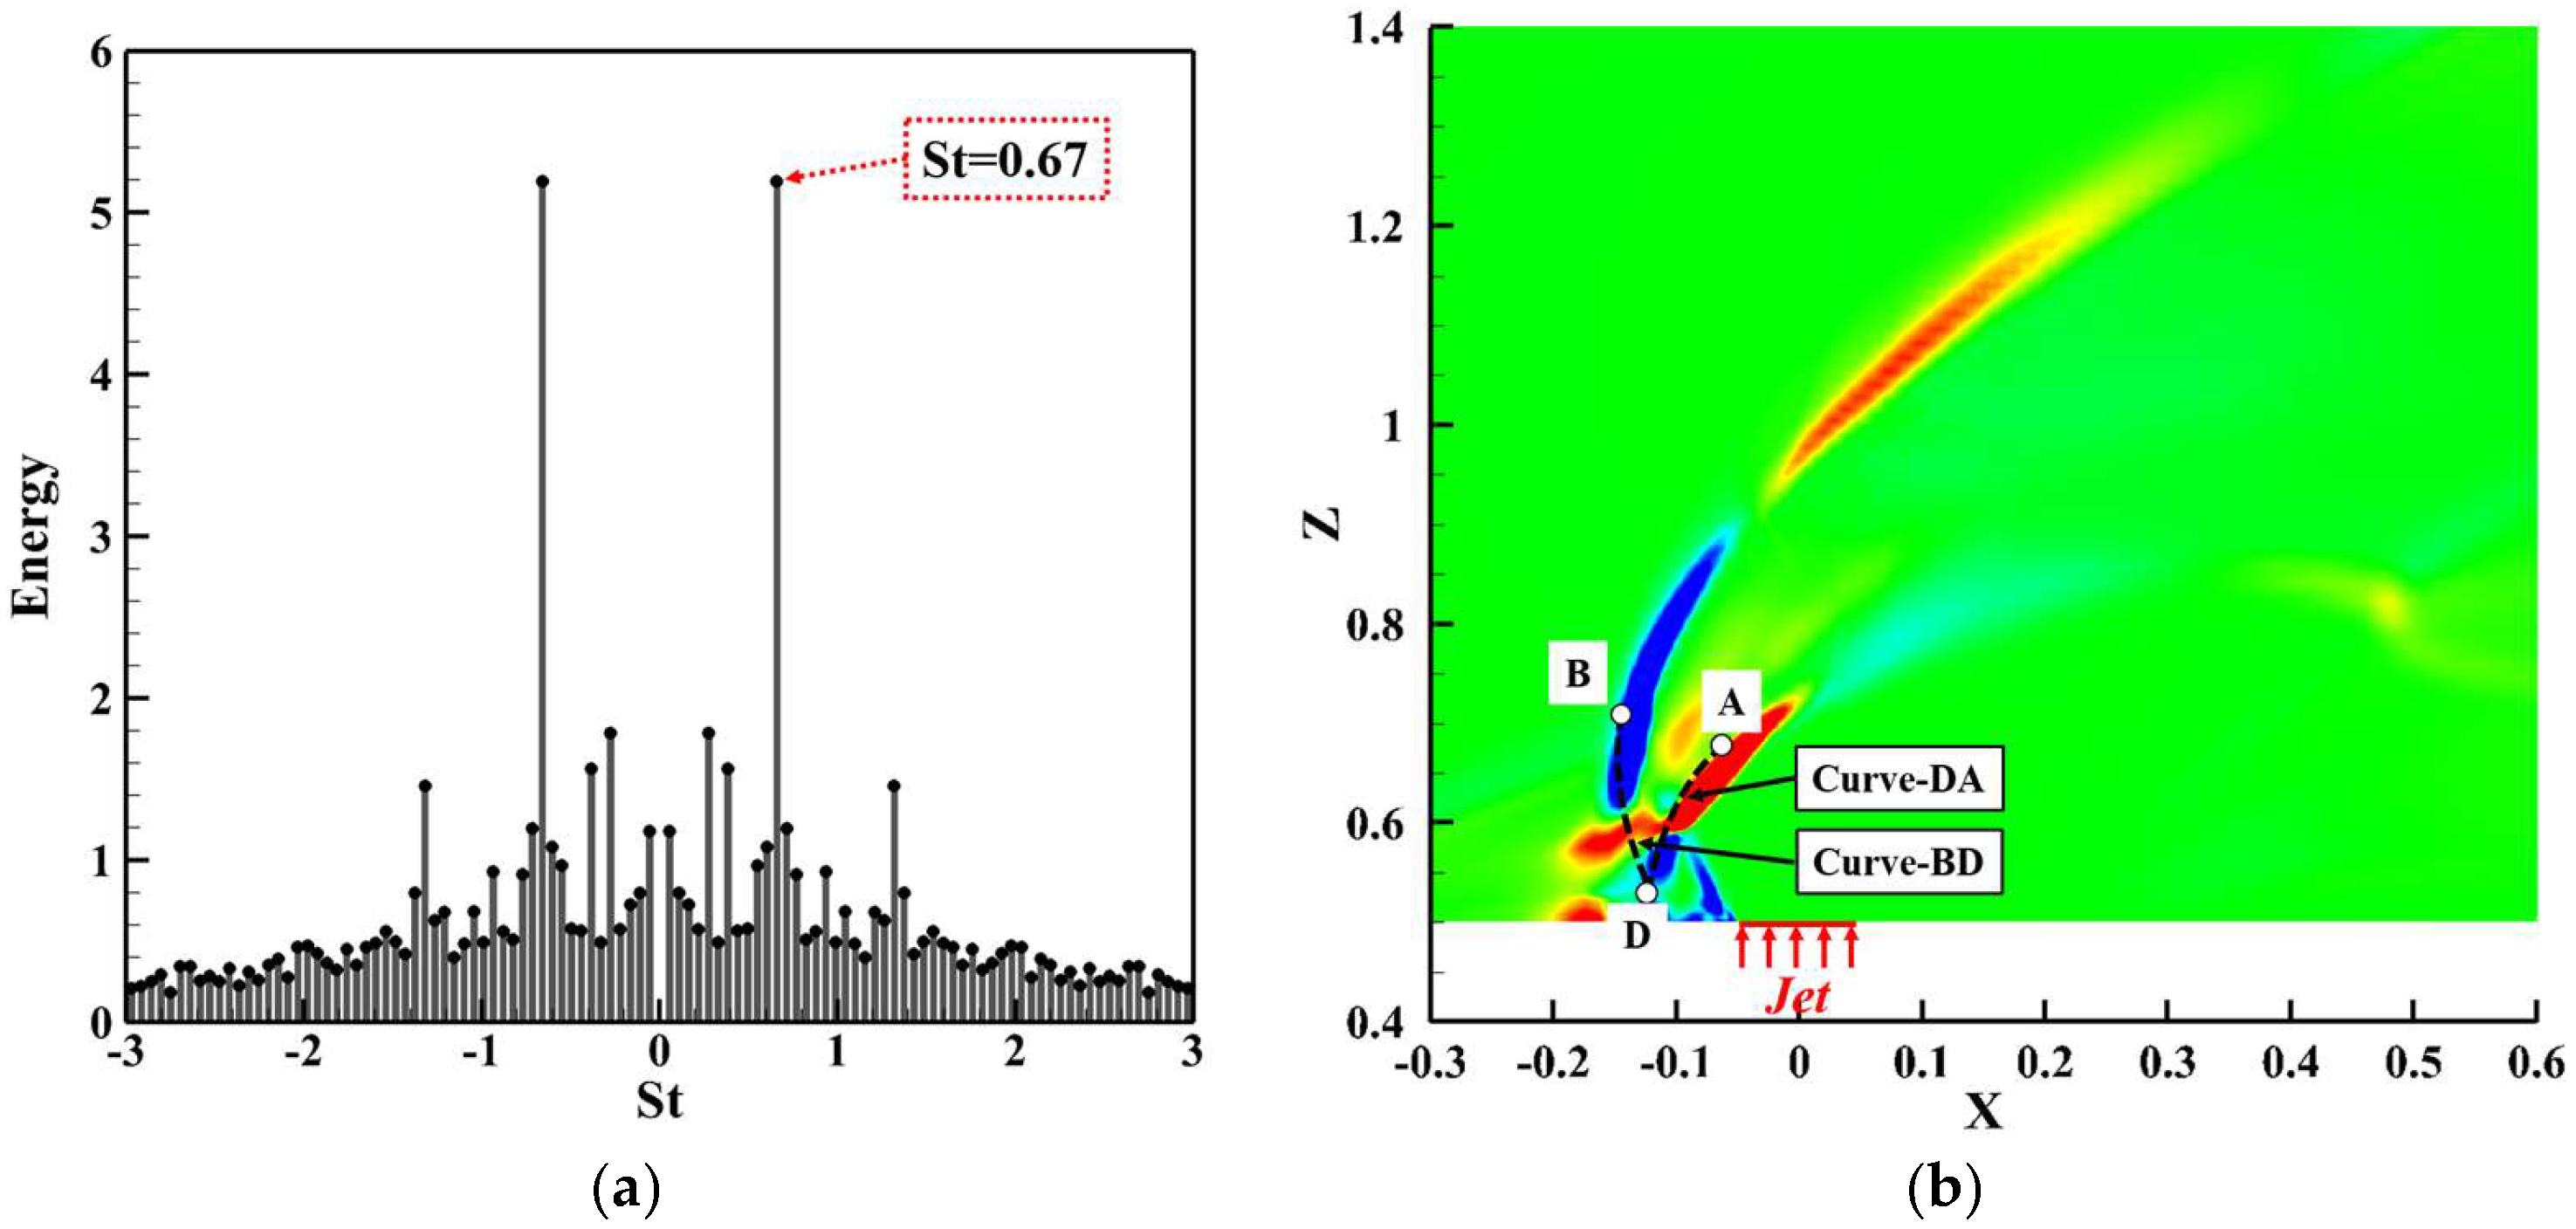
For a more in-depth analysis of the unsteady oscillatory characteristics of the flow, DMD analysis is employed, with the applicable algorithmic details referring to the literature [26]. DMD analysis affords insights into the dominant frequency information within the regions of interest and facilitates a profound comprehension of the spatial modal oscillation regions corresponding to each predominant frequency within the flow. Initially, the symmetry plane (y = 0) was selected as the spatial domain for modal analysis, utilizing 120 snapshots with a temporal interval of t = 0.05 D/ u . Figure 19a illustrates the variation in energy with the non-dimensional frequency St = fD/ u , revealing the presence of a dominant frequency St = 0.67 within the flow, indicative of a global oscillation. The eigenvalues obtained from the DMD analysis are inherently complex, with the real part denoting the growth rate of the mode and the imaginary part representing the modal angular frequency. Figure 19b presents the spatial distribution contour of the real part of the pressure field corresponding to the mode with St = 0.67. It is evident from the Figure 19b that the pressure variations of this mode are primarily concentrated in the shear layer on the windward side of the crossflow and the jet, extending from the barrel shock region on the windward side to the bow shock upstream of the jet, which is consistent with the contemplations in the previous section.
To investigate the spatiotemporal evolution of the dominant flow modes, we reconstructed the flow structures using the dominant mode and analyzed the pressure fluctuations along Curve-DA (recirculation zone to barrel shock) and Curve-BD (bow shock to recirculation zone) in Figure 19b. Two-point space–time cross-correlation analysis was performed using the fluctuating pressure data obtained along Curve-DA and Curve-BD. The reference points were positioned at the midpoints of the respective curves, with normalization applied using the curve lengths. The correlation results are presented in Figure 20, where the black curve indicates the maximum time delay coordinates at fixed x-coordinates. As shown in Figure 20a, negative time delays are observed from point D to the midpoint of curve Curve-DA, while positive time delays occur from the midpoint to point A. This indicates that disturbances propagate along the curve from point D toward point A—that is, from the recirculation zone toward the barrel shock region. Similarly, Figure 20b reveals positive time delays from point B to the midpoint of curve Curve-BD and negative time delays from the midpoint to point D, suggesting that disturbances propagate along the curve from point D toward point B, i.e., from the recirculation zone toward the bow shock region. These observations align with the conclusions drawn from the earlier correlation analysis, further validating the dominant mode’s governing role in the evolutionary characteristics of the original flow.

4.3. Mechanism of Oscillatory Motion

Through methods such as transient flowfield analysis and dynamic mode decomposition (DMD), the complex causes and core mechanism of oscillatory motion were revealed. The pressure pulsation in the recirculation zone serves as the initial disturbance source and propagates through two subsonic paths. One path is upward propagation to the root of the bow shock wave, which triggers periodic oscillation of the bow shock wave and forms a feedback loop. In this loop, pulsation in the recirculation zone induces oscillation of the bow shock wave, which further enhances flow separation and amplifies the initial pulsation. The other path is downward propagation to the barrel shock wave, which stimulates instability of the windward shear layer and generates large-scale vortices. This oscillation is not a single local instability but a global coupling mode dominated by the recirculation zone. The subsonic recirculation zone enables bidirectional propagation of pressure disturbances, which synchronizes the phase responses of both the bow and barrel shock waves to the oscillation of its pressure field. At the same time, continuous pulsation in the recirculation zone disturbs the windward shear layer. The dominant vortex shedding frequency of this shear layer aligns with the overall oscillation frequency, which in turn amplifies the Kelvin–Helmholtz instability within the layer. These interconnected dynamic processes collectively form the closed-loop feedback that maintains the oscillation. Specifically, pressure pulsation in the recirculation zone drives both vortex shedding in the shear layer and oscillation of the shock waves, and these two phenomena further reinforce the initial pulsation in the recirculation zone.
Based on the identified physical mechanism of oscillatory motion, we propose targeted strategies to suppress global oscillation, with plans to prioritize them in future work. To address the identified oscillatory feedback loop, active control strategies aim to dynamically interrupt its propagation. A key method uses plasma actuators to inject pulsed energy into the shear layer. By adding periodic energy at a frequency that does not match the global oscillation mode, this technique makes vortex shedding and shock oscillations out of phase. This misalignment breaks the coupling in the feedback loop, reducing sustained oscillations and their disruptive effect on the flowfield. While these strategies provide theoretical suppression pathways, they lack experimental validation. Given this study’s single-pressure-ratio focus, future work will expand the parametric scope and integrate experiments to refine them.

5. Results and Discussion

This study presents a multi-scale investigation of transverse jet evolution in supersonic crossflow utilizing the RSM-IDDES methodology. The comprehensive analysis of both time-averaged and unsteady-flow characteristics systematically reveals the coupled shock/vortex dynamics governing transverse jet interactions in high-speed vehicle configurations. The three principal findings are as follows:
  • The RSM-IDDES method accurately predicts time-averaged surface pressure while resolving pressure gradients across primary and secondary separation zones. The approach successfully captures the three-dimensional evolution of transient vortical structures, including counter-rotating vortex pairs and horseshoe vortices.
    Through systematic analysis of time-averaged flow, this study characterizes the multi-scale evolution of transverse jets, revealing three key phenomena: (1) near-field flow separation governed by the interacting barrel and bow shock systems; (2) boundary layer separation induced by the λ-shaped bow shock structure, creating localized surface high-pressure regions; and (3) three-dimensional development of counter-rotating vortex pair generated through shear layer roll-up in the jet wake.
  • Through transient flow characteristics analysis, this study reveals that supersonic transverse jets develop complex unsteady shock systems, whose interactions with recirculation zones and jet shear layers induce periodic large-scale flow oscillations. Dynamic mode decomposition (DMD) and spectral analysis further identify a dominant global oscillation frequency (St = 0.67), demonstrating that periodic pulsations in the recirculation zone trigger synchronized oscillations of both upstream bow shocks and barrel shocks.
In conclusion, this study provides essential time-averaged load data and characterizes unsteady-flow structures in high-speed vehicle flows, with spectral analysis revealing fundamental mechanisms underlying these complex flow phenomena.

6. Future Work

Future work on transverse jet flows will focus on advancing mechanistic understanding, improving prediction reliability and expanding practical applications. First, we will further investigate the characteristics and evolution of three-dimensional asymmetric flows while systematically examining how key parameters—including total pressure ratio and Reynolds number—influence jet penetration, shock structures and aerodynamic performance. This effort aims to refine the physical understanding of transverse jet behavior.
Next, a comprehensive uncertainty analysis will be conducted to quantify the effects of numerical discretization errors on simulation results, thereby increasing prediction credibility. Concurrently, to address flow control needs, we will explore active and passive strategies for regulating transverse jet flows, with the goal of optimizing control efficiency and stability. Finally, machine-learning algorithms will be employed to develop fast prediction models for transverse jet characteristics, providing theoretical and technical support for transverse jet applications under complex conditions.

Author Contributions

Conceptualization, Z.-K.L. and G.W.; methodology, Z.-K.L. and Y.-L.L.; software, G.W. and T.-Y.L.; validation, Y.-L.L.; formal analysis, Z.-K.L.; investigation, Z.-K.L.; resources, G.W.; data curation, Z.-K.L.; writing—original draft preparation, Z.-K.L.; writing—review and editing, G.W.; visualization, Y.-L.L.; supervision, G.W.; project administration, Z.-K.L.; funding acquisition, G.W. All authors have read and agreed to the published version of the manuscript.

Funding

This research was funded by the National Natural Science Foundation of China (No. U2141254 and No. U23B6009).

Institutional Review Board Statement

Not applicable.

Informed Consent Statement

Not applicable.

Data Availability Statement

The data supporting the findings of this study are available in this paper.

Acknowledgments

The computations were conducted in the Computing Center in Xi’an. The authors thankfully acknowledge these institutions.

Conflicts of Interest

The authors declare no conflicts of interest.

Abbreviations

The following abbreviations are used in this manuscript:
CFDComputational Fluid Dynamics
DDESDelayed Detached Eddy Simulation
DESDetached Eddy Simulation
LU-SGSLower–Upper Symmetric Gauss–Seidel
IDDESImproved Delayed Detached Eddy Simulation
DNSDirect Numerical Simulation
LESLarge Eddy Simulation
RSMReynolds Stress Model
DMDDynamic Mode Decomposition
RANSReynolds-Averaged Navier–Stokes
StStrouhal Number
CVPCounter-Rotating Vortex Pair

References

  1. Lai, J.; Zhao, Z.; Wang, X.; Li, H.; Li, Q. Numerical investigation of pitch motion induced unsteady effects on transverse jet interaction. Aerosp. Sci. Technol. 2020, 105, 106005. [Google Scholar] [CrossRef]
  2. Zhang, L.; Yang, J.; Duan, T.; Wang, J.; Li, X.; Zhang, K. Numerical and experimental investigation on nosebleed air jet control for hypersonic vehicle. Aerospace 2023, 10, 552. [Google Scholar] [CrossRef]
  3. Qiao, C.L.; Xu, H.Y.; Li, J.; Hu, H.-D. Parametric study on the sonic transverse jet in supersonic crossflow and analysis of the jet-crossflow interaction instability. Aerosp. Sci. Technol. 2022, 123, 107472. [Google Scholar] [CrossRef]
  4. Meng, Y.-S.; Wang, Z.-W.; Shen, Y.; Huang, W.; Niu, Y.-B.; Yan, L. Drag and heat reduction mechanism induced by jet interaction over a reusable launch vehicle in hypersonic flows. Acta Astronaut. 2022, 198, 502–520. [Google Scholar] [CrossRef]
  5. Gnemmi, P.; Schäfer, H. Experimental and numerical investigations of a transverse jet interaction on a missile body. In Proceedings of the 43rd AIAA Aerospace Sciences Meeting and Exhibit, Reno, NV, USA, 10–13 January 2005; Volume 52, pp. 1–15. [Google Scholar]
  6. Gülhan, A.; Schütte, G.; Stahl, B. Experimental study on aerothermal heating caused by jet-hypersonic crossflow interaction. J. Spacecr. Rockets. 2008, 45, 891–899. [Google Scholar] [CrossRef]
  7. Mani, M.; Dorgan, A.J. A perspective on the state of aerospace computational fluid dynamics technology. Annu. Rev. Fluid Mech. 2023, 55, 431–457. [Google Scholar] [CrossRef]
  8. Xiao, Y.; Zhang, H.; Chen, Z.; Zhang, H.; Zheng, C. Numerical investigation on the transverse jet into a supersonic crossflow with different pressure ratios. Eng. Appl. Comput. Fluid Mech. 2024, 18, 2354760. [Google Scholar] [CrossRef]
  9. Zhang, H.; Xiao, Y.; He, K.; Lyu, K.; Chen, Z.; Zheng, C. The 3D flow characteristics of a sonic transverse jet in laminar supersonic crossflow. Aerosp. Sci. Technol. 2025, 167, 110661. [Google Scholar] [CrossRef]
  10. Huh, J.; Lee, S. Numerical study on lateral jet interaction in supersonic crossflows. Aerosp. Sci. Technol. 2018, 80, 315–328. [Google Scholar] [CrossRef]
  11. Xu, C.Y.; Zhang, T.; Yu, Y.Y.; Sun, J.-H. Effect of von Karman length scale in scale adaptive simulation approach on the prediction of supersonic turbulent flow. Aerosp. Sci. Technol. 2019, 86, 630–639. [Google Scholar] [CrossRef]
  12. Liu, Y.; Zhou, Z.; Zhu, L.; Wang, S. Numerical investigation of flows around an axisymmetric body of revolution by using Reynolds-stress model based hybrid Reynolds-averaged Navier–Stokes/large eddy simulation. Phys. Fluids 2021, 33, 085115. [Google Scholar] [CrossRef]
  13. Bouchard, M.; Marty, J.; Deck, S.; Costes, M. Numerical investigation of self-sustained oscillations of stall cells around a leading edge-separating airfoil. Phys. Fluids 2022, 34, 115153. [Google Scholar] [CrossRef]
  14. Li, Q.; Sun, X.; Wang, G. Detached-eddy simulation of the vortex system on the high-lift common research model. Phys. Fluids 2024, 36, 025173. [Google Scholar] [CrossRef]
  15. Dong, Q.L.; Xu, H.Y.; Ye, Z.Y. Numerical investigation of unsteady flow past rudimentary landing gear using DDES, LES and URANS. Eng. Appl. Comput. Fluid Mech. 2018, 12, 689–710. [Google Scholar] [CrossRef]
  16. Wang, G.; Li, Q.; Sun, X. Resolution assessment of Reynolds stress model-based DES methods for high-lift device flow over 30P30N configuration. Aerosp. Sci. Technol. 2024, 145, 108863. [Google Scholar] [CrossRef]
  17. Spalart, P.R. Detached-eddy simulation. Annu. Rev. Fluid Mech. 2009, 41, 181–202. [Google Scholar] [CrossRef]
  18. Li, Q.; Chen, X.; Wang, G.; Liu, Y. A dynamic version of the improved delayed detached-eddy simulation based on the differential Reynolds-stress model. Phys. Fluids 2022, 34, 115112. [Google Scholar] [CrossRef]
  19. Wang, G.; Li, Q.; Liu, Y. IDDES method based on differential Reynolds-stress model and its application in bluff body turbulent flows. Aerosp. Sci. Technol. 2021, 119, 107207. [Google Scholar] [CrossRef]
  20. Gao, Y.; Zhang, C.; Huang, J.; Tong, Y.; Lin, Z. Characteristics of transverse liquid jets at different preheated temperatures in supersonic crossflow. Appl. Therm. Eng. 2025, 279, 127631. [Google Scholar] [CrossRef]
  21. Yang, Y.; Wang, H.; Sun, M.; Wang, Z.; Wang, Y. Numerical investigation of transverse jet in supersonic crossflow using a high-order nonlinear filter scheme. Acta Astronaut. 2019, 154, 74–81. [Google Scholar] [CrossRef]
  22. Smith, B.R.; Yagle, P. Computational Simulation of Jet in Crossflow with RANS and Hybrid RANS/LES Methods. In Proceedings of the AIAA Scitech 2023 Forum, National Harbor, MD, USA, 23–27 January 2023; Volume 1230, pp. 1–18. [Google Scholar]
  23. Schmid, P.J. Dynamic mode decomposition and its variants. Annu. Rev. Fluid Mech. 2022, 54, 225–254. [Google Scholar] [CrossRef]
  24. Rowley, C.W.; Mezić, I.; Bagheri, S.; Schlatter, P.; Henningson, D.S. Spectral analysis of nonlinear flows. J. Fluid Mech. 2009, 641, 115–127. [Google Scholar] [CrossRef]
  25. Iyer, P.S.; Mahesh, K. A numerical study of shear layer characteristics of low-speed transverse jet. J. Fluid Mech. 2016, 790, 275–307. [Google Scholar] [CrossRef]
  26. Kou, J.; Zhang, W. Dynamic mode decomposition with exogenous input for data-driven modeling of unsteady flows. Phys. Fluids. 2019, 31, 057106. [Google Scholar] [CrossRef]
  27. Pokharel, P.; Acharya, S. Dynamics of circular and rectangular jet in crossflow. Comput. Fluids 2021, 230, 105111. [Google Scholar] [CrossRef]
  28. Ma, B.; Wang, G.; Ren, J.; Ye, Z.; Lei, Z.; Zha, G. Near-field sonic-boom prediction and analysis with hybrid grid navier–stokes solver. J. Aircr. 2018, 55, 1890–1904. [Google Scholar] [CrossRef]
  29. Zhou, H.; Wang, G.; Mian, H.H.; Qin, M. Fluid-structure coupled analysis of tandem 2D elastic panels. Aerosp. Sci. Technol. 2021, 111, 106521. [Google Scholar] [CrossRef]
  30. Wang, G.; Chen, X.; Xing, Y.; Zeng, Z. Multi-body separation simulation with an improved general mesh deformation method. Aerosp. Sci. Technol. 2017, 71, 763–771. [Google Scholar] [CrossRef]
  31. Cécora, R.-D.; Radespiel, R.; Eisfeld, B.; Probst, A. Differential Reynolds-stress modeling for aeronautics. AIAA J. 2015, 53, 739–755. [Google Scholar] [CrossRef]
  32. Choi, H.; Moin, P. Grid-point requirements for large eddy simulation: Chapman’s estimates revisited. Phys. Fluids 2012, 24, 011702. [Google Scholar] [CrossRef]
  33. Muppidi, S.; Mahesh, K. Direct numerical simulation of passive scalar transport in transverse jet. J. Fluid Mech. 2008, 598, 335–360. [Google Scholar] [CrossRef]
  34. Hunt, J.C.R.; Wray, A.A.; Moin, P. Eddies, streams, and convergence zones in turbulent flows. In Studying Turbulence Using Numerical Simulation Databases, 2, Proceedings of the 1988 Summer Program, Seoul, Republic of Korea, 17 September–2 October 1988; Ames Research Center: Moffett Field, CA, USA, 1988. [Google Scholar]
  35. Kawai, S.; Lele, S. Mechanisms of jet mixing in a supersonic crossflow: A study using large-eddy simulation. In Proceedings of the 44th AIAA/ASME/SAE/ASEE Joint Propulsion Conference & Exhibit, Hartford, CT, USA, 21–23 July 2008; Volume 4575, pp. 1–16. [Google Scholar]
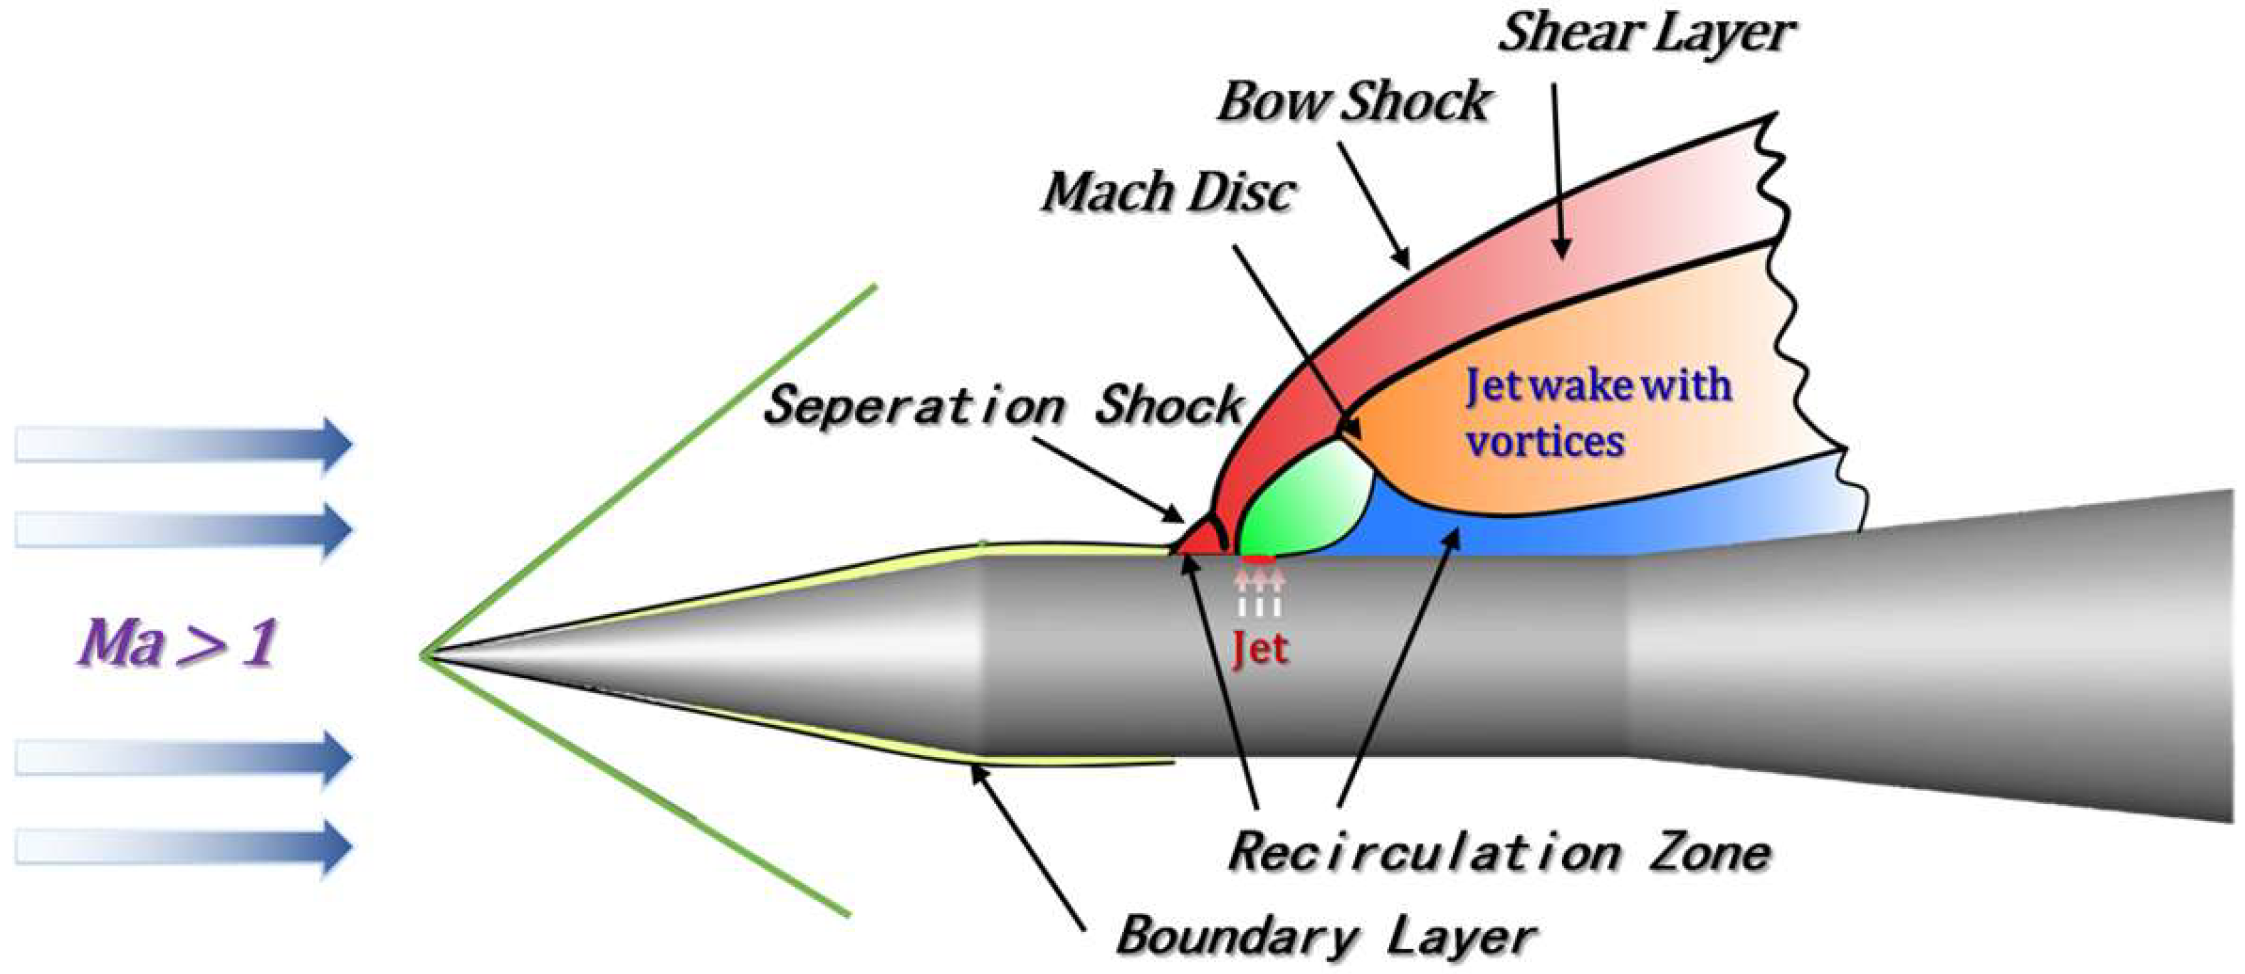
Figure 1. Schematic of transverse jet interaction with a supersonic flowfield.
Fluids 10 00229 g001
Figure 2. Schematic of the model and nozzle location.
Fluids 10 00229 g002
Figure 3. Source area for the computational domain.
Fluids 10 00229 g003
Figure 4. Computational mesh and boundary conditions: (a) Global viewpoint; (b) Refinement region near the body; (c) Cross-section of the body.
Fluids 10 00229 g004
Figure 5. Detailed distribution of the surface grid: (a) Refinement region near the nose; (b) Global viewpoint; (c) Refinement region near the nozzle.
Fluids 10 00229 g005
Figure 6. Grid independence study for the high-speed vehicle.
Fluids 10 00229 g006
Figure 7. Contours of the convective CFL number at φ = 180°.
Fluids 10 00229 g007
Figure 8. Time histories of the lift coefficient.
Fluids 10 00229 g008
Figure 9. Pressure distribution at φ = 180°.
Fluids 10 00229 g009
Figure 10. Comparison results of Schlieren images for validation [6].
Fluids 10 00229 g010
Figure 11. Mean flow for a transverse jet interacting with supersonic crossflow (a) Global viewpoint; (b) Refinement region near the nozzle.
Fluids 10 00229 g011
Figure 12. Isocontours of (a) Shear-dominated structures (Q = −70); (b) Vorticity-dominated structures (Q = 10).
Fluids 10 00229 g012
Figure 13. Distributions of the turbulent kinetic energy.
Fluids 10 00229 g013
Figure 14. The distribution of velocity divergence · V at four planes.
Fluids 10 00229 g014
Figure 15. Contours of ω x at four planes. (a) X/D = 0; (b) X/D = 0.5; (c) X/D = 1.0; (d) X/D = 1.5.
Fluids 10 00229 g015
Figure 16. Instantaneous spanwise vorticity ( ω y ) and Mach number contours at (a) t = 15.0 D/ u , (b) t = 15.75 D/ u , (c) t = 16.5 D/ u and (d) t = 17.25 D/ u .
Fluids 10 00229 g016aFluids 10 00229 g016b
Figure 17. Temporal spectra taken at various locations in the flowfield. (a) Mach number contours; (b) Power spectral density in Region A; (c) Power spectral density in Region B; (d) Power spectral density in Region C; (e) Power spectral density in Region D.
Fluids 10 00229 g017aFluids 10 00229 g017b
Figure 18. Cross-correlation of the pressure waves at various points.
Fluids 10 00229 g018
Figure 19. (a) Energy variation with Strouhal number and (b) spatial distributions of the dominant frequencies at St = 0.67.
Fluids 10 00229 g019
Figure 20. The space–time cross-correlations of pressure fluctuations along (a) Curve-DA and (b) Curve-BD.
Fluids 10 00229 g020
Disclaimer/Publisher’s Note: The statements, opinions and data contained in all publications are solely those of the individual author(s) and contributor(s) and not of MDPI and/or the editor(s). MDPI and/or the editor(s) disclaim responsibility for any injury to people or property resulting from any ideas, methods, instructions or products referred to in the content.