1. Introduction
A comprehensive understanding of fluid behavior under various stress conditions is highly important as medical devices increasingly rely on fluid dynamics for operation. Shear stress acts parallel to a surface, in contrast to extensional stress, which refers to the longitudinal stretching of fluid along a specific axis. This type of stress is crucial in areas where fluids experience rapid changes in velocity and direction, leading to the deformation of suspended particles and biological cells. It is essential to recognize the critical role of extensional stress in clarifying the mechanical forces acting on biological systems and medical devices [
1]. Extensional stress has been proven to considerably impact the performance and safety of devices employed in medical applications such as blood circulation and drug delivery [
2,
3,
4].
Computational fluid dynamics (CFD) is a commonly used methodology to improve and examine medical devices such as ventricular assist devices [
5,
6], prosthetic heart valves [
7,
8], filters [
9,
10,
11], and stents [
12,
13,
14]. It is also very useful when simulating fluid flow and determining the stresses that occur in medical devices. Complex interactions between blood and device surfaces can be modeled by using CFD, which helps to understand the flow characteristics, such as stress distributions and velocity profiles. Using CFD is especially useful to determine the effect of extensional stresses on hemolysis, an important consideration for patients’ health, in blood-contacting devices [
15,
16]. The Food and Drug Administration (FDA) started several benchmark studies to standardize and evaluate CFD methodologies, which are important for predicting fluid behavior in these devices [
17,
18].
The United States (US) Food and Drug Administration (FDA) introduced the “Critical Path Initiative” program to establish a robust and standardized CFD methodology for biomedical applications [
19]. Therefore, a nozzle benchmark was introduced, which shows flow behaviors similar to those in medical devices, such as expanding, recirculating, and contracting characteristics. The first interlaboratory study of the FDA included 28 independent groups of researchers who accomplished a set of simulations using Reynolds-averaged Navier–Stokes (RANS) models to determine the efficiency and limitations of turbulence models in the examination of flow characteristics for the FDA nozzle case [
20].
Several CFD studies have focused on the FDA nozzle to examine flow characteristics, turbulence effects, and hemolysis predictions. As a part of an FDA-sponsored project, Hariharan et al. [
21] evaluated the use and limitations of CFD in assessing blood flow parameters related to medical device safety. Abad et al. [
22] applied direct numerical simulations (DNSs) to simulate the FDA nozzle at Reynolds numbers based on the throat diameter Ret = 500, 2000, 3500, and 5000, using the spectral-element code Nek5000. Axial velocity in the nozzle after sudden expansion region was analyzed in the work of Onah et al. [
23]. A lattice Boltzmann method (LBM) was employed to simulate the FDA nozzle benchmark for transitional cases of Reynolds numbers 2000 and 3500 [
24]. Multilaboratory in vitro blood damage testing was performed on the FDA nozzle to determine the effect of different flow parameters and blood properties on device-induced hemolysis in the work of Herbertson et al. [
15].
Thus, five different experimental conditions for two different nozzle configurations with throat Reynolds numbers in the range of 500–6500, including laminar, transitional, and turbulent flow conditions, were analyzed. Moreover, particle image velocimetry (PIV) measurements from three laboratories [
21] were used to compare hemolysis predictions using commonly accepted power-law models when extensional stress was applied.
This study examines the extensional stresses within the FDA nozzle configurations at varying flow velocities and characteristics. Although hemolysis prediction has been widely addressed via shear-based criteria, extensional stress contributions remain underexplored in FDA benchmark geometries. This study uniquely quantifies centerline and spatially resolved extensional stress distributions and correlates them with hemolysis risk via empirical modeling.
2. Materials and Methods
2.1. Three-Dimensional Model and Computational Mesh
The modelled geometry is the FDA nozzle, which is frequently utilized in biomedical research both experimentally and numerically [
20,
21,
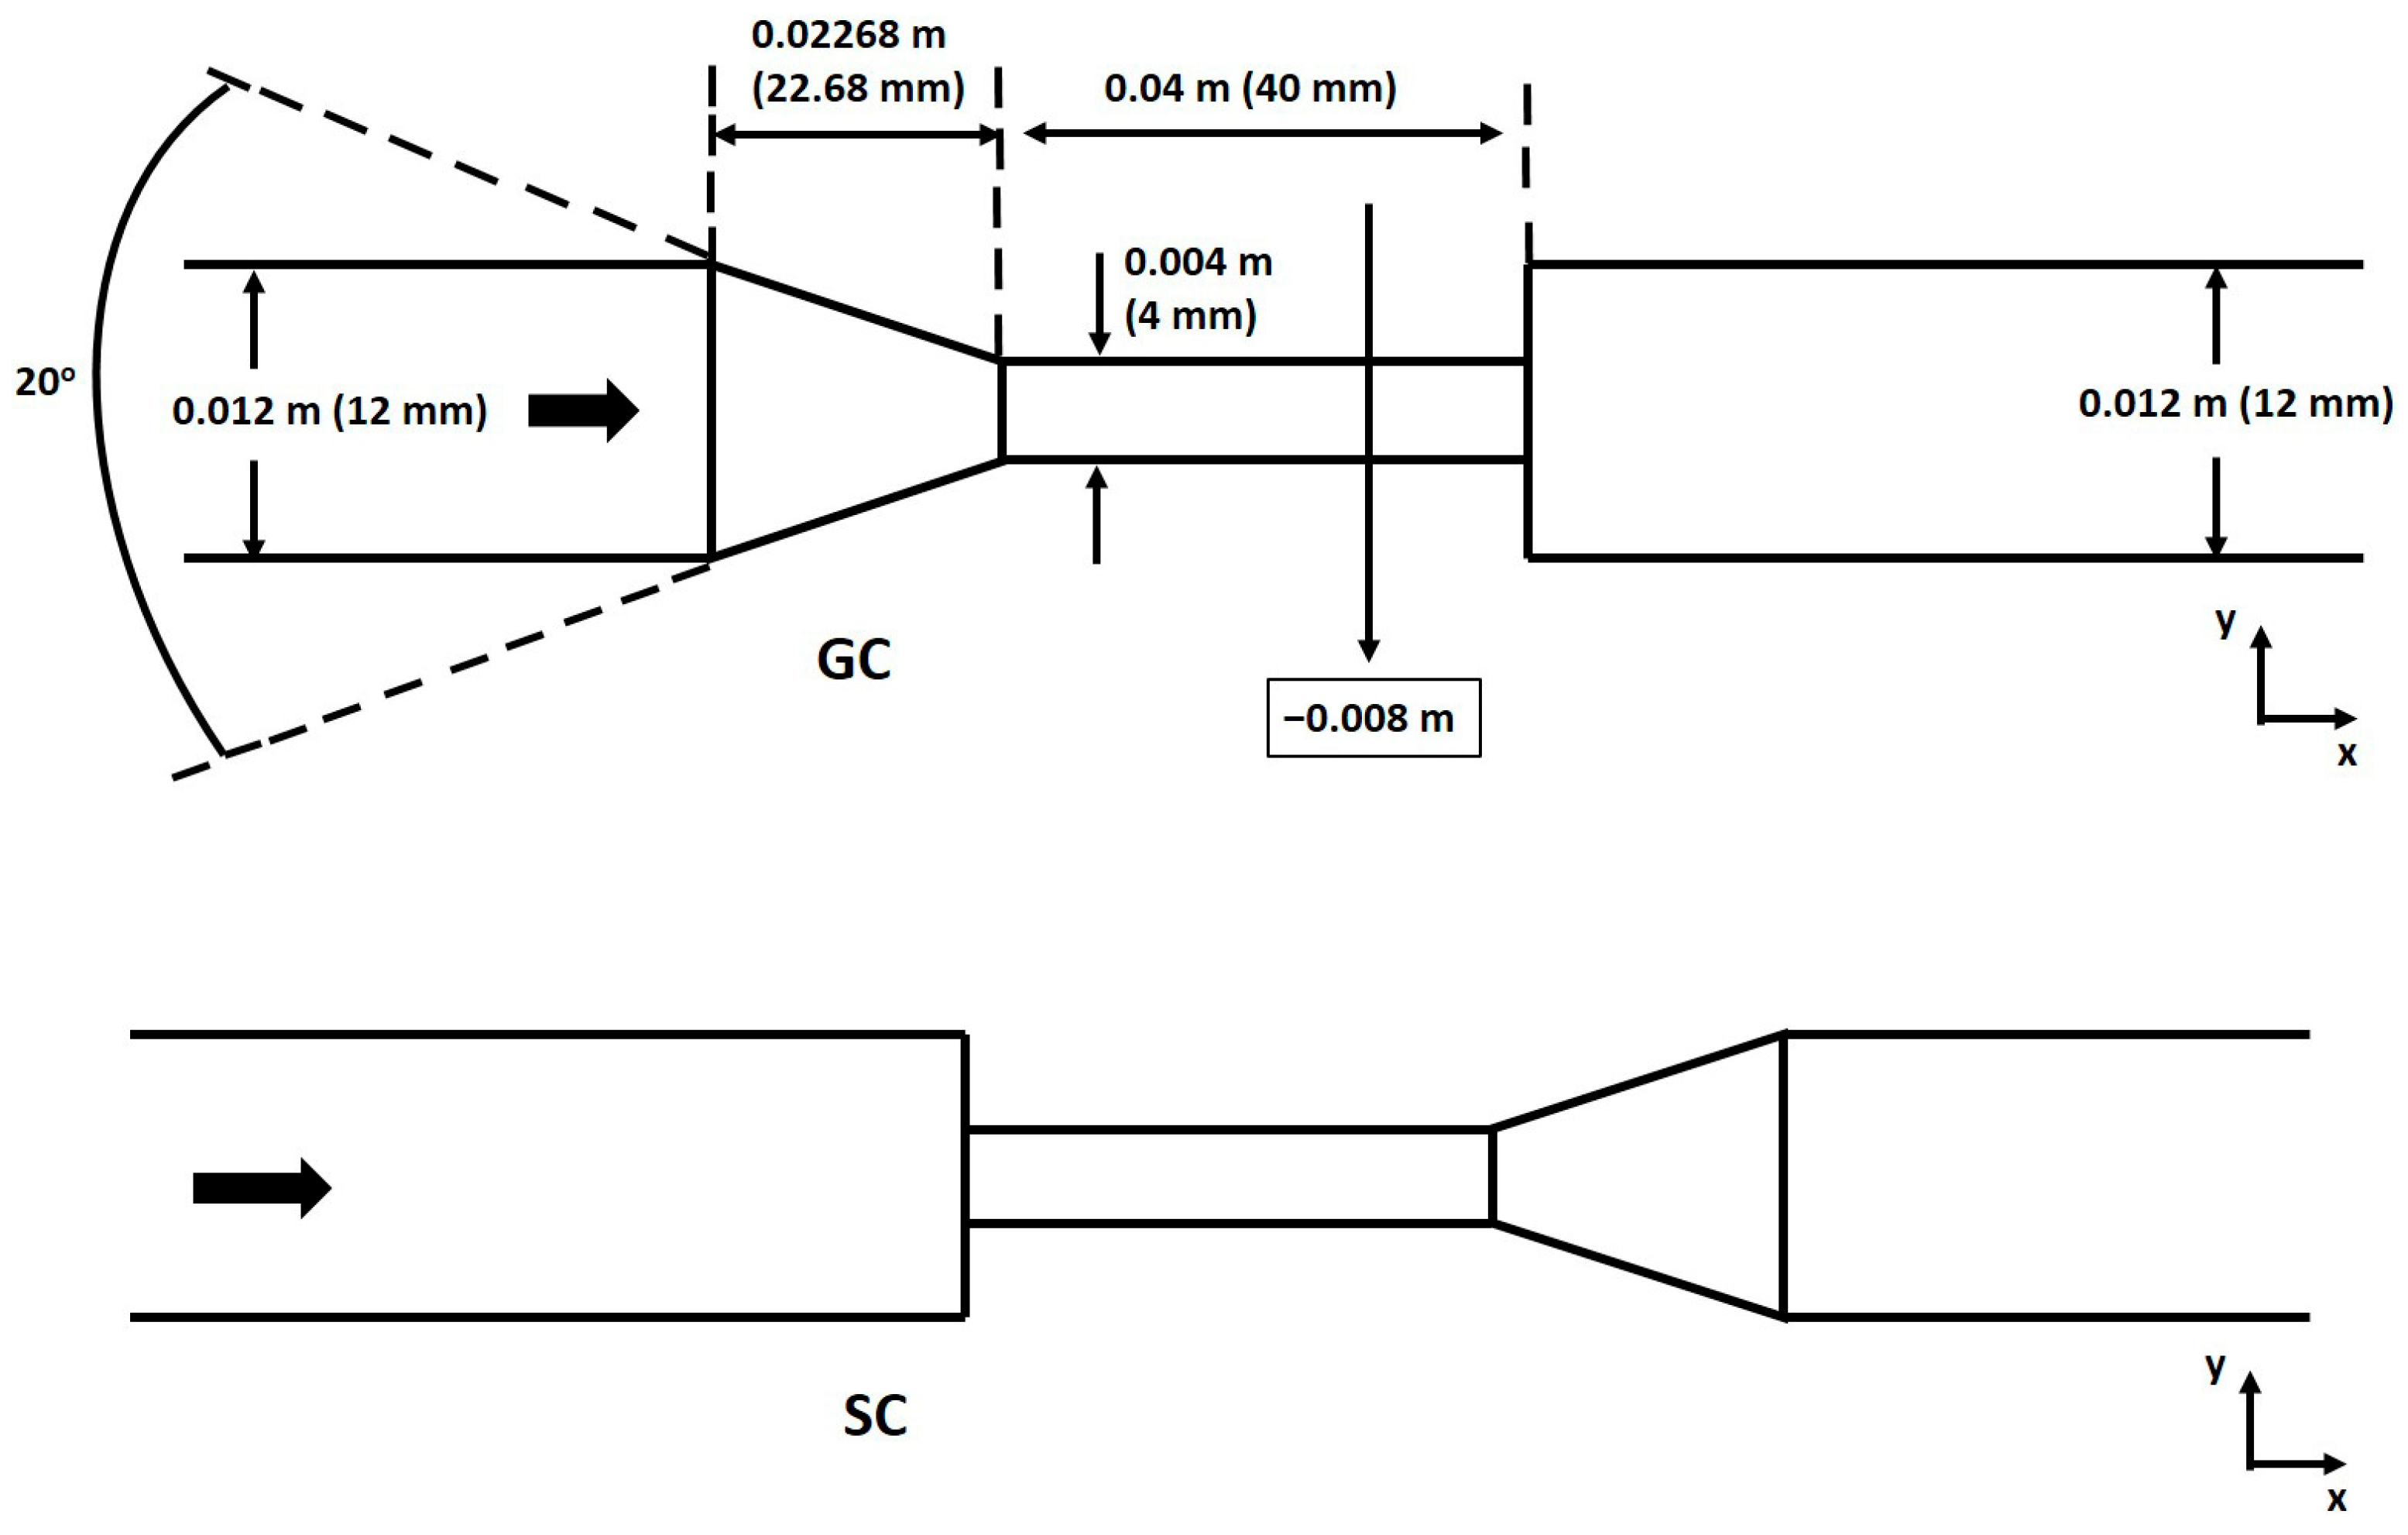
25]. The effect of different flow conditions on extensional stresses is analyzed for two different nozzle models, which are named depending on the flow direction as the gradual cone (GC) and the sudden contraction (SC). The nozzle geometries are created as 3D models using Ansys Fluent 18.2 and its preprocessing software ICEM CFD 18.2 (
Figure 1).
The dimensions of the nozzle include inlet and outlet zones of identical diameters (12 mm) and lengths of 1200 mm (100 D) in both configurations, ensuring that the entrance and exit effects are not significant. Between the inlet and outlet pipes, the GC configuration has a conical section providing a gradual transition to a 4 mm diameter throat section, and the SC composition has a sudden transition to the 4 mm throat section.
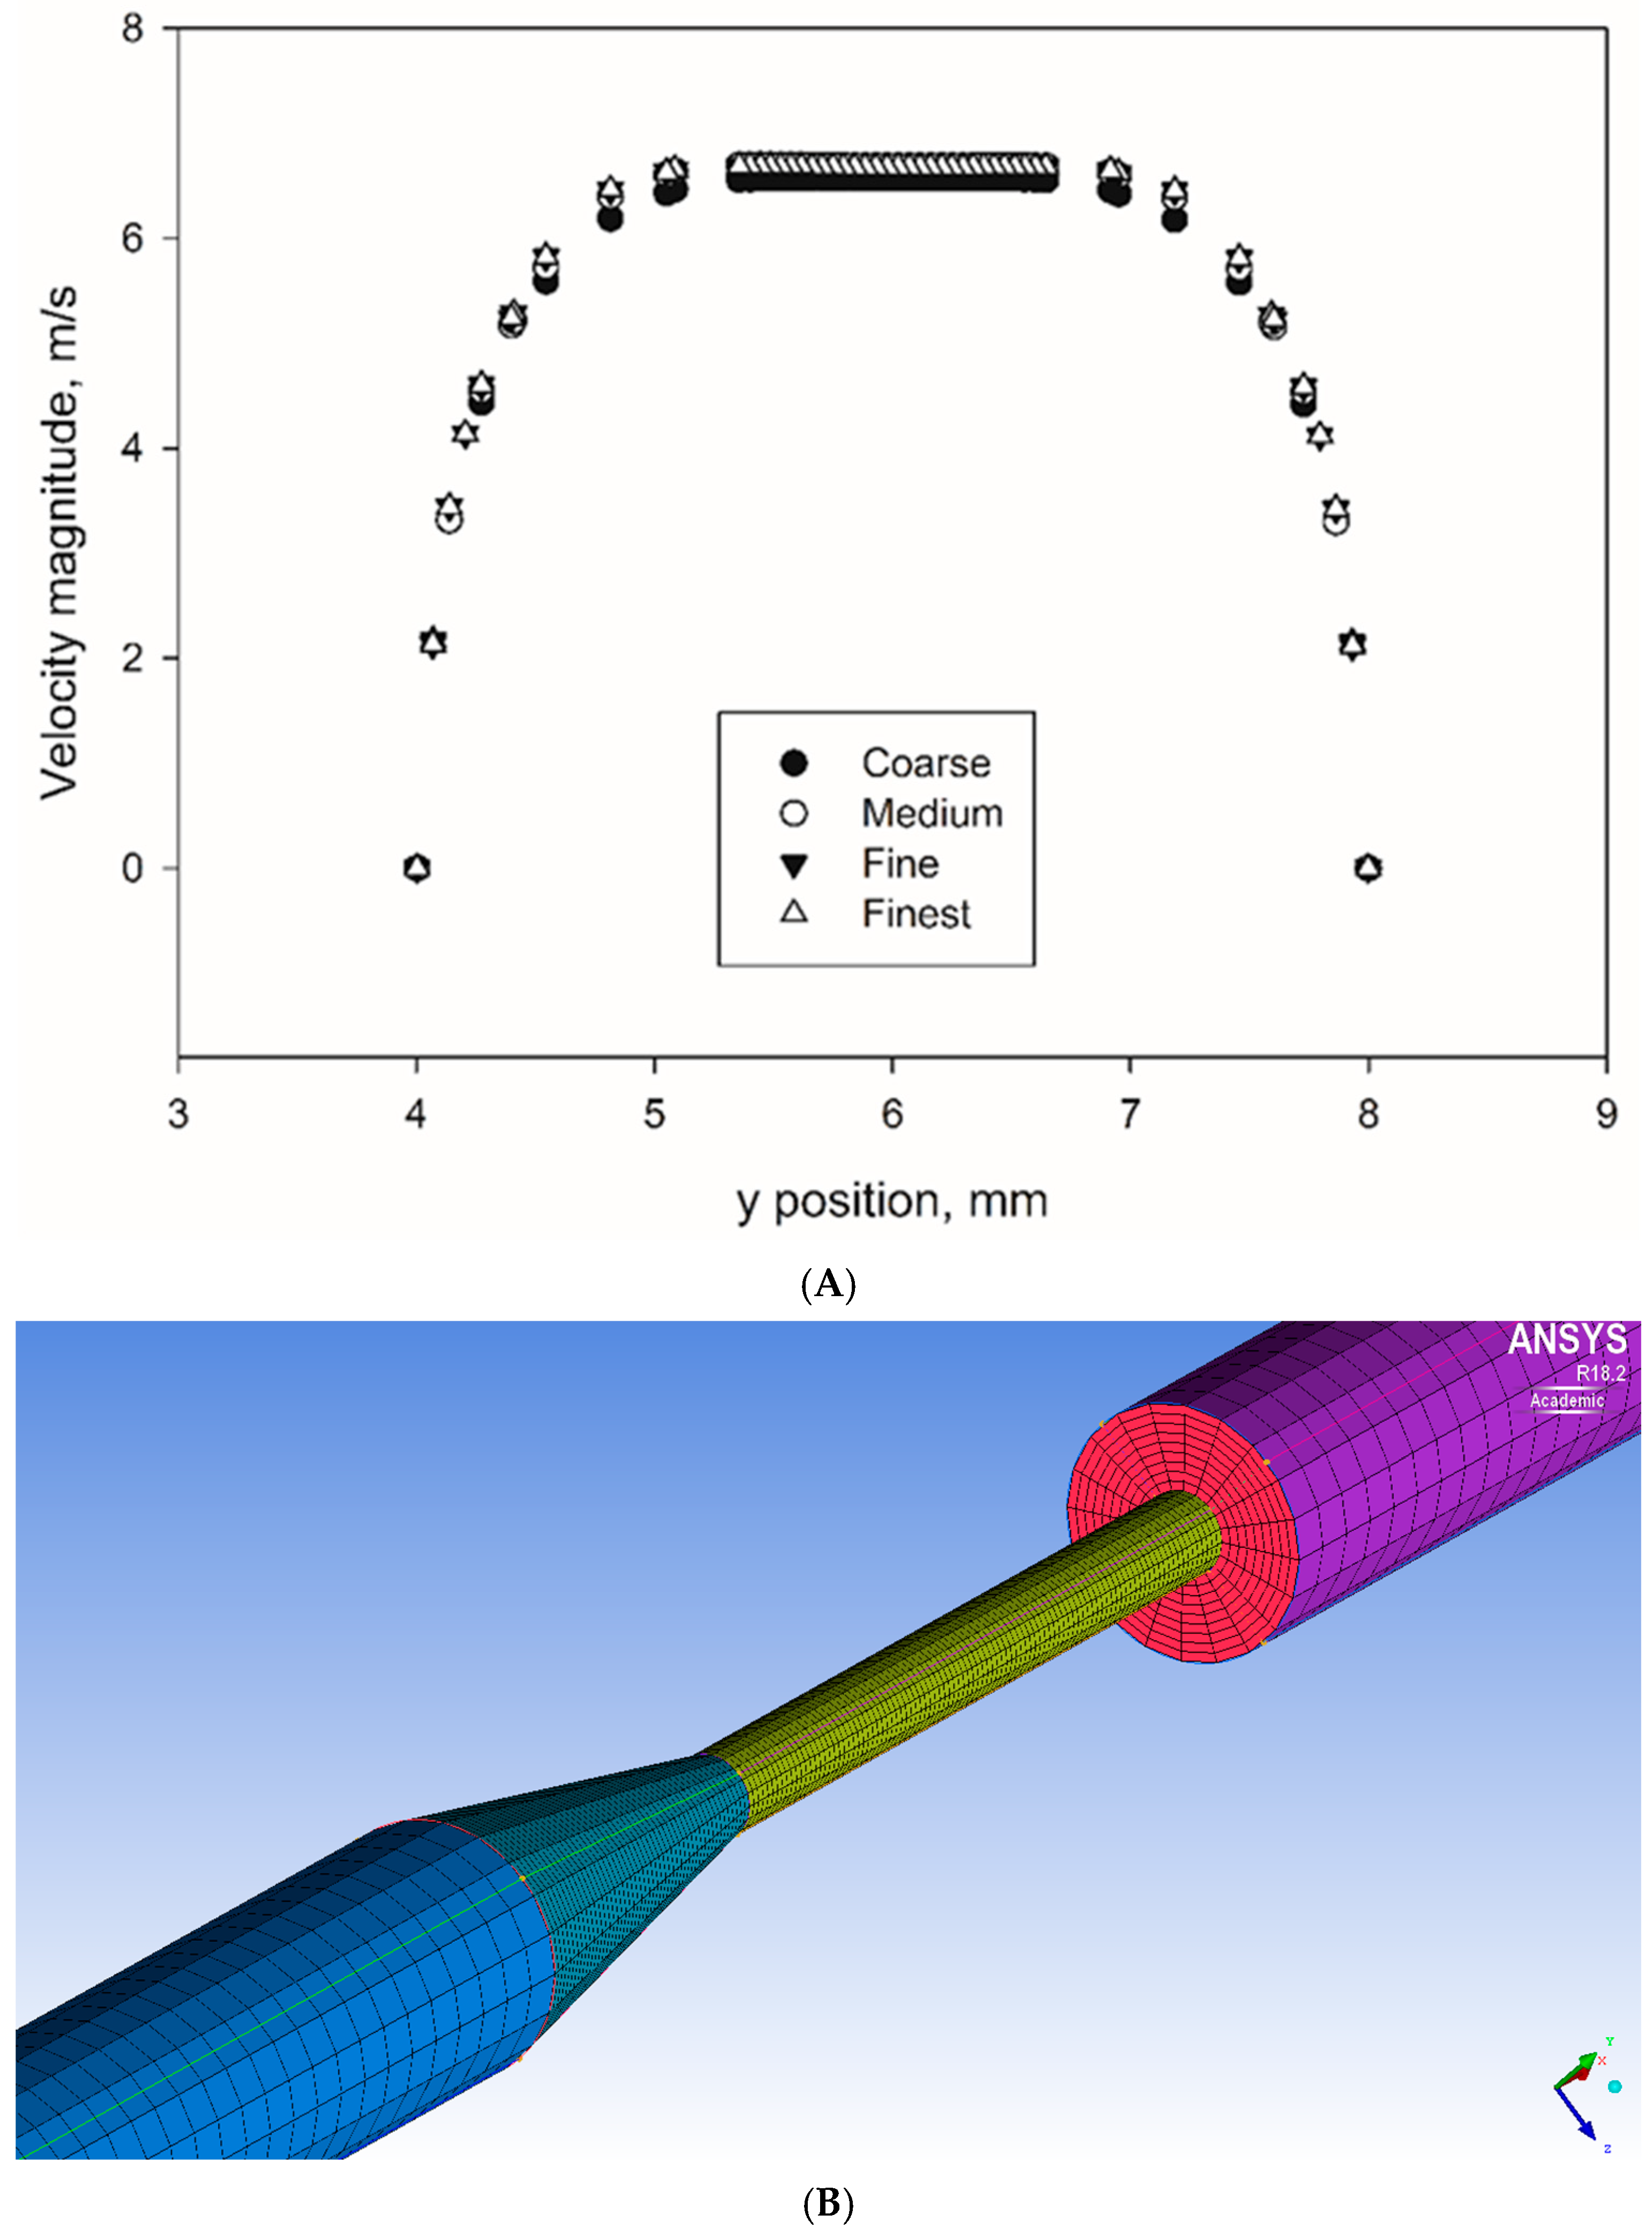
The computational mesh is created with the commercial software tool ICEM-CFD. Four different mesh densities (coarse, medium, fine, and finest) were generated for each nozzle configuration (GC and SC) using a multiblock-structured hexahedral grid with combined O-grid topologies to perform the mesh refinement study. Mesh independence results for the velocity of the GC configuration at the highest Reynolds number (Re = 6500) at a cross-section located −0.008 m below the throat (matching the experimental PIV location and also indicated in
Figure 1) are shown in
Figure 2A; the same refinement strategy was followed for the SC configuration. The mesh details, including the number of cells and nodes for each mesh level, are provided in
Table 1. As shown in
Figure 2A, velocity values in the nozzle system were independent of mesh sizes. A representative view of the computational mesh is shown in
Figure 2B.
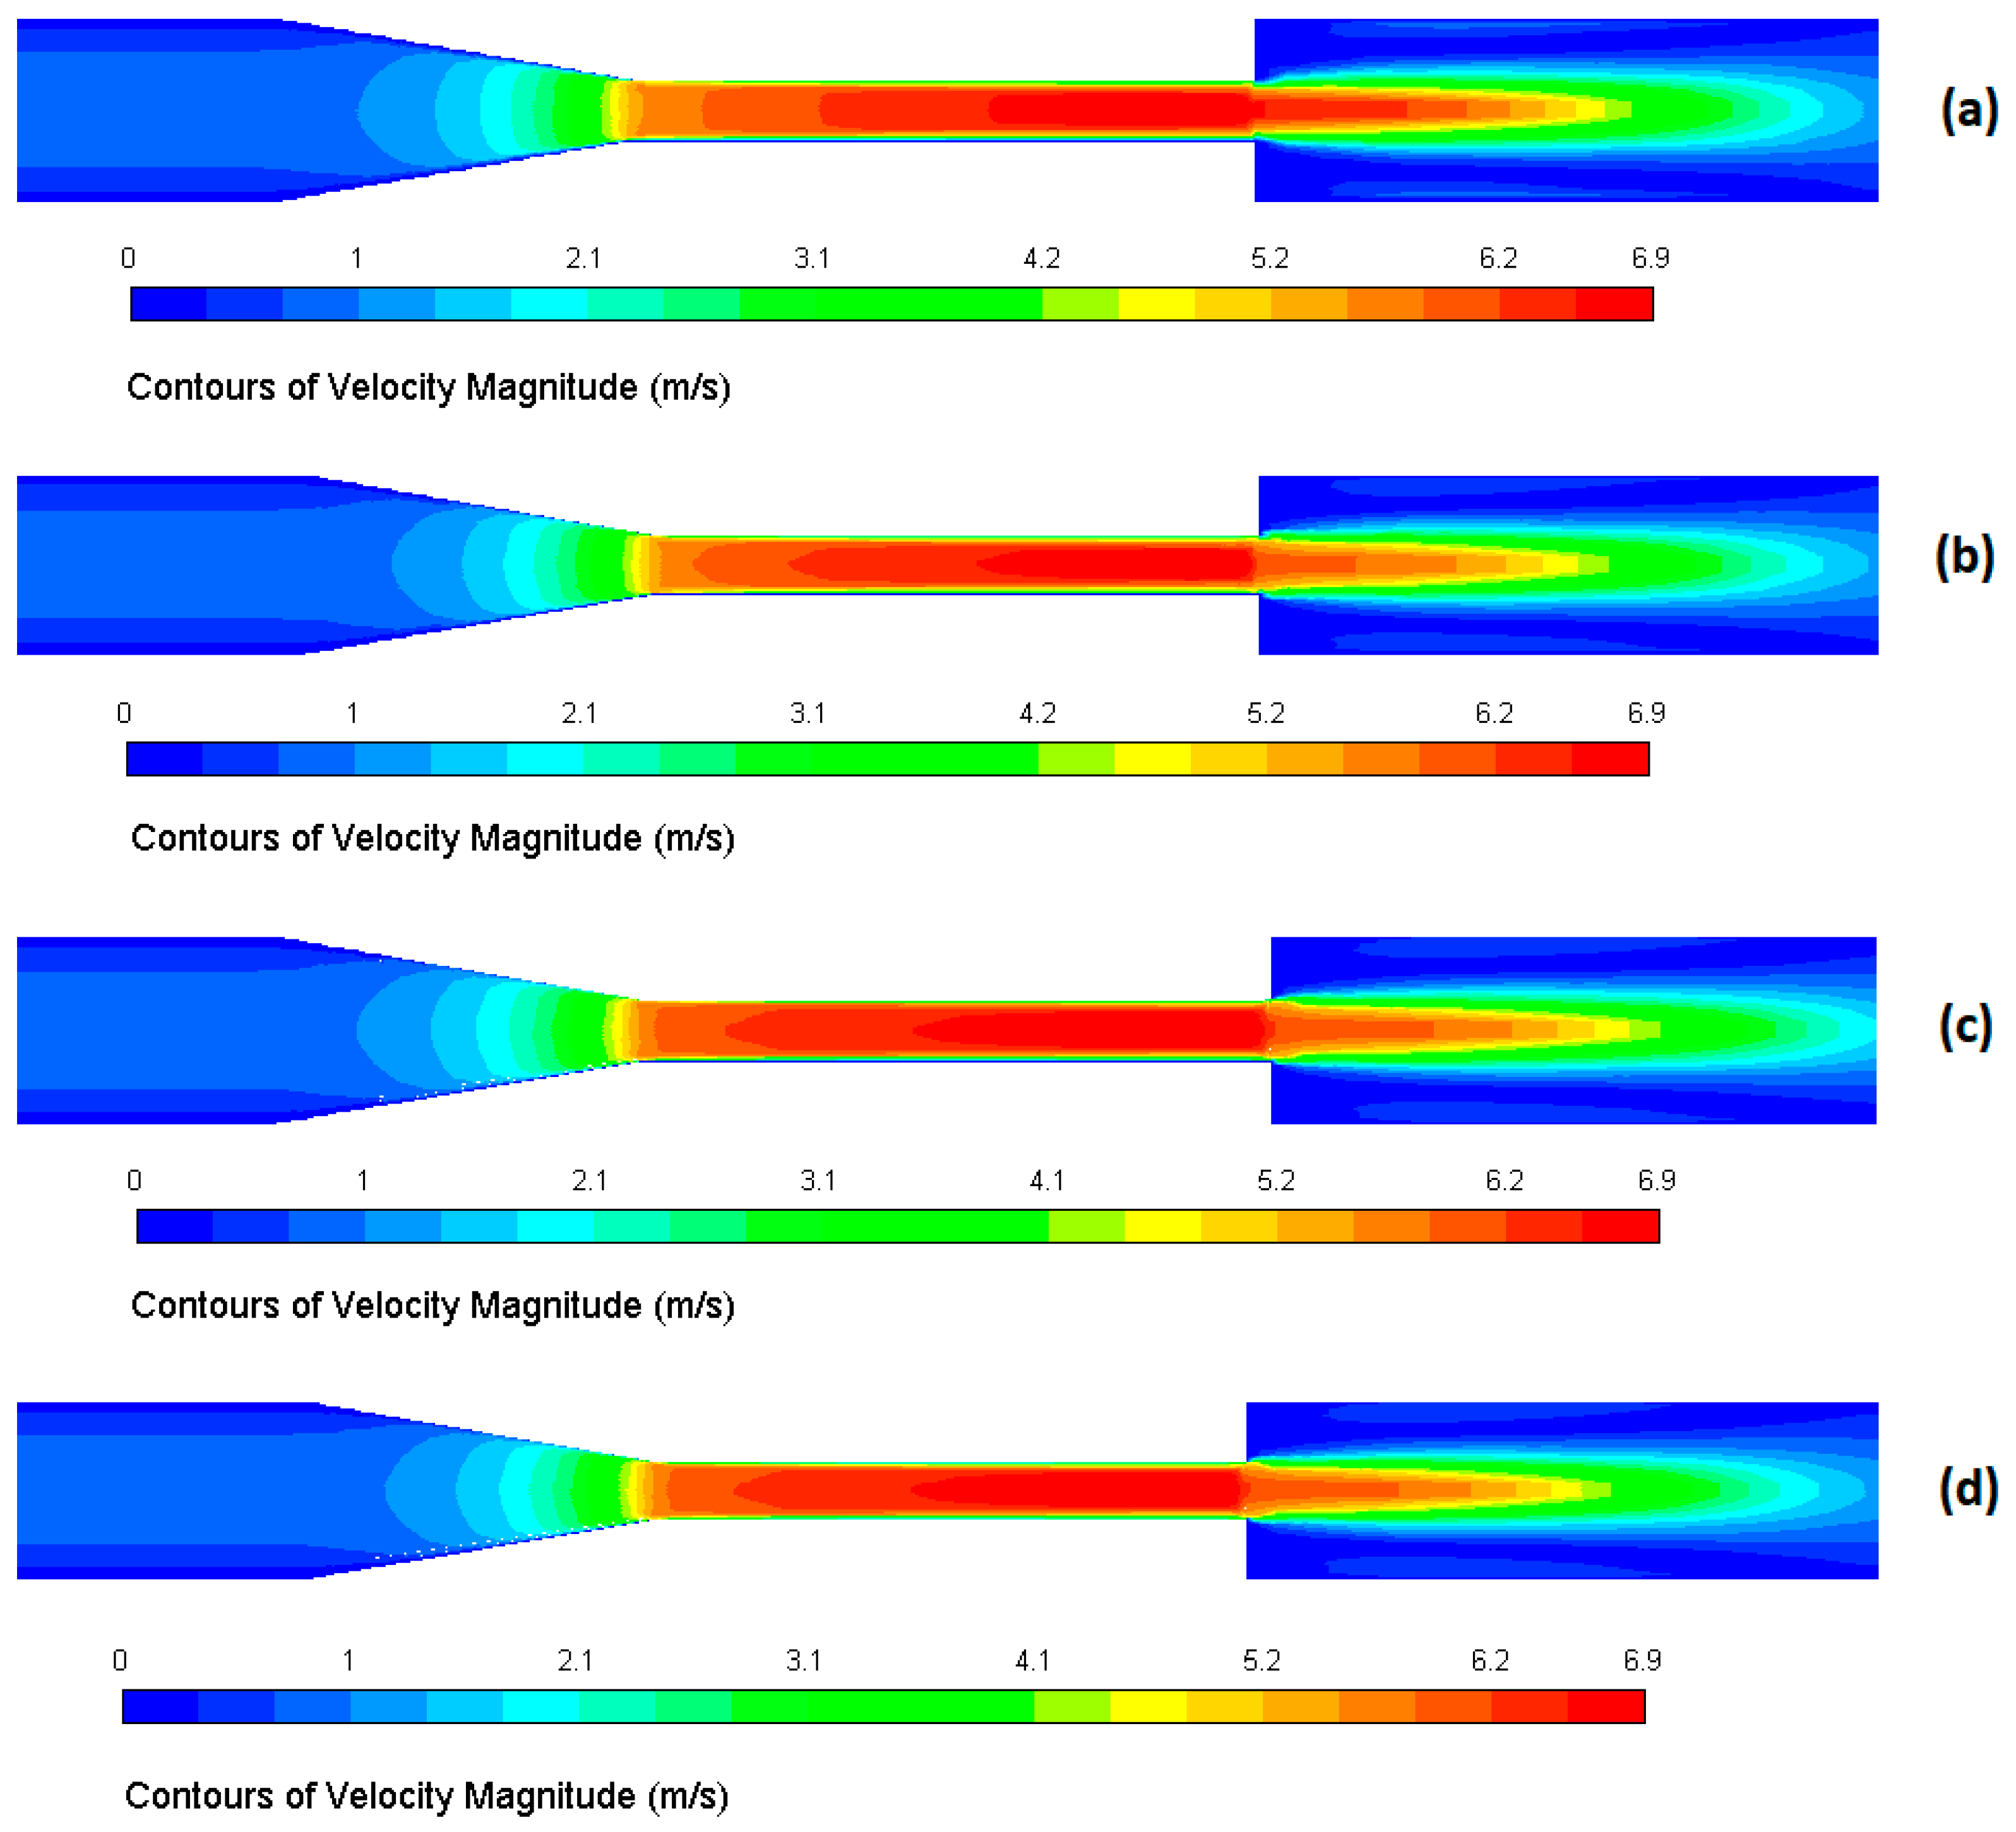
Mesh independence was further verified by presenting the velocity contours on the center plane extending from inlet to outlet for the GC configuration at the highest Reynolds number (Re = 6500) for all four mesh densities (coarse, medium, fine, and finest) in
Figure 3a–d. As can be seen from the contour plots, the velocity distribution remains essentially unchanged at all mesh refinements, confirming mesh independence for the selected mesh resolution. The same refinement study was performed for the SC configuration, and it also showed similar agreement. The maximum difference in peak velocity between the finest mesh and the other meshes was found to be 1.3% for coarse, 0.9% for medium, and 0.02% for fine mesh.
2.2. Flow Conditions and Simulation Details
The simulation conditions were acquired from Hariharan et al.’s inter-laboratory particle image velocimetry (PIV) study [
21]. The blood flow was assumed incompressible and exhibits Newtonian behavior with a density of 1056 kg/m
3 and a viscosity of 3.5 mPa.s. The flow simulations were performed using the shear stress transport k-ω (SST k-ω) model, which was shown to have greater accuracy in capillary flow [
26,
27,
28]. The boundary conditions were determined as the velocity inlet for the nozzle inlet, the outflow at the domain outlet, and the no-slip condition for the nozzle walls. The solution parameters included the least square cell-based scheme for gradient, the second-order upwind discretization scheme for pressure and momentum, and the simple scheme for pressure–velocity coupling. The residuals were specified as 10
−6 for the convergence criterion. Flow simulations were performed for the complete set of experiments [
21] for each GC and SC configuration shown in
Table 2.
Simulations were completed by specifying a slow fluid velocity (such that the flow was in a laminar regime) and running the simulations until convergence. Then, the velocity was continuously increased in silico until the resulting velocity and the throat Reynolds numbers matched the experimental conditions reported by Hariharan et al. [
21]. After the velocity was high enough to produce turbulent flow, the k–ω SST turbulence model was applied. The procedure of raising the velocity values was repeated until all five cases (0.05 m/s–0.60 m/s, shown in
Table 2) of Hariharan et al. [
21] were simulated. The Reynolds number (Re) for the throat section of the nozzle was calculated by using the density of the fluid, ρ, the flow rate, Q, the viscosity, µ, and the pipe diameter, D, as Re = 4ρQ⁄πμD yielding values of 500 (for the lowest velocity, 0.05 m/s) to 6500 (for the highest velocity, 0.60 m/s), as seen in
Table 2.
2.3. Extensional Stress Calculation
Extensional stress calculations were completed for both nozzle configurations at a post-processing phase. Various lines (named rakes in Fluent) with multiple points through the model geometry were constructed for both models of five experimental conditions. Rakes were created equally spaced, but this space was not the same at different parts of the nozzle. For example, in the case of GC configuration (
Figure 1, top image), there were 97 rakes spaced 30 mm apart at the beginning of the wide inlet section, and the distance between rakes was decreased to 2 mm for the last 120 mm of the wide inlet section. The distance between rakes in the conical and throat sections, and the first 120 mm of the last wide outlet section, was 2 mm. Finally, the distance between rakes was 30 mm for the last part of the wide outlet section. A total of 225 rakes with several points were created for each nozzle configuration, resulting in approximately 12,000 different calculated extensional stress values for each configuration and each experiment. The same procedure was applied to the SC configuration of the nozzle. Time-averaged velocity gradients of each point of every rake were found, and then the extensional components of the stress tensor were found, which are as follows:
where µ is the dynamic viscosity, V
x, V
y, V
z are the radial and axial velocities. These variables were calculated in the entire flow domain.
3. Results
3.1. Flow Field Validation
Validation of the flow behavior is critical in the CFD study of the nozzle with medical device features [
17,
29]. Hariharan et al.’s interlaboratory PIV data [
21] were used to validate the CFD flow simulations. Axial velocity profiles were calculated along the radial direction at the cross-section located −0.008 m below the throat for the GC configuration. This location was chosen to match the position used in the experimental PIV measurements by Hariharan et al. [
21], which served as the reference data for validation. This region is located in the throat, which is crucial since velocity gradients are most significant and make it suitable for determining the accuracy of CFD predictions against experimental results. The location of the −0.008 m section is also indicated in
Figure 1 for clarity. Four inlet velocities were compared: 0.05 m/s, 0.18 m/s, 0.32 m/s, and 0.60 m/s, corresponding to throat Reynolds numbers of 500, 2000, 3500, and 6500, respectively (presented in
Figure 4).
As shown in
Figure 4, the axial velocity profiles agree very well with the experimental PIV data in the throat region and remain consistent across all flow conditions. Slight discrepancies were observed at higher flow rates because of the limitations of the k-ω SST model to capture near-wall turbulence and transitional flow regimes. Similar behavior was observed in the study by Stewart et al. [
25], which compared k-ω SST and k-ɛ models and found that the k-ω SST model broadly matched the diffuser flow well but modestly under predicted upstream velocity in the nozzle. Overall, the CFD results compare reasonably well with the PIV measurements, showing that the simulation results are reliable for both the laminar and transitional regimes.
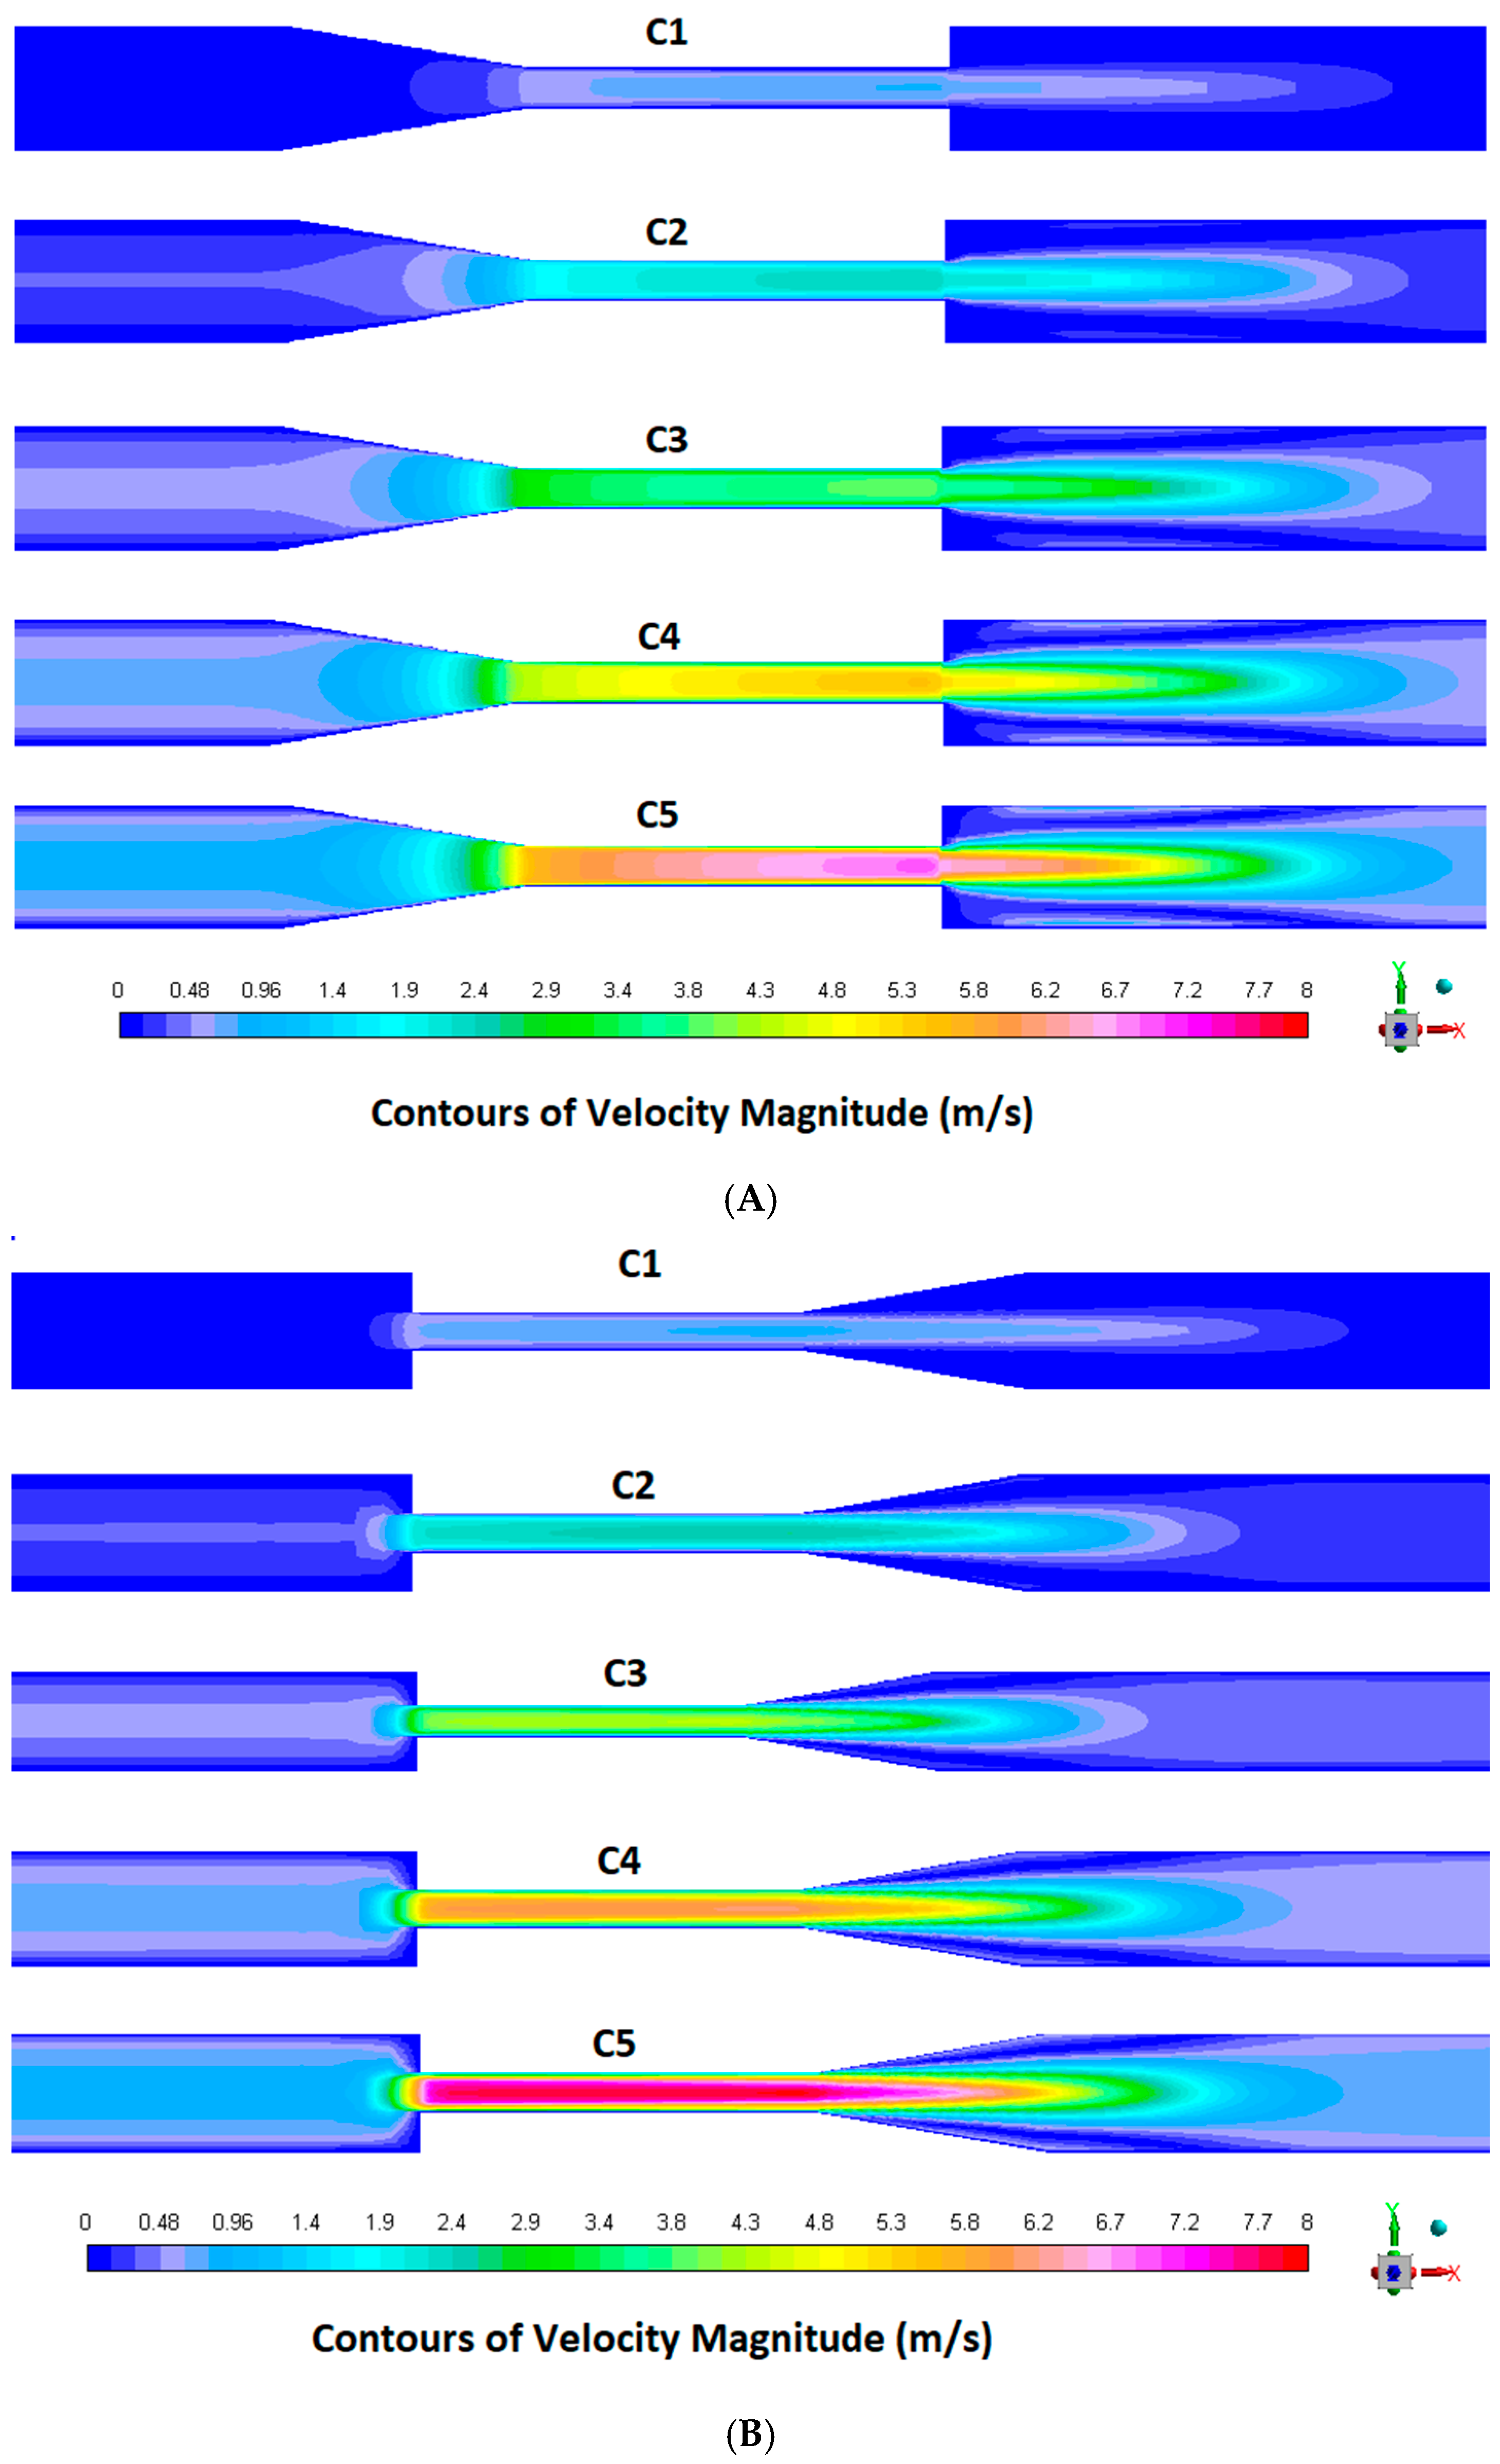
Validity and physiological relevance of the CFD results can also be determined by examining the velocity magnitude contours, which reveal characteristic flow features such as recirculation zones, flow separation, and acceleration through the throat. Regions where sharp velocity gradients are monitored in these contours mostly correlate with the elevated extensional stress zones, which are the primary aim of this study. Therefore, examining velocity contours inside the nozzle for varying flow conditions serves not only as a validation step but also to help understand the hemolytic zones in blood-contacting devices.
As shown in
Figure 5A,B, velocity magnitude contours were examined at five different Reynolds numbers for both the GC and the SC configurations. Flow acceleration was observed at both geometries in the throat region. In the GC configuration (
Figure 5A), the high-velocity core region remains in the center and exhibits less disturbance downstream. The flow stays symmetric and well-developed, depending on the shape of the geometry. In contrast, the SC configuration (
Figure 5B) shows a slightly more disturbed flow field downstream of the throat. Mild recirculation features were also observed, especially at higher Reynolds numbers, due to sudden expansion. These differences are significant when determining local stress distributions and ultimately evaluating hemolysis risk as discussed in the next section.
3.2. Extensional Stress and Hemolysis Risk Analysis
Extensional stress is a significant factor in the deformation and potential hemolysis of red blood cells (RBCs), which can occur in blood-contacting medical devices. In contrast to shear stress, which affects RBCs tangentially, extensional stress stretches the RBCs along the flow direction. Extensional stress is particularly active in regions of geometric acceleration and contraction, which are present in the FDA nozzle studied here.
Experimental PIV hemolysis data were only available for three test conditions: GC configuration at Re = 6500, and SC configuration at Re = 5000 and Re = 6500 (shown in
Table 3). Therefore, spatially resolved extensional stress analyses were performed for these three cases to identify critical regions that could be associated with elevated hemolysis risk.
To capture the effect of extensional stresses more precisely, the entire domain was sampled by creating several rakes with multiple points. Spatial distribution of extensional stress was collected from a total of 225 rakes, each with 50 different measurements (approximately 12,000 data points). This comprehensive and highly sensitive analysis catches localized high-stress regions that are often missed in low-resolution or limited-capacity analyses.
A detailed stress distribution analysis for three experimental cases, along with an extensional stress threshold based on the experimental hemolysis data and stress distribution, is presented in this section.
3.2.1. Spatial Distribution of Extensional Stress Along Axial Direction
Variation in extensional stresses was analyzed by collecting data from 225 rakes across the entire flow domain of each nozzle configuration. Rakes were created equally spaced, but this space was not the same at different parts of the nozzle (explained in
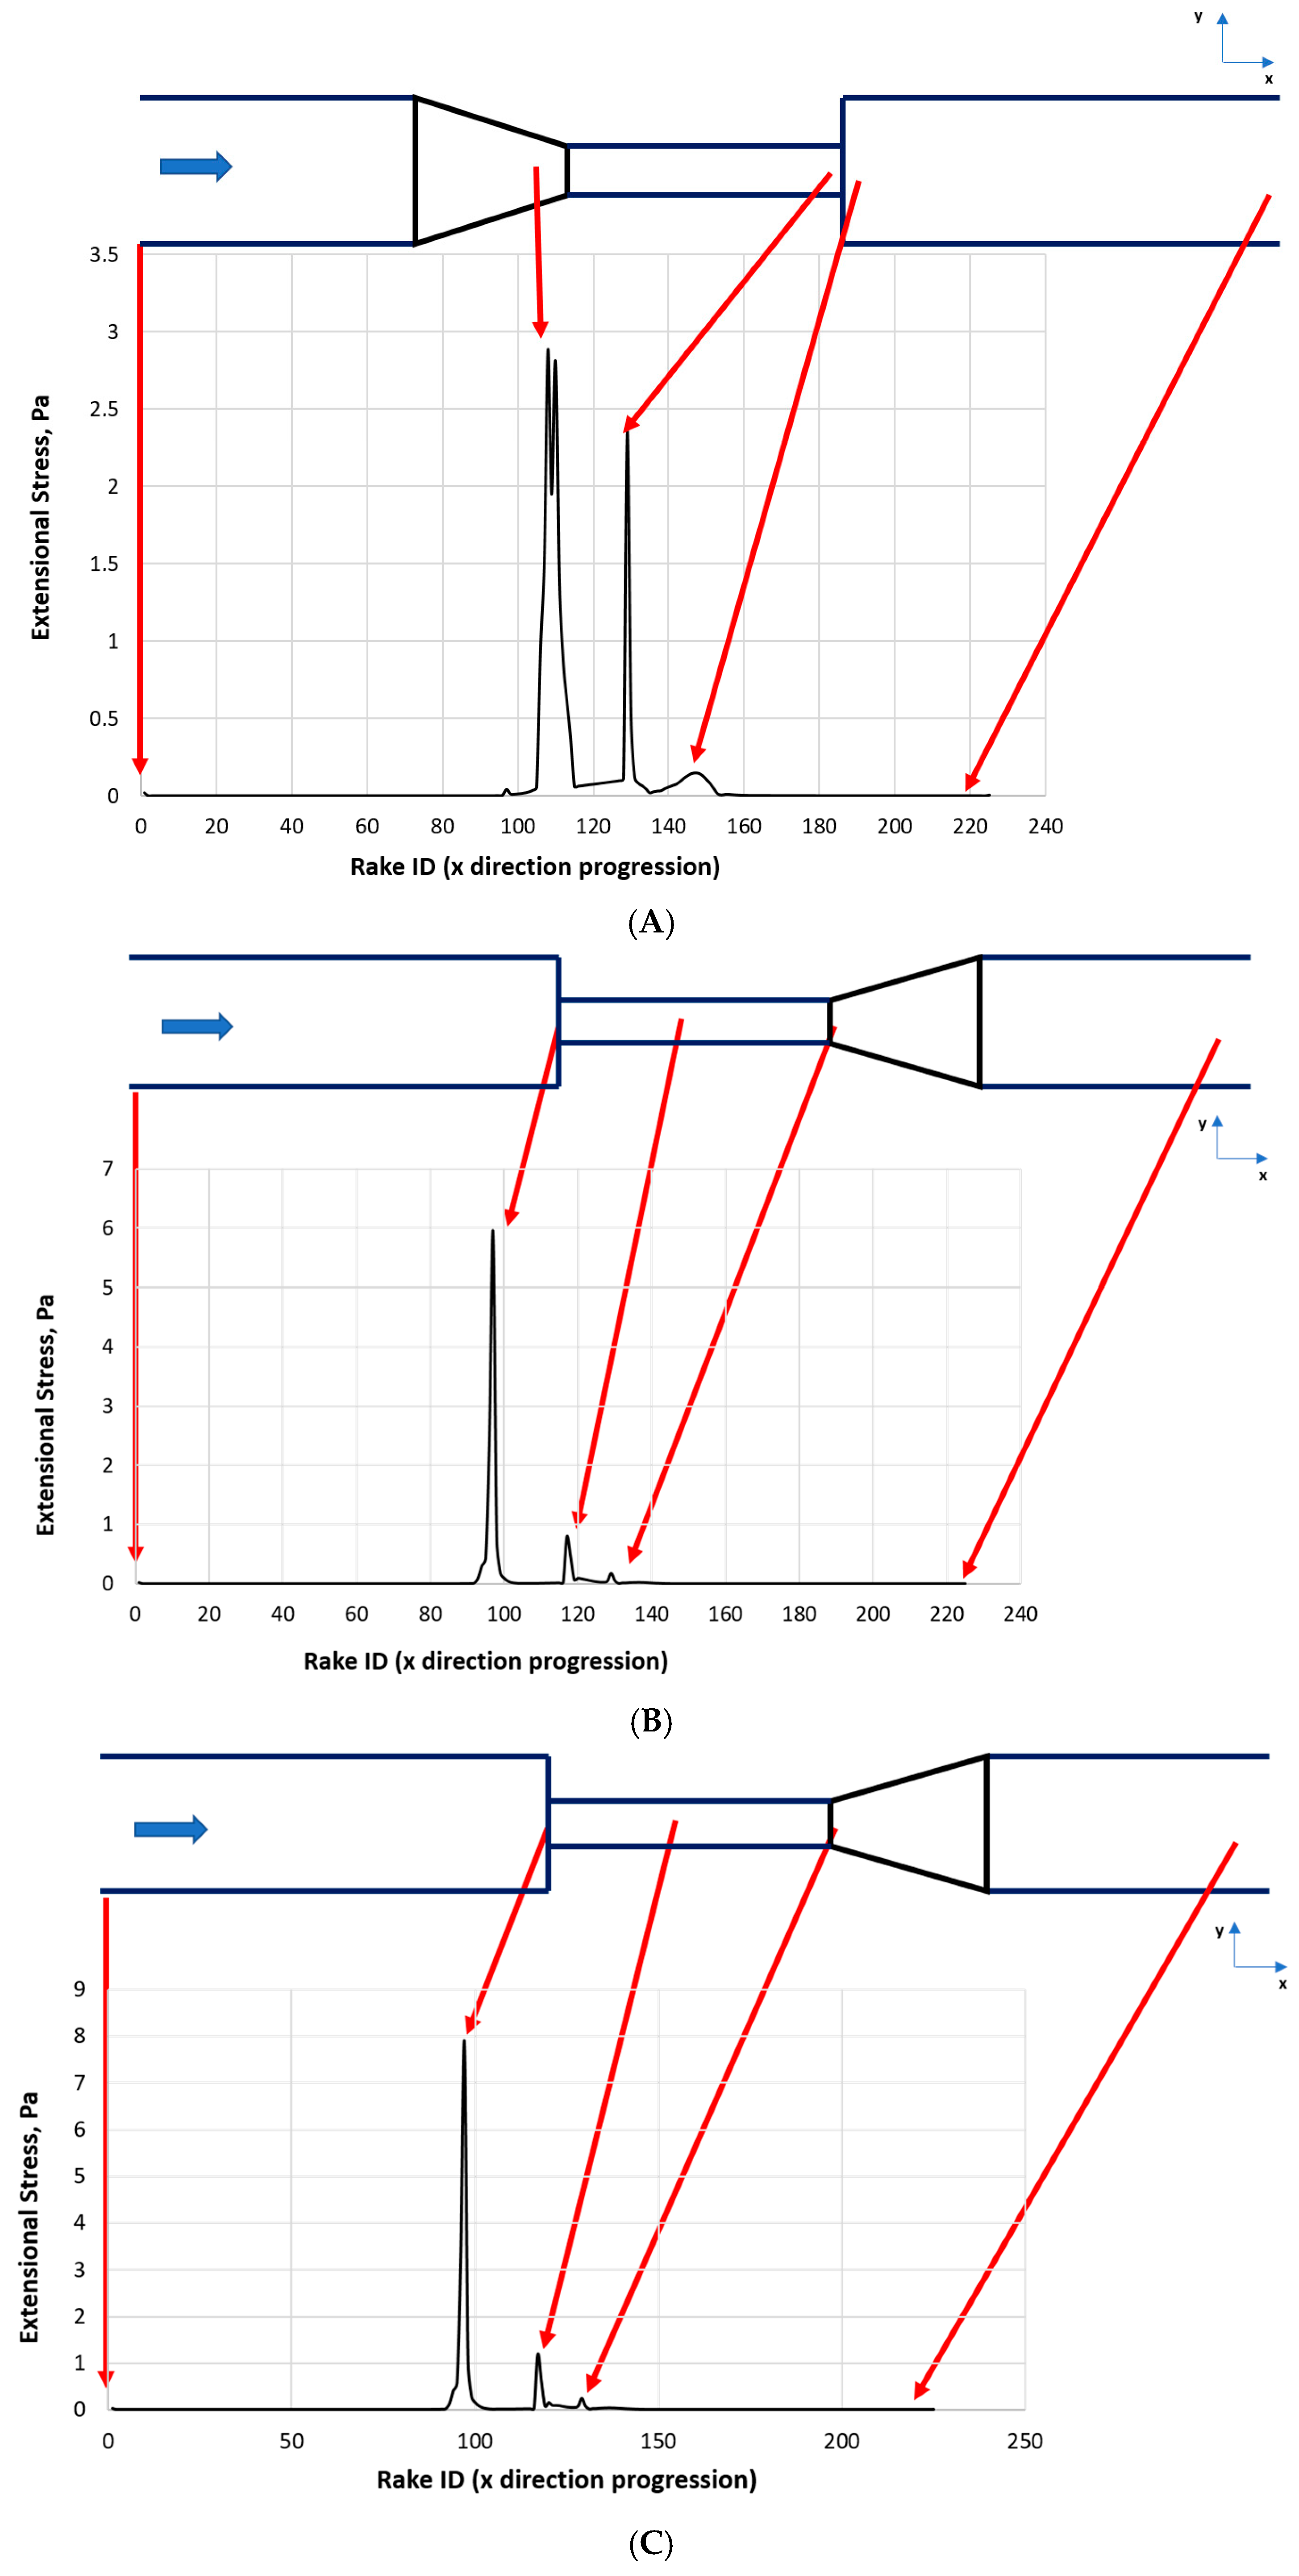
Section 2.3). Extensional stress values for each point on every rake were extracted from the Fluent program and postprocessed in Excel. The maximum value of every rake was recorded and plotted with changing rake numbers. Examining the domain at small intervals enables the detection of localized high-stress regions. Distribution of maximum extensional stress values along the axial direction for the selected configurations, GC at Re = 6500, SC at Re = 5000, and SC at Re = 6500, is presented in
Figure 6A–C.
In the GC configuration at Re = 6500 case (
Figure 6A), two distinct extensional stress peaks were observed. Extensional stress reached its maximum value of approximately 2.9 Pa around rake IDs 110–112, and a second, smaller peak of roughly 2.4 Pa was observed around rake ID 129. A third, much smaller peak was observed at approximately 0.9 Pa at rake ID 140. Remaining fluid domain revealed low stress values (<0.3 Pa), showing that high stress occurred at specific acceleration zones. It can also be seen that the distribution of these peaks was relatively broad in the GC configuration, which indicated a more gradual flow acceleration characteristic.
In contrast, a sharper stress peak confined to a narrower region was observed in the SC configuration at Re = 5000 (
Figure 6B) with maximum stress level of nearly 6 Pa around rake ID 100. A second peak was observed at smaller stress level of around 0.8 Pa at rake ID 117. This intense and narrow stress peak occurs due to a sudden geometric contraction in the SC model, which leads to flow acceleration in a highly localized region. This pattern may be a significant risk factor for mechanical loading on RBCs compared to the GC model.
The SC model at Re = 6500 (
Figure 6C) creates a much higher maximum stress value of around 8 Pa at rake ID 97. Consistent with the first peak, the second peak is also higher, around 1.2 Pa at rake ID 117. This increase in the stress intensity was due to both the geometrical effect and the increased flow rate. Higher Reynolds numbers increase the focused stress effects of the SC model. These peaks may represent potential zones for RBC damage and lysis.
An interesting observation is that the presence of smaller secondary peaks in all configurations, which are usually under the expected hemolysis threshold, may still lead to cumulative cellular damage due to repeated exposure in flow cycles, especially under unsteady flow conditions. Therefore, analyzing both the distribution and magnitude of stress is significant for predicting hemolysis.
These findings indicate that the Reynolds number and nozzle geometry influence the location and magnitude of extensional stress. While the GC model creates a more spread-out and lower stress level, the SC causes narrower but stronger stress peaks. Determination of these high stress levels in the entire domain helps to find an extensional stress threshold, which is presented in the next section.
Although the axial distribution of extensional stress is examined in detail in the present study, it should be noted that radial variations may also affect red blood cells. When considering different flow conditions, such as laminar and transitional flows, the highest shear stresses typically exhibit a high concentration near the centerline in accelerating flow regions and decrease smoothly toward the wall due to the axial velocity gradient. On the other hand, in turbulent flow conditions or sudden geometric transitions such as SC configurations, radial distributions may become more heterogeneous, and localized stress increases may occur in regions close to the wall due to secondary flows and recirculation zones. These aspects will be considered in future studies involving radial stress analysis.
3.2.2. Histogram Analysis and Hemolysis Threshold Determination
Simulations were performed for three experimental cases, which are GC at Re = 6500, SC at Re = 5000, and SC at Re = 6500. With varying levels of hemolysis (0.008–0.5%) achieved using the FDA nozzle configurations, the significance of extensional stresses in relation to hemolysis can be understood from a unique perspective. Experimental % hemolysis values were acquired from the original work of Hariharan et al. [
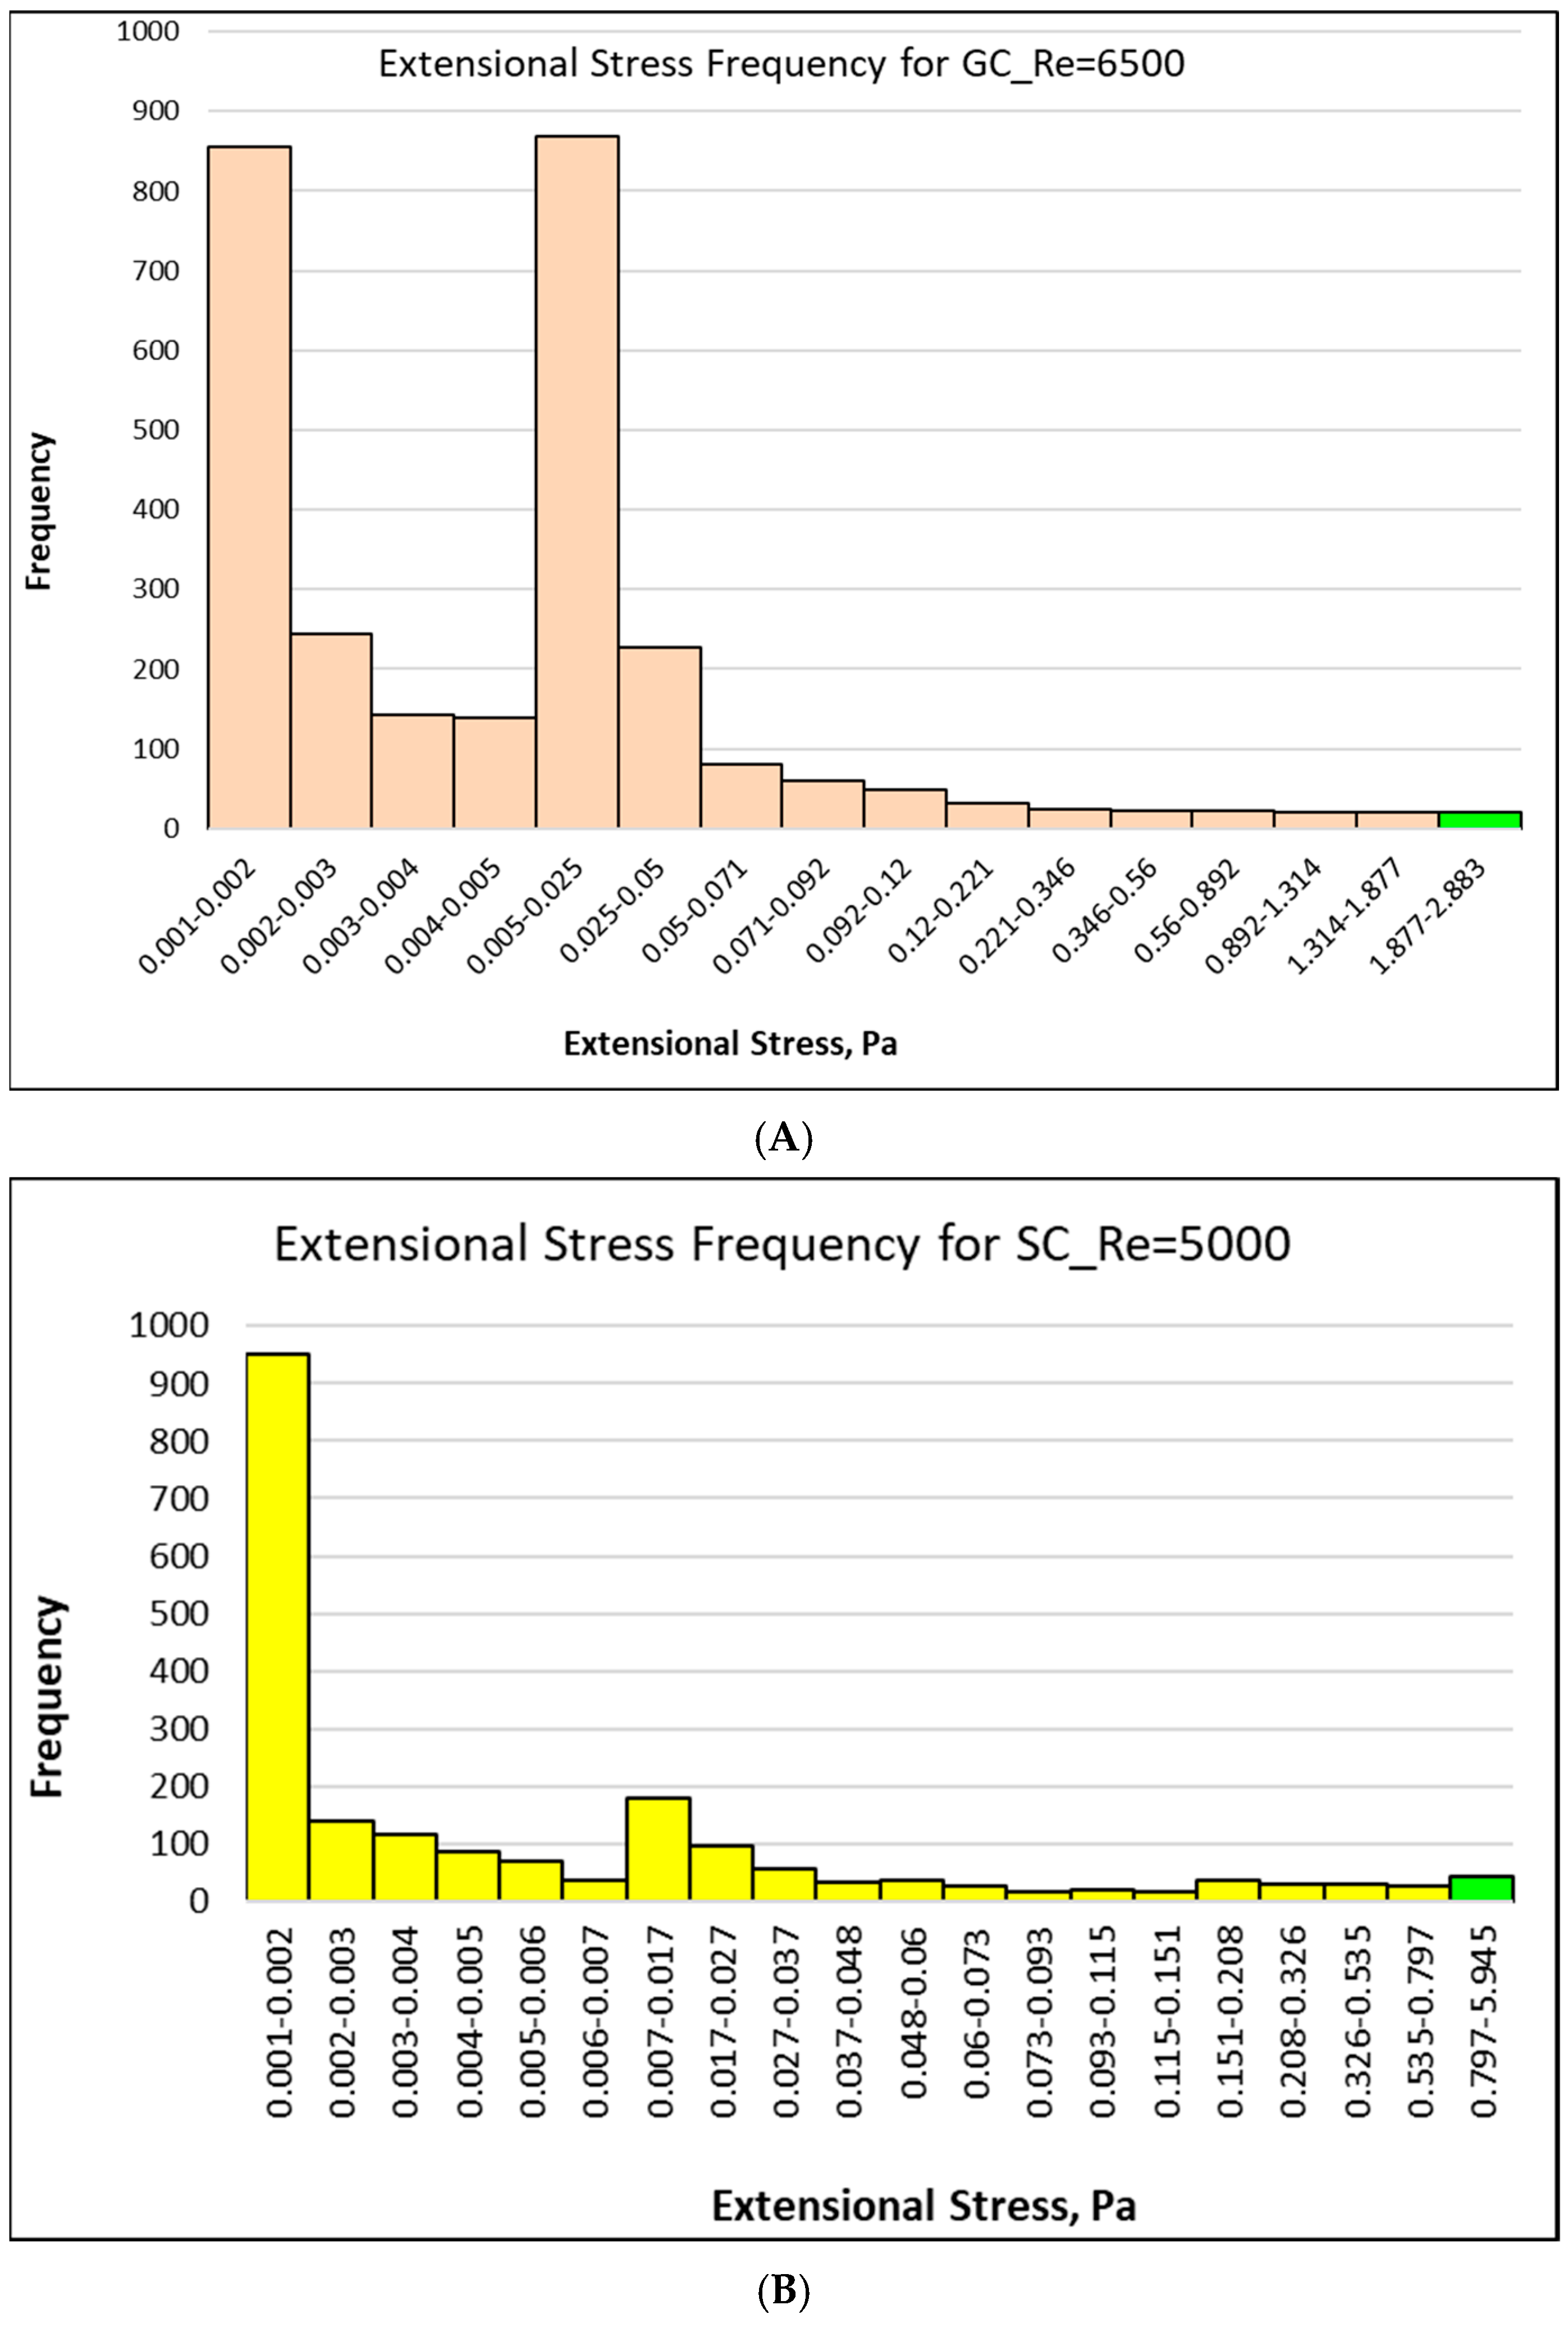
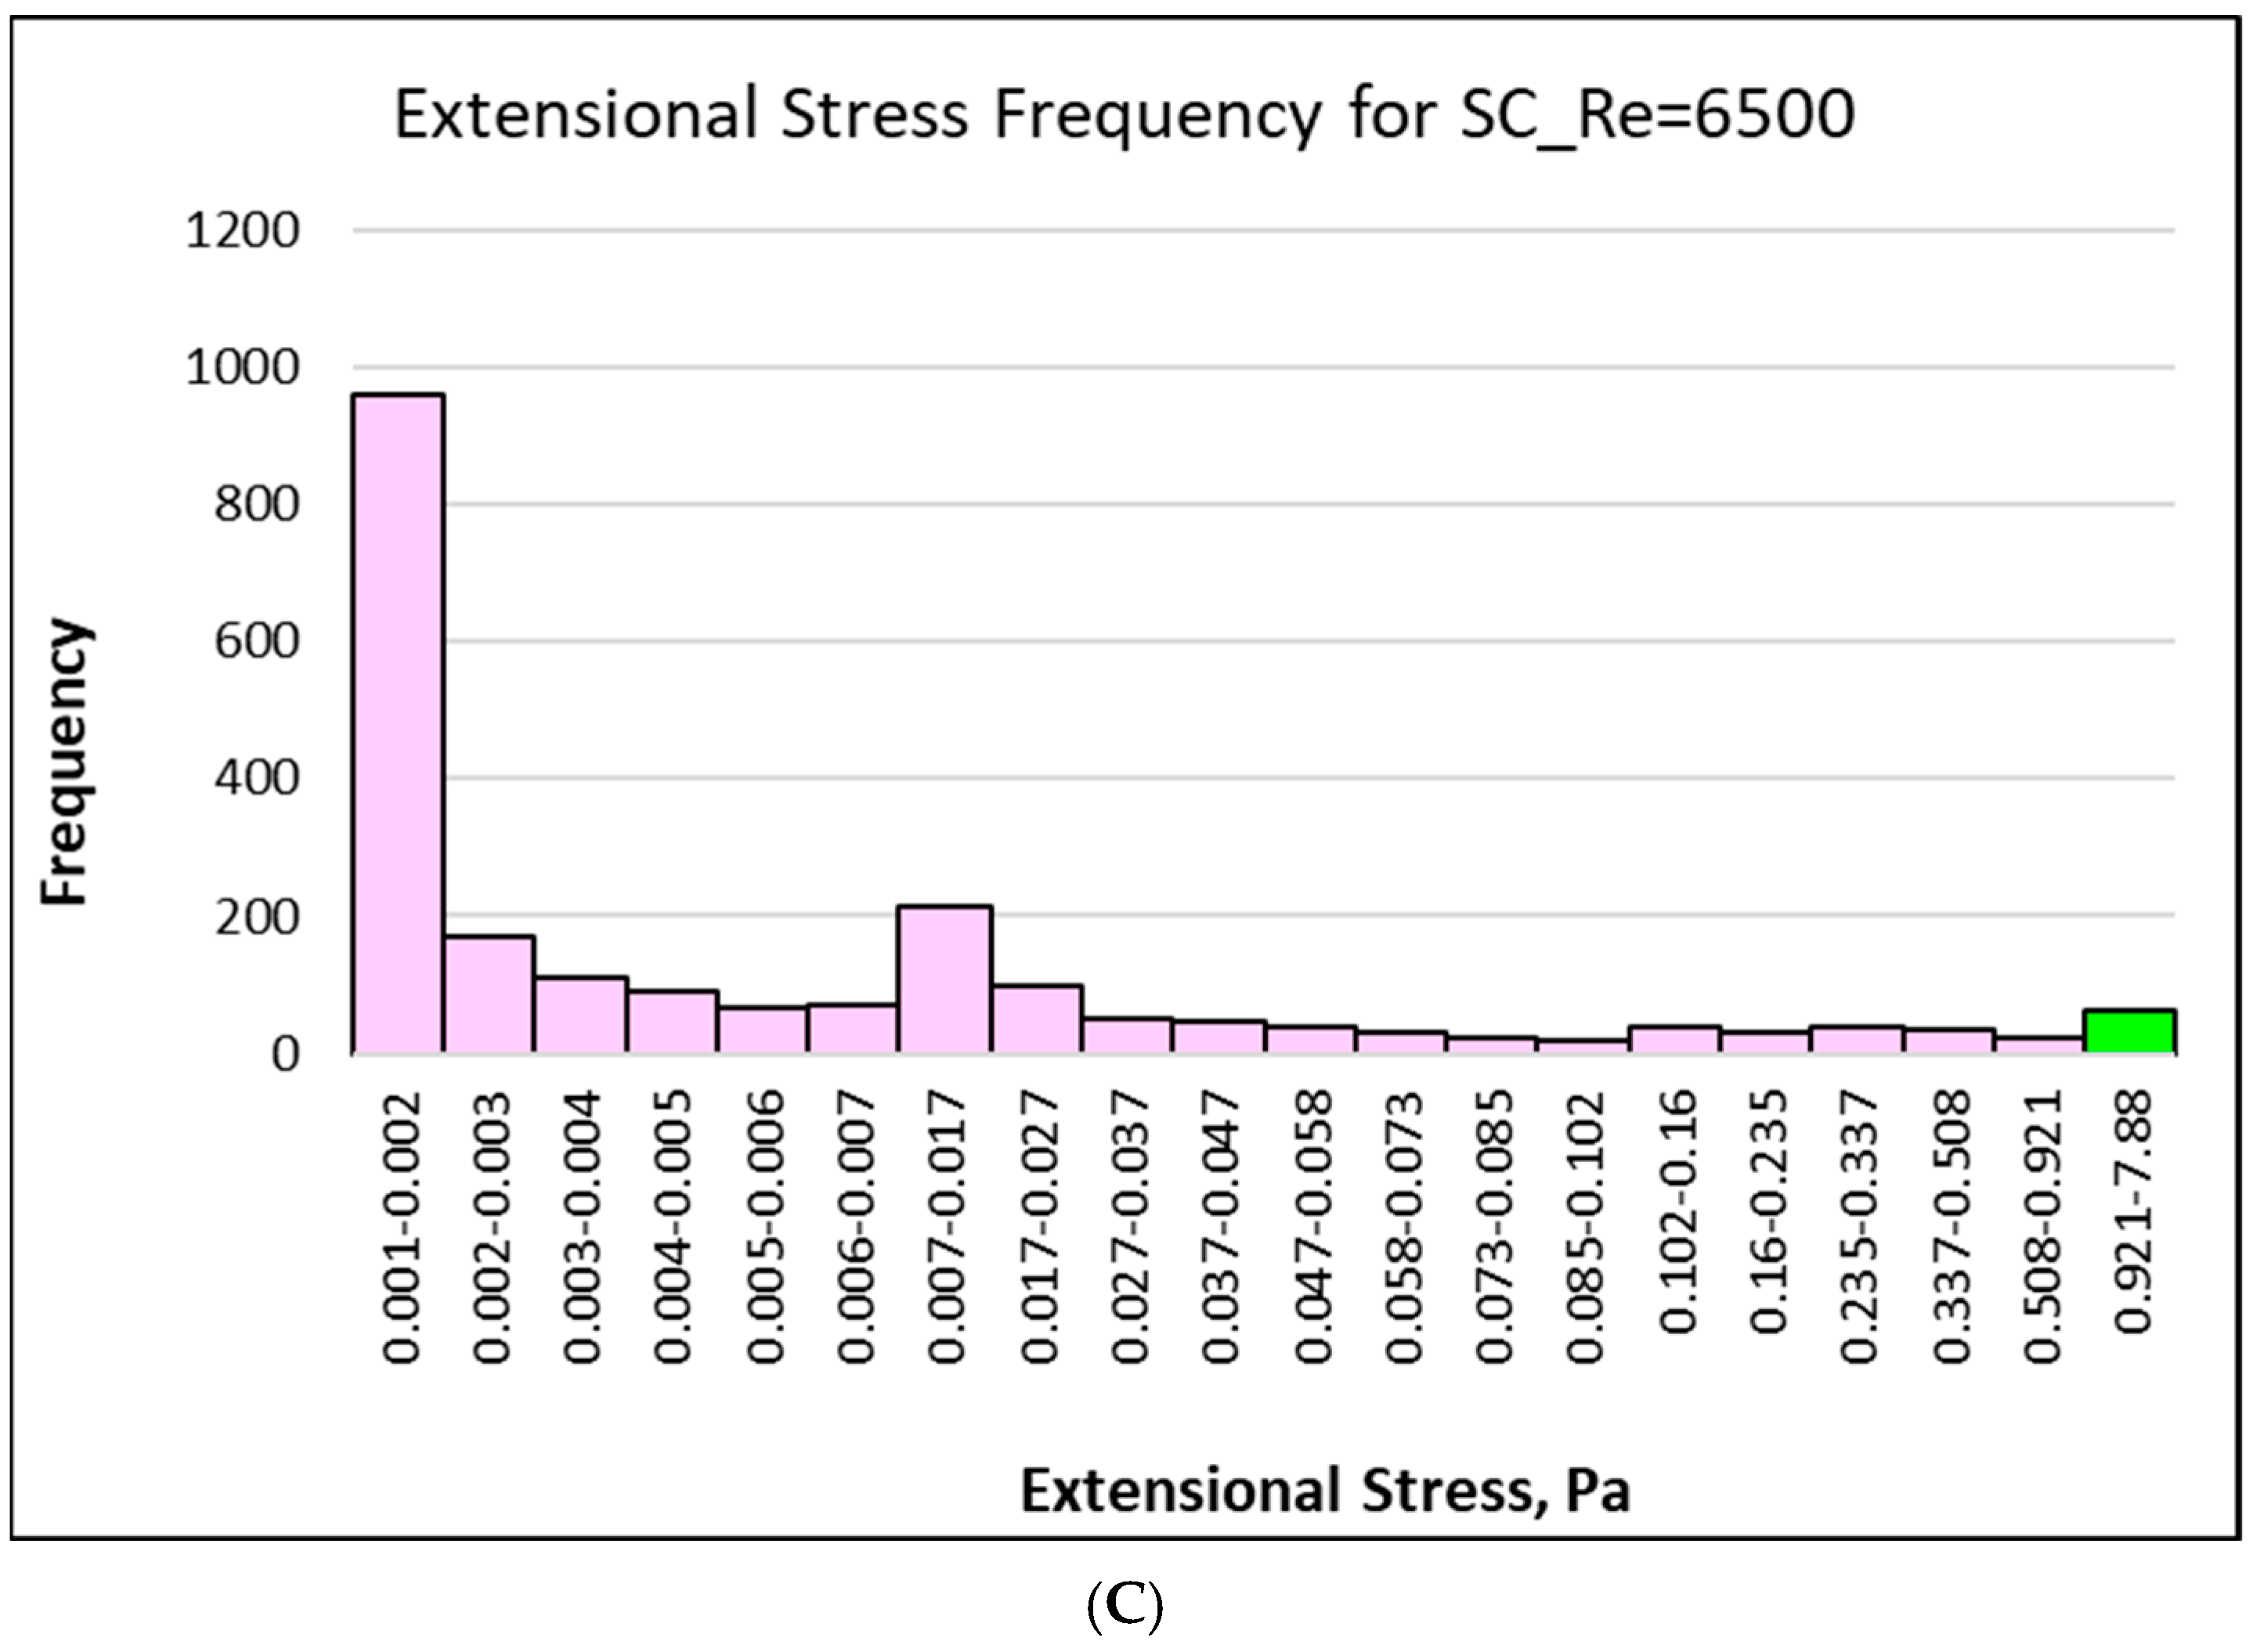
21]. The spatial distributions of extensional stresses were determined for each experiment of the two nozzle configurations. For each simulation, a threshold value of extensional stress associated with hemolysis was estimated using constant stress contour maps. The level of contour surrounding a volume fraction equal to the experimental hemolysis percentage was defined as the threshold stress. For example, in an experiment with a 0.5% hemolysis rate, the stress value corresponding to the contour surrounding 0.5% of the area was chosen as the threshold. A histogram of results (
Figure 7A–C) shows that for three experiments examined (
Table 3) the threshold extensional stress was found to be 2.8 Pa (shown with green color in
Figure 7A–C), which means that, for example, 0.008% (hemolysis level of GC model at Re = 6500 experiment) of the spatial distribution of extensional stress was above this value. In addition to local extensional stress peaks, this frequency-based analysis not only provides information on where the highest stress occurs but also reveals how much of the area is subjected to different stress levels, thus providing a comprehensive picture of the overall mechanical stress loading.
The extensional stress distributions of all three cases (
Figure 7A–C) show that the 2.8 Pa threshold is in the final bin. In all three cases, exposure to high stress values is limited, but the stress magnitude range varies between the geometries. The GC case has a narrow distribution, which is mostly below 0.05 Pa, showing more uniform and slow flow acceleration. However, the SC configuration shows wide spreaded extensional stresses reaching a maximum of around 6 Pa at Re = 5000 and around 8 Pa at Re = 6500. In the SC model, even if the maximum stress value is confined to a small volume, the stress level can increase significantly due to sudden contraction. Therefore, it is essential not only to determine the maximum stress level but also to identify the area over which this stress is distributed, to assess the risk of hemolysis.
According to the literature, such low stress values can initiate von Willebrand Factor (vWF) unfolding, which is a crucial factor in thrombogenic events and platelet activation. Pham et al. [
4] found a threshold extensional stress level of 1.2 Pa for unfolding of vWF. This result emphasizes that even small extensional stress values can be biologically significant for flows in blood-contacting devices. The extensional stress threshold value of 2.8 Pa obtained for red blood cells, which have a more complex and flexible membrane structure than vWF, reasonably exceeds the threshold value determined for vWF and can therefore be used as a reasonable biological marker for exposure to subhemolytic stress.
From a hemodynamic design perspective, these findings suggest not only that the geometric differences elucidate the instantaneous flow characteristics, but also how red blood cells are generally exposed to these damaging forces. The geometric structure of the GC configuration appears to create a smoother acceleration and distribute the stress more, which may provide a more hemodynamically compatible environment for the RBCs. In contrast, due to the sudden contraction in the SC model, the elongation forces are concentrated in a smaller area and therefore increase the risk of localized mechanical trauma despite similar flow rates. This information may be useful for design optimization of mechanical devices that come into contact with blood, such as nozzles, connectors, or VADs (Ventricular Assist Devices).
3.2.3. Hemolysis Calculations Using Power Models
The threshold-based approach provides information about the spatial assessment of hemolysis risk, but it does not directly calculate the hemolysis index. In our previous work [
28], Reynolds and viscous stress thresholds for hemolysis in the geometry of Kameneva et al. [
30] were investigated. No threshold value was found for either Reynolds or viscous stresses, confirming that neither Reynolds nor viscous stress was a good estimator for determining hemolysis. That analysis showed the limitation when only relying on averaged flow parameters to determine hemolysis. Building on these findings, the current study extends the previous work [
28] to examine the effects of extensional stress on hemolysis, using commonly used power law hemolysis models to determine more biologically relevant and quantifiable hemolysis potentials in FDA nozzle configurations. The maximum extensional stress values were extracted from rake analysis of the whole domain for three cases where experimental hemolysis data are available (GC at Re = 6500, SC at Re = 5000, and SC at Re = 6500), and an exposure time of 7200 s was taken based on experimental data. Using maximum extensional stress provides the worst-case scenario that an RBC could encounter in the flow domain. This approach is consistent with the idea of power-law models, which are developed to predict damage under such extreme conditions. The hemolysis index (HI) values were calculated for four commonly used power law models (Giersiepen et al. [
31], Heuser et al. [
32], Zhang et al. [
33], and Fraser et al. [
1]) and presented in
Table 4.
As can be seen in
Table 4, four power law modes were used to predict hemolysis using maximum extensional stress. The standard error between experimental hemolysis and theoretical calculation was also found for three experiments of the FDA nozzle. Standard error (SE) [
34] was found using the formula
, where sdev is the standard deviation and N is the number of observations that correspond to three experiments of Hariharan et al. [
21]. Hemolysis predictions showed that the power law model of Zhang et al. [
33] gives the lowest standard error. The highest error was observed in Giersiepen’s power law model [
31]. These calculations show the difficulty of applying the power law models, which are developed from homogeneous laminar flow measurement to the analysis of devices with complex turbulent flows.
4. Discussion
This study systematically evaluated the distribution and peak values of extensional stress in two FDA benchmark nozzle configurations, the gradual cone (GC) and the sudden contraction (SC), and determined their relationship to hemolysis potential using experimental data. The results indicated a substantial influence of nozzle geometry on both the extent and distribution of extensional stresses. Specifically, the GC configuration resulted in wider but lower stress peaks, whereas the SC configuration yielded sharper and higher peaks concentrated over smaller regions.
The extensional stress threshold of 2.8 Pa identified in this study is higher than the 1.2 Pa threshold reported for von Willebrand Factor (vWF) unfolding Pham et al. [
4]. However, it remains within the physiological range for red blood cells (RBCs) given their larger size and flexible membranes. This finding indicates the potential of this threshold to function as a valuable sub-hemolytic indicator in the context of device-scale flows. Furthermore, the histogram-based frequency analysis provided a complementary perspective by quantifying the fraction of the flow domain exposed to potentially harmful stress levels. This information is frequently overlooked in hemolysis risk assessments.
The methodology integrates both centerline and spatially resolved rake-based stress analyses. The integration of these analyses enables the capture of localized high-stress regions that might be missed by low resolution approaches. This detailed assessment is particularly relevant for design optimization, as it reveals not only the absolute peak stresses but also the volumetric extent over which RBCs may experience these loads.
4.1. Assumptions
This study adopted several simplifying assumptions. The blood was modeled as a Newtonian, single-phase fluid with constant viscosity, a choice that aligns with numerous prior FDA nozzle studies and is known to enhance computational efficiency while maintaining established validity in large-scale flows. Flow was assumed steady, neglecting pulsatility that could alter temporal exposure patterns. A turbulence model was constructed using the SST k–ω RANS formulation. The SST k–ω RANS formulation has been validated extensively for this particular benchmark. However, concerns have been raised that this formulation may potentially underestimate fine-scale transitional structures. The degree of hemolysis was estimated using maximum extensional stress values and uniform exposure times. These values represent a worst-case scenario and assume uniform stress history for all red blood cells (RBCs).
4.2. Limitations
The single-phase approach, however, does not take into account RBC–RBC interactions, including particle–particle collisions, clustering, and trajectory variability, which may influence stress accumulation. Capturing such effects across the full nozzle requires simulating millions of cells per millimeter cubed, which is computationally prohibitive at present. The steady-state assumption excludes physiological pulsatility, which can modulate instantaneous stress magnitudes and cumulative exposure. Additionally, the power-law hemolysis models used were originally derived from homogeneous laminar shear experiments; their direct applicability to turbulent, extensional flows is approximate and may contribute to discrepancies between predicted and observed hemolysis. Finally, the threshold value of 2.8 Pa is based on spatial stress distributions correlated with experimental hemolysis data for only three test cases. While this provides valuable guidance, broader validation across more geometries and flow conditions is necessary to confirm its general applicability.
5. Conclusions
In this study, to better elucidate the potential for extensional stress to induce hemolysis in blood-contacting devices, the distribution of these stresses was computationally investigated in detail. For each configuration, 225 rakes were created over the entire flow domain, and stress measurements were taken at around 12,000 points. These samples were spatially analyzed to generate extensional stress profiles, allowing for peak-based and volumetric analyses. A biologically reasonable threshold value (2.8 Pa) was identified, enabling a better understanding of the impact of different geometric effects on the risk of hemolysis.
The results show that more intense and localized stress peaks occur in the SC configuration, especially at higher Reynolds numbers, and the number of points exceeding the hemolytic threshold increases. In contrast, the broader and lower stress distributions observed in the GC configuration suggest that it may be more hemodynamically compatible. These findings are in agreement with experimental hemolysis data. It is also thought that the threshold value found may be biologically compatible when compared to studies on the vWF protein.
When applying a power law model that incorporates stress and exposure time, Zhang’s power law model yields the lowest standard error. On the other hand, Giersiepen’s power law model gives the highest standard error.
Overall, this study emphasizes the critical role of flow acceleration due to geometric differences in affecting spatial stress patterns. It also highlights the importance of including both density and spatial frequency analyses in hemolysis predictions. The proposed methodology emphasizes the importance of geometric effects in the assessment of blood damage potential of medical devices and may benefit medical device designs with more biocompatible flow environments. Future work will focus on simulating RBC–RBC interactions, including particle trajectories and collisions, in the high-extensional-stress regions identified in this study. Such smaller-scale multiphase simulations will provide additional insights into cell-level mechanical responses and complement the single-phase results presented here.
