Next Article in Journal
CFD-Based Extensional Stress and Hemolysis Risk Evaluation in the U.S. Food and Drug Administration (FDA) Benchmark Nozzle Configurations
Previous Article in Journal
Compressing Magnetic Fields by the Electromagnetic Implosion of a Hollow Lithium Cylinder: Experimental Test Beds Simulated with OpenFOAM
 
 
fluids-logo
Article Menu
Article

Experimental and Numerical Analysis of Nozzle-Induced Cavitating Jets: Optical Instrumentation, Pressure Fluctuations and Anisotropic Turbulence Modeling

by
Luís Gustavo Macêdo West
1,*,
André Jackson Ramos Simões
1,
Leandro do Rozário Teixeira
1,
Igor Silva Moreira dos Anjos
1,
Antônio Samuel Bacelar de Freitas Devesa
1,
Lucas Ramalho Oliveira
1,
Juliane Grasiela de Carvalho Gomes
1,
Leonardo Rafael Teixeira Cotrim Gomes
2,
Lucas Gomes Pereira
1,
Luiz Carlos Simões Soares Junior
2,
Germano Pinto Guedes
3,
Geydison Gonzaga Demetino
2,
Marcus Vinícius Santos da Silva
1,
Vitor Leão Filardi
4,
Vitor Pinheiro Ferreira
1,
André Luiz Andrade Simões
1,
Luciano Matos Queiroz
1 and
Iuri Muniz Pepe
1
1
Physics Institute, Federal University of Bahia, Salvador 40170-110, Brazil
2
Center of Exact and Technological Sciences, Federal University of Recôncavo of Bahia, Cruz das Almas 44380-000, Brazil
3
Physics Department, State University of Feira de Santana, Feira de Santana 44036-900, Brazil
4
Electronics Department, Federal Institute of Bahia, Salvador 40301-015, Brazil
*
Author to whom correspondence should be addressed.
Fluids 2025, 10(9), 223; https://doi.org/10.3390/fluids10090223
Submission received: 22 July 2025 / Revised: 16 August 2025 / Accepted: 21 August 2025 / Published: 26 August 2025
(This article belongs to the Section Turbulence)

Abstract

Cavitation has been widely explored to enhance physical and chemical processes across various applications. This study aimed to model the key characteristics of a cavitation jet, induced by a triangular-orifice nozzle, using both experimental and numerical methods. Optical instrumentation, a pressure transducer and the Reynolds-Averaged Navier–Stokes (RANS) equations were employed. Optical instrumentation and high-speed photography detected the two-phase flow generated by water vaporization, revealing a mean decay pattern. Irradiance fluctuations and photographic evidence provided results about the light transmission dynamics through cavitating jets. Pressure fluctuations exhibited similar growth and decay, supporting optical instrumentation as a viable method for assessing cavitation intensity. Experimental data showed a strong relationship between irradiance and flow rate (R2 = 0.998). This enabled the correlation of the standard deviation of instantaneous pressure measurements and normalized flow rate (R2 = 0.977). Furthermore, vapor volume fraction and normalized flow rate reached a correlation coefficient of 0.999. On the simulation side, the SSG-RSM turbulence mode showed better agreement with experimental data, with relative deviations ranging from 2.1% to 6.6%. The numerical results suggest that vapor jet length is related to vapor fraction through a power law, enabling the development of new equations. These results demonstrated that anisotropic turbulence modeling is essential to reproduce experimental observations compared to mean flow properties. Based on the agreement between the numerical model and the experimental data for mean flow quantities, a formulation is proposed to estimate the jet length originating from the nozzle, offering a predictive approach for cavitating jet behavior.

1. Introduction

Hydrodynamic cavitation, studied initially as a detrimental phenomenon affecting hydraulic structures, has increasingly been explored for beneficial applications, including water treatment disinfection [1], pipeline cleaning [2] and other industrial processes such as emulsification [3] and biodiesel production [4]. In this context, innovation is pivotal in developing devices capable of generating cavitation at intensities suitable for specific applications. These advancements are typically pursued through experimental and numerical approaches, enabling data collection and insights that can drive process optimization.
Several studies have investigated hydrodynamic cavitation using computational fluid dynamics (CFD) simulations, employing various modeling techniques to capture the underlying physics accurately. Dastane et al. [5] utilized two-phase flow simulations to analyze cavitation within a Venturi device. The mass transfer between the liquid and vapor phases was modeled using the cavitation approach proposed by Singhal et al. [6], while the discrete phase model was applied to predict cavity trajectories. Additionally, the Keller–Miksis equation [7] was employed to describe cavity dynamics, and turbulence was addressed using two-equation eddy viscosity models. The study demonstrated that single-phase simulations, although limited in predicting collapse intensity, can effectively reproduce the qualitative trends of multiphase models, providing a computationally efficient alternative for preliminary design assessments.
Simpson and Ranade [8] modeled hydrodynamic cavitation using the Shear Stress Turbulence (SST) κ-ω model within an orifice to investigate the influence of key geometric parameters, such as orifice thickness, hole inlet sharpness and wall angle, on the cavitation behavior. Their results offer valuable guidance for designers of hydrodynamic cavitation devices, enabling them to compare and evaluate different cavitation devices designs and operating parameters.
In similar vein, Li et al. (2024) [9] investigated the cavitation erosion characteristics of artificial jets using Scale-Adaptative Simulation (SBES) and the Zwarti–Gerber–Belamri (ZGB) model. Their study aimed to understand how the standoff distance affects the periodic distribution pattern of the cavitation cloud. Their findings indicated that an optimal standoff distance led to the generation of a greater number of cavitation clouds on the workpiece surface in numerical simulations, with the most pronounced erosion characteristics being confirmed in experiments. The authors attributed this behavior to the shear effect formed between the two jets, which plays a primary role in generating cavitation bubbles in artificially submerged jets. Moreover, they found that increasing the pressure of the high-pressure internal nozzle can enhance the cavitation effect.
Dutta et al. [10] conducted axisymmetric 2D Reynolds-Averaged Navier–Stokes (RANS) simulations to examine cavitation in a Venturi configuration. A two-phase mixture model was implemented in the RANS simulations, while the discrete phase model was incorporated to track the trajectories of cavitation bubbles. The study utilized the k-ω SST turbulence model and investigated the influence of different Venturi divergence angles and surface roughness on vapor generation. The authors further proposed and numerically assessed three design strategies to intensify cavitation, finding that a trumpet-shaped diverging section significantly increased vapor volume fraction, outperforming surface roughness and circular hurdle configurations.
Zhou et al. [11] investigated pressure fluctuations under cavitation conditions, characterized the unsteady internal flow features and analyzed the relationship between cavitation intensity and pressure oscillations. Using the re-normalization group (RNG) κ-ε turbulence model, they predicted the inlet pressure for cavitation development. Even more, they observed the point of strongest pressure fluctuation amplitude. These results provide valuable insights that enable more accurate prediction and understanding of the phenomenon.
Thus, Li et al. [12] investigated cavitation jet flow fields using three different turbulence models: RNG κ-ε, DES and LES. The findings indicate that the static pressure in the sections studied was below the saturation vapor pressure of water. The LES model demonstrated effective simulation capabilities for accurately representing the cavitating flow phenomena in an organ pipe nozzle. Furthermore, the LES model accurately replicated the evolution of vorticity, which exhibits a consistent pattern during the periodic formation of a cavitation cloud.
A comprehensive review by Hong et al. [13] examined various cavitation models employed in CFD simulations of cavitation reactors. Commonly used models include those by Singhal et al. [6], Schnerr–Sauer [14] and Zwart–Gerber–Belamri [15], mainly due to their availability in commercial CFD software (2021 R2 version). The authors emphasized the importance of selecting suitable turbulence and cavitation models, noting that commonly used two-equation RANS models may lack accuracy in simulating transient cavitation phenomena. They also reinforced the necessity of mesh sensitivity analysis and experimental validation for reliable predictions of vapor volume fractions.
Liu and Park [16] used the DeepCFD Model to predict transient cavitation flow around a hydrofoil. Their results showed that while the model accurately predicted cavitation shapes across different flow conditions, it exhibited a discrepancy in velocity predictions, particularly for detached cavitation flows. This study suggests that the selection of a model should be carefully considered based on the specific variables or results required, highlighting that a single model may not be optimal for all aspects of a complex flow phenomenon.
Polgár et al. [17] investigated shear stress distribution in hydrodynamic cavitation reactors through CFD simulations. The employed turbulence models were derived from the Favre-Averaged Navier–Stokes (FANS) equations, using the k-ε model, widely recognized for its efficiency in characterizing turbulent flows. Their study compared a Venturi-based reactor and an orifice-type reactor, validating their numerical results through experimental bacterial colony reduction tests. The authors showed that reactor geometry strongly influences shear stress distribution and bacterial inactivation, with the Venturi-based design outperforming the bore-type in both CFD and experimental results.
Jia et al. [18] analyzed the cavitation flow and vorticity transport in jet pump cavitation reactors using a filter-based density correction model (FBDCM), which validated the model with experimental tests. The study yielded results that provide guidance for the application of this reactor in water sterilization and disinfection. Specifically, the findings show that jet pump cavitation reactors with higher area ratios tend to have a higher-pressure recovery rate, making cavitation less likely to occur. A greater area ratio also extends the operating range by increasing the upper limit of the flow ratio. Furthermore, the efficiency of the reactor was found to increase initially with the flow ratio, peaking just before the onset of cavitation.
The research by Zhou et al. [19] focused on the pre-treatment of food waste via hydrodynamic cavitation, employing 2D axisymmetric CFD simulations. The Herschel–Bulkley model was implemented alongside RANS-based simulations to capture the rheology of non-Newtonian fluids. The study analyzed how variations in inlet pressure affected flow characteristics, viscosity, vapor volume and cavitation number. The results indicated that a pressure drop of ∆P ≥ 0.07 MPa is required to overcome viscosity-induced inhibition, enabling effective cavitation and enhancing vapor generation. Özgünoğlu [20] investigated cavitation-induced erosion in high-pressure fuel injectors through numerical simulations. The cavitation dynamics were simulated using a modified Zwart–Gerber–Belamri model with RANS and Large Eddy Simulation (LES) approaches. Additionally, an advanced erosion prediction model was employed to enhance the accuracy of cavitation erosion forecasts. The study introduced a unified erosion modeling framework and demonstrated that incorporating realistic surface deviations significantly alters cavitation patterns and erosion predictions in high-pressure fuel injectors.
Fang et al. [21] used Large Eddy Simulations (LESs) to explore the turbulent cavitation flow outside of an organ-pipe nozzle. The findings indicate that the dominant fluid frequency is positively correlated with the inlet pressure but is not related to the nozzle’s divergence angle. They found the best divergence angle for cavitation intensity and highest observed vorticity is 30°. Their analysis, which combined simulation with the Dynamic Mode Decomposition (DMD) method, revealed that the motion of the cavitation cloud is guided by the coherent vortex structure.
In Venturi tubes, Apte et al. [22] investigated the mechanisms of driving hydrodynamic cavitation tube using numerical simulations. They compared Detached Eddy Simulation (DES) and Shear Stress Turbulence (SST) κ-ω models. Their results showed that the DES models accurately replicated the mean cavity shape observed in experiments. In contrast, the URANS calculations produced an unrealistic “arrowhead” cavity shape. This is attributed to the re-entrant jet in the URANS simulation breaking the primary cavity much farther downstream than in the DES models. Thus, turbulence and vortex dynamics were tested, and given a vorticity budget, analysis of the cavitation–vortex interaction showed that both vortex stretching and vortex dilatation are crucial for vortex dynamics during a cavitating shedding cycle.
Guo et al. [23] investigated the geometrical parameters of a Venturi tube using the SST κ-ω turbulence model. Their findings indicated that the divergent angle, convergent angle and throat diameter are the three most important geometrical parameters for enhancing cavitation intensity. Consequently, they determined optimal angles to maximize the cavitation intensity.
These studies have emphasized the growing importance of numerical modeling in hydrodynamic cavitation research, particularly the need for robust CFD methodologies that accurately predict cavitation behavior in complex geometries. Although previous investigations have explored both experimental and numerical approaches for modeling hydrodynamic cavitation in conventional devices, further research is required to support the development of systems with innovative configurations, especially for applications related to molecular degradation and microorganism inactivation. The present work aims to experimentally and numerically analyze the average characteristics of cavitation generated by a triangular nozzle, employing optical detection with a phototransistor, a piezoelectric pressure transducer, and three-dimensional modeling based on Reynolds-Averaged Navier–Stokes (RANS) equations. The specific objectives are (1) to analyze the influence of turbulence anisotropy; (2) to investigate the complementarity between experimental measurements and numerical simulations through the correlation of physical variables; (3) to evaluate the correspondence between the regions of steam occurrence observed experimentally at the beginning of the nozzle and those calculated numerically.

2. Materials and Methods

2.1. Experimental Setup

The experimental apparatus consists of a water recirculation system, as illustrated in Figure 1a. A centrifugal pump controlled by a frequency inverter drives the recirculation, forcing water through a convergent–divergent tube or a transparent acrylic Venturi. Manometers were installed at the inlet and outlet of the Venturi tube to measure the head loss. As shown in Figure 1b, the Venturi tube was designed with a geometry that allows the coupling of nozzles with different shapes, enabling the study of the influence of nozzle geometry on cavitation generation.
Based on the findings of West et al. [24], which demonstrated that triangular nozzles yield higher turbulence intensities and lower Euler numbers, which corresponds to the lowest head loss for the highest mean velocity, this study selected the triangular geometry for both the experimental investigations and the numerical simulations.
Instrumentation included a piezoelectric pressure transducer connected to a data acquisition system mounted on the acrylic section. On the lateral face of the tube, a phototransistor and a white LED were positioned diametrically opposite to enable irradiance (Ir) measurements. An opaque enclosure made by additive manufacturing was installed around the optical path to reduce interference from ambient light and ensure consistency in optical readings, as shown in Figure 1b. The phototransistor operates within a range of 10 μW/cm2Ir ≤ 1 mW/cm2, with a maximum capacity, Irmax, equivalent to the measurement of a 100 W lamp at a distance of 50 cm. Opposite the phototransistor, the white LED provides a calibration reading of Ir = 0.4937 ± 0.0015 for single-phase water flow. Then, all irradiance measurements were normalized by Ir. The sampling rate and measuring duration were set to 200 Hz and 120 s following preliminary tests at lower frequencies. The experimental error is associated with the LED (0.1%) and the phototransistor (2.8%).
The system temperature was monitored using a thermometer and controlled by a water chiller.
The experiments were conducted at 23.7 ± 1.9 °C, with differential pressures between the Venturi inlet and outlet ranging from 2.9 to 25.4 mH2O, corresponding to frequency settings between 20 and 60 Hz on the frequency inverter. These conditions resulted in flow rates of 0.306, 0.389, 0.431, 0.528, 0.583, 0.625, 0.667, 0.722 and 0.778 L/s, with an associated uncertainty of 0.014 L/s. Thus, the flow rate was normalized by Q* = Q/Qmax. The pressure transducer was tested at sampling rates between 50 and 400 Hz over 180 s, yielding relative deviations of less than 1.2% for the mean pressure and 1.7% for the standard deviation of pressure. Based on these results, a sampling rate of 50 Hz was adopted for the measurements. The selected nozzle has a triangular orifice with a side length of 10.8 mm, an area of 50.51 mm2 and a hydraulic diameter of 6.24 mm, as illustrated in Figure 2a,b. Preliminary tests with this nozzle yielded a maximum uncertainty of 1.28 × 10⁻² mH2O for pressure measurements.
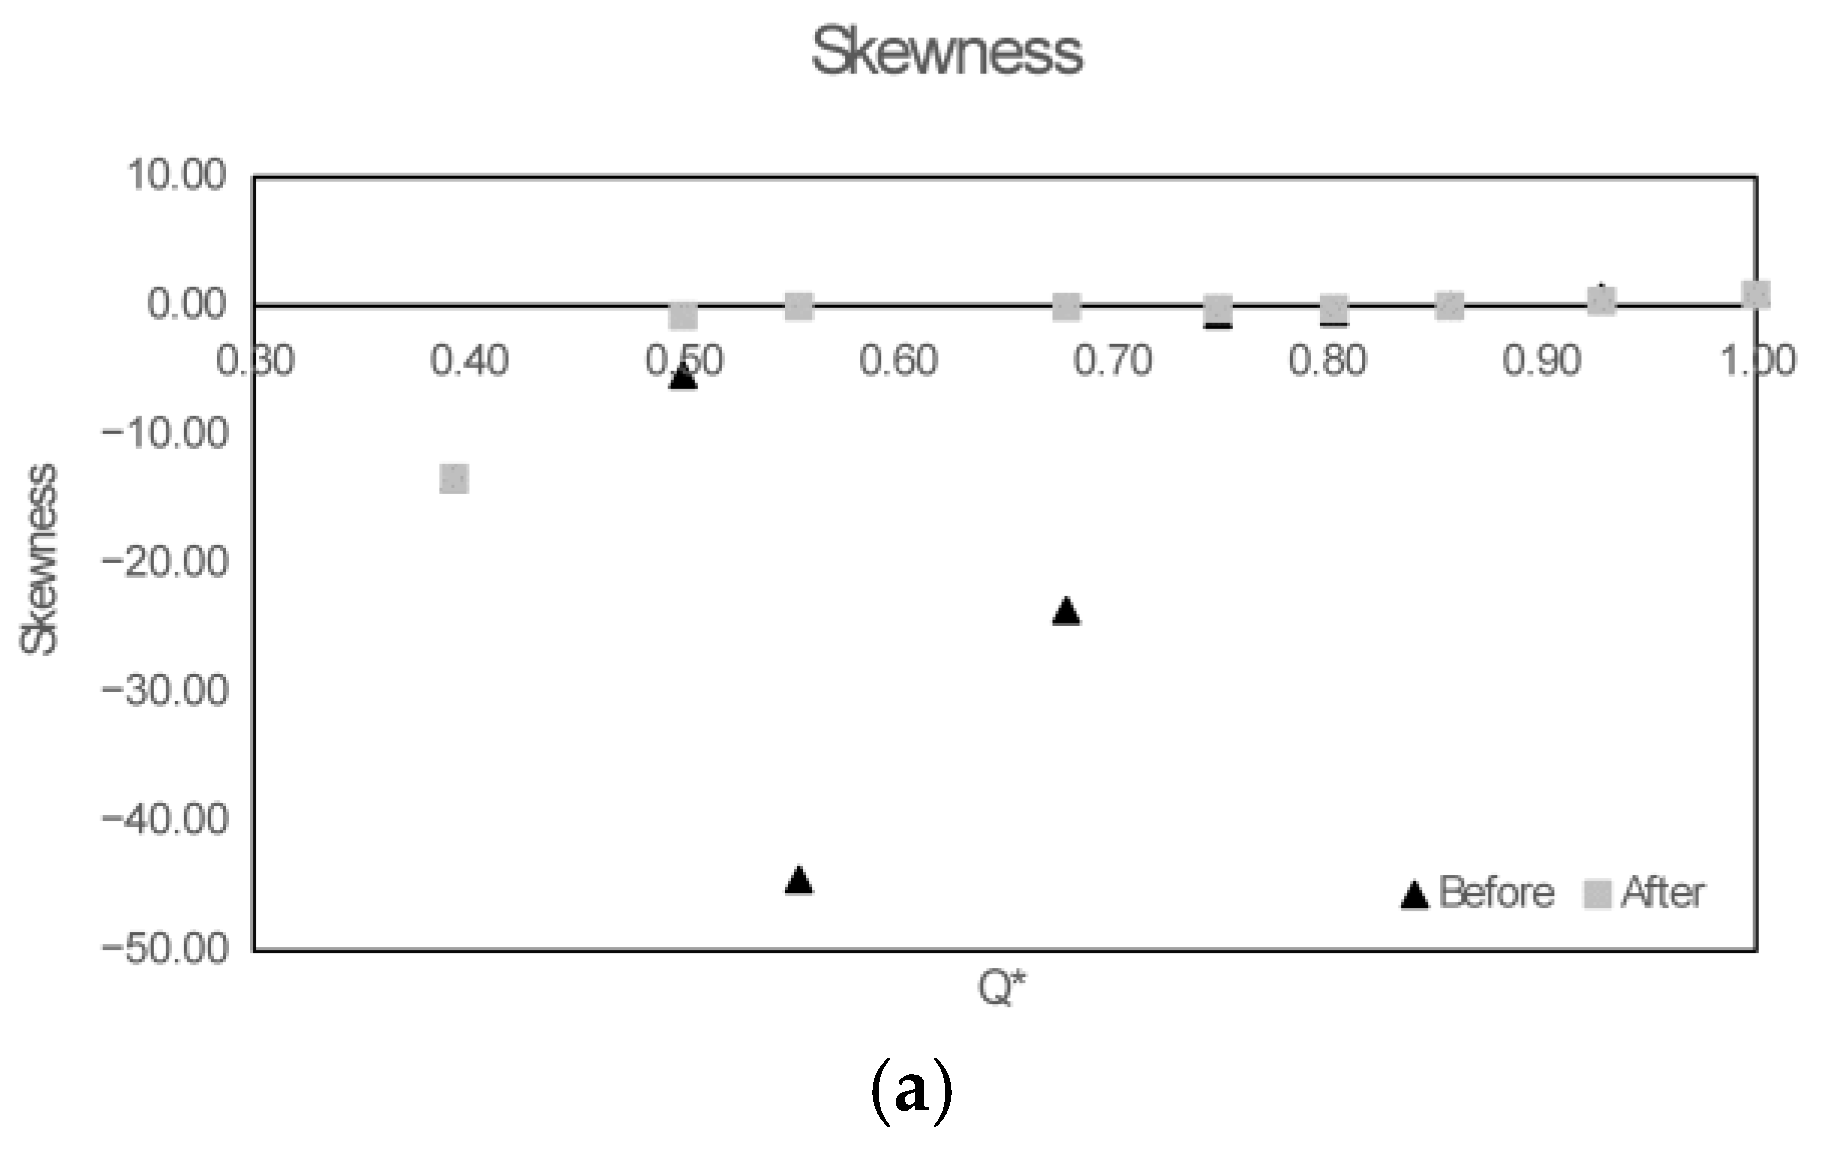
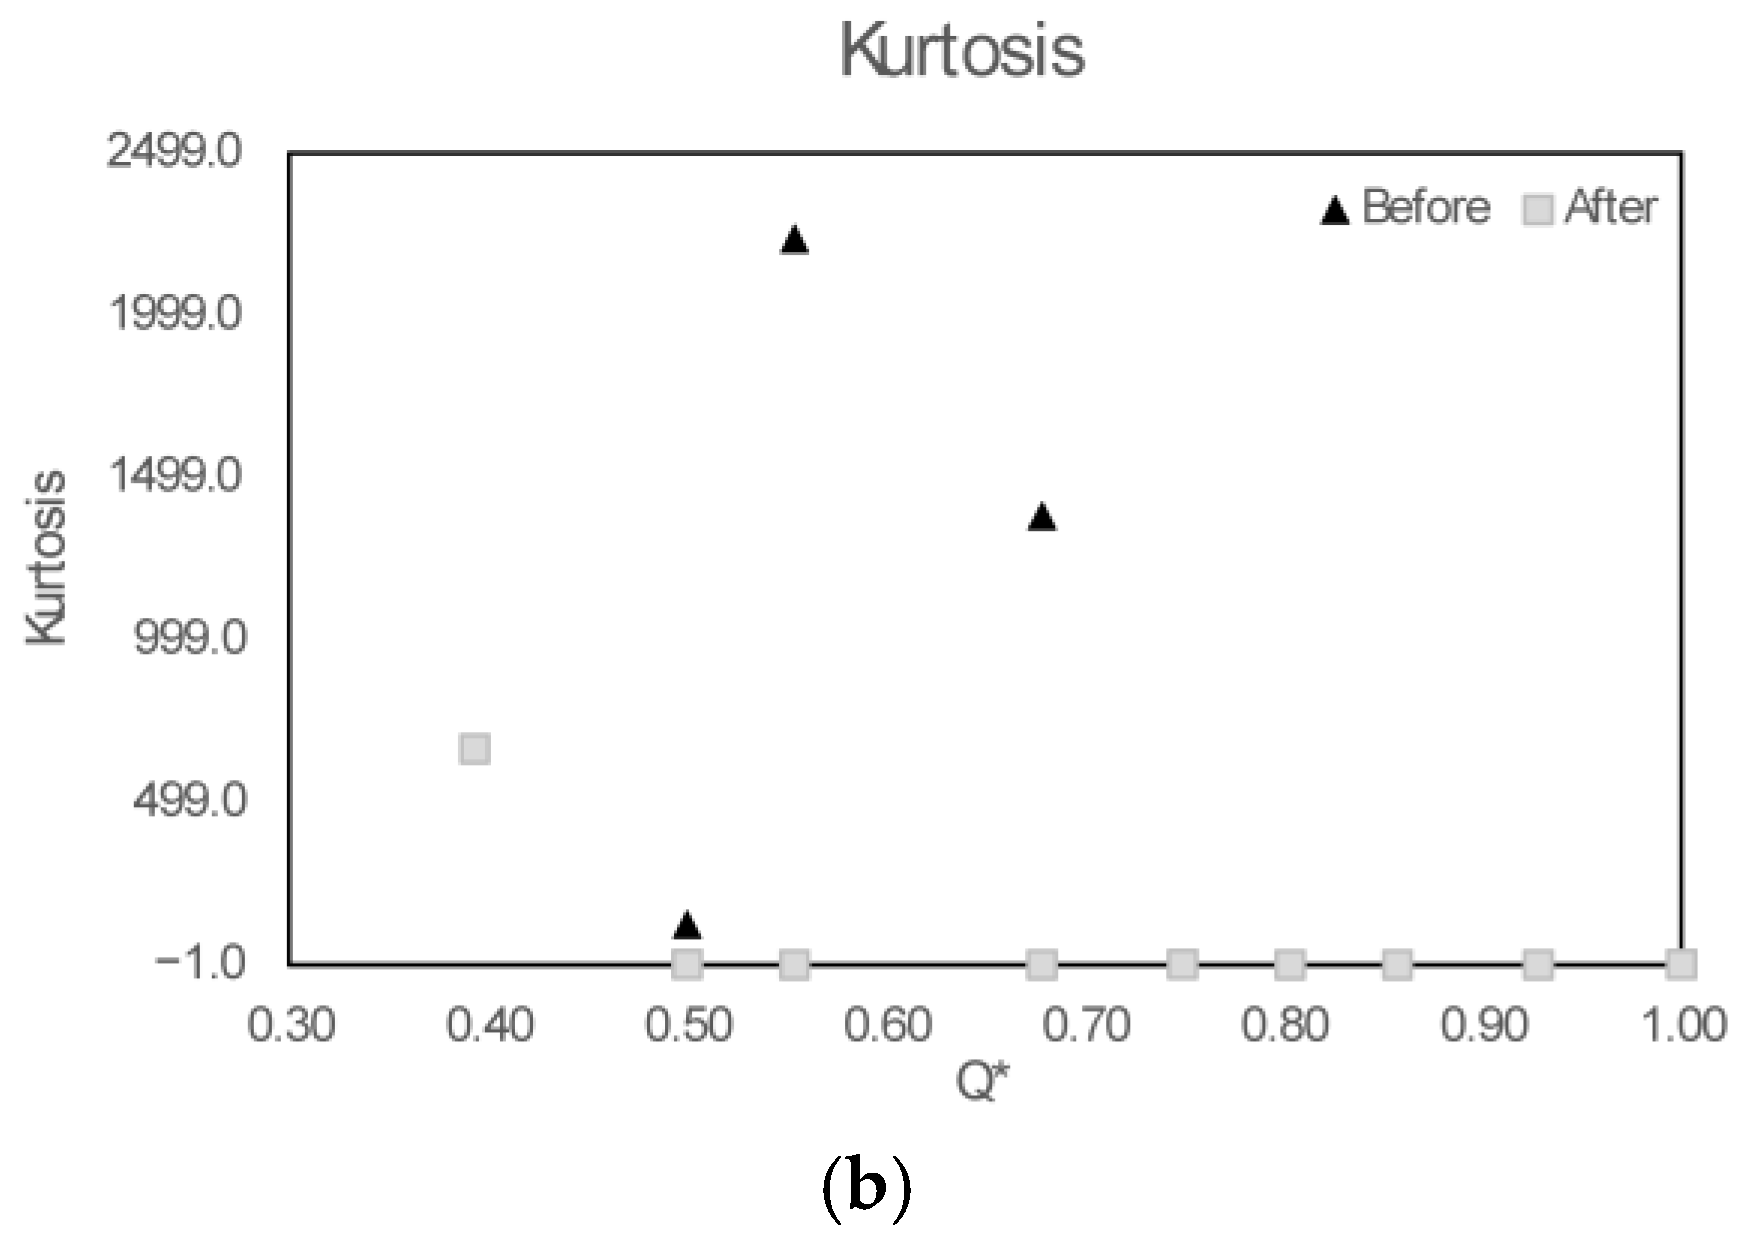
The experiments conducted with the optical measurement system generated 24,001 measurements of the irradiance per flow rate, resulting in 1,080,045 sampled points. As part of the methodology, outliers were removed using a criterion 1.2 times the interquartile range (IQR), excluding fewer than 3000 data points. This choice allowed for a more conservative approach to outlier removal, thereby retaining a larger portion of the original data while ensuring the exclusion of the most extreme values. Kurtosis and skewness comparison between data before and after outliers’ removal (Figure 3) shows the importance of remove outliers, mainly for initial flow rates that have interference of bubbles accumulated in pipes.
The experimental design produced 9000 data points per flow rate for the pressure measurements, totaling 405,000 sampled points, with no need for data rejection. Mean irradiance (Im) was calculated after removing outliers from the 24,000 data points. The mean and standard deviation of the irradiance were then determined and normalized by the maximum mean irradiance observed in non-cavitating flow (Q < 0.3 L/s).

2.2. Computational Fluid Dynamics

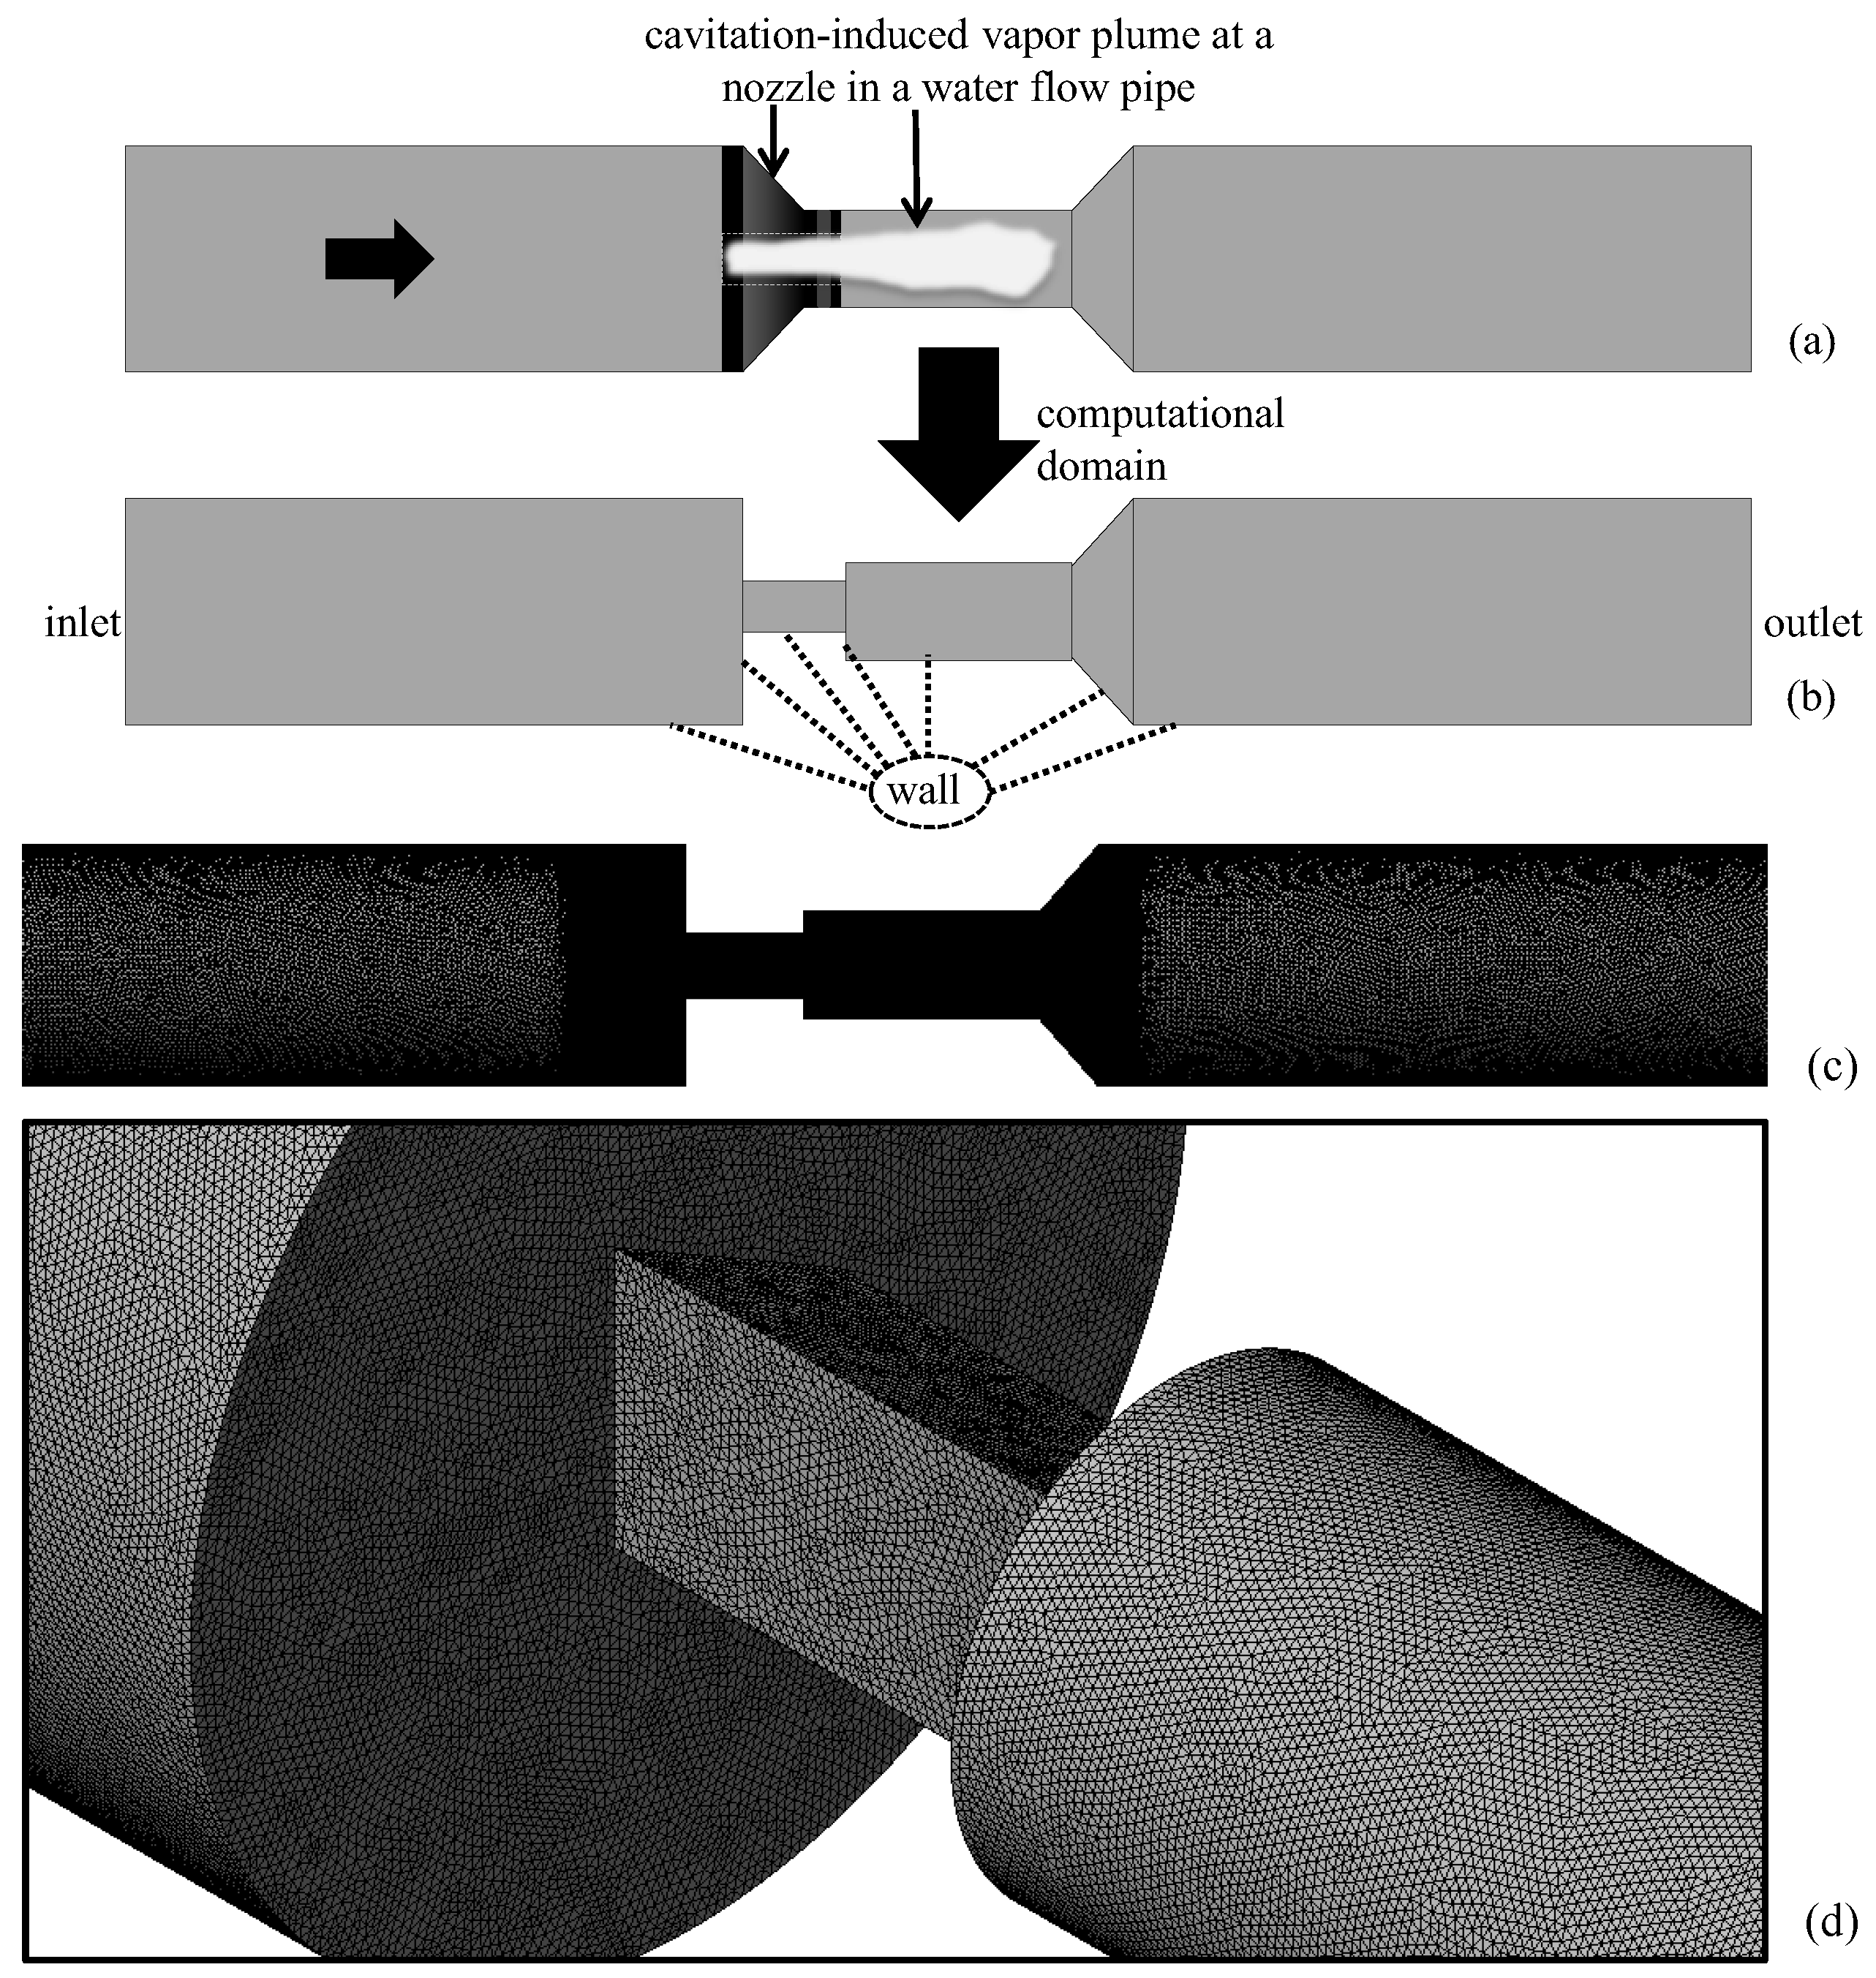
This study was conducted in a three-dimensional computational domain geometrically similar to the one investigated experimentally by West et al. [24], as shown in Figure 4a–d. The inlet boundary condition was defined with a static pressure inlet and outlet presented in Table 1 corresponds to the experimentally observed value, with a water volume fraction of 1.0 and a vapor volume fraction of 0.0.
The outlet was modeled as an open boundary for the liquid and vapor phases, with pressure and zero gradients for the liquid and vapor volume fractions. All other surfaces were subjected to a no-slip condition with a smooth wall. The working fluid in the simulations was water at 23.7 °C, consistent with the experimental conditions reported by West et al. [24].
In this context, the RANS (Reynolds-Averaged Navier–Stokes) approach offers a viable alternative for predicting cavitation and its mean characteristics in cavitating jets downstream of nozzles. The simulations were conducted under steady-state conditions, solving the Reynolds-Averaged Navier–Stokes (RANS) equations in the inhomogeneous multiphase model form. The turbulence models employed for comparison were formulated from a homogeneous perspective. The standard k-ε model and the Speziale–Sarkar–Gatski Reynolds Stress Model (SSG-RSM) [25] were selected among the available turbulence models.
Two turbulence models were used: k-ε and SSG-RSM. The SSG-RSM was chosen as the anisotropic model due to its expected performance for flows with strong deformation or curvature and its suitability for use in the current two-phase cavitation configuration with Scalable Wall Functions. This pairing isolates the effect of turbulence anisotropy, enabling the analysis of its effect on the solution of the multiphase cavitation problem.
The SSG-RSM is an advanced second-order turbulence model that directly solves the transport equations for the Reynolds stress tensor, allowing for accurate predictions of flow anisotropy, streamline curvature, and flow separation. In contrast, the two-equation k-ε model [26] is widely used due to its computational efficiency and robustness across a broad range of turbulent flows. However, while the k-ε model provides reasonable approximations in many engineering applications, it struggles in highly anisotropic and recirculating flows, where models such as SSG-RSM offer improved predictive capabilities [27].
Since the flow is biphasic, comprising both liquid and vapor phases, the Eulerian–Eulerian inhomogeneous multiphase model [28,29] implemented in ANSYS CFX 2021 R2 version was employed. The key feature of this model is that the two phases share only the pressure field, which generally results in sharper phase interfaces compared to homogeneous models. This characteristic is particularly desirable for accurately identifying the interface of the vapor jet. The mathematical framework of the model consists of the mass conservation equation (Equation (1)) and the Navier–Stokes equation (Equation (2)), both rewritten for each phase α. Cavitation was modeled by coupling the multiphase model with the Rayleigh–Plesset equation (Equation (3)) [30], which governs the temporal evolution of the bubble radius, R. In this framework, interfacial mass and momentum transfers occur, requiring an appropriate calculation of the interfacial area. For this purpose, the mixture model was adopted to compute the interfacial area density per unit volume, as defined by Equation (4) [31]. This formulation provides a consistent method for estimating the interaction between the liquid and vapor phases, ensuring a more accurate representation of cavitation dynamics in computational simulations.
t r α ρ α + · r α ρ α U α = S α + β = 1 N p Γ α β
t r α ρ α U α + · r α ρ α U α U α = r α p + · r α μ α U α + U α T + + β = 1 N p Γ α β + U β Γ β α + U α + S M α + M α
The (absolute) vapor pressure was adopted as 3137.92 Pa, corresponding to the temperature of the experiments. The average diameter of the bubbles at the nucleation site was 10−5 m.
R R ¨ + 3 2 R ˙ 2 = p B p ρ 2 σ ρ R 4 ν R R ˙
A α β = r α r β d α β
in which rα = volumetric fraction of phase α; ρα = mass density of the fluid composing phase α; Uα = velocity field of phase α; Sα is a mass source term; Γαβ corresponds to the temporal rate of change of mass per unit volume, resulting from mass flow between phases; Np = total number of phases; p = pressure field; μα is the dynamic viscosity (when interpreted without turbulence modeling, or the sum of this with turbulent viscosity for turbulence modeling condition); S is a source term representing external field forces and sources and sinks defined for specific problems; Mα corresponds to interfacial forces acting on phase α due to the presence of other phases; the term Γ α β + U β Γ β α + U α models the transfer of momentum between phases due to mass transfer between phases. In the Rayleigh–Plesset equation, R = radius of the bubble, pB = pressure inside the bubble, p = pressure far from the bubble, σ = surface tension, ρ = specific mass of the liquid, ν = kinematic viscosity of the liquid phase and Aαβ = interfacial area density.

2.3. Numerical Setup

Steady RANS simulations were performed in ANSYS CFX using Scalable Wall Functions [32,33]. At the highest-flow condition, the near-wall metrics were k-ε, mean y+ = 12.3 and max y+ = 105; SSG-RSM, mean y+ = 15.1 and max y+ = 92.3. The solver used the pseudo-transient method with Auto Time Scale (length-scale option: Conservative; time-scale factor: 1.0). Convergence was declared when all residuals were ≤1 × 10⁻⁴ and monitored integral quantities reached a flat trend; iteration counts therefore varied by operating point. High Resolution (bounded second-order) was used for advection and for the turbulence equations. The domain was initialized automatically.

2.4. Mesh and Quality Assessment

An unstructured polyhedral/tetrahedral grid, comprising approximately 12 million elements, was generated to discretize the computational domain. A global mesh size of 1.0 mm was used, with local refinement applied to the central region (±20 mm upstream and downstream of the throat) where cavitation forms and evolves. Following a mesh sensitivity study involving maximum local mesh sizes of 0.60 mm, 0.50 mm and 0.40 mm, a refinement size of 0.40 mm was selected. This choice ensured that relative differences in key monitored quantities (mass flow rates and jet length, L0.001) were maintained below 3%.
The mesh quality was rigorously assessed using standard metrics. Histograms of the mesh-metrics revealed the following characteristics: Equiangle skewness: The distribution was strongly left-skewed with a mode of approximately 0.13. Over 95% of cells had a skewness below 0.38, and more than 99% were below 0.50. Orthogonal quality: the grid exhibited high orthogonal quality, with nearly all cells (>99%) having a value greater than 0.63. Aspect ratio: The aspect ratio showed a dominant peak at approximately 1.93. Over 95% of cells had an aspect ratio of less than 3, with only rare outliers extending to ~16.

2.5. Grid Independence Study

To confirm the independence of the simulation results from the mesh resolution, a grid convergence analysis was performed using the Grid Convergence Index (GCI) method, as described by Roache [34]. This study employed three successively refined grids with a constant refinement ratio (j) of 1.11. The characteristic grid dimensions, calculated as (volume/number of elements)1/3, were 0.43 mm (Grid 1), 0.40 mm (Grid 2) and 0.35 mm (Grid 3).
The convergence was monitored for two key variables: the inlet/outlet mass flow rates and the steam jet length (L0.001). The GCI analysis involved comparing the ratio of consecutive GCIs (GCI23/GCI12) with the theoretical value of jp, where p is the estimated order of convergence.
For the κ-ε turbulence model, the GCI ratios for the minimum flow rates (0.577 ≈ 0.569 for the inlet and 0.28 ≈ 0.27 for the outlet) were in close agreement with the theoretical value. For the maximum flow rates, the ratios were 0.405 ≈ 0.405 and 10.74 ≈ 10.68, with the observed deviations attributed to the inherent oscillations in the mean turbulent flow. For the jet length, the ratio was 4.1 ≈ 3.9, and the relative error between the two finest grids was 2.97%.
For the SSG turbulence model, the GCI ratios for the minimum flow rates (3.09 ≈ 3.11 for the inlet and 0.80 ≈ 0.81 for the outlet) also showed excellent agreement. For the maximum flow rates, the ratios were 0.168 ≈ 0.168 and 0.57 ≠ 0.89, a deviation considered to be a result of similar turbulent fluctuations. The jet length ratio was 0.233 ≈ 0.236, with a relative error of 1.49% between the two finest grids. These results confirm that the used grids are sufficiently refined for this study and that the numerical solution has achieved adequate convergence.

3. Results and Discussion

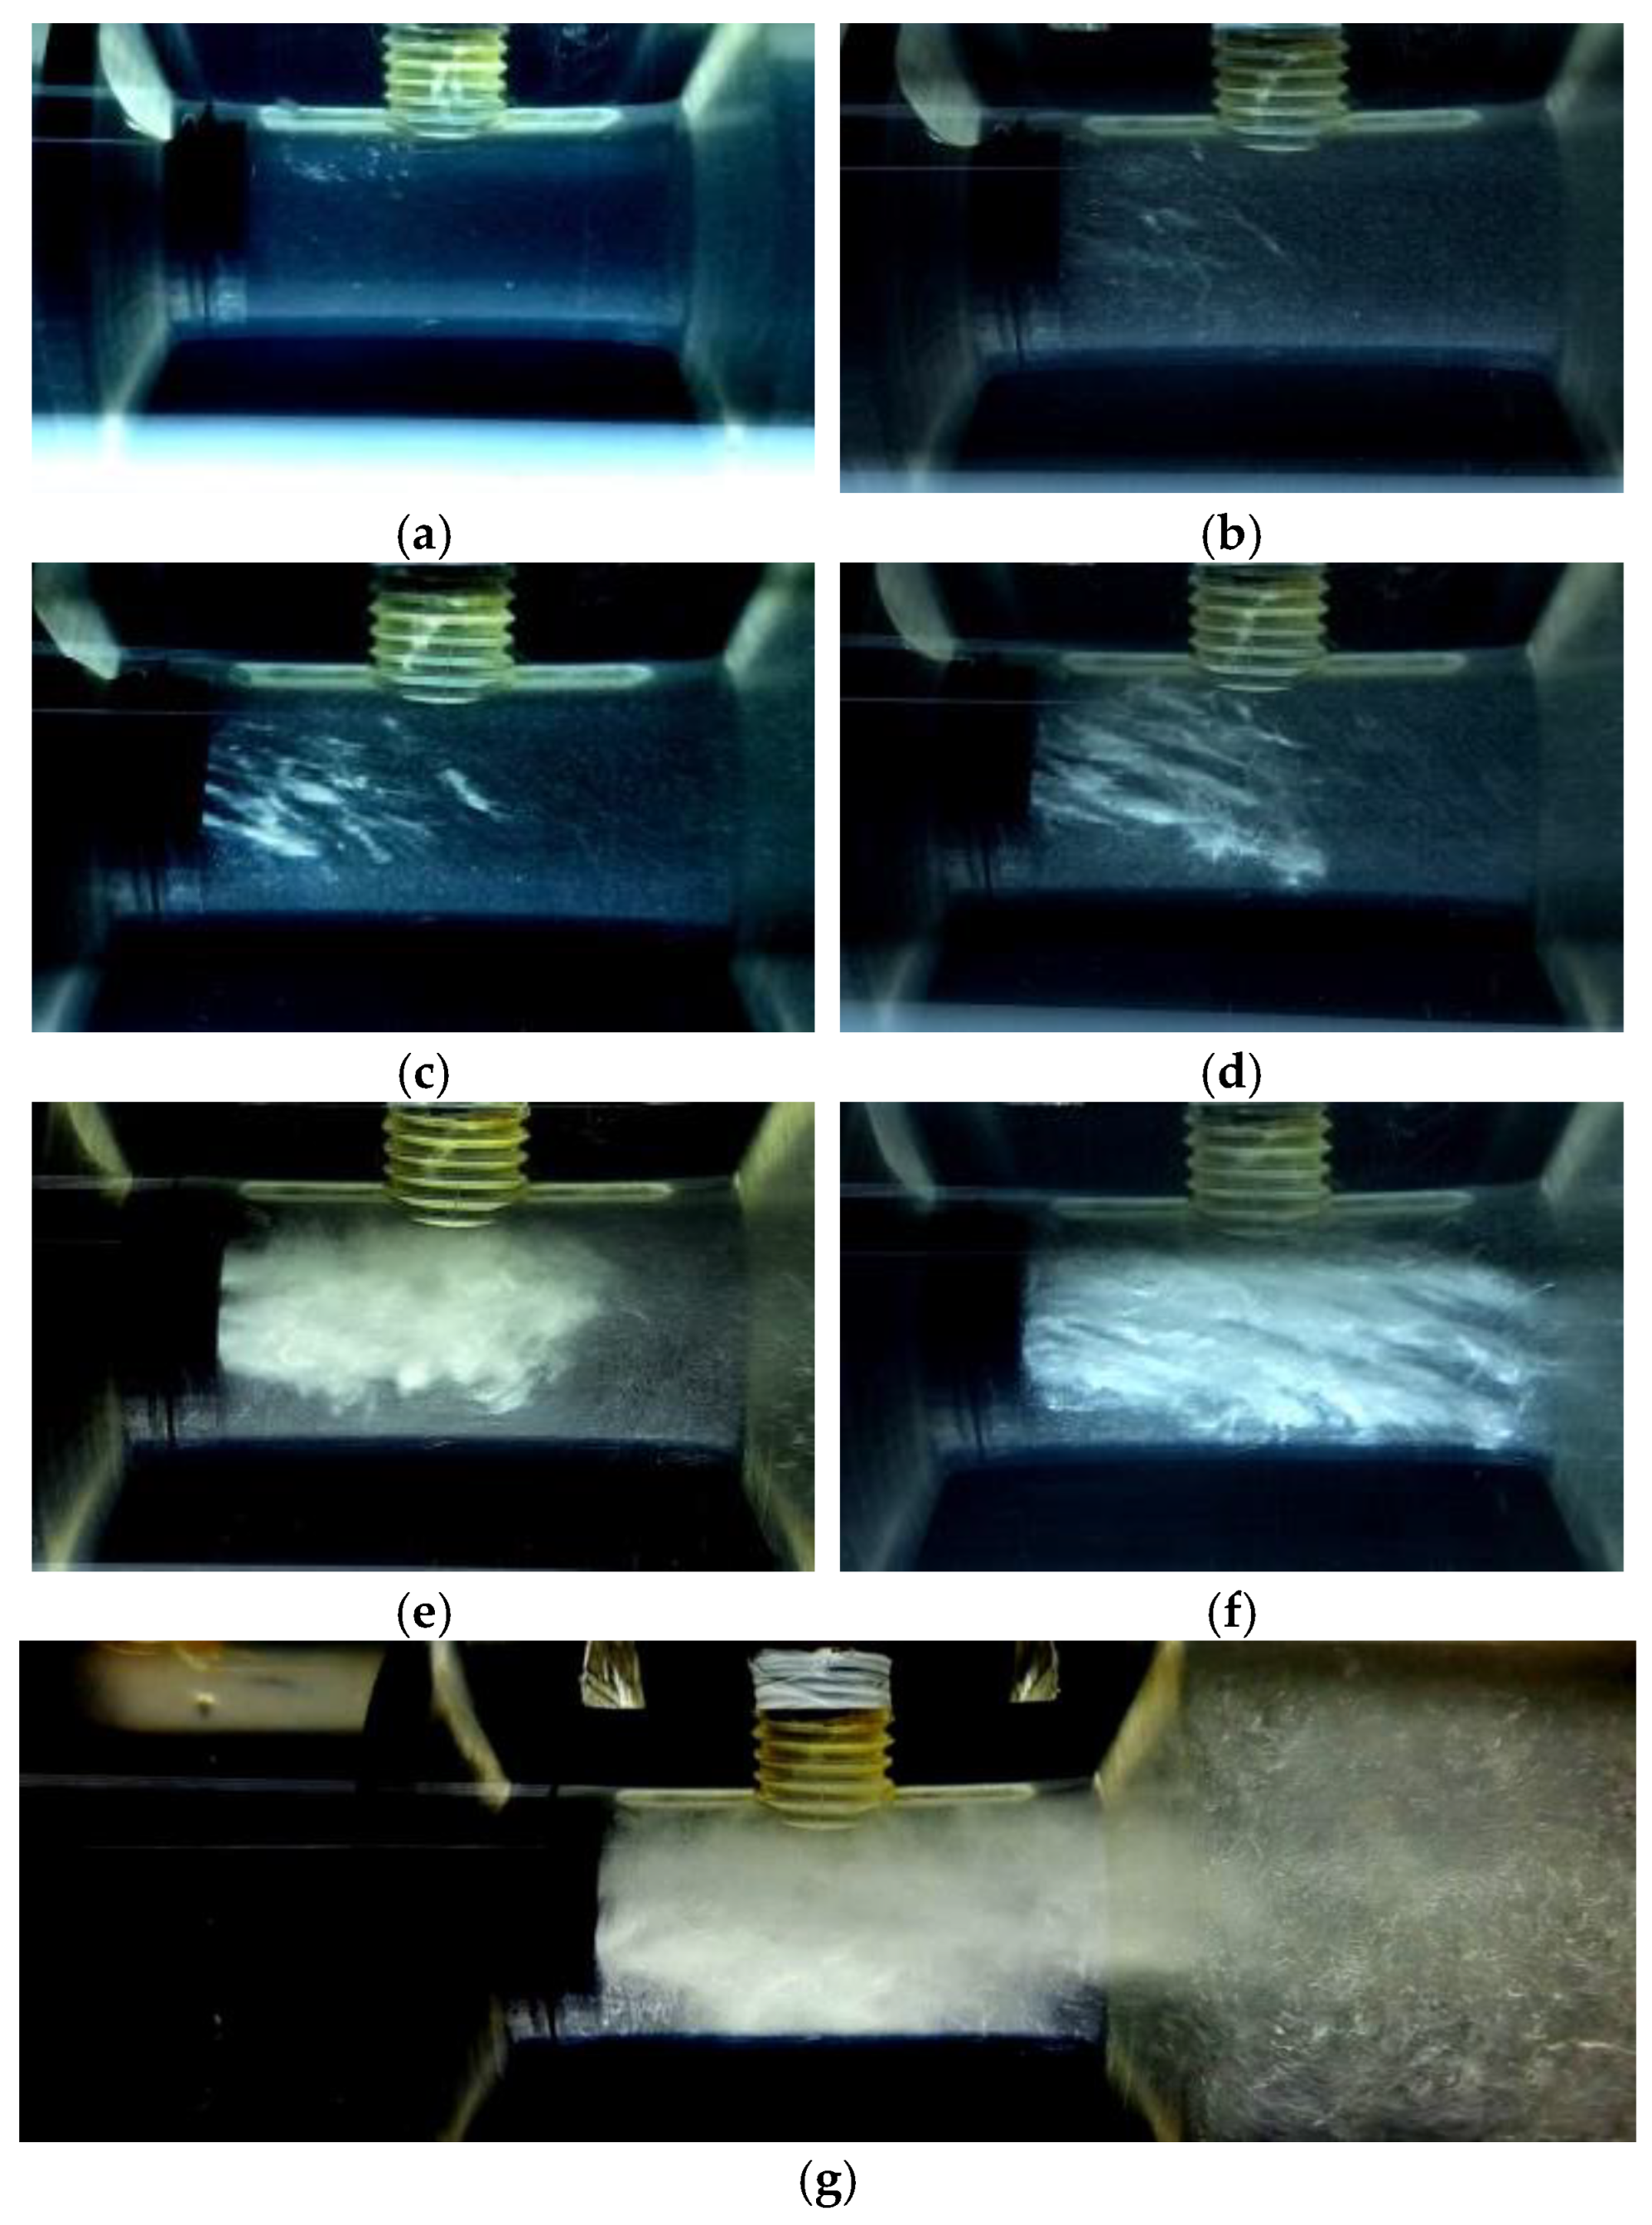
The photographs presented in Figure 5 were captured using a shutter speed of 1/6000 s and represent images of the flow downstream of the triangular nozzle. As observed, there is a precise formation of bubble-laden jets downstream of the triangular nozzle for Q* > 0.80 (Figure 5c–f). The initially transparent appearance of the water is progressively replaced as the mean bubble population increases, leading to a more visually distinct cavitating region. For lower flow rates, chaotic bubble motion within the liquid phase is evident, which can be analyzed through high-speed imaging and slow-motion recordings. At higher flow rates, the increased bubble density results in an opaquer two-phase mixture, restricting the random motion of bubbles compared to lower flow conditions. This transition suggests that, at higher cavitation intensities, the interaction between vapor structures and the surrounding liquid phase becomes more constrained, altering the overall flow characteristics. The jet can reach lengths that extend beyond the Venturi throat, as shown in Figure 5g.
Virtually, no vapor bubble formation is observed for the three lowest flow rates. Sporadic bubble formation becomes noticeable starting from the fourth flow rate, with bubbles appearing chaotically and convecting downstream of the nozzle, randomly distributed throughout the flow, as shown in Figure 5a. At the fifth flow rate (Figure 5b), a more significant number of bubbles is observed, and this trend intensifies with increasing flow rate, eventually reaching a high bubble density condition at the maximum flow rate, as illustrated in Figure 5f. As a result, the mean irradiance decreases with increasing flow rate due to the reduction in white light transmission (Figure 6a). This behavior was previously described by West et al. [24] and modeled using Equation (5), which, when fitted to the data from the present study, yielded a correlation coefficient of 0.998. The residuals, shown in Figure 6c, exhibit a well-distributed pattern, indicating a strong agreement between the model and the experimental data.
I m = [ 0.0217 + t a n h ( 1.67 Q * 2.14 ) ] 32.5
The standard deviation of irradiance increases with the growing number of bubbles due to enhanced light scattering compared to the single-phase condition. From a wave optics perspective, the transmitted light undergoes interference due to its interaction with the vapor bubble surfaces. This is compounded by the light’s passage through the bubbles, which are less refractive than the surrounding water. Combined with the chaotic motion of the bubble swarm, this results in a measurement of turbulent intensity, as demonstrated by West et al. [24].
This trend continues until it reaches a maximum, after which it decreases as the bubble density increases further, leading to a more uniform optical signal passing through the dense vapor region. This behavior, observed experimentally and quantified through the standard deviation of irradiance, was successfully fitted using a Gaussian function (Equation (6a)), yielding a correlation coefficient 0.990 between the experimental and calculated data. The residuals, shown in Figure 6d, confirm the agreement between the Gaussian model and the experimental observations. The standard deviation of the instantaneous pressure measurements obtained from the pressure transducer exhibited a similar trend, with an initial increase followed by a subsequent decrease. This behavior was modeled using Equation (6b), which yielded a correlation coefficient of 0.977, with the data distribution shown in Figure 6e,f.
D P I = 0.034   e x p   [ Q * 0.785 2 0.0141 ]
D P p = 1.06   exp   Q * 0.898 2 0.0114 + 0.16
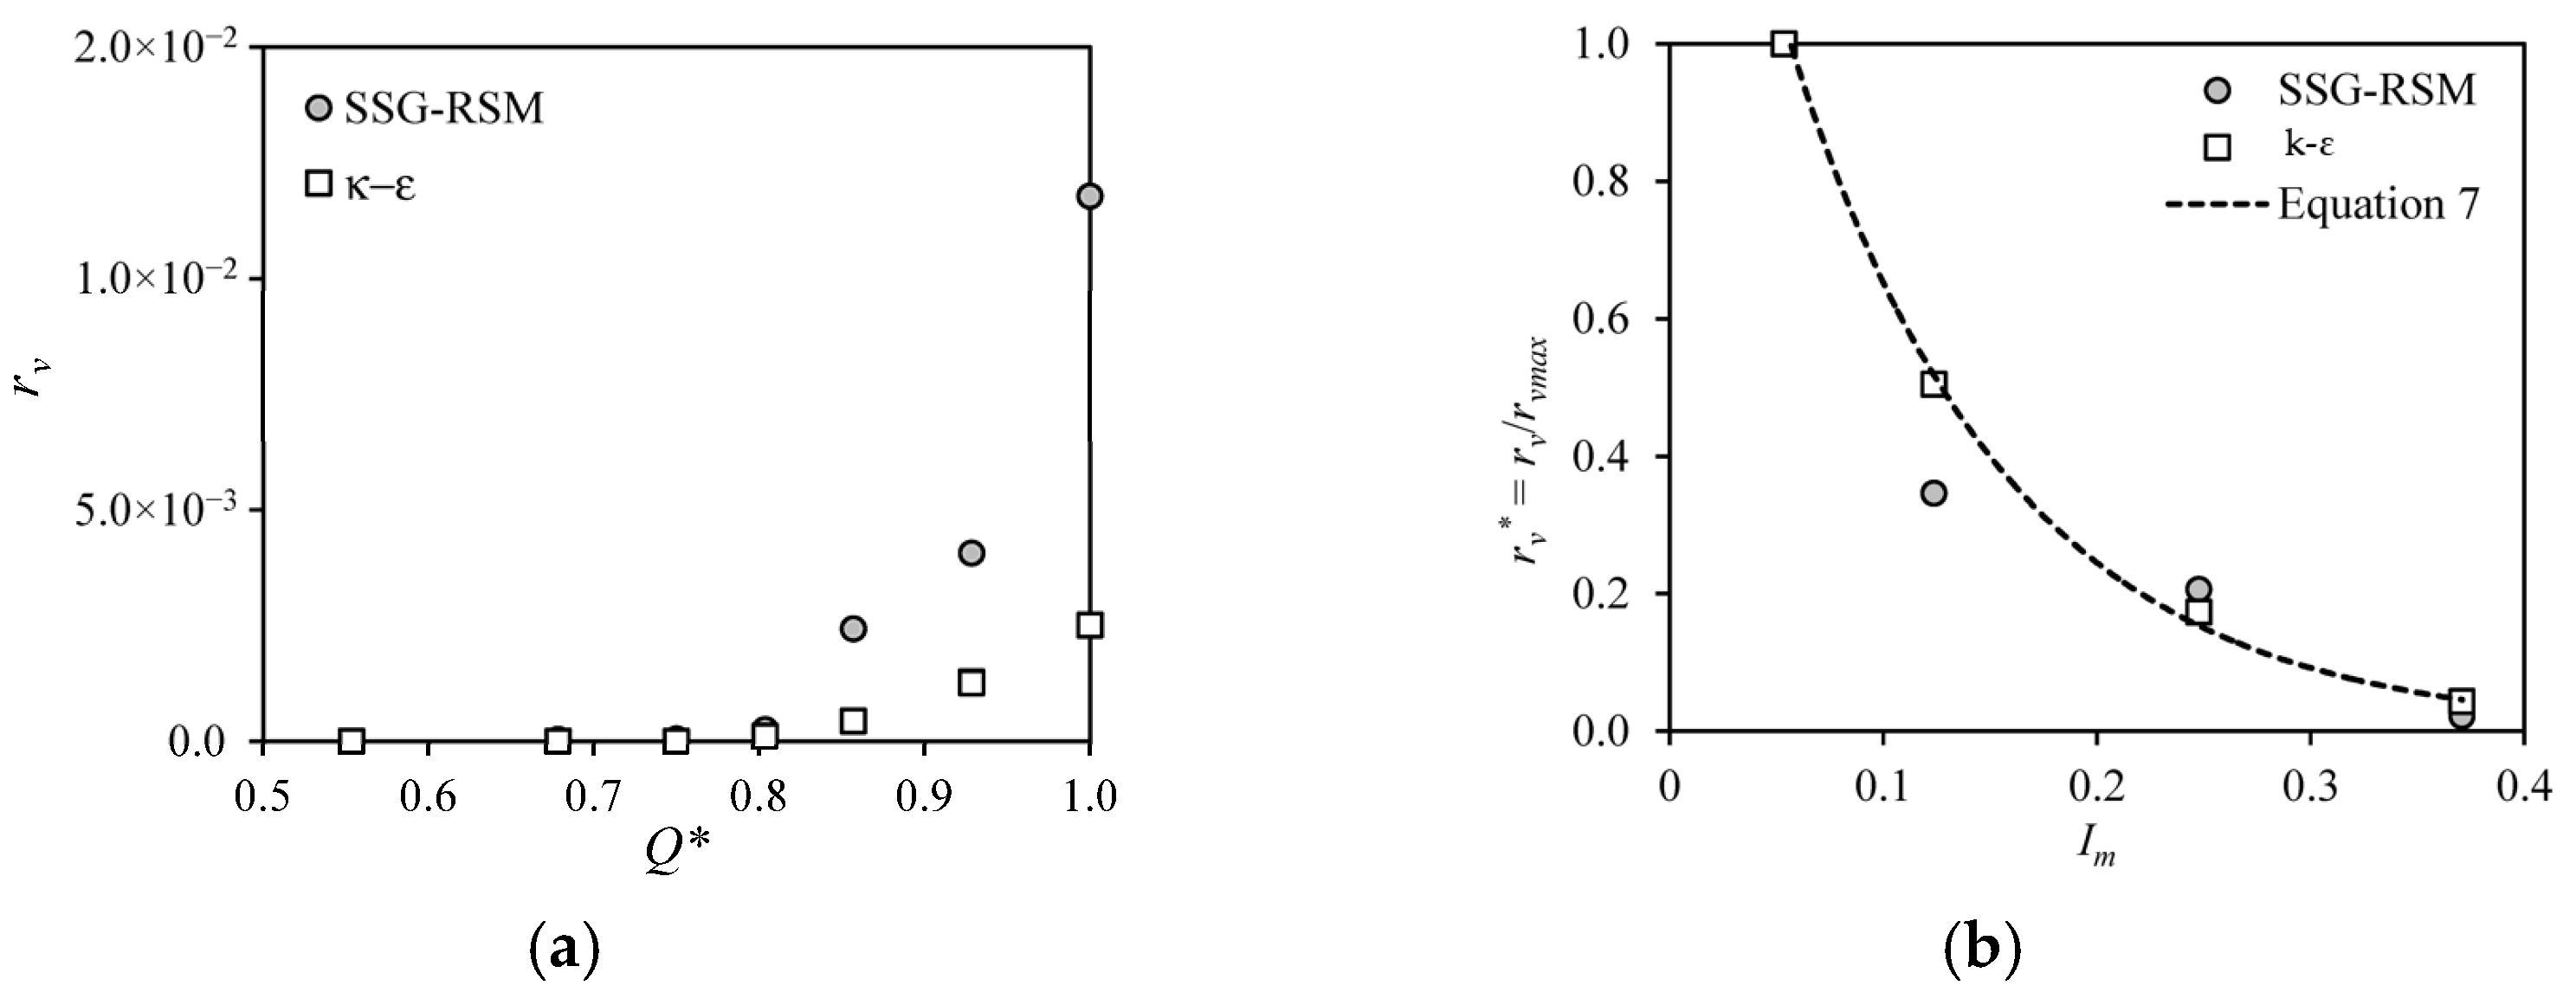
The mean values of the vapor volume fraction (rv) were computed at the central position of the Venturi throat, where irradiance measurements were taken using the phototransistor. rvmax is the maximum vapor fraction calculated in simulations, acquired in the maximum normalized flow rate. A strong correlation between rv and Q* was observed, as shown in Figure 7a. It was noted that higher flow rates correspond to higher vapor fractions, consistent with experimental observations and the photographs presented in Figure 5. The normalized vapor fraction, denoted as rv∗, exhibited a strong correlation with Im, following an exponential model expressed by Equation (7), with a correlation coefficient of 0.999, indicating excellent agreement with the experimental data, as illustrated in Figure 6b.
r v * = 1.74   e x p   [ 9.80 I m ]
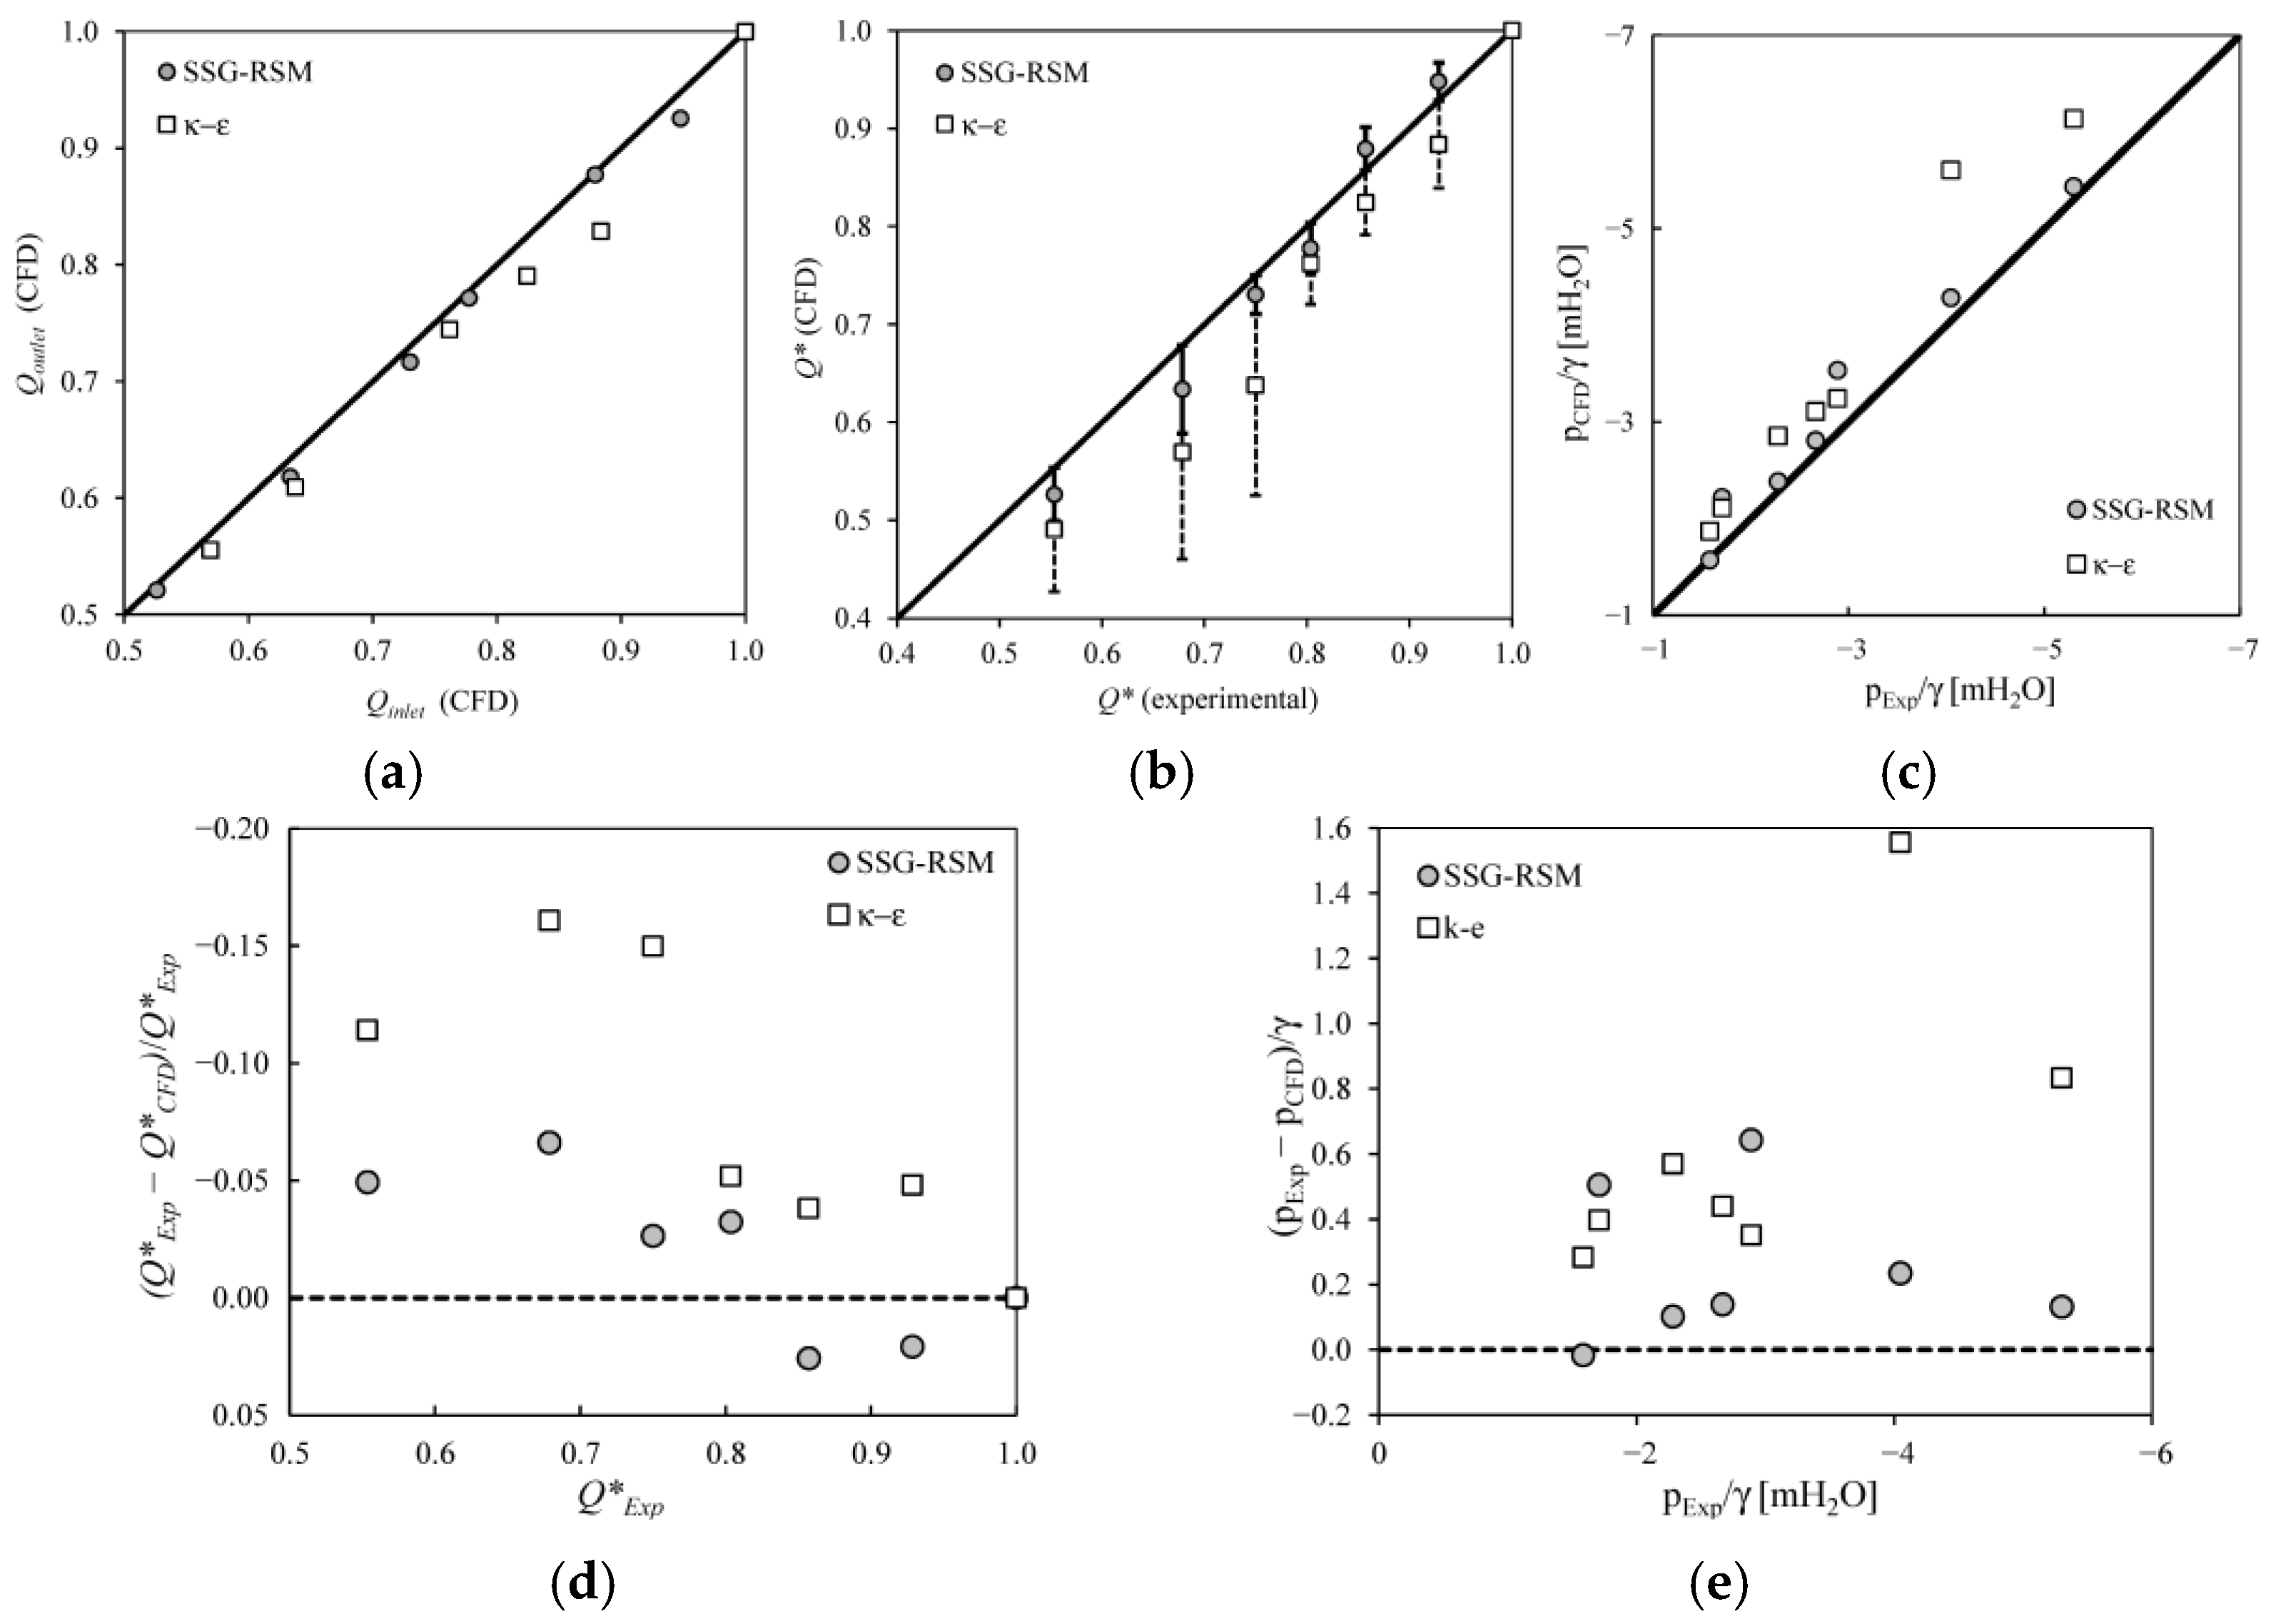
The simulations performed using the k-ε and SSG-RSM turbulence models converged in terms of inlet and outlet flow rates, with a maximum relative difference of 4.3% for the k-ε model, as shown in Figure 7a. Figure 6b compares the numerically computed flow rates and the experimentally measured values, normalized by their respective maximum values. The error bars were calculated as the difference between the identity line and the numerical value, for up and down sides. The results obtained with the SSG-RSM turbulence model showed better agreement with the experimental data, with relative deviations ranging from 2.1% to 6.6%. In contrast, the k-ε model exhibited more significant relative deviations, varying between 3.8% and 16%.
Figure 8c presents the mean pressure values obtained experimentally alongside those computed using the turbulence modeling approach proposed in this study. The SSG-RSM model yielded results closer to the experimental data than those obtained using the k-ε model. Among the seven analyzed points, five exhibited relative deviations below 5.8% for the SSG-RSM model, while two points showed higher deviations of 22% and 28%. In contrast, when using the k-ε model, deviations ranged between 15.7% and 38.4% for mean pressure. In the same way, Polgár et al. [17] compared simulated data with the k-ε model and the experimental data from rotational cavitation device, finding relative errors between 3% and 57%. Furthermore, the results obtained with the k-ε model showed a systematic deviation for Q* and mean pressure (see Figure 8d,e), while the SSG-RSM predictions were distributed around or closer to the exact-fit reference line. These findings support this study’s initial hypothesis regarding the need for anisotropic turbulence modeling due to the asymmetries introduced by cavitation. Consequently, all subsequent numerical evaluations in this work were conducted using the SSG-RSM model.
Murthy and Joshi [34] compared several turbulence models against experimental data including RMS using SSG to model the pressure–strain term, standard κ-ε model and LES. In their discussion, they concluded that the RSM performed better than κ-ε during comparison with a disc turbine, especially when recirculation was present.
Similarly, Lee et al. [35] found that SSG models are in better agreement with the experimental data and predict the anisotropy of turbulent structures better than the standard κ-ε model.
The velocity and pressure fields calculated using the adopted turbulence models are shown in Figure 9 for the minimum and maximum flow rates. It is noted that the velocities calculated with the κ-ε model were lower compared to the results obtained with the SSG model, which also resulted in an underestimation of the flow rates, as shown in Figure 9b. It is also observed that the κ-ε model produced a more symmetric velocity field in the region of the jet originating from the triangular nozzle, whereas the SSG model produced less symmetric mean jets. This asymmetry was also observed experimentally via stroboscopic illumination, which demonstrated the occurrence of similar oscillations in the vapor bubble jet. The pressure fields showed greater discrepancies between the models for the lower flow rate, with the results converging at the maximum flow rate. Despite this, the symmetric pattern calculated by the κ-ε model is clearly visible, in contrast to the SSG model.
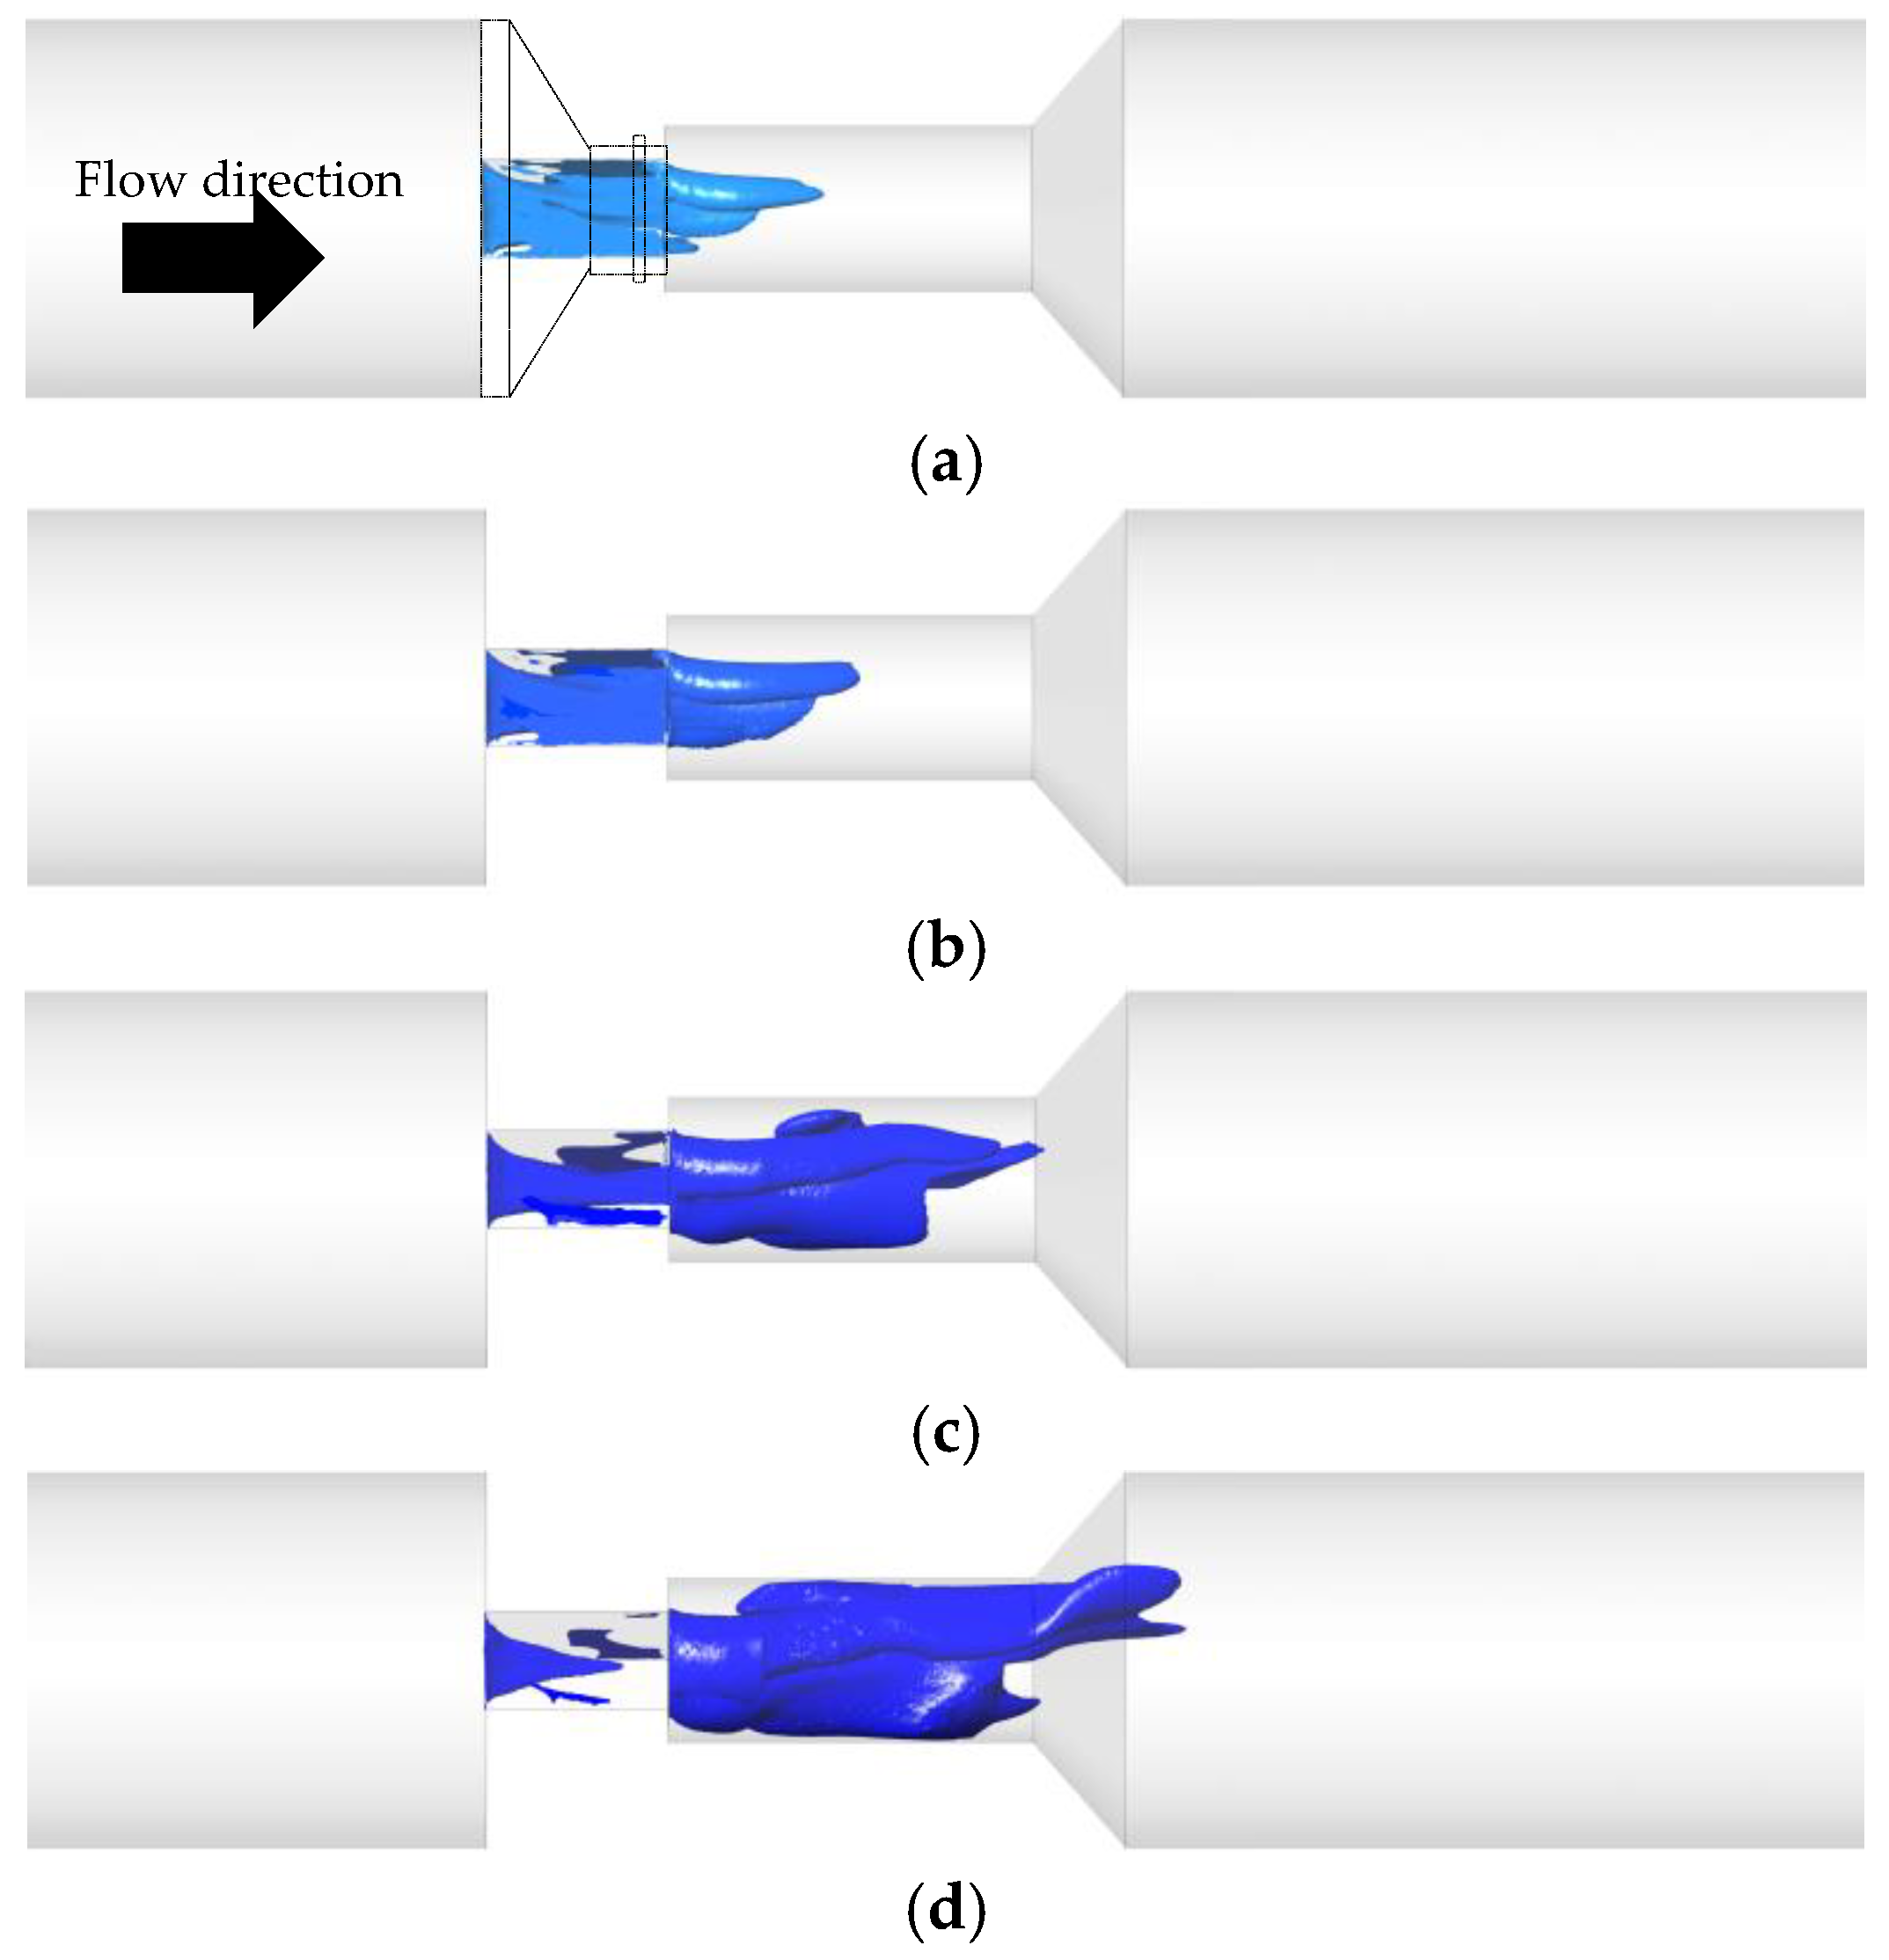
The vapor jet length, L, measured from the nozzle inlet, was nondimensionalized using the triangle side length, l, resulting in the dimensionless parameter L* = L/l. Each vapor jet was computed based on the isosurface corresponding to a vapor volume fraction, rv, of 0.10, 0.05, 0.01 and 0.001. Figure 10a, obtained for Q* = 1.0, shows that for rv = 0.10, the vapor jet extends beyond the nozzle length, reaching the Venturi throat region. For rv = 0.001, the corresponding jet extends further downstream of the Venturi, indicating the occurrence of advective pulses that give the jet an even greater average range, although for a smaller volume fraction. This behavior could be observed experimentally, as presented in Figure 5g.
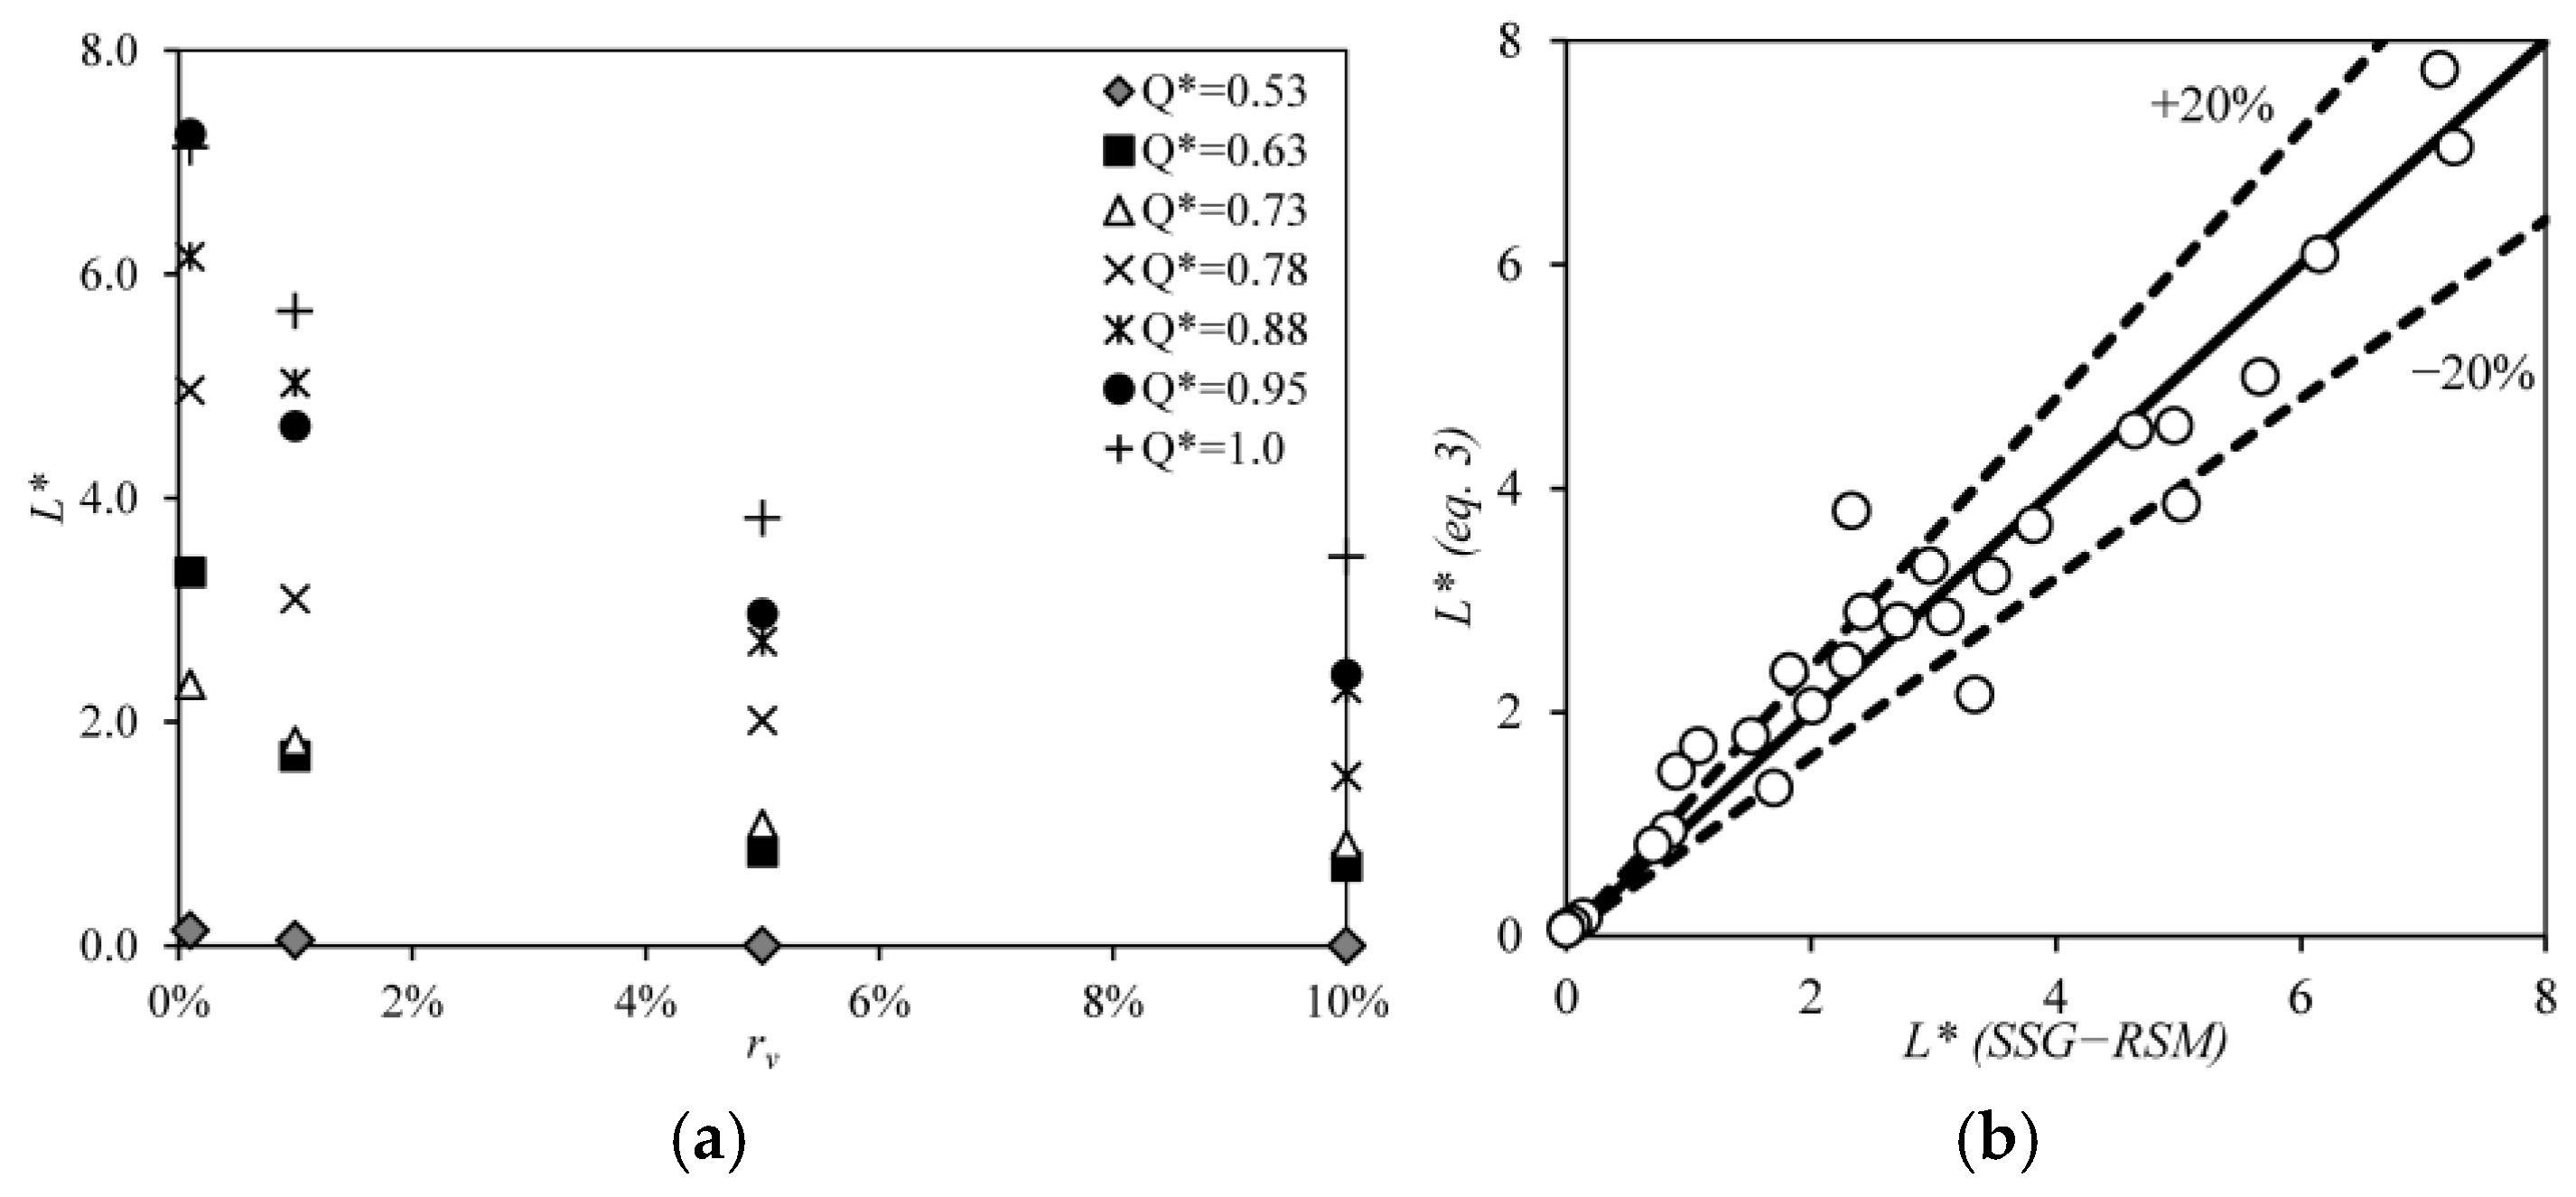
The numerical results suggest that L* is related to rv through a power law (Figure 11a, Equation (8a)), with coefficients that can be approximated by series in the form of Equations (8b) and (8c). The coefficients ψ1 and ψ2 were analyzed using cubic, quadratic and linear approximations, yielding coefficients of determination (R2) of 0.942, 0.941 and 0.937, respectively, with mean squared errors (MSEs) of 0.253, 0.257 and 0.276. The Akaike Information Criterion (AIC), based on likelihood theory, was applied to assess the model complexity. The linear approximation for ψ1 and ψ2 was ultimately adopted, as there was no reasonable justification for higher-order approximations.
L * = ψ 1 r v ψ 2
ψ 1 = i = 1 A i Q * i 1 = 4.31 Q * 2.23
ψ 2 = i = 1 B i Q * i 1 = 0.0577 Q * 0.248
Equation (8a,b,c) was developed based on the results obtained using the SSG-RSM turbulence model for the range 0.001 ≤ rv ≤ 0.10 and 0.53 ≤ Q* ≤ 1.0, requiring further experimental validation. However, a common approach for modeling free and isotropic jets involves using a Gaussian function to describe both longitudinal and transverse decay of concentration and velocity, as Holley and Jirka [36] proposed. Although the Gaussian approach is not directly applicable to the present case, primarily due to the inherent isotropy assumed in Gaussian modeling, the resulting decay behavior in Gaussian models is also well represented by a power law. This similarity reinforces the validity of the power-law formulation adopted in this study, suggesting that the observed decay follows a comparable mathematical structure despite the asymmetries introduced by cavitation and the confinement within the conduit.
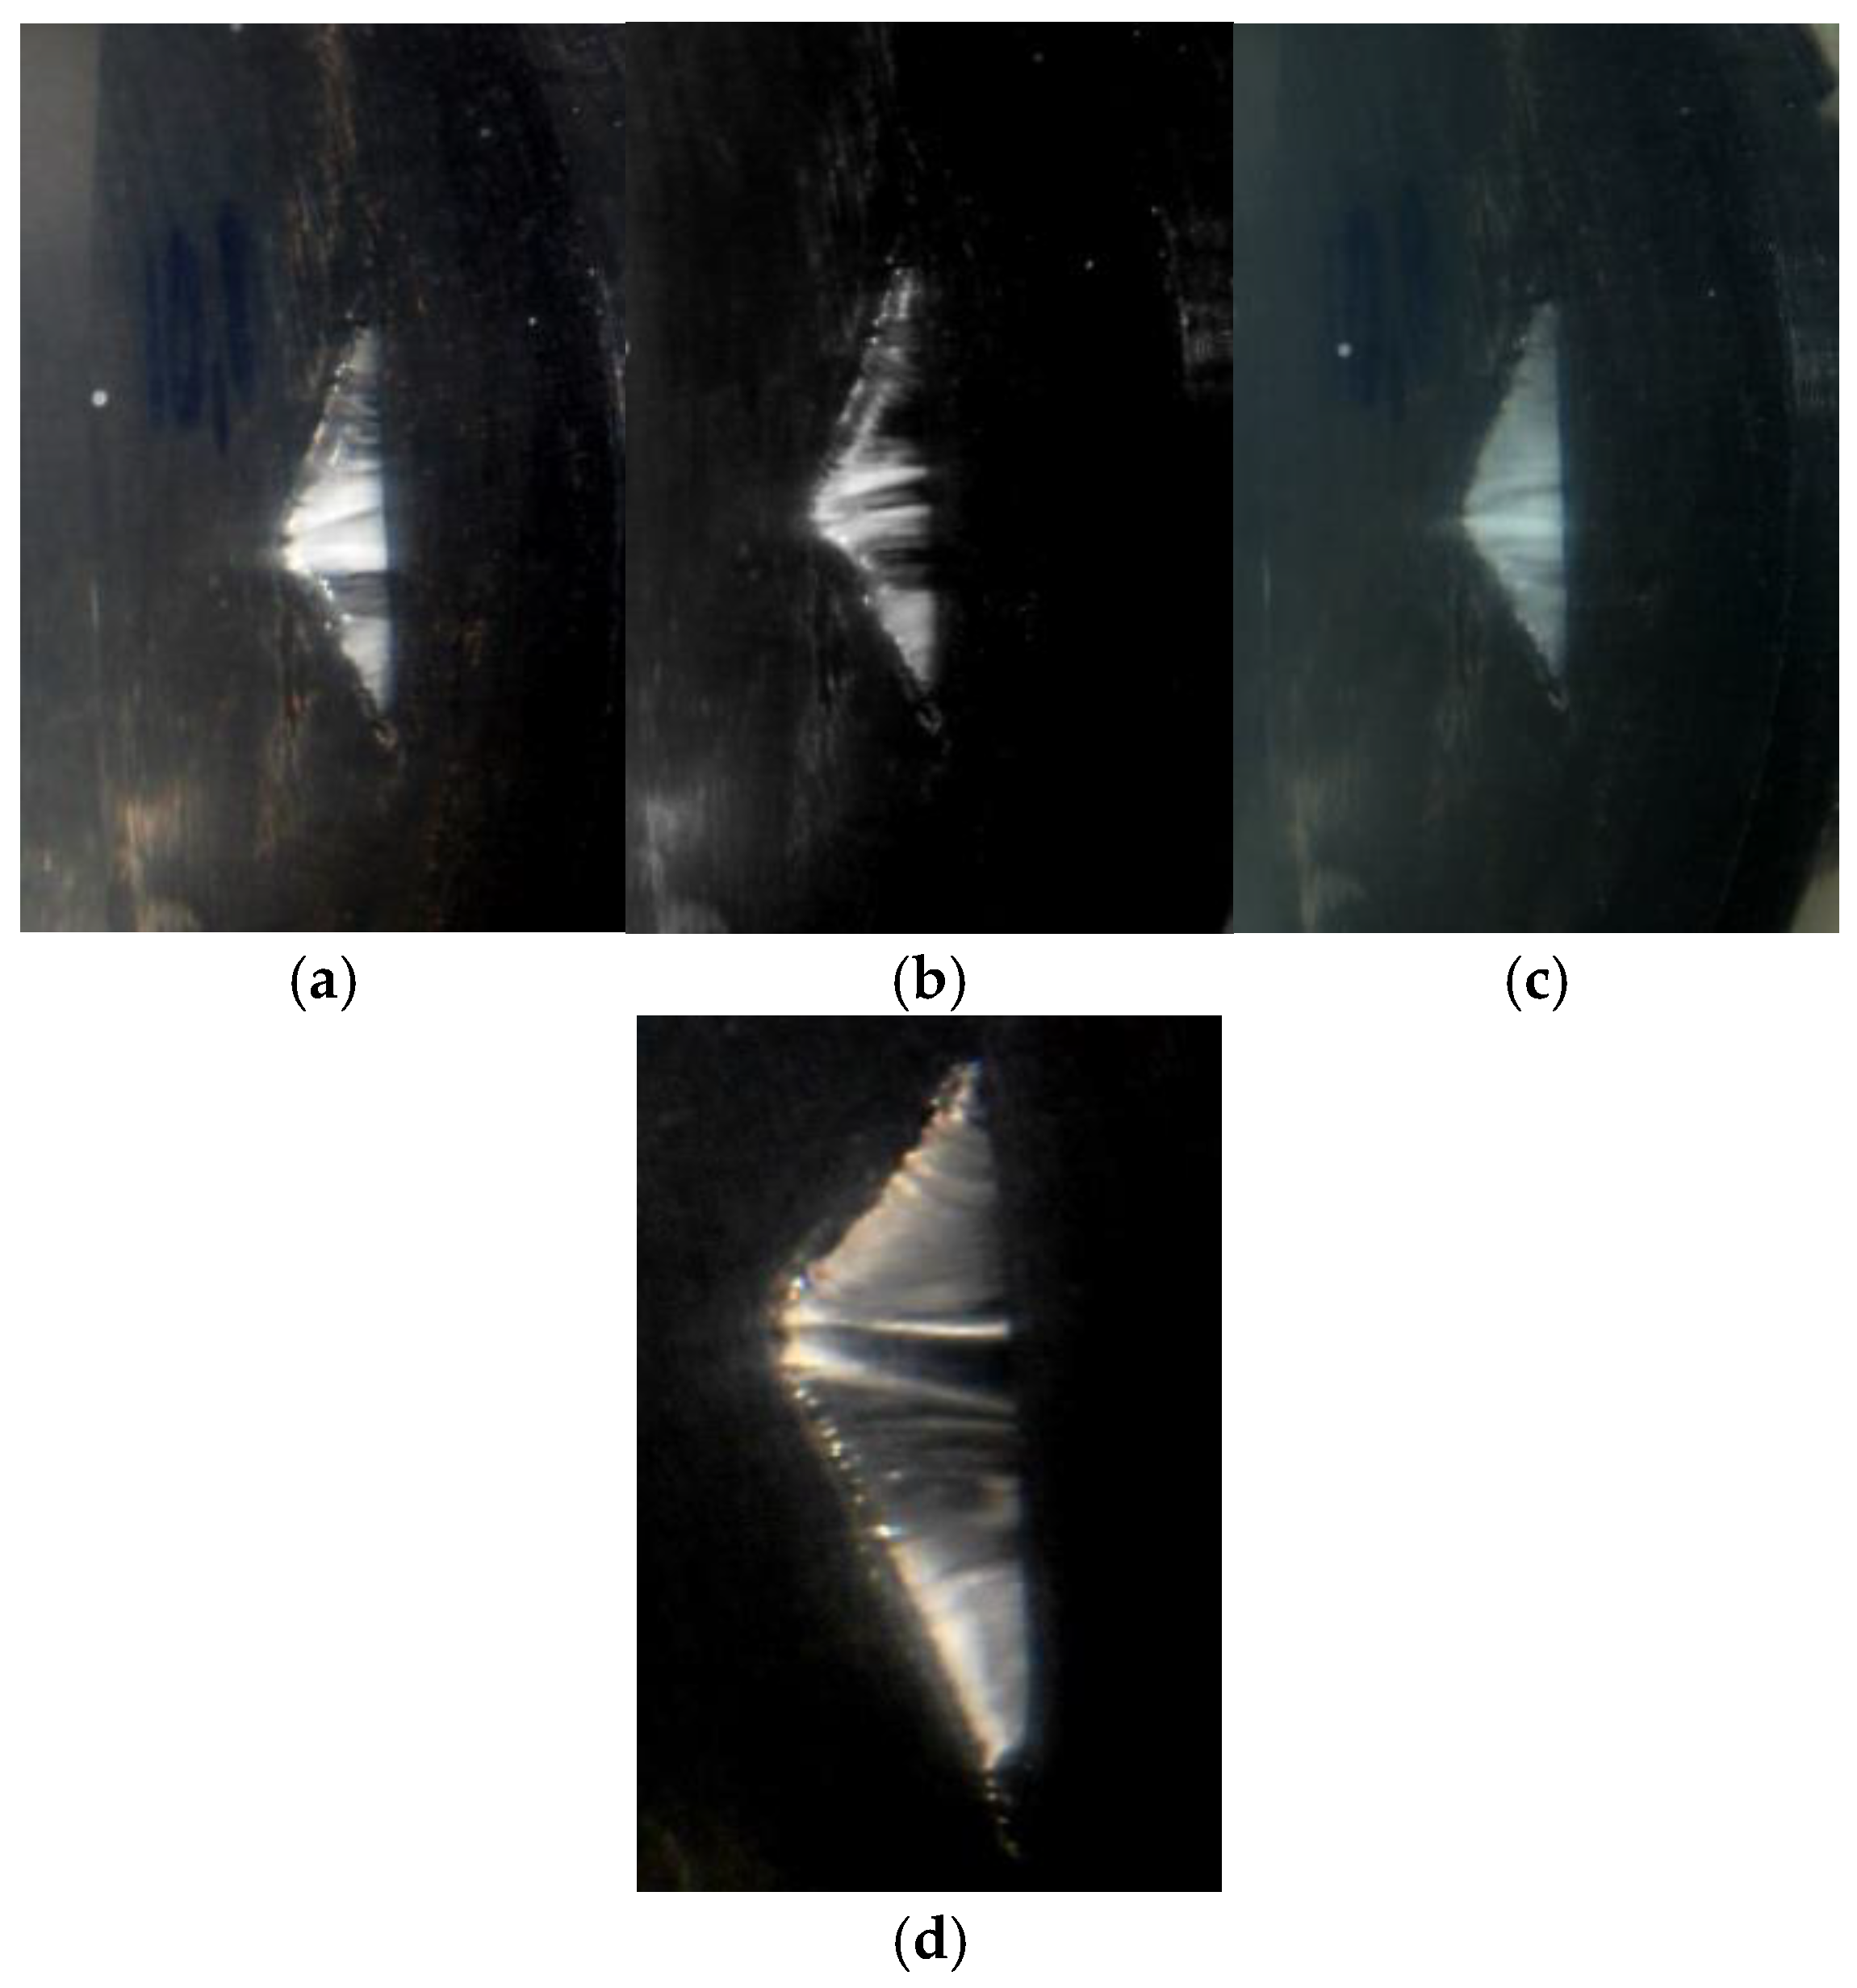
Cavitation initiates at the abrupt transition from the 44 mm tube to the triangular nozzle, as observed in the photographs in Figure 12a–d. These images reveal the phase change through the appearance of white coloration at the onset of the triangular section. In this region, the sudden change in flow direction is expected to cause flow separation and vortex formation, leading to localized low-pressure zones that promote phase change. Additionally, the contraction of the cross-sectional area results in flow acceleration, further reducing the pressure at the center of the triangular conduit.
The incipient cavitation recorded experimentally through high-speed photography suggests the presence of vortical structures within the white-water region. It is well known that abrupt transitions promote flow separation and the formation of large recirculating vortices, which in turn contribute to localized pressure drops in cases like this. The temporal variation observed in the images reveals intermittent behavior, indicating that cavitation occurs in a pulsating manner. This behavior is likely influenced by turbulent ejections originating from the velocity boundary layer and local pressure fluctuations. Such intermittency may play a significant role in the nucleation and collapse of vapor bubbles, affecting the overall cavitation dynamics.
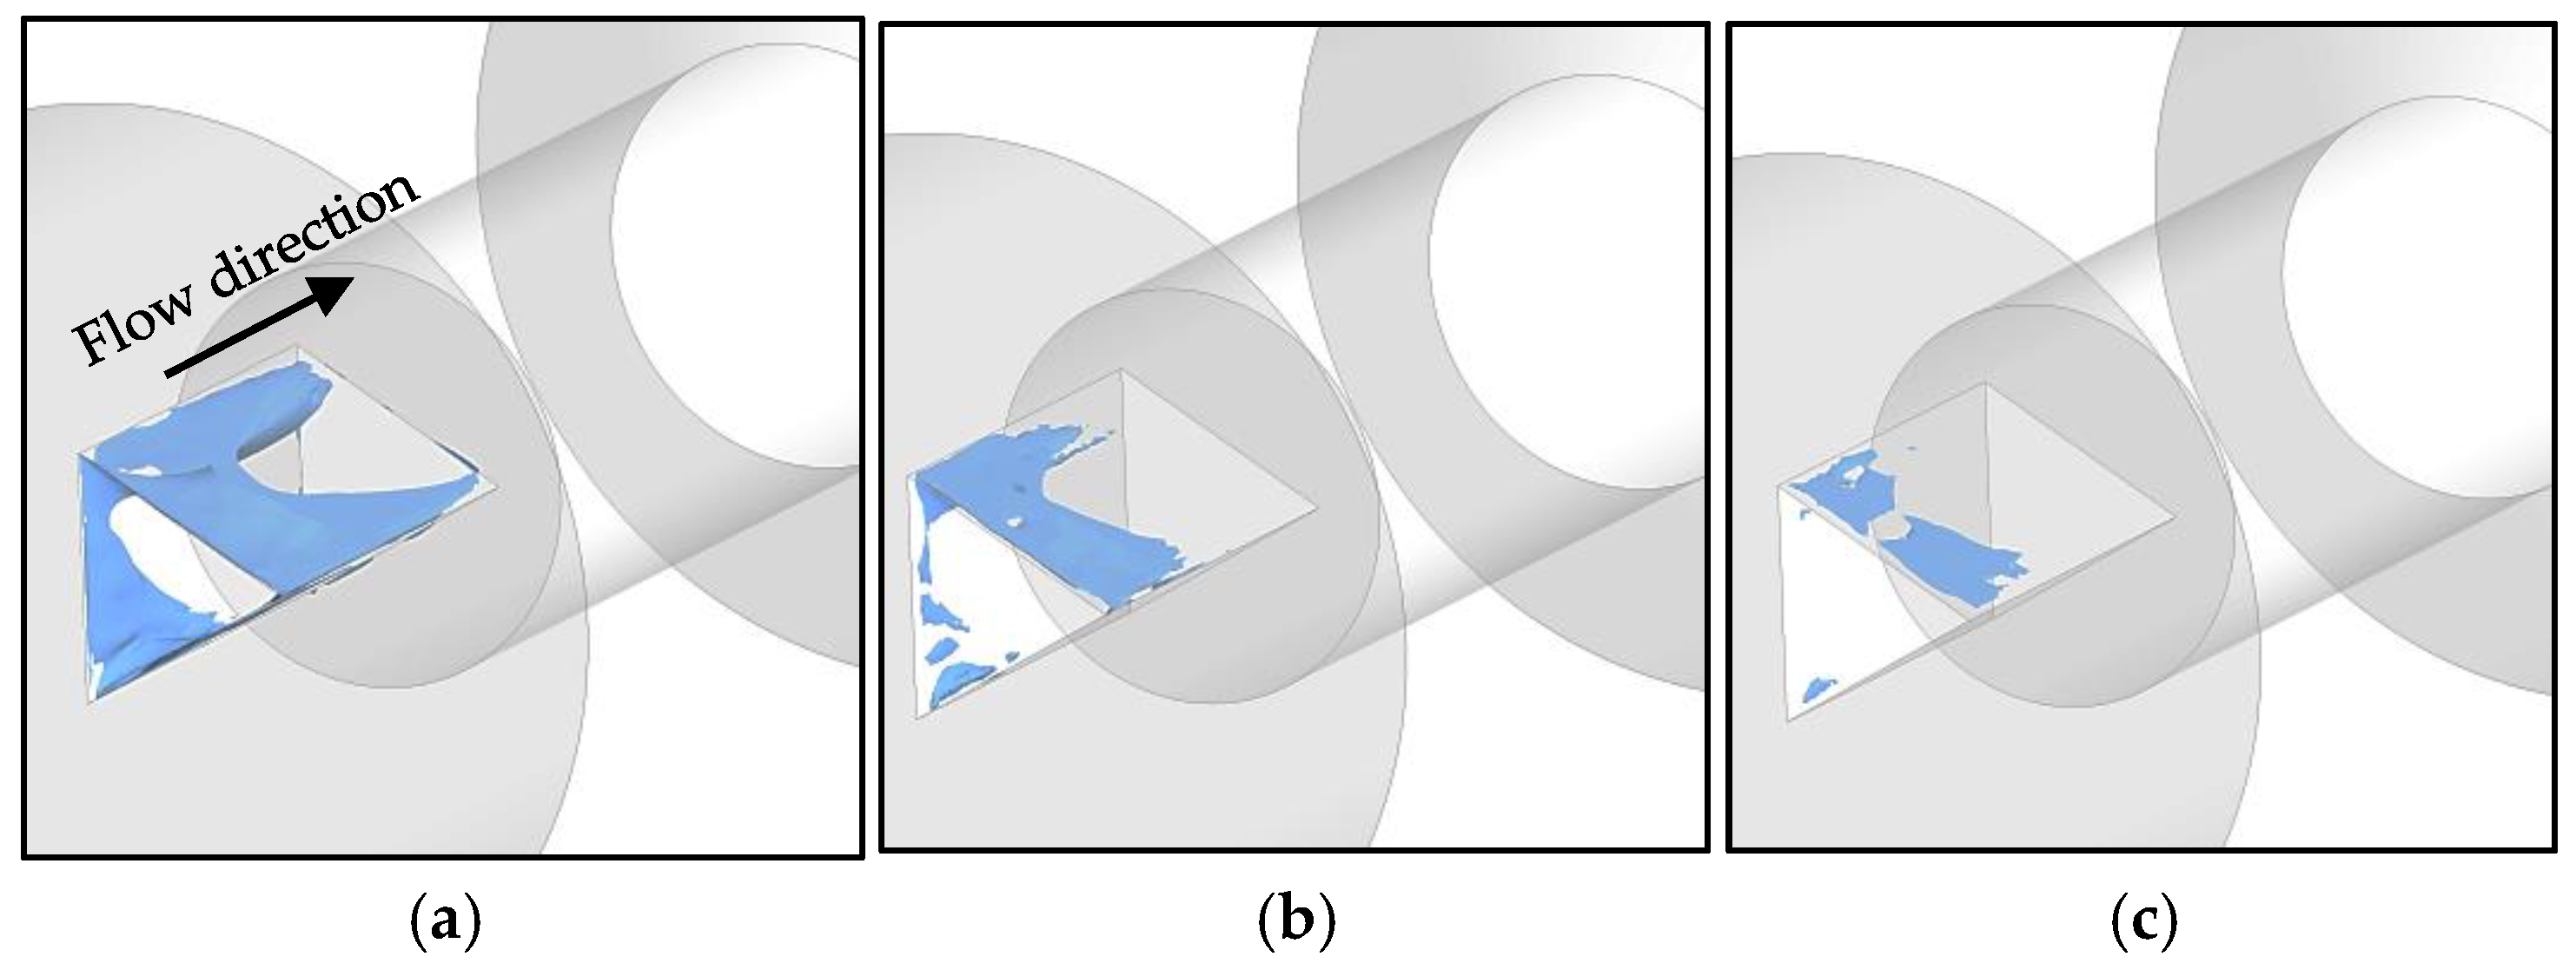
Figure 13 presents the isosurfaces computed numerically for rv values of 0.50, 0.90 and 0.99, illustrating the spatial distribution of the vapor region. These results indicate that the pattern captured in the 1/6000 s photograph closely resembles the mean distribution observed for rv = 0.50 and 0.90. Similarly, Omelyanyuk et al. [37] observed that cavitation appears in the transition from a wide to the narrow section in the flow direction. In CFD simulation, that maximum vapor concentration was 80% with a maximum inlet pressure of 2.8 atm. This comparison qualitatively suggests that the RANS approach with the SSG-RSM turbulence model is suitable for predicting cavitation occurrence in nozzles, providing a reasonable approximation of the mean vapor distribution observed experimentally.

4. Conclusions

The optical measurement system effectively detected cavitation bubble-induced variations in light transmission, confirming its applicability to investigate two-phase flow in confined geometries. The irradiance standard deviation exhibited a well-defined trend, increasing with vapor bubbles up to a maximum and decreasing as the vapor fraction increased further. This behavior, described mathematically by a Gaussian function, demonstrates the system’s sensitivity to cavitation dynamics and its potential to characterize bubble-laden flows. The standard deviation of instantaneous pressures, a parameter capable of representing the intensity of cavitation, showed similar behavior with growth and subsequent decay. This condition reinforces the suitability of the optical instrumentation used.
The flow rates calculated with the k-ε and SSG-RSM turbulence models yielded different values. The SSG-RSM model produced results closer to the measured values for flow rate and pressure, indicating that modeling the Reynolds tensor components with the anisotropic approach is necessary for determining fundamental average quantities, such as flow rate and pressure, for the problem studied in the present work. Numerical simulations successfully captured the formation and evolution of cavitation structures in the flow, with steam jet lengths following a power-law dependence on the vapor volume fraction. The computed isosurfaces of the vapor volume fraction showed qualitative agreement with high-speed photographs, suggesting that the Reynolds-Averaged Navier–Stokes (RANS) approach with the SSG-RSM turbulence model can provide reliable predictions of the average cavitation behavior. Furthermore, vortex identification methods such as the vorticity, λ2-criterion, Q criterion, and swirling strength suggest the presence of large eddies near the nozzle exit, reinforcing the hypothesis that low-pressure zones induced by the abrupt geometry change contribute to the incipient cavitation at this position.
The results demonstrate the role of turbulence anisotropy in cavitation modeling and suggest that turbulence models capable of capturing recirculating vortices are essential to accurately predict cavitation in nozzle flows. The results also indicate that the onset and evolution of cavitation follow trends observed in free-shear jets despite the geometric confinement of the flow. The agreement between experimental and computational findings provides a basis for future studies aimed at optimizing nozzle designs to control cavitation intensity in several applications, including water treatment, biodiesel synthesis and microorganism inactivation, among others.

Author Contributions

L.G.M.W., L.d.R.T., A.J.R.S. and A.L.A.S.: conceptualization, methodology, data curation, formal analysis, writing—original draft and validation. L.R.T.C.G., J.G.d.C.G., L.C.S.S.J., G.G.D. and L.R.O.: software, methodology, validation and data curation. I.S.M.d.A. and A.S.B.d.F.D.: investigation, conceptualization and data curation. L.G.P.: supervision, resources and project administration. V.P.F., G.P.G., L.M.Q., I.M.P., M.V.S.d.S. and V.L.F.: supervision, resources, formal analysis, project administration, funding acquisition and writing—reviewing and editing. All authors have read and agreed to the published version of the manuscript.

Funding

This study was supported by the Coordination for the Improvement of Higher Education Personnel—Brazil (CAPES)—Financing code 001 and process number 88881.708215/2022-01—Emergency PDPG for Strategic Consolidation of Postgraduate Programs (PPGs) stricto sensu academics with grades 3 and 4; 88881.691452/2022-01—PDPGPOSDOC/Strategic Postdoctoral Program of the Graduate Development Program (PDPG), both from the Master’s in Environment, Water, and Sanitation—MAASA—UFBA. This research was supported by Coordination for the Improvement of Higher Education Personnel—Brazil (CAPES) through the Postgraduate Program in Energy and Environment (PGENAM) under process number 88887.959392/2024–00. The authors thank Petrobras for computational support to the project.

Data Availability Statement

The original contributions presented in this study are included in the article. Further inquiries can be directed to the corresponding author.

Conflicts of Interest

The authors declare no conflicts of interest.

Abbreviations

The following abbreviations are used in this manuscript:
RANSReynolds-Avereged Navier–Stokes
CFDComputational Fluid Dynamics
FANSFavre-Averaged Navier–Stokes
LESLarge Eddy Simulation
LEDLight Emitter Diode
DNSDirect Numerical Simulation
SSG-RMSSpeziale–Sarkar–Gatski Reynolds Stress Model
MSEMean Squared Error
AICAkaike Information Criterion
IrIrradiance
QFlow rate
Q*Normalized flow rate
ImMean irradiance
αFluid phase
RRadius of the bubble
rαVolumetric fraction of phase α
ραMass density of the fluid composing phase α
UαVelocity field of phase α
SαMass source term
ΓαβTemporal rate of change of mass per unit volume
NpTotal number of phases
pPressure field
μαDynamic viscosity
SSource term for external field forces
MαInterfacial forces acting on phase α
pBPressure inside the bubble
pPressure far from the bubble
σSurface tension
ρSpecific mass of the liquid
νKinematic viscosity of the liquid phase
AαβInterfacial area density
rυVapor volume fraction
rυmaxMaximum numerical vapor fraction
rυ*Normalized vapor volume fraction
LVapor jet length
L*Normalized jet length

References

  1. Tian, Y.; Yuan, X.; Xu, S.; Li, R.; Zhou, X.; Zhang, Z. Biological efficacy and toxic effect of emergency water disinfection process based on advanced oxidation technology. Ecotoxicology 2015, 24, 1723–1731. [Google Scholar] [CrossRef]
  2. Silva, C.E.T.; Soares, L.L.O.; Pereira, L.G.; Cavalcante, A.A.; Achy, A.R.A.; Filardi, V.L.; Ferreira, V.P.; Junior, R.A.F.; Castro, B.B.; Paes, T.F.; et al. A new ultrasonic reactor for CaCO3 antiscaling in pipelines and equipment. SPE J. 2023, 28, 2632–2644. [Google Scholar] [CrossRef]
  3. Zheng, H.; Zheng, Y.; Zhu, J. Recent developments in hydrodynamic cavitation reactors: Cavitation mechanism, reactor design, and applications. Engineering 2022, 19, 180–198. [Google Scholar] [CrossRef]
  4. Mohod, A.V.; Viel, G.; Gogate, P.R.; Firmino, P.; Giudici, R. Intensification of biodiesel production using hydrodynamic cavitation based on high-speed homogenizer. Chem. Eng. J. 2017, 316, 751–757. [Google Scholar] [CrossRef]
  5. Dastane, G.G.; Thakkar, H.; Shah, R.; Perala, S.; Raut, J.; Pandit, A.B. Single and multiphase CFD simulations for designing cavitating venturi. Chem. Eng. Res. Des. 2019, 149, 1–12. [Google Scholar] [CrossRef]
  6. Singhal, A.K.; Athavale, M.M.; Li, H.; Jiang, Y. Mathematical basis and validation of the full cavitation model. J. Fluids Eng. 2002, 124, 617–624. [Google Scholar] [CrossRef]
  7. Keller, J.B.; Miksis, M. Bubble oscillations of large amplitude. J. Acoust. Soc. Am. 1980, 68, 628–633. [Google Scholar] [CrossRef]
  8. Simpson, A.; Ranade, V.V. Modeling of hydrodynamic cavitation with orifice: Influence of different orifice designs. Chem. Eng. Res. Des. 2018, 136, 698–711. [Google Scholar] [CrossRef]
  9. Li, H.; Chen, J.; Guo, J.; Zhu, H.; Lin, Y.; Ge, H. A Study of Cavitation Erosion in Artificial Submerged Water Jets. Appl. Sci. 2024, 14, 4804. [Google Scholar] [CrossRef]
  10. Dutta, N.; Kopparthi, P.; Mukherjee, A.K.; Nirmalkar, N.; Boczkaj, G. Novel strategies to enhance hydrodynamic cavitation in a circular venturi using RANS numerical simulations. Water Res. 2021, 204, 117559. [Google Scholar] [CrossRef]
  11. Zhou, P.; Cui, J.; Xiao, G.; Xiang, C.; Dai, J.; Zheng, S. Numerical Study on Cavitating Flow-Induced Pressure Fluctuations in a Gerotor Pump. Energies 2023, 16, 7301. [Google Scholar] [CrossRef]
  12. Li, L.; Xu, Y.; Ge, M.; Wang, Z.; Li, S.; Zhang, J. Numerical Investigation of Cavitating Jet Flow Field with Different Turbulence Models. Mathematics 2023, 11, 3977. [Google Scholar] [CrossRef]
  13. Hong, F.; Tian, H.; Yuan, X.; Liu, S.; Peng, Q.; Shi, Y.; Jin, L.; Ye, L.; Jia, J.; Ying, D.; et al. CFD-assisted modeling of the hydrodynamic cavitation reactors for wastewater treatment—A review. J. Environ. Manag. 2022, 321, 115982. [Google Scholar] [CrossRef]
  14. Schnerr, G.H.; Sauer, J. Physical and numerical modeling of unsteady cavitation dynamics. In Proceedings of the Fourth International Conference on Multiphase Flow, New Orleans, LA, USA, 27 May–1 June 2001. [Google Scholar]
  15. Zwart, P.J.; Gerber, A.G.; Belamri, T. A two-phase flow model for predicting cavitation dynamics. In Proceedings of the Fifth International Conference on Multiphase Flow, Yokohama, Japan, 30 May–4 June 2004. [Google Scholar]
  16. Liu, B.; Park, S. Two-Dimensional Prediction of Transient Cavitating Flow Around Hydrofoils Using a DeepCFD Model. J. Mar. Sci. Eng. 2024, 12, 2074. [Google Scholar] [CrossRef]
  17. Polgár, M.; Agarwal, C.; Gogate, P.; Németh, G.; Csóka, L. Using CFD simulations to investigate the shear stress in hydrodynamic cavitation reactors coupled with experimental validation using colony count measurements. Sci. Rep. 2022, 12, 18034. [Google Scholar] [CrossRef] [PubMed]
  18. Jia, X.; Zhang, S.; Tang, Z.; Xue, K.; Chen, J.; Manickam, S.; Lin, Z.; Sun, X.; Zhu, Z. Investigations on cavitation flow and vorticity transport in a jet pump cavitation reactor with variable area ratios. Ultrason. Sonochem. 2024, 108, 106964. [Google Scholar] [CrossRef]
  19. Zhou, P.; Zhong, K.; Zhu, Y. Numerical study of hydrodynamic cavitation pretreatment of food waste: Effect of pressure drop on the cavitation behavior. Processes 2024, 12, 300. [Google Scholar] [CrossRef]
  20. Özgünoğlu, M.; Mouokue, G.; Oevermann, M.; Bensow, R.E. Numerical investigation of cavitation erosion in high-pressure fuel injector in the presence of surface deviations. Fuel 2025, 386, 134174. [Google Scholar] [CrossRef]
  21. Fang, Z.; Hou, W.; Xu, Z.; Guo, X.; Zhang, Z.; Shi, R.; Yao, Y.; Chen, Y. Large Eddy Simulation of Cavitation Jets from an Organ-Pipe Nozzle: The Influence of Cavitation on the Vortex Coherent Structure. Processes 2023, 11, 2460. [Google Scholar] [CrossRef]
  22. Apte, D.; Ge, M.; Zhang, G.; Delgosha, O.C. Numerical investigation of three-dimensional effects of hydrodynamic cavitation in a Venturi tube. Ultrason. Sonochemistry 2024, 111, 107122. [Google Scholar] [CrossRef]
  23. Guo, M.; Lu, Y.; Xue, H.; Show, P.L.; Yoon, J.Y.; Sun, X. Numerical simulation on the enhancement mechanism of the distinctive division baffle on the performance of a Venturi for process intensification. J. Water Process Eng. 2024, 57, 104719. [Google Scholar] [CrossRef]
  24. West, L.G.M.; Simões, A.J.R.; Teixeira, L.R.; Santos, C.A.; Oliveira, L.R.; Pereira, L.G.; Ferreira, V.P.; Simões, A.L.A.; Queiroz, L.M.; Pepe, I.M. Hydrodynamic cavitation induced by different nozzle shapes in pressurized conduits, instrumented by optical detection, searching for pressure correlation. Flow Meas. Instrum. 2025, 102, 102797. [Google Scholar] [CrossRef]
  25. Speziale, C.G.; Sarkar, S.; Gatski, T.B. Modelling the pressure-strain correlation of turbulence: An invariant dynamical systems approach. J. Fluid Mech. 1991, 227, 245–272. [Google Scholar] [CrossRef]
  26. Launder, B.E.; Spalding, D.B. The numerical computation of turbulent flows. Comput. Methods Appl. Mech. Eng. 1974, 3, 269–289. [Google Scholar] [CrossRef]
  27. Gatski, T.B.; Speziale, C.G. On explicit algebraic stress models for complex turbulent flows. J. Fluid Mech. 1993, 254, 59–78. [Google Scholar] [CrossRef]
  28. Ishii, M.; Hibiki, T. Thermo-Fluid Dynamics of Two-Phase Flow, 2nd ed.; Springer: New York, NY, USA, 2011. [Google Scholar]
  29. ANSYS, Inc. Ansys CFX Reference Guide; ANSYS: Canonsburg, PA, USA, 2021. [Google Scholar]
  30. Plesset, M.S. The dynamics of cavitation bubbles. ASME J. Appl. Mech. 1949, 16, 228–231. [Google Scholar] [CrossRef]
  31. Manninen, M.; Taivassalo, V. On the Mixture Model for Multiphase Flow; VTT Technical Research Centre of Finland: Espoo, Finland, 1996; No. 288. [Google Scholar]
  32. Menter, F.R.; Esch, T. Elements of Industrial Heat Transfer Predictions. In Proceedings of the 16th Brazilian Congress of Mechanical Engineering (COBEM), Uberlandia, Brazil, 26–30 November 2001. [Google Scholar]
  33. Roache, P.J. Perspective: A Method for Uniform Reporting of Grid Refinement Studies. ASME J. Fluids Eng. 1994, 116, 405–413. [Google Scholar] [CrossRef]
  34. Murthy, B.N.; Joshi, J.B. Assessment of standard κ-ε, RSM and LES turbulence models in a baffled stirred vessel agitated by various impeller designs. Chem. Eng. Sci. 2008, 63, 5468–5495. [Google Scholar] [CrossRef]
  35. Lee, I.; Ryou, H.S.; Lee, S.H.; Chae, S. Comparison of two-equation Model and Reynolds Stress Models with experimental data for the three-dimensional turbulent boundary layer in a 30 degree bend. KSME Int. J. 2000, 14, 93–102. [Google Scholar] [CrossRef]
  36. Holley, E.R.; Jirka, G.H. Mixing in Rivers; Technical Report E-86-11; U.S. Army Engineer Waterways Experiment Station: Vicksburg, MS, USA, 1986. [Google Scholar]
  37. Omelyanyuk, M.; Ukolov, A.; Pakhlyan, I.; Bukharin, N. Experimental and numerical study of cavitation number limitations for hydrodynamic cavitation inception prediction. Fluids 2022, 7, 198. [Google Scholar] [CrossRef]
Figure 1. Schematic diagram of the experimental apparatus (a) and detailed view of the convergent-divergent nozzle with the optical measurement system (b). Adapted from [24].
Fluids 10 00223 g001
Figure 2. Triangular nozzle with a side length of 10.8 mm: (a) front view and (b) side view.
Fluids 10 00223 g002
Figure 3. Skewness (a) and kurtosis (b) of irradiation data before and after outliers’ removal.
Fluids 10 00223 g003aFluids 10 00223 g003b
Figure 4. (a) Physical domain; (b) computational domain; (c,d) mesh.
Fluids 10 00223 g004
Figure 5. Photographs of the region downstream of the nozzle, obtained with an exposure time of 1/6000 s: (a) Q* = 0.68; (b) Q* = 0.75; (c) Q* = 0.80; (d) Q* = 0.86; (e) Q* = 0.93; (f,g) for Q* = 1.00, corresponding to the flow with maximum discharge.
Fluids 10 00223 g005
Figure 6. Mean irradiance as a function of the normalized flow rate (a); standard deviation of the irradiance (b); comparison between experimental data, fitted models and the exact fit line (c,d,f); and standard deviation of the pressure (e).
Fluids 10 00223 g006
Figure 7. Vapor fraction as a function of the normalized flow rate (a) and normalized vapor fraction as a function of the mean irradiance (b).
Fluids 10 00223 g007
Figure 8. Comparison between normalized flow rates, Q*, and mean pressures, pExp = experimental and pCFD = numerical: (a) inlet and outlet flow rates of the computational domain; (b) experimental data versus CFD values for flow rates; (c) mean pressure at the pressure transducer location; (d) relative deviation for Q* and deviation for pressure (e).
Fluids 10 00223 g008
Figure 9. Velocity and pressure fields for k-ε and SSG—RSM models: (a) velocity and (b) pressure for κ-ε model at 0.528 L/s flow rate; (c) velocity and (d) pressure for SSG—RSM model at 0.528 L/s flow rate; (e) velocity and (f) pressure for κ-ε model at 0.778 L/s flow rate; (g) velocity and (h) pressure for SSG—RSM model at 0.778 L/s flow rate.
Fluids 10 00223 g009
Figure 10. Isosurface defined for Q* = 1.0 and rv values of (a) 0.10; (b) 0.05; (c) 0.01; (d) 0.001.
Fluids 10 00223 g010
Figure 11. Vapor jet length as a function of flow rate (a), parity plot comparing Equation (3) with CFD results obtained using the SSG-RSM model (b).
Fluids 10 00223 g011
Figure 12. Photographs at three different time instants (ac), captured with a shutter speed of 1/6000 s, indicating incipient cavitation (white region); magnified image of the incipient cavitation zone, showing the curvature of the white water as it detaches from the transition edge (d).
Fluids 10 00223 g012
Figure 13. Isosurface for vapor volume fraction: (a) rv = 0.50, (b) rv = 0.90 and (c) rv = 0.99.
Fluids 10 00223 g013
Table 1. Static pressure used in boundary conditions for numeric simulations.
Flow RateP [Pa]
L/sInletOutlet
0.52873,545.0−9335.31
0.58398,060.0−9335.31
0.625127,478.0−9335.31
0.667161,799.0−9335.31
0.772196,120.0−9335.31
0.778230,441.0−9335.31
Disclaimer/Publisher’s Note: The statements, opinions and data contained in all publications are solely those of the individual author(s) and contributor(s) and not of MDPI and/or the editor(s). MDPI and/or the editor(s) disclaim responsibility for any injury to people or property resulting from any ideas, methods, instructions or products referred to in the content.