Article

Air Entrainment and Slope Erosion During Overflow on a Levee Covered by Non-Uniform Turfgrass

1
Graduate School of Science and Engineering, Saitama University, Saitama 338-8570, Japan
2
Department of Resilient Society, Research Center for Social Transformation, Saitama University, Saitama 338-8570, Japan
*
Author to whom correspondence should be addressed.
Fluids 2025, 10(8), 212; https://doi.org/10.3390/fluids10080212
Submission received: 6 June 2025 / Revised: 4 August 2025 / Accepted: 9 August 2025 / Published: 12 August 2025

Abstract

To mitigate flood damage caused by overflow from a levee, it is essential to prevent the levee failure or extend the time to breaching. Although turfgrass on a levee slope is effective in suppressing erosion, insufficient maintenance can reduce its coverage. When overtopping occurs under such non-uniform turfgrass conditions, the flow tends to entrain air. In spillways, air entrainment is known to reduce friction loss; therefore, it may also contribute to lowering shear stress and erosion depth. This study conducted flume experiments with artificial turf arranged in various patterns on levee slopes to investigate flow patterns, air entrainment, and erosion. The flow pattern changed depending on the turf arrangement and overflow depth, and air entrainment occurred due to water surface fluctuations around the turfgrass. The inception point of air entrainment was found to be similar to or shorter than that observed in stepped spillways. Furthermore, the experiments showed a tendency for erosion depth to decrease once air entrainment is fully developed. This finding is significant because it suggests that erosion can potentially be minimized not only by reinforcing the levee structure itself but also by modifying flow characteristics through designs that promote air entrainment.

1. Introduction

Plant roots enhance the cohesion and shear strength of soil [1]. Grass roots that grow naturally can increase soil shear strength [2]. Experiments conducted with different vegetation types have confirmed that soil shear strength increases with root density [3]. This increase makes levees with grass-covered slopes highly effective at mitigating erosion caused by overflow and wave overtopping [4,5]. Turfgrass roots grow densely to a shallow depth. In river levees managed by the Ministry of Land, Infrastructure, Transport and Tourism in Japan, turfgrass is first planted on the slope and then maintained through a three-year establishment period through regular mowing and root management. After this period, the grass is typically mowed twice a year; however, maintaining the turf in a healthy condition with such infrequent mowing is difficult [6], because even two mowings are costly. When turfgrass area coverage decreases, the overflow becomes more turbulent and may entrain air due to the presence of alternating high-resistance turf patches and low-resistance bare ground. Zhang et al. [7] showed that the grass cover pattern has a significant effect on the erosion of slopes caused by rainfall. However, the effect of air entrainment during overflow on the erosion characteristics of the levee has not been clarified.
Many studies of air entrainment have been conducted in structures with steep and long chutes, such as dam spillways. Flume experiments [8] and field observations [9] have shown that steeper slopes result in higher air concentrations and that the inception point of air entrainment shifts downstream as discharge increases. In steep channels, air is entrained from the free water surface when the turbulent flow velocity exceeds the effects of water tension and gravity [10]. Analyses based on experimental and field data indicated that the friction coefficient decreases with increasing air concentration [11,12]. Because the energy reduction of a high-velocity flow is important in dam spillways, stepped spillways have been proposed [13]. Stepped spillways can more easily entrain air than smooth chute spillways [14]. Although air entrainment can reduce the effect of energy dissipation, which is a disadvantage for dam spillways, preventing erosion of the levee slope is more critical than dissipating the energy of overflow from river levees. Accordingly, the potential role of an aerated flow in mitigating levee slope erosion should be examined.
The increase in flood disasters due to climate change has heightened the importance of preventing erosion caused by overflowing from river levees. Adequate compaction of the levee body and appropriate selection of levee materials are essential to enhance erosion resistance under such conditions [15,16]. Numerous studies have investigated protective measures, including covering levee crests and slopes with grass [17], roller compacted concrete [18], articulated concrete blocks [18], riprap [19], or geogrids [20]. These approaches aim to improve erosion resistance by strengthening the levee structure. However, while it is important to ensure the continued effectiveness of these countermeasures, maintaining a high turfgrass cover ratio is difficult. Nevertheless, the flow behavior and erosion resistance on levee slopes with a diminished turf cover ratio remain insufficiently understood.
This study aimed to clarify the flow characteristics and erosion resistance on levee slopes covered by non-uniform turfgrass due to insufficient maintenance. The study particularly focused on how the turfgrass coverage and its arrangement affect the inception point of air entrainment, as well as the relationship between air entrainment and the erosion resistance of a levee slope. A series of fixed-bed experiments were conducted by varying the extent of turfgrass coverage, its arrangement, and flow discharge to investigate air entrapment and flow types on the levee slope. In addition, semi-movable-bed experiments, where only the bare ground was set as a movable bed, were also conducted to examine erosion characteristics. This study proposes a new approach to preventing erosion of river levees.

2. Materials and Methods

Flume experiments were conducted in a circulating open channel at Saitama University in Japan, measuring 6.5 m in length, 0.5 m in width, and 1.2 m in depth. A levee model with a 20 cm crest width was set in the channel, as shown in Figure 1. Three overflow depths at the crest center, h = 2, 4, and 6 cm, were set, corresponding to discharges of Q = 0.0044, 0.0125, and 0.0230 m3/s, respectively. The physical scale of this experiment was 1/5, and the corresponding overflow depths of the prototype scale ranged from 10 to 30 cm. During the September 2015 Kinu River flooding by Typhoon Kilo, the estimated overflow depth was approximately 20 cm [21]. In addition, the Ministry of Land, Infrastructure, Transport and Tourism (MLIT) in Japan has set a technical development target for levees to withstand an overflow depth of 30 cm for three hours, based on a survey of overflow depth distributions from past overtopping events [22]. Accordingly, the overflow depth was set to 10–30 cm in prototype scale, corresponding to 2–6 cm in model scale.
Two types of tests were performed: fixed-bed experiments (Figure 1a) and semi-movable-bed experiments (Figure 1b). In the fixed-bed experiments, the levee height was 90 cm, and flow structure and air-entrainment patterns were recorded. In the semi-movable-bed experiments, a movable bed section was placed on top of the fixed-bed model, resulting in a total levee height of 98 cm. However, in both experiments, the observation area was limited to the slope surface up to approximately 75–80 cm below the crest to avoid the effects of backwater from the downstream end of the flume channel. Therefore, the difference in levee height did not affect the interpretation of the results. In the semi-mobile bed experiment, a 7-cm deep layer of Arakida soil was placed as the bare ground. Arakida soil was selected as a cohesive material to comparatively evaluate the erosion resistance. The Arakida soil is composed of 18% sand, 47% silt, and 35% clay and is classified as a silty clay loam. Its median particle diameter (D50) was 0.01 mm, maximum dry density was 1.55 g/cm3, optimum moisture concentration was 23.7%, and the permeability coefficient was 1.82 × 10⁻⁷ cm/s [23].
The overflow duration was generally set to 1 h, after which the maximum erosion depth (Figure 1b) was measured at each bare ground. This duration corresponds to approximately 2.2 h at the prototype scale using a Froude similarity. After the levee slope is eroded by overflow, a scour hole typically develops at the landward toe and gradually enlarges. This process eventually leads to a levee breach through soil-mass failure of the levee body. Based on experiments with different levee bodies and foundation materials, Sherzai et al. [24] showed that the time from the development of a scour hole to soil-mass failure ranged from approximately 1.6 to 2.9 h at full scale. Considering the process of levee failure, the real-time duration of 2.2 h for slope erosion can be regarded as sufficient. When the maximum erosion depth reached the thickness of the Arakida soil layer (7 cm), the experiment was terminated. This is because the turfgrass patch can be washed away, although in the experiment, it remained in place due to the fixed bed condition. Although such cases cannot be directly compared to others in terms of erosion resistance, they can be regarded as more erosion-prone conditions.
During actual flood events, the overflow is often wide, and gully erosion can develop on the levee slope. When the overflow depth is relatively small, approximately 0.1 to 0.2 times the levee height, multiple scour holes may form along the longitudinal direction of the levee [25]. This phenomenon is attributed to spatial variations in overflow depth and unit discharge along the levee crest. Under such wide overflow conditions, it is also important to consider minor surface irregularities on the crest due to differential settlement of the levee body. In the present experiments, the flume width was limited to 50 cm; therefore, the effect of such longitudinal irregularities can be regarded as negligible. The evaluation of phenomena such as gully erosion requires investigation under wider overflow conditions, but such analysis remains a subject for future study.
Artificial turf (2 cm in height) was installed on the slope in one of two distinct arrangements, as shown in Figure 1c,d. The artificial turf was composed of densely arranged short-pile plastic fibers. Each fiber was approximately 0.02 cm thick, 0.06 cm wide, and trimmed to a height of 2 cm. The fiber density was approximately 400,000 fibers/m2, resulting in a porosity of about 95%. The porosity and height of the turfgrass installed on levee slopes are likely to vary significantly depending on management conditions; however, this aspect remains an issue for future research. Case F-2D, as shown in Figure 1c, is a two-dimensional arrangement of turf and bare ground. The turf width Wt and bare width Wb are each 50 cm, the same as the channel width. In Case F-3D, as shown in Figure 1d, turf patches and bare ground are arranged as a staggered pattern. Wt, Wb, and the turf length Lt were all 10 cm. The coverage rates were varied from 50% to 66.7% by changing the bare lengths Lb, as shown in Table 1.
In all experimental cases, flow structures and air entrainment were recorded using overhead and side-wall video cameras. The overflow depth at the crest was measured using a scale on the side wall of the channel. In Case F-2D, water depths were measured along the channel centerline at intervals of 2–5 cm. In Case F-3D, measurements were taken along five longitudinal lines, as shown in Figure 1d. A thin steel scale with 0.1 cm graduations was used to measure the water depth.

3. Results

3.1. Flow Conditions and Inception Point of Air Entrainment in Fixed Bed Experiments

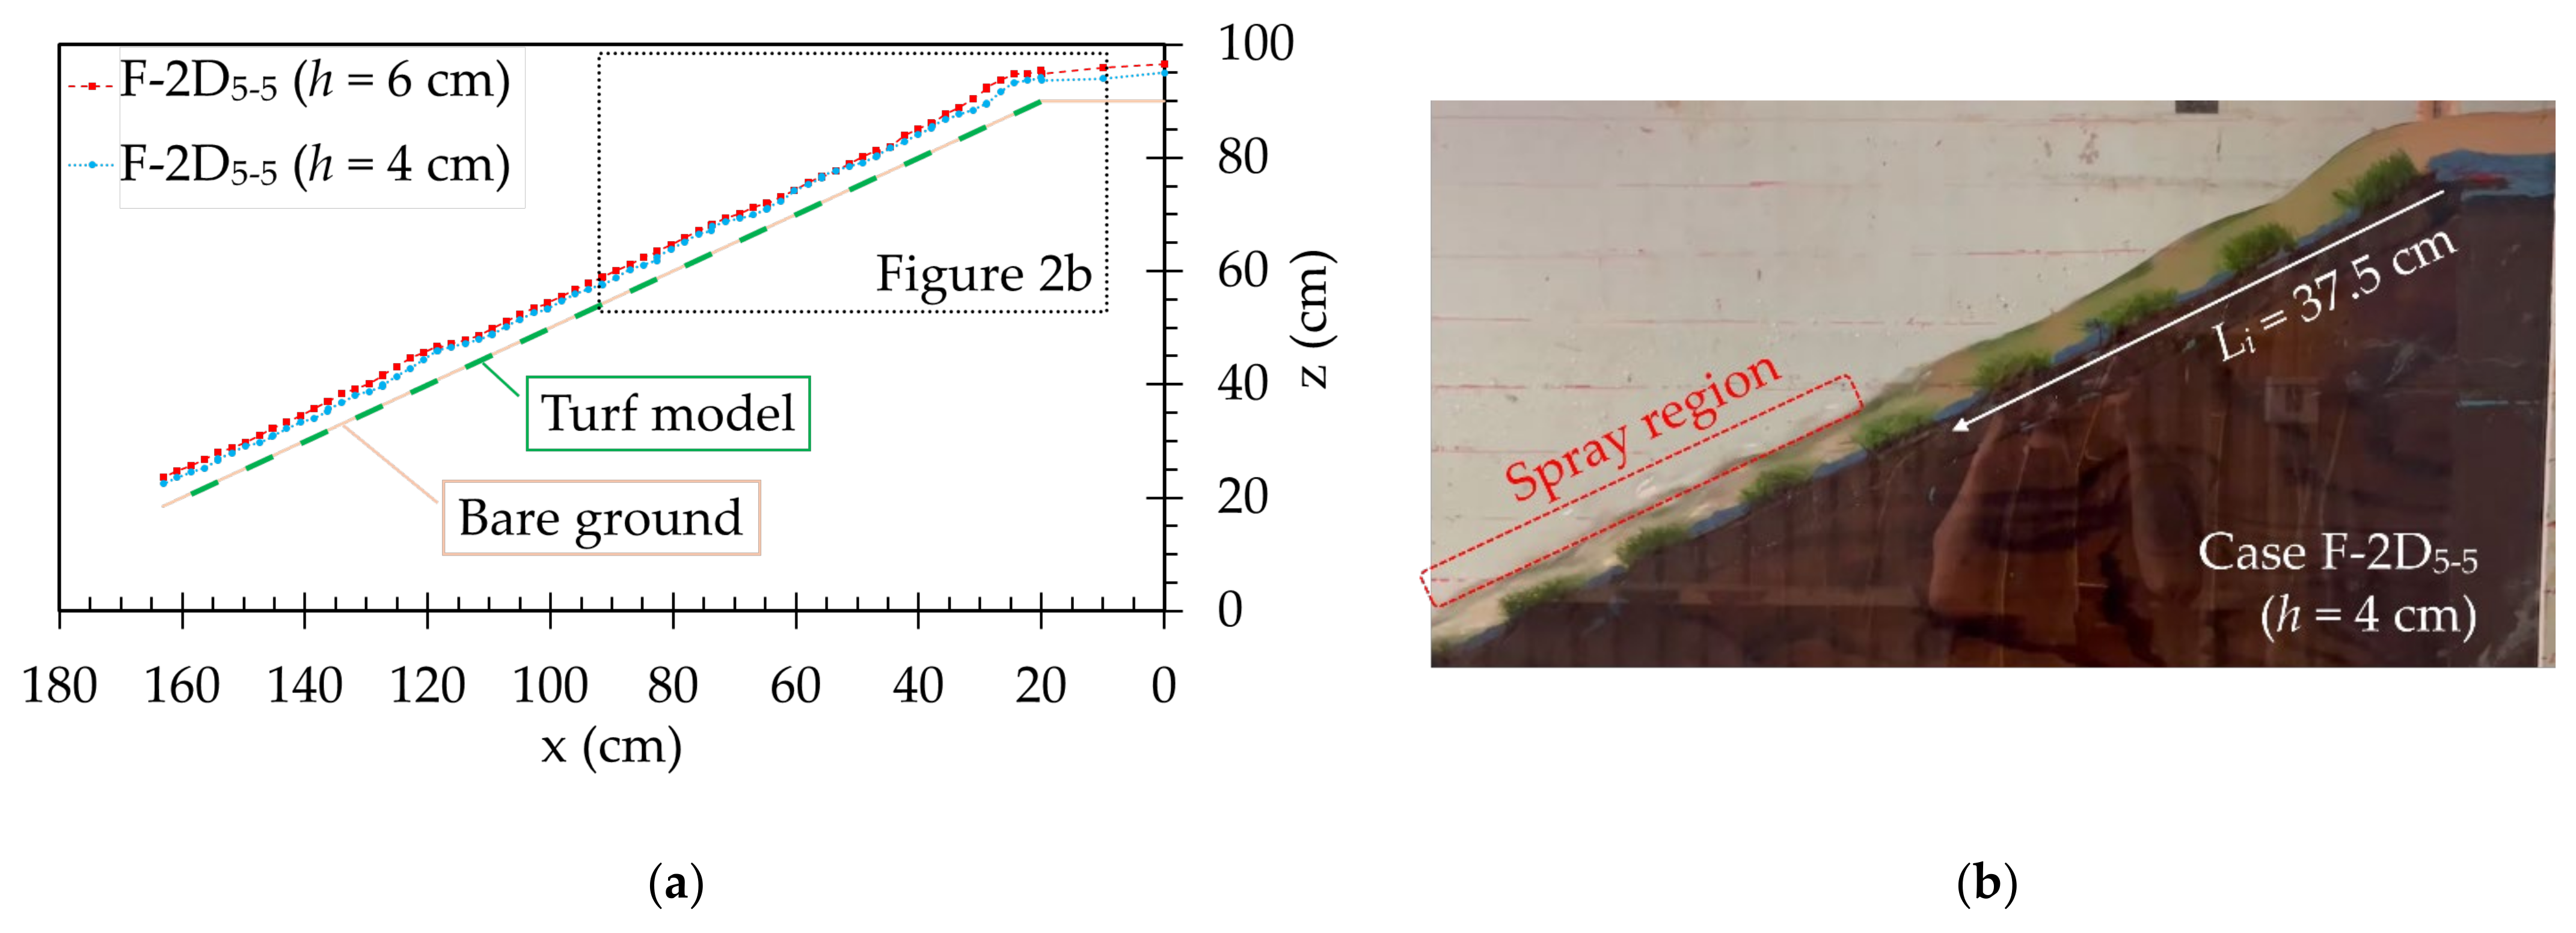
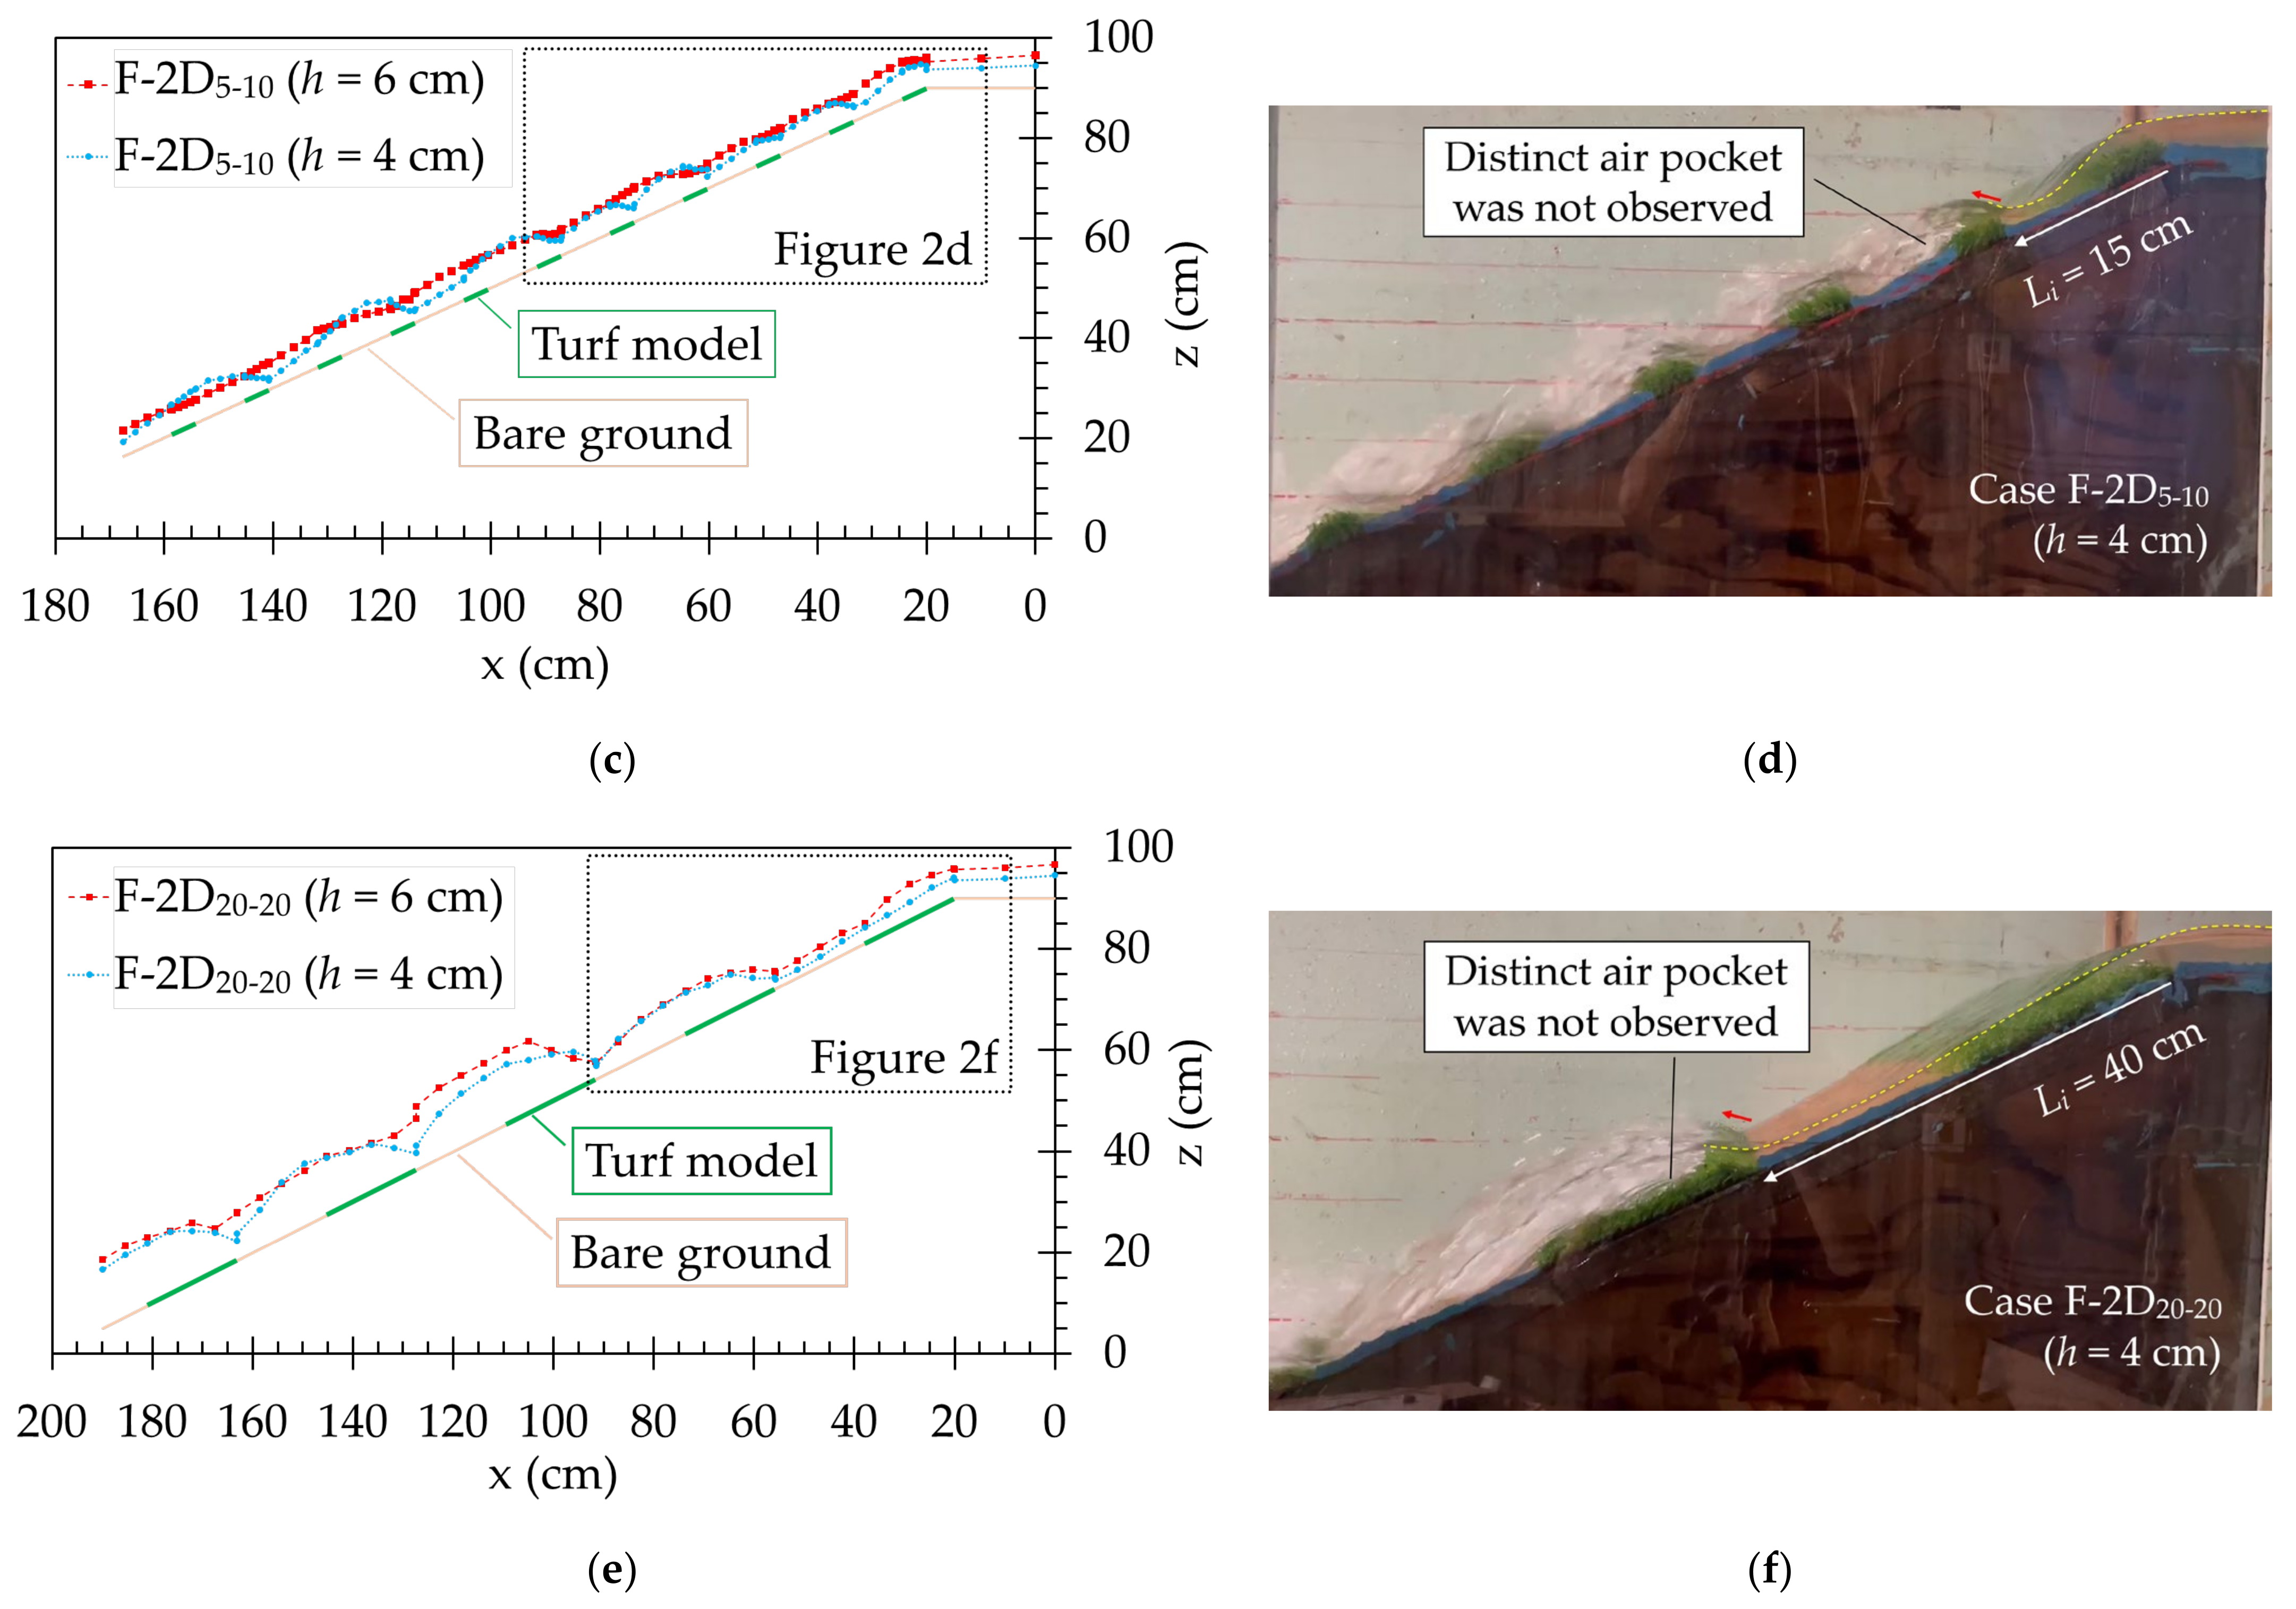
Figure 2 shows the water levels along the measurement line for Case F-2D at h = 4 cm and 6 cm, along with photographs of Case F-2D at h = 4 cm. In Case F-2D5-5, a spray region where water projection occurred was observed near the water surface, and the flow became quasi-uniform (Figure 2b). This is similar to the skimming flow of a stepped spillway. To quantify water surface fluctuations along the slope, the coefficient of variation (CV) was calculated as the ratio of the standard deviation to the mean water depth. In Case F-2D5-5 at h = 4 cm and 6 cm, where skimming flow was observed, the CV was 0.12 in both cases. This indicates that the variation in water depth due to surface disturbances was as small as about 12% of the mean water depth. In Case F-2D5-10 at h = 6 cm, the CV was 0.13, and skimming flow occurred. At h = 4 cm, the flow structure resembled a nappe flow. In this case, the CV was 0.29, which reflects the development of a nappe flow in which the water surface varied in a parabolic pattern corresponding to the spacing of the turf arrangement. However, distinct air pockets, typically observed in nappe flow overstepped spillways, were not observed (Figure 2d). This is likely due to the thin and flexible nature of the individual blades of turf, which caused the jet trajectory to fluctuate spatially and temporally, preventing consistent nappe flow formation. In Case F-2D20-20, nappe flow patterns were observed at both h = 4 and 6 cm (Figure 2f). The CVs at these flow depths were 0.49 and 0.40, respectively.
When a nappe flow was observed, the inception point of air entrainment corresponded to the location where the water surface gradient changed significantly, as indicated by the red arrows in Figure 2d,f. In contrast, under skimming flow conditions, the gradient change at the inception point was relatively small (Figure 2b). Similar to previous studies on spillways, this inception point can be determined by the development of a boundary layer, which will be discussed later. Further investigation, including vertical velocity profile measurements, is required to examine this in more detail.
Table 2 shows the distance Li in the flow direction from the top of the slope to the inception point of air entrainment in the fixed-bed experiments. In cases where h = 2 cm, except Case F-3D10-10, sparse air entrainment was observed near the water surface around some turf patches; however, continuous air entrainment along the flow direction did not develop. This phenomenon is considered to result from the turf height Ht being nearly equal to the water depth, which inhibited adequate flow acceleration. In contrast, Case F-3D10-10 exhibited continuous air entrainment in the streamwise direction, likely due to the three-dimensional arrangement of the turf, concentrating the flow on the bare ground and the relatively long bare area (Lb) in this case. In both cases of F-2D and F-3D, Li was shorter for h = 4 cm than for h = 6 cm. This is because, at ℎ = 4 cm, the relative turf height (= turf height/flow depth) was larger, and turbulence could easily occur.
The inception of air entrainment was observed either on the turfgrass or slightly upstream of it. Specifically, air entrainment occurred where the accelerated flow from the bare ground collided with the turfgrass. In Case F-2D, the upstream edges of the turfgrass were sparsely arranged along the flow direction, resulting in a large variation in Li. In both Cases of F-2D5-10 and F-2D20-20, the relatively large bare ground areas facilitated a greater flow acceleration, and the air entrainment occurred at the upstream edge of the second turf patch in both cases. However, because this edge was located at 15 cm and 40 cm, respectively, Li differed significantly between the two cases (Figure 2d,f). On the other hand, in Case F-3D, the turfgrass was arranged in a staggered pattern, resulting in a dense distribution of upstream turf edges along the flow direction. Therefore, multiple potential triggers for air entrainment were present, leading to smaller variations in Li.
The water level along the measurement line in photographs of Case F-3D10-10 (ℎ = 4 cm) is shown in Figure 3 to demonstrate the effects of the staggered arrangement of turf patches. Figure 3a,b present the water surface elevation and water depth, respectively. These figures show the mean value and standard deviation of the cross-sectional water depth, which was averaged across five measurement lines from y = 15 to 25 cm. Figure 3b also includes the water depths at y = 15 cm and 25 cm for comparison. Figure 3a indicates that the water surface fluctuations in Case F-3D10-10 were smaller than those in Cases F-2D5-10 and F-2D20-20. The flow in Case F-3D10-10 was quasi-uniform, similar to that in Case F-2D5-5 (Figure 3c). As shown in Figure 3b, the water depth increased and decreased depending on the turf arrangement. Therefore, the staggered arrangement of turf patches caused the phase of the flow depth fluctuation to differ by half a wavelength between different lateral positions (y). This phase shift is considered to inhibit the development of water surface fluctuations.
In Case F-2D5-5 and Case F-3D10-10, both of which exhibited skimming flow, the average water depth in the upstream slope section (x = 20–90 cm) was 4.1 cm and 3.9 cm, respectively. In contrast, the average water depth in the downstream section (x = 90–160 cm) in the two cases was 3.8 cm and 4.3 cm, respectively. This indicates that the flow in Case F-3D10-10 was less prone to acceleration along the slope. As shown in Figure 3d, the staggered vegetation arrangement generated a transverse flow component, which is thought to have contributed to the suppression of the flow acceleration. Figure 3e shows the cross-sectional distributions of water depth at x = 20.9, 24.5, 29.8, and 33.4 cm. In the bare ground sections, where the flow resistance was low, the water depth was relatively shallow. A part of the accelerated flow over the bare ground was diverted around the downstream turf, which had higher resistance. As a result, a transverse velocity component was generated.

3.2. Erosion of the Bare Ground of the Levee Slope in Semi-Mobile Experiments

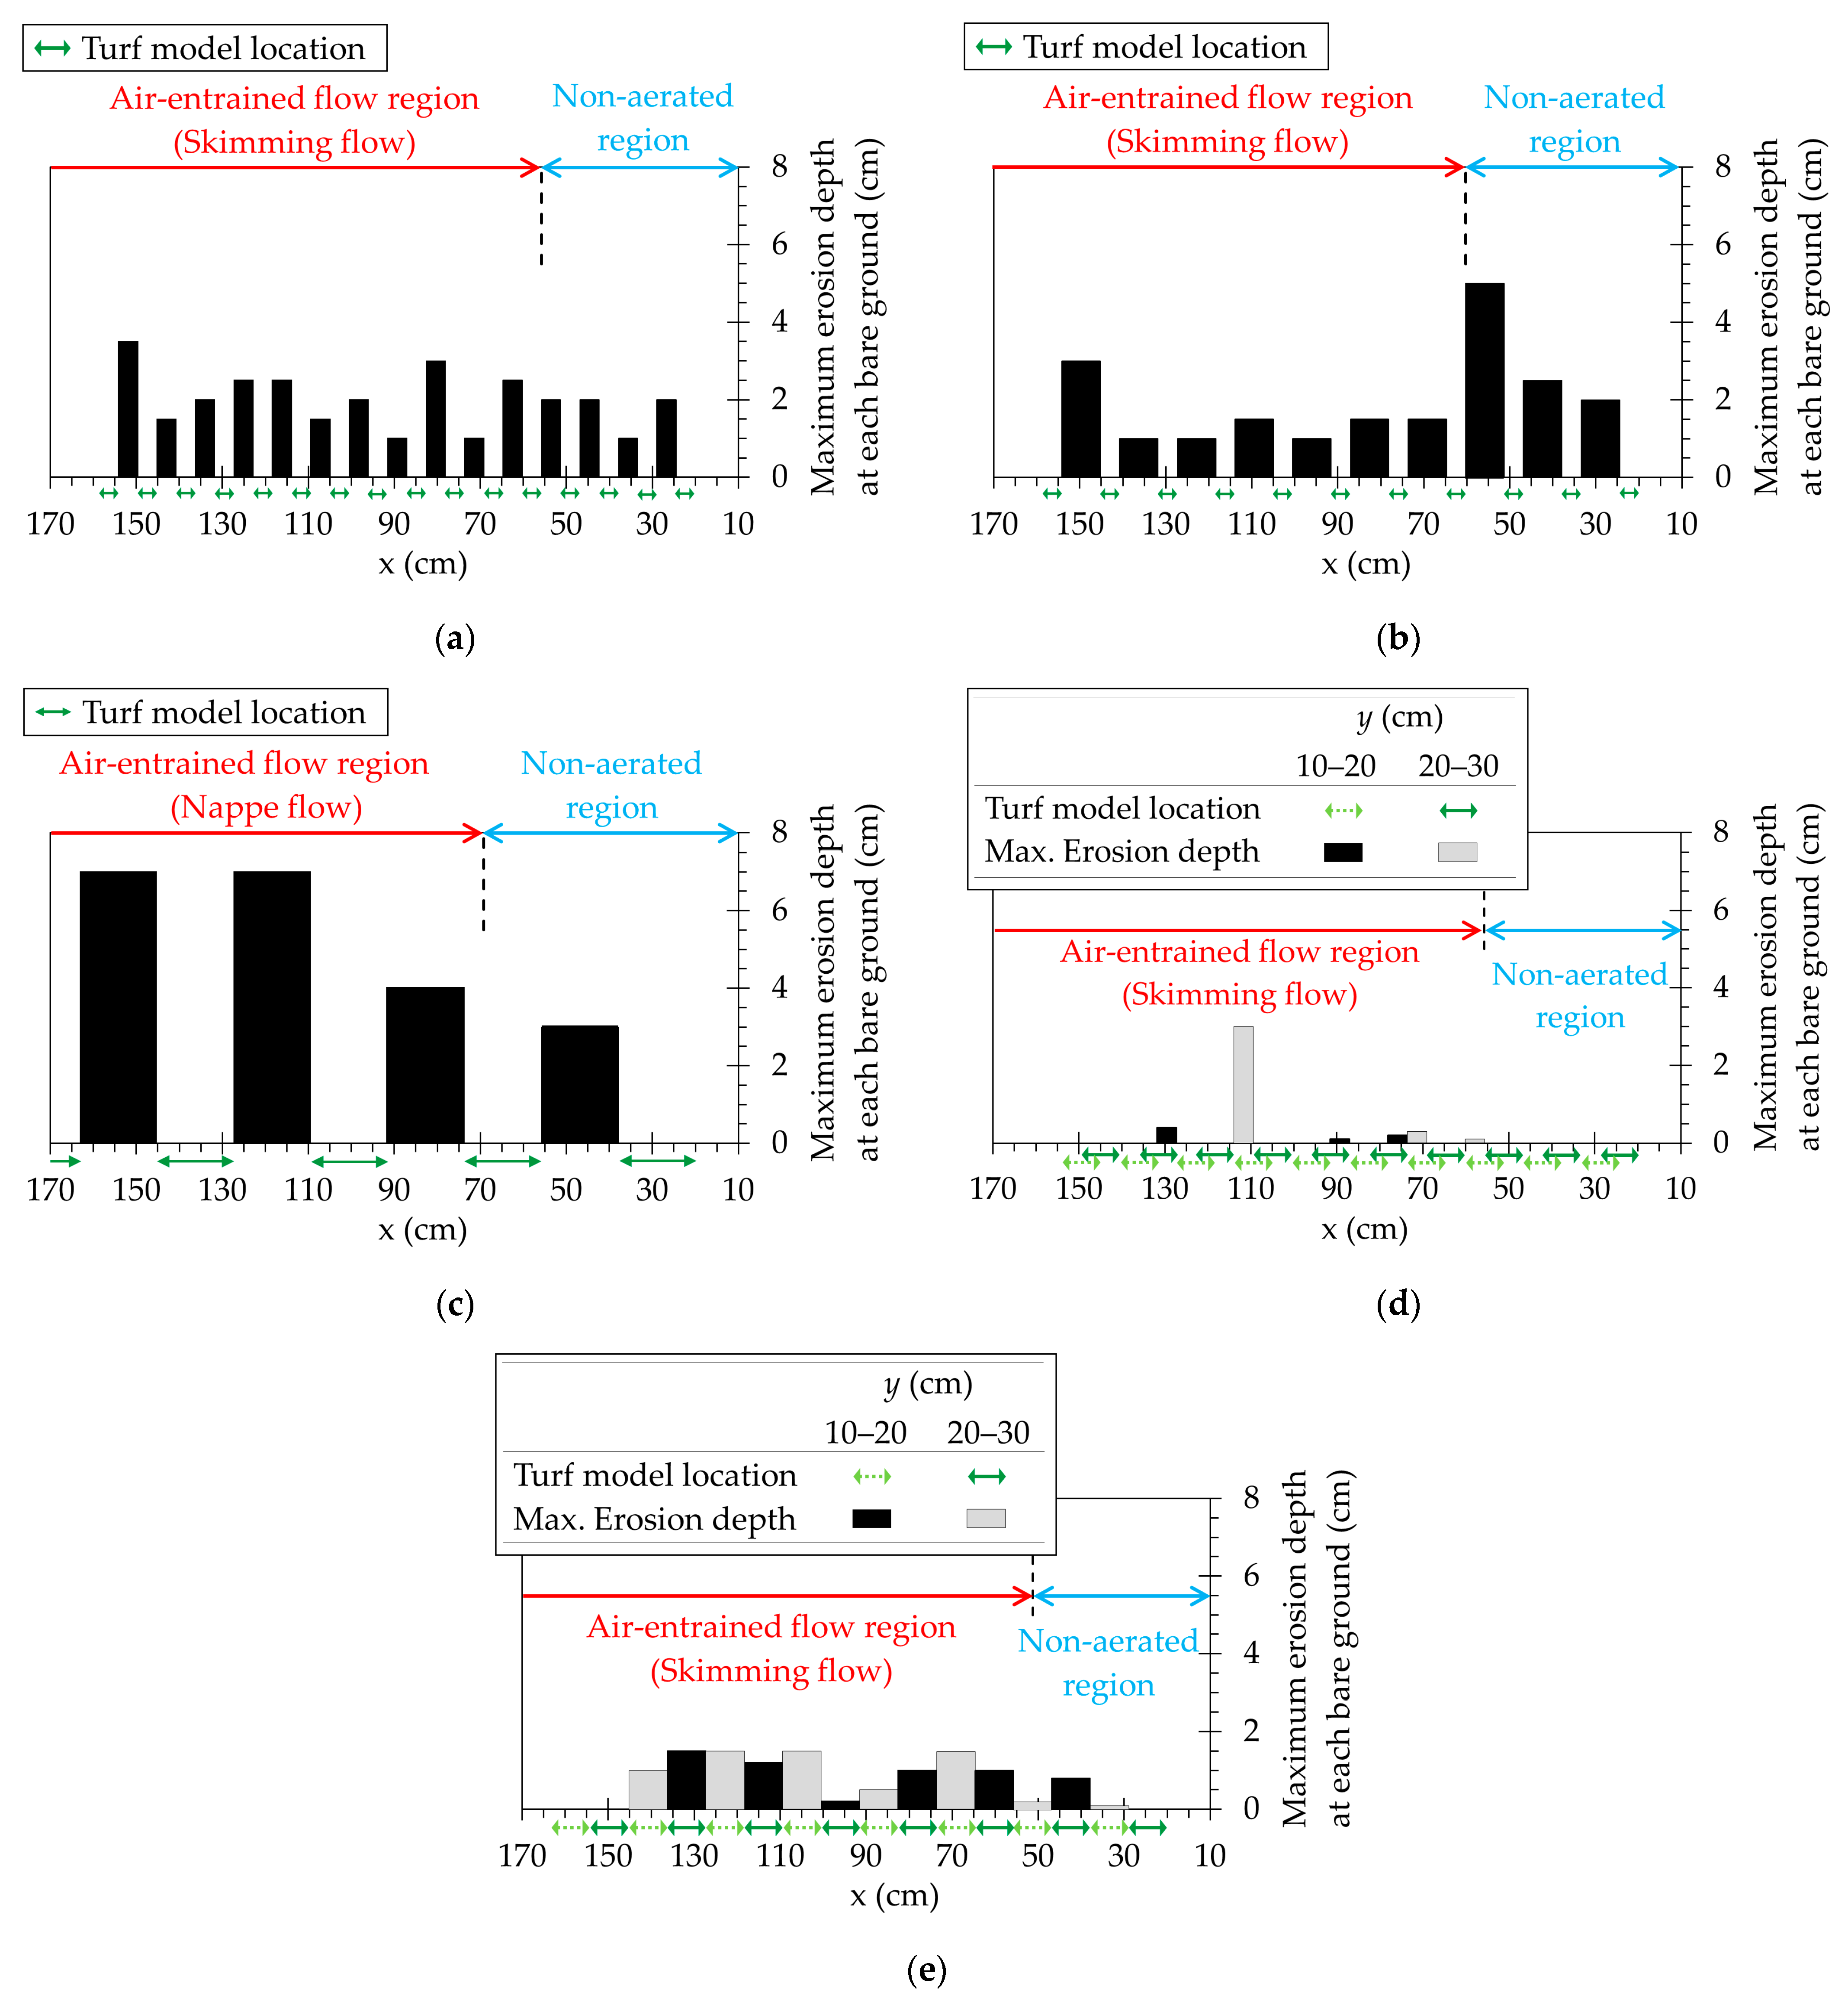
Figure 4 shows the maximum erosion depths in Cases Sm-2D5-5, Sm-2D5-10, Sm-2D20-20, Sm-3D10-5, and Sm-3D10-10 at h = 6 cm. In Cases Sm-2D5-5 and Sm-2D5-10, erosion depths were relatively shallow. After one hour of overflow, the maximum erosion depths for overflow depths of 2, 4, and 6 cm were approximately 1.5–2.0 cm, 1–2.5 cm, and 1–3.5 cm, respectively, in Case Sm-2D5-5, and approximately 1–4 cm, 1–4 cm, and 1–5 cm, respectively, in Case Sm-2D5-10. In Case Sm-2D5-10, significant erosion depth (5 cm) was observed in the most upstream bare ground area, which was located in the non-aerated region, as shown in Figure 4b. This is because the longer bare ground section in Case Sm-2D5-10 allowed for greater flow acceleration and resulted in higher shear stress compared to Case Sm-2D5-5. Although Case Sm-2D20-20 had the same turf coverage rate (50%) as Case Sm-2D5-5, the erosion depth was significantly greater. Even at h = 2 cm, the erosion depth reached 6–7 cm, indicating that nearly the entire movable bed would be washed away. At h = 4 and 6 cm, the erosion depth reached 7 cm in some bare ground after 10 and 25 min, respectively. These results suggest that to suppress erosion, the area of the bare ground, particularly the length of bare sections along the slope Lb, was more important than the overall turf coverage rate.
In Case Sm-3D10-5 at h = 2 cm, the maximum erosion depth was 0.7 cm. At h = 6 cm, erosion depths were generally less than 0.5 cm in most bare ground, with some locations exhibiting erosion depths of around 3 cm, as shown in Figure 4d. In Case Sm-3D10-10, the maximum erosion depth was 2.0 cm at h = 2 cm. At h = 6 cm, the erosion depth was 1–1.5 cm in most areas, as shown in Figure 4e. Despite having the same coverage rate and a larger Lb, Case Sm-3D10-10 exhibited shallower erosion depths than Case Sm-2D5-5. This suggests that a staggered arrangement of turfgrass and bare patches may reduce erosion depth. This effect is due to the induction of transverse (y-direction) flow components, which suppress flow acceleration in the downslope direction, as already mentioned.

4. Discussion

The results of our experiments suggest that air entrainment can play a role in suppressing levee erosion. In other words, the inception point of air entrainment is a key factor when discussing erosion risk reduction. This study compared the inception points of air entrainment between non-uniform turfgrass and a spillway. Much research on self-aeration has been conducted for spillways to prevent cavitation damage. In those studies, the inception point of air entrainment was generally defined as the location where the developing boundary layer reached the free surface, as shown in Figure 5. Wood et al. [26] conducted multiple regression analyses based on the relationship between surface roughness and boundary layer thickness, using data from previous studies. As a result, they proposed predictive equations for the inception point of air entrainment (Equations (1) and (2)), which showed good agreement with results from both laboratory experiments and field observations:
L i   k s   = 13.6 sin θ 0.0796 F * 0.713 ,
F * = q g sin θ k s 3 ,
where ks is the surface roughness (m), θ is the slope of the spillway, q is the unit discharge (m3/s/m), and g is the acceleration due to gravity (m/s2). F is the discharge parameter, also referred to as the roughness Froude number. While the Froude number represents the ratio of inertial to gravitational forces using flow depth as the reference length, the roughness Froude number instead uses the roughness height (ks). In addition, sin θ is included to account for the component of gravitational force acting along the slope.
Chanson [14] applied this theory to stepped spillways and proposed Equation (3) based on experimental results:
L i   k s   = 9.8 sin θ 0.080 F * 0.71 .
In this equation, ks is defined as H S cos θ , where H S is the vertical step height (Figure 5).
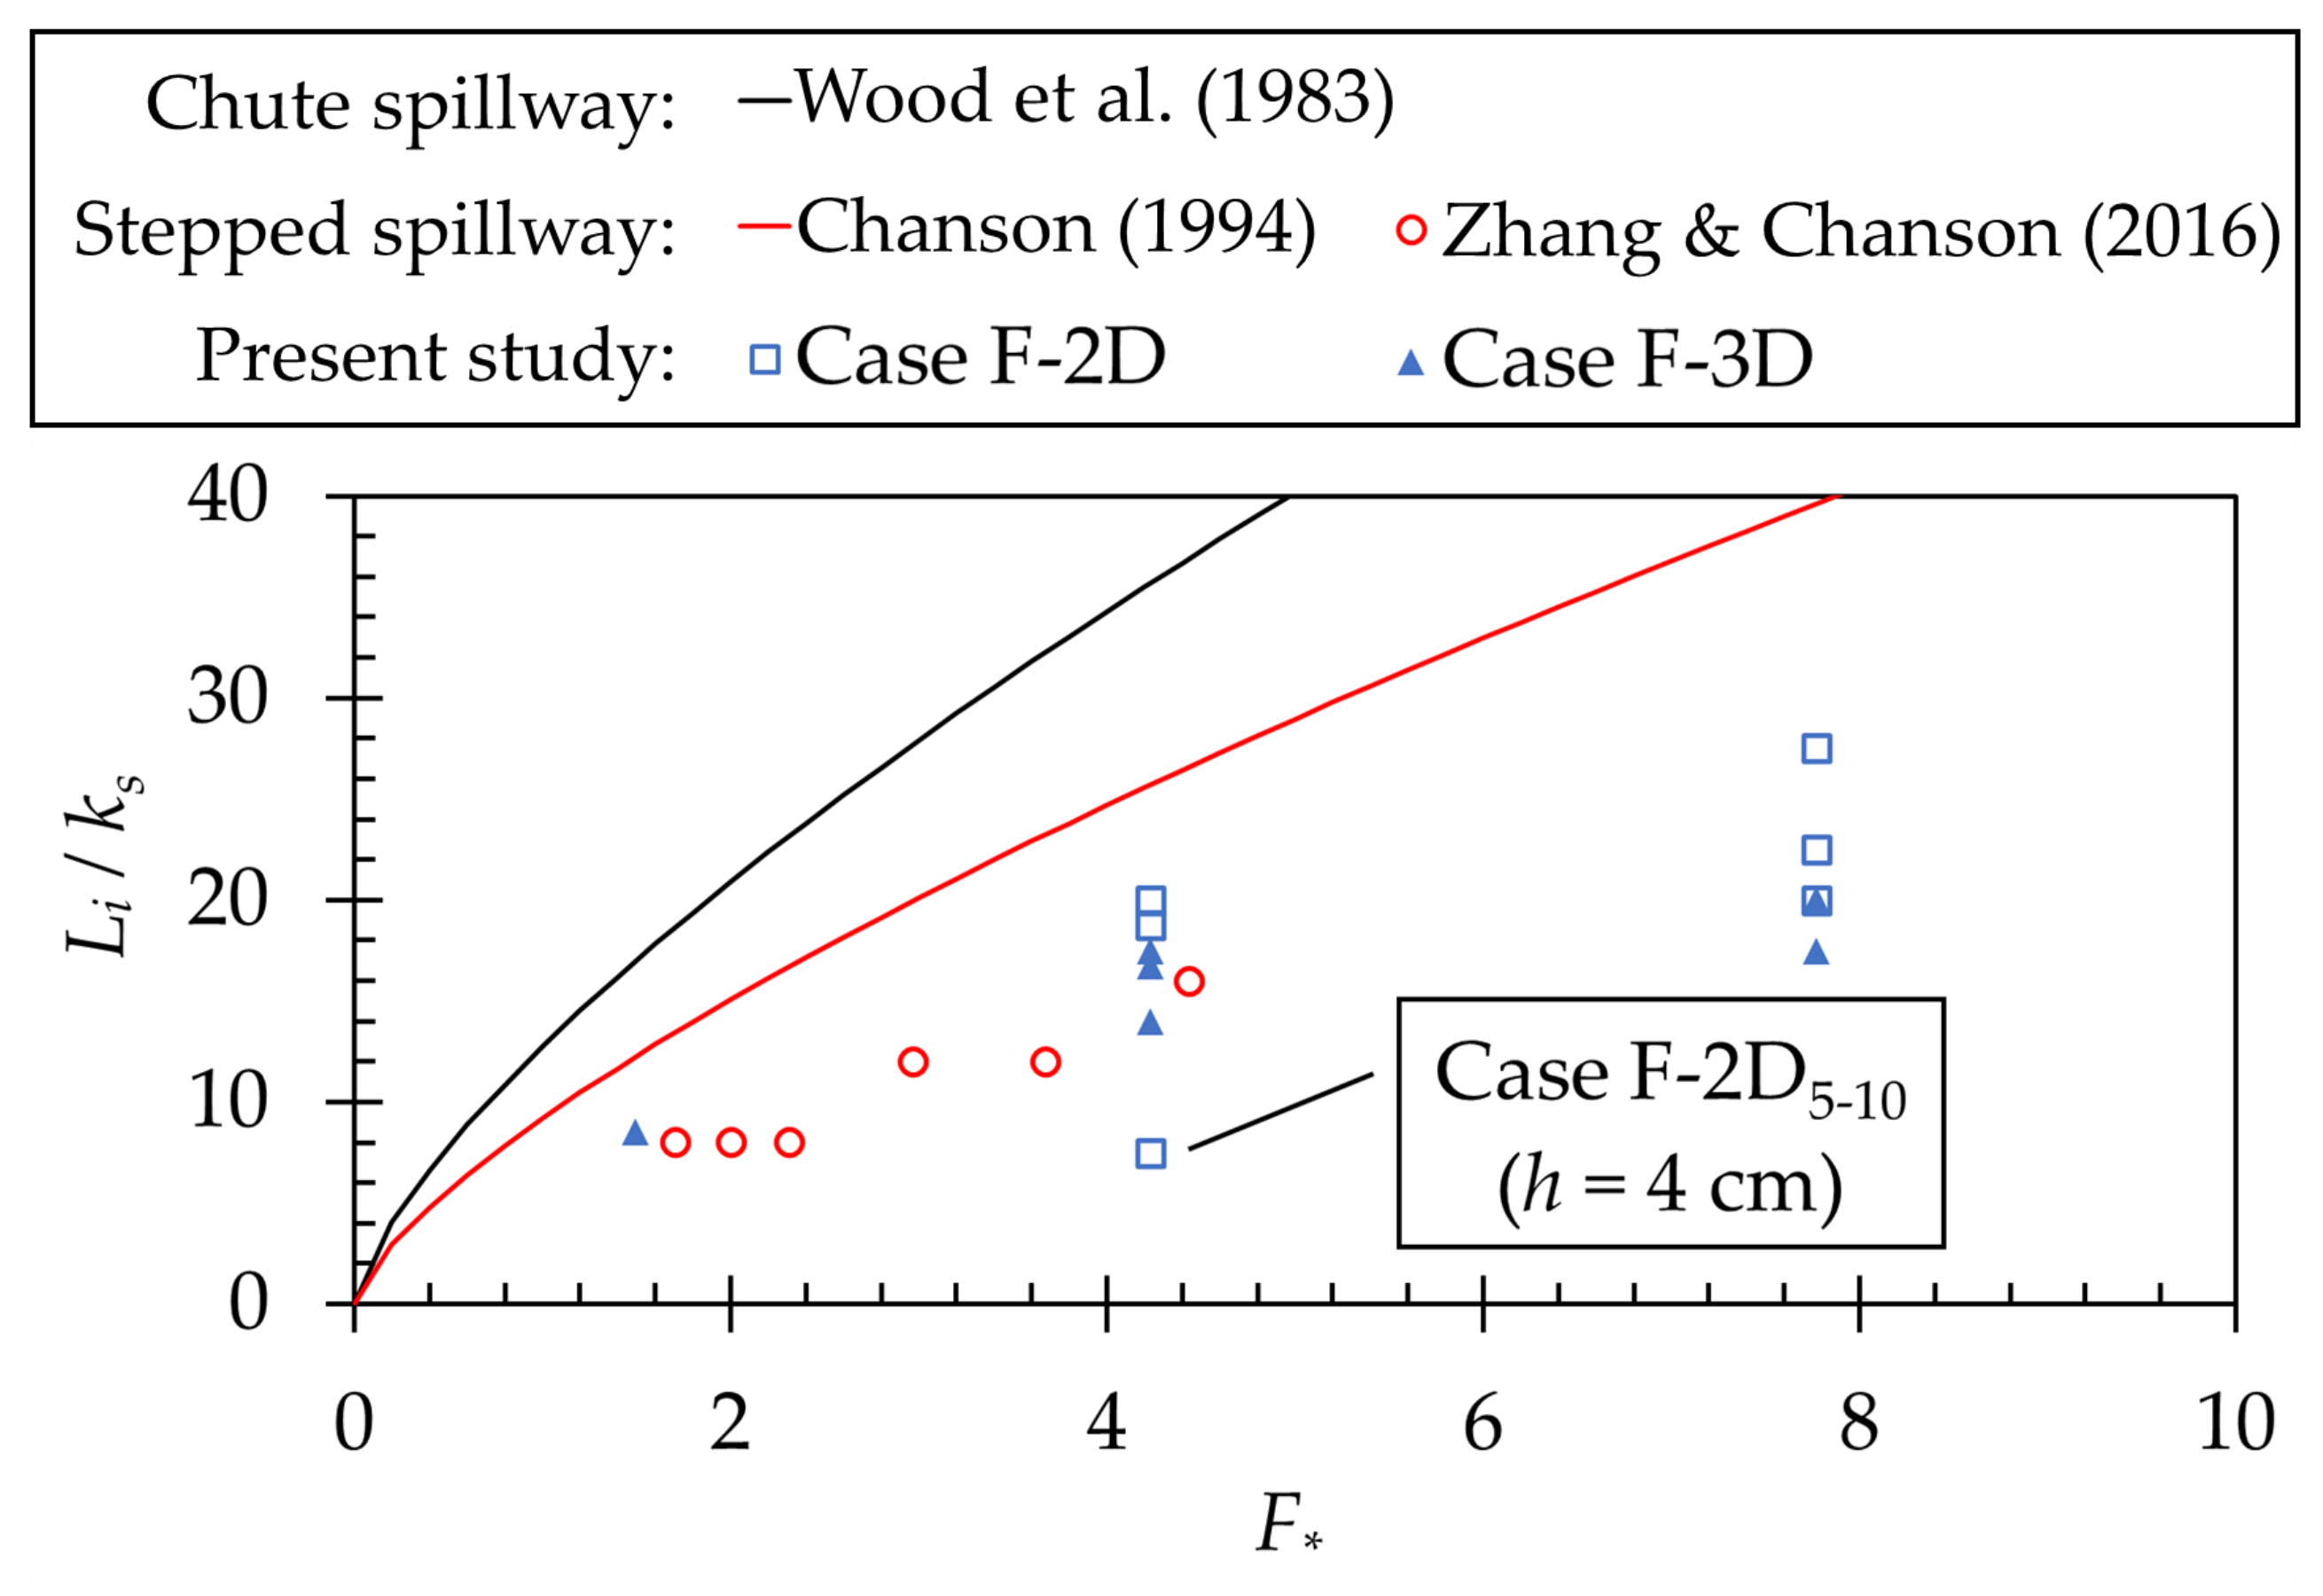
Figure 6 compares the inception points of air entrainment for non-uniform turfgrass-covered slopes (Cases F-2D and F-3D), a smooth spillway [26], and stepped spillways [14,27]. As described above, the equations proposed by Wood et al. [26] (Equations (1) and (2)) are empirical formulas for predicting the inception point of air entrainment in chute spillways, and their validity has been confirmed through laboratory and field data. As noted by Chanson [14], the inception point tends to occur closer to the crest in stepped spillways compared to chute spillways. Zhang and Chanson [27] conducted large-scale experiments on a stepped channel with a slope of θ = 45 ° and noted that while Equation (3) tends to overestimate the inception point, the overall trend is consistent.
For the turfgrass cases, the roughness height ks was taken as the turf height Ht, as shown in Figure 1a. In most of the F-2D and F-3D cases, the inception points of air entrainment were comparable to those of the stepped spillways, particularly to the results of Zhang and Chanson [27]. In our study, Li in Case F-2D5-10 is the shortest among all cases, due to the shortest acceleration distance. In stepped spillway experiments, roughness (steps) was installed immediately and continuously downstream of the crest. In Case F-2D5-10, although turfgrass covered the first 5 cm immediately downstream of the crest, the subsequent 10 cm was bare ground, which facilitated flow acceleration. The accelerated flow impinged on the turfgrass, resulting in earlier air entrainment.
Turfgrass consists of thin, flexible blades of grass. Under subcritical flow conditions, a flexible cylinder generates stronger turbulence and induces more variation in velocity distribution than a rigid cylinder [28]. Furthermore, in the presence of cylinders under a supercritical flow, particularly when the flow depth is slightly greater than the cylinder height, turbulence is generated due to the velocity gradient between the high-speed flow near the water surface and the lower-speed flow around the cylinders [29]. Based on these findings, it is considered that the non-uniform turfgrass induces turbulence and air entrainment due to both the flexibility of the turfgrass and the velocity variation.
In Case F-2D5-10, although significant erosion occurred on the most upstream bare ground in a non-aerated flow region, the erosion depth was small downstream in an air-entrained flow region. To achieve the shear force reduction caused by air entrainment, it is important to minimize the distance to the inception point of air entrainment Li. When flow is sufficiently accelerated over the turfgrass, air entrainment can be expected to enhance erosion resistance. One type of levee designed to prevent erosion due to overtopping uses blocks to protect the weak point of the slope near the crest. By making these slope blocks longer, the flow is accelerated and collides with the turfgrass, which can cause air entrainment. On the other hand, if the flow is excessively accelerated, a nappe flow may form, and the landing point can be severely eroded. In our experiments, the presence of large bare ground areas led to excessive flow acceleration, resulting in the formation of nappe flow, and severe erosion was observed at the point of nappe impingement. Therefore, when large bare ground areas, especially in the streamwise direction, are formed, maintenance of the turfgrass becomes necessary. Further investigation is needed to clarify the relationship between the air entrainment rate and shear stress, as well as to quantitatively evaluate its effectiveness in preventing erosion.

5. Conclusions

On levee slopes covered with non-uniformly distributed turfgrass due to insufficient maintenance, air entrainment occurs as the flow accelerates over bare patches and subsequently collides with the flexible turfgrass. The point of inception of air entrainment was shown to be similar to or shorter than that observed in stepped spillways. Flume experiments also showed that once air entrainment is fully developed, the erosion depth tends to decrease. This finding suggests the potential to suppress erosion not by strengthening the levee structure itself but by altering the flow characteristics. However, when large bare patches lead to the formation of nappe flow, severe erosion can still occur despite air entrainment. Therefore, further research is required to deepen understanding of these phenomena and reduce the risk of levee erosion.

Author Contributions

Conceptualization, N.T.; methodology, Y.I. and N.T.; validation, Y.I.; formal analysis, Y.I.; investigation, resources, and data curation, Y.I., N.T., M.W.A.J. and T.K.; writing—original draft preparation, Y.I.; writing—review and editing, N.T.; visualization, Y.I.; supervision, N.T.; project administration, N.T. All authors have read and agreed to the published version of the manuscript.

Funding

This study was partially funded by JSPS grant-in-Aid for Scientific Research (KAKENHI) (No. 24K07677).

Data Availability Statement

The original contributions presented in this study are included in the article. Further inquiries can be directed to the corresponding author.

Conflicts of Interest

The authors declare no conflicts of interest.

Abbreviations

The following abbreviations are used in this manuscript:
MLITMinistry of Land, Infrastructure, Transport and Tourism

References

  1. Tengbeh, G.T. The Effect of Grass Cover on Bank Erosion. Ph.D. Dissertation, Cranfield Institute of Technology, Bedfordshire, UK, 1989. [Google Scholar]
  2. De Baets, S.; Poesen, J.; Gyssels, G.; Knapen, A. Effects of grass roots on the erodibility of topsoils during concentrated flow. Geomorphology 2006, 76, 54–67. [Google Scholar] [CrossRef]
  3. Ali, F.H.; Osman, N. Shear strength of a soil containing vegetation roots. Soils Found. 2008, 48, 587–596. [Google Scholar] [CrossRef]
  4. Koelewijn, A.R.; Rikkert, S.J.; Peeters, P.; Depreiter, D.; van Damme, M.; Zomer, W. Overflow tests on grass-covered embankments at the Living Lab Hedwige-Prosperpolder: An overview. Water 2022, 14, 2859. [Google Scholar] [CrossRef]
  5. Wegman, R. Strength of Grass Covers on Dikes. Master’s Thesis, Delft University of Technology, Delft, The Netherlands, 2020. Available online: https://repository.tudelft.nl/record/uuid:9af2efca-90e7-4006-95a7-8d87180b0709 (accessed on 8 August 2025).
  6. Hattori, A.; Mochizuki, T.; Fujita, K. Estimation of erosion resistance of the levee slopes covered by vegetation which is managed by two cuttings per year. Proc. Hydraul. Eng. 1997, 41, 367–372, (In Japanese with English Summary). [Google Scholar] [CrossRef]
  7. Zhang, M.; Zhang, K.; Cen, Y.; Wang, P.; Xia, J. Effects of grass cover on the overland soil erosion mechanism under simulated rainfall. Water Resour. Res. 2025, 61, e2023WR036888. [Google Scholar] [CrossRef]
  8. Straub, L.G.; Anderson, A.G. Experiments on self-aerated flow in open channels. J. Hydraul. Div. 1958, 84, 1–35. [Google Scholar] [CrossRef]
  9. Keller, R.J. Field Measurement of Self-Aerated High Speed Open Channel Flow. Ph.D. Thesis, U Canterbury, Christchurch, New Zealand, 1972. [Google Scholar]
  10. Chanson, H. Air Entrainment in Chutes and Spillways; Research Report. No. CE 133; Dept. of Civil Engineering, The University of Queensland: Brisbane, Australia, 1992; 85p. [Google Scholar]
  11. Wood, I.R. Uniform region of self-aerated flow. J. Hydraul. Eng. 1983, 109, 447–461. [Google Scholar] [CrossRef]
  12. Chanson, H. Drag reduction in open channel flow by aeration and suspended load. J. Hydraul. Res. 1994, 32, 87–101. [Google Scholar] [CrossRef]
  13. Sorensen, R.M. Stepped spillway hydraulic model investigation. J. Hydraul. Eng. 1985, 111, 1461–1472. [Google Scholar] [CrossRef]
  14. Chanson, H. Hydraulics of skimming flows over stepped channels and spillways. J. Hydraul. Res. 1994, 32, 445–460. [Google Scholar] [CrossRef]
  15. Briaud, J.L.; Chen, H.C.; Govindasamy, A.V.; Storesund, R. Levee erosion by overtopping in New Orleans during the Katrina Hurricane. J. Geotech. Geoenvironmental Eng. 2008, 134, 618–632. [Google Scholar] [CrossRef]
  16. Sills, G.L.; Vroman, N.D.; Wahl, R.E.; Schwanz, N.T. Overview of New Orleans levee failures: Lessons learned and their impact on national levee design and assessment. J. Geotech. Geoenvironmental Eng. 2008, 134, 556–565. [Google Scholar] [CrossRef]
  17. Van der Meer, J.W. Guidance on Erosion Resistance of Inner Slopes of Dikes from 3 Years of Testing with the Wave Overtopping Simulator; Van der Meer Consulting: Leonards, Australia, 2009. [Google Scholar]
  18. Pan, Y.; Li, L.; Amini, F.; Kuang, C. Influence of three levee-strengthening systems on overtopping hydraulic parameters and hydraulic equivalency analysis between steady and intermittent overtopping. J. Waterw. Port. Coast. Ocean. Eng. 2013, 139, 256–266. [Google Scholar] [CrossRef]
  19. Ahadiyan, J.; Bahmanpouri, F.; Adeli, A.; Gualtieri, C.; Khoshkonesh, A. Riprap effect on hydraulic fracturing process of cohesive and non-cohesive protective levees. Water Resour. Manag. 2022, 36, 625–639. [Google Scholar] [CrossRef]
  20. Abbas, F.M.; Tanaka, N. Utilization of geogrid and water cushion to reduce the impact of nappe flow and scouring on the downstream side of a levee. Fluids 2022, 7, 299. [Google Scholar] [CrossRef]
  21. Yasuda, S.; Shimizu, Y.; Deguchi, K. Investigation of the mechanism of the 2015 failure of a dike on Kinu River. Soils Found. 2016, 56, 581–592. [Google Scholar] [CrossRef]
  22. Ministry of Land, Infrastructure, Transport and Tourism (MLIT). Study on Resilient River Levees Against Overtopping. 2022. Available online: https://www.mlit.go.jp/river/shinngikai_blog/teibou_kentoukai/dai01kai/pdf/kentou.pdf (accessed on 31 October 2024). (In Japanese).
  23. Billah, M.M.; Yagisawa, J. Headcut migration in earthen embankment induced by varying sub-surface and seepage state under overflow. Geotech. Geol. Eng. 2023, 41, 4659–4676. [Google Scholar] [CrossRef]
  24. Sherzai, J.H.; Tanaka, N.; Igarashi, Y.; Onose, R. Effects of Soil Characteristics on Levee Erosion and the Behavior of Twin Eddies in a Scoured Hole Generated by Nappe Flow. Int. J. Civ. Eng. 2025, 23, 1287–1305. [Google Scholar] [CrossRef]
  25. Afreen, S.; Yagisawa, J.; Binh, V.D.; Tanaka, N. Investigation of scour pattern downstream of levee toe due to overtopping flow. J. Jpn. Soc. Civ. Eng. Ser. B1 2015, 71, I_175–I_180. [Google Scholar] [CrossRef]
  26. Wood, I.R.; Ackers, P.; Loveless, J. General method for critical point on spillways. J. Hydraul. Eng. 1983, 109, 308–312. [Google Scholar] [CrossRef]
  27. Zhang, G.; Chanson, H. Hydraulics of the developing flow region of stepped spillways. I: Physical modeling and boundary layer development. J. Hydraul. Eng. 2016, 142, 04016015. [Google Scholar] [CrossRef]
  28. Dol, S.S.; Wee, S.K.; Yong, T.H.; Sulaiman, S.A. The effects of flexible cylinder structural dynamics to the near wake turbulence. Fluids 2023, 8, 270. [Google Scholar] [CrossRef]
  29. Igarashi, Y.; Tanaka, N.; Zaha, T. Changes in flow structures and energy reduction through compound tsunami mitigation system with embankment and lined piles. Ocean. Eng. 2018, 164, 722–732. [Google Scholar] [CrossRef]
Figure 1. Images of the levee models and artificial turf arrangement installed in the channel: (a) longitudinal section of the model in the fixed-bed experiments; (b) longitudinal section of the model in the semi-movable bed experiments; (c) plan view of Case F-2D; (d) plan view of Case F-3D.
Fluids 10 00212 g001
Figure 2. Water level along the measurement line shown in Figure 1c: (a) Case F-2D5-5 (h = 4 and 6 cm); (b) Case F-2D5-5 (h = 4 cm); (c) Case F-2D5-10 (h = 4 and 6 cm); (d) Case F-2D5-10 (h = 4 cm); (e) Case F-2D20-20 (h = 4 and 6 cm); (f) Case F-2D20-20 (h = 4 cm).
Fluids 10 00212 g002aFluids 10 00212 g002b
Figure 3. Effect of staggered turf patch arrangement in Case F-3D10-10 (h = 4 cm): (a) water level along the measurement line as shown in Figure 1d; (b) flow depth and turf model location (light blue symbols indicate the average and standard deviations, as in Figure 3a); (c) photograph taken from the left-hand side of the flume; (d) photograph taken downstream; (e) the cross-sectional distributions of water depth.
Fluids 10 00212 g003
Figure 4. Maximum erosion depth of each bare ground at h = 6 cm: (a) Case Sm-2D5-5 (after 1 h overflow); (b) Case Sm-2D5-10 (after 1 h overflow); (c) Cases Sm-2D20-20 (after 25 min overflow); (d) Sm-3D10-5 (after 1 h overflow); (e) Sm-3D10-10 (after 1 h overflow).
Fluids 10 00212 g004
Figure 5. Self-aeration on a chute spillway and a stepped spillway.
Fluids 10 00212 g005
Figure 6. Inception point of air entrainment: comparison between the present study and previous studies [14,26,27].
Fluids 10 00212 g006
Table 1. Experiment cases.
CaseSlope
Condition
h (cm)Ht (cm)Lt (cm)Wt (cm)Lb (cm)Wb (cm)Turf Coverage
(%)
F-2D5-5Fixed2, 4, 6255055050
F-2D5-10Fixed2, 4, 62550105033.3
F-2D20-20Fixed2, 4, 622050205050
F-3D10-5Fixed2, 4, 62101051066.7
F-3D10-8Fixed2, 4, 62101081055.6
F-3D10-10Fixed2, 4, 621010101050
Sm-2D5-5Semimobile2, 4, 6255055050
Sm-2D5-10Semimobile2, 4, 62550105033.3
Sm-2D20-20Semimobile2, 4, 622050205050
Sm-3D10-5Semimobile2, 4, 62101051066.7
Sm-3D10-10Semimobile2, 4, 621010101050
Table 2. Experimental results.
h (cm)CaseLi (cm)Li/HtF (from Equation (2))
2F-2D5-5No No 1.50
F-2D5-10No No
F-2D20-20No No
F-3D10-5No No
F-3D10-8No No
F-3D10-10178.5
4F-2D5-537.518.84.23
F-2D5-10157.5
F-2D20-204020
F-3D10-53517.5
F-3D10-82811.5
F-3D10-1033.512.5
6F-2D5-55527.57.77
F-2D5-104522.5
F-2D20-204020
F-3D10-54020
F-3D10-84020
F-3D10-103517.5
: Air entrainment was not observed.
Disclaimer/Publisher’s Note: The statements, opinions and data contained in all publications are solely those of the individual author(s) and contributor(s) and not of MDPI and/or the editor(s). MDPI and/or the editor(s) disclaim responsibility for any injury to people or property resulting from any ideas, methods, instructions or products referred to in the content.