Article

Computational Fluid Dynamics Modeling of Sweep Gas Flow Rate-Dependent Carbon Dioxide Removal in Oxygenators

1
Department of Biomedical Engineering, Lawrence Technological University, Southfield, MI 48075, USA
2
Department of Biomedical Engineering, Marquette University, Milwaukee, WI 53233, USA
*
Author to whom correspondence should be addressed.
Fluids 2025, 10(6), 158; https://doi.org/10.3390/fluids10060158
Submission received: 28 April 2025 / Revised: 11 June 2025 / Accepted: 13 June 2025 / Published: 15 June 2025
(This article belongs to the Special Issue Respiratory Flows)

Abstract

:
Computational fluid dynamics (CFD) models have been widely used to evaluate the hydrodynamic and gas exchange performances of oxygenators, which are crucial in supporting patients with lung diseases or failure. However, while CFD models have been effective in analyzing oxygen transfer, they have not adequately addressed the experimentally demonstrated effects of varying sweep gas flow rates on CO2 removal. This is a critical gap, as sweep gas flow directly influences the CO2 transfer efficiency in oxygenators. To fill this gap, we extend our previously developed 1D mathematical model into a 3D computational framework to predict both blood pressure drops and the rates of oxygen and CO2 transfers in oxygenators. The comparison between our model predictions and experimental data validates the model’s capability in capturing the overall trends in CO2 transfer/removal rates under different sweep gas flow rates. The results also demonstrated that our model can predict CO2 removal more accurately, particularly in scenarios where adjusting the sweep gas flow rate is essential for optimizing the oxygenator performance.

1. Introduction

Lung disease continues to be a leading cause of death globally, affecting millions each year and resulting in significant annual mortality [1]. Blood oxygenators or artificial lungs are commonly used to support patients with lung disease or failure [2,3,4]. In the past two decades, significant research has focused on developing highly efficient, compact artificial lungs for both short-term and long-term support or as a bridge to transplantation [2,5,6,7]. The core component of modern blood oxygenators is the microporous hollow fiber membrane (HFM), which facilitates the gas exchange between blood and gas. These HFMs consist of hundreds or thousands of small hollow fibers. In most configurations, blood flows around the outside of the fibers, while sweep gas (typically pure oxygen) flows inside the fiber lumens. Due to the concentration gradients of oxygen (O2) and carbon dioxide (CO2) between the blood and the sweep gas, O2 diffuses from the fiber wall into the blood while CO2 diffuses from the blood into the fiber lumen. The performance of an HFM bundle is influenced by various factors, including the fiber material, the surface area of the fibers in contact with the blood and the contact time.
Computational fluid dynamics (CFD)-based models have been widely developed and implemented to analyze gas transfer in HFM bundles within oxygenators, enabling virtual prototyping that may reduce design costs. It also provides detailed insight into hemodynamic performance, unfavorable flow characteristics, regions with high shear stresses and shear-induced blood damage in most blood-contacting medical devices [8,9,10,11]. In CFD modeling, the HFM bundle is typically simplified as a homogeneous porous medium to numerically solve for the blood flow and gas transfer within the fiber bundles. Over the past decades, HFM bundles with various configurations have been extensively studied for their gas transfer performance using CFD methods. For example, Hormes et al. [12] modified a CFD model to predict both oxygen and carbon dioxide transfers in a custom-designed micromembrane oxygenator with a highly reproducible fiber arrangement and bundle geometry; Asiltürk et al. [13] evaluated the maximum gas transfer performance of microfluidic artificial lungs with fiber bundles arranged in varying column-to-row aspect ratios; Wu et al. [7,14] studied the gas transfer performances of flat and cylindrical oxygenators for both pediatric and adult applications; Barbian et al. [15] investigated the gas transfer of the oxygenator fiber membrane with triply periodic minimal surfaces; Focke et al. [16] studied the influence of the membrane fiber arrangement on gas exchange; Li et al. [17] examined the effects of clinical modalities and oxygenator configurations on oxygen transfer efficiency; and Tang et al. [18], from a different perspective, used a CFD model to study the influence of pulsatile blood flow on oxygen transport in oxygenators. Among these studies, most focused solely on oxygen transfer, and only a few considered both oxygen and carbon dioxide exchange. However, none accounted for the effect of the sweep gas flow rate on carbon dioxide removal—despite this phenomenon being reported in both experimental [2] and clinical studies [19].
Although the sweep gas flow rate—or its ratio to the blood flow rate—has been shown to have no impact on oxygen transfer, it does influence carbon dioxide removal [2,20]. To account for this effect, several 1D mathematical models [3,21] and a 2D simulation tool [20] have been developed. However, to the best knowledge of the authors, there is no reported 3D CFD model considering this effect when modeling carbon dioxide removal in oxygenators. Therefore, there is a need for a validated CFD model that includes this effect to enable a more accurate prediction of carbon dioxide removal.
This study aims to address this gap by extending a previously developed mathematical model into a 3D CFD framework that integrates the blood pressure drop across the device, oxygen transport and carbon dioxide removal while accounting for the sweep gas effect. The specific aims include the following:
  • Develop a theoretical model that incorporates the blood pressure drop and gas transfer influenced by sweep gas flow rates;
  • Implement the theoretical model into a CFD framework and validate it by comparing model predictions with experimental data;
  • Apply the validated CFD model to investigate carbon dioxide removal in oxygenators under varying sweep gas flow rates.

2. Materials and Methods

2.1. Theory Formulation

2.1.1. Transfer of Oxygen

This study adopts the oxygen transfer model presented in [14], and a brief overview of its key components is provided here. Readers are referred to [14] for a detailed derivation. The model originated from the consideration of a mass balance law where the oxygen change within a blood control volume is contributed by oxygen diffusion in blood, oxygen convection due to blood flow, oxygen delivery from the gas phase and the exchange between the hemoglobin-bound and free (dissolved) oxygen in blood. The partial pressure of oxygen ( P O 2 ) in blood can be considered as the measure of the concentration of mass species ( O 2 ), and its spatial change under a steady-state condition is governed by
v α P O 2 = α D e f f 2 P O 2 + k p A ( P O 2 g P O 2 ) 1 + λ ( P O 2 )
where v is the blood flow velocity, and α is O2 solubility in blood. D e f f is the effective diffusivity of O2 proposed initially by Vaslef et al. [22] to account for the O2 attached to the hemoglobin in blood and it has the following expression
D e f f = α D α + C h S ( P O 2 )
where C h is the concentration of hemoglobin in blood. D is the O2 diffusivity in the region of hollow fiber membrane which is modeled as a continuum porous medium, and it is defined as D = ε D b where ε is the porosity of the membrane and D b is the O2 diffusivity in blood. S ( P O 2 ) is the slope of the oxygen association curve reflecting the relationship between hemoglobin-bound O2 saturation and O2 partial pressure, which can be described using Hill equation [23]:
S ( P O 2 ) = n ( P 50 ) n P O 2 n 1 P 50 n + P O 2 n 2
where P50 is the oxygen partial pressure corresponding to the 50% O2–hemoglobin saturation at the oxygen association curve and n is an empirical constant. The values of P50 and n can be determined by fitting Equation (3) to the experimentally measured data from specific blood samples. In Equation (1), A is the hollow fiber membrane surface area used in oxygenators, and P O 2 g is partial pressure of O2 in the sweep gas flowing through fiber lumens. P O 2 g is assumed to remain constant along the longitudinal axis of the fiber lumen. k p is the shell-side mass transport coefficient governing the speed of O2 transferring from the gas phase to blood phase through the hollow fiber membrane wall. The equation of k p is given by Hewitt et al. [24].
k p = a α d h 1 D 2 / 3 ν 1 / 3 R e b
where a and b are two empirical constants, and ν is the dynamic viscosity of the blood. R e is the Reynolds number defined as R e = V i d h / v where V i is the interstitial velocity magnitude of the blood volume in the region of hollow fiber membrane. Depending on the porosity of fiber bundle, the effective fiber diameter d h can be either d h = d when ε > 0.5 or d h = ε d / ( 1 ε ) when ε 0.5 . d is the diameter of a single fiber as the basic unit of the hollow fiber membrane.

2.1.2. Carbon Dioxide Removal

Carbon dioxide is transported from tissues to the lungs in three primary ways: it dissolves directly in plasma, binds to hemoglobin and forms bicarbonate ions in plasma. The majority of carbon dioxide in the blood is carried as bicarbonate. The CO2 removal model is adapted from [21,25], and its 1D mathematical forms were also presented in our previous works [3]. Here, we extend this model for 3D fluid dynamics simulation. The effective diffusivity ( D ¯ e f f ) of CO2 in blood has a similar form to O2 case but with more mechanisms in it, as described by
D ¯ e f f = D C O 2 + D H C O 3 α C O 2 λ C O 2 1 + 1 α C O 2 λ C O 2
where D C O 2 and D H C O 3 are the diffusivities of dissolved carbon dioxide and bicarbonate ions in blood, respectively. α C O 2 represents carbon dioxide solubility in blood. λ C O 2 is the change in bicarbonate ion concentration with respect to the change in carbon dioxide partial pressure, which can be approximated by the slope of the carbon dioxide dissociation curve (carbon dioxide concentration versus carbon dioxide partial pressure) due to the large amount (90%) of bicarbonate ion relative to the total carbon dioxide. On a pressure range of 20–50 mmHg, the slope ( λ C O 2 ) of the carbon dioxide dissociation curve can be fitted by using the following equation
λ C O 2 = q t P C O 2 t 1
where P C O 2 is the CO2 partial pressure, and q and t are two empirical constants. The mass transfer coefficient k C O 2 for CO2 in blood is adapted from [25]
k C O 2 = c α C O 2 d h d 1 V i d D C O 2 + D H C O 3 α C O 2 λ C O 2 2 / 3 1 + 1 α C O 2 λ C O 2 1 / 3 ν 1 / 3 d
where c and d are two empirical constants.

2.1.3. Effects of Sweep Gas Rate

It was shown from [20] that the sweep gas flow rate has few effects on O2 exchange in oxygenators. Therefore, in this study, we only consider the sweep gas flow rate effect on CO2 removal. Previous works [21,26] have reported that adjusting the sweep gas flow rate will affect the concentration gradient of CO2 in membrane oxygenator. More specifically, a higher sweep gas flow rate decreases CO2 buildup along the sweep gas pathway [27]. As a result, the partial pressure ( P C O 2 ) of CO2 in the sweep gas will not be constant along the gas pathway. In our previous work [3], the distribution of P C O 2 along the long axis of the fiber lumen was derived to have the following form as
P ¯ C O 2 g = P a t D C O 2 P C O 2 Q g + P a t D C O 2 + C e Q g + P a t D C O 2 Q g H y
where P a t and Q g are the atmospheric pressure and sweep gas flow rate, respectively. H is the length of the individual fiber, assuming axis y is along the long axis of the individual fiber and y denotes the location of any point at the fiber. C is an arbitrary constant and it can be determined using the boundary condition of pure oxygen sweep gas at the inlet ( P ¯ C O 2 g = 0 at y = 0 ). An updated Equation (8) can be then obtained as
P ¯ C O 2 g = P a t D C O 2 P C O 2 Q g + P a t D C O 2 P a t D C O 2 P C O 2 Q g + P a t D C O 2 e ( Q g + P a t D C O 2 ) Q g H y
In the 3D computational modeling of gas exchange, we use the average value of P ¯ C O 2 g over the fiber length as
P C O 2 f = δ H 0 H   P ¯ C O 2 s f d y = P a t D ¯ C O 2 P C O 2 Q g + P a t D ¯ C O 2 1 + e Q g + P a t D ¯ C O 2 Q g 1 1 + P a t D ¯ C O 2 / Q g
where δ is a scaling factor that amplifies or reduces the effect of the sweep gas rate on the CO2 partial pressure in fiber lumens. This scaling parameter is motivated by [14], in which the authors suggested modifying or adding parameters to capture the effects of fiber type, fiber coating, fiber arrangement and other factors on gas transfer. We assume these factors also influence how the sweep gas rate affects the CO2 partial pressure within the fiber lumens. The scaling parameter is important because it allows us to adjust the model—e.g., by assigning a different value when a different fiber type is used—to reflect these effects.

2.1.4. Blood Flow and Pressure Drop

The blood motion passing through the hollow fiber bundle (or membrane) is governed by the standard Navier–Stokes equation [28]. To theoretically describe the blood pressure drop across hollow fibers, the whole fiber bundle (or membrane) is considered as a continuum porous medium, and the classical Ergun equation is adopted. This equation assumes that the total energy or pressure losses for the fluid flowing through porous media can be attributed to the sum of viscous/permeability loss and kinetic/inertial loss (due to the flow separation and streamline direction change behind each fiber), and it has a 1D expression form as
d P d x = 150 ν 1 ε 2   d 2 ε 3 V S + 1.75 ρ 1 ε d ε 3 V S 2
where P is the blood pressure, and d P d x represents its change along a specific direction. V S and ρ are the superficial velocity and mass density of the blood, respectively.

2.2. Simulation Setup

2.2.1. Model Implementation

The theoretical models described in the last section were implemented into commercial computational fluid dynamics (CFD) package (Fluent 2023 R2, ANSYS, Inc, Canosburg, PA) for 3D device simulations. Specifically, for O2 and CO2 transfer models, we wrote C++ codes to implement them via user-defined functions (UDFs). To validate the developed models discussed in Section 2.1, we reconstructed a 3D oxygenator geometry (its detailed dimension is shown in Figure 1) from [2] based on the provided dimension and also due to the available experimental data of the O2 and CO2 transfer rates corresponding to that device. As shown in Figure 2, this device features two cylindrical fiber bundles and the computational fluid domain for it included the inlet, outlet, two flow chambers containing two cylindrical fiber beds and one fluid domain connecting the two chambers. It should be noted that because the detailed dimension of the volute (inlet part) of the device in the reference [2] was not given, we made an estimation of its size when reconstructing the 3D model. However, because the gas transfer performances of the device are primarily determined by the fiber bundles, we hypothesize that the small difference in the volute sizes will not have a significant effect on the simulation results. This assumption is supported by simulation results from our previous work, which showed that significant changes in gas transfer (e.g., oxygen transfer) occurred only within the fiber bundle region [7]. More details of the device we modeled are described in [2].
As for the boundary condition, constant mass flow rate and zero pressure were specified at the oxygenator inlet and outlet, respectively. Using UDFs, constant O2 and CO2 partial pressures of 45 mmHg were also applied at the device inlet. The walls of the device were assumed to be rigid and no-slip. The blood used for model demonstration was considered as an incompressible Newtonian fluid with the density of 1050 kg/m3 and viscosity of 0.0035 kg/m∙s [14]. The Semi-Implicit Method for Pressure-Linked Equations (SIMPLE) pressure–velocity coupling scheme with second order accuracy was used to solve all fluid governing equations. The Menter’s Shear Stress Transport (SST) k–ω model was used to model the fluid turbulence in the device. The fiber bundle (blood, fiber walls and gas phase) was modeled as one lumped continuum (porous medium) in our simulation, and the hydrodynamic behaviors (e.g., pressure drop) of the fluid flowing across the fiber bundle were modeled using Ergun equation given in Equation (11). Experimentally measured pressure difference between the device inlet and outlet with blood was used to verify this estimation.
We used a two-step simulation procedure, which can be summarized as follows: The Ansys-Fluent setup was first used to solve the steady-state Navier–Stokes equations with a k–ω turbulence model to obtain the velocity and turbulence fields across the entire domain, including the porous media region. Once the flow field solution converged, we proceeded to solve the mass transport equations using UDFs implemented only within the porous region. The UDFs included source terms to model oxygen and carbon dioxide exchange across the membrane and used the previously computed steady-state velocity and turbulence fields as inputs—without re-solving the flow equations. This sequential approach effectively captures the influence of flow dynamics on gas transfer, while maintaining transport models that are governed primarily by molecular and facilitated diffusion, which is appropriate given the low turbulence (turbulent mixing is negligible) within the membrane domain [29].

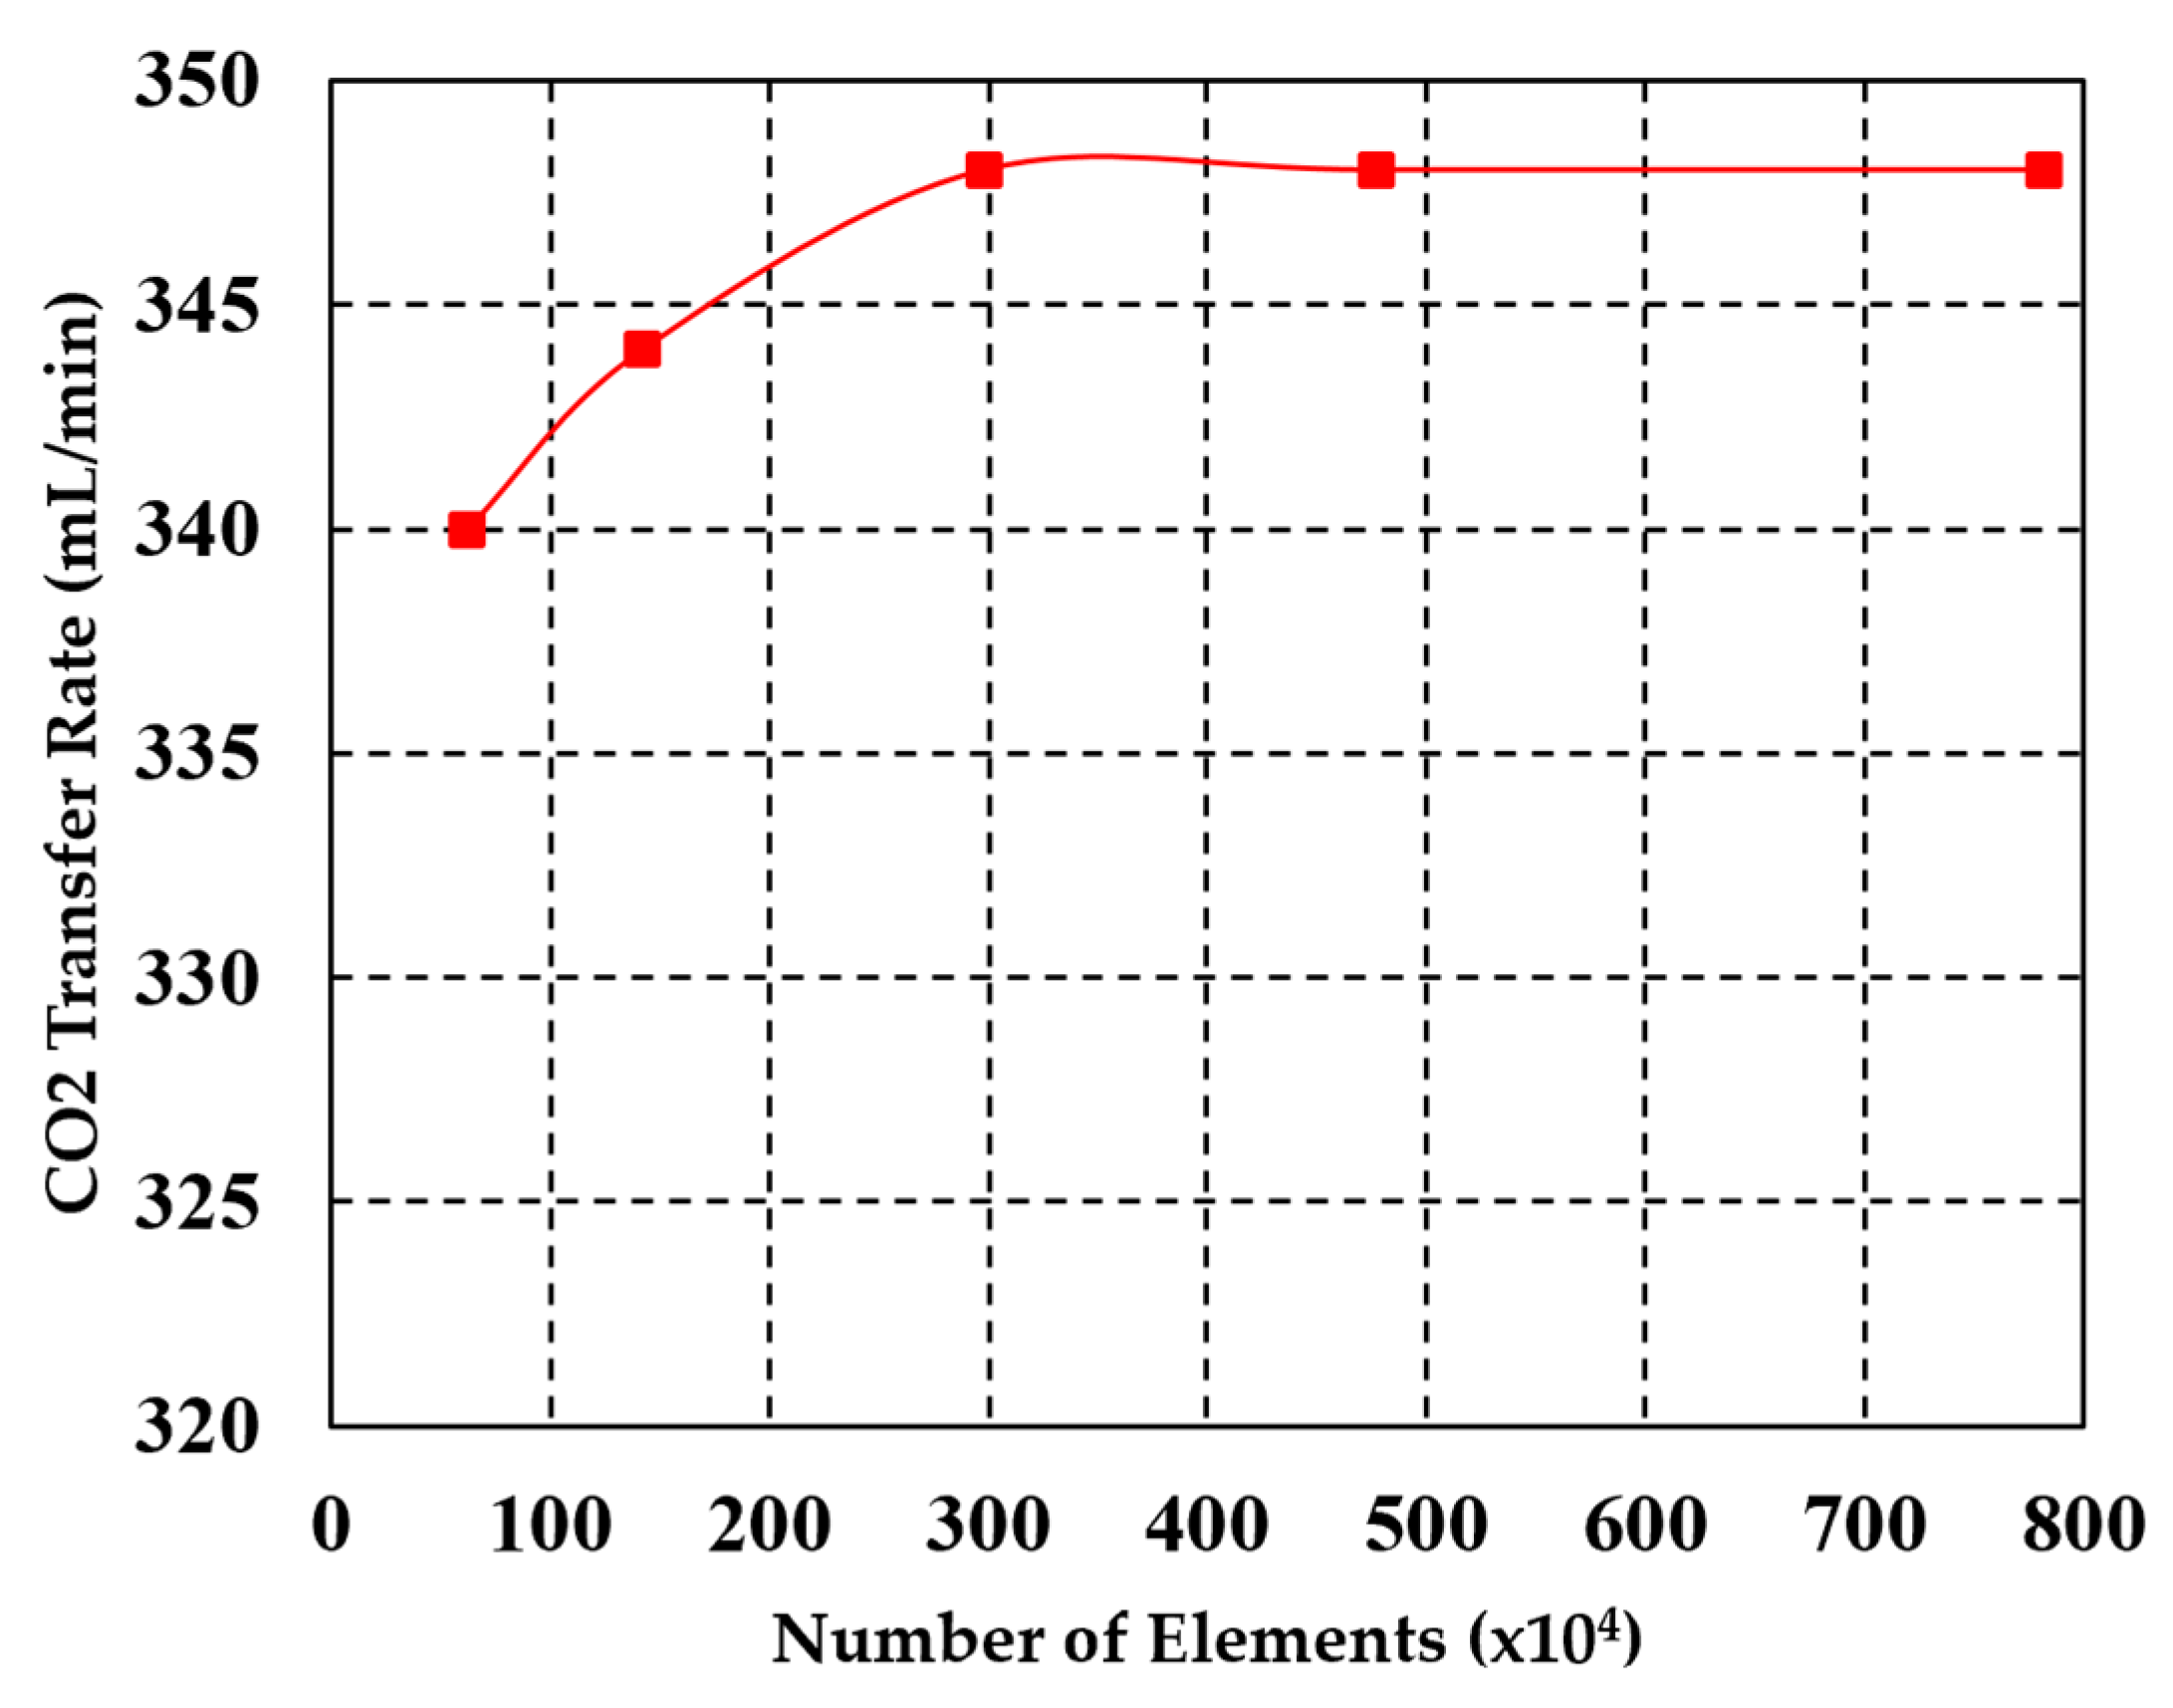
2.2.2. Mesh Sensitivity Study

The mesh sensitivity verification is shown in Figure 3. Because this numerical study is focused on the carbon dioxide (CO2) removal performance of the oxygenator, the CO2 transfer rate of the oxygenator (constant CO2 partial pressure of 45 mmHg at the device inlet) was computed for various mesh sizes. The results indicated that when the mesh element count is below 3 million, the predicted CO2 transfer rate shows significant variations, resulting in low accuracy and consistency. However, for mesh sizes exceeding 5~7 million elements, the variations become minimal and stabilize. Therefore, to balance accuracy and computational efficiency and also to be consistent with the number of meshes used in [2], a mesh size of around 7 million linear-order elements was chosen for the subsequent calculations. We adopted a multistep meshing process for the entire geometry to ensure high mesh quality. The volute, outer fiber bundle, inner fiber bundle, inner fluid domain, outlet and inlet of the oxygenator (these different regions are labeled in Figure 1) were meshed sequentially using a combination of linear hybrid elements: 4-node tetrahedral (Tet4), 6-node wedge (Wed6) and 5-node pyramid (Pyr5) elements. The maximum mesh aspect ratio and skewness were 23.6 and 0.9, respectively, while the minimum orthogonal quality was 0.1. To better resolve velocity gradients near the fluid–wall interfaces, 5-layer inflation meshes were applied during the meshing process (Figure 2b). Figure 4 shows the turbulence intensity and flow velocity contours of the oxygenator, meshed with 7 million elements and simulated at a blood flow rate of 6 L/min.

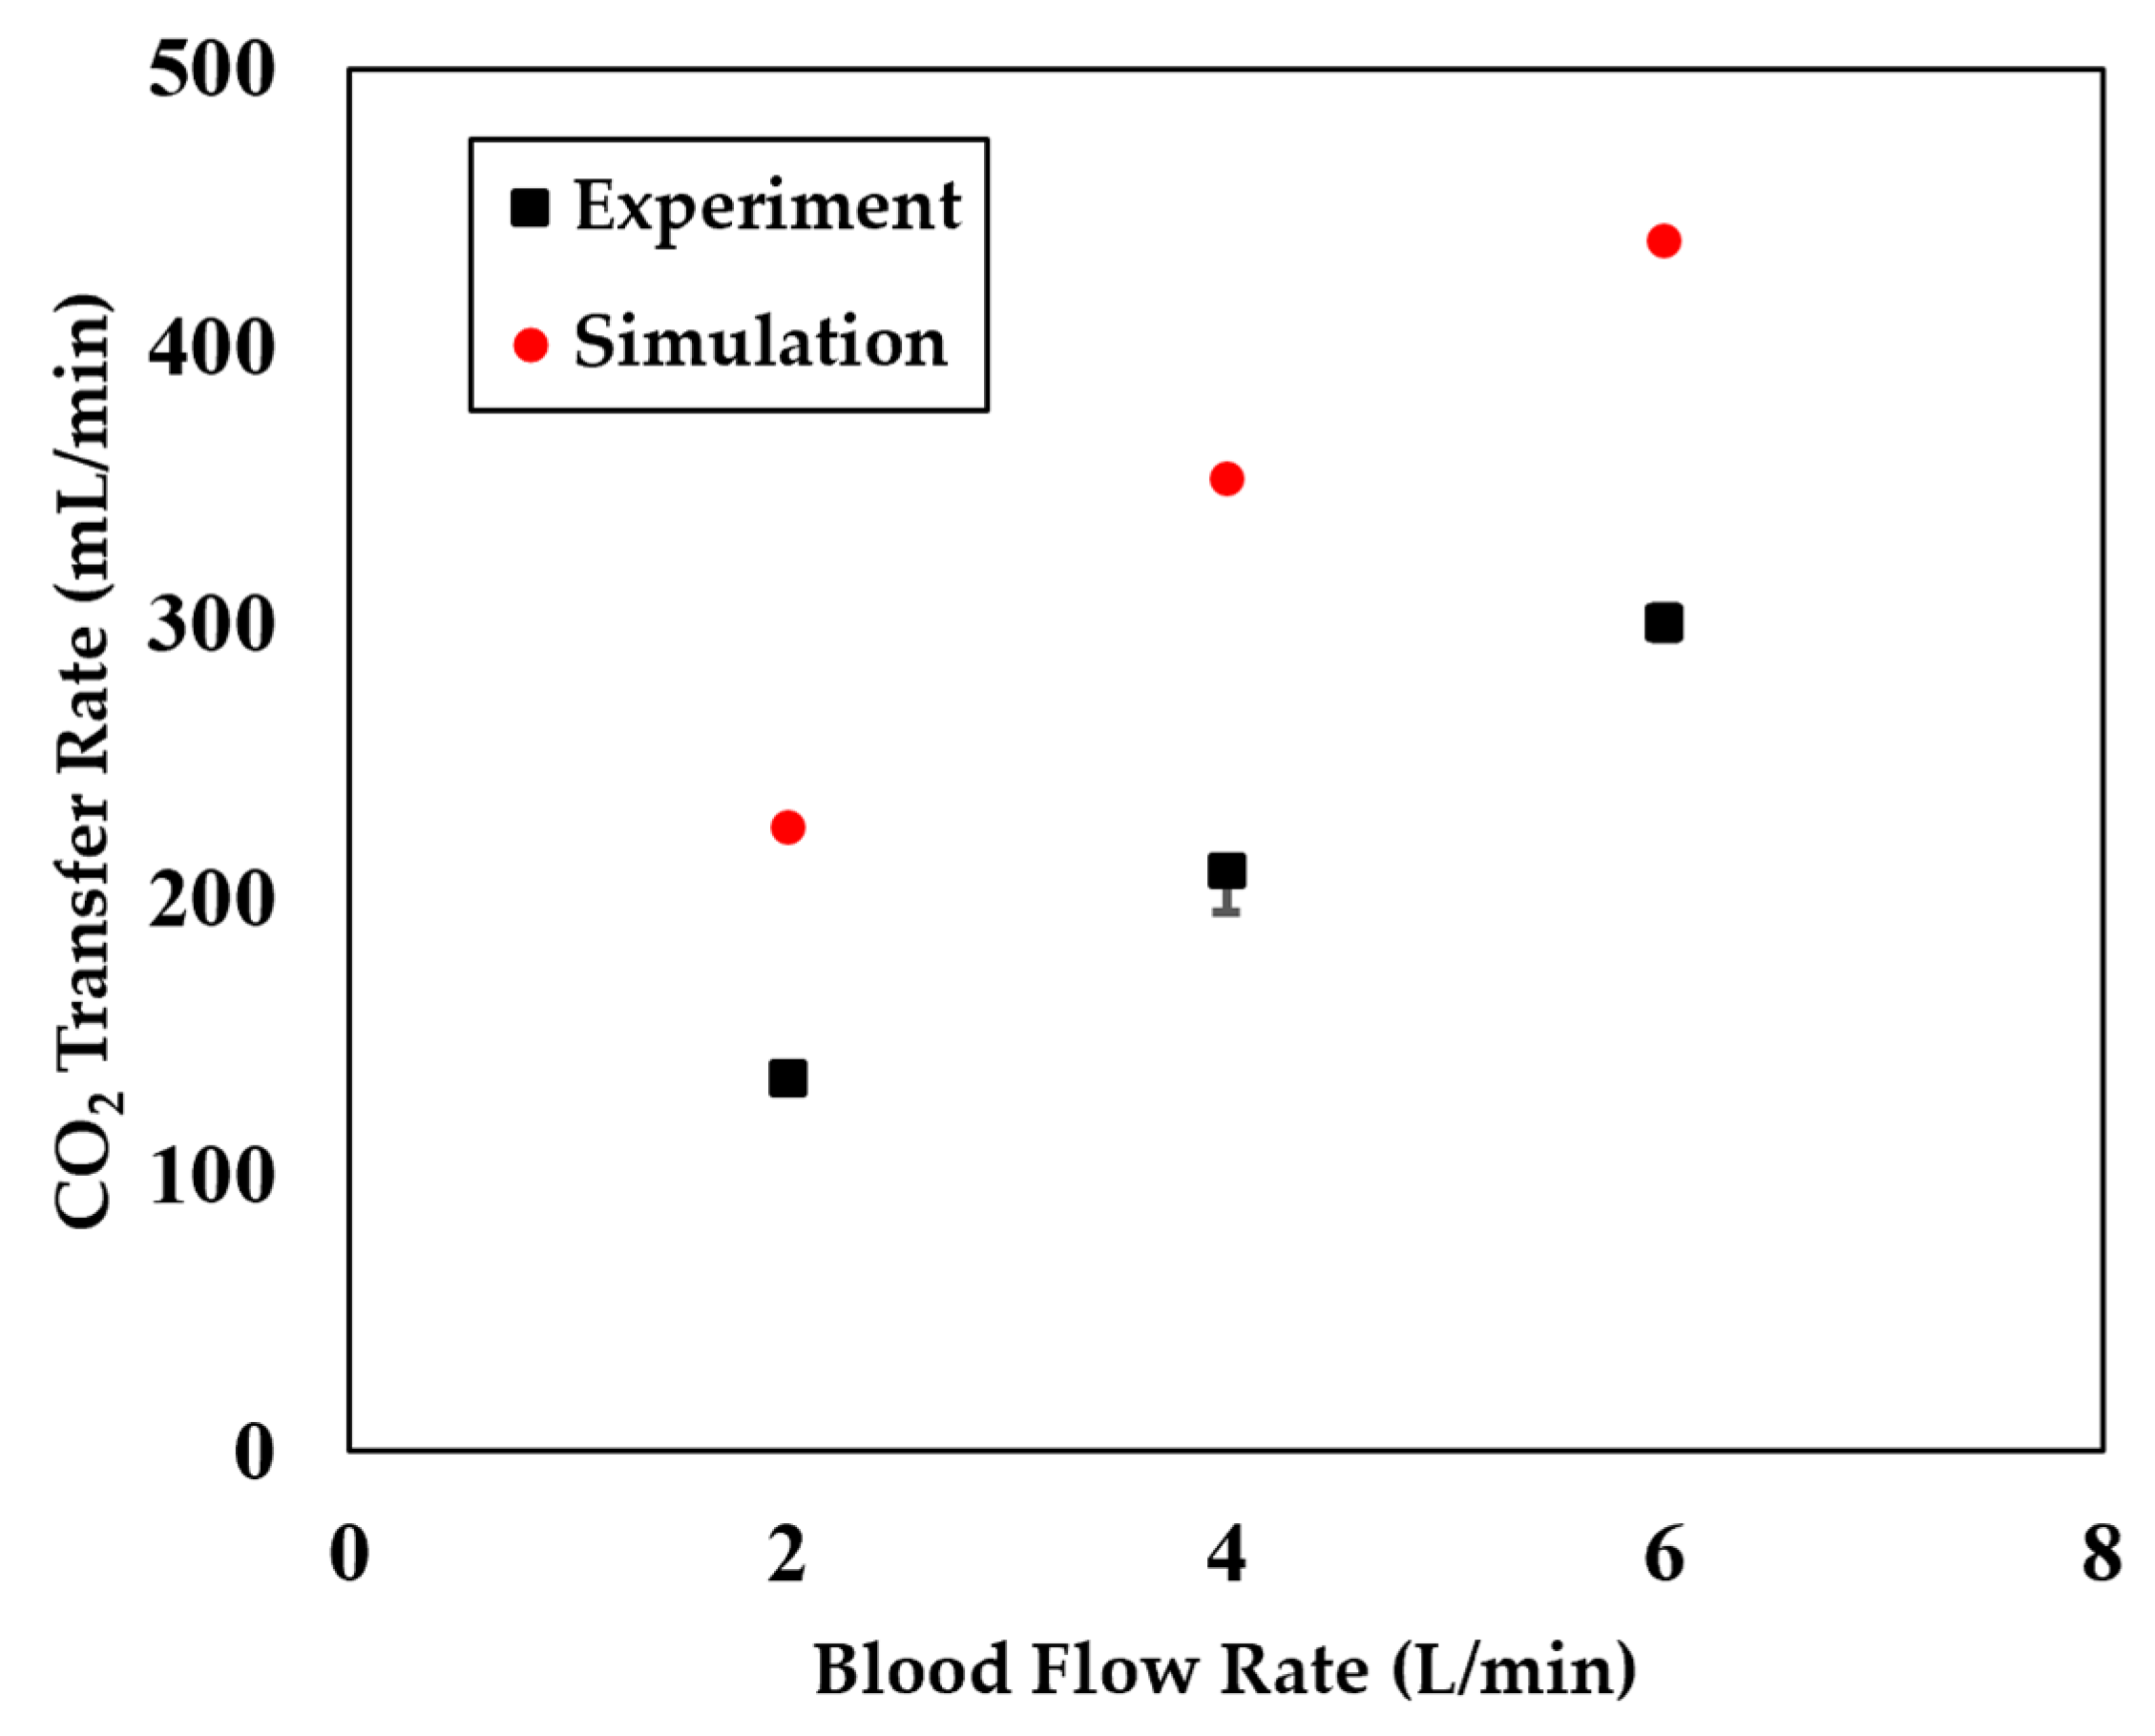
2.2.3. Model Validation

To verify the prediction reliability of the CFD model developed in this study for simulating hydrodynamic and gas transfer performances of oxygenators, experimental data from Han et al. [2] regarding the blood pressure drop, O2 transfer rate and CO2 transfer rate at different blood flow rates were used for comparison. Particularly, we will demonstrate the model’s capability of predicting sweep gas rate-dependent CO2 removal/transfer performances of the 3D oxygenator device, which was not reported in previous modeling works. The O2 transfer rate ( m ˙ O 2 ) of the device is calculated based on the O2 partial pressure and saturation at the inlet and outlet of the device as [30]
m ˙ o 2 = 13.4 × C h × S o 2 o u t S o 2 i n + α × 10 3 × P o 2 o u t P o 2 i n Q b
where C h is the hemoglobin concentration; S o 2 o u t and S o 2 i n are the O2 saturation at the outlet and inlet of the device, respectively; P o 2 o u t and P o 2 i n , respectively, represent the O2 partial pressure predicted at the device outlet and inlet; and Q b is the volumetric blood flow rate. The detailed values of these parameters can be found in [14]. The CO2 transfer rate ( m ˙ C O 2 ) is calculated based on the CO2 concentrations at the device inlet ( C C O 2 i n ) and outlet ( C C O 2 o u t ) as [2]:
m ˙ C O 2 = C C O 2 o u t C C O 2 i n Q b
Figure 5 shows the model-predicted blood pressure drop across the oxygenator running at different blood flow rates. The simulation results agree very well with the experimental measurement even when the device geometry was not perfectly reconstructed, which also demonstrates that the classical Ergun equation (Equation(11)) is a good candidate to be used to model the fluid pressure drop across porous medium. Figure 6 shows the model-predicted oxygen (O2) transfer rate of the device at different blood flow rates, which agree well with the experimental data. Figure 7 shows the model-predicted carbon dioxide (CO2) removal rate of the device at different blood flow rates. While the model overestimated the absolute CO2 transfer rates, it accurately captures the overall trend of CO2 transfer rate changes, meaning it can be used to conduct comparative studies. Figure 8 shows the predicted CO2 transfer rates of the oxygenator at different sweep gas flow rates, which clearly demonstrate the model’s capability of predicting the sweep gas rate-dependent CO2 transfer. The model did not capture absolute values of the experimentally measured CO2 transfer rate, but it captures the overall trend of the CO2 transfer rate changes when δ = 10 was used in the simulation. A scaling factor of 1 was chosen to represent the baseline case without accounting for any scaling effects from factors such as fiber type, coating or arrangement. We also tested values between 1 and 10 and found that a factor of 10 produces a noticeable difference compared to 1. Therefore, we selected 1 and 10 as representative values for comparison. As shown in Equation (10), the scaling factor effectively modulates the CO2 partial pressure in the fiber lumens. A higher scaling factor results in a greater CO2 partial pressure gradient across the fiber–blood interface, thereby increasing the CO2 transfer rate. Figure 8 also shows that the scaling factor δ did amplify or reduce the effect of the sweep gas rate on the CO2 transfer rate. While the model-predicted the sweep gas rate effect when the scaling factor was not used ( δ = 1 ), this precited effect was relatively weak compared to the case when δ = 10 was used. Therefore, in the subsequent section of simulation analyses, we presented all the simulation results with δ = 10 . The discrepancy between the simulation results and experimental data in Figure 8 may be attributed to the calculation of CO2 partial pressure in the fiber lumens. Although Equation (10) accounts for the effect of sweep gas rate, it uses an average CO2 partial pressure along the fiber length, despite it being non-uniform. A more accurate prediction could be achieved through mesoscale simulations that incorporate the spatial variation in CO2 partial pressure directly. However, such models are computationally too expensive for simulating the entire device. Because this study is mainly focused on the CO2 transfer/removal performances of the oxygenator, we only present CO2-related simulation results.

3. Analysis of Simulation Results

3.1. CO2 Patial Pressure Under Different Sweep Gas Rate

Figure 9 shows the CFD-simulated CO2 partial pressure (PCO2) distribution within the oxygenator at different sweep gas flow rates of 3 L/min, 6 L/min, 9 L/min and 12 L/min. Specifically, the sweep gas rate is related to the volumetric flow rates of air provided in the outer fiber bundle, while the flow rates of oxygen provided in the inner fiber bundle remained as a constant rate of 3 L/min [2]. The PCO2 was set to have the same value of 45 mmHg at the device inlet but varied at the device outlet due to different sweep gas flow rates used. From Figure 9, the PCO2 decreases when the blood flows from the device inlet to outlet, meaning that the oxygenator is functioning well and has successfully removed the CO2 from the blood entering the device. A uniform PCO2 gradient can also be found in the region of the inner fiber bundle, meaning that the device provides a stable CO2 removal. In addition, it can also be found that the PCO2 at the device outlet decreases from 38.4 mmHg to 36 mmHg, 35.2 mmHg and 34.8 mmHg when the sweep gas flow rate increases from 3 L/min to 6 L/min, 9 L/min and 12 L/min, which demonstrates that increasing the sweep gas flow rate can allow the oxygenator to remove more CO2. This simulation finding is consistent with experimental and clinical measurements [2,19].

3.2. CO2 Concentration Under Different Sweep Gas Rate

Figure 9 also shows the simulated CO2 concentration distribution within the oxygenator at different sweep gas flow rates. The relationship between the CO2 concentration and CO2 partial pressure (PCO2) can be represented by an exponential function [3], where the CO2 concentration is increasing exponentially as the PCO2 increases. Similarly to Figure 8, Figure 9 also shows that the CO2 concentration decreases when the blood flows from the device inlet to outlet, meaning the oxygenator is functioning well and has successfully removed the CO2 from the blood entering the device. A uniform CO2 concentration gradient can also be found in the region of the inner fiber bundle, meaning the device provides a stable CO2 removal. In addition, it can also be found that the CO2 concentration at the device outlet decreases from 0.491 mL/mL to 0.480 mL/mL, 0.476 mL/mL and 0.474 mL/mL when the sweep gas flow rate increases from 3~L/min to 6~L/min, 9~L/min and 12~L/min. Considering that the CO2 concentration is increasing exponentially as PCO2 increases, the finding from Figure 9 can also demonstrate that increasing sweep gas flow rates can allow the oxygenator to remove more CO2. Both the CO2 concentration and PCO2 can be used to indicate whether the oxygenator removes more or less CO2.

3.3. Fiber Lumen CO2 Patial Pressure Under Different Sweep Gas Rate

In order to show what is happening inside the fiber lumens that leads to the sweep gas flow rate-dependent phenomena shown in Figure 9, we directly used Equation (10) to calculate the CO2 partial pressure within fiber lumens ( P C O 2 f ) vs. the sweep gas flow rate ( Q g ), and the calculation result is shown in Figure 10. The P C O 2 f were normalized by dividing them by their maximum value. As the sweep gas flow rate increased, the CO2 partial pressure within fiber lumens decreased, creating a larger PCO2 gradient across the fiber–blood interface, which sped up the CO2 removal rate and reduced more CO2, as demonstrated in Figure 8.

4. Conclusions

In this study, we enhanced a previously developed mathematical model by implementing it within a three-dimensional CFD framework to predict both the blood pressure drop and gas exchange performance of oxygenators under clinically relevant flow conditions. A significant advancement of the current work is the explicit incorporation of the sweep gas flow rate as a significant factor in carbon dioxide (CO2) removal, based on experimentally validated dependencies. Unlike prior models that often assume a constant CO2 pressure in fiber lumens and neglect the sweep gas effect, our extended model integrates the variable of the sweep gas rate into the simulation, allowing for a more accurate representation of CO2 exchange dynamics.
CFD predictions of CO2 removal rates across a range of sweep gas flow rates were compared with experimental measurements, demonstrating the model’s ability to capture the correct trend and response behavior. This agreement supports the model’s utility as a predictive tool for evaluating the oxygenator performance, particularly in scenarios where sweep gas modulation is clinically necessary or operationally desirable. The inclusion of sweep gas effects not only enhances the model’s predictive accuracy but also improves its potential for use in design optimization, control strategies and individualized device tuning.
Nevertheless, the further refinement of the functional form used in Equation (10) is needed to improve the quantitative match between simulated and experimental values. Future work will focus on developing a more accurate representation of the localized CO2 partial pressure distribution within the fiber lumens, possibly through the coupling with mesoscale or multiscale models, to further improve predictive fidelity.

Author Contributions

Conceptualization, G.H.; methodology, K.A., J.R. and G.H.; software, K.A. and J.R.; validation, K.A., J.R. and G.H.; formal analysis, K.A. and G.H.; writing—original draft preparation, G.H.; writing—review and editing, L.F. and G.H.; supervision, G.H. All authors have read and agreed to the published version of the manuscript.

Funding

This research received no external funding.

Data Availability Statement

The data presented in this study are available on request from the corresponding author.

Conflicts of Interest

The authors declare no conflicts of interest.

References

  1. Subramaniyan, V.; Fuloria, S.; Sekar, M.; Shanmugavelu, S.; Vijeepallam, K.; Kumari, U.; Narain, K.; Meenakshi, D.U.; Maziz, M.N.H.; Fuloria, N.K. Introduction to Lung Disease. In Targeting Epigenetics in Inflammatory Lung Diseases; Springer: Berlin/Heidelberg, Germany, 2023; pp. 1–16. [Google Scholar]
  2. Han, D.; Zhang, J.; Shah, A.; Griffith, B.P.; Wu, Z.J. A New Multifunction Oxygenator with a Dual-Chamber Gas Exchanger to Reduce Dependence on Oxygen Supply. ASAIO J. 2025. [Google Scholar] [CrossRef] [PubMed]
  3. He, G.; Zhang, T.; Zhang, J.; Griffith, B.P.; Wu, Z.J. Model-Based Design and Optimization of Blood Oxygenators. J. Med. Devices, Trans. ASME 2020, 14, 041001. [Google Scholar] [CrossRef] [PubMed]
  4. Wu, Z.; Griffith, B.; Zhang, J.; He, G. Blood Gas Exchanger for Multifunctional Respiratory Support. PCT/US2024/012927, 25 February 2024. [Google Scholar]
  5. Lachaux, J.; Hwang, G.; Arouche, N.; Naserian, S.; Harouri, A.; Lotito, V.; Casari, C.; Lok, T.; Menager, J.B.; Issard, J.; et al. A compact integrated microfluidic oxygenator with high gas exchange efficiency and compatibility for long-lasting endothelialization. Lab Chip 2021, 21, 4791–4804. [Google Scholar] [CrossRef] [PubMed]
  6. Franke, B.; Goubergrits, L. Beveled shaped axial oxygenator with improved hemodynamics. medRxiv 2024. ahead of printing. [Google Scholar] [CrossRef]
  7. Han, D.; Zhang, J.; He, G.; Griffith, B.P.; Wu, Z.J. Computational fluid dynamics-based design and in vitro characterization of a novel pediatric pump-lung. Artif. Organs 2023, 48, 130–140. [Google Scholar] [CrossRef]
  8. Han, D.; Leibowitz, J.L.; Han, L.; Wang, S.; He, G.; Griffith, B.P.; Wu, Z.J. Computational fluid dynamics analysis and experimental hemolytic performance of three clinical centrifugal blood pumps: Revolution, Rotaflow and CentriMag. Med. Nov. Technol. Devices 2022, 15, 100153. [Google Scholar] [CrossRef]
  9. He, G.; Han, L.; Zhang, J.; Shah, A.; Kaczorowski, D.J.; Griffith, B.P.; Wu, Z. Numerical study of the effect of LVAD inflow cannula positioning on thrombosis risk. Comput. Methods Biomech. Biomed. Engin. 2022, 25, 852–860. [Google Scholar] [CrossRef]
  10. He, G.; Zhang, J.; Shah, A.; Berk, Z.B.; Han, L.; Dong, H.; Griffith, B.P.; Wu, Z.J. Flow characteristics and hemolytic performance of the new Breethe centrifugal blood pump in comparison with the CentriMag and Rotaflow pumps. Int. J. Artif. Organs 2021, 44, 829–837. [Google Scholar] [CrossRef]
  11. Han, D.; Zhang, J.; He, G.; Griffith, B.P.; Wu, Z.J. A prestressed intracellular biomechanical model for the platelet to capture the disc-to-sphere morphological change from resting to activated state. Int. J. Comput. Methods 2022, 19, 2250021. [Google Scholar] [CrossRef]
  12. Hormes, M.; Borchardt, R.; Mager, I.; Schmitz-Rode, T.; Behr, M.; Steinseifer, U. A validated CFD model to predict O2 and CO2 transfer within hollow fiber membrane oxygenators. Int. J. Artif. Organs 2011, 34, 317–325. [Google Scholar] [CrossRef]
  13. Asiltürk, A.Y.; Atalık, K. Computational Pulsatile Flow and Efficiency Analysis of Biocompatible Microfluidic Artificial Lungs for Different Fiber Configurations. J. Biomech. Eng. 2024, 146, 081002. [Google Scholar] [CrossRef] [PubMed]
  14. Zhang, J.; Nolan, T.D.C.; Zhang, T.; Griffith, B.P.; Wu, Z.J. Characterization of membrane blood oxygenation devices using computational fluid dynamics. J. Memb. Sci. 2007, 288, 268–279. [Google Scholar] [CrossRef]
  15. Barbian, K.P.; Hirschwald, L.T.; Linkhorst, J.; Neidlin, M.; Steinseifer, U.; Wessling, M.; Wiegmann, B.; Jansen, S.V. Flow and mass transfer prediction in anisotropic TPMS-structures as extracorporeal oxygenator membranes using reduced order modeling. J. Memb. Sci. 2024, 690, 122160. [Google Scholar] [CrossRef]
  16. Focke, J.M.; Bonke, P.L.; Gendron, N.; Call, T.; Steinseifer, U.; Arens, J.; Neidlin, M. The influence of membrane fiber arrangement on gas exchange in blood oxygenators: A combined numerical and experimental analysis. J. Memb. Sci. 2024, 710, 123147. [Google Scholar] [CrossRef]
  17. Li, Y.; Wang, H.; Fu, X.; Xi, Y.; Sun, A.; Chen, Z.; Fan, Y. A comprehensive study of oxygenator gas transfer efficiency and thrombosis risk. Phys. Fluids 2024, 36, 081916. [Google Scholar] [CrossRef]
  18. Tang, T.Q.; Hsu, S.Y.; Dahiya, A.; Soh, C.H.; Lin, K.C. Numerical modeling of pulsatile blood flow through a mini-oxygenator in artificial lungs. Comput. Methods Programs Biomed. 2021, 208, 106241. [Google Scholar] [CrossRef]
  19. Karabulut, H.; Toraman, F.; Tarcan, S.; Demirhisa, Ö.; Alhan, C. Adjustment of sweep gas flow during cardiopulmonary bypass. Perfusion 2002, 17, 353–356. [Google Scholar] [CrossRef]
  20. Turri, F.; Yanagihara, J.I. Computer-assisted numerical analysis for oxygen and carbon dioxide mass transfer in blood oxygenators. Artif. Organs 2011, 35, 579–592. [Google Scholar] [CrossRef]
  21. Manap, H.H.; Abdul Wahab, A.K.; Zuki, F.M. Mathematical Modelling of Carbon Dioxide Exchange in Hollow Fiber Membrane Oxygenator. In IOP Conference Series: Materials Science and Engineering; IOP Publishing: Bristol, UK, 2017; Volume 210, p. 012003. [Google Scholar] [CrossRef]
  22. Vaslef, S.N.; Mockros, L.F.; Anderson, R.W.; Leonard, R.J. Use of a mathematical model to predict oxygen transfer rates in hollow fiber membrane oxygenators. ASAIO J. 1994, 40, 990–996. [Google Scholar] [CrossRef]
  23. Hill, A.V. The possible effects of the aggregation of the molecules of hemoglobin on its dissociation curves. J. Physiol. 1910, 40, iv–vii. [Google Scholar]
  24. Hewitt, T.J.; Hattler, B.G.; Federspiel, W.J. A mathematical model of gas exchange in an intravenous membrane oxygenator. Ann. Biomed. Eng. 1998, 26, 166–178. [Google Scholar] [CrossRef] [PubMed]
  25. Svitek, R.G.; Federspiel, W.J. A mathematical model to predict CO2 removal in hollow fiber membrane oxygenators. Ann. Biomed. Eng. 2008, 36, 992–1003. [Google Scholar] [CrossRef] [PubMed]
  26. Barrett, N.A.; Hart, N.; Camporota, L. In-vitro performance of a low flow extracorporeal carbon dioxide removal circuit. Perfusion 2020, 35, 227–235. [Google Scholar] [CrossRef] [PubMed]
  27. Scaravilli, V.; Zanella, A.; Sangalli, F.; Patroniti, N. Basic aspects of physiology during ECMO support. In ECMO-Extracorporeal Life Support Adults; Springer: Berlin/Heidelberg, Germany, 2014; pp. 19–36. [Google Scholar]
  28. Fill, B.; Gartner, M.; Johnson, G.; Horner, M.; Ma, J. Computational fluid flow and mass transfer of a functionally integrated pediatric pump-oxygenator configuration. ASAIO J. 2008, 54, 214–219. [Google Scholar] [CrossRef]
  29. Fu, X.; Su, Z.; Wang, Y.; Sun, A.; Wang, L.; Deng, X.; Chen, Z.; Fan, Y. Comparison of hemodynamic features and thrombosis risk of membrane 497 oxygenators with different structures: A numerical study. Comput. Biol. Med. 2023, 159, 106907. [Google Scholar] [CrossRef]
  30. Ertan Taskin, M.; Zhang, T.; Fraser, K.H.; Griffith, B.P.; Wu, Z.J. Design Optimization of a Wearable Artificial Pump-Lung Device With Computational Modeling. J. Med. Devices Trans. ASME 2012, 6, 031009. [Google Scholar] [CrossRef]
Figure 1. Three-dimensional dimensions of the oxygenator studied. The geometry was adapted from [2] for the validation of the proposed model discussed in Section 2.1.
Fluids 10 00158 g001
Figure 2. (a) Components of the dual-chamber oxygenator and the (b) mesh and local refinement. The 3D geometry was adapted from [2], with some detailed features omitted due to a lack of dimensional information in the original reference. The red arrows indicate the blood flow directions.
Fluids 10 00158 g002
Figure 3. Mesh sensitivity analysis result for carbon dioxide (CO2) transfer rate.
Fluids 10 00158 g003
Figure 4. The turbulence intensity and flow velocity contours of the oxygenator operating at a blood flow rate of 6 L/min.
Fluids 10 00158 g004
Figure 5. A comparison of the model-predicted blood pressure drops across the oxygenator (i.e., the pressure difference between the device outlet and inlet) with experimental measurements at varying blood flow rates. The experimental data with error bars were adapted from [2].
Fluids 10 00158 g005
Figure 6. A comparison of the model-predicted oxygen (O2) transfer rate of the oxygenator (the O2 transfer rate is defined in Equation (12)) with experimental measurements at varying blood flow rates. The experimental data with error bars were adapted from [2].
Fluids 10 00158 g006
Figure 7. A comparison of the model-predicted carbon dioxide (CO2) transfer rate of the oxygenator (the CO2 transfer rate is defined in Equation (13)) with experimental measurements at varying blood flow rates. The scaling factor of δ = 1 was used in the simulation. The experimental data with error bars were adapted from [2].
Fluids 10 00158 g007
Figure 8. A comparison of the model-predicted carbon dioxide (CO2) transfer rate of the oxygenator (the blood flow rate is set as 6L/min) with experimental measurements at varying sweep gas flow rates. The experimental data with error bars were adapted from [2].
Fluids 10 00158 g008
Figure 9. The CFD-predicted carbon dioxide (CO2) partial pressure distribution (unit: mmHg) and concentration (unit: mL/mL) within the oxygenator at the gas flow rate of (a) 3 L/min; (b) 6 L/min; (c) 9 L/min; and (d) 12 L/min. The blood flow rate was set to 5 L/min. The blood flow directions are indicated by black arrows in (a), and the same directions apply to the other plots.
Fluids 10 00158 g009
Figure 10. Normalized carbon dioxide partial pressure (PCO2) within fiber lumens vs. sweep gas flow rates.
Fluids 10 00158 g010
Disclaimer/Publisher’s Note: The statements, opinions and data contained in all publications are solely those of the individual author(s) and contributor(s) and not of MDPI and/or the editor(s). MDPI and/or the editor(s) disclaim responsibility for any injury to people or property resulting from any ideas, methods, instructions or products referred to in the content.

