Article

Influence of an Air Slit in Dust Shields on Accumulation of Dust over PV Panels

by
Ahmed M. Gobran
1,
Mohamed S. Abd-Elhady
1,2,* and
Hamdy A. Kandil
1
1
Department of Mechatronics, Faculty of Engineering and Materials Science, German University in Cairo (GUC), Cairo 11835, Egypt
2
Department of Mechanical Engineering, Faculty of Engineering, Beni-Suef University, Beni-Suef 62511, Egypt
*
Author to whom correspondence should be addressed.
Fluids 2025, 10(6), 153; https://doi.org/10.3390/fluids10060153
Submission received: 10 April 2025 / Revised: 22 May 2025 / Accepted: 9 June 2025 / Published: 10 June 2025
(This article belongs to the Section Flow of Multi-Phase Fluids and Granular Materials)

Abstract

Dust accumulation on Photovoltaic (PV) panels represents a major challenge for the operation of panels. There are several passive dust mitigation techniques, such as using a dust shield whose performance has been enhanced by integrating it with an air nozzle. The air exiting the nozzle acts as an air barrier that obstructs the approach of dust particles to the panel’s surface. The objective of this study is to minimize dust accumulation over PV panels by adding slits within the dust shield. The function of the slit is to induce air drafts that can sweep dust away from the surface of the PV panel. Numerical simulations are performed to determine the influence of the slit size and position on dust mitigation. It has been found that there is a critical slit size, such that the deposition of particles for slits of sizes smaller or larger than that size decreases. Increasing the slit size increases dust deposition until a certain limit, i.e., the critical size, and that is due to the Coanda effect that keeps the flow intact with the shield until it reaches the panels’ surface, which increases the dust accumulation rate. On the other hand, increasing the slit size above the critical size decreases the dust deposition due to the change from a non-inertial flow to an inertial flow, which diverts the incoming particles from reaching the panels’ surface. Also, it has been found that keeping the slit location away from the panel’s surface decreases the accumulation of dust over the panels’ surface. Therefore, based on the performed simulations, the slit size should always be either greater or smaller than the critical size and as far as possible from the panel’s surface to minimize dust accumulation over PV panels.

1. Introduction

Nowadays, fossil fuels dominate global energy consumption, supplying the majority of energy used for electricity generation, transportation, heating, and industrial processes [1,2,3,4]. However, fossil fuels are non-renewable resources, which pose long-term challenges for environmental sustainability, energy security, climate change, and economic stability. Therefore, there is a global push towards utilizing renewable energy [5,6], especially solar energy, which is seen as a promising solution to the energy crisis [7,8]. Solar energy is renewable, free, and abundant since it is derived from the sun, which is an inexhaustible resource. One of the main applications of using solar energy is Photovoltaic (PV) panels. PV panels convert sunlight directly into electricity. The usage of PV panels for the generation of electricity has increased rapidly over the years [8] due to improved efficiency, reduced costs, and expanded applications, which make them a fundamental component in the global transition towards sustainable energy sources. One of the major challenges for the operation of PV panels in the Middle East North Africa (MENA) region is the high rate of dust accumulation on the panel’s surface [9,10]. The soiling of PV panels [11] results in reducing the amount of sunlight reaching the PV cells; consequently, the panel’s output and efficiency decrease.

1.1. Soiling of PV Panels in the MENA Region

The MENA region is well known for its huge amount of solar irradiance; however, the dust loading [9] in this region is large, which hinders the application of PV panels. Tanka and Chiba [12] investigated the contributions of potential dust source regions, and it was concluded that dust originating from the Sahara Desert in the Northern part of Africa accounts for about 58% of the total dust emissions and about 62% of the total dust load in the atmosphere, which significantly influences the performance of PV panels, especially in the MENA region. Several research studies [13,14,15] have been performed to infer the effect of dust on the performance of PV panels in the MENA region. Adinoyi and Said [16] studied the effect of dust accumulation on the power output of PV panels in the Eastern province of Saudi Arabia, and it was found that the power output from the PV panels decreased by 50% after six months without cleaning. Said et al. [17] examined the influence of dust on PV panels in Dhahran City, Saudi Arabia, which is situated about 10 km from the Arabian Gulf, and it has been confirmed that dust accumulation can lead to a drastic reduction in the output power, ranging between a 10 and 17% reduction after six weeks of exposure without cleaning. Asl-Soleimani et al. [18] developed an experimental setup in the city of Tehran in Iran in order to determine the influence of dust on the performance of PV panels, and it was found that the soiling rate in Tehran is so large that the drop in efficiency can reach up to 60% in 10 days. Menoufi et al. [19] examined the impact of dust on the electrical performance of PV panels installed in Beni-Suef in Egypt. The PV panels were exposed to the outdoor environment for three months, and it was measured that the drop in efficiency reached 65%. Elminir et al. [20] examined the influence of desert dust on the degradation of the output of unattended PV modules in Egypt, and it was found that the decrease in the output power is about 17.4% per month at a tilt angle of 45° with the panels facing South.

1.2. Dust Mitigation Techniques

To address the problem of dust accumulation on PV panels, various dust mitigation techniques have been developed. These techniques are categorized into passive, active, and active–passive methods [9]. Passive Techniques include natural cleaning with wind and rain, superhydrophobic coatings that repel water, causing dust particles to be carried away by water droplets, and superhydrophilic surfaces that attract water, forming a thin film that helps wash away dust. Active techniques include water cleaning that uses water jets or sprays [21], mechanical cleaning that employs brushes or wipers to remove dust, electrodynamic screens that utilize electric fields to repel dust particles [22], and mechanical vibrators that use vibrations to shake off dust particles from the panels [23]. Active–passive techniques include antistatic coatings with mechanical vibrations [24], where antistatic coatings reduce dust attraction, while mechanical vibrations help to dislodge any accumulated dust. In 2021, Chiteka et al. [25] proposed a new passive cleaning method where they computationally investigated the soiling mitigation on a ground-mounted Photovoltaic (PV) panel using a wind barrier installed in front of the panel. It was found that increasing the barrier height reduces soiling, but it also causes partial shading on the PV panels. Increasing the distance between the barrier and the panels increased the accumulation rate of the particles on the panels due to turbulent eddies forming behind the barrier. They concluded that the use of barriers is an effective way of mitigating dust deposition, where up to 25% of the total dust particles were blocked by the barrier positioned at 3 m from the solar panels. Using the barrier resulted in a 2.81% increase in energy compared to an installation without a barrier.
Raillani et al. [26] computationally investigated the influence of barrier height on dust mitigation. It has been found that the addition of a barrier in front of the PV panel reduced the dust deposition rate, and the best barrier height was found to be 1.4 m. The study was then extended [27] to include seven tilt angles of the PV panel, and it was concluded that the dust deposition rate is maximum on the PV for a tilt angle of 40°, followed by 30°. Raillani et al. [28] also investigated the use of a porous barrier for the mitigation of dust on a PV panel, in which the effect of the barrier porosity and distance from the panel on the particle behavior and deposition rate was investigated. The results showed that controlling the porosity and location of the barrier can reduce dust deposition by a rate of 86% for large particles and 33% for small particles. It was noticed that a low-porosity barrier creates higher turbulence levels upstream of the panel in the form of vortices, allowing particles to be suspended in the air, and it was found that the optimal barrier porosity is 50%. The wind barriers proposed by Refs. [25,26,27,28] were effective for ground-mounted solar panels, but they cannot be used for dust mitigation on solar panels that operate street light posts because of the height. The only published articles on the use of wind barriers or windshields in dust mitigation on such panels are those by Eisa et al. [29] and Shenouda et al. [30]. Eisa et al. [29] proposed a technique to mitigate dust on PV panels that operate light posts, including fixing a windshield on the panel, which obstructs the dust carried by the wind from reaching and settling on the PV panel. They experimentally implemented two designs of the shields. The first is a 1D shield that obstructs the wind from the North, while the other is a 2D shield that obstructs the winds from the North and from the East direction. It has been found that the 1D shield performed better than the 2D shield. In fact, the 2D shield assisted in accumulating more dust on the PV surface compared to the no-shield panel. Shenouda et al. [30] used a dust shield with the same width as the panel and tilted it at an angle of 120° with the panel for dust mitigation. CFD simulations were performed to evaluate the effect of the dust shield on dust accumulation on the panel. It was found that using a dust shield decreases the dust deposition rate by more than 44%. In addition, it is concluded that the deposition rate could be decreased by extending the panel’s surface at the lower edge using a flat plate. Moreover, adding an air gap between the shield and the extension plate induces air drafts over the panel’s surface. The air drafts act as a barrier that prevents the deposition of dust particles on the panel surface. The effect of the air drafts increases with the increase in the air gap. Finally, it was found that using a dust shield with an extension plate and a large air gap is an effective method for dust mitigation that can decrease the dust deposition rate by more than 88%. Shenouda et al. [30] demonstrated the effectiveness of dust shields in reducing dust accumulation on PV panels operating street light posts. However, dust shields limit the airflow on the panel’s surface. The lack of airflow can limit the overall dust removal, as stagnant air allows dust to settle and accumulate. This limitation has led to the need for the development of advanced configurations in dust shields to improve airflow and dust mitigation.

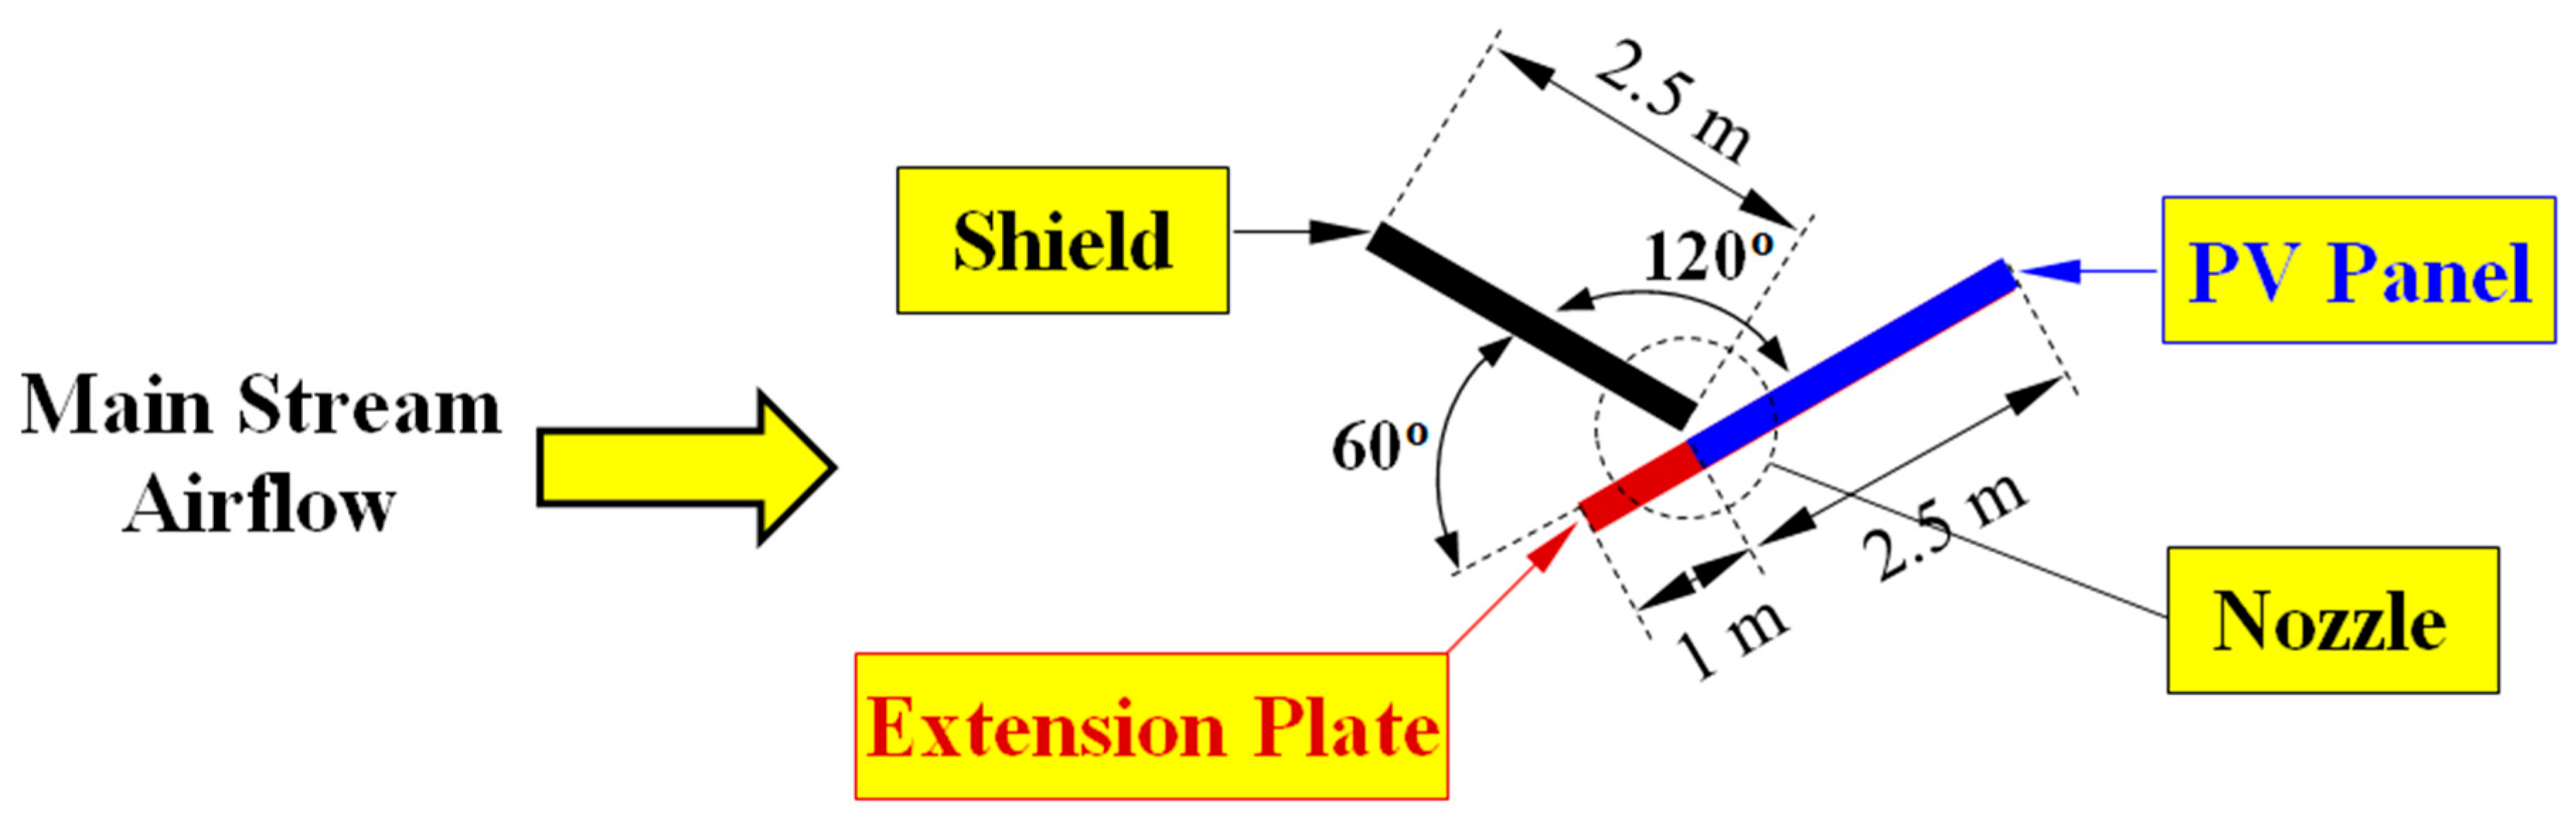
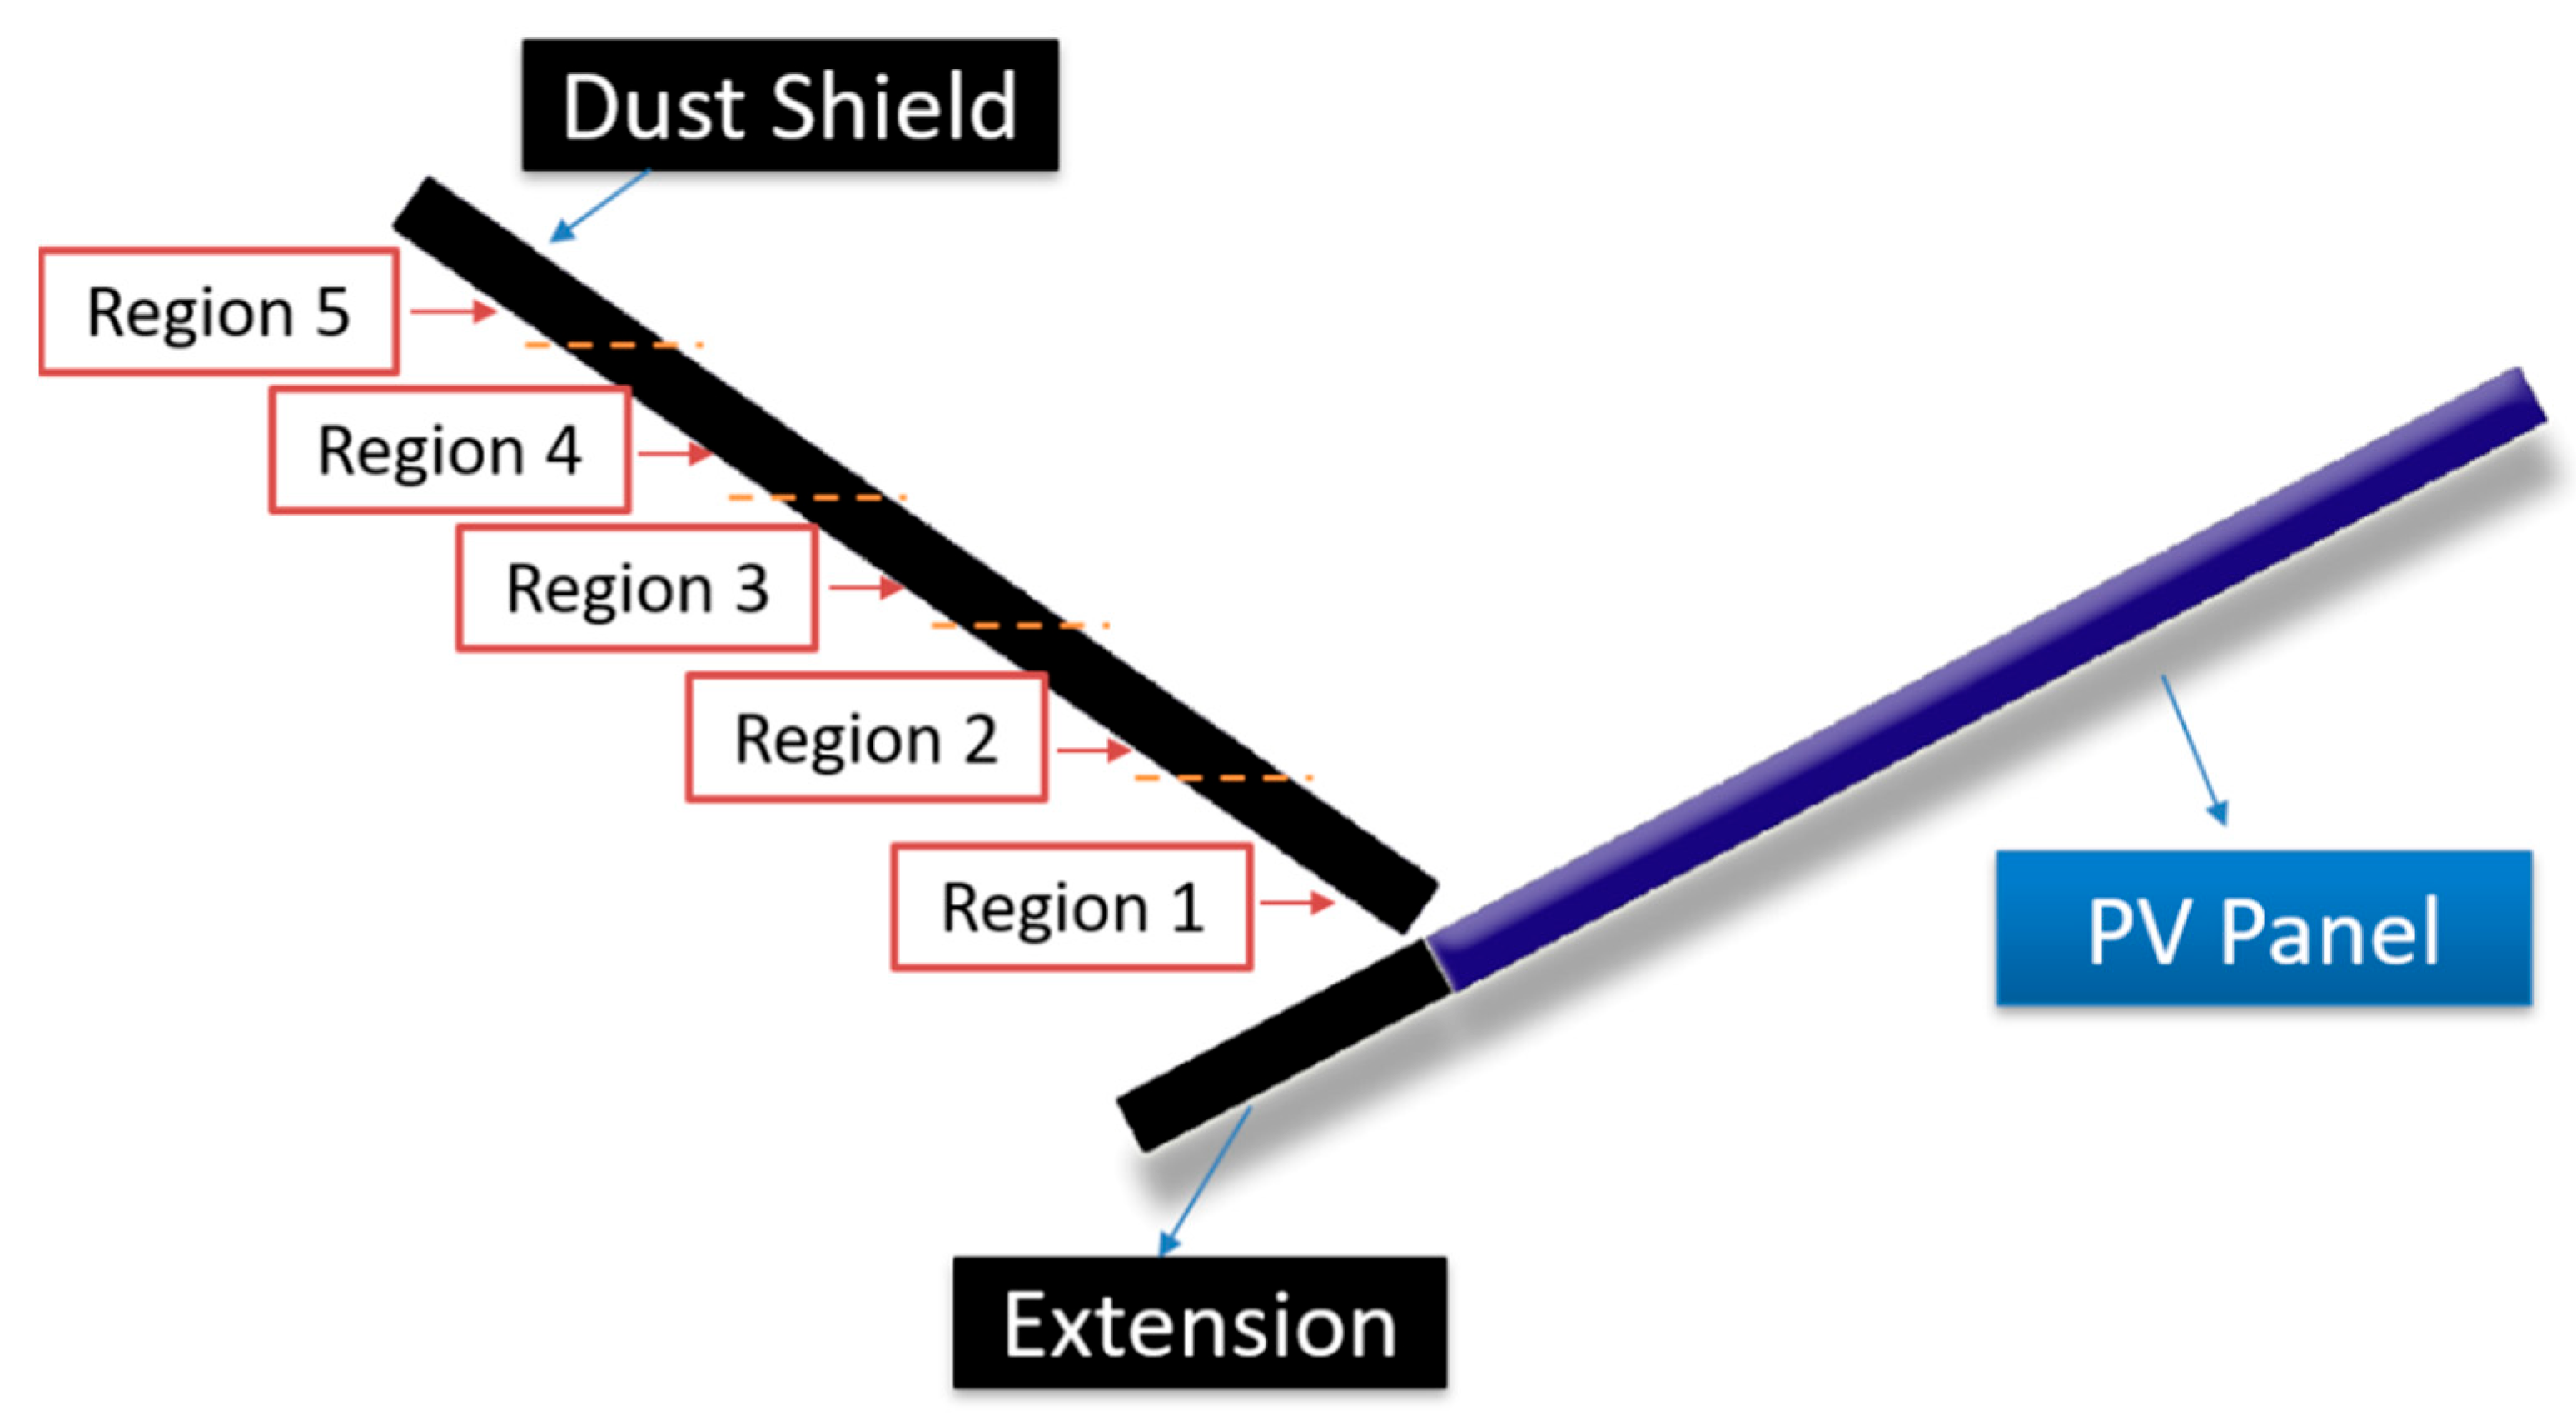
1.3. A New Design of Dust Shields

In this research, a new design of dust shields is introduced that integrates an air slit into the dust shield, which acts as an air nozzle that can enhance the air dynamics across the surface of PV panels, consequently, prevents dust accumulation more effectively than conventional shields. Moreover, the design ensures that dust particles swept away from the panel surface do not settle back again after being swept away. This approach can maintain cleanliness over extended periods. The idea of inserting a slit in the dust barrier can be easily implemented by simply cutting a rectangle in the barrier according to the required dimensions and position. The investigation involves all of the aspects of the new design, including the optimal size, position, and configuration of the air slit. Through numerical simulations, the airflow patterns and dust removal efficiency associated with different slit designs are analyzed. This approach will identify the most effective parameters that maximize dust mitigation and minimize maintenance requirements for PV systems. The research seeks to provide insights that can enhance the cleaning process of PV panels, thereby promoting the usage of solar energy as a sustainable power source.

2. Numerical Methodology

2.1. Numerical Scheme

The airflow around the PV panel is simulated using the CFD package ANSYS FLUENT 18.1, and the numerical simulation is taken further as the input boundary condition for modeling dust deposition on the panel’s surface. The Eulerian–Lagrangian approach is adopted to trace the trajectories of the dust particles because of its accuracy in predicting the transport behavior of dust particles within the airflow [31]. In this research, it is assumed that the airflow is incompressible, and the Eulerian–Lagrangian approach is applied for a steady state 2D airflow around the panel.

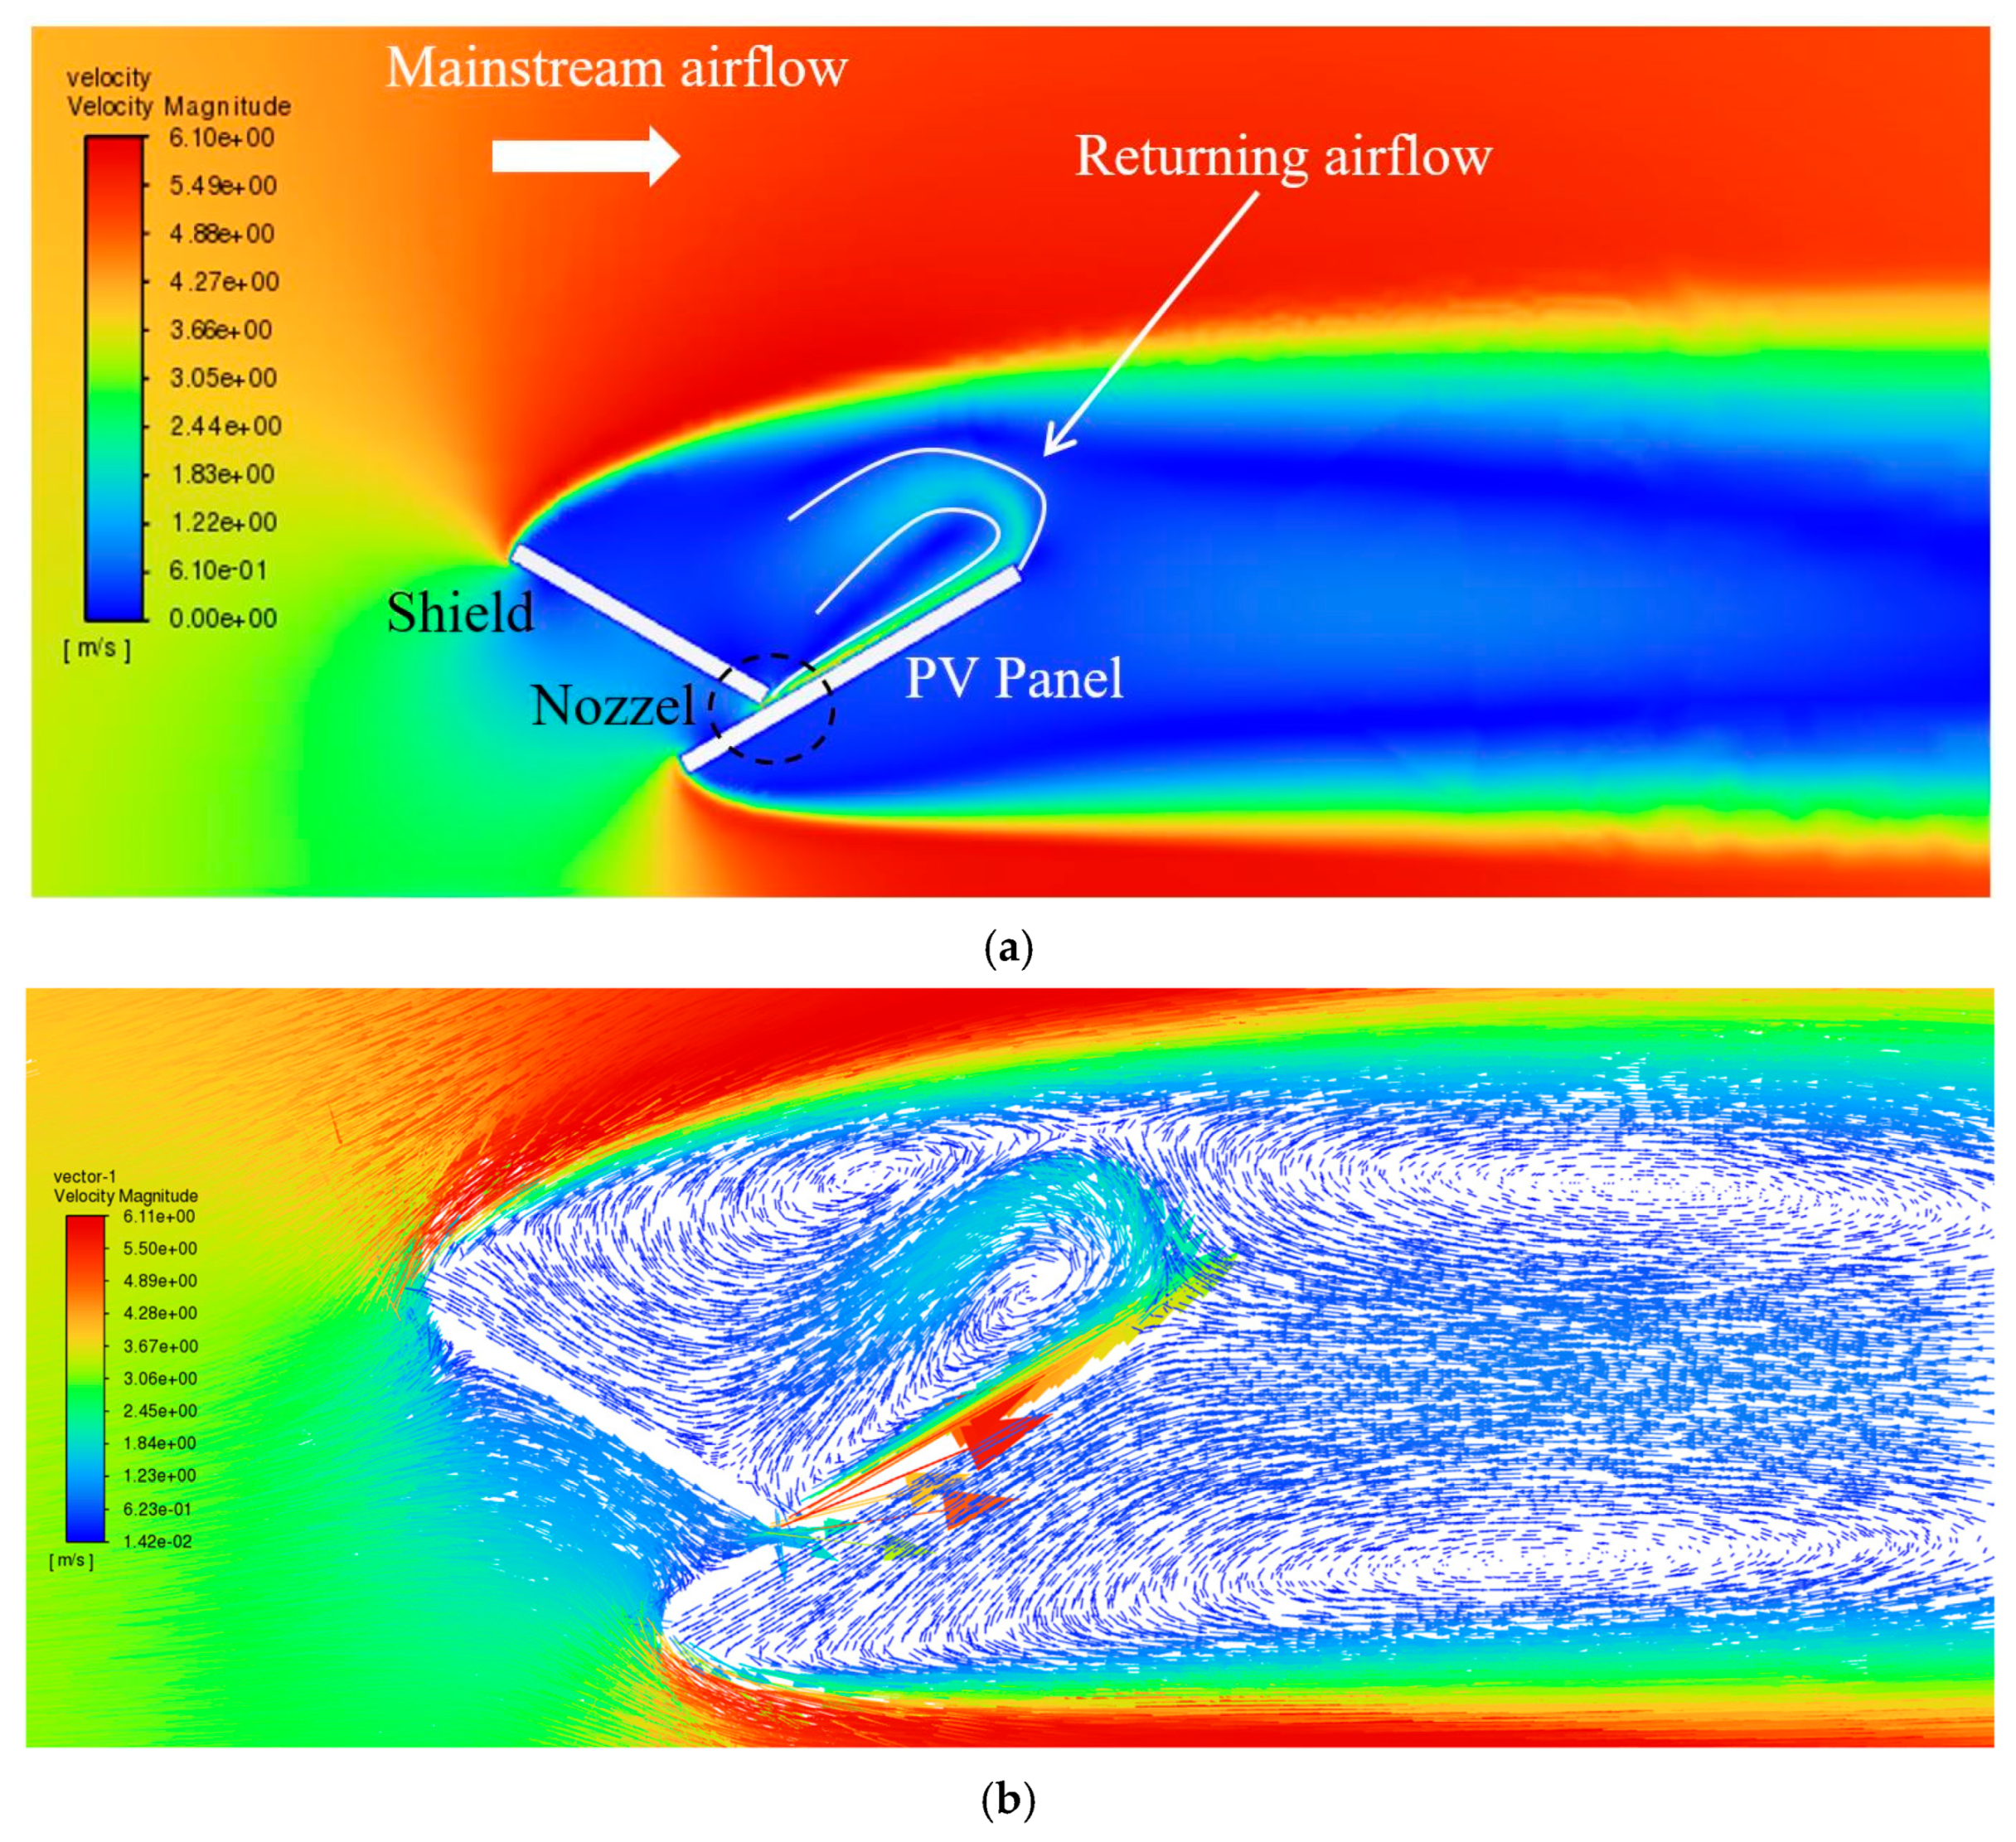
2.2. Airflow Around the PV Panel

In this research, the Reynolds Averaged Navier–Stokes (RANS) equations were applied. The RANS equations are mainly based on the fundamental laws of mass and momentum conservation, in addition to serving as the guiding principles for turbulent airflow. The time-averaged mass and momentum equations, encapsulated in Equations (1) and (2), describe the behavior of turbulent airflow fields surrounding the PV panel. These equations model the mean velocity and pressure fields within the domain of incompressible turbulent flow [32].
u ¯ i x ¯ i = 0 ,   i   =   1 ,   2
u ¯ i t + u ¯ j u ¯ i x j = 1 ρ p ¯ x i + 1 ρ x j ν u ¯ i x j ρ u i u j _ _ _ _ _ _ .   i ,   j   =   1 ,   2
where ρ  and ν represent the fluid density and kinematic viscosity, while p ¯ and u i  represent time-averaged pressure and velocity, respectively. The last term on the right-hand side of Equation (2) represents the force due to turbulence per unit volume where ρ u i u j is the Reynolds stress tensor and u i represents the fluctuation velocity of the fluid. The Reynolds stresses make the number of unknowns higher than the number of RANS equations. Consequently, a turbulence model should be adopted as a closure to the equations in order to predict the turbulent airflow around the solar PV panel [33]. The numerical results for airflow around a panel performed by several studies [20,34] proved that the shear stress transport (SST) k-ω turbulence model has the best prediction results among different turbulence models. The transport governing equations of the (SST) k-ω turbulence model are addressed by Equations (3) and (4) [32]. Hence, to effectively predict turbulent airflow around the solar PV panel, a turbulence model serves as a crucial component for closing the equations [32]. Various studies have demonstrated the effectiveness of the shear stress transport (SST) k-ω turbulence model compared to other turbulence models [20,34]. Notably, numerical simulations were carried out in studies highlighted in Refs. [20,34] underline the superior predictive capabilities of the SST k-ω turbulence model, solidifying its position as the model of choice for accurate airflow predictions in this research.
t ( ρ κ ) + x i ( ρ κ u i ) = x j ( Γ κ κ x j ) + G κ Y κ + S κ ,
t ( ρ ω ) + x i ( ρ ω u i ) = x j ( Γ ω ω x j ) + G ω Y ω + D ω + S ω .
where Gk (m2/s2) and Gω (s−1) are the generation of turbulent kinetic energy  κ  and the specific dissipation rate ω, respectively. The effective diffusivities of κ and ω are given by Γk and Γω, respectively. Yk and Yω are the dissipation rates of κ and ω, respectively. Dω stands for the cross-diffusion term. Sk and Sω are user-defined source terms, respectively, and both are taken as zero.

2.3. Boundary Conditions

This paper establishes specific parameters and conditions for the computational domain where the initial wind inlet velocity was taken as 4 m/s, representing the average wind speed in Egypt [35]. The initial pressure is equivalent to the standard atmospheric pressure across the computational domain. A turbulent boundary layer is achieved when the Reynolds number (Re) exceeds 100,000, calculated as Re = ρvL/μ = 328,601, where air density (ρ) = 1.225 kg/m3, air velocity (v) = 4 m/s, representative length (L) = 1.2 m, and dynamic viscosity of air (μ) = 1.79 × 10⁻⁵ kg/m.s. The boundary conditions were set as follows: a no-slip boundary condition was applied to all walls. The roughness model used for wall roughness was the standard model. The outflow boundary condition was implemented at the outlet, and finally, the symmetry boundary condition was applied to the upper boundary of the computational domain [32,33].

2.4. Dust Deposition Behavior

The behavior of dust particles was modeled as a discrete phase using the Discrete Phase Model (DPM). This approach involves tracking the trajectory of individual dust particles by solving the particle dynamics equation through the effective DPM model. The effective DPM model is particularly well-suited for scenarios where there is a single continuous, discrete phase with a minimal volume fraction, typically less than 12% [36]. Since the dust-laden airflow was dilute in this case, the impact of dust motion on the fluid flow field and particle–particle interactions was considered negligible. The governing equation of the dust motion is described by Newton’s Law of Motion as follows [36],
m p d u p d t = 1 2 C D A p ρ u u p u u p + m p g ρ V p g + F ,
where m p d u p / d t is the force acting on the dust particle of mass mp and velocity  u p , which is equal to the summation of the terms on the right-hand side of Equation (5). The terms on the right-hand side of Equation (5) are defined as follows. The first term corresponds to the drag force, where the drag coefficient is denoted by C D , the particle cross-sectional area is represented by A p and u p signifies the velocity of the dust particle. The second term, m p g , illustrates the weight of the particle, where g denotes the acceleration due to gravity. The third term, ρ V p g , signifies the buoyancy force and V p represents the volume of the dust particle. In Equation (5), the last term on the right-hand side, F , represents Saffman’s lift force, which is essentially the lift generated due to shear effects in the fluid flow field. Additionally, the study neglected the impact of the pressure gradient, virtual mass, and Basset forces on particle dynamics. This exclusion was justified by the relatively small ratio of air density to particle density, which was 0.00043. Consequently, external forces were considered more significant, compared to these neglected forces, in influencing the motion and behavior of the particles within the airflow [36]. The Discrete Random Walk (DRW) model is employed as a stochastic approach in order to model the turbulent dispersion of dust particles influenced by airflow velocity fluctuations. The DRW model provides a more realistic representation of how dust particles scatter in turbulent airflow scenarios [36]. Equations (1)–(5) are utilized to resolve the two-phase flow field of air and dust within the computational domain. In this scenario, spherical dust particles, distributed uniformly in space, are introduced into the domain at the inlet following the convergence of the airflow simulations. The main objective is to calculate the accumulated dust particles on the surface of a panel. It is assumed that any particles impacting the surface of the PV panel will be deposited without re-suspension, and this is employed in Fluent by activating the “trap function” only at the panel’s surface. This condition is not very correct since particles can only stick if the impact speed of the particles is below the critical sticking velocity [37], and introducing such a condition in Fluent is beyond the scope of this research. Meanwhile, the “escape function” is activated for other boundaries in order to allow the free movement of the particles.

2.5. Solution Strategy

The Finite Volume Method (FVM) was employed to address the conservation laws of mass and momentum equations governing turbulent airflow fields. A coupled scheme was utilized to separate the pressure and velocity fields. Pressure was discretized using a second-order scheme, while momentum, turbulent kinetic energy, and specific dissipation rate were discretized using a second-order upwind approach. To solve the equations related to dust particle motion, the Runge–Kutta method was applied. The convergence criteria were set such that the solution converged when the Residual Mean Square Error (RMSE) value reached 10−6.

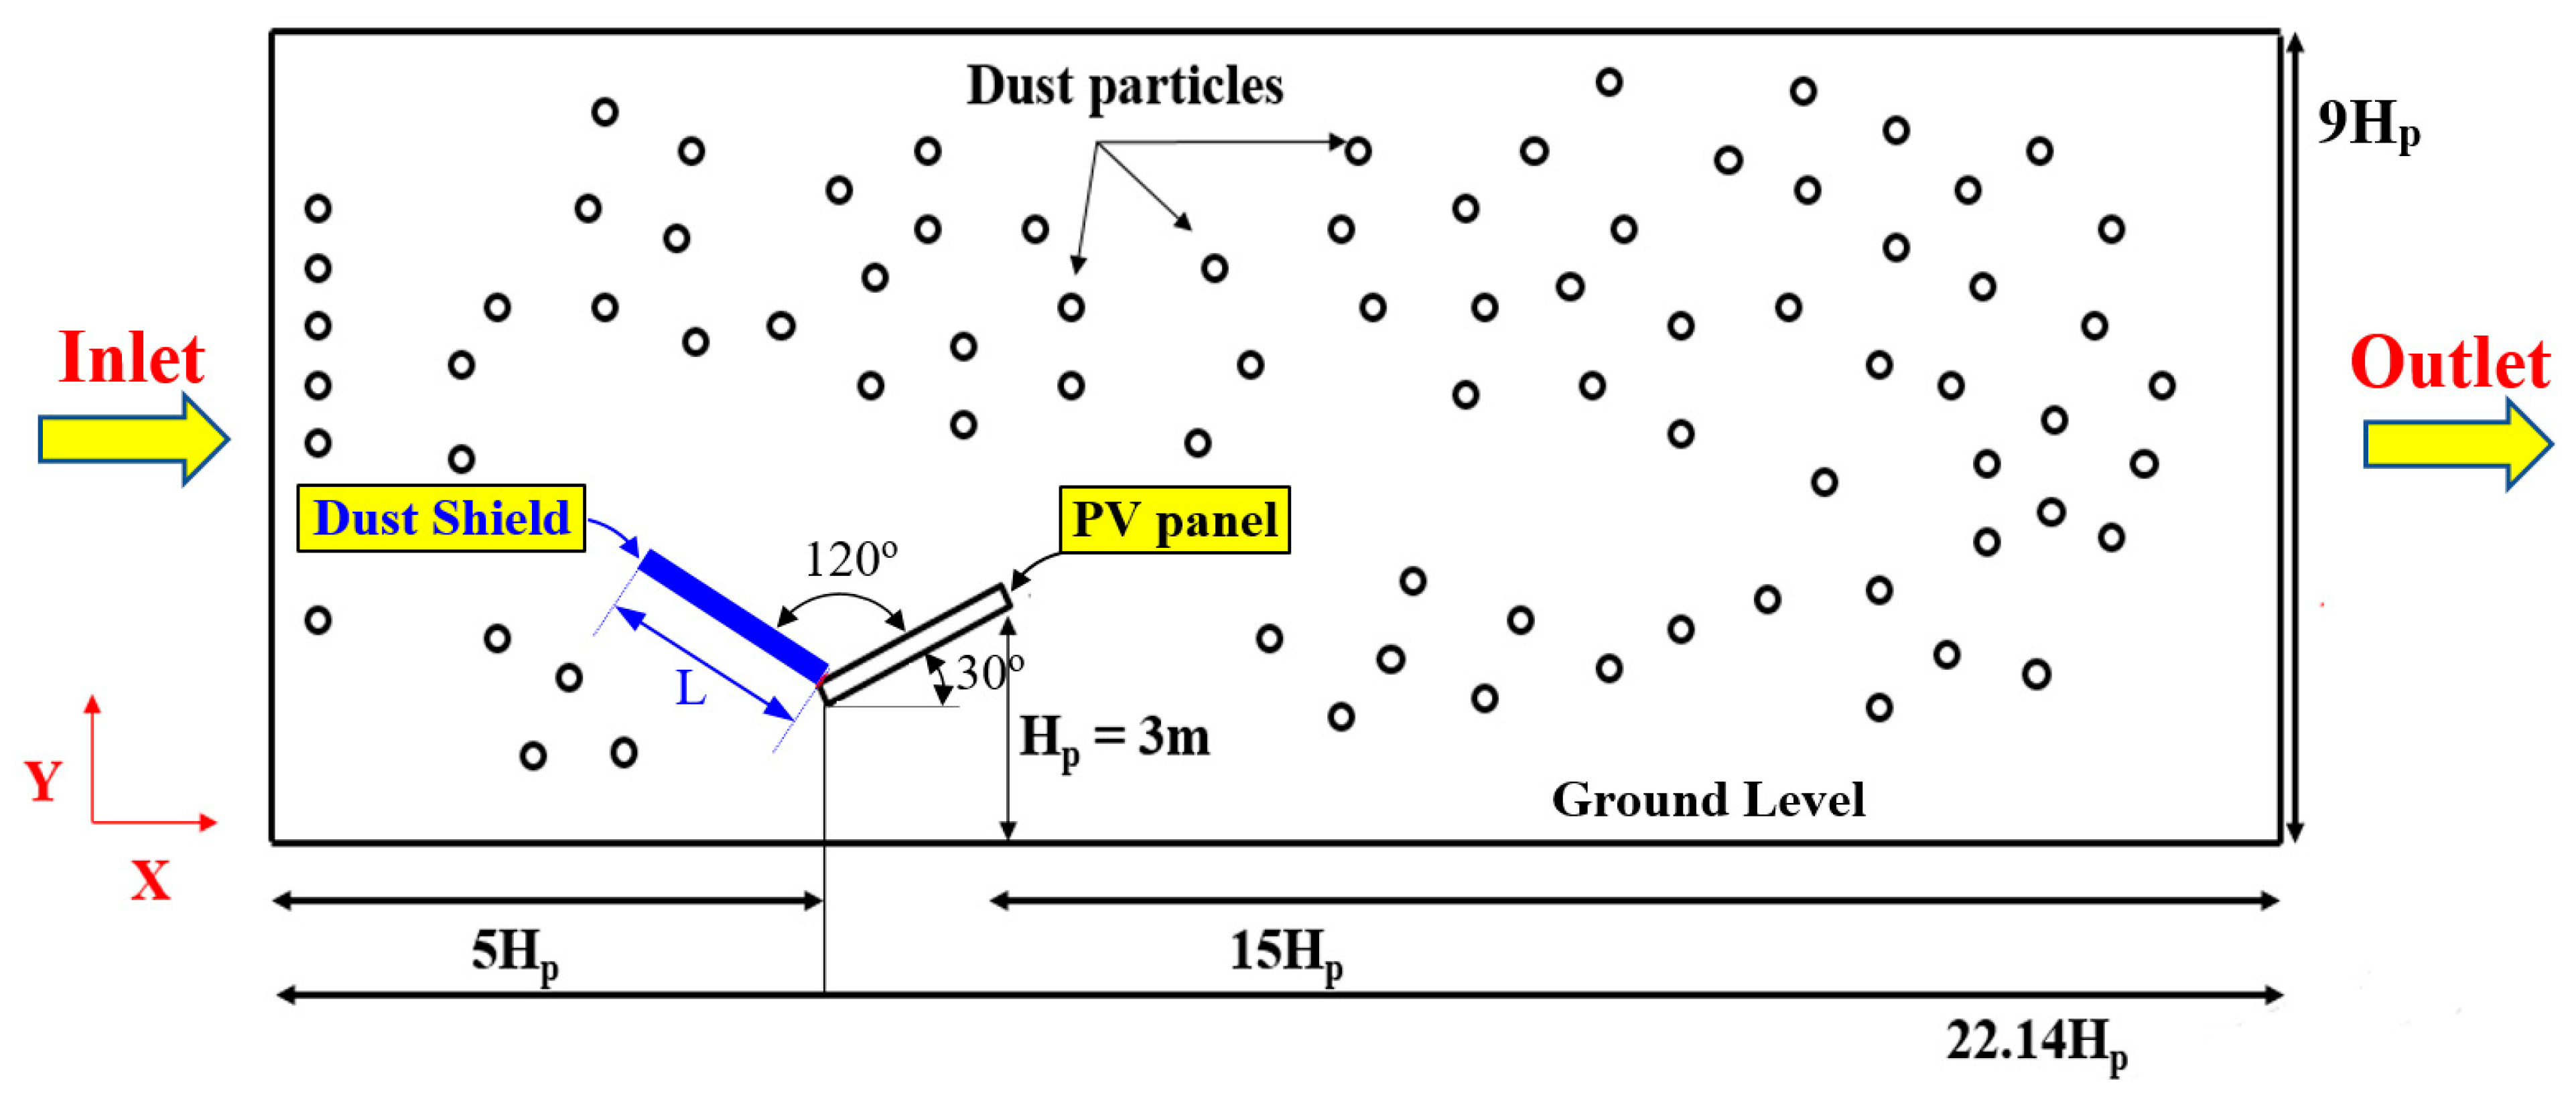
2.6. Model Geometry and Case Description

The airflow around a PV panel, which is fixed to a light post, is simulated, and a schematic of the PV panel with respect to the computation is presented in Figure 1. The PV panel is tilted at an angle of 30° from the horizontal plane. Additionally, a dust shield is attached to the PV panel, which has the same dimensions as the panel. Notably, the angle between the PV panel and the dust shield is 120°, as depicted in Figure 1. The choice of a 120° angle is based on a study conducted by Eisa et al. [29]. This angle was selected to prevent shading caused by the dust shield; shading can occur if the angle is less than 120°. Conversely, angles greater than 120° result in the reduced impact of the dust shield on dust deposition, as the obstructed wind length by the shield is decreased. Hence, the 120° angle represents a balance between minimizing shading effects and maximizing the shield’s impact on dust accumulation. However, further research will be conducted to determine the minimum angle between the dust shield and the PV panel without shading the panel, and based on that angle, the presented research will be repeated but with a new angle. The computational domain structure was modeled following the wind tunnel configuration outlined by Tominaga et al. [33]. The length of the domain, Lx, is set to Lx = 22.4Hp, and the height of the domain, Ly, is taken as Ly = 9Hp, where Hp is the height of the panel from the ground, as defined in Figure 1, and it is set to 3 m. Therefore, Lx and Ly are equal to 67.2 m and 27 m. Also, the length of the PV panel, L, is set to 2.5 m. The distance between the air inlet boundary and the PV panel was set to 5HP, while the distance from the PV panel to the air outlet boundary was set at 15HP to allow for wake flow redevelopment. Once the airflow fields reached convergence with a residual of 10−6, spherical dust particles with a uniform size distribution were introduced at the domain’s inlet. The Discrete Particle Model (DPM) was utilized to model the behavior of the injected particles with respect to the PV panel’s surface. In this study, the dust type was assumed to be calcium carbonate, with a density of 2800 kg/m3 and a diameter of 60 μm. A total of 10,000 dust particles were introduced into the domain; each injection was tracked 10 times.

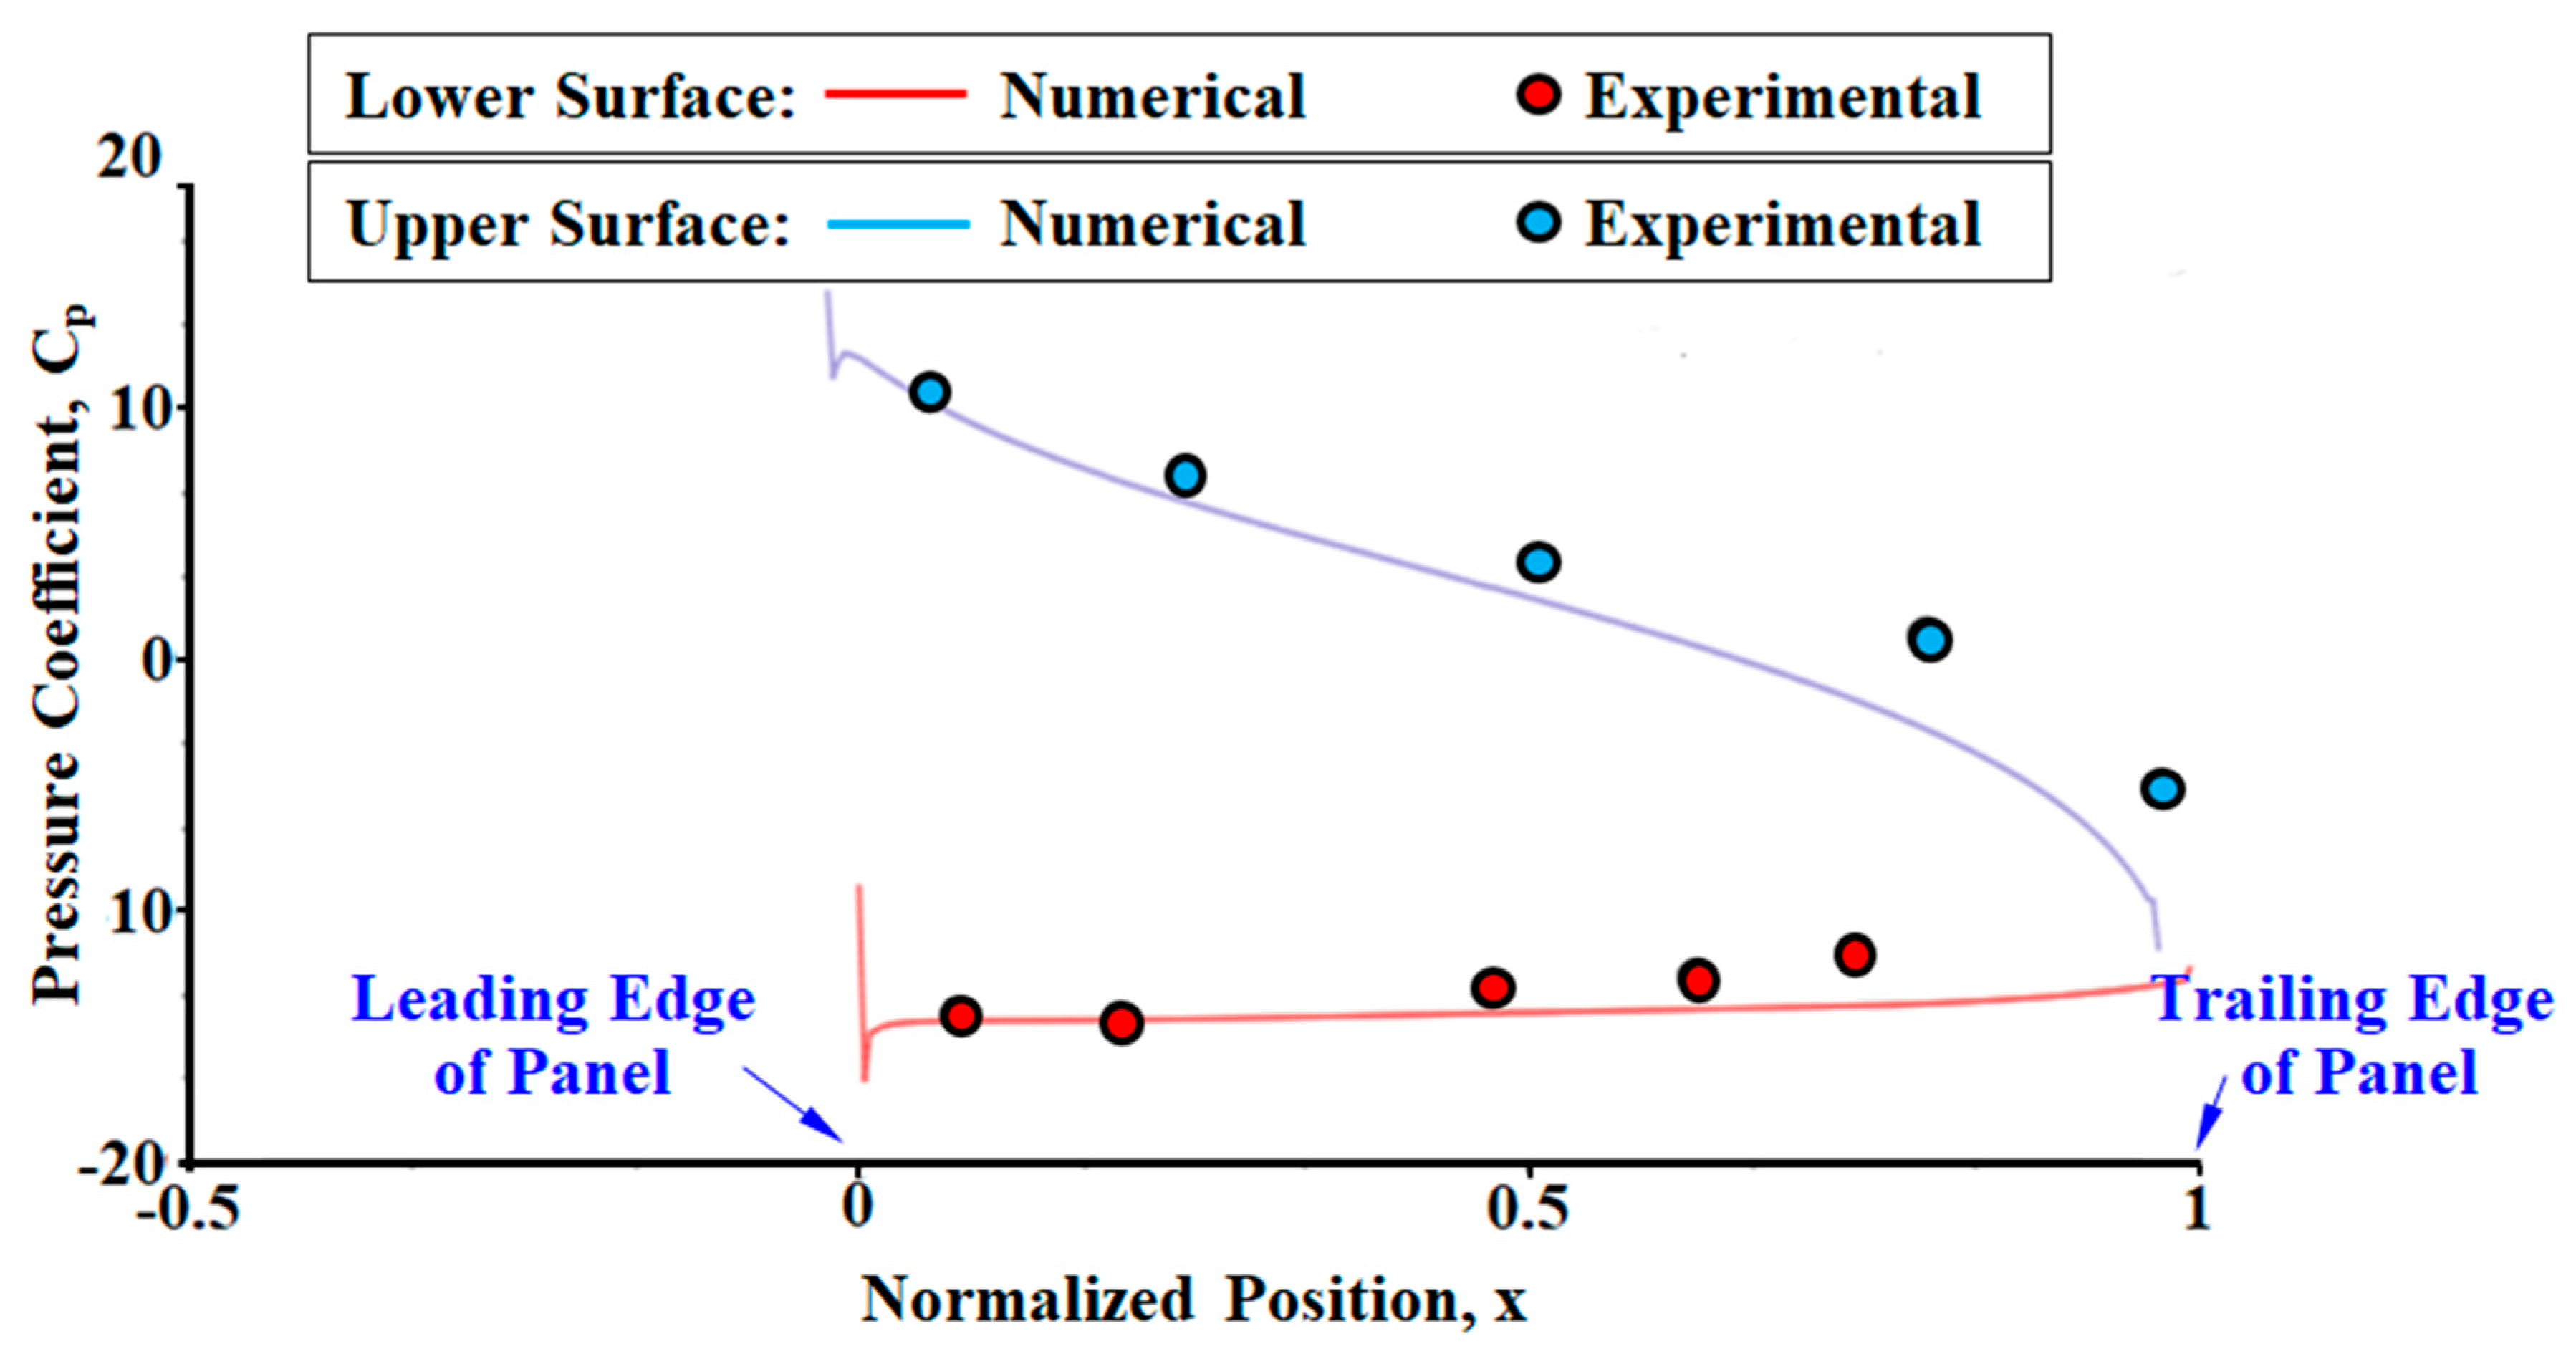
2.7. Grid Independence Study and Numerical Validation

The computational domain was discretized using a non-uniform mesh strategy to achieve an optimal balance between computational efficiency and accuracy. This approach acknowledges the varying levels of detail required in different regions of the domain. A finer mesh was employed in the area near the PV panel, which is the area of primary interest in this study. A cell size of 0.05 m was chosen for this critical area to ensure the capture of the flow features. In contrast, the exterior regions of the domain, where the flow is less influenced by the presence of the panel, were discretized with a coarser mesh. A cell size of 0.15 m was deemed appropriate for these areas, providing a balance between capturing the general flow characteristics and maintaining computational efficiency. To verify the mesh independence of the numerical solutions, a grid independence study was conducted. This involved simulating the airflow with progressively coarse and finer meshes and analyzing the changes in the key parameters of interest, i.e., the velocity profile. By establishing that the solutions obtained with the chosen mesh configuration exhibit minimal variation compared to those obtained with a finer mesh, the velocity profile of the fine mesh coincides with the finer grid velocity profile. However, the velocity profile of the coarse mesh is somehow different from those of the other meshes. Accordingly, the fine grid was adopted in the present study.
In order to validate the developed numerical model, the mean pressure coefficient, Cp, is calculated by the model at the upper and lower surfaces of the PV panel [34], and the results are compared to the experimental measurements performed by Abiola-Ogedengbe et al. [38]. The CP is determined numerically with respect to the normalized position, x, which is the distance measured along the solar panel width from the leading edge and normalized by the total panel width, i.e., WPV. Therefore, x = 0 is the leading edge of the panel, while x = 1 is the trailing edge of the panel. The pressure coefficients measured by Abiola-Ogedengbe et al. [38] are specifically related to the airflow over solar panels. The referenced experiment utilized an open return wind tunnel with dimensions of 33 m length, 2.4 m width, and a height varying from 1.5 m at the entrance to 2.15 m at the test area. The tested PV panel is mounted at an angle of 30° relative to the horizontal plane, and the dimensions of the panel are 0.72 m × 0.24 m × 0.17 m, i.e., length × width × thickness. The flow conditions within the wind tunnel were characterized by an air velocity of 15 m/s and a Reynolds number of 369,553. The pressure coefficient, as measured experimentally by Ref. [38] and determined numerically based on the developed numerical model, is presented in Figure 2. It was found that the maximum deviation of the mean CP between the numerical simulations and the experimental measurements is about 1.04%. Therefore, it is possible to predict accurately the airflow field and the behavior of the dust particles with respect to the panel using the developed numerical model.

3. Results

The dust shield attached to the PV panel, as developed by Shenouda et al. [30], is shown in Figure 3, and it is taken as the baseline for comparison. In the design of Shenouda et al. [30], an extension is added to the PV panel, which leads to the development of an air nozzle at the leading edge of the panel, as can be seen in Figure 3. The airflow simulation around the dust shield and the panel is presented in Figure 4. It is noted from the velocity contours presented in Figure 4a that the airflow coming out of the air nozzle sweeps the panel surface and then reverses its direction as it approaches the end of the panel. This reverse in motion is due to the high pressure at the upper edge of the panel, which forces the airflow to reverse its direction of motion. The velocity vectors shown in Figure 4b confirm the conclusion drawn from the velocity contours regarding the flow direction and the reverse in motion at the end of the PV panel. Consequently, this reverse in the airflow direction increases the dust deposition over the PV panel. Particle tracking simulations were performed to quantify dust deposition on the PV panel’s upper surface, and it was found that the number of particles deposited on the panel’s surface was around 355 particles out of the 10,000 injected particles. Therefore, creating an air slit in the dust shield, which allows a jet of air to come out of the slit and prevent the airflow from returning back to the panel, can decrease the dust deposition over the panel. Therefore, the objective of this research is to study the numerical influence of the air-slit size and position on the dust deposition over the panel surface in terms of the number of deposited particles, as follows.

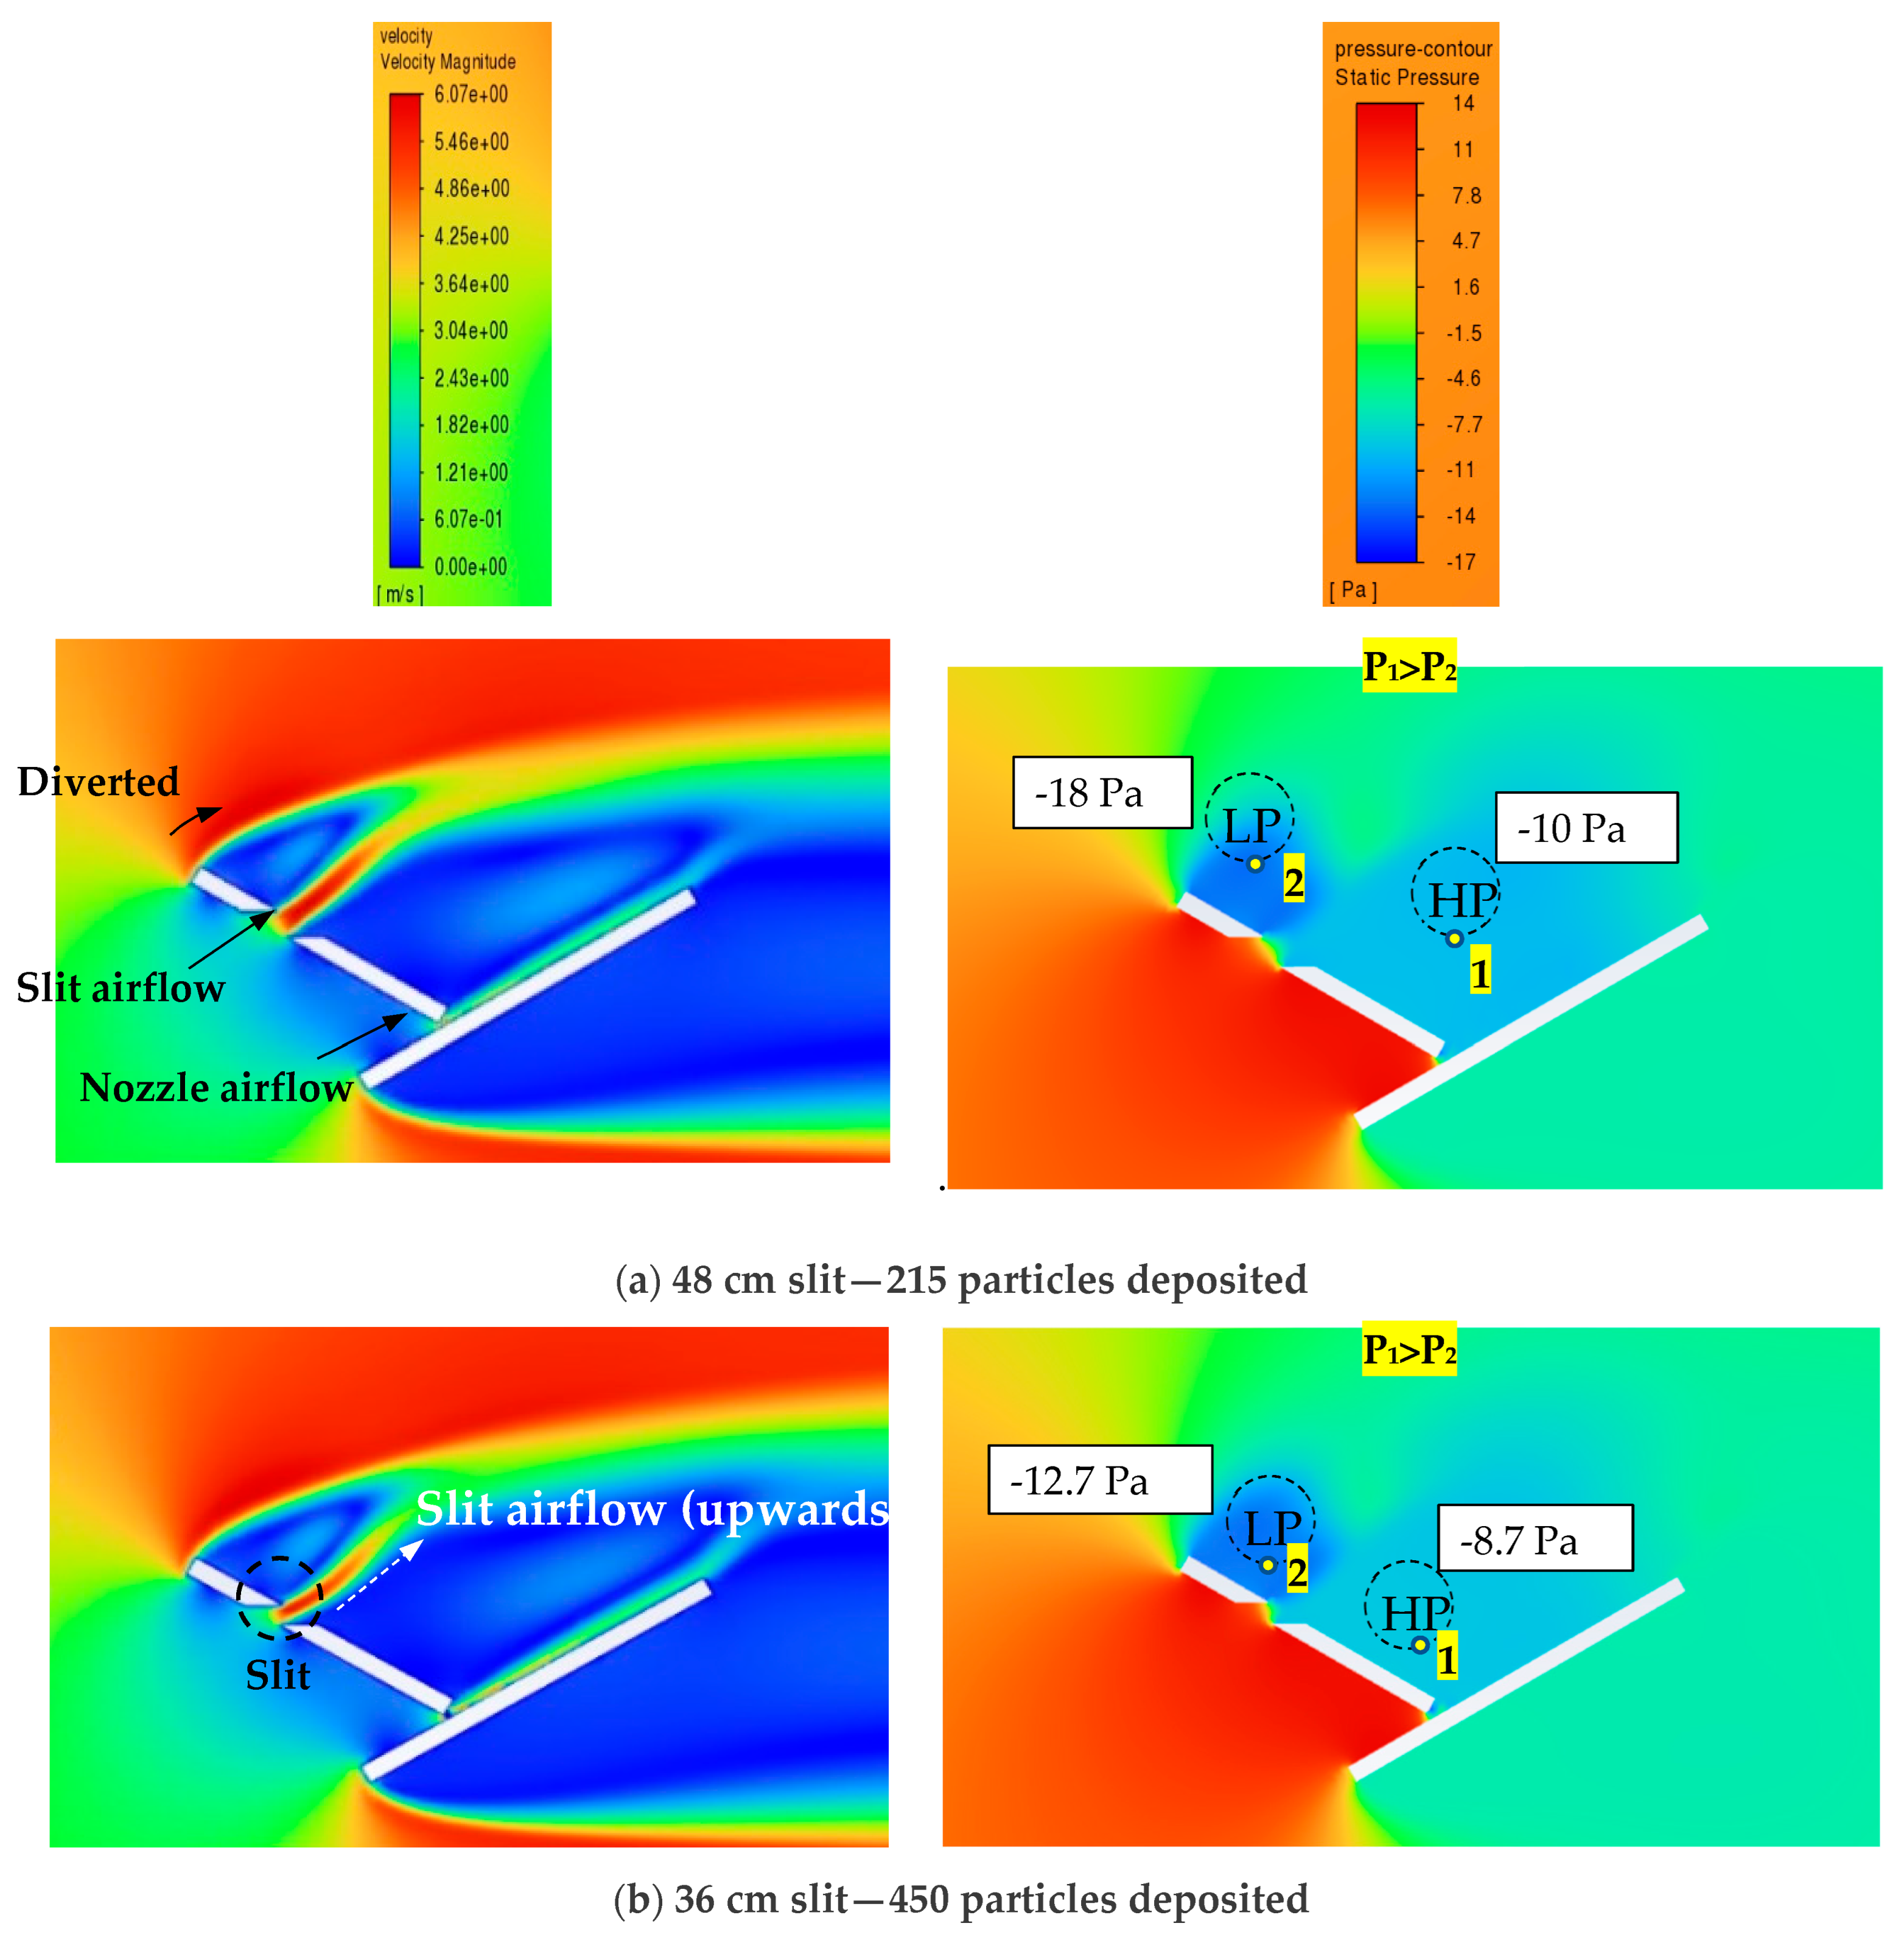
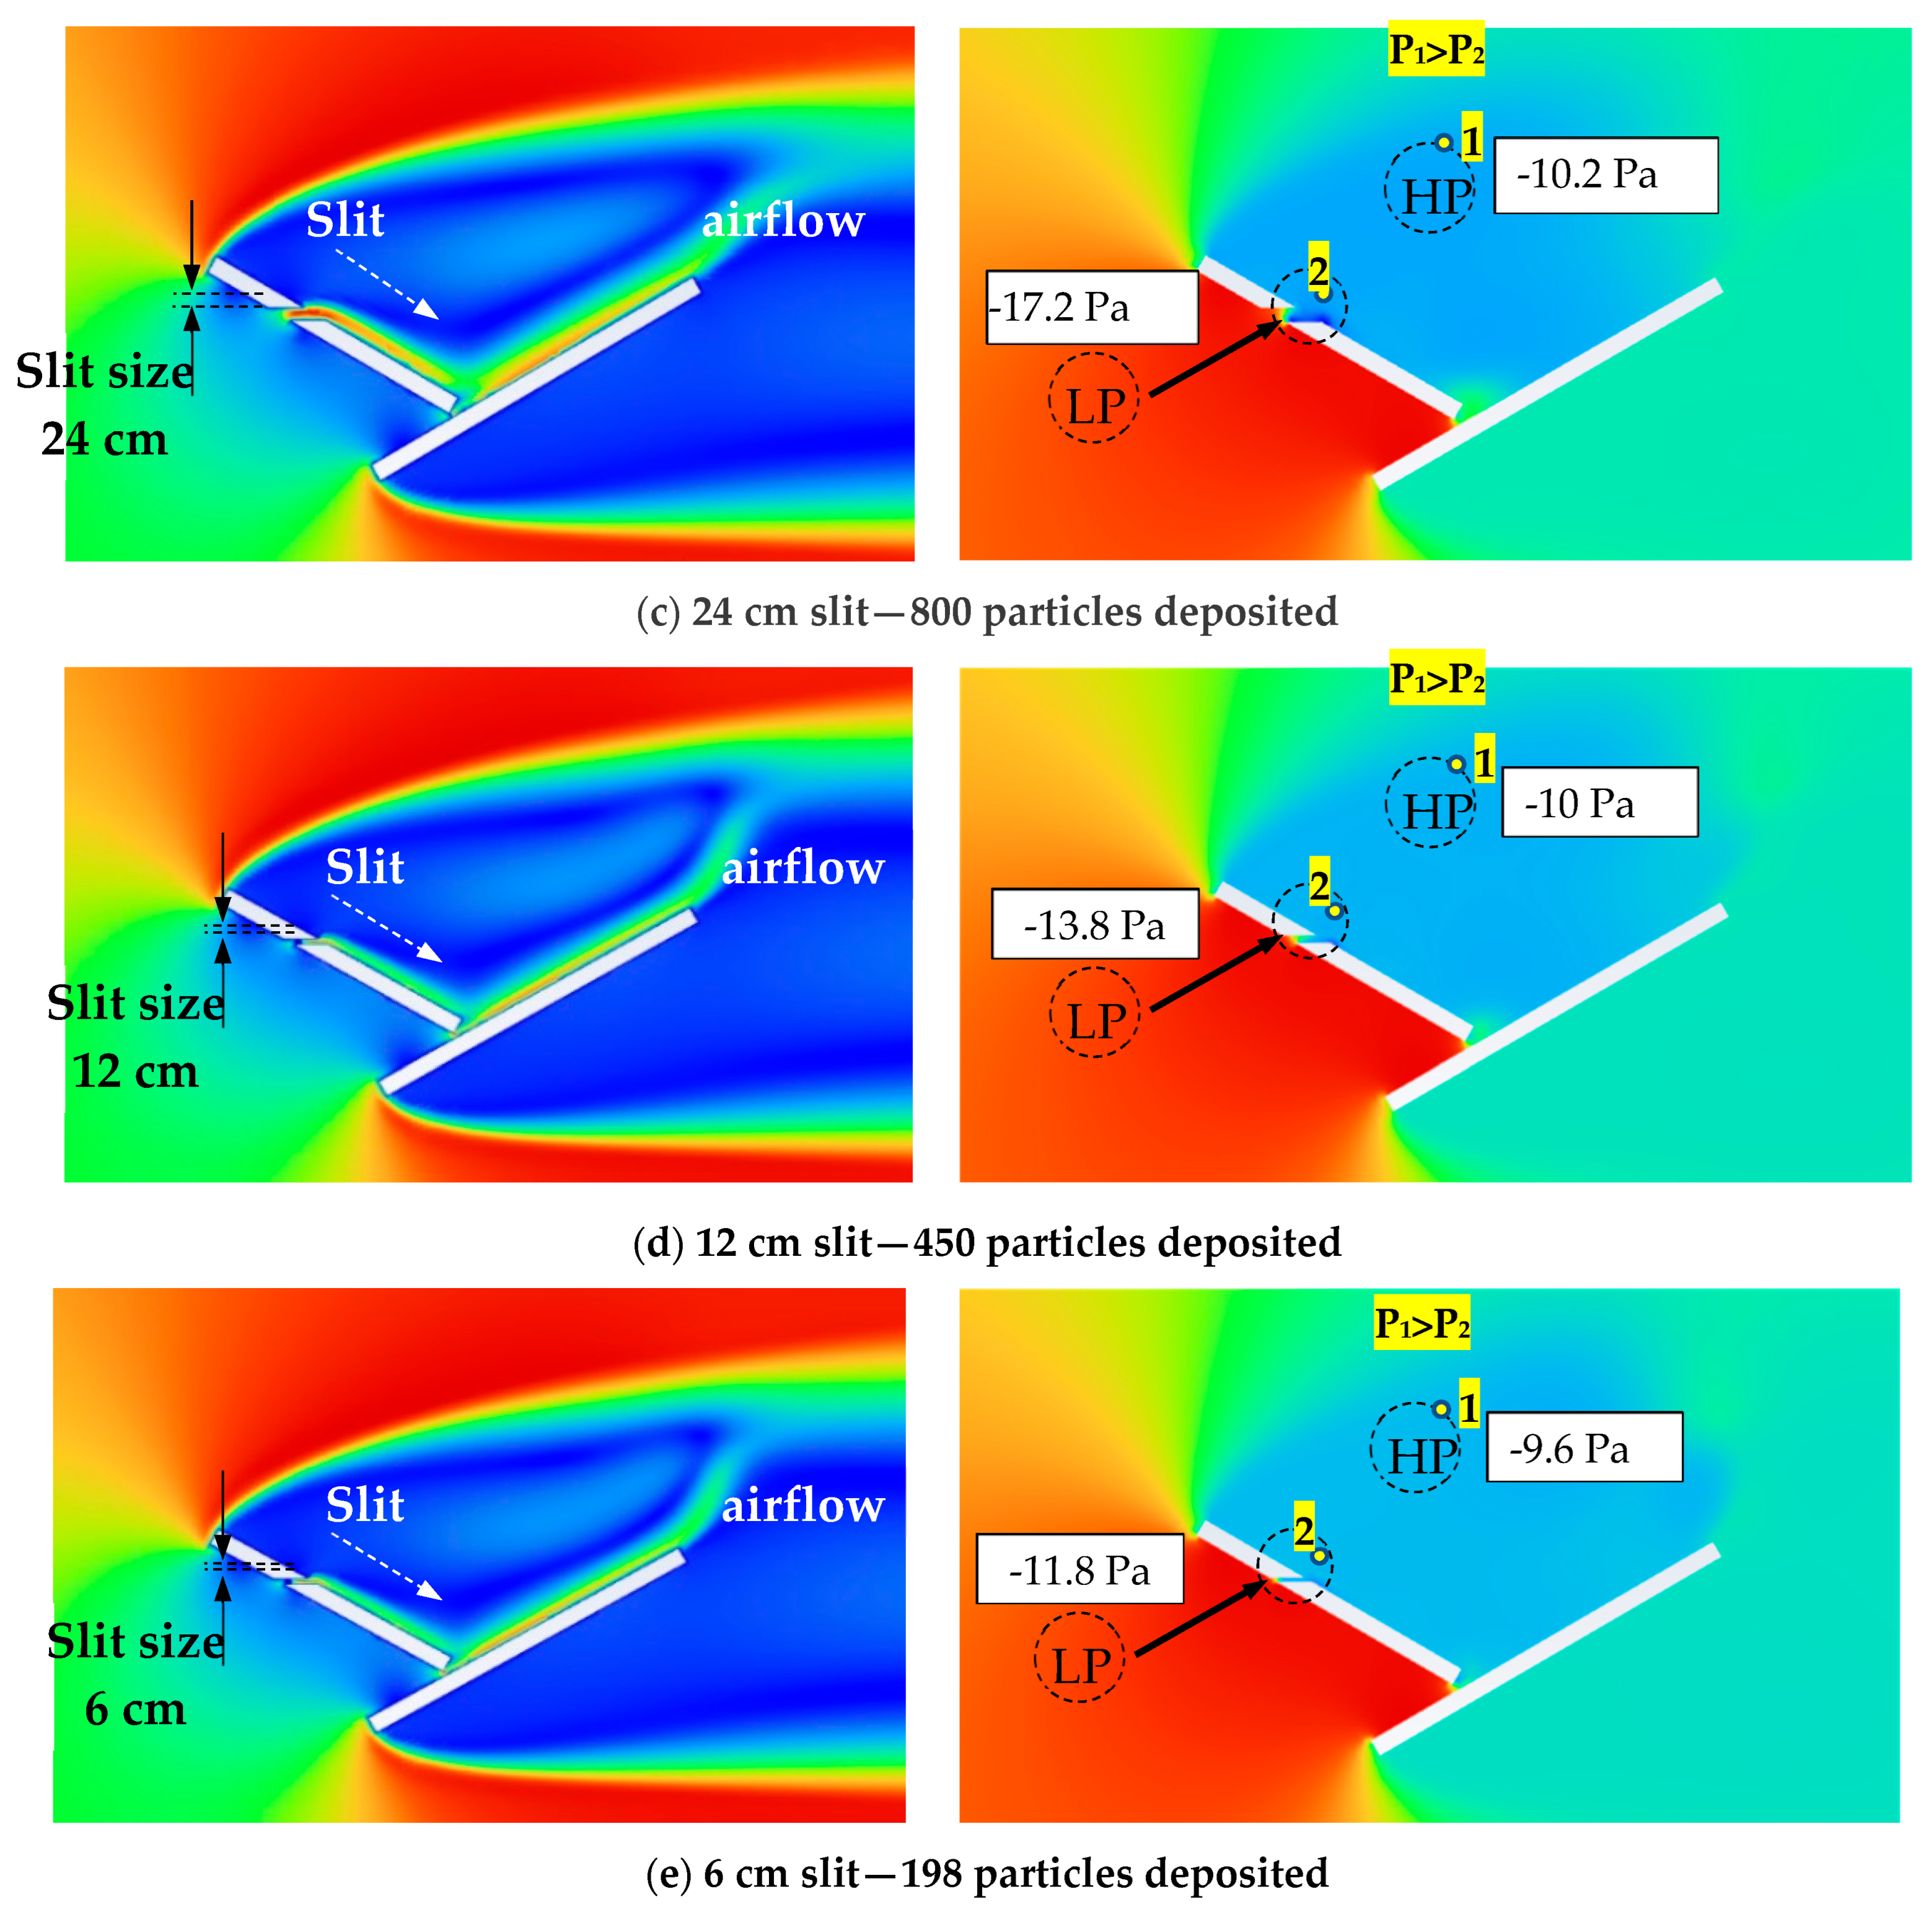
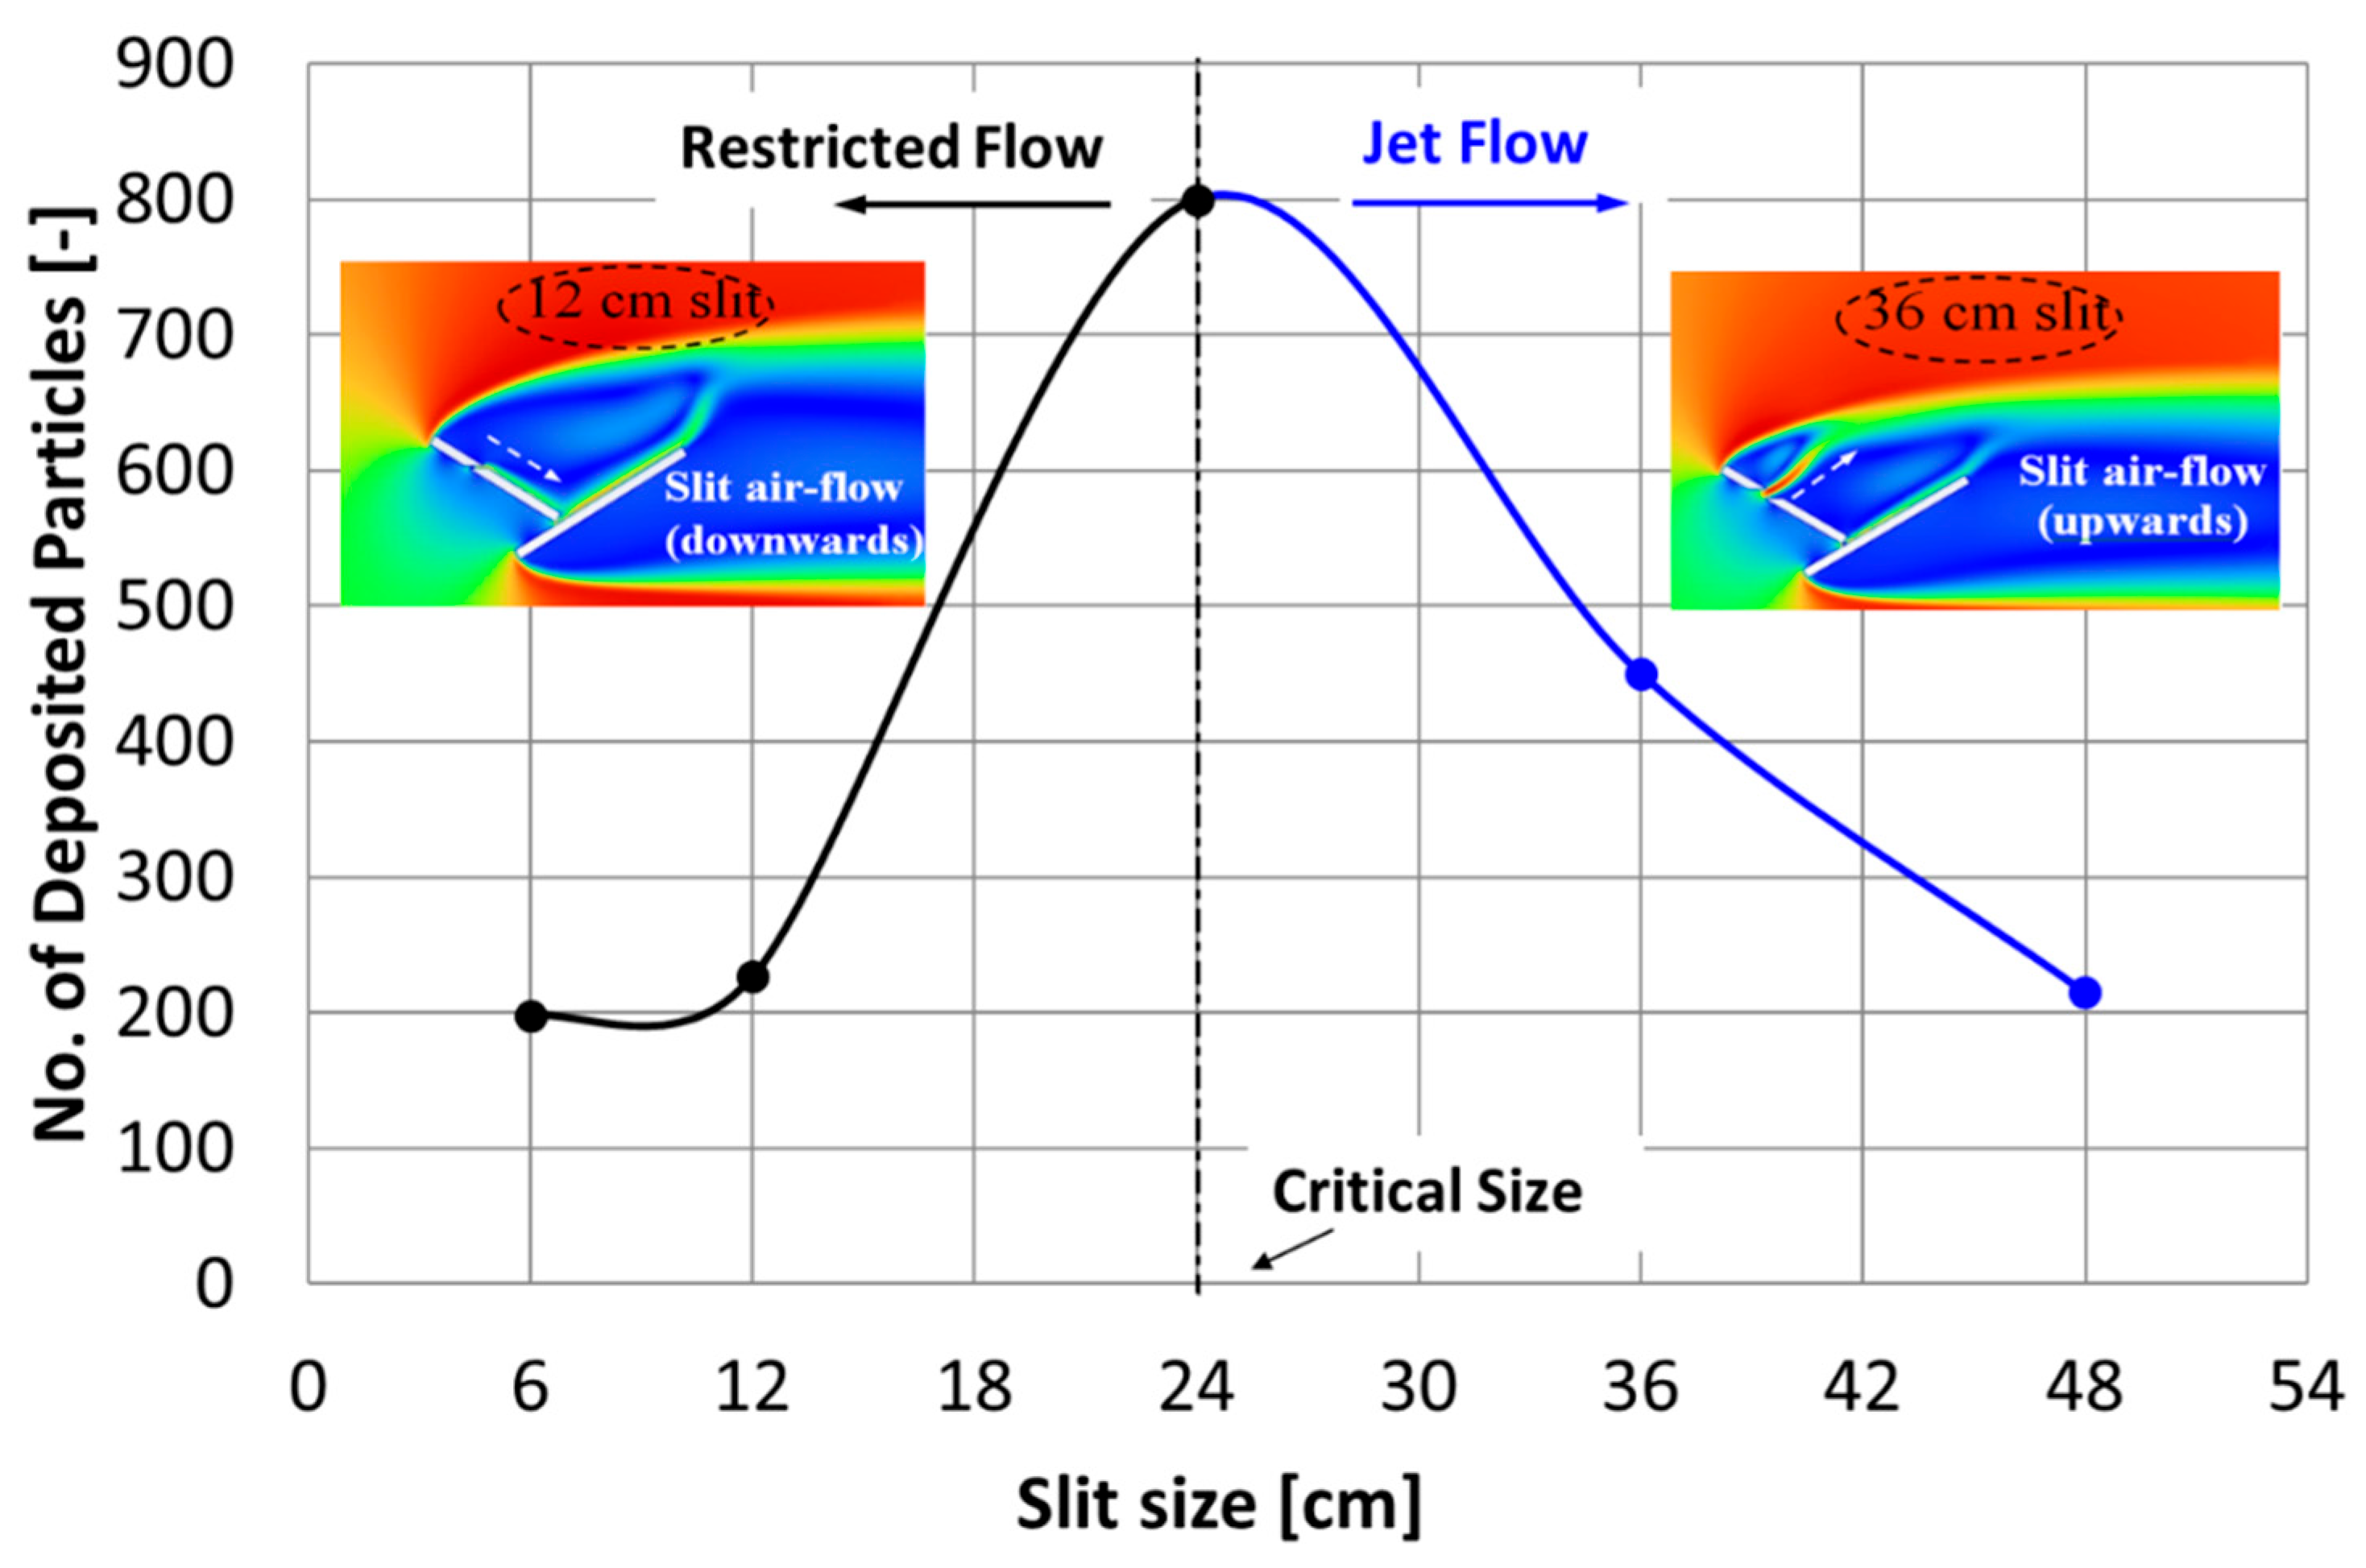
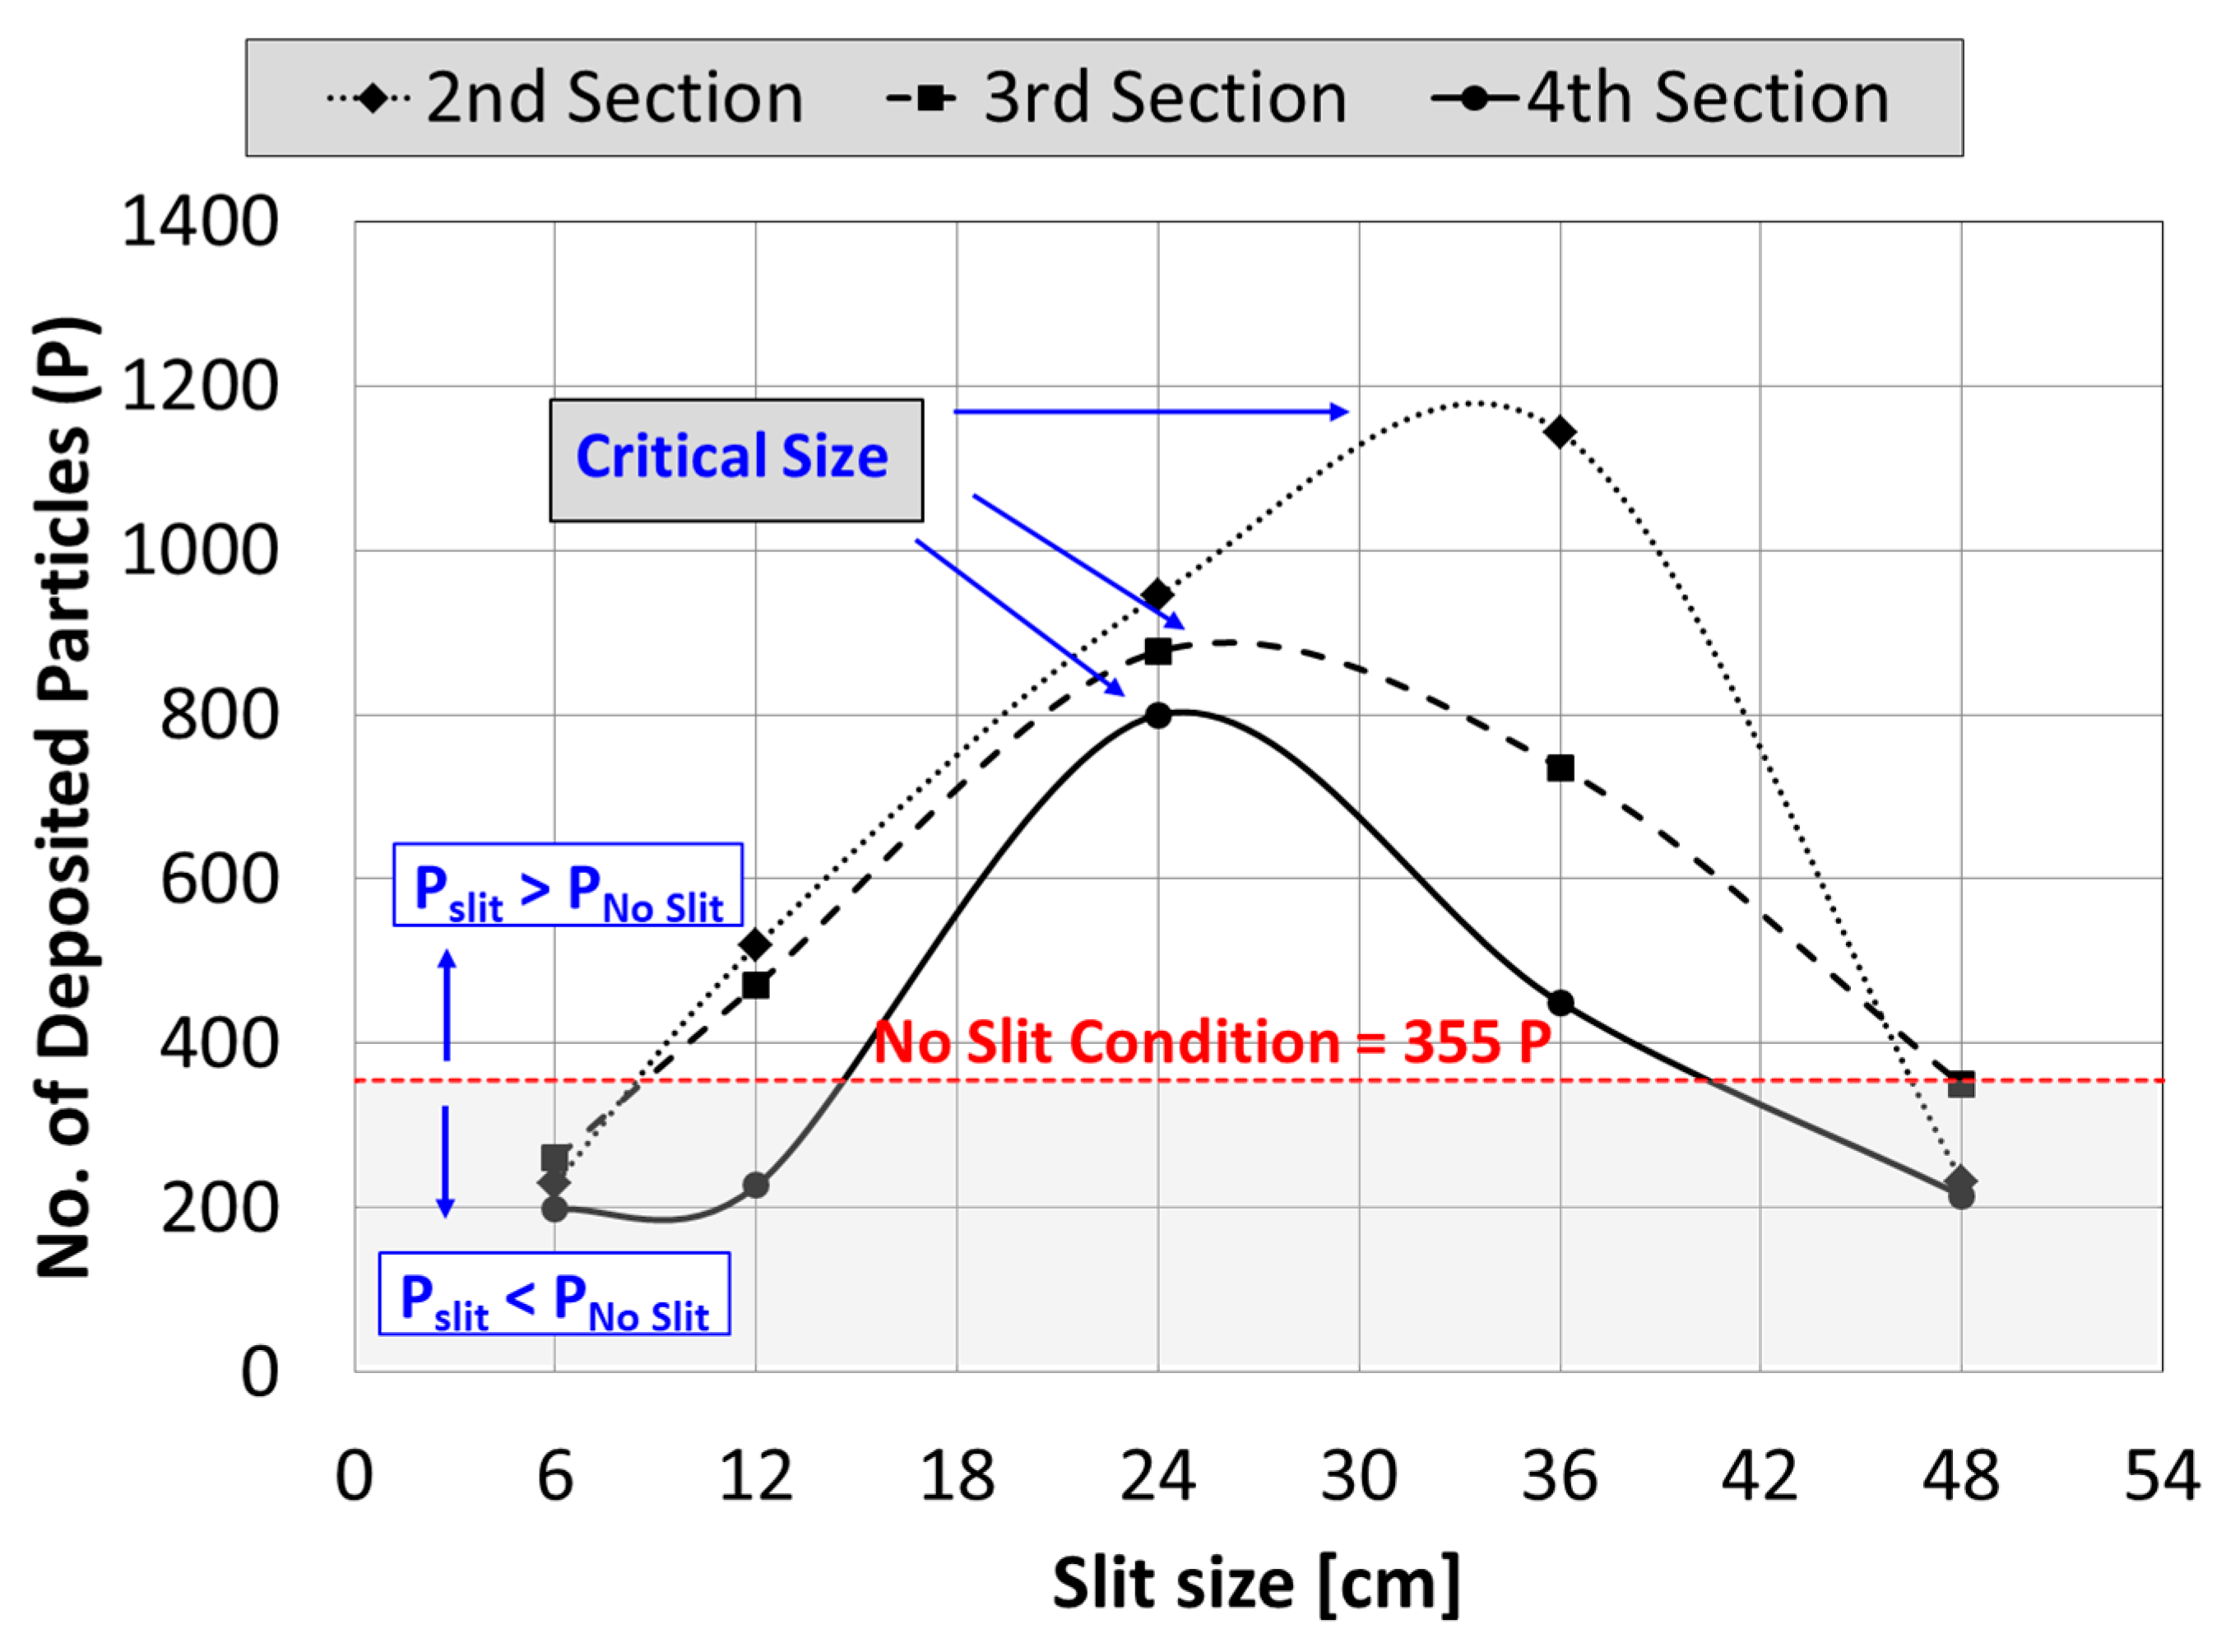
3.1. Influence of Slit Size on Dust Deposition over the PV Panel

The dust shield has been divided into five sections, as shown in Figure 5, and a slit was tested in each of the second, third, and fourth sections. The slit size varied from a minimum of 6 cm to a maximum of 12 cm, 24 cm, 36 cm, or 48 cm in order to determine the optimum size of the slit, which minimizes dust accumulation over the PV panel. The effect of varying the slit size at the fourth section of the dust shield is presented in this section of the paper. The influence of the slit size on the airflow over the PV panel is shown in Figure 6. The main stream velocity is 4 m/s.
The main stream airflow is diverted by the dust shield, as can be seen in Figure 6, and it moves away from the PV panel. This diverted flow is assisted by the air escaping from the slit in case the slit size is 48 cm and 36 cm, such that the two streams merge and move away from the PV panel. The airflow coming out of the slit results in preventing the airflow coming out of the nozzle from returning back to the panel, consequently reducing the accumulation of dust over the panel. This inertial flow coming out of the slit tends to move upwards in the direction of the diverted airflow due to the difference in pressures. The number of dust particles that have deposited over the panel’s surface is 215 particles for the slit size of 48 cm, which is smaller lower than that for the standard case, i.e., a dust shield without a slit. This indicates the positive influence of the slit size on the deposition of dust on the panel’s surface. However, decreasing the slit size to 36 cm increased the number of particles deposited on the panel’s surface to 450 particles. Decreasing the slit size increases the slit air velocity but decreases its pressure, consequently decreasing the pressure difference between the slit airflow and the diverted airflow, which leads to less airflow upwards, i.e., towards the diverted flow.
Decreasing the slit size too much leads to a restricted flow, such that the pressure of the air at the exit from the slit decreases, and the flow moves downwards and becomes intact to the dust shield surface. Consequently, increases the dust deposition over the surface of the PV panel. Reducing the slit size from 36 cm to 24 cm changed the slit airflow from upwards to downwards, as illustrated in Figure 6c, which resulted in increasing the number of deposited particles on the panel’s surface from 450 particles to 1045 dust particles. The transition of the slit airflow from upwards to downwards is due to the large pressure drop across the slit, which changes the flow from a jet flow to a restricted flow intact to the dust shield. The transition of the slit airflow from upwards to downwards has a huge impact on the accumulation of dust on the panel’s surface. It can be concluded that there is a critical slit size at which the slit flow changes from a jet flow to a restricted flow intact to the wall of the slit, which is attributed to the Coanda effect, which is defined as the tendency of a fluid to attach to and flow around solid surfaces [39]. A further decrease in the slit size decreased the number of deposited dust particles on the panel’s surface, as indicated in Figure 6d,e, and that is due to the decrease in the slit airflow rate, which reduces the number of particles that can reach the panel.
The influence of the slit size on the deposition of particles over the PV panel is depicted in Figure 7. The slit is installed in the fourth section of the dust shield, as illustrated in Figure 5. It is clear from Figure 7 that there is a critical slit size, such that above or below that size, the number of deposited particles decreases. This critical slit size is due to the transition from a restricted flow to a jet flow. A small slit size results in a restricted flow because of the Coanda effect, and increasing the slit size in this flow regime increases the airflow rate and the number of particles reaching the panel’s surface. Consequently, the number of deposited particles increases. However, the transition to a jet flow diverts the dust particles away from the panel, consequently reducing the number of deposited particles over the panel. Therefore, increasing the jet air flow rate by increasing the slit size above the critical size decreases the deposited particles.

3.2. Influence of the Slit Position on Dust Deposition over the PV Panel

The influence of the slit position on dust accumulation over the panel’s surface is presented in Figure 8. The slit size was kept constant at 36 cm, and its position varied between the second, the third, and the fourth section. The number of deposited particles on the PV panel in the case that the slit was at the second position was 1144 particles. Shifting the slit to the third section and the fourth section decreased the deposition to 736 particles and 450 particles, as indicated in Figure 8. It can be concluded that moving the slit closer to the PV panel leads to a higher dust accumulation. This is likely due to the closer proximity of the dust-laden airflow to the panel’s surface, which increases the dust deposition on the panel’s surface. Positioning the slit too close to the PV panel allows more dust-laden air to reach the panel’s surface, leading to increased deposition. Conversely, placing the slit far away, as in the fourth region, significantly reduces dust accumulation. Thus, careful consideration of slit placement is essential for enhancing the dust shield’s effectiveness. The influence of the slit size and position on the dust accumulation over the panel’s surface is presented in Figure 9. It can be concluded from Figure 9 that there is a critical slit size, such that above or below that size, the accumulation of dust decreases, and that critical size depends on the distance between the slit and the panel surface. The critical slit size is 24 cm in case the slit is installed in the third or the fourth region, and it is ~36 cm if the slit is installed in the second region. This analysis highlights the critical impact of slit size and position on dust mitigation, indicating that optimized configurations can significantly enhance PV panel performance. It can be concluded, based on Figure 9, that the slit should be as far as possible from the panel’s surface, and its size should be far away from the critical size. The number of dust particles that deposited on the panel’s surface in the case of no slit is about 355 particles. Therefore, the acceptable slit size is the size which decreases the deposited particles below 355 particles, i.e., the no slit condition, which is the slit size that corresponds to the shaded area under the horizontal dashed line in Figure 9.

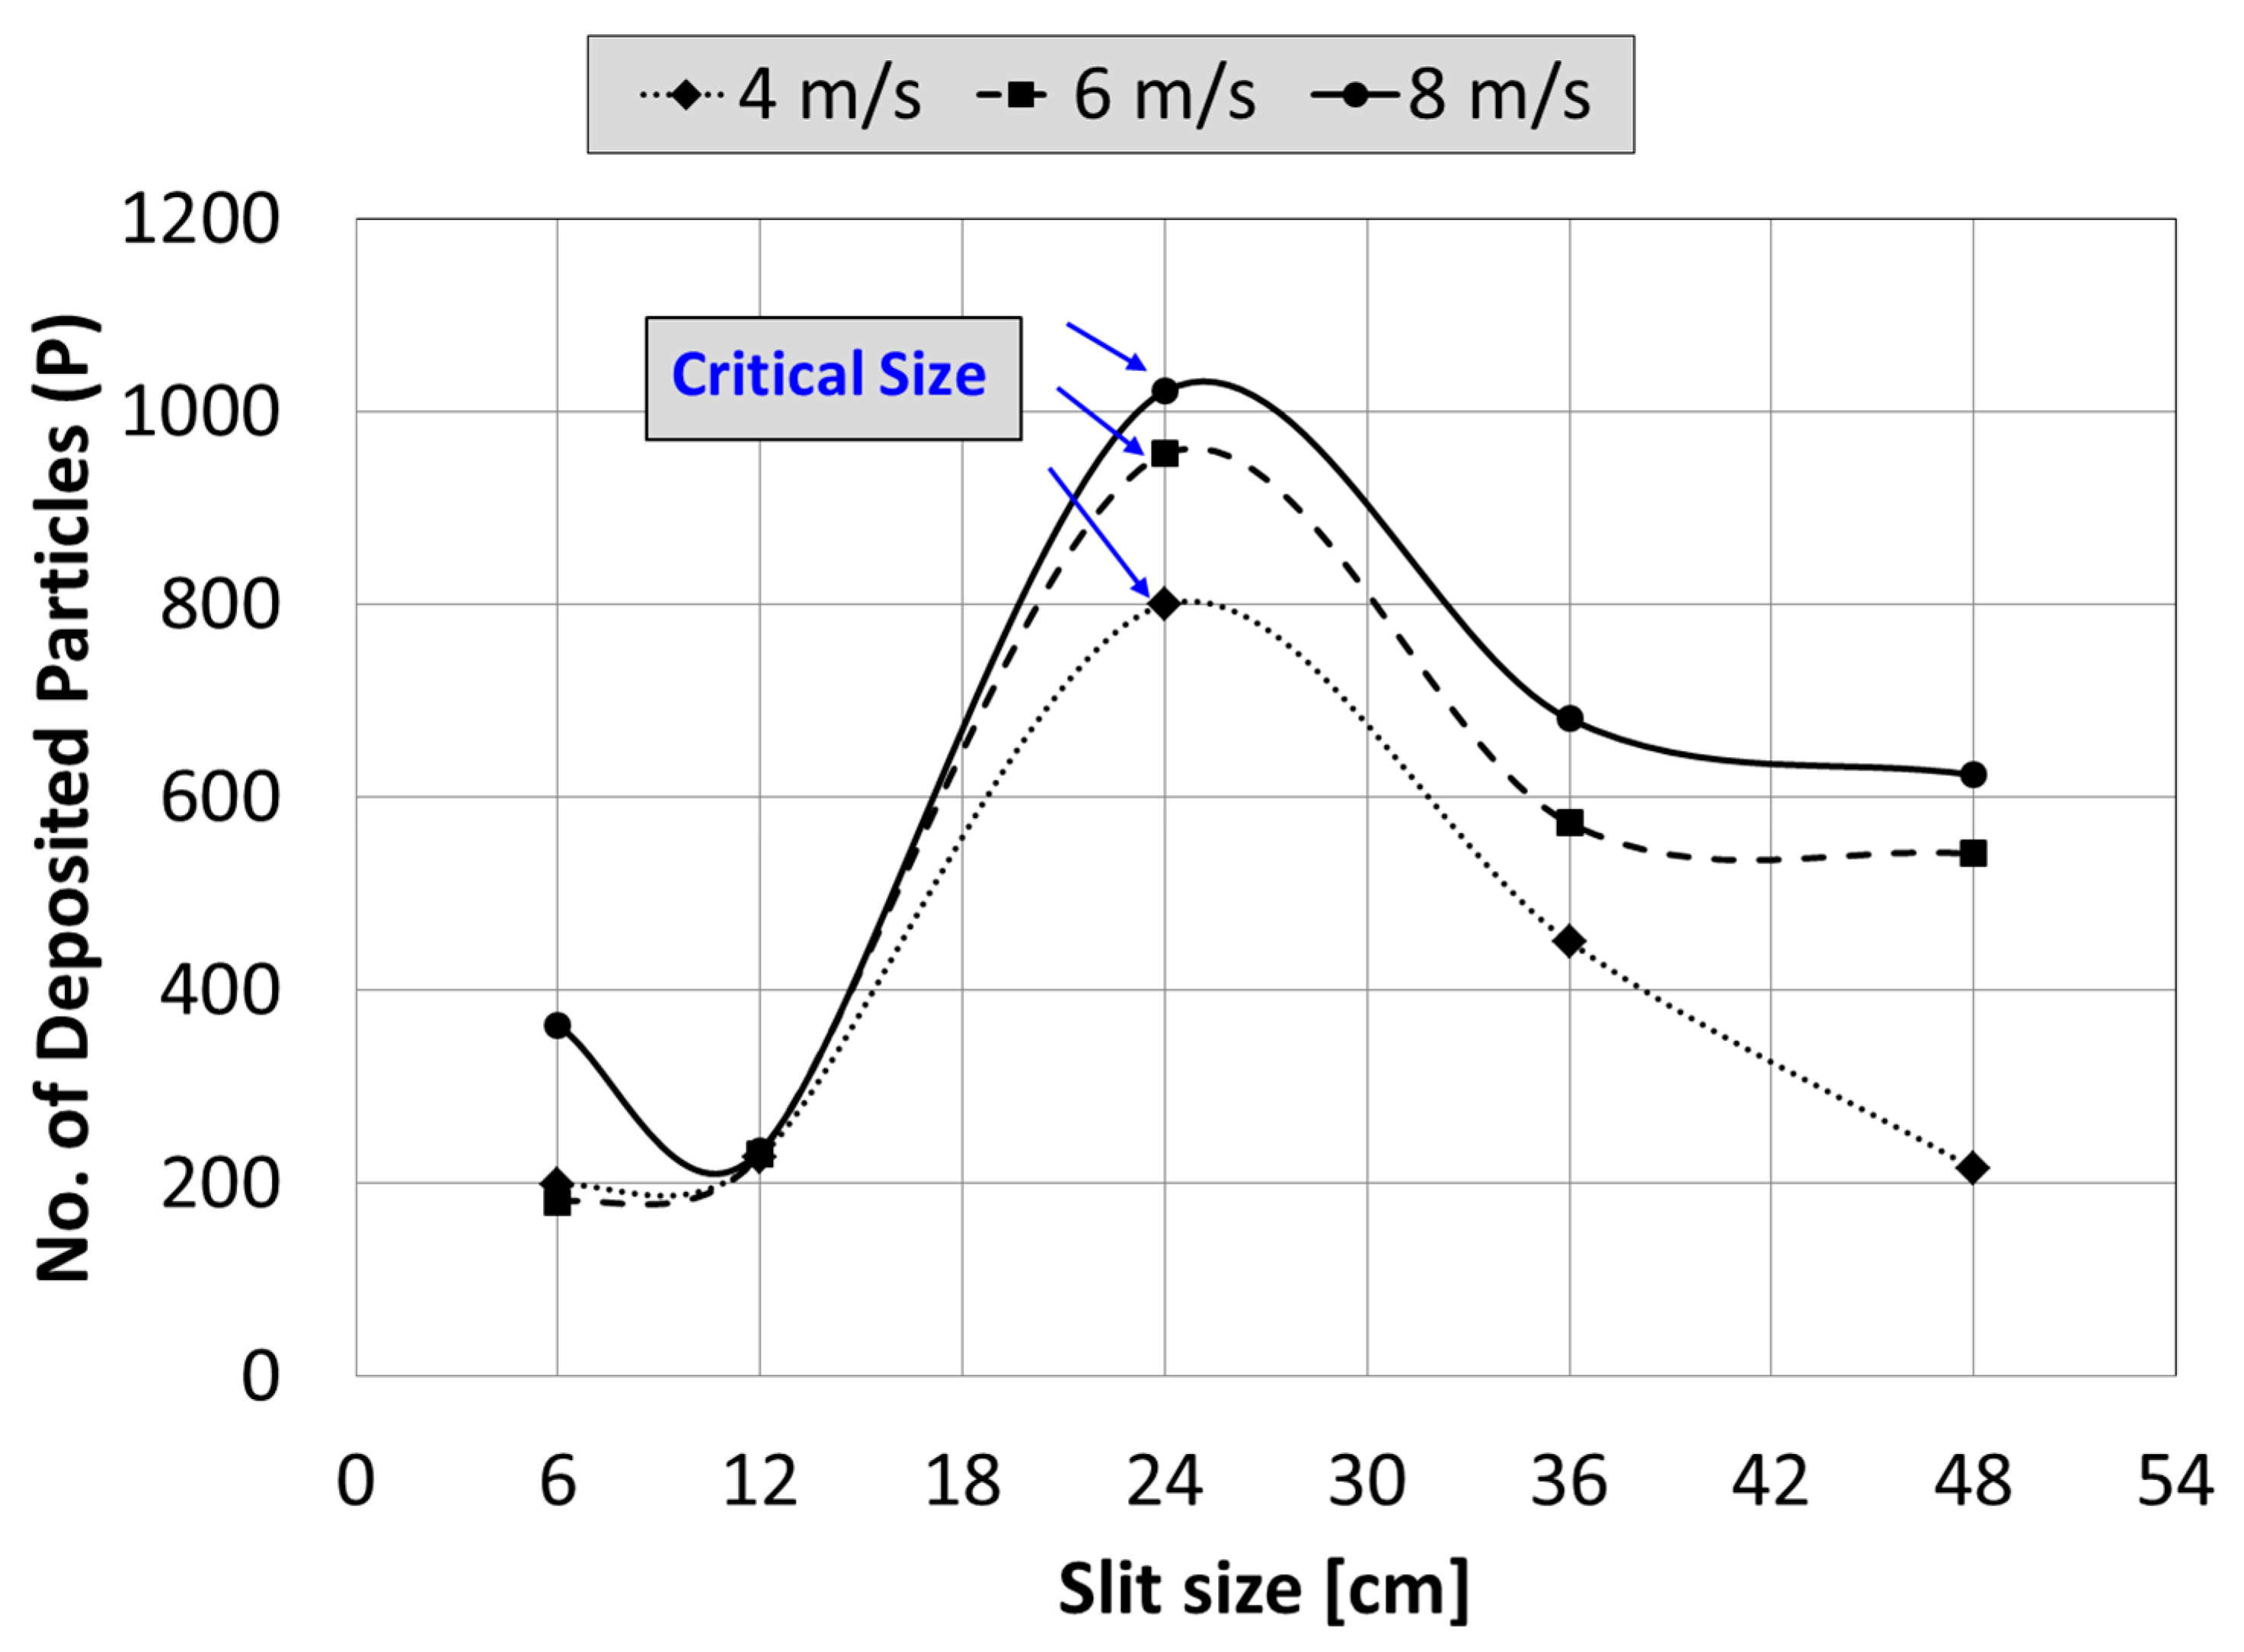
3.3. Influence of the Main Stream Velocity on Dust Deposition over the PV Panel’s Surface

The influence of the main stream velocity on the deposition of particles over the panel’s surface as a function of the slit size is presented in Figure 10. The slit is installed in the fourth region of the dust shield. It can be seen that the critical slit size, i.e., the size at which below or above it the dust deposition decreases, is independent of the flow speed. In addition, it can be concluded from Figure 10 that as the main stream air speed increases, the dust deposition increases. The pressure drop across the slit in the dust shield is proportional to the air speed; consequently, increasing the air speed decreases the pressure after the slit, which results in increasing the pressure acting on the dust particles and results in more settling of particles on the panel’s surface. The pressure after the dust shield as a function of the main stream velocity is presented in Figure 11, and that is in the case of a slit of size smaller and larger than the critical size. It can be concluded that the pressure difference, i.e., the difference between the pressure of the air before the slit and the pressure of the air leaving the slit, increases with the increasing main stream velocity, which results in more dust deposition.

4. Conclusions

Installing a dust shield in front of the PV panel decreases the accumulation of dust over the panel, and the performance is improved by employing an air nozzle between the dust shield and the panel. The airflow coming out of the air nozzle sweeps the panel’s surface and then reverses its direction as it approaches the end of the panel. Consequently, this reversal in the direction of the nozzle airflow increases the dust deposition over the PV panel. Therefore, cutting an air slit in the dust shield, which allows a jet of air to come out of the slit and prevent the airflow from returning back to the panel, can decrease the dust deposition over the panel. The objective of this research was to determine the numerical influence of the air-slit size and position on the dust deposition over the PV panel’s surface. It has been found that
  • There is a critical slit size, such that below or above that critical size, the number of deposited particles decreases compared to that at the critical size.
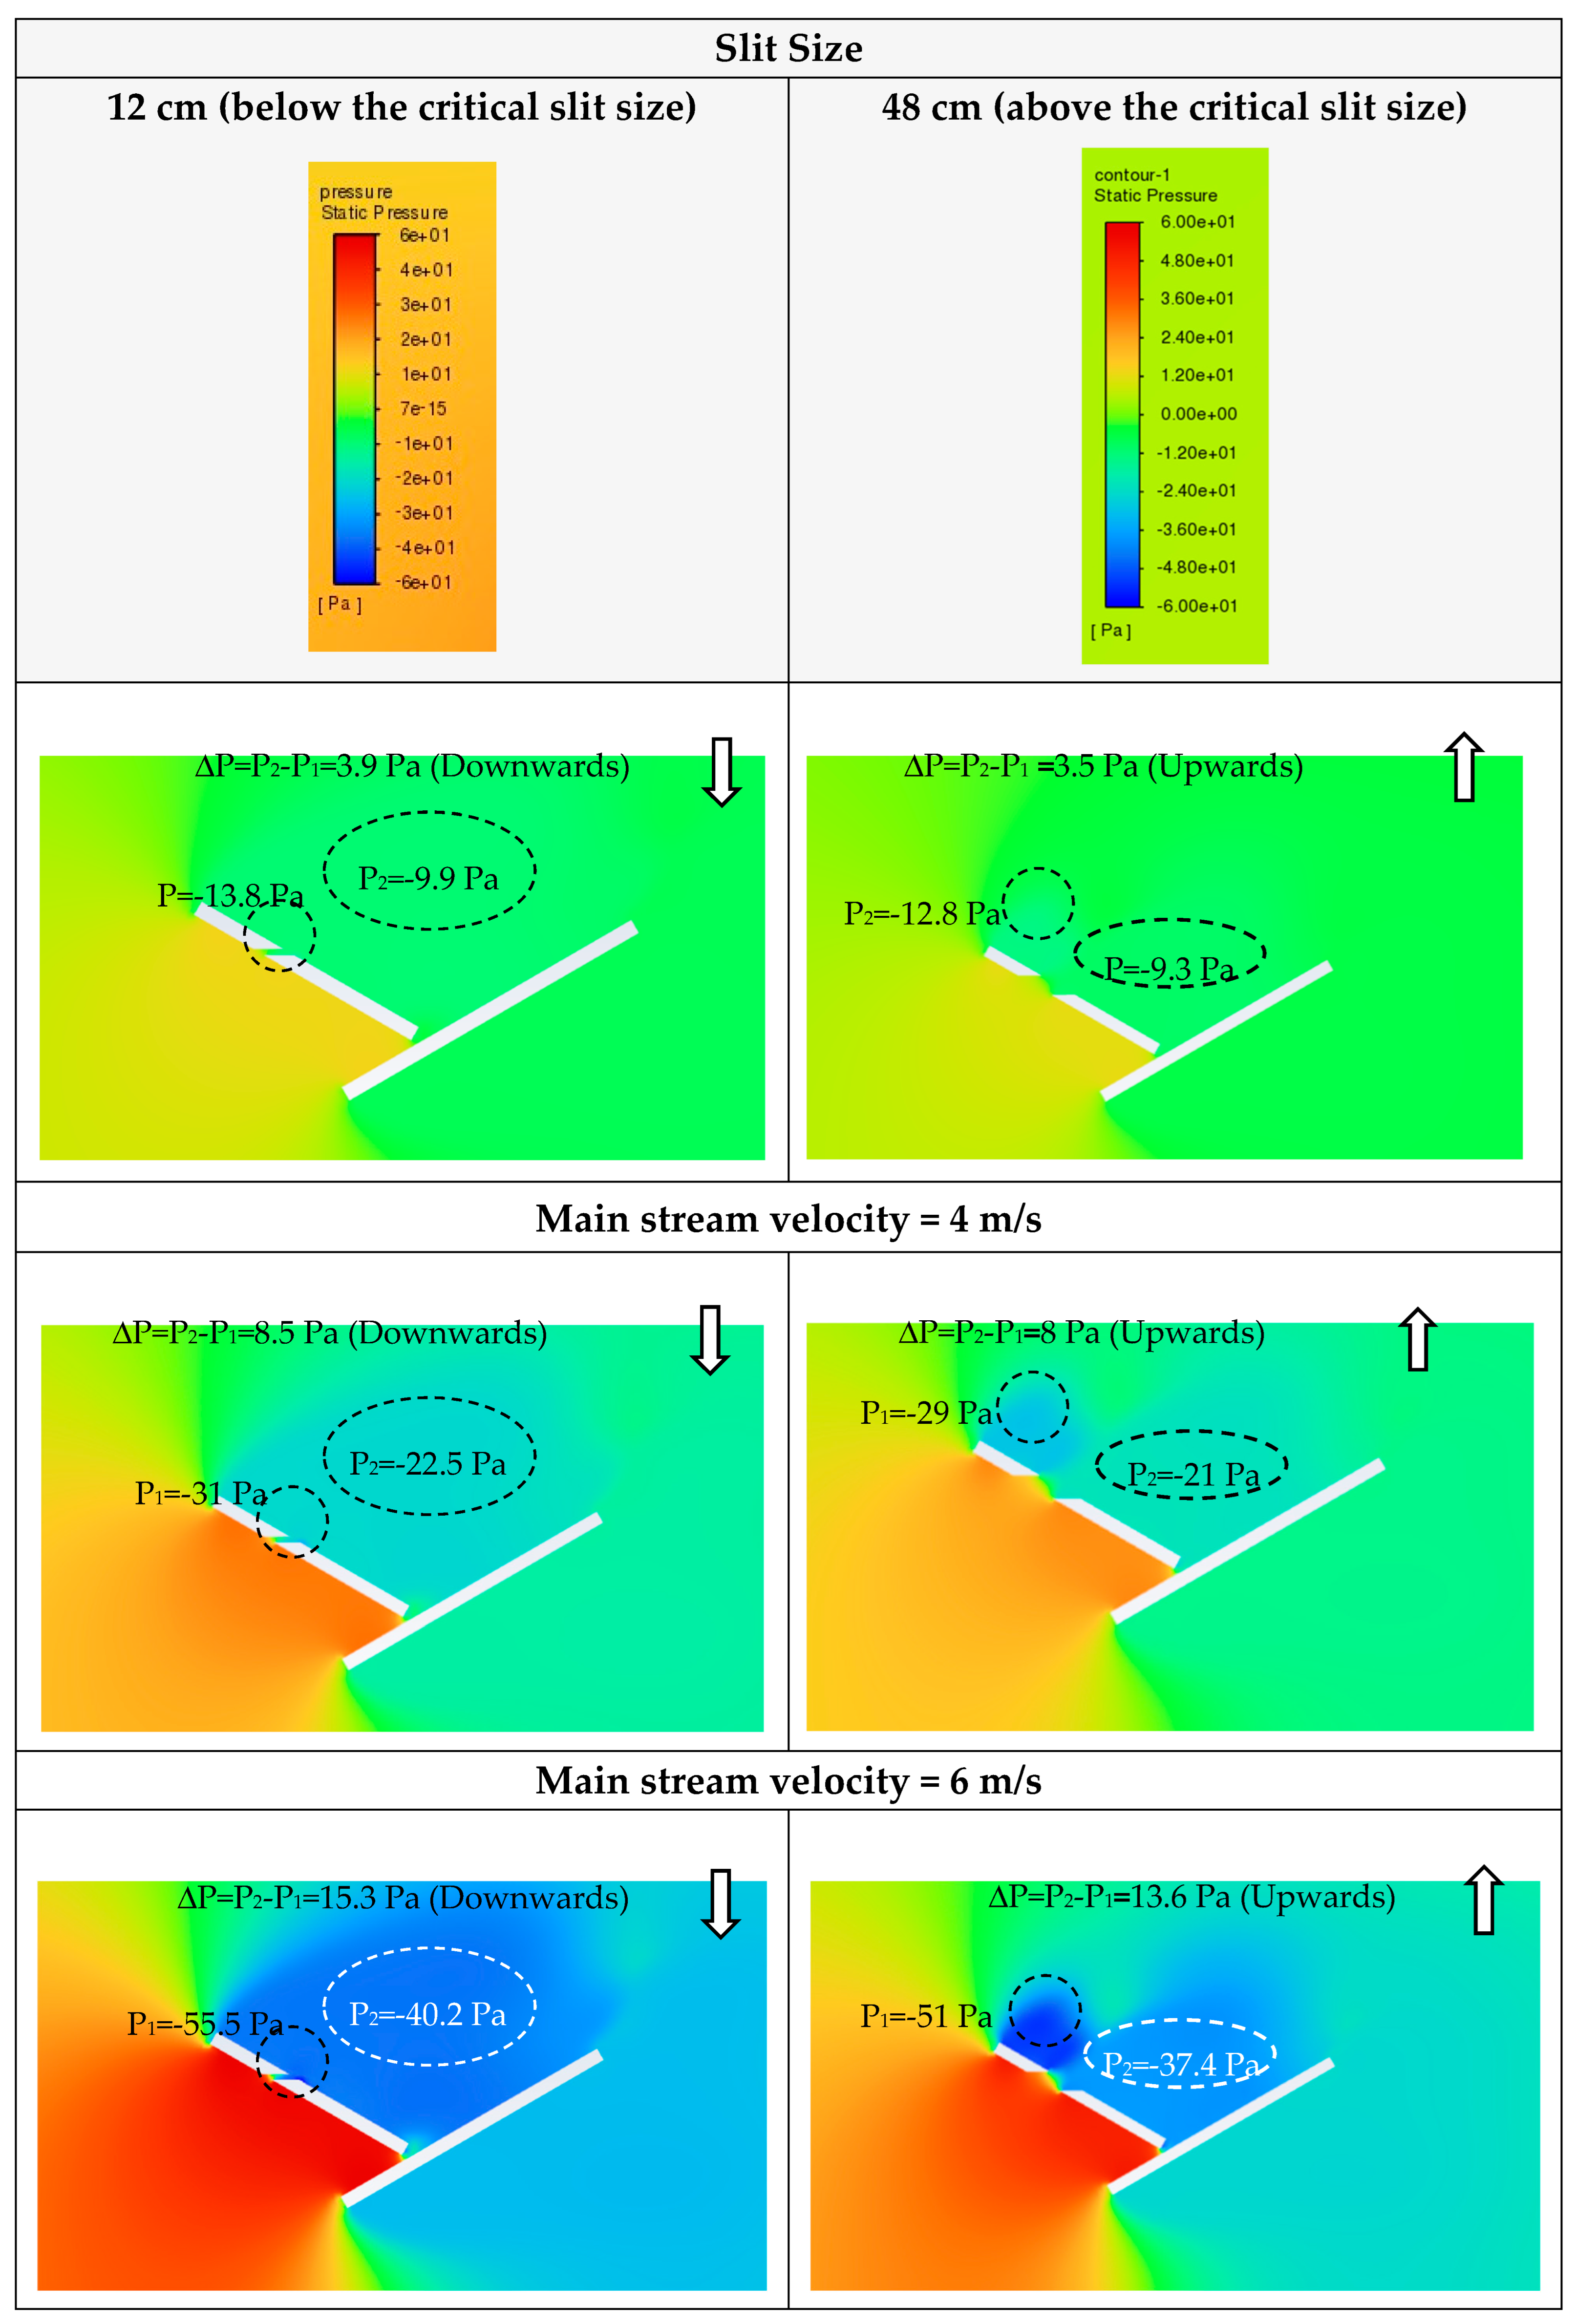
  • The critical slit size is due to the transition of the airflow from a restricted flow that is intact to the panel’s surface due to the Coanda effect to a free jet flow, which is diverted away from the panel’s surface.
  • Positioning the slit too close to the PV panel allows more dust-laden air to reach the panel’s surface, leading to increased dust deposition; conversely, placing the slit far away from the panel reduces dust accumulation.

Author Contributions

Conceptualization, M.S.A.-E.; Methodology, A.M.G.; Validation, A.M.G.; Formal analysis, M.S.A.-E. and H.A.K.; Investigation, A.M.G.; Data curation, A.M.G.; Writing—original draft, M.S.A.-E.; Writing—review & editing, H.A.K.; Visualization, A.M.G.; Supervision, M.S.A.-E. All authors have read and agreed to the published version of the manuscript.

Funding

This research received no external funding.

Data Availability Statement

The original contributions presented in this study are included in the article. Further inquiries can be directed to the corresponding author.

Conflicts of Interest

The authors declare no conflict of interest.

References

  1. Tawalbeh, M.; Al-Othman, A.; Kafiah, F.; Abdelsalam, E.; Almomani, F.; Alkasrawi, M. Environmental impacts of solar photovoltaic systems: A critical review of recent progress and future outlook. Sci. Total Environ. 2021, 759, 143528. [Google Scholar] [CrossRef]
  2. Abbasi, K.R.; Shahbaz, M.; Zhang, J.; Irfan, M.; Alvarado, R. Analyze the environmental sustainability factors of China: The role of fossil fuel energy and renewable energy. Renew. Energy 2022, 187, 390–402. [Google Scholar] [CrossRef]
  3. Cevik, E.I.; Yıldırım, D.Ç.; Dibooglu, S. Renewable and non-renewable energy consumption and economic growth in the US: A Markov-Switching VAR analysis. Energy Environ. 2021, 32, 519–541. [Google Scholar] [CrossRef]
  4. Bloomberg. US Crosses the Electric-Car Tipping Point for Mass Adoption. 2022. Available online: https://www.bloomberg.com/news/articles/2022-07-09/us-electric-car-sales-reach-key-milestone (accessed on 1 April 2025).
  5. Saligkaras, D.; Papageorgiou, V.E. On the detection of patterns in electricity prices across European countries: An unsupervised machine learning approach. AIMS Energy 2022, 10, 1146–1164. [Google Scholar] [CrossRef]
  6. Cavana, G.; Becchio, C.; Bottero, M. Feasibility and evolution studies on renewable energy communities in cities. Renew. Sustain. Energy Rev. 2025, 213, 115477. [Google Scholar] [CrossRef]
  7. Creutzig, F.; Hilaire, J.; Nemet, G.; Müller-Hansen, F.; Minx, J.C. Technological innovation enables low cost climate change mitigation. Energy Res. Soc. Sci. 2023, 105, 103276. [Google Scholar] [CrossRef]
  8. Mdallal, A.; Yasin, A.; Mahmoud, M.; Abdelkareem, M.A.; Alami, A.H.; Olabi, A.G. A comprehensive review on solar photovoltaics: Navigating generational shifts, innovations, and sustainability. Sustain. Horiz. 2025, 13, 100137. [Google Scholar] [CrossRef]
  9. Shenouda, R.; Abd-Elhady, M.S.; Kandil, H.A. A review of dust accumulation on PV panels in the MENA and the Far East regions. J. Eng. Appl. Sci. 2022, 69, 8. [Google Scholar] [CrossRef]
  10. Abd-Elhady, M.S.; Fazila, A.R.A.; Kandil, H.A.; Khalil, T.; Dahlhaus, D. Modeling the Solar Cells Temperature and Power Output From Photovoltaic Panels Under Dusty Conditions. J. Sol. Energy Eng. 2025, 147, 011008. [Google Scholar] [CrossRef]
  11. Shenouda, R.; Abd-Elhady, M.S.; Kandil, H.A. Influence of seasonal effect on dust accumulation on Photovoltaic panels that operate light posts. Energy Rep. 2022, 8, 1275–1284. [Google Scholar] [CrossRef]
  12. Tanaka, T.Y.; Chiba, M. A numerical study of the contributions of dust source regions to the global dust budget. Glob. Planet. Change 2006, 52, 88–104. [Google Scholar] [CrossRef]
  13. Rashid, M.; Yousif, M.; Rashid, Z.; Muhammad, A.; Altaf, M.; Mustafa, A. Effect of Dust Accumulation on the Performance of Photovoltaic Modules for Different Climate Regions. Heliyon 2023, 9, e23069. [Google Scholar] [CrossRef] [PubMed]
  14. Rusănescu, C.O.; Rusănescu, M.; Istrate, I.A.; Constantin, G.A.; Begea, M. The effect of dust deposition on the performance of photovoltaic panels. Energies 2023, 16, 6794. [Google Scholar] [CrossRef]
  15. Ghazi, S.; Sayigh, A.; Ip, K. Dust effect on flat surfaces—A review paper. Renew. Sustain. Energy Rev. 2014, 33, 742–751. [Google Scholar] [CrossRef]
  16. Adinoyi, M.J.; Said, S.A. Effect of dust accumulation on the power outputs of solar photovoltaic modules. Renew. Energy 2013, 60, 633–636. [Google Scholar] [CrossRef]
  17. Said, S.A.M.; Al-Aqeeli, N.; Walwil, H.M. The potential of using textured and anti-reflective coated glasses in minimizing dust fouling. Sol. Energy 2015, 113, 295–302. [Google Scholar] [CrossRef]
  18. Asl-Soleimani, E.; Farhangi, S.; Zabihi, M.S. The effect of tilt angle, air pollution on performance of photovoltaic systems in Tehran. Renew. Energy 2001, 24, 459–468. [Google Scholar] [CrossRef]
  19. Menoufi, K.; Farghal, H.F.; Farghali, A.A.; Khedr, M.H. Dust accumulation on photovoltaic panels: A case study at the East Bank of the Nile (Beni-Suef, Egypt). Energy Procedia 2017, 128, 24–31. [Google Scholar] [CrossRef]
  20. Elminir, H.K.; Ghitas, A.E.; Hamid, R.H.; El-Hussainy, F.; Beheary, M.M.; Abdel-Moneim, K.M. Effect of dust on the transparent cover of solar collectors. Energy Convers. Manag. 2006, 47, 3192–3203. [Google Scholar] [CrossRef]
  21. Moharram, K.A.; Abd-Elhady, S.M.; Kandil, H.A.; El-Sherif, H. Influence of cleaning using water and surfactants on the performance of photovoltaic panels. Energy Convers. Manag. 2013, 68, 266–272. [Google Scholar] [CrossRef]
  22. Kawamoto, H.; Shibata, T. Electrostatic cleaning system for removal of sand from solar panels. J. Electrost. 2015, 73, 65–70. [Google Scholar] [CrossRef]
  23. Al-Badra, M.Z.; Abd-Elhady, M.S.; Kandil, H.A. A novel technique for cleaning PV panels using antistatic coating with a mechanical vibrator. Energy Rep. 2020, 6, 1633–1637. [Google Scholar] [CrossRef]
  24. Abd-Elhady, M.S.; Rana, A.; Elsebaaie, M.A.; Kandil, H.A. A new cleaning method for solar panels inspired from the natural vibrations of tree branches and leaves. Sci. Rep. 2024, 14, 18138. [Google Scholar] [CrossRef] [PubMed]
  25. Chiteka, K.; Arora, R.; Sridhara, S.N.; Enweremadu, C.C. Optimizing wind barrier and photovoltaic array configuration in soiling mitigation. Renew. Energy 2021, 163, 225–236. [Google Scholar] [CrossRef]
  26. Raillani, B.; Chaatouf, D.; Salhi, M.; Amraqui, S.; Mezrhab, A. Effect of wind barrier height on the dust deposition rate of a ground-mounted photovoltaic panel. Sustain. Energy Technol. Assess. 2022, 52, 102035. [Google Scholar] [CrossRef]
  27. Raillani, B.; Chaatouf, D.; Salhi, M.; Bria, A.; Amraqui, S.; Mezrhab, A. The effectiveness of the wind barrier in mitigating soiling of a ground-mounted photovoltaic panel at different angles and particle injection heights. Results Eng. 2022, 16, 100774. [Google Scholar] [CrossRef]
  28. Raillani, B.; Salhi, M.; Chaatouf, D.; Amraqui, S.; Mezrhab, A. Optimization of a porous wind barrier to reduce soiling and avoid shading losses of photovoltaic panels. Renew. Energy 2022, 189, 510–523. [Google Scholar] [CrossRef]
  29. Eisa, K.; Shenouda, R.; Abd-Elhady, M.S.; Kandil, H.A.; Khalil, T. Mitigation of dust on PV panels that operate light posts using a wind shield, mechanical vibrations and AN antistatic coating. Ain Shams Eng. J. 2023, 14, 101993. [Google Scholar] [CrossRef]
  30. Shenouda, R.; Abd-Elhady, M.S.; Kandil, H.A.; Dagher, M. Numerical investigation of the effect of dust shields on accumulation of dust over PV panels. Environ. Sci. Pollut. Res. 2023, 30, 62905–62923. [Google Scholar] [CrossRef]
  31. Duronio, F.; Lien, H.P.; De Vita, A. CFD unified approach under Eulerian–Lagrangian framework for methanol and gasoline direct injection sprays in evaporative and flash boiling conditions. Int. J. Multiph. Flow 2025, 182, 105048. [Google Scholar] [CrossRef]
  32. Lu, H.; Zhao, W. CFD Prediction of Dust Pollution and Impact on an Isolated Ground-mounted Solar Photovoltaic System. Renew. Energy 2019, 131, 829–840. [Google Scholar] [CrossRef]
  33. Tominaga, Y.; Akabayashi, S.I.; Kitahara, T.; Arinami, Y. Air flow around isolated gable-roof buildings with different roof pitches: Wind tunnel experiments and CFD simulations. Build. Environ. 2015, 84, 204–213. [Google Scholar] [CrossRef]
  34. Karava, P.; Jubayer, C.M.; Savory, E. Numerical modelling of forced convective heat transfer from the inclined windward roof of an isolated low-rise building with application to photovoltaic/thermal systems. Appl. Therm. Eng. 2011, 31, 1950–1963. [Google Scholar] [CrossRef]
  35. IEM :: Site Wind Roses (iastate.edu). Available online: https://mesonet.agron.iastate.edu/sites/windrose.phtml?station=NUI&network=MD_ASOS (accessed on 1 April 2025).
  36. Chiteka, K.; Arora, R.; Jain, V. CFD Prediction of dust deposition and installation parametric optimisation for soiling mitigation in non-tracking solar PV modules. Int. J. Ambient Energy 2021, 42, 1307–1320. [Google Scholar] [CrossRef]
  37. Abd-Elhady, M.S.; Rindt, C.C.M.; Wijers, J.G.; van Steenhoven, A.A. Particulate fouling in waste incinerators as influenced by the critical sticking velocity and layer porosity. Energy 2005, 30, 1469–1479. [Google Scholar] [CrossRef]
  38. Abiola-Ogedengbe, A.; Hangan, H.; Siddiqui, K. Experimental investigation of wind effects on a standalone photovoltaic (PV) module. Renew. Energy 2015, 78, 657–665. [Google Scholar] [CrossRef]
  39. Ahmed, N.A. Coanda Effect: Flow Phenomenon and Applications; CRC Press Taylor & Francis Group: Abingdon, UK, 2020; ISBN 978-1-138-33915-6. [Google Scholar]
Figure 1. A schematic diagram of the PV panel and the dust shield with respect to the computational domain. The Length, L, of the PV panel is equal to the length of the dust shield and is set to 2.5 m.
Fluids 10 00153 g001
Figure 2. The pressure coefficient, Cp, at the upper and lower surfaces of the PV panel, as calculated based on the developed numerical model and as measured experimentally by Abiola-Ogedengbe et al. [38].
Fluids 10 00153 g002
Figure 3. Dimensions of the dust shield, PV panel, extension plate and the air nozzle have been developed by Shenouda et al. [30].
Fluids 10 00153 g003
Figure 4. Velocity (a) contours and (b) vectors around the PV panel and the dust shield. The main stream velocity is 4 m/s.
Fluids 10 00153 g004
Figure 5. The five sections of the dust shield in which a slit has been implemented.
Fluids 10 00153 g005
Figure 6. Influence of slit size on the airflow (left) and the pressure distribution (right) over the PV Panel. The slit is at the 4th section of the dust shield and it varied from (a) 48 cm, (b) 36 cm, (c) 24 cm, (d) 12 cm, and (e) 6 cm. The main stream velocity is 4 m/s.
Fluids 10 00153 g006aFluids 10 00153 g006b
Figure 7. Influence of the slit size on the number of deposited particles over the PV panel. The slit is installed at the 4th section of the dust shield as indicated in Figure 5.
Fluids 10 00153 g007
Figure 8. Influence of slit position on the airflow over the PV panel. The slit size is 36 cm and it is installed at (a) 2nd section, (b) 3rd section, and (c) 4th section.
Fluids 10 00153 g008
Figure 9. Influence of the slit size and position on the dust accumulation over the panel’s surface.
Fluids 10 00153 g009
Figure 10. Influence of the main stream velocity on the deposition of particles over the PV panel surface as a function of the slit size. The slit is installed in the 4th region.
Fluids 10 00153 g010
Figure 11. The pressure distribution as a function of the gas speed in case of a slit installed in the 4th region of size 12 cm (left) and 48 cm (right).
Fluids 10 00153 g011aFluids 10 00153 g011b
Disclaimer/Publisher’s Note: The statements, opinions and data contained in all publications are solely those of the individual author(s) and contributor(s) and not of MDPI and/or the editor(s). MDPI and/or the editor(s) disclaim responsibility for any injury to people or property resulting from any ideas, methods, instructions or products referred to in the content.

