Article

Influence of Gurney Flap and Leading-Edge/Trailing-Edge Flaps on the Stall Characteristics and Aeroacoustic Performance of Airfoils

School of Energy and Power Engineering, University of Shanghai for Science and Technology, Shanghai 200093, China
*
Author to whom correspondence should be addressed.
Fluids 2025, 10(6), 152; https://doi.org/10.3390/fluids10060152
Submission received: 10 May 2025 / Revised: 3 June 2025 / Accepted: 6 June 2025 / Published: 9 June 2025
(This article belongs to the Section Mathematical and Computational Fluid Mechanics)

Abstract

In aerospace, flow control techniques have improved the separation flow characteristics around airfoils by various means. In this paper, the delayed detached eddy simulation (DDES) technique is used to simulate the detailed flow field around the NACA0021 airfoil with two different flow control methods (Gurney flaps and leading- and trailing-edge flaps) applied at an angle of attack of 20°. The aerodynamic characteristics around the airfoil under these two flow control methods are investigated, and the results show that both flow control methods lead to a significant increase in the pressure on the suction surface of the airfoil, which contributes to an increase in lift. The aeroacoustic characteristics of the original airfoil, the Gurney flapped airfoil and the airfoil with leading-edge and trailing-edge flaps are then analyzed using a combination of DDES and FW-H acoustic analog equations. The results show that the total sound pressure level of the Gurney flap airfoil and the leading-edge and trailing-edge flap airfoil are improved in most azimuthal angles of the acoustic pointing distribution, among which the degree of improvement of the leading-edge and trailing-edge flap airfoil is greater than that of the Gurney flap airfoil near the trailing edge, and the total sound pressure level of the band leading- and trailing-edge flap airfoil decreases in the azimuthal angles near the leading edge. Compared with the original airfoil, the noise value is thus reduced by up to 4.13 dB. The results of pressure pulsation cloud map, sound pressure level cloud map on the airfoil surface and vortex cloud map distribution show that the two flow controls increase the pressure pulsation near the trailing edge, the range and peak value of sound emission on the airfoil surface increase, and the trailing vortex becomes more finely grained, which leads to an increase in noise.

1. Introduction

Airfoil stall is a key aerodynamic phenomenon affecting engineering applications such as aircraft wings, wind turbine blades and unmanned aerial vehicles. Flow separation occurs when the angle of attack exceeds a critical value, leading to a sharp decrease in lift, an increase in drag and the creation of highly unsteady flow structures [1]. More importantly, stall and post-stall conditions generate strong broadband noise, mainly caused by vortex shedding, shear layer instabilities and turbulent interactions [2]. In the aerospace and wind energy industries, the reduction in stall-induced aerodynamic noise is crucial to improve environmental adaptation and operational efficiency [3].
In order to minimize stall effects and improve aerodynamic performance, researchers have developed various flow control techniques [4]. Among them, Gurney flaps (GFs) and leading-edge/trailing-edge flaps (LEFs/TEFs) have shown significant potential in modifying boundary conditions and delaying flow separation [5]. These passive flow control strategies do not require additional energy input and have strong engineering feasibility while improving aerodynamic performance [6]. However, despite the effectiveness of these methods in improving aerodynamic characteristics, their impact on aeroacoustic performance remains a key issue. The improvement in aerodynamic efficiency is often accompanied by an increase in noise, in particular trailing edge noise, turbulence interaction noise and wake instability noise [7].
How to balance the trade-off between stall control and noise generation remains a key challenge in airfoil design. Therefore, an in-depth study of the combined effects of different flow control strategies on aerodynamic efficiency and aeroacoustic characteristics is crucial for optimizing airfoil design and reducing noise generation. In recent years, researchers have conducted a number of studies on the aerodynamic effects of Gurney and leading-/trailing-edge flaps, with particular emphasis on their role in increasing lift and delaying stall. Y. Amini, M. Liravi and E. Izadpanah [8] investigated the effect of Gurney airfoils on the aerodynamic performance of the NACA0012 airfoil under thin airflow conditions, mainly by the direct simulation of the DSMC method. It was found that the Gurney airfoil can enhance the lift performance of the airfoil to a certain extent, especially at specific combinations of angle of attack and airfoil height. Bruce L. Storms et al. [9] conducted wind tunnel experiments to investigate the effects of Gurney flaps and vortex sounders on the aerodynamic performance of the NACA4412 airfoil. Through surface pressure distribution and wake profile measurements, it was found that the Gurney flap could improve the maximum lift coefficient from 1.49 to 1.96, but the drag increased at low lift coefficients. Wang et al. [10] reviewed the research progress of the Gurney flap in improving the aerodynamic performance of subsonic and supercritical airfoils, high-lift devices and delta wings. Through experimental measurements and flow structure analysis, it was found that Gurney flaps enhance lift by changing the pressure distribution on the upper and lower surfaces and delaying flow separation. He et al. [11] used the Reynolds-averaged Navier–Stokes (RANS) equations in combination with the SST k-ω turbulence model to investigate the aerodynamic characteristics of SFYT15 thick airfoils retrofitted with Gurney flaps for high altitude vehicles. In a numerical study, the simulation results showed that the Gurney flap significantly increases the lift coefficient and improves the lift-to-drag ratio in a certain angle of attack range by suppressing the flow separation on the upper surface and generating reverse vortex pairs. Ye et al. [12] investigated the effect of serrated gurney flaps (SFGs) on the aerodynamic performance and noise of NACA0018 wind turbine airfoil by numerical simulation. The results show that SFGs can significantly improve the lift coefficient, delay the stall angle of attack by 3° and reduce the noise by stabilizing the wake vortex structure, breaking the large-scale vortices and suppressing the pressure pulsation. Xuemin Ye et al. [13] investigated the aerodynamic and acoustic characteristics of serrated Gurney flaps in two-stage variable-pitch axial wind turbine by using the large eddy simulation (LES) and RANS methods. It is shown that the optimized sawtooth height can increase the total pressure rise, widen the efficient operation range and reduce the high-frequency noise by changing the wake vortex structure and suppressing the turbulence intensity. Xueqing Zhang et al. [14] analyzed the aerodynamic and acoustic characteristics of NACA0015 airfoil fitted with a 6% chord-length Gurney flap by using the time-resolved particle image velocimetry (TR-PIV) and Curle acoustic analogy methods. To obtain acoustic characteristics, the pressure field from velocity data was reconstructed and the distributed and tight formulas of Curle analogy were applied; thus, it was shown that both methods can accurately predict the noise at the 315 Hz vortex shedding frequency. Y. Amini et al. [15] investigated the effect of Gurney flaps on the drag of airfoils by using a continuous concomitant shape optimization method and combining the Navier–Stokes equations and the Spalart–Allmaras (S-A) turbulence model. By optimizing the NACA2412 and NACA4421 airfoils fitted with 1–2% chord-length Gurney flaps at Mach number 0.3–0.7, the study showed that the method can significantly reduce drag while maintaining lift, resulting in an increase in lift-to-drag ratio by more than 50%.
In the field of leading-/trailing-edge flaps, Tang et al. [16] investigated the effects of leading- and trailing-edge Gurney flaps on the aerodynamic characteristics of a non-slender delta wing during high-frequency and large-scale pitching motions and revealed the optimization of the Gurney flaps on the non-stoichiometric aerodynamic performance under different vortex dynamics and loop volume mechanisms. Xie et al. [17] investigated the flow field and noise sources of a Kruger flap configuration with a main wing cavity and compared it with the cavity-less configuration by using a hybrid improved delayed detached eddy simulation (IDDES) and Ffowcs Williams–Hawkings (FW-H) acoustic analogy method, and the numerical results show that the main wing cavity has a small effect on the low-frequency noise but has a broadband noise in the mid- and high-frequencies The numerical results show that the main flap cavity has little effect on the low-frequency noise, but contributes to the broadband noise in the middle and high frequencies, and the change in the angle of attack significantly affects the flow field and noise characteristics. Qian et al. [18] used the RANS method and SST k-ω turbulence model combined with dynamic mesh technique to analyze the effect of deformable trailing-edge flaps on the aerodynamic performance of FFA-W3-241 airfoil under dynamic stall conditions, and investigated and evaluated the effects of flap size, deflection angle, etc., on the airfoil lift and drag hysteresis loops and found that the dynamic loads are significantly reduced when the flaps are in the same frequency as the airfoil pitching motion. It was found that the dynamic load is significantly reduced when the flaps are in the same frequency as the wing pitching motion. Qingsong Liu et al. [19] investigated the effect of tail movable flaps on the aerodynamic performance and noise characteristics of a vertical axis wind turbine (VAWT) by numerical simulation methods. Based on the separation vortex simulation (DES) and FW-H acoustic analog equations, the geometrical parameters of the flaps are optimized by combining with the orthogonal design of experiments (OED), and the results show that the tail flaps can effectively inhibit the flow separation, delay the stall angle of attack by about 2° and significantly increase the power coefficient of the high tip-to-tip speed ratio condition in high angle of attack, and at the same time, by reducing the pressure pulsation caused by vortex detachment, the noise spectrum exhibits a broadband characteristic and the total sound pressure level is reduced by a maximum of 4.23%. The maximum reduction in sound pressure level is 4.23%. T. Lee and P. Gerontakos [20] investigated the control effects of leading-edge flaps (LEFs) and trailing-edge flaps (TEFs) on the dynamic stall characteristics of an oscillating NACA0015 airfoil through wind tunnel experiments, which provided a key experimental basis for the collaborative control of high maneuverability vehicle and rotor dynamic stall. Samara and Johnson [21] investigated the aerodynamic characteristics of the S833 airfoil with phase offset trailing-edge flaps (TEF) under pitching dynamic stall conditions. Through wind tunnel experiments combined with time-resolved pressure measurements, the results show that the TEFs, although not able to completely inhibit the formation of leading-edge vortices (LEVs), are able to reduce their strength and significantly reduce the cyclic loads, thereby reducing the risk of stall flutter. He et al. [22] used wind tunnel experiments to investigate the aerodynamic effects of the NACA0015 airfoil with oscillating trailing-edge flaps (TEFs) during a pitching dynamic stall. It was demonstrated that the TEF significantly affects the lift response and is able to delay stall onset, but the effect on the evolution of leading-edge suction parameters is more subtle, and the critical stall delay is mainly dominated by the time evolution of the effective angle of attack. Jawahar et al. [23] investigated the effect of deformed trailing edges (MTEs) with different curvatures on the aerodynamic performance of the NACA0012 airfoil through wind tunnel experiments and numerical simulations. It was shown that high curvature MTEs increase the lift coefficient and delay the trailing edge flow separation, while having less effect on the lift-to-drag ratio. Yang et al. [24] investigated the effect of iron-shaped serrated trailing edge with different curvatures on the trailing edge noise suppression of the turbulent boundary layer of the NACA0018 airfoil by means of large eddy simulation (LES) and FW-H acoustic analogy methods. They also found that, compared to the conventional triangular serration, the iron-shaped serration design improves the lift and drag ratios in the range of the small angle of attack and realizes a maximum 16.2 dB in the low- and middle-frequency range of noise reduction. Wei and Liu [25] investigated the shear layer oscillations and low-frequency noise characteristics of the leading-edge wing slit of a high-lift device experimentally by a phased microphone array and a hot-wire anemometer. It was found that the overall oscillation of the shear layer affected the transformation of the main resonant modes, verifying the key role of the shear layer oscillation on the dominant acoustic mode transformation. Kang and Lee [26] investigated the effects of different trailing edge curvatures on the noise source and acoustic radiation characteristics of the NACA0018 airfoil, which were analyzed by using large eddy simulation (LES) and FW-H acoustic analogy methods. It was found that the use of a concave trailing edge design effectively reduces the wall pressure spectrum in the low- and mid-frequency ranges, thereby reducing far-field noise, while a convex trailing edge enhances low-frequency noise and reduces high-frequency noise. Marouf et al. [27] investigated the deformation concept of a high-lift wing flap system using high-fidelity numerical simulations and validated it on a real-size Airbus A320 aircraft. The study proposed a new hybrid deformation flap design, which was shown to significantly improve the aerodynamic performance and optimize the turbulent structure. Shehata et al. [28] investigated the effect of oscillating trailing-edge flaps (TEFs) on the lift enhancement of the NACA0012 airfoil under low Reynolds number conditions. The aerodynamic performance of the TEF at five normalized frequencies (k = 0.02–0.12) and three amplitudes (5°, 8°, and 10°) was tested by wind tunnel experiments at different angles of attack (0° and 10°). It is shown that the TEF oscillations can effectively boost lift and optimize the lift-to-drag ratio at angles of attack close to stall. Lee and Su [29] investigated the effect of harmonic deflection trailing-edge flaps on the aerodynamic loads of an oscillating NACA0015 airfoil through wind tunnel experiments and found that the control method can significantly change the shape and size of the dynamic load ring, which has less effect on the formation and shedding of leading-edge vortices, but can significantly change the low-pressure characteristics of the vortices, thus effectively controlling the dynamic stall phenomenon. Wang and Tian [30] investigated the effect of bionic flaps attached to an airfoil on aerodynamic performance and acoustic output through numerical simulations. The study used the immersed boundary method to analyze the flow characteristics of fixed and small amplitude oscillating NACA0012 airfoils at a mean windward angle of 10°. The results showed that the flaps significantly reduced the lift amplitude and hence the acoustic power by 60.3% and 25.3% for the fixed and low-frequency oscillation conditions, respectively. Jawahar et al. [31] investigated the aerodynamic and aeroacoustic characteristics of NACA0012 airfoil with hinged flaps (HTEs) and deformed trailing-edge flaps (MTE). The study uses the large eddy simulation (LES) method to analyze the non-constant flow characteristics on the airfoil surface and its wake development. The results show that the MTE produces higher lift compared to the HTE, but results in stronger far-field noise due to its larger surface pressure fluctuations.
Although extensive studies have been conducted on the aerodynamic performance of Gurney flaps and leading-/trailing-edge flaps, research on their aeroacoustic characteristics under stall conditions remains relatively limited. Therefore, this study employs the delayed detached eddy simulation (DDES) technique combined with the Ffowcs Williams–Hawkings (FW-H) acoustic analogy to investigate the aeroacoustic characteristics of a NACA0021 airfoil equipped with a Gurney flap and leading-/trailing-edge flaps at an angle of attack of 20°. By systematically comparing the aerodynamic performance and noise characteristics of the baseline airfoil, i.e., the Gurney flap-configured airfoil, and the airfoil with combined leading- and trailing-edge flaps, the underlying mechanisms through which different flow control strategies affect the stall behavior and aeroacoustic performance of the airfoil are revealed.

2. Numerical Simulation of Flow Around NACA0021 Using DDES

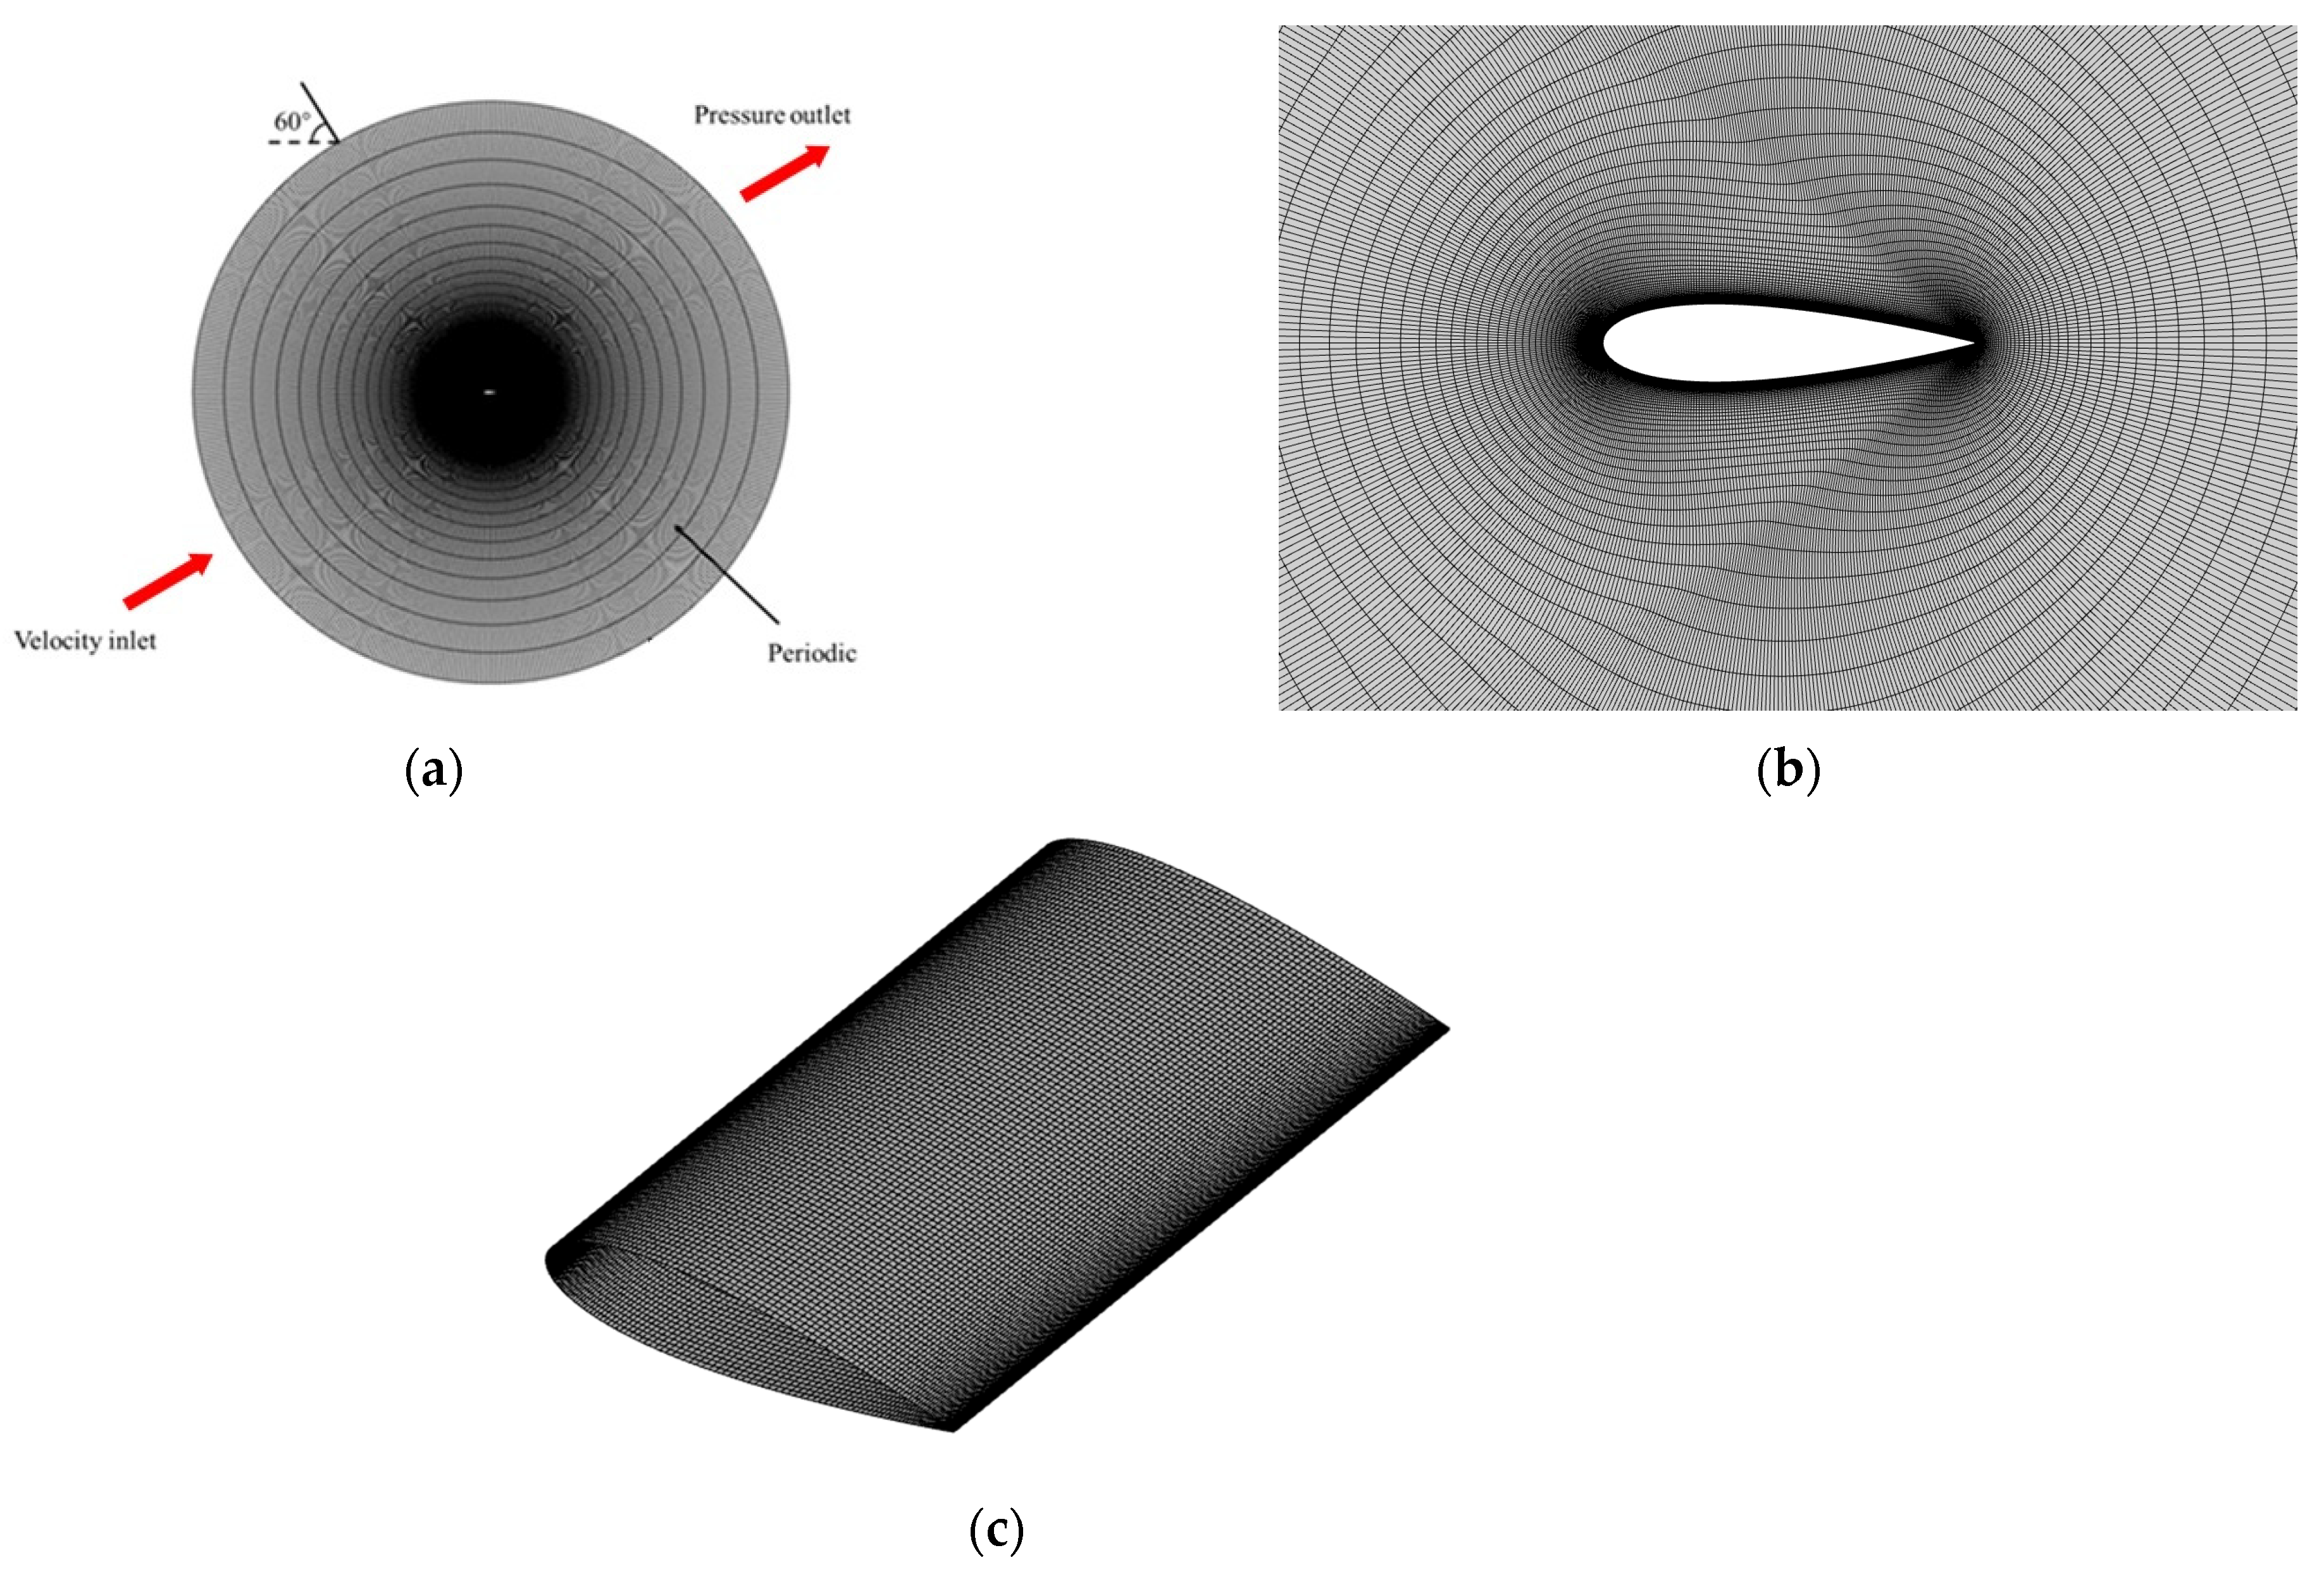
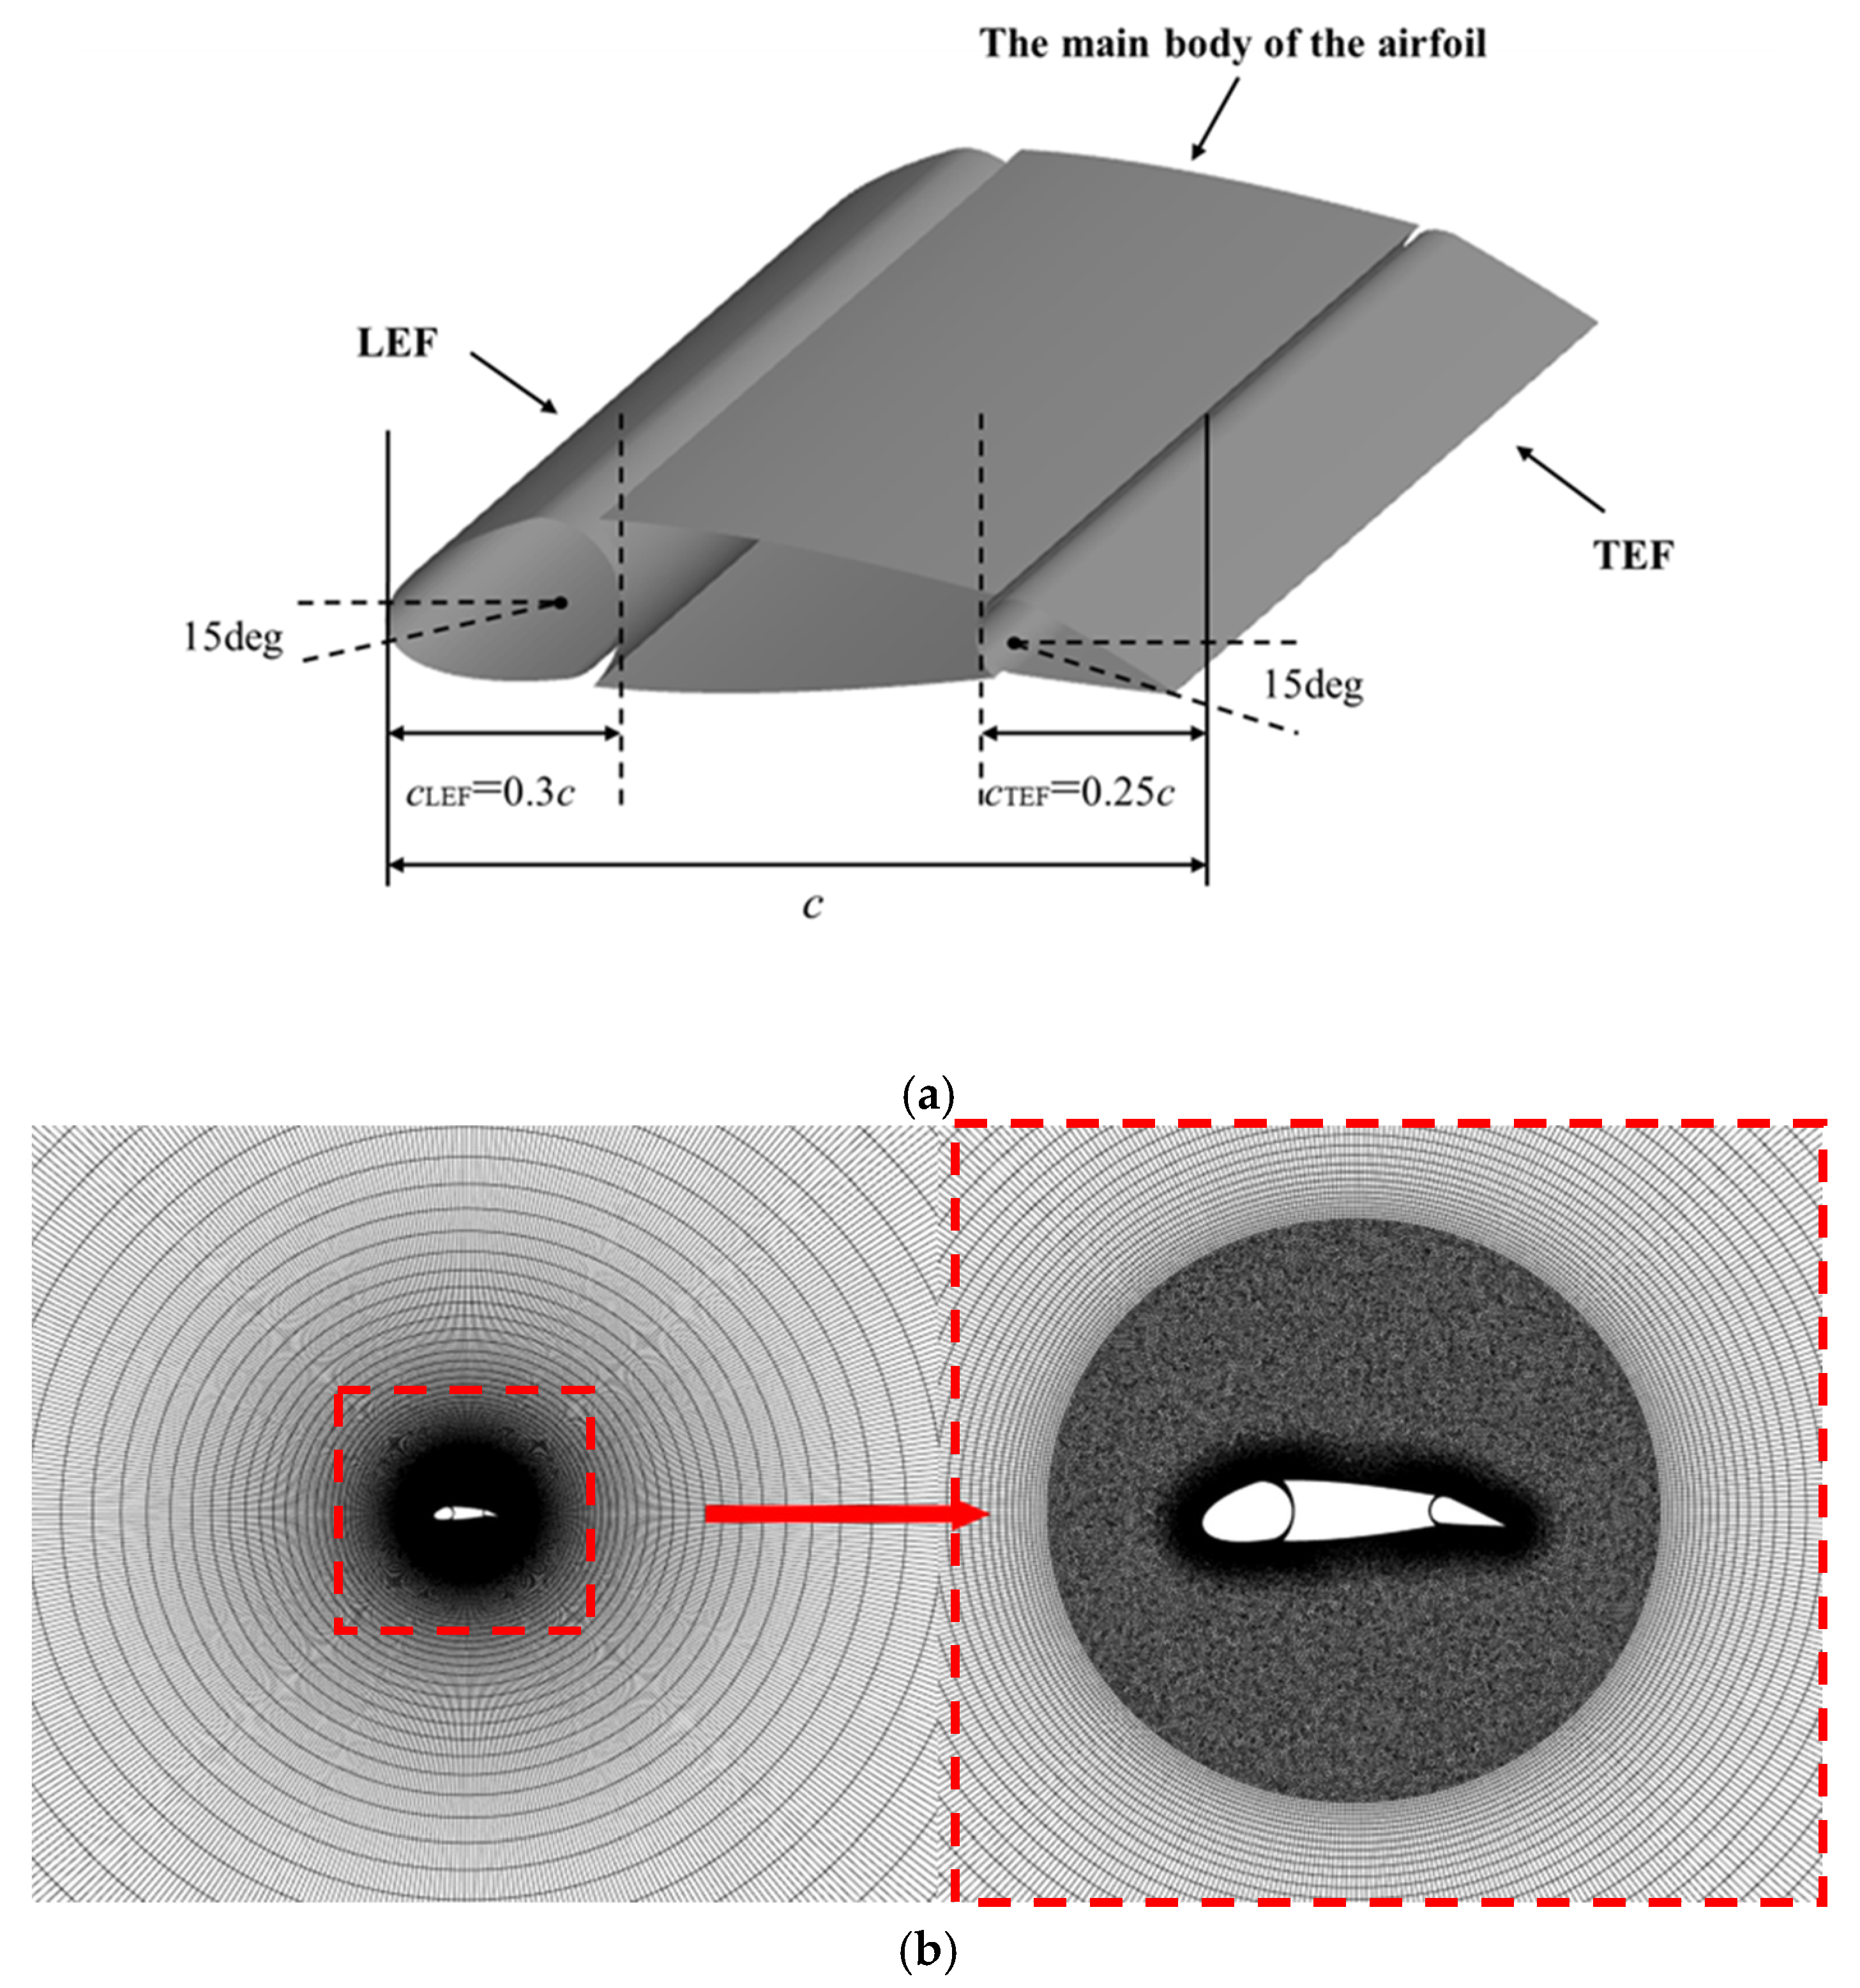
2.1. Computational Modeling and Mesh Generation

The numerical simulation approach adopted in this study is based on the wind tunnel experiments conducted by Swalwell et al. [32], which investigated the aerodynamic behavior of an airfoil under high-angle-of-attack conditions. The experiment utilized a NACA-series airfoil model with a chord length of 0.125 m and a maximum thickness of 21% of the chord. In the simulation, the freestream conditions at the inlet were defined by a Mach number of Ma = 0.1 and a Reynolds number of Re = 2.7 × 10⁵, with an angle of attack set to 60°. As illustrated in Figure 1, the computational domain was constructed with a radius of 20 chord lengths, centered at a point located 25% of the chord length upstream of the airfoil’s leading edge. The origin of the coordinate system was positioned at the airfoil’s leading-edge tip. Considering the geometric characteristics of the NACA0021 airfoil, an O-type mesh topology was employed. The spanwise extent of the domain covered a distance of two chord lengths. In the coordinate system, the x-axis extends from the leading edge to the trailing edge, corresponding to the main flow direction; the y-axis represents the normal direction and the z-axis corresponds to the spanwise direction. For mesh generation, the grid was discretized with 502, 111 and 80 nodes in the x, y and z directions, respectively, resulting in a total of approximately 4.3 million cells for the three-dimensional computational domain.
To ensure accurate resolution of near-wall turbulence characteristics, the height of the first layer of grid cells in the wall-normal direction was set to 0.0094 mm, maintaining a dimensionless wall distance of approximately y+ ≈ 1. Additionally, the stretching ratio of the structured grid was kept within the range of 1.05 to 1.1 to ensure high mesh quality and numerical stability. The boundary conditions, as illustrated in Figure 1, were defined as follows: a velocity inlet at the upstream boundary, a pressure outlet at the downstream boundary and periodic boundaries in the spanwise direction. A no-slip wall condition was applied to the airfoil surface. High-fidelity numerical simulations of the unsteady, incompressible flow around the NACA0021 airfoil were conducted using the commercial software ANSYS Fluent version 2021 R1. The turbulence was modeled using the delayed detached eddy simulation (DDES) approach based on the Spalart–Allmaras (S-A) model.
During the numerical solution process, the SIMPLE algorithm was employed for pressure–velocity coupling, with both spatial and temporal discretizations using second-order accuracy schemes. The convergence criterion was set to a residual level of 1 × 10⁻⁸. To capture unsteady flow behavior, a time step of Δt = 0.00039 s was used. The resulting flow field data were subsequently employed as input for the Ffowcs Williams–Hawkings (FW-H) acoustic analogy [33] to predict the far-field noise. The FW-H formulation extracts equivalent acoustic source terms directly from the nonlinear flow field, enabling the accurate prediction of sound radiation generated by fluid–structure interactions. Importantly, because the flow field and acoustic propagation computations are decoupled, there is no need to construct an additional acoustic mesh, thereby improving computational efficiency. The FW-H equation is expressed as follows:
1 c 2 2 t 2 2 x i 2 p x i , t                                                               = t ρ 0 v n + ρ u n v n δ f + 2 x i y i T i j H   f                                                               x i p i j n i j + ρ u i u n v n δ f
H f = { 0 , f x i , t < 0 1 , f x i , t 0
δ f = H f f  
where
  • 1 c 2 2 t 2 2 x i 2 fluctuation   operator ;
  • p x i , t far - field   sound   pressure ;
  • ρ 0 the   density   of   undisturbed   medium ;
  • v n the   velocity   normal   to   the   surface   of   the   moving   object ;
  • f x 1 , x 2 , x 3 , t = 0 the   surface   equation   of   the   moving   object ;
  • H   f the   Heavisat   function ;
  • T i j the   Leithill   turbulent   stress   component .
In this paper, we set the sound field detection frequency to 10 KHz. The time step is determined to be 50 μs according to Equation (4), the frequency resolution is determined to be 5 Hz, and the number of sampling steps is determined to be 4000 from Equation (5).
f max = 1 2 Δ t
N = 1 Δ f · Δ t

2.2. Grid Independence Verification

To evaluate the sensitivity of numerical simulation results to mesh resolution, a grid independence study was first conducted under high-angle-of-attack conditions. Based on a spanwise domain length of twice the chord, three sets of computational meshes with varying densities—coarse, medium and fine—were generated using Pointwise software V18.4R4, all employing a consistent O-type mesh topology. The meshes differed in the distribution of grid points along the x, y and z directions, resulting in approximately 2 million, 4 million and 6 million cells, respectively. The simulation outcomes were compared against wind tunnel experimental data provided by Swalwell et al. [32], as well as numerical results from the EADS-M group [34], the latter employing unstructured mesh strategies. All referenced numerical results were obtained using the Spalart–Allmaras turbulence model to ensure methodological consistency.
To investigate the impact of mesh resolution on simulation accuracy, numerical simulations were conducted for the NACA0021 airfoil under a high angle of attack using three mesh densities consisting of approximately 2 million, 4 million and 6 million cells. The time-averaged results obtained from these simulations were compared with wind tunnel experimental data, as illustrated in Figure 2 and Table 1. Spanwise-averaged surface pressure coefficients were extracted for each mesh case. The comparison reveals that all three mesh resolutions yield results that closely follow the experimental trends, particularly on the pressure side (lower surface) of the airfoil. Along the pressure surface, a high-pressure region is maintained from the leading edge to the trailing edge, with a pronounced drop in pressure occurring only near the trailing edge. Due to the large angle of attack, a substantial flow separation occurs at the leading edge on the suction surface (upper surface), resulting in a broad region with low-pressure values and little attached flow. The multiscale nature of turbulent structures on the suction side leads to some variability in the simulated pressure coefficients. However, as shown in Figure 2, the simulation results on the suction surface near the leading and trailing edges agree well with experimental observations, with only minor deviations present in the mid-chord region.
As shown in Table 1, the time-averaged lift and drag coefficients obtained under different mesh resolutions are generally in good agreement with the experimental data. Among the three cases, the mesh with approximately 4 million cells yields results that most closely match the experimental values. In contrast, overly coarse meshes tend to cause numerical divergence and increased errors, while excessively fine meshes, despite their potential for improved resolution, may lead to higher computational costs and the accumulation of numerical errors, ultimately compromising stability and efficiency. Considering the balance between accuracy and computational expense, the medium-resolution mesh of 4 million cells was selected as the baseline for subsequent high-fidelity simulations and validation.

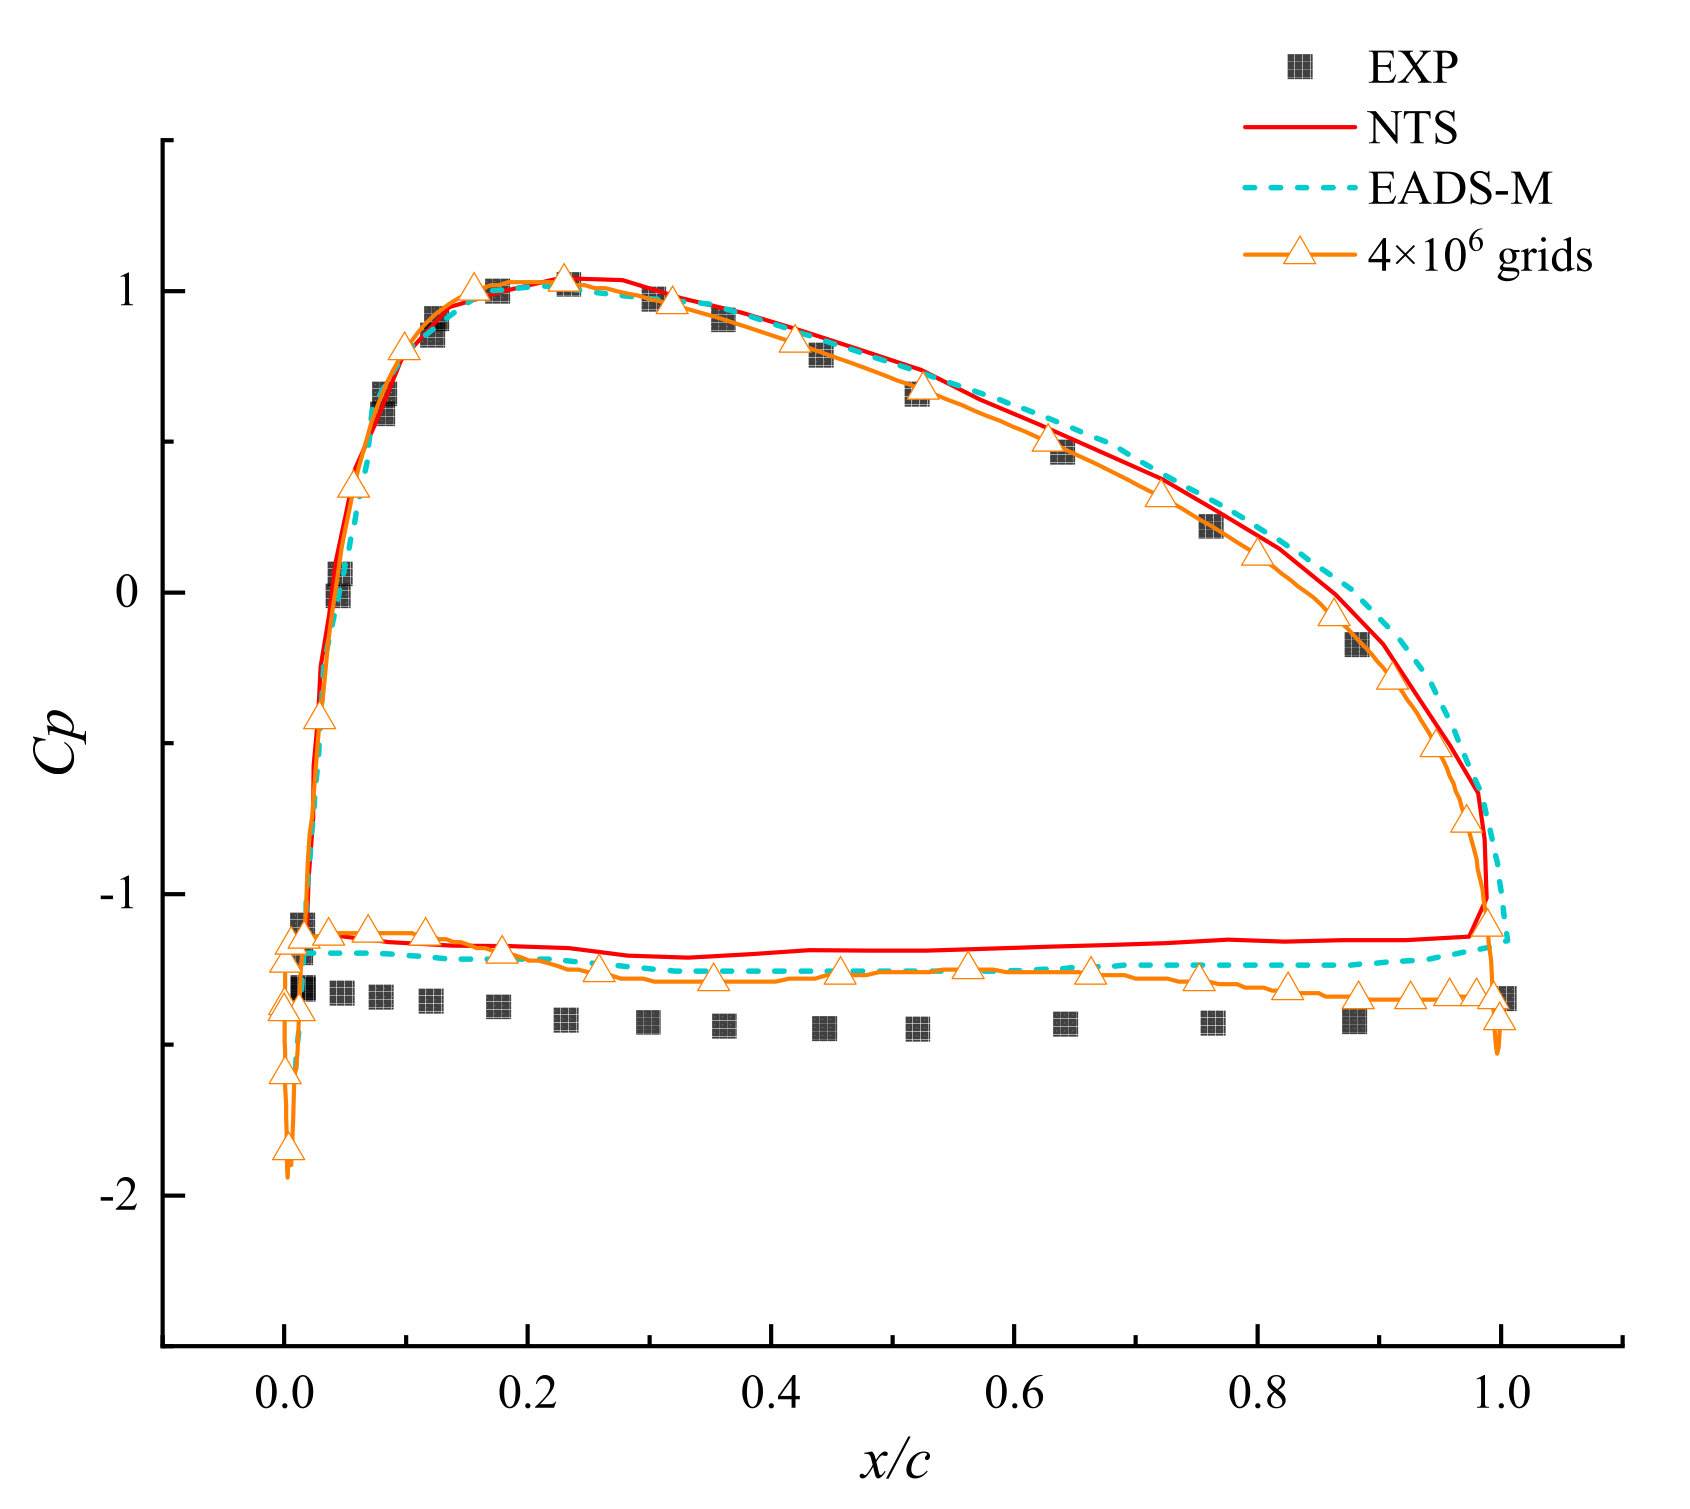
2.3. Verification of the Accuracy of Simulation Results

To assess the reliability of the numerical simulation, the results obtained using the 4-million-cell mesh were compared with the wind tunnel data from Swalwell et al. [32] and the numerical predictions from the EADS-M research group [34]. Table 2 presents a comparison of the time-averaged aerodynamic coefficients. It is evident that the lift and drag coefficients calculated in this study exhibit significantly better agreement with experimental values than those reported in the aforementioned references. Furthermore, Figure 3 illustrates the surface pressure coefficient distributions, where all referenced results closely match the experimental measurements on the lower surface of the airfoil. This further confirms the high accuracy of the present simulation in capturing the key aerodynamic features.

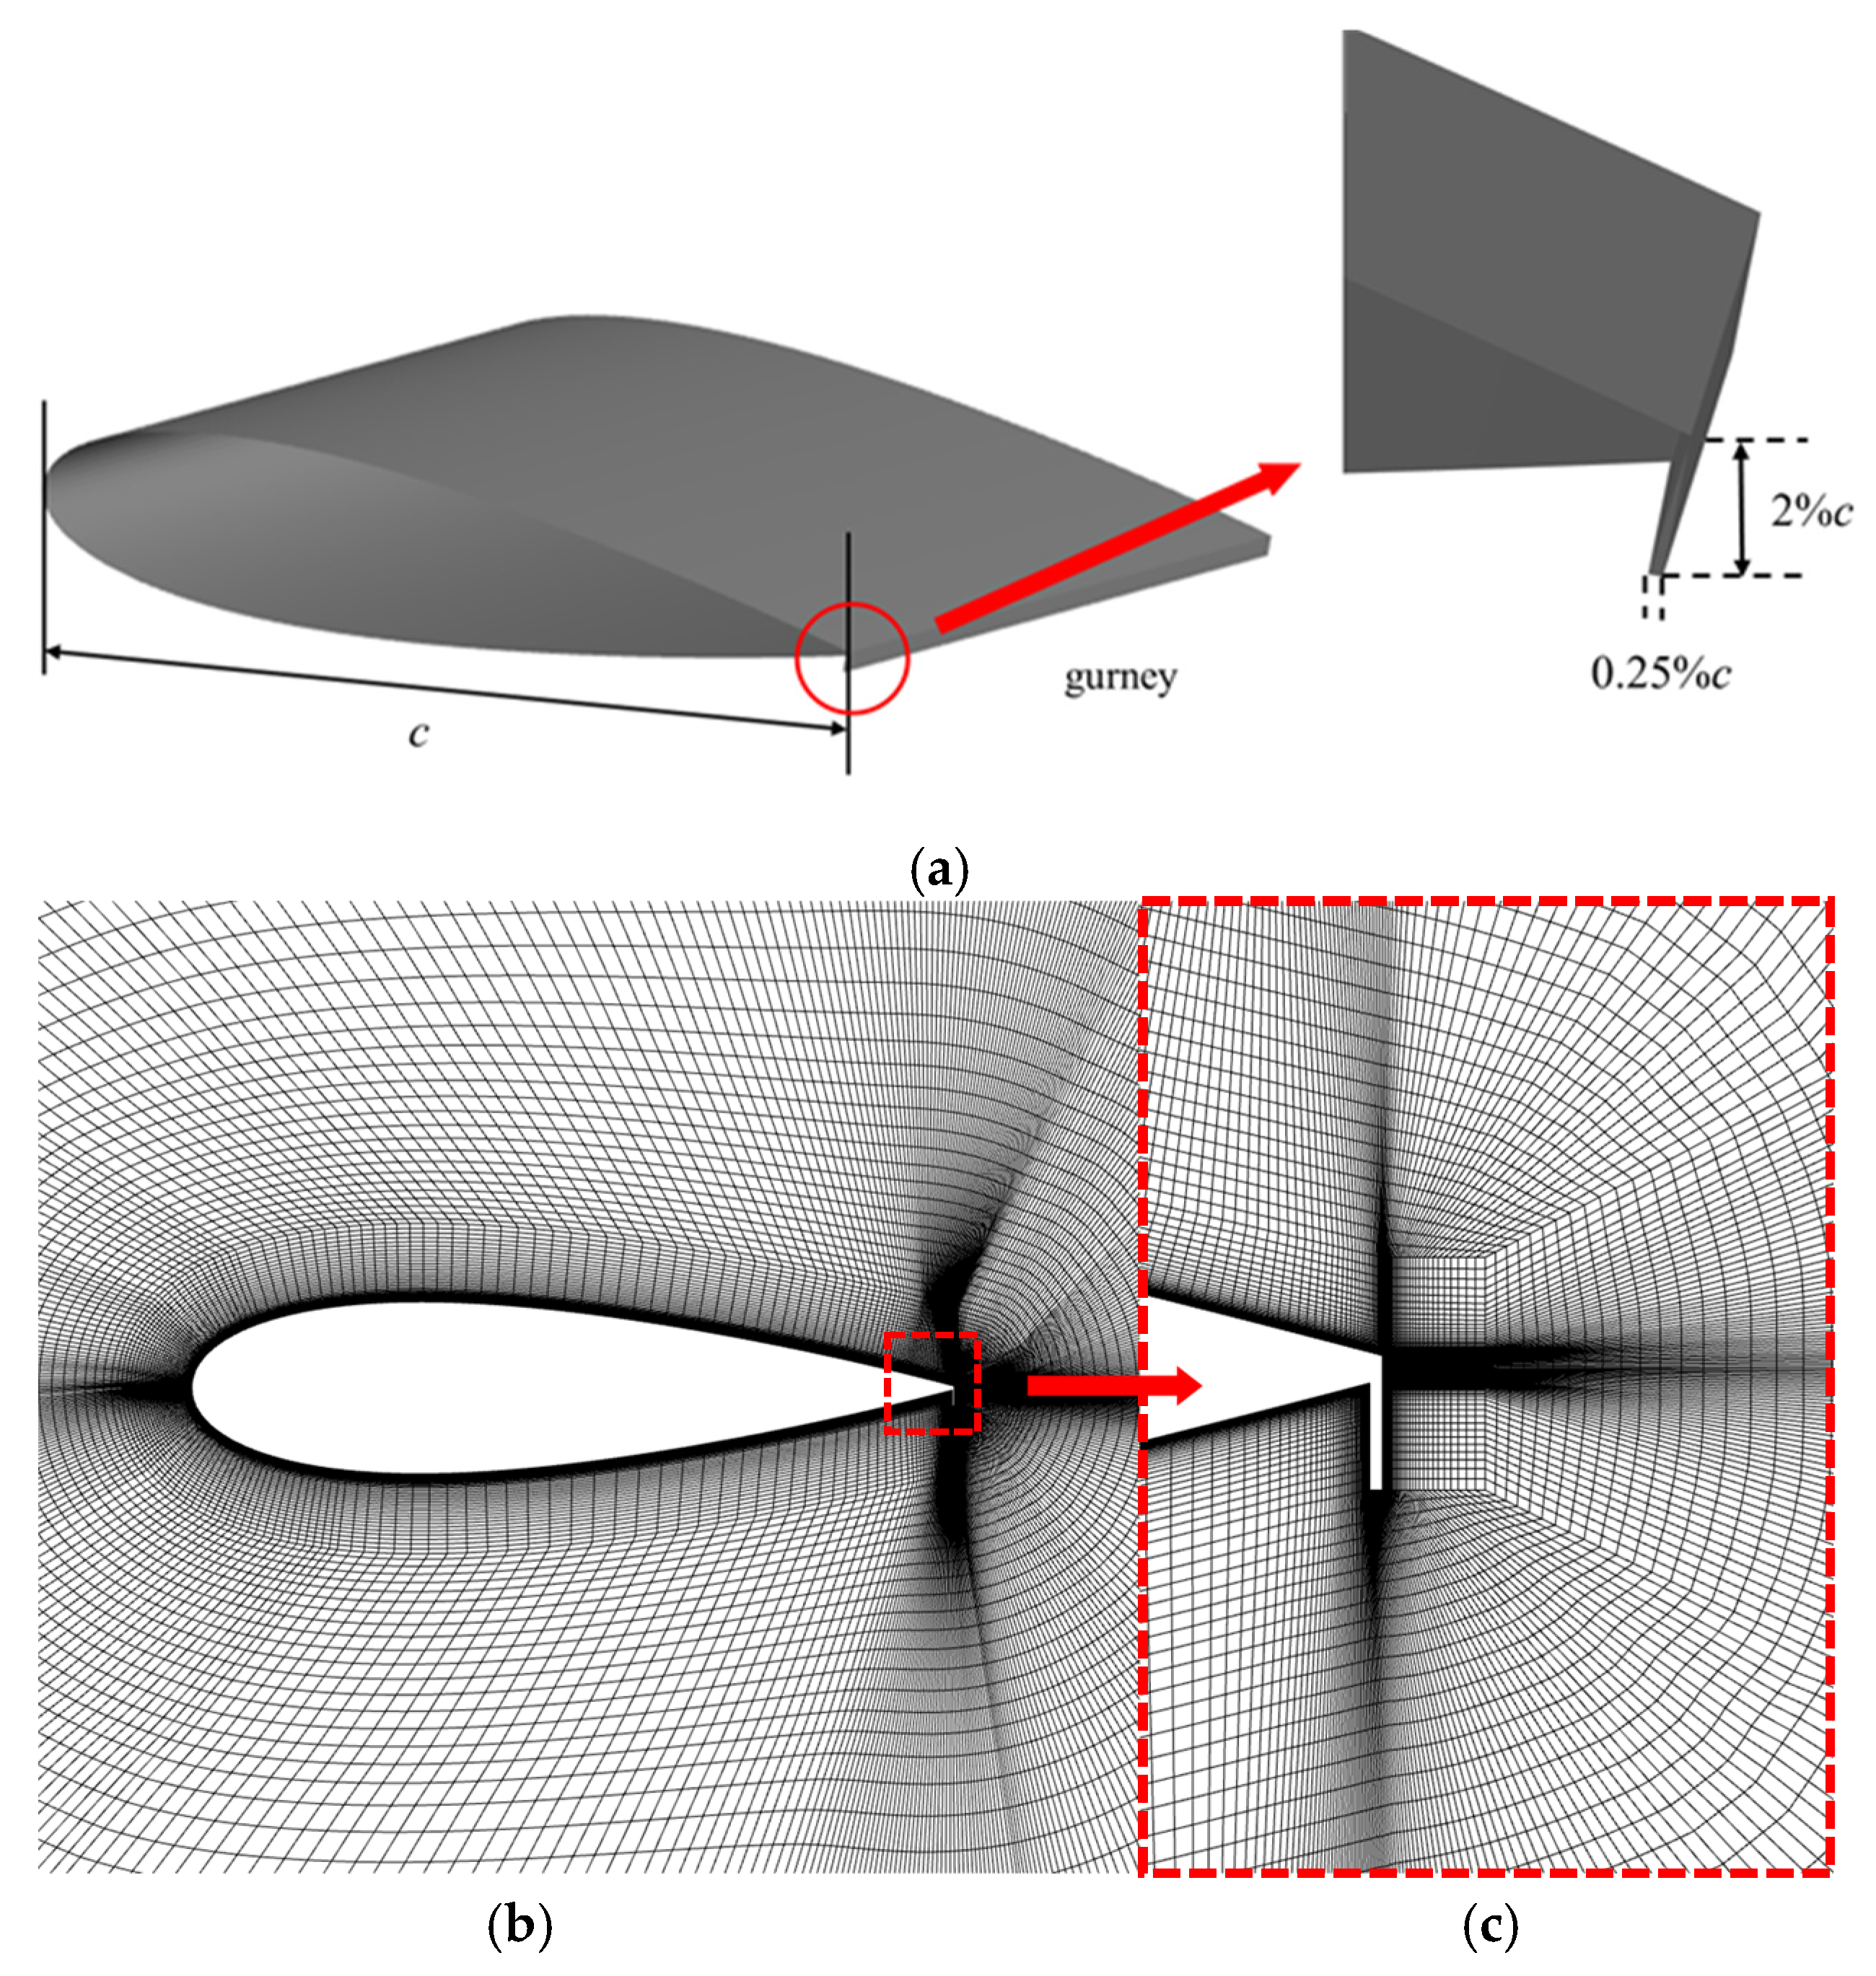
2.4. Simulation Results of Airfoil Model with Gurney Flap Airfoil and Leading- and Trailing-Edge Flap Airfoils

The Gurney flap is a small flat plate mounted at the trailing edge of an airfoil, oriented perpendicular to the chord line. As a passive flow control device, it is widely employed in aerospace applications to enhance aerodynamic performance. In this study, the geometry of the Gurney flap is illustrated in Figure 4a. It is positioned on the pressure side of the trailing edge, aligned perpendicular to the airfoil chord, with a height of 2% and a thickness of 0.25% of the chord length. Due to its vertical configuration relative to the chord, a dedicated structured meshing strategy was applied to the flap region. The entire two-dimensional computational domain was discretized using structured grids, with local refinement in the vicinity of the flap, as shown in Figure 4b. The resulting three-dimensional mesh comprises approximately 5 million elements, ensuring a comparable mesh scale to that used for the baseline airfoil to maintain consistency in the simulation comparison. The simulation conditions employed for the Gurney flap configuration are identical to those used for the baseline airfoil without flaps: the chord length of the airfoil is set to 0.125 m, the maximum thickness is 21% of the chord, the free-stream Mach number is 0.1 and the Reynolds number is 2.7 × 10⁵.
Under a freestream angle of attack of 20°, the lift and drag coefficients of the airfoil equipped with a Gurney flap are presented in Table 3. Compared to the baseline airfoil without a flap, the configuration with the Gurney flap exhibits a substantial enhancement in lift performance, with the lift coefficient increasing by approximately 93.68%, while the increase in drag coefficient remains relatively modest. Under deep stall conditions, the Gurney flap demonstrates excellent lift augmentation capability, significantly improving the lift-to-drag ratio and confirming its effectiveness under high-angle-of-attack scenarios. Figure 5 illustrates the spanwise-averaged distribution of surface pressure coefficients for both the baseline airfoil and the airfoil equipped with a Gurney flap. It can be observed that the pressure distributions on the lower surface near the leading edge are quite similar for both configurations. However, on the upper surface, the pressure coefficient for the airfoil with the Gurney flap is significantly higher than that of the baseline. Overall, the installation of the flap results in a slight increase in surface pressure across the airfoil, with a particularly notable rise on the pressure side near the trailing edge. This increase further amplifies the pressure differential between the upper and lower surfaces, thereby enhancing the lift generation.
Figure 6a presents the three-dimensional structural model and geometric parameters of the leading-edge and trailing-edge flaps. The chordwise length of the leading-edge flap is set to 30% of the airfoil chord length (cLEF = 0.3c), with a deflection angle of 15°. Its rotation center is positioned near the leading-edge slot and aligned along the original airfoil chord line. The distance between the rotation center and the leading-edge slot (LLEF) accounts for 30% of the leading-edge flap length. The trailing-edge flap has a chordwise length of 0.25c, also with a deflection angle of 15°, and its rotation center is located near the trailing-edge slot, similarly lying along the original chord line. The distance from the rotation center to the trailing-edge slot (LTEF) is 15% of the trailing-edge flap length. Both the leading- and trailing-edge slots have a gap size of 0.5%c, with flaps deflected toward the pressure side of the airfoil.
Considering the extremely narrow space in the slot regions after flap deflection, an unstructured mesh was first employed to fill the slot areas to ensure mesh quality and smooth transition. Surrounding these regions, a structured mesh with circumferential topology was generated, followed by spanwise mesh distribution to complete the full three-dimensional airfoil mesh structure, as illustrated in Figure 6b. Due to the complexity of the slot geometry requiring a large number of unstructured elements for detailed modeling, the final three-dimensional mesh consists of approximately 8 million cells.
To further investigate the influence of different types of flaps on the aerodynamic characteristics of the airfoil, high-angle-of-attack numerical simulations were conducted under the same computational conditions as previously described. Specifically, the freestream angle of attack was set to 20°, with an airfoil chord length of c = 0.125 m, a maximum thickness of 21% of the chord, a freestream Mach number of Ma = 0.1 and a Reynolds number of Re = 2.7 × 10⁵. Under these conditions, simulations were performed for the airfoil equipped with a combination of leading-edge and trailing-edge flaps. The resulting lift and drag coefficients are presented in Table 4. Compared to the baseline configuration without flaps, the airfoil with combined leading- and trailing-edge flaps exhibited substantial improvements in both lift and drag, with the lift coefficient increasing by approximately 65.061% and the drag coefficient rising by 37.302%. Despite the increase in drag, the overall lift-to-drag ratio still demonstrated a certain degree of improvement. Figure 7 compares the spanwise-averaged surface pressure coefficient distributions between the baseline and the flap-equipped configurations. It can be observed that, in the region influenced by the leading-edge flap, the pressure coefficient on the upper surface (suction side) of the airfoil significantly decreases relative to the baseline, while changes on the lower surface (pressure side) are minimal. In the gap regions between the flaps and the main airfoil, some freestream flow from the lower surface enters the upper surface through the slots, resulting in a localized rapid increase in pressure and forming a pressure concentration zone.
In the mid-chord region, the overall surface pressure is higher than that of the original airfoil, enhancing the pressure differential between the upper and lower surfaces and thereby significantly increasing lift. Furthermore, in the trailing-edge region, the deflection of the trailing-edge flap causes a notable drop in lower surface pressure near the flap gap, while the upper surface pressure remains higher than that of the baseline, further contributing to the enhancement of lift.

3. Acoustic Noise Analysis

3.1. Noise Spectrum

The center of the acoustic directivity distribution was positioned at the midpoint of the airfoil’s chordwise and spanwise directions, with 24 monitoring points uniformly arranged around it, as shown in Figure 8a. The positions at 90° azimuth are defined as A1, 0° azimuth as A7, 270° azimuth as A13, and 180° azimuth as A19. These four main monitoring points are located at the upper-, lower-, leading- and trailing-edge positions in the center of the wing spread, which are typical azimuths reflecting noise. The acoustic directivity patterns are presented in Figure 8b. As illustrated, the sound pressure level (SPL) distributions for the baseline airfoil, the airfoil with a Gurney flap and the airfoil equipped with leading- and trailing-edge flaps all exhibit distinct dipole-like source characteristics. The trends in acoustic directivity are consistent across the three configurations, indicating that the addition of the Gurney flap or the leading-/trailing-edge flaps does not significantly alter the overall acoustic directivity pattern of the airfoil. As shown in Figure 8c, compared to the baseline airfoil, the Gurney flap configuration exhibits almost identical total SPLs at 0° and 180° azimuthal angles, while noticeable differences occur at other angles, particularly within the ranges of 0–90° and 270–360°, where the total SPL increases by more than 2.5 dB. Additionally, at the 195° azimuth, the total SPL decreases by approximately 4.8 dB.
For the airfoil equipped with leading- and trailing-edge flaps, the total SPL is generally higher than that of the baseline airfoil across most azimuthal angles, with a maximum increase of up to 11.8 dB. However, within the range of 135–195°, the total SPL decreases relative to the baseline, with the maximum reduction reaching approximately 4.1 dB. These observations suggest that both flow control strategies lead to an increase in noise over most azimuthal directions, while in certain regions near the leading edge, they contribute to noise reduction, achieving a maximum noise reduction rate of approximately 4.4%.
The acoustic spectra at four representative azimuthal angles-0°, 90°, 180° and 270° were analyzed for the three airfoil configurations, as shown in Figure 9. The spectral trends at these angles are generally similar. At 0°, 90°, 180° and 270° azimuths, the airfoil with a Gurney flap shows minor differences in sound pressure level (SPL) compared to the baseline airfoil in the low to mid-frequency range (approximately 5–1000 Hz). In the mid-frequency range (approximately 1200–3000 Hz), the baseline airfoil exhibits pronounced peaks in its SPL curves compared to the Gurney flap configuration. In the mid-to-high frequency range (approximately 3000–20,000 Hz), the SPL of the Gurney flap airfoil becomes slightly higher than that of the baseline.
In contrast, the airfoil equipped with leading- and trailing-edge flaps displays a generally higher SPL across almost the entire frequency range compared to the baseline, except for a narrow frequency band (approximately 1700–2500 Hz) where the baseline airfoil slightly outperforms it. These results indicate that the addition of both the Gurney flap and the leading-/trailing-edge flaps tends to increase noise in the low- and mid-to-high frequency ranges, while a noise reduction is observed in the mid-frequency range around 1700–2500 Hz. Compared to the Gurney flap configuration, the leading-/trailing-edge flap airfoil generates a more substantial noise increase relative to the baseline, particularly in the mid-to-high frequency range (approximately 3000–20,000 Hz).
To balance the need for representing subjective human auditory perception and reducing data volume, the one-third octave band analysis has become one of the most commonly used tools in acoustic spectral analysis [35]. In noise measurements, one-third octave spectra can more accurately reflect the spectral characteristics of noise sources. As shown in Figure 10, the one-third octave band curves derived from the fluctuating pressure noise spectra reveal that the sound pressure level (SPL) trends for the Gurney flap airfoil and the baseline airfoil are generally consistent at the four azimuthal angles of 0°, 90°, 180° and 270°. At the 0° azimuth, in the low-to-mid frequency range (25–1250 Hz), the SPL of the Gurney flap airfoil is higher than that of the baseline at most frequencies, with a maximum increase of 9.4 dB at 50 Hz. In the mid-to-high frequency range (1250–10,000 Hz), the SPL of the Gurney flap airfoil is lower than that of the baseline across most frequencies, except at 10,000 Hz where it is 0.85 dB higher. Notably, at 2000 Hz, the Gurney flap airfoil achieves a SPL reduction of 14.7 dB compared to the baseline.
At the 0° azimuth, across most frequency ranges (40–63 Hz and 100–10,000 Hz), the SPL of the airfoil equipped with leading- and trailing-edge flaps is higher than that of the baseline airfoil, with a maximum increase of 23.98 dB at 160 Hz and 26.7 dB at 10,000 Hz. At the 180° azimuth, the SPL of the Gurney flap airfoil exceeds that of the baseline across most frequencies (50–10,000 Hz), with increases of 8.66 dB at 50 Hz and 7.95 dB at 80 Hz. However, in a portion of the low-frequency range, the baseline airfoil exhibits higher SPL values, with a maximum increase of 1.89 dB at 40 Hz. For the airfoil with leading- and trailing-edge flaps, higher SPL values compared to the baseline are observed over frequency ranges of 40–200 Hz and 4000–10,000 Hz, with maximum increases of 16.52 dB at 160 Hz and 19.24 dB at 10,000 Hz. Nevertheless, in certain low- and mid-frequency ranges (25–31.5 Hz and 400–3150 Hz), the baseline airfoil shows higher SPL, with a maximum increase of 8.19 dB at 1250 Hz. At the 90° azimuth, the Gurney flap airfoil exhibits lower SPL compared to the baseline over most frequencies (100–630 Hz and 1000–5000 Hz), achieving a maximum reduction of 5.78 dB at 200 Hz. In contrast, the airfoil with leading- and trailing-edge flaps displays higher SPL than the baseline across most frequencies (40–200 Hz and 3150–10,000 Hz), with increases of 12.71 dB at 160 Hz and 20.43 dB at 10,000 Hz. At the 270° azimuth, the Gurney flap airfoil maintains lower SPL across almost the entire frequency range (25–40 Hz, 100–500 Hz and 1000–8000 Hz), with a maximum reduction of 5.6 dB at 200 Hz. Conversely, the airfoil with leading- and trailing-edge flaps exhibits higher SPL than the baseline at most frequencies (40–200 Hz and 2500–10,000 Hz), with increases of 12.08 dB at 160 Hz and 23.76 dB at 10,000 Hz.
Figure 11 presents the fluctuations in sound pressure levels (SPL) of the Gurney flap airfoil and the airfoil with leading- and trailing-edge flaps relative to the baseline airfoil at four azimuthal monitoring points. Focusing on the 0° azimuth, it can be observed that the Gurney flap airfoil exhibits significant SPL increases in the low- and mid-to-high-frequency ranges, while a noticeable SPL reduction occurs in the high-frequency range. At specific frequencies, the maximum SPL reduction achieved by the Gurney flap airfoil reaches 14.72 dB. In contrast, the airfoil equipped with leading- and trailing-edge flaps shows a significant SPL increase across almost the entire frequency range, with a maximum increase of 26.7 dB at specific frequencies. These results indicate that the Gurney flap can contribute to noise reduction at the trailing edge.

3.2. Noise Mechanism Analysis of the Gurney Flap Airfoil

The generation and propagation of sound sources are closely related to transient pressure pulsations, so the root mean square (RMS) value of the pressure pulsations given in Equation (6) is introduced to evaluate the effect of the Gurney flaps on the sound source field.
p rms = var p z 1 , t
where p(z1, t) is the time-averaged instantaneous pressure of the flow field; var is the variance of the instantaneous pressure signal during the computation time; p = pp0, p is the instantaneous pressure; and p0 is the time-averaged pressure.
The strength of noise sources can be reflected by the distribution range and magnitude of time-averaged pressure fluctuations. As shown in Figure 12, the Gurney flap airfoil exhibits a broader distribution range of peak pressure fluctuations near the trailing edge at 0° azimuth and near the leading edge at 180° azimuth compared to the baseline airfoil, which is consistent with the data presented in Figure 8. The phenomena observed in Figure 13 indicate that the addition of a Gurney flap leads to an expansion of the wake region, resulting in finer and more fragmented vortex structures. The enhanced interactions between vortical structures subsequently contribute to an increase in noise generation.
Further analysis, based on the baseline airfoil curve shown in Figure 10b-A7, reveals an inflection point at 1250 Hz. To investigate this phenomenon, surface-radiated noise pressure contour maps at specific frequencies on either side of the inflection point are analyzed, as presented in Figure 14. It can be observed that with increasing frequency, the peak distribution range of the surface pressure contours near the trailing edge gradually decreases and the peak magnitude also diminishes. This trend is opposite to that observed in the baseline airfoil curve in Figure 10b-A7. These results suggest that as the surface flow evolves, the initially large-scale flow separation progressively stabilizes, leading to a reduction in noise generated by the interaction between the trailing edge surface and the surrounding air. Meanwhile, noise generated by the interaction between wake vortices gradually becomes dominant.
As shown by the Gurney flap airfoil curve in Figure 10b-A7, the sound pressure level gradually decreases within the frequency range of 1250 Hz to 2000 Hz, and the noise level is significantly lower than that of the baseline airfoil. Figure 15 illustrates that, with increasing frequency, the peak distribution range of the surface pressure contours near the trailing edge progressively shrinks, and the peak magnitude also decreases. This trend is consistent with that observed in the Gurney flap airfoil curve. These observations indicate that the trailing-edge noise is primarily generated by the interaction between the surface of the airfoil and the surrounding air. Moreover, due to the presence of the Gurney flap, distinct alternating vortex structures appear at the trailing edge, exhibiting periodic shedding. Consequently, the wake vortices become finer and the contribution of noise generated by interactions among the wake vortices is reduced within this frequency range.

3.3. Noise Mechanism Analysis of the Leading-Edge and Trailing-Edge Flap Airfoil

The noise characteristics of the airfoil with leading-edge and trailing-edge flaps at a 20° angle of attack were analyzed. As observed in Figure 16, the peak distribution range of pressure fluctuations near the trailing edge at a 0° azimuth is significantly larger than that of the baseline airfoil. Moreover, the p’rms values are also considerably higher compared to the baseline airfoil, indicating enhanced unsteady pressure fluctuations induced by the leading-edge and trailing-edge flaps. At the leading-edge region near the 180° azimuth, the root mean square (RMS) distribution of pressure fluctuations indicates an almost complete absence of pressure oscillations. These findings indicate that the leading-edge and trailing-edge flaps induce pronounced pressure fluctuations at the trailing edge, with the overall wake region significantly larger than that of the baseline airfoil. The deflection of the flaps toward the pressure side effectively reduces the local angle of attack, leading to more stabilized leading-edge flow and a substantial reduction in pressure fluctuations compared to the baseline airfoil. Additionally, no flow separation is observed upstream of the leading-edge flap, as shown in Figure 17. Consequently, while the noise generated near the trailing edge increases due to the presence of the leading-edge and trailing-edge flaps, the pressure fluctuation-induced noise near the leading edge is reduced, further validating the trends observed in Figure 8.
Further analysis reveals that, as shown in Figure 10b-A7, a distinct peak appears at 160 Hz in the 1/3-octave band spectrum. To investigate this peak and the surrounding frequencies, sound pressure level (SPL) contour maps of airfoil surface radiation noise at selected frequencies were examined, as shown in Figure 14. From Figure 18c, it is evident that at 160 Hz, the acoustic radiation is primarily concentrated at the trailing-edge flap of the airfoil. The SPL contours at this frequency display a uniform sound radiation pattern along the trailing edge, with the highest peak value observed. In contrast, at 100 Hz, 125 Hz and 200 Hz—depicted in Figure 18a, Figure 18b and Figure 18d, respectively—the SPL distributions along the trailing edge are less uniform and exhibit lower peak values compared to those at 160 Hz. Among them, the SPL contour at 200 Hz shows a more uniform distribution and slightly higher peak value than at 125 Hz. These trends are consistent with the data presented in Figure 10b-A7.
The further analysis of Figure 10b-A7 reveals that 3150 Hz corresponds to an inflection point in the 1/3-octave band spectrum, where the sound pressure level (SPL) transitions from a decreasing to an increasing trend. To investigate the acoustic characteristics around this inflection point, SPL contour maps of airfoil surface radiation noise at selected frequencies were analyzed. As shown in Figure 18g, at 3150 Hz, the acoustic radiation is mainly concentrated around the trailing-edge flap of the airfoil. The SPL contours at this frequency exhibit a relatively small peak distribution area, low peak values and non-uniform surface radiation. At lower frequencies, from 2000 Hz to 2500 Hz—as shown in Figure 18e,f—the peak distribution area of the SPL contours at the trailing edge gradually decreases, and the peak values diminish, indicating a weakening of the surface acoustic radiation at the trailing edge. At 2500 Hz, the SPL distribution area further shrinks, and the radiation intensity weakens. However, as indicated by the SPL curve in Figure 10b-A7, the overall SPL begins to rise after 3150 Hz, implying that the subsequent noise enhancement is primarily due to the interaction of wake vortices, with the contribution from the direct interaction between the airfoil trailing-edge surface and the airflow becoming negligible.

4. Conclusions

In this study, the aerodynamic performance of airfoils equipped with Gurney flaps and combined leading- and trailing-edge flaps was analyzed using the delayed detached eddy simulation (DDES) technique. Furthermore, to better understand the effects of these two flow control strategies on the acoustic environment surrounding the airfoil, a comparative analysis was conducted focusing on the directivity of sound pressure levels, noise spectra, vorticity distributions around the airfoil and surface sound pressure level contours. The main conclusions drawn from this investigation are summarized as follows:
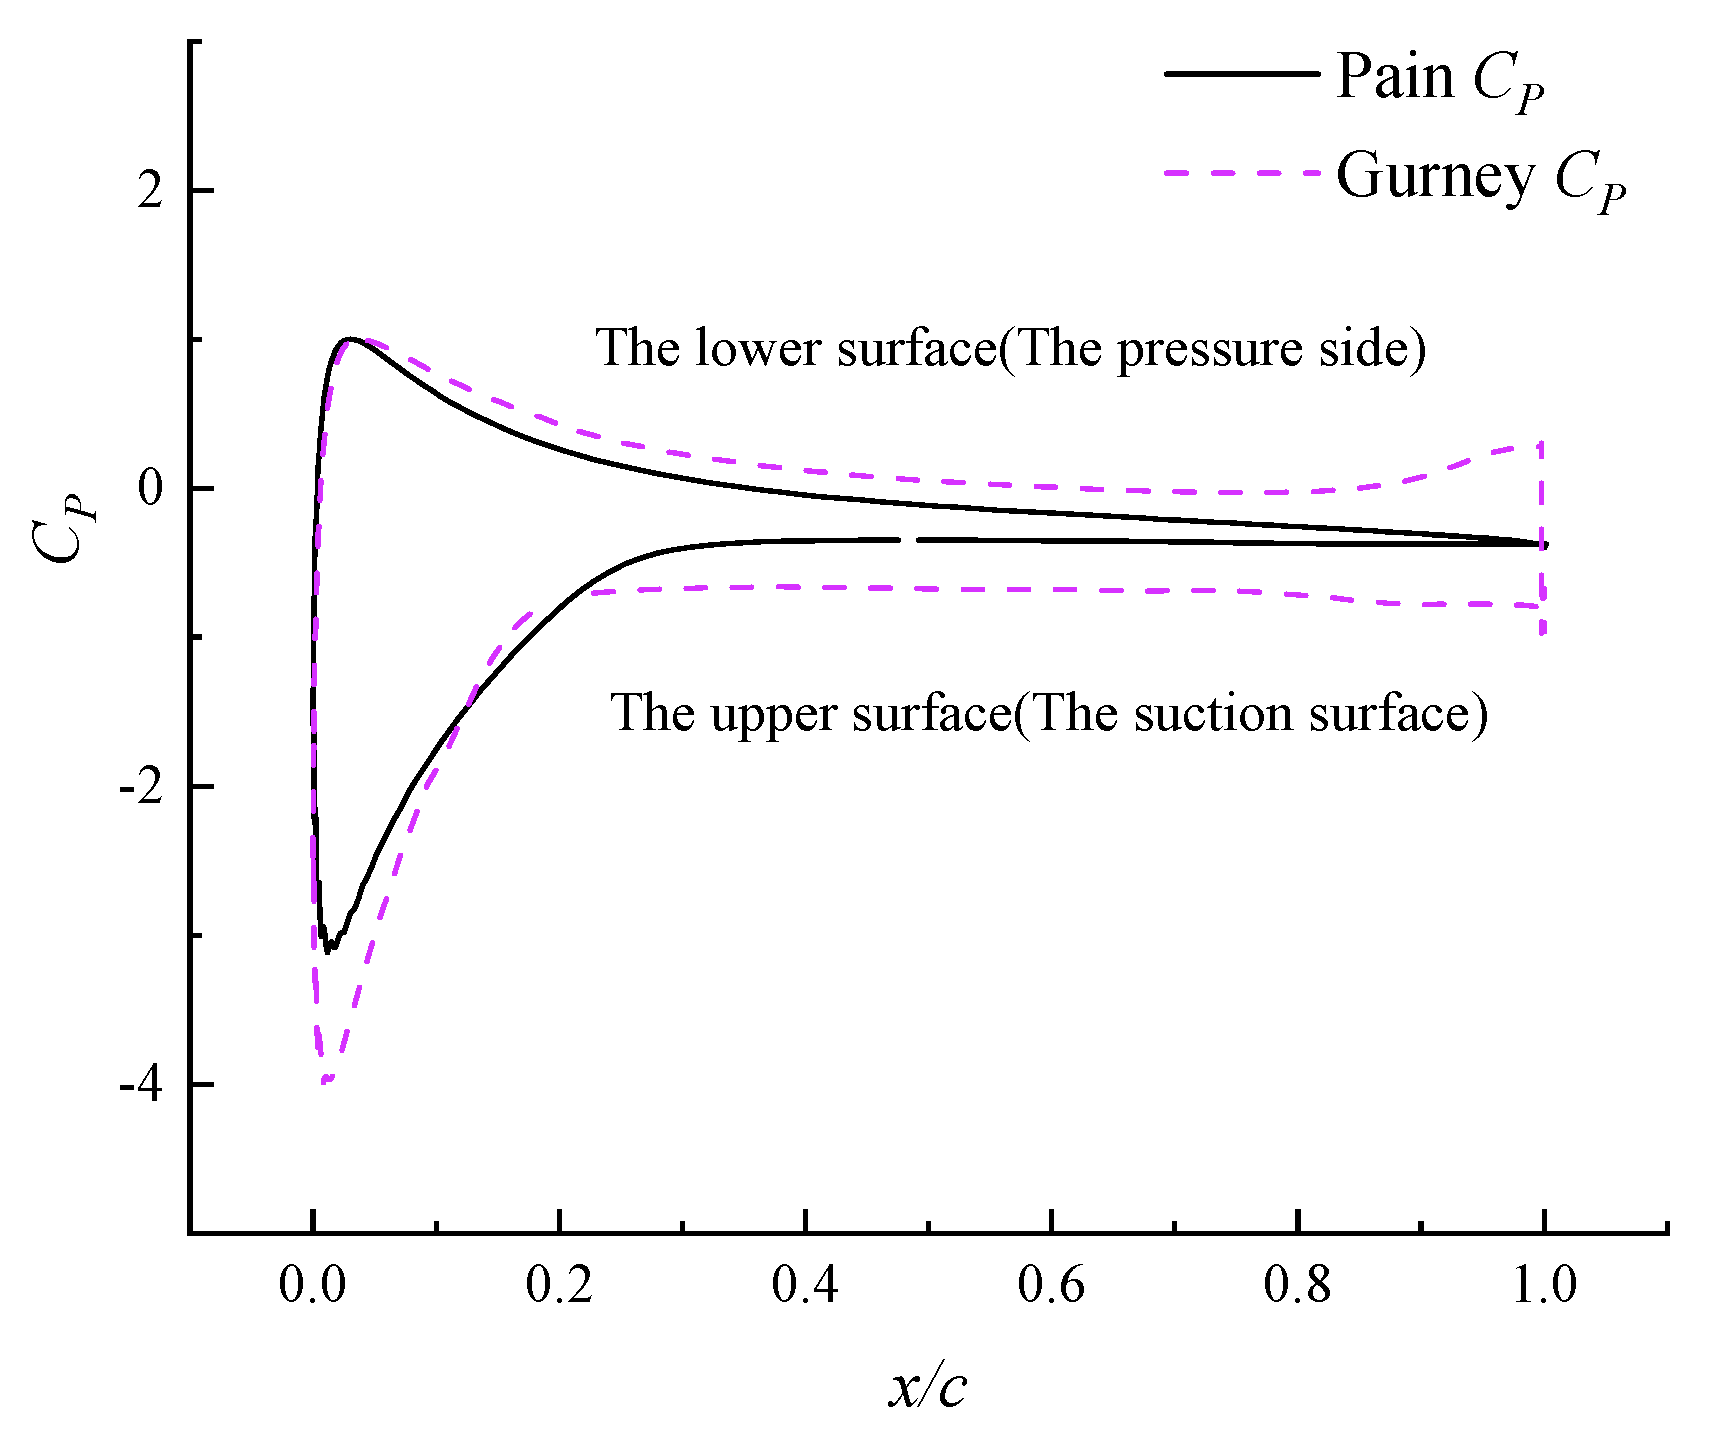
  • At an angle of attack of 20°, numerical simulations show that both the Gurney flap airfoil and the leading- and trailing-edge flap airfoil exhibit significant improvements in lift and drag compared to the baseline airfoil. The Gurney flap notably enhances lift with minimal change in drag, resulting in a substantial increase in lift-to-drag ratio. For the airfoil with leading- and trailing-edge flaps, both lift and drag increase considerably, but the lift-to-drag ratio also shows a moderate improvement. The surface pressure coefficient distributions further reveal that the installation of Gurney flaps and leading- and trailing-edge flaps leads to a marked increase in suction-side pressure, thereby contributing to the enhancement of lift.
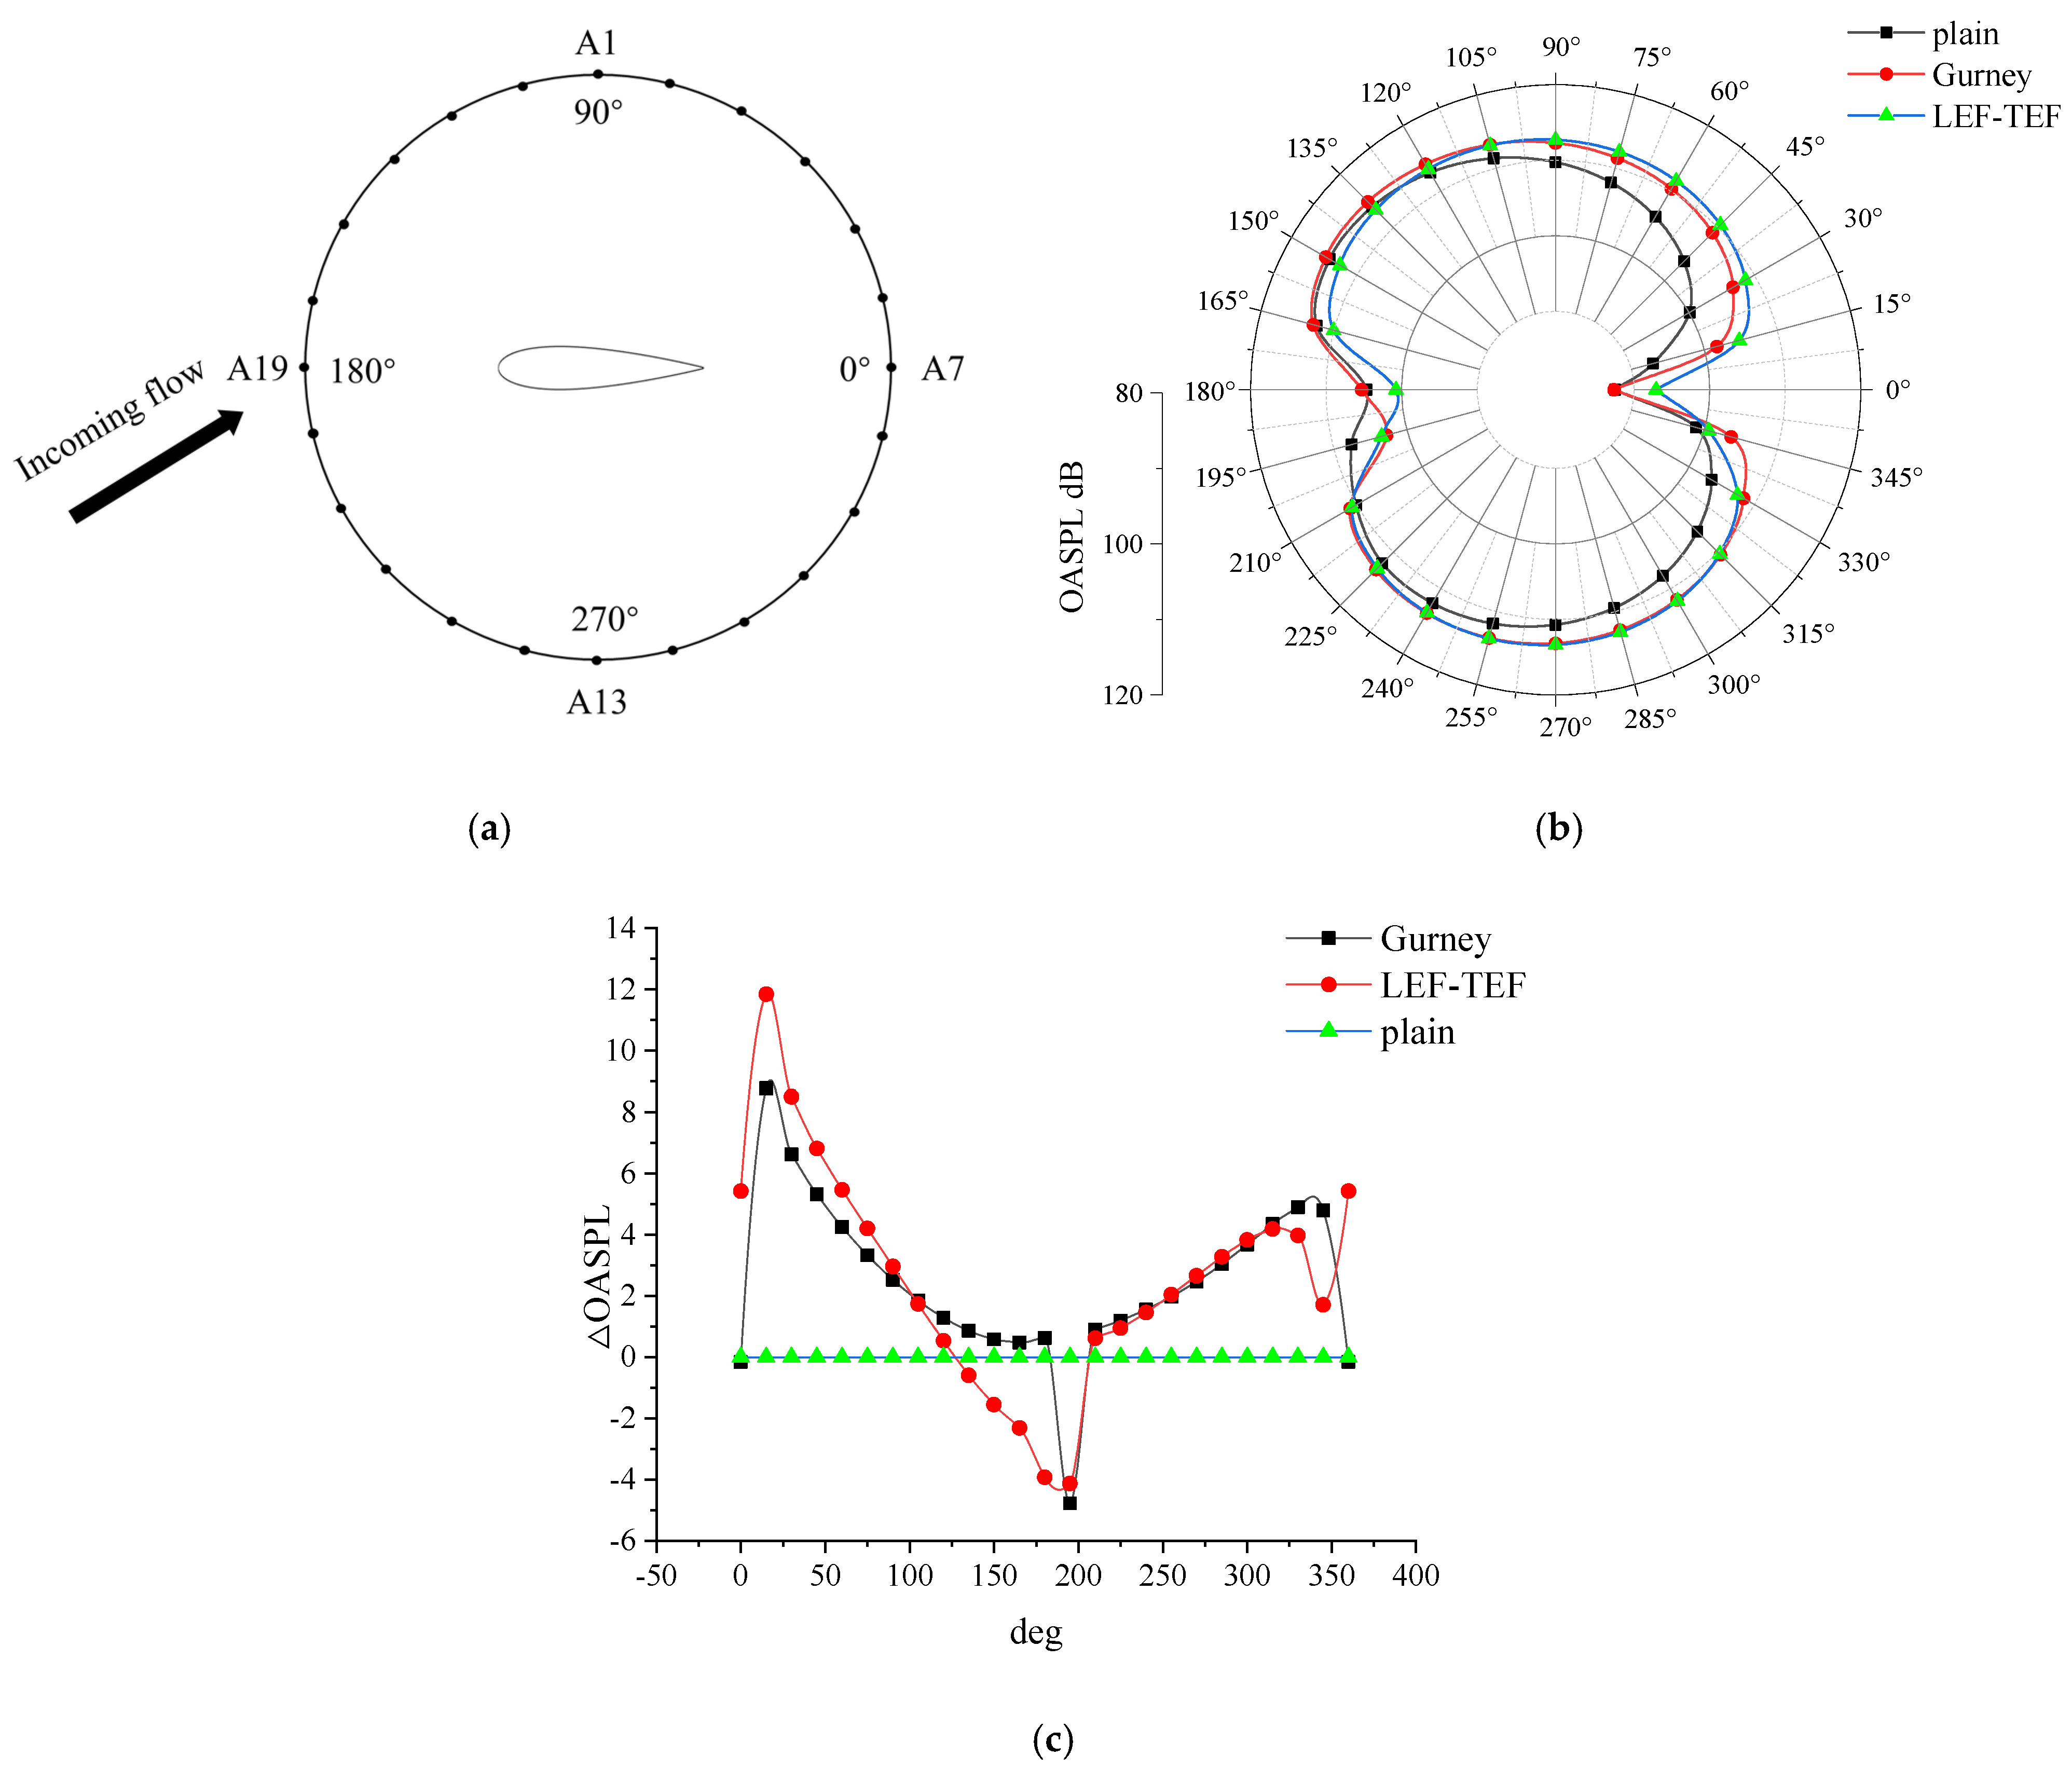
  • In terms of spatial radiation characteristics, compared to the baseline airfoil, the Gurney flap airfoil shows a slight reduction of 0.15 dB in overall sound pressure level (OASPL) at the trailing edge (0° azimuth) and a slight increase of 0.63 dB at the leading edge (180° azimuth), indicating minimal changes at these two positions. However, in the regions between 0 and 90° and 270 and 360° azimuth, the OASPL increases by more than 2.5 dB. For the airfoil equipped with leading- and trailing-edge flaps, the OASPL increases at most azimuthal angles, with a maximum rise of up to 11.8 dB. Nevertheless, in the vicinity of the leading edge, specifically within the 135–195° azimuth range, the maximum reduction in OASPL reaches approximately 4.1 dB. These results suggest that both types of flow control generally lead to increased noise across most azimuthal directions, with the leading- and trailing-edge flap configuration causing a more pronounced noise increase near the trailing edge. However, a noise reduction effect is observed near the leading edge for the airfoil with leading- and trailing-edge flaps, with a maximum noise reduction rate of 4.4%.
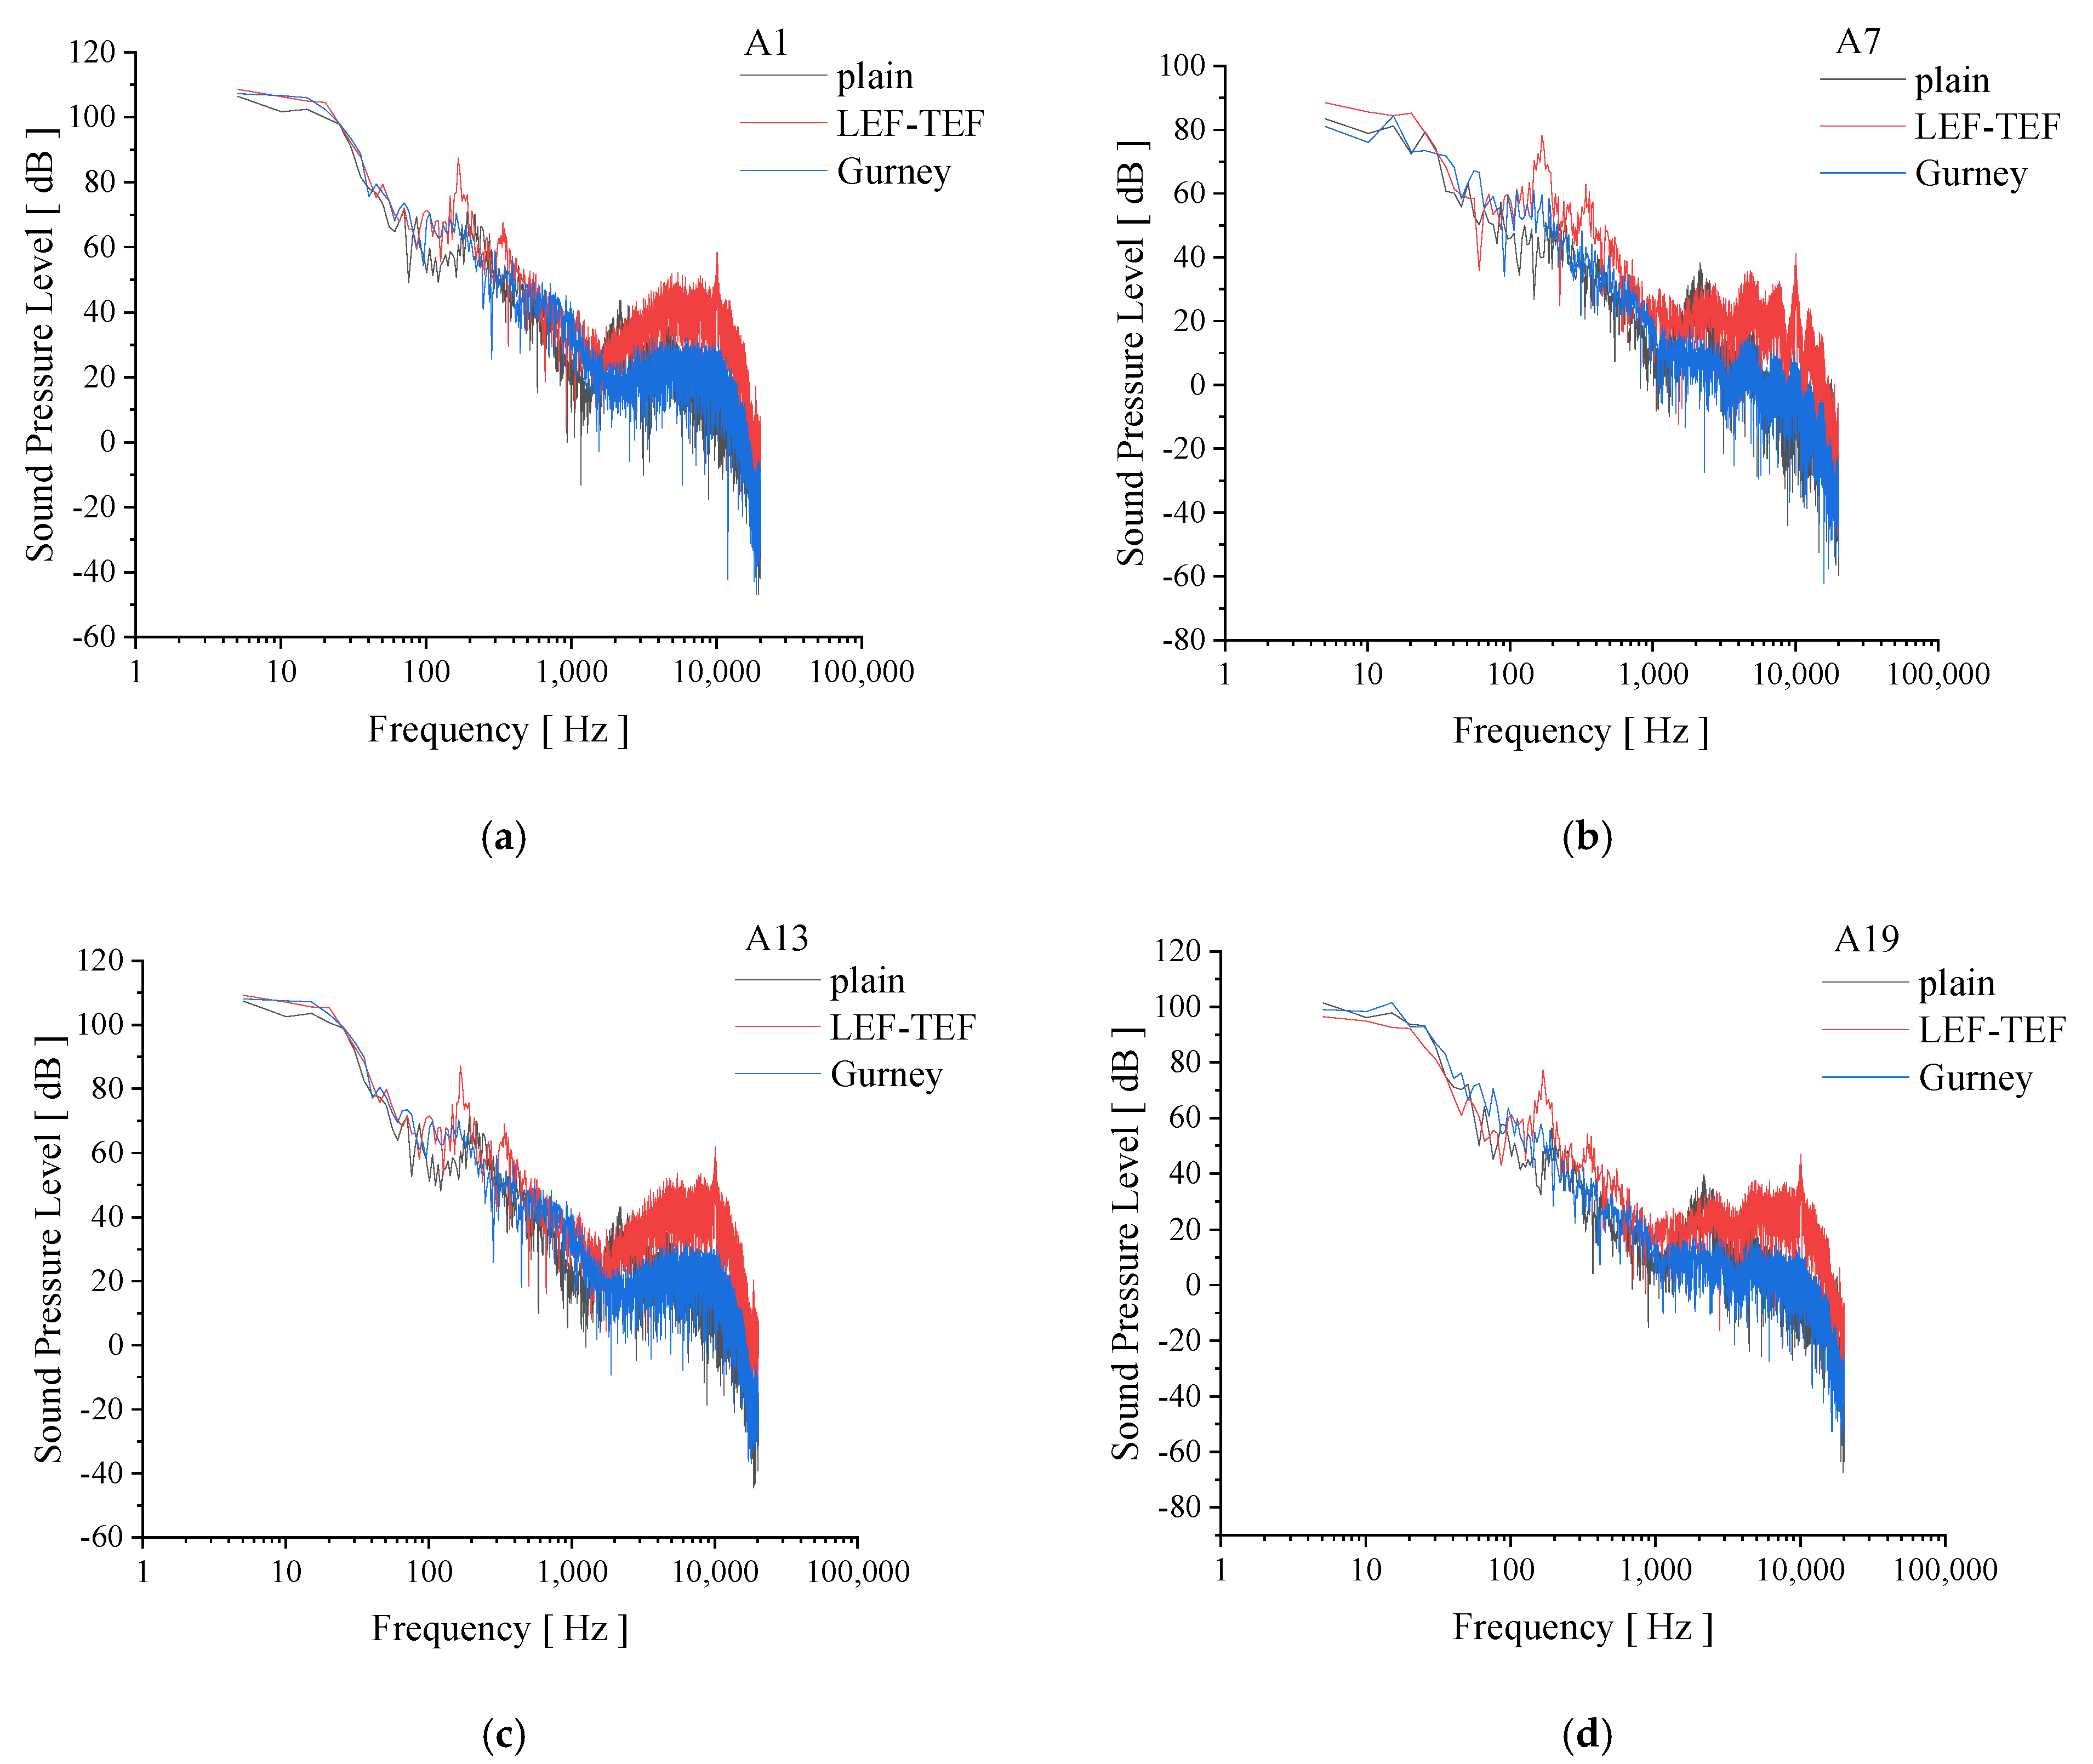
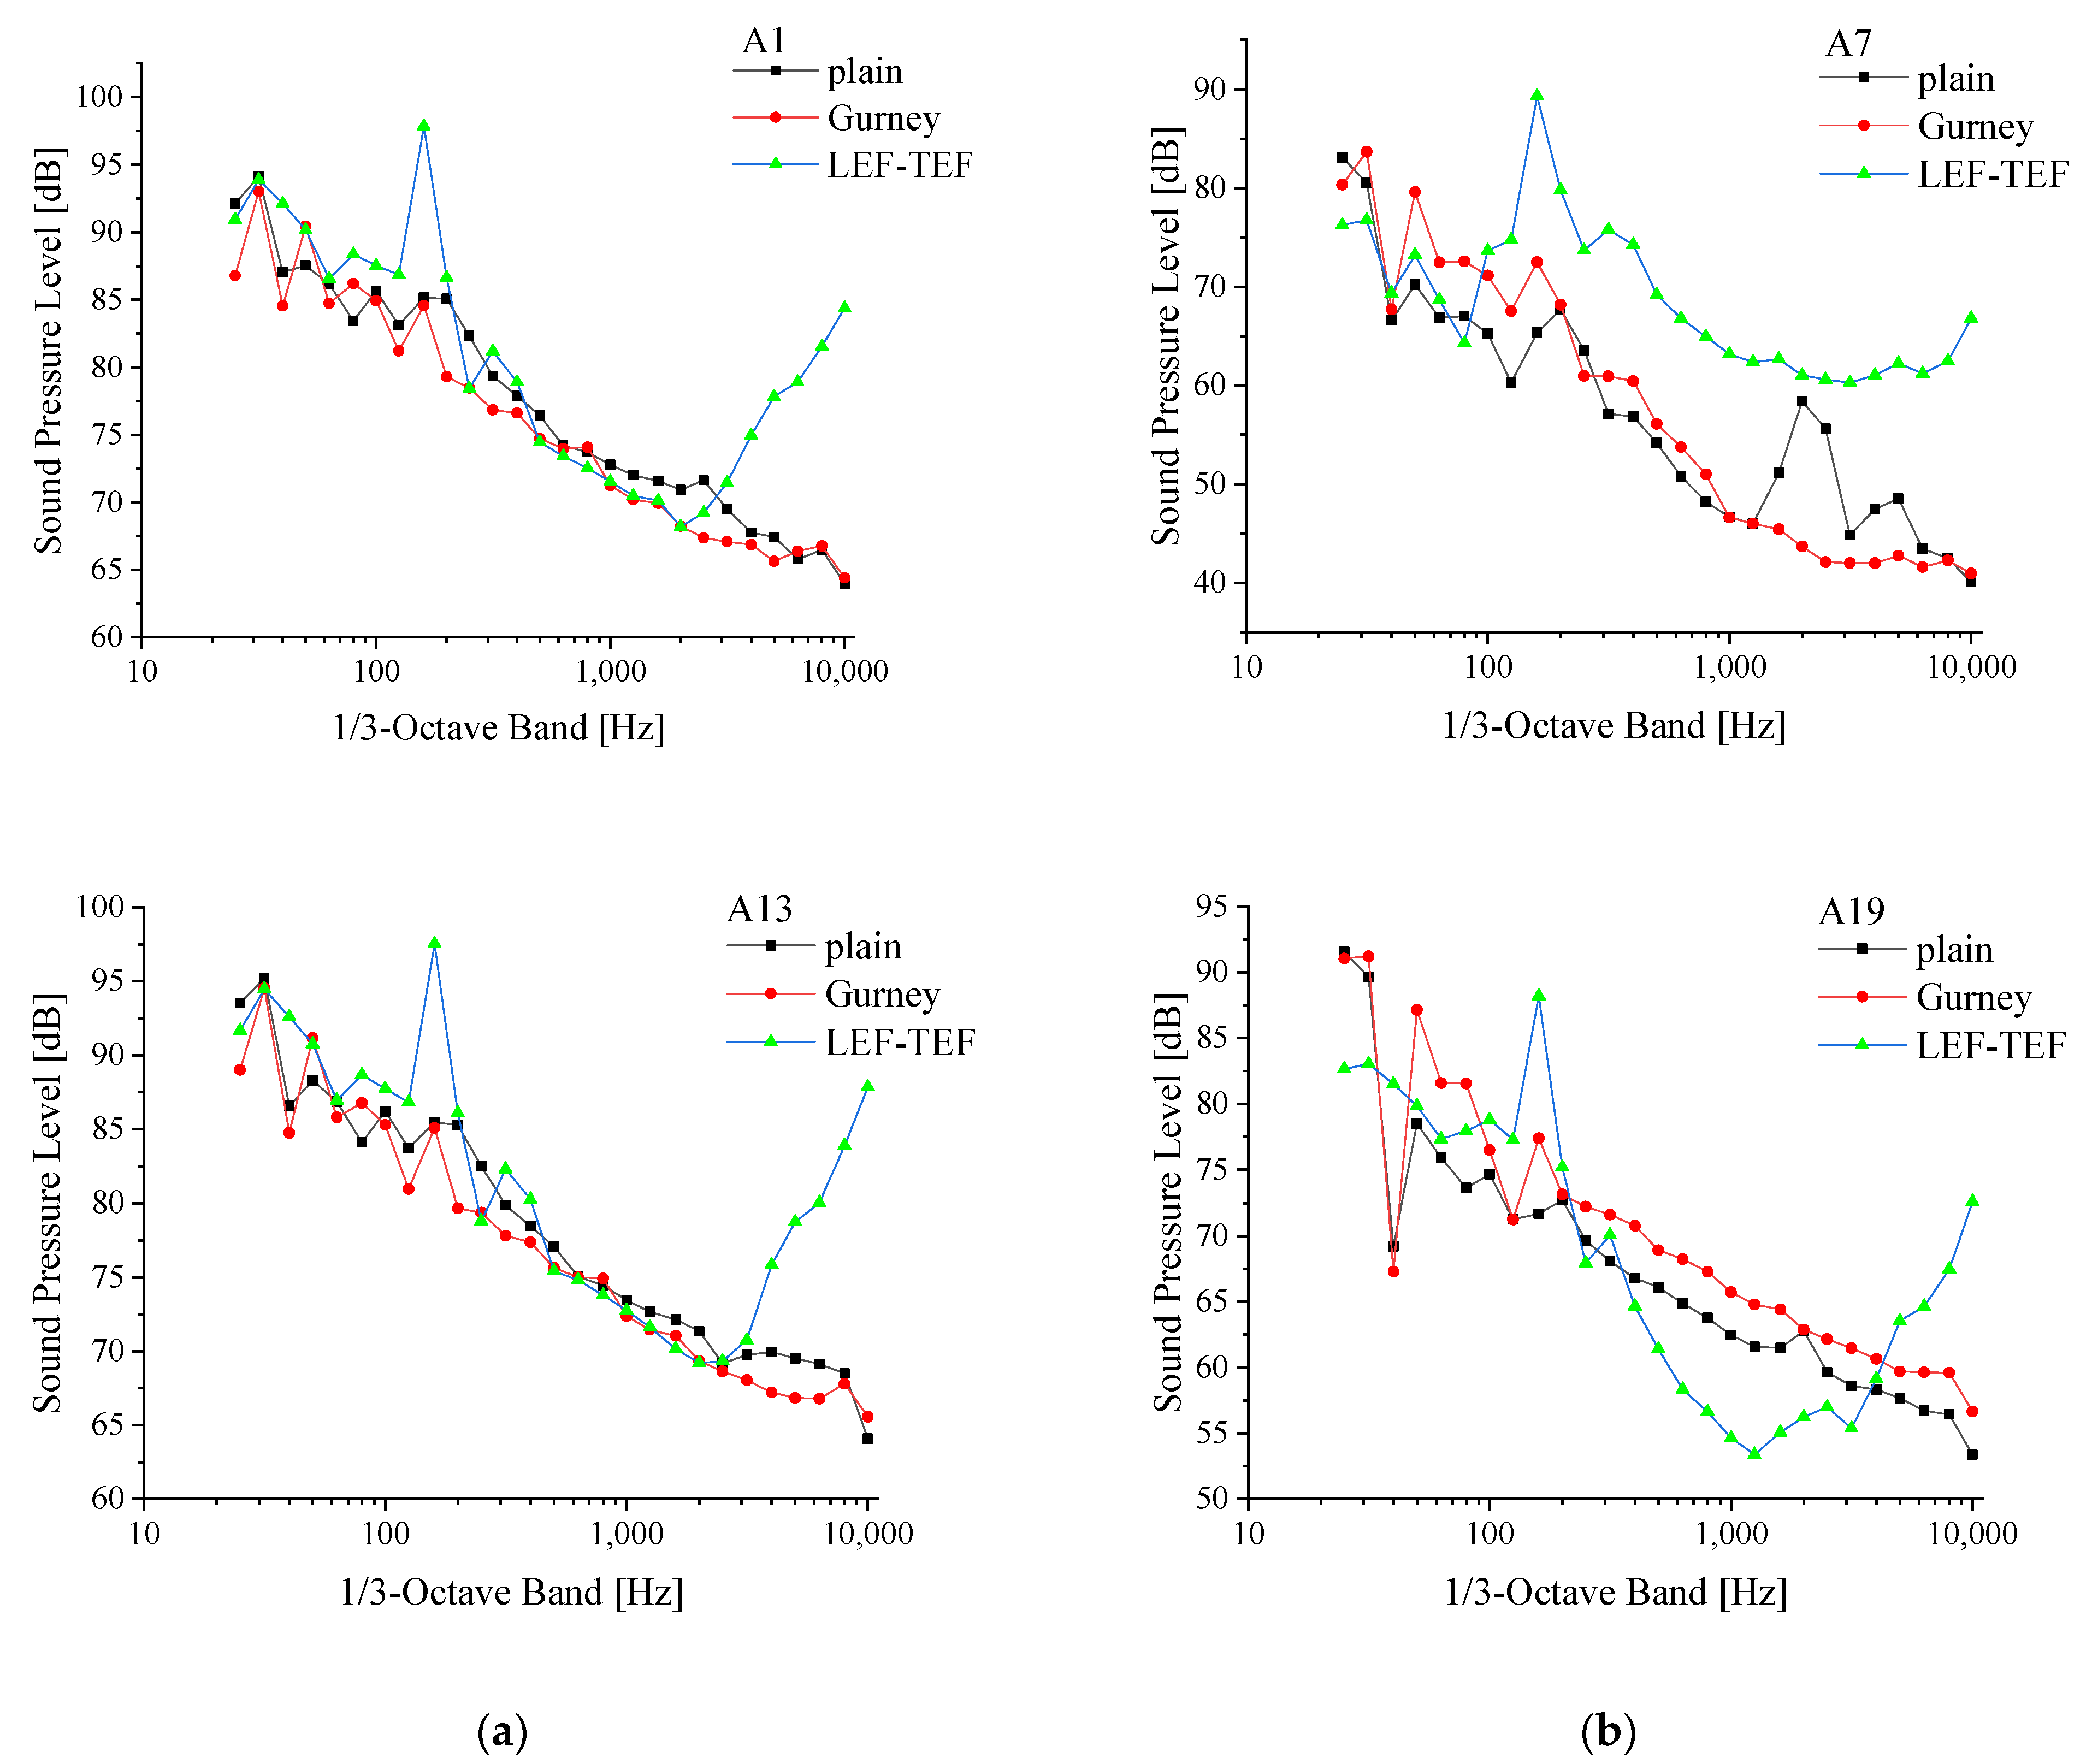
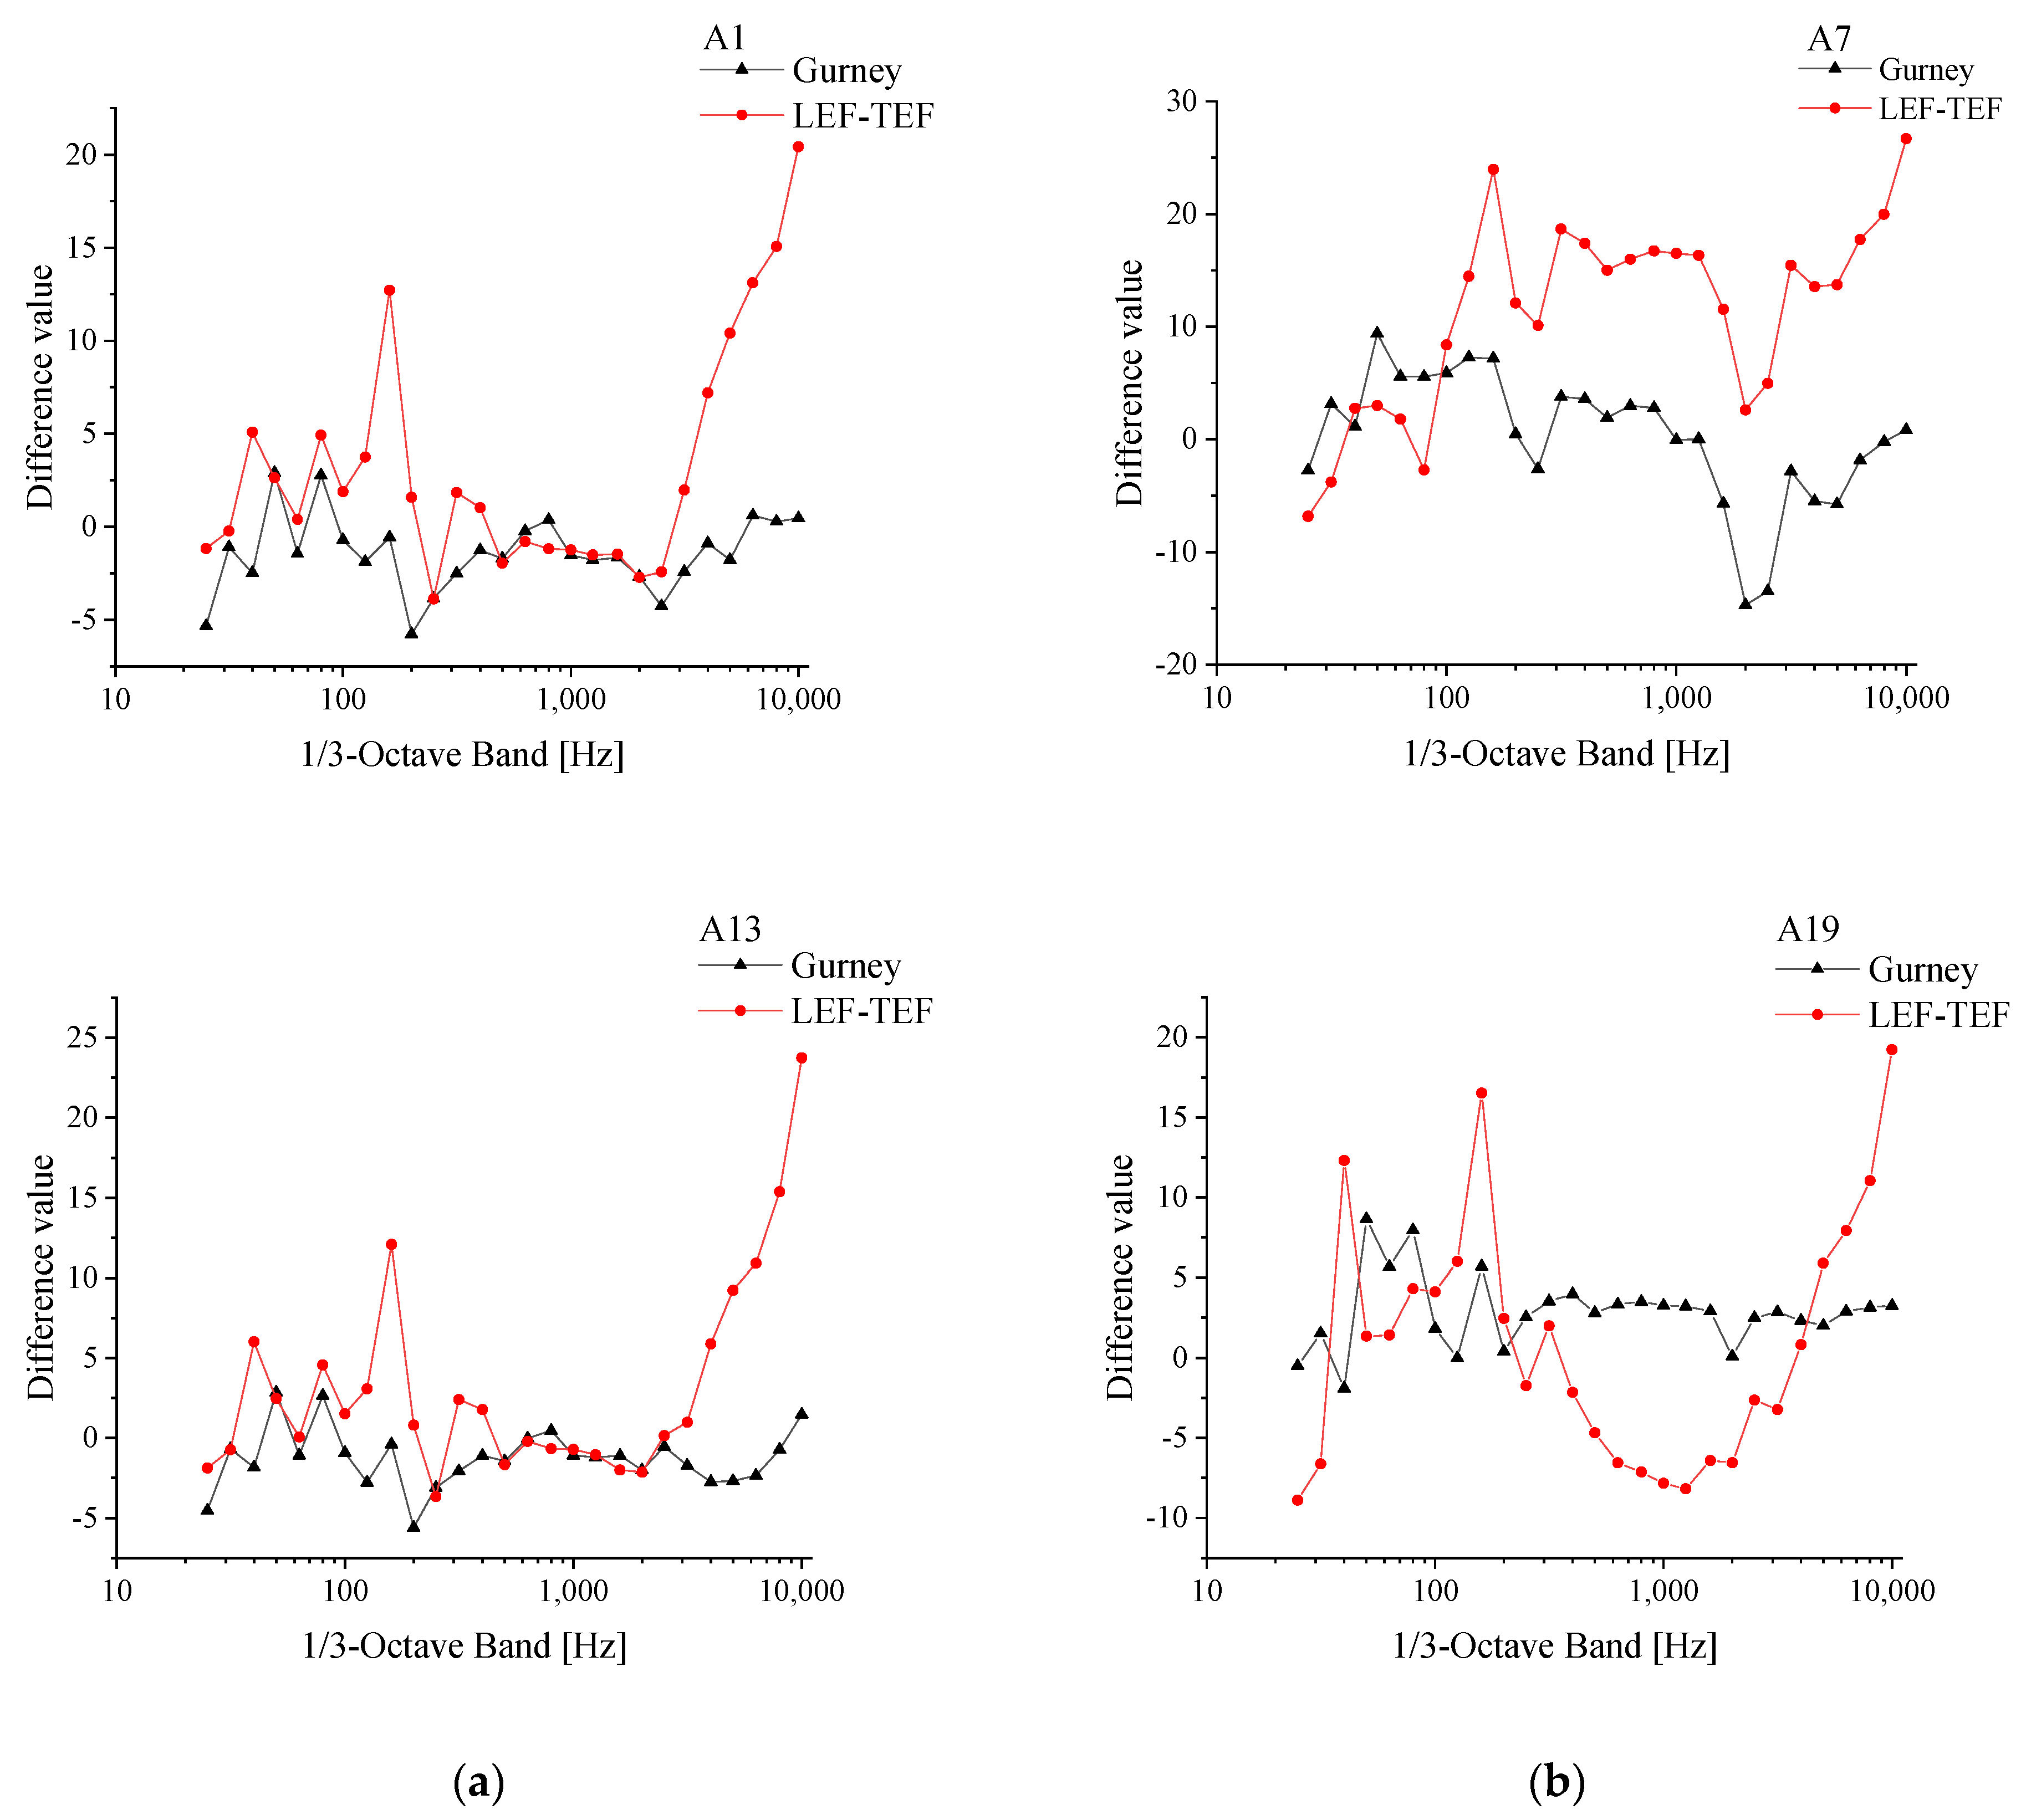
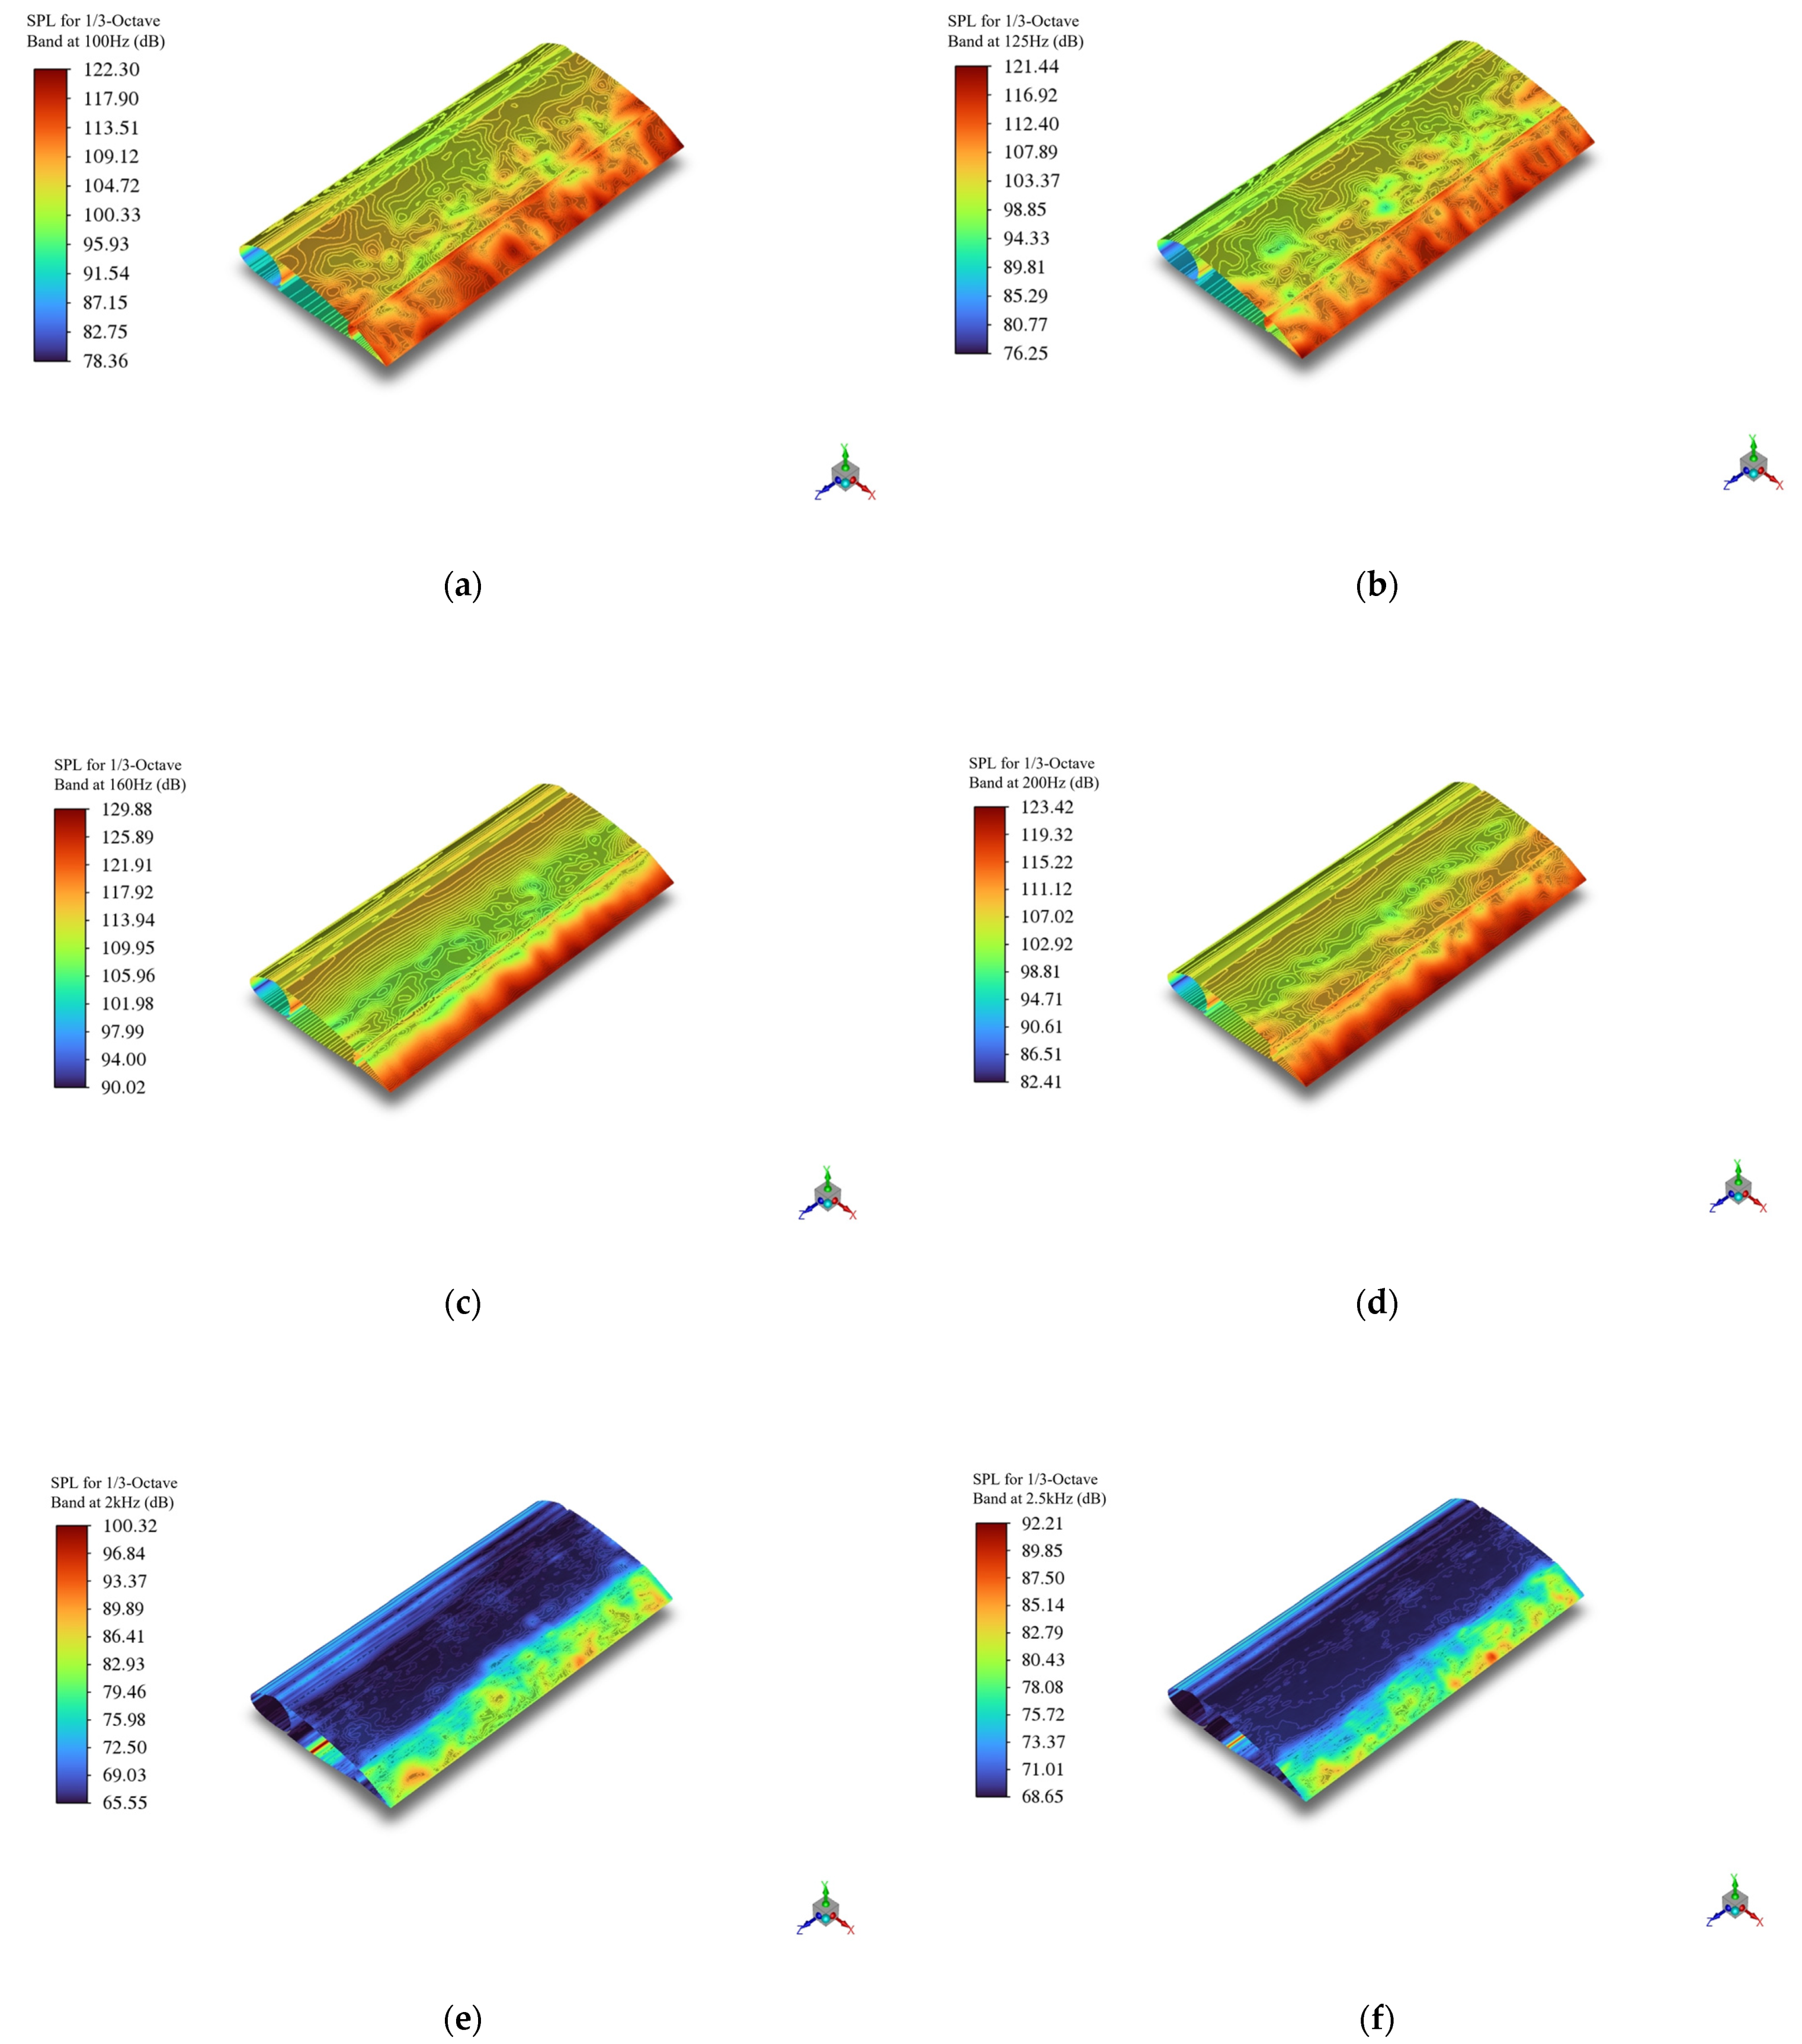
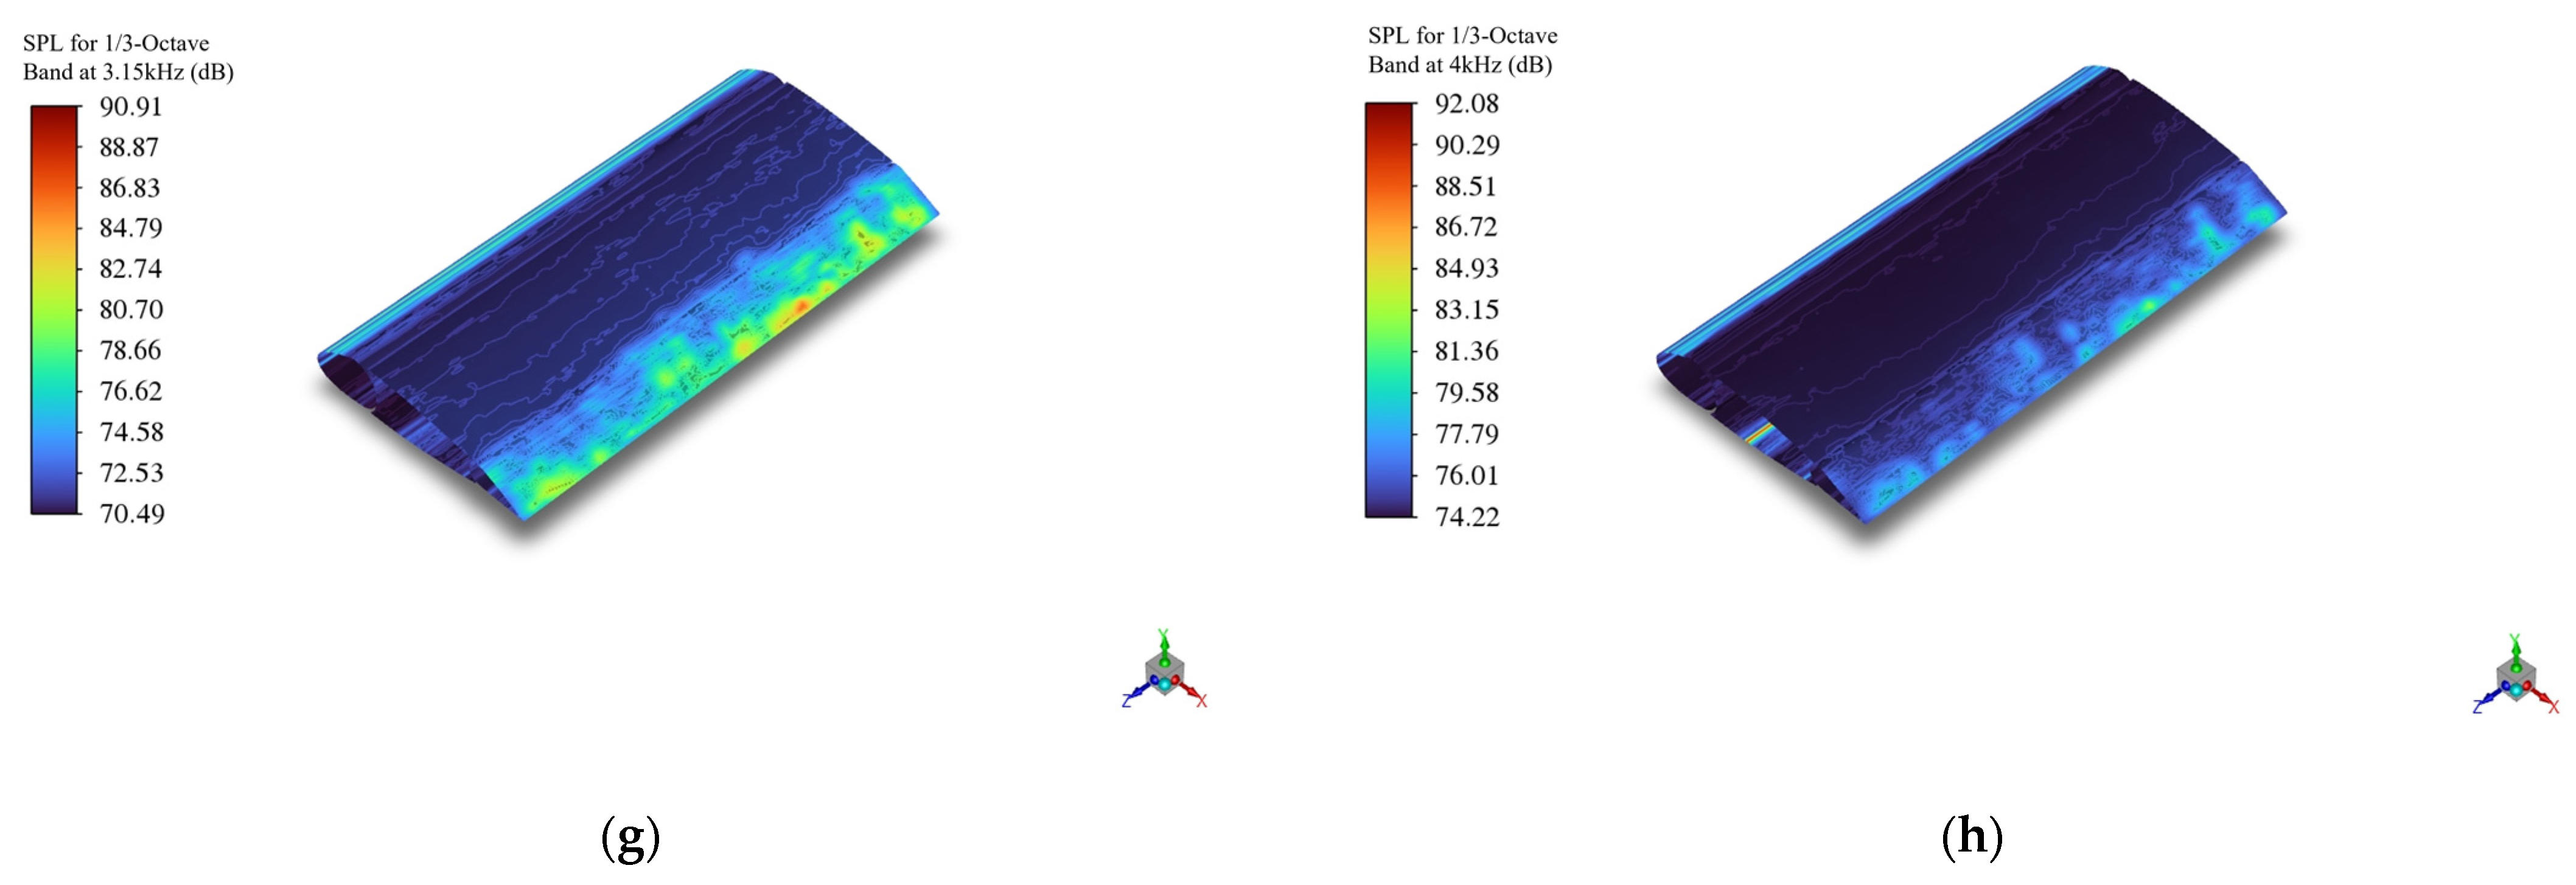
  • At an azimuthal angle of 0°, within the low- to mid-frequency range (25–1250 Hz), the Gurney flap airfoil exhibits higher sound pressure levels than the baseline airfoil across most frequencies, with a maximum increase of 9.4 dB observed at 50 Hz. In the mid- to high-frequency range (1250–10,000 Hz), the Gurney flap airfoil shows higher sound pressure only at 10,000 Hz, where it exceeds the baseline by 0.85 dB; at all other frequencies, it exhibits lower sound pressure levels, with a maximum reduction of 14.7 dB at 2000 Hz. This indicates that near the trailing edge, the Gurney flap has a positive effect in suppressing noise in the mid- to high-frequency range. At an azimuthal angle of 180°, within the mid- to high-frequency range (400–3150 Hz), the baseline airfoil displays higher sound pressure levels compared to the airfoil with leading- and trailing-edge flaps, with a maximum increase of 8.19 dB at 1250 Hz. This suggests that near the leading edge, the combined leading- and trailing-edge flaps are effective in suppressing noise within the mid- to high-frequency range.
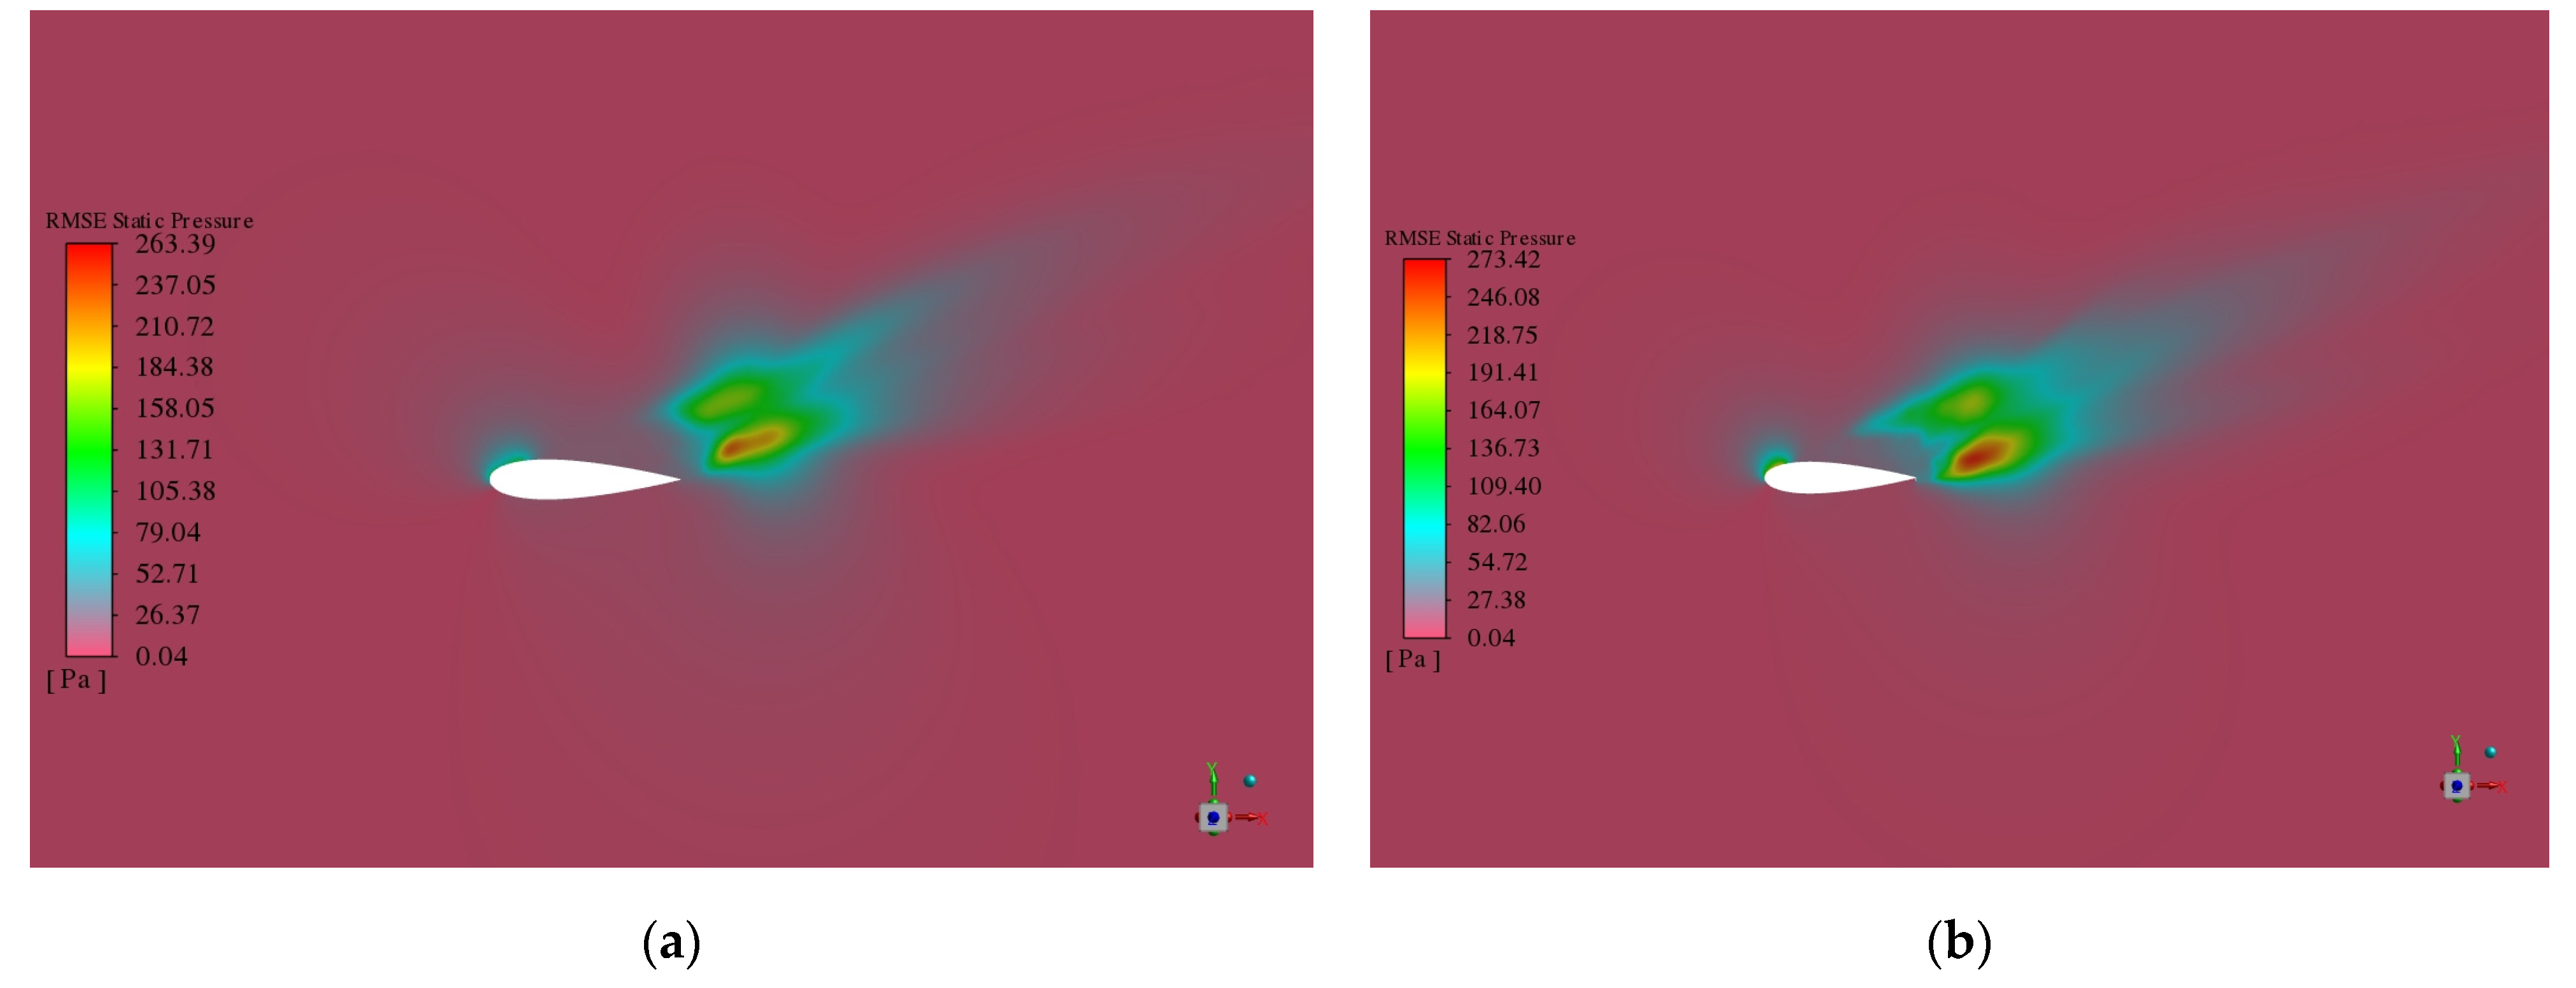
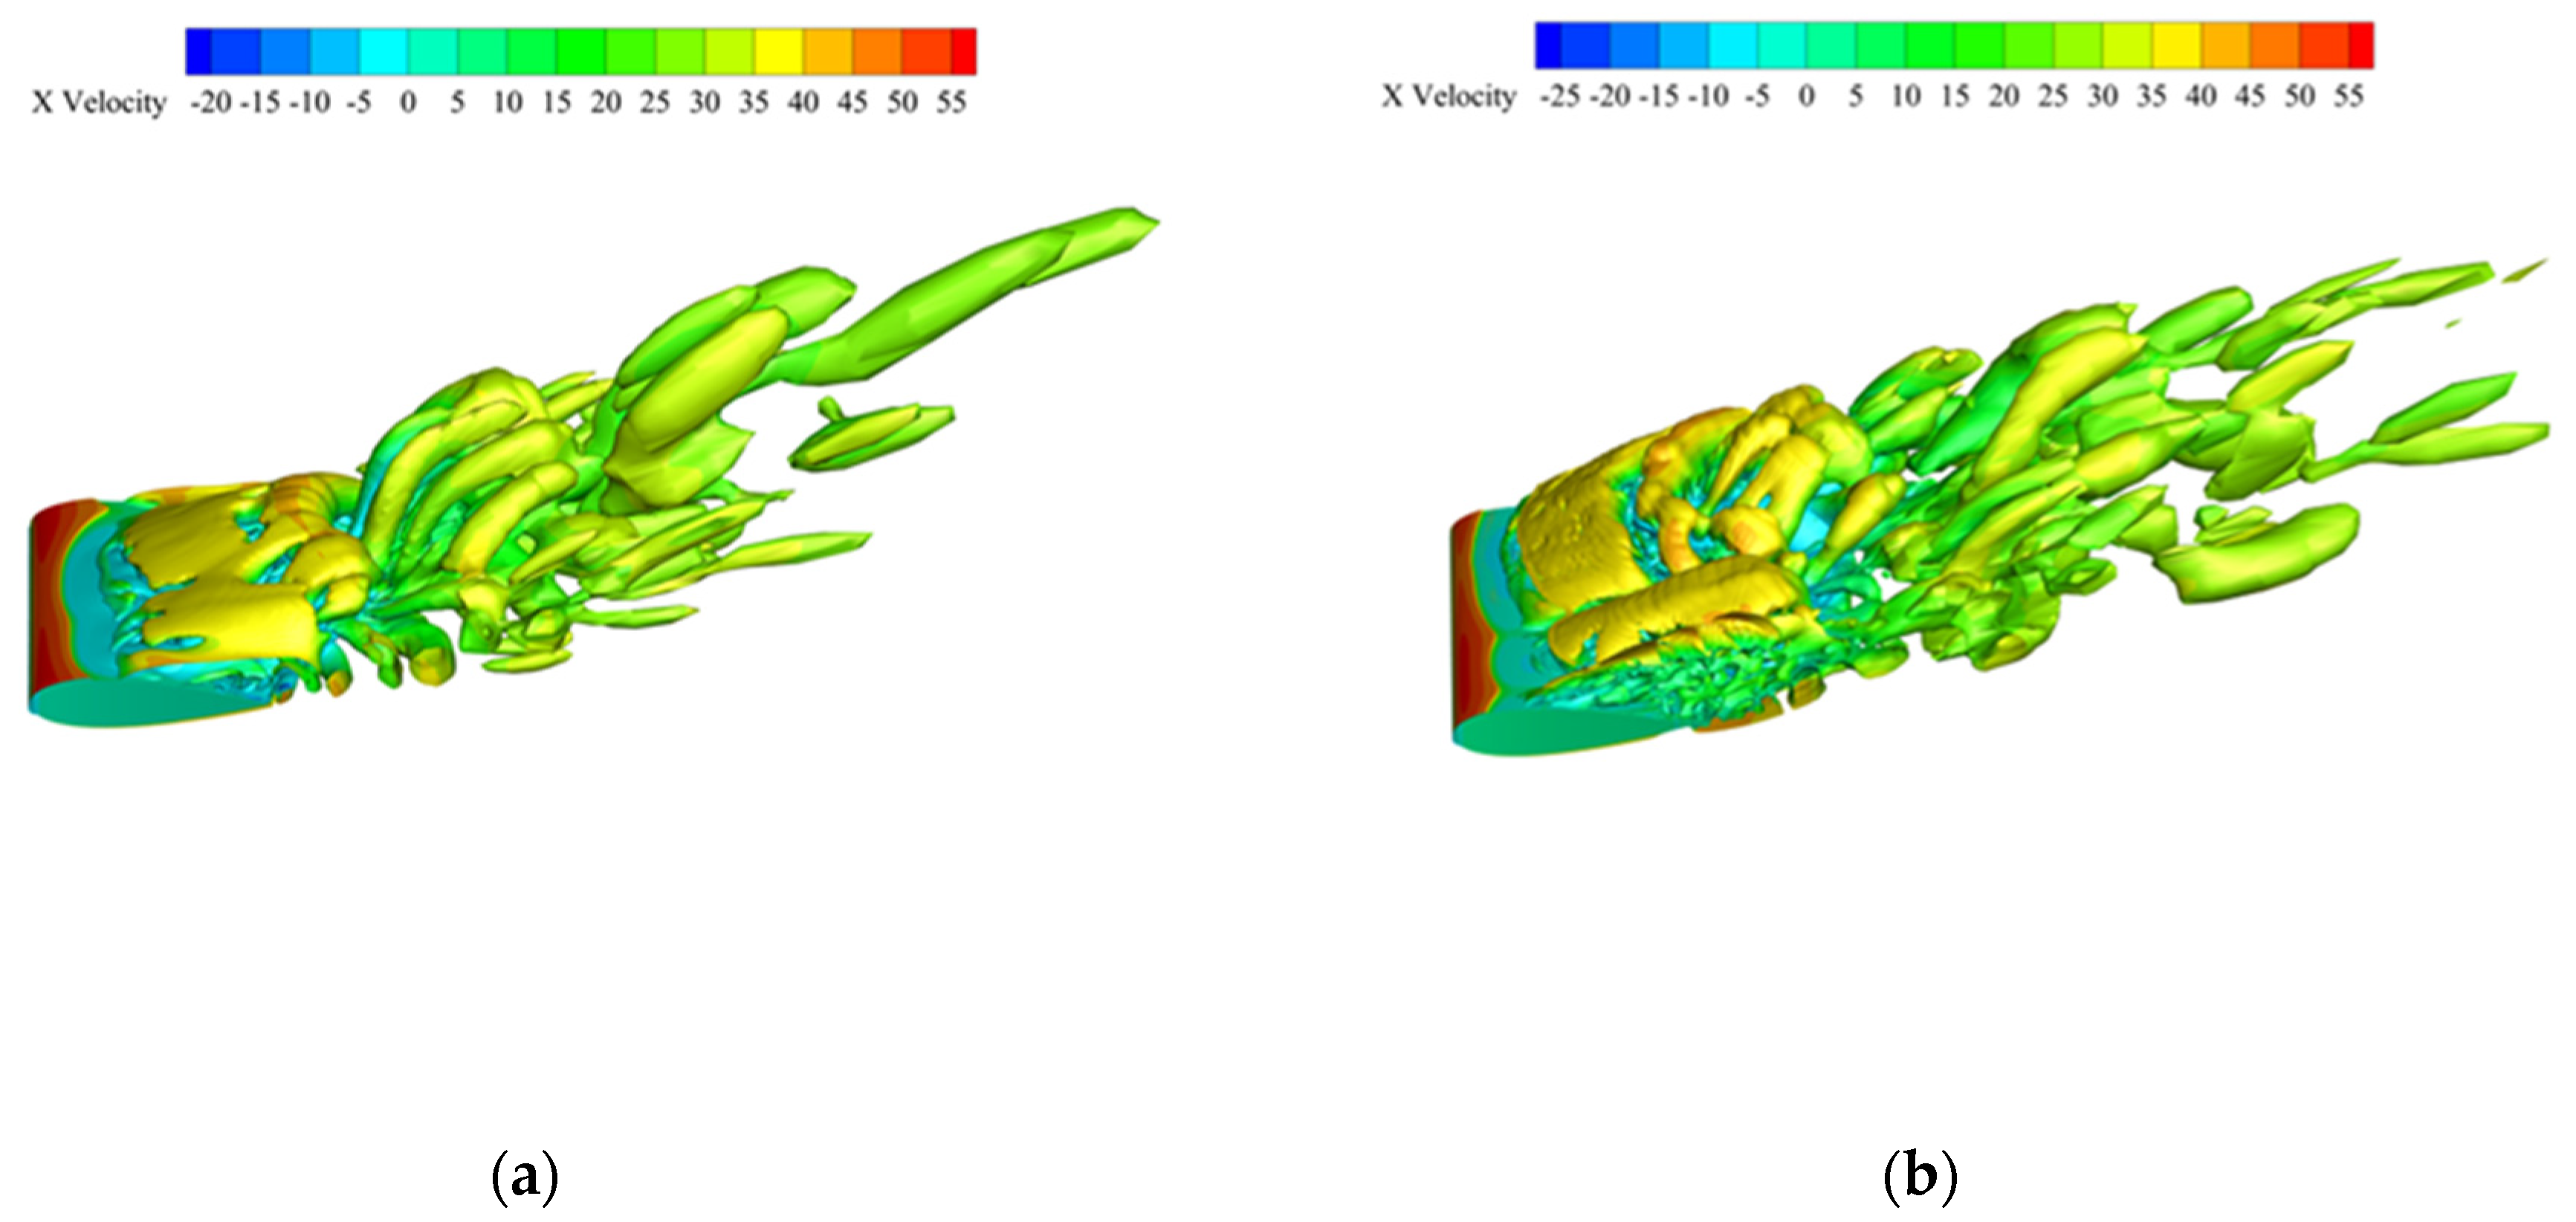
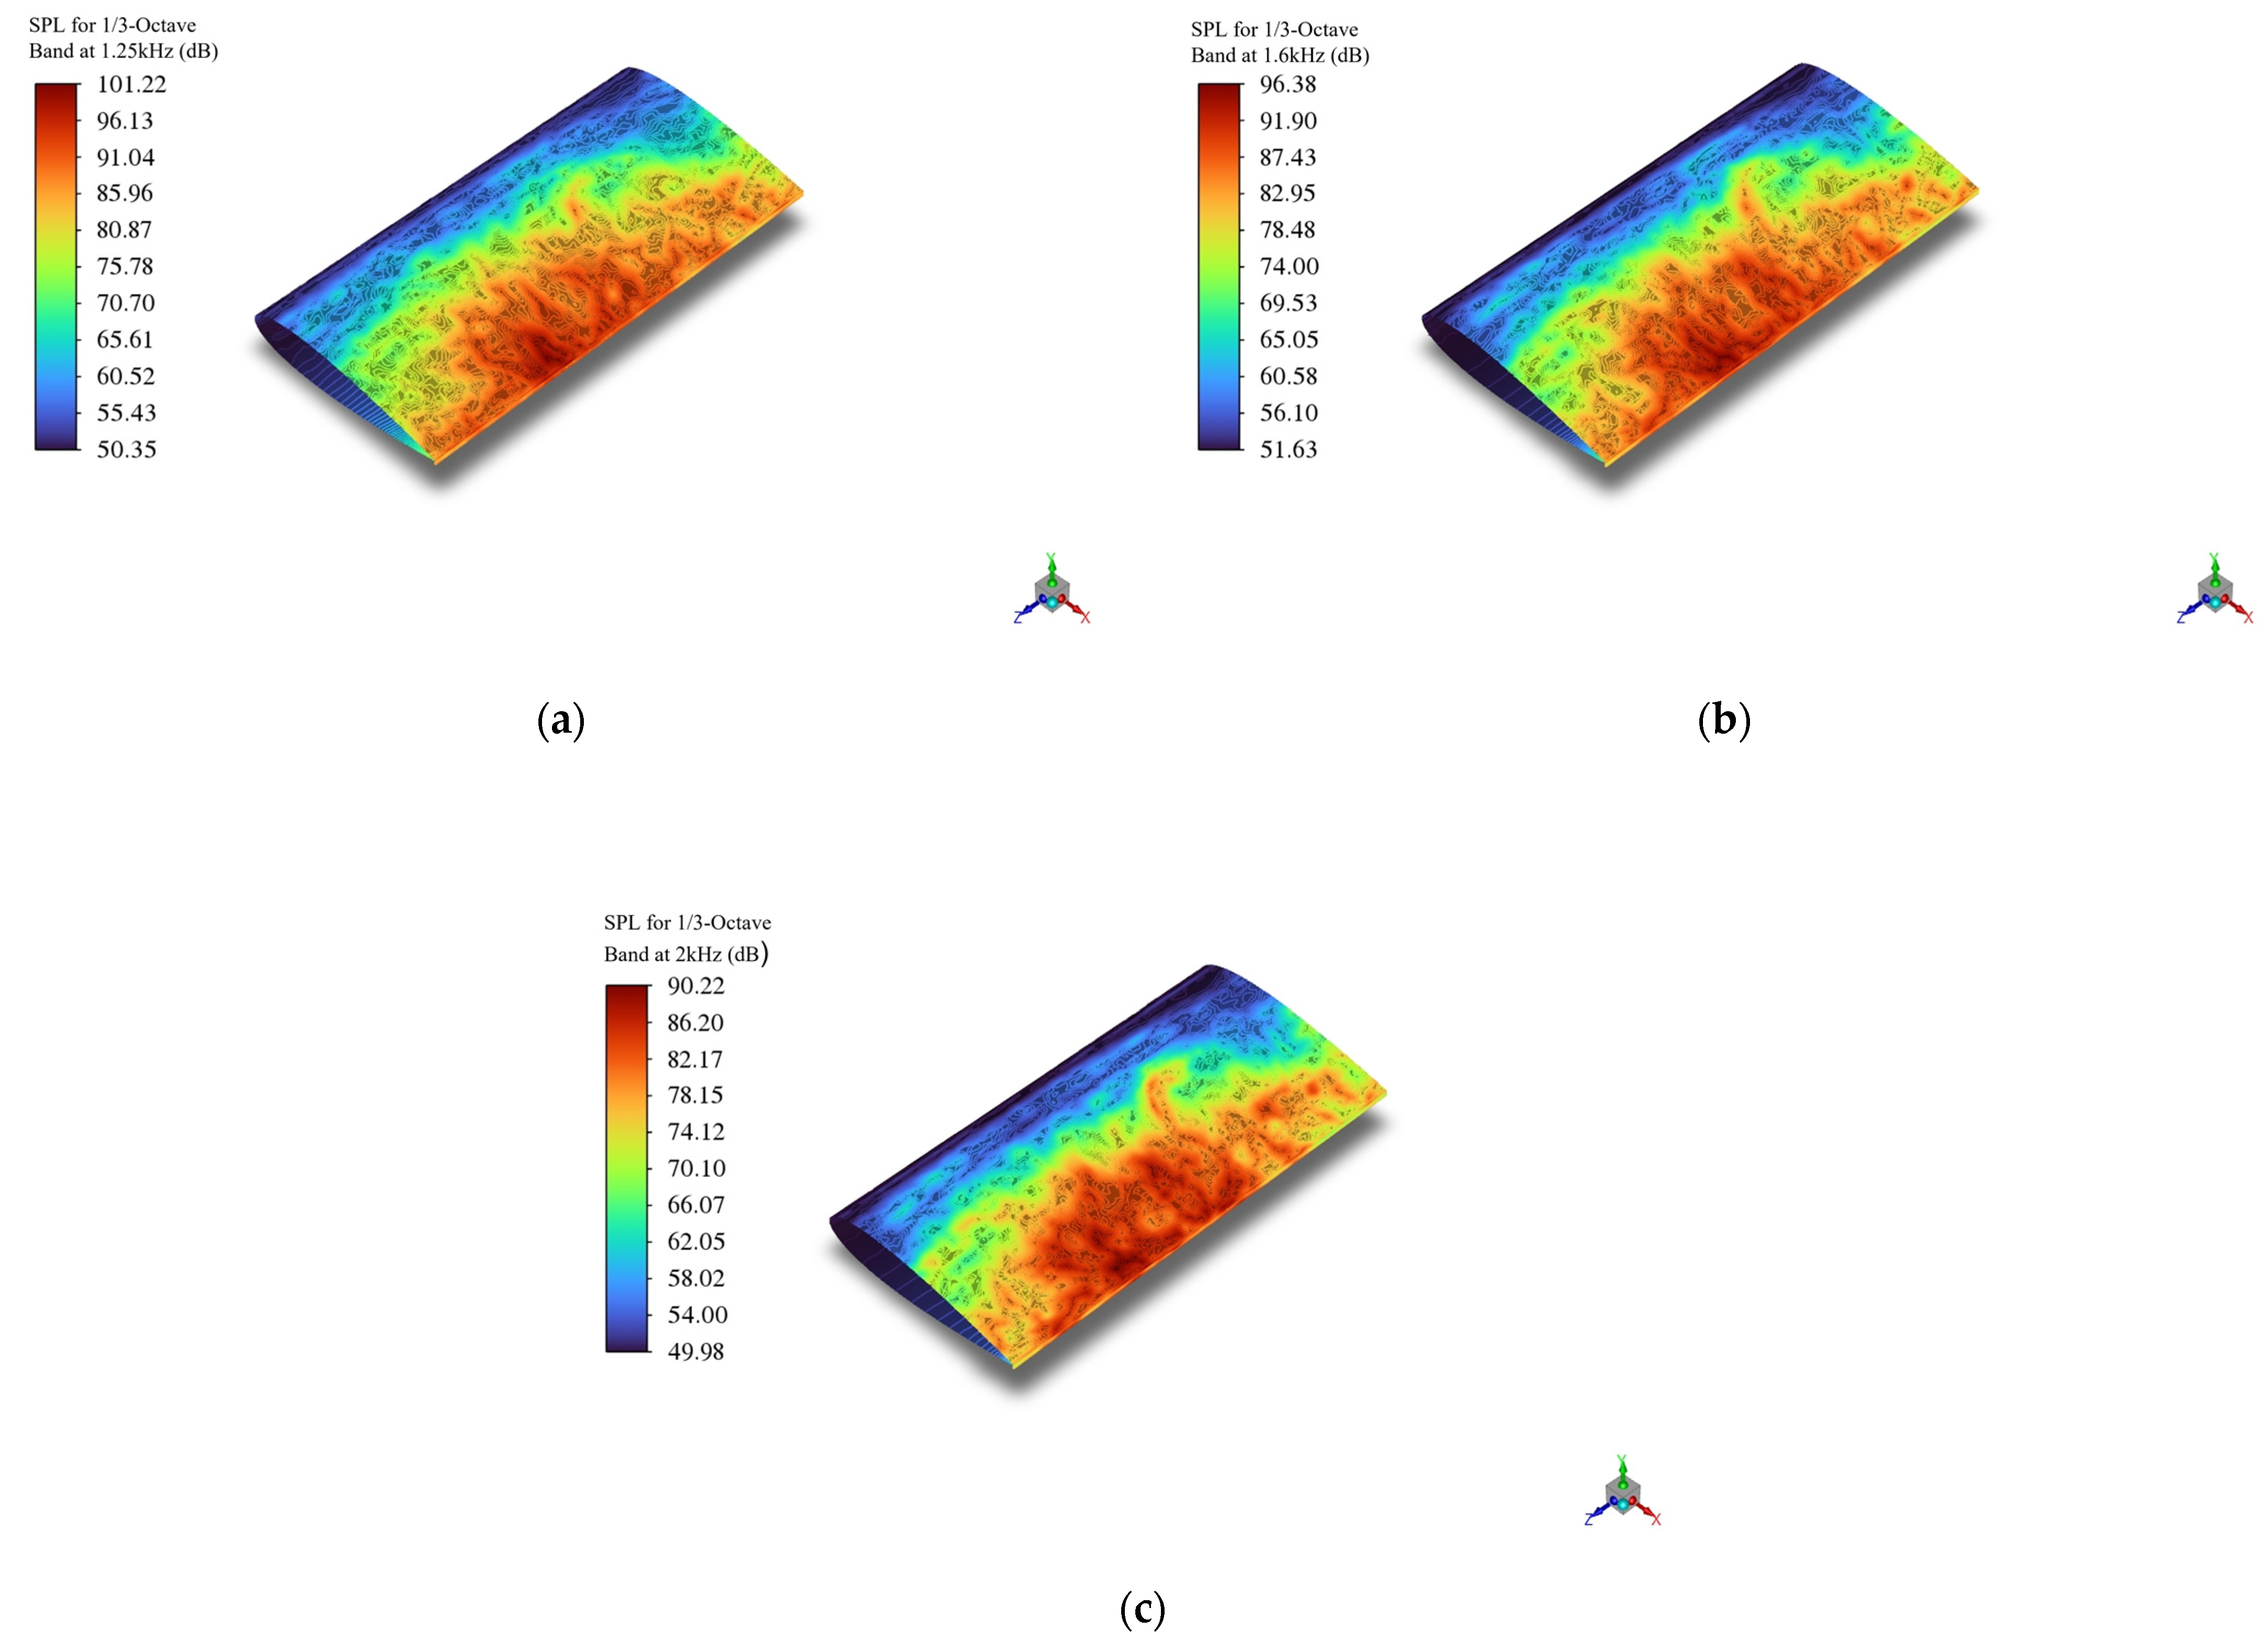
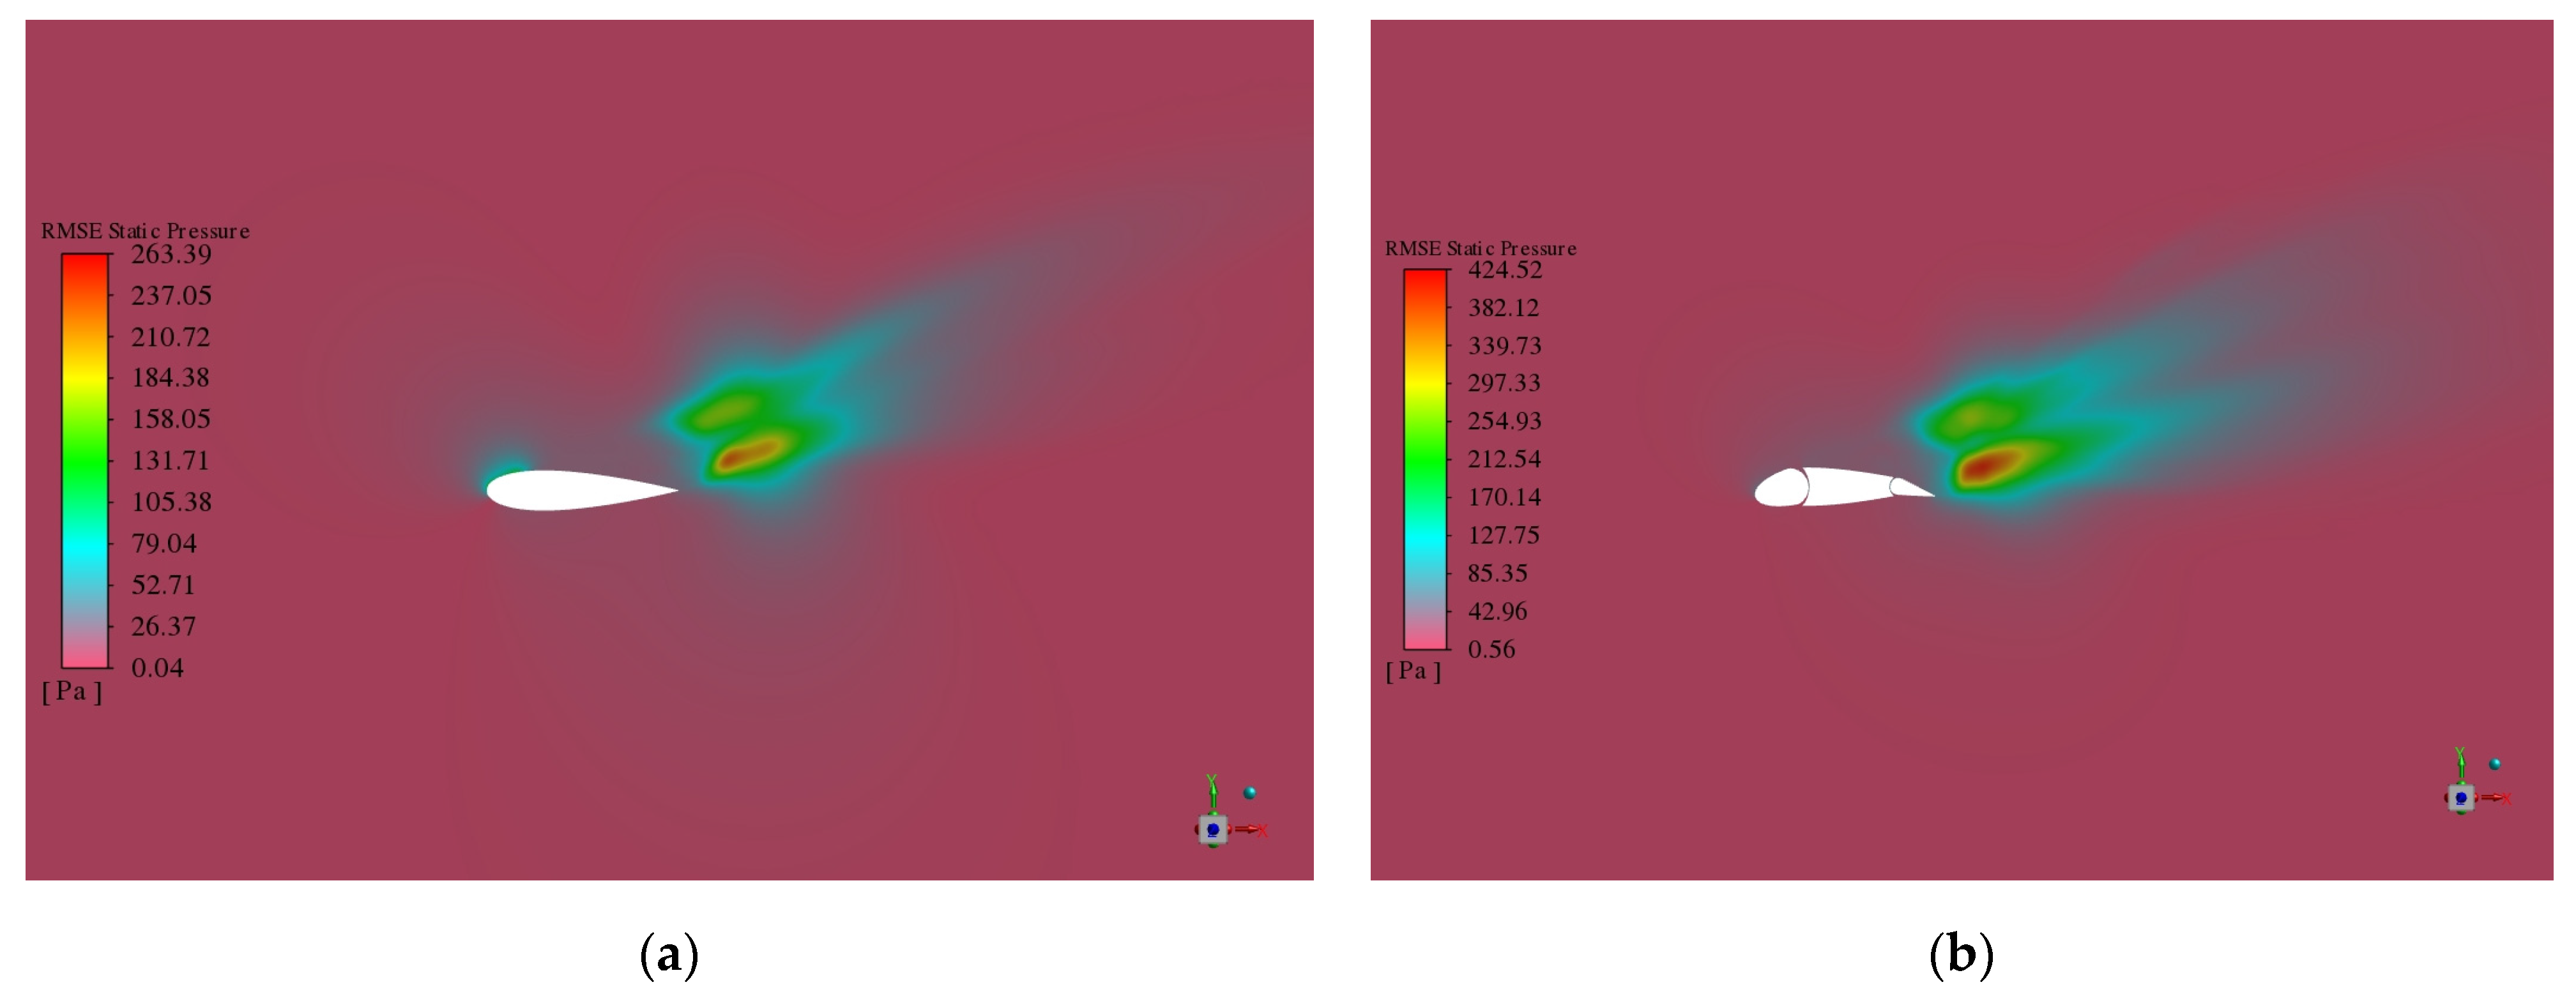
  • The pressure fluctuations in the flow field and the surface sound pressure level (SPL) contours of the airfoil were analyzed to better understand the mechanisms by which the two flow control strategies influence noise generation. For the Gurney flap airfoil, the distribution range of peak pressure fluctuations near the trailing edge at 0° azimuth and near the leading edge at 180° azimuth is larger compared to the baseline airfoil. At the trailing edge, noise is mainly generated by the interaction between the airfoil surface and the airflow, constituting the primary source of noise. The presence of the Gurney flap leads to finer and more fragmented wake vortices, thereby reducing the noise contribution from wake vortex interactions within this frequency range. In contrast, for the airfoil equipped with combined leading- and trailing-edge flaps, pressure fluctuations near the leading edge at 180° azimuth are significantly lower than those of the baseline airfoil, resulting in reduced leading-edge noise. However, at the trailing edge, the noise level increases compared to the baseline, with the noise predominantly originating from wake vortex interactions, while the contribution from the interaction between the airfoil surface and the airflow is relatively minor.
  • By applying two flow controls to the original airfoil, it can be seen that an increase in the airfoil lift-to-drag ratio is accompanied by an increase in noise generation. Since the Gurney flap airfoil enhances the lift resistance ratio much more than the leading- and trailing-edge flap airfoils in this flow condition, and its influence on the noise generation is smaller compared to the leading- and trailing-edge flap airfoils, it is an excellent flow control method for enhancing lift and controlling noise.

Author Contributions

Conceptualization, X.S. and Z.L.; methodology, X.S.; software, Z.L.; validation, Z.L. and K.L.; formal analysis, Z.L.; investigation, K.L.; resources, X.S.; data curation, K.L.; writing—original draft preparation, Z.L.; writing—review and editing, Z.L.; visualization, K.L.; supervision, X.S.; project administration, X.S.; funding acquisition, X.S. All authors have read and agreed to the published version of the manuscript.

Funding

This work was supported by the National Natural Science Foundation of China (no. 52176194).

Data Availability Statement

The raw data supporting the conclusions of this article will be made available by the authors on request.

Conflicts of Interest

The authors declare no conflicts of interest.

References

  1. Frankhouser, M.W.; Gregory, J.W. Nanosecond Dielectric Barrier Discharge Plasma Actuator Flow Control of Compressible Dynamic Stall. In Proceedings of the 46th AIAA Plasmadynamics and Lasers Conference, Dallas, TX, USA, 22–26 June 2015. [Google Scholar]
  2. Maruta, Y.; Kotake, S. Separated Flow Noise of a Flat Plate at Large Attack Angles. J. Sound Vib. 1983, 89, 335–357. [Google Scholar] [CrossRef]
  3. Wang, T.; Tian, L.; Zhong, W.; Wang, L.; Zhu, C. Advances in Aerodynamic Research for Wind Energy Utilization I: Aerodynamic Characteristics of Wind Turbines. J. Aerodyn. 2022, 40, 1–21. [Google Scholar]
  4. Choi, H.; Jeon, W.-P.; Kim, J. Control of Flow Over a Bluff Body. Annu. Rev. Fluid Mech. 2008, 40, 113–139. [Google Scholar] [CrossRef]
  5. Zhao, Y.H.; Liang, H.; Wang, B. Research Progress on Factors Affecting Airfoil Dynamic Stall and Flow Control. Acta Aerodyn. Sin. 2020, 41, 23605. [Google Scholar]
  6. Fouatih, O.M.; Medale, M.; Imine, O.; Imine, B. Design optimization of the aerodynamic passive flow control on NACA4415 airfoil using vortex generators. Eur. J. Mech.-B/Fluids 2016, 56, 82–96. [Google Scholar] [CrossRef]
  7. Liu, P.; Li, L.; Xing, Y.; Guo, H. Research Progress on Aerodynamic Noise of High-Lift Devices for Large Aircraft. Acta Aerodyn. Sin. 2017, 35, 472–484. [Google Scholar]
  8. Amini, Y.; Liravi, M.; Izadpanah, E. The effects of Gurney flap on the aerodynamic performance of NACA0012 airfoil in the rarefied gas flow. Comput. Fluids 2018, 170, 93–105. [Google Scholar] [CrossRef]
  9. Storms, B.L.; Jang, C.S. Lift enhancement of an airfoil using a Gurney flap and vortex generators. J. Aircr. 1994, 31, 542–547. [Google Scholar] [CrossRef]
  10. Wang, J.J.; Li, Y.C.; Choi, K.S. Gurney flap—Lift enhancement; mechanisms; applications. Prog. Aerosp. Sci. 2008, 44, 22–47. [Google Scholar] [CrossRef]
  11. He, X.; Wang, J.; Yang, M.; Ma, D.; Yan, C.; Liu, P. Numerical simulation of Gurney flap on SFYT15thick airfoil. Theor. Appl. Mech. Lett. 2016, 6, 286–292. [Google Scholar] [CrossRef]
  12. Ye, X.; Hu, J.; Zheng, N.; Li, C. Numerical study on aerodynamic performance and noise of wind turbine airfoils with serrated gurney flap. Energy 2023, 262, 125574. [Google Scholar] [CrossRef]
  13. Ye, X.; Zheng, N.; Hu, J.; Li, C.; Xue, Z. Numerical investigation of the benefits of serrated Gurney flaps on an axial flow fan. Energy 2022, 252, 124072. [Google Scholar] [CrossRef]
  14. Zhang, X.; Sciacchitano, A.; Pröbsting, S. Aeroacoustic analysis of an airfoil with Gurney flap based on time-resolved particle image velocimetry measurements. J. Sound Vib. 2018, 422, 490–505. [Google Scholar] [CrossRef]
  15. Amini, Y.; Emdad, H.; Farid, M. Adjoint shape optimization of airfoils with attached Gurney flap. Aerosp. Sci. Technol. 2015, 41, 216–228. [Google Scholar] [CrossRef]
  16. Tang, W.; Liu, P.; Hu, T.; Qu, Q.; Guo, H.; Liu, Y.; Akkermans, R.A.D. Effect of gurney flaps on a nonslender delta wing during large-amplitude and high-frequency dynamic pitching. Aerosp. Sci. Technol. 2023, 143, 108715. [Google Scholar] [CrossRef]
  17. Xie, J.; Yang, X.; Ding, J.; Weng, P. Aeroacoustics evaluation and mechanism of Krueger flap. Aerosp. Sci. Technol. 2025, 161, 110085. [Google Scholar] [CrossRef]
  18. Qian, Y.; Zhang, Y.; Sun, Y.; Wang, T. Numerical investigations of the flow control effect on a thick wind turbine airfoil using deformable trailing edge flaps. Energy 2023, 265, 126327. [Google Scholar] [CrossRef]
  19. Liu, Q.; Miao, W.; Li, C.; Hao, W.; Zhu, H.; Deng, Y. Effects of trailing-edge movable flap on aerodynamic performance and noise characteristics of VAWT. Energy 2019, 189, 116271. [Google Scholar] [CrossRef]
  20. Lee, T.; Gerontakos, P. Unsteady Airfoil with Dynamic Leading- and Trailing-Edge Flaps. J. Aircr. 2009, 46, 1076–1081. [Google Scholar] [CrossRef]
  21. Samara, F.; Johnson, D.A. Dynamic Stall on Pitching Cambered Airfoil with Phase Offset Trailing Edge Flap. AIAA J. 2020, 58, 2844–2856. [Google Scholar] [CrossRef]
  22. He, G.; Deparday, J.; Siegel, L.; Henning, A.; Mulleners, K. Stall Delay and Leading-Edge Suction for a Pitching Airfoil with Trailing-Edge Flap. AIAA J. 2020, 58, 5146–5155. [Google Scholar] [CrossRef]
  23. Jawahar, H.K.; Ai, Q.; Azarpeyvand, M. Experimental and numerical investigation of aerodynamic performance for airfoils with morphed trailing edges. Renew. Energy 2018, 127, 355–367. [Google Scholar] [CrossRef]
  24. Yang, Z.; Xu, L.; Zhang, K.; Zhu, W. Numerical study on benefits of curved serrations upon suppressing turbulent boundary layer trailing-edge noise. Phys. Lett. A 2025, 530, 130131. [Google Scholar] [CrossRef]
  25. Wei, R.; Liu, Y. On the shear-layer oscillation and low-frequency tonal noise in a slat cove. Phys. Fluids 2025, 37, 034113. [Google Scholar] [CrossRef]
  26. Kang, D.; Lee, S. Effect of trailing-edge curvature on airfoil noise source and radiation characteristics. Phys. Fluids 2025, 37, 035134. [Google Scholar] [CrossRef]
  27. Marouf, A.; Charbonnier, D.; Vos, J.B.; El Akoury, R.; Hoarau, Y.; Braza, M. Morphing of high-lift wing-flap system with cambering and trailing-edge flapping at high Reynolds number towards a full airplane application. J. Fluids Struct. 2024, 127, 104111. [Google Scholar] [CrossRef]
  28. Shehata, H.M.; Zakaria, M.Y.; Woolsey, C.A.; Hajj, M.R. Lift enhancement by a flapped trailing edge at low Reynolds number: A frequency response approach. J. Fluids Struct. 2022, 110, 103518. [Google Scholar] [CrossRef]
  29. Lee, T.; Su, Y.Y. Unsteady airfoil with a harmonically deflected trailing-edge flap. J. Fluids Struct. 2011, 27, 1411–1424. [Google Scholar] [CrossRef]
  30. Wang, L.; Tian, F.-B. Sound generated by the flow around an airfoil with an attached flap: From passive fluid–structure interaction to active control. J. Fluids Struct. 2022, 111, 103571. [Google Scholar] [CrossRef]
  31. Jawahar, H.K.; Vemuri, S.S.; Azarpeyvand, M. Aerodynamic noise characteristics of airfoils with morphed trailing edges. Int. J. Heat Fluid Flow 2022, 93, 108892. [Google Scholar] [CrossRef]
  32. Swalwell, K.; Sheridan, J.; Melbourne, W. Frequency analysis of surface pressures on an airfoil after stall. In Proceedings of the 21st AIAA Applied Aerodynamics Conference, Orlando, FL, USA, 24 June 2003; p. 3416. [Google Scholar]
  33. Ffowcs Williams, J.E.; Hawkings, D.L. Sound generation by turbulence and surfaces in arbitrary motion. Philos. Trans. R. Soc. Lond. Ser. A Math. Phys. Sci. 1969, 264, 321–342. [Google Scholar]
  34. Haase, W.; Braza, M.; Revell, A. DESider–A European Effort on Hybrid RANS-LES Modelling: Results of the European-Union Funded Project, 2004–2007; Springer Science & Business Media: Berlin/Heidelberg, Germany, 2009. [Google Scholar]
  35. Wang, F.M.; Wang, J.C. Relationship and Calculation of 1/3 Octave and Octave Spectrum in Noise Measurement. Noise Vib. Control 1996, 16, 39–41. [Google Scholar]
Figure 1. Computational domain mesh: (a) mesh and boundary condition setup; (b) mesh near the airfoil; and (c) spanwise meshing of the airfoil.
Fluids 10 00152 g001
Figure 2. Grid independence verification (comparison of surface pressure coefficients).
Fluids 10 00152 g002
Figure 3. Validation of simulation results accuracy (comparison of surface pressure coefficients).
Fluids 10 00152 g003
Figure 4. Schematic diagrams showing (a) the configuration of the airfoil with a Gurney flap, (b) the computational mesh surrounding the airfoil, and (c) a partially enlarged view of the mesh around the Gurney flap.
Fluids 10 00152 g004
Figure 5. Comparison of surface pressure coefficients between the original airfoil and the Gurney flap airfoil.
Fluids 10 00152 g005
Figure 6. (a) Three-dimensional model of the airfoil with leading- and trailing-edge flaps; (b) schematic representation of the computational grid around the airfoil.
Fluids 10 00152 g006
Figure 7. Comparison of surface pressure coefficients between the original airfoil and the airfoils with leading-edge and trailing-edge flaps.
Fluids 10 00152 g007
Figure 8. Sound field monitoring points, sound directivity distribution and differences in total sound pressure level. (a) Sound field monitoring points. (b) Sound direction distribution. (c) The difference in total sound pressure level among the three airfoils.
Fluids 10 00152 g008
Figure 9. Sound pressure level distributions at each monitoring point: (a) 90° monitoring point; (b) 0° monitoring point; (c) 270° monitoring point; (d) 180° monitoring point.
Fluids 10 00152 g009
Figure 10. The 1/3-octave band at each measurement point: (a) 1/3-octave band at the 90° (upper monitoring point) and 270° (lower monitoring point) measurement points; (b) 1/3-octave band at the 0° (trailing edge monitoring point) and 180° (leading-edge monitoring point) measurement points.
Fluids 10 00152 g010
Figure 11. Difference in 1/3-octave band between the Gurney flap airfoil, the leading-edge and trailing-edge flap airfoil and the original airfoil at each measurement point: (a) 1/3-octave band difference at the 90° (upper monitoring point) and 270° (lower monitoring point) measurement points; (b) 1/3-octave band difference at the 0° (trailing-edge monitoring point) and 180° (leading-edge monitoring point) measurement points.
Fluids 10 00152 g011
Figure 12. Time-averaged pressure fluctuation distribution of the original airfoil and the Gurney flap airfoil: (a) original airfoil; (b) Gurney flap airfoil.
Fluids 10 00152 g012
Figure 13. Comparison of the wake three-dimensional vorticity contour map between the original airfoil and the Gurney flap airfoil: (a) original airfoil; (b) Gurney flap airfoil.
Fluids 10 00152 g013
Figure 14. Surface radiated sound pressure level contour map of the original airfoil at a specific frequency. (a) Surface sound pressure level contour map of the airfoil at 1250 Hz frequency. (b) Surface sound pressure level contour map of the airfoil at 1600 Hz frequency. (c) Surface sound pressure level contour map of the airfoil at 2000 Hz frequency.
Fluids 10 00152 g014
Figure 15. Surface radiated sound pressure level contour map of the Gurney flap airfoil at a specific frequency. (a) Surface sound pressure level contour map of the airfoil at 1250 Hz frequency. (b) Surface sound pressure level contour map of the airfoil at 1600 Hz frequency. (c) Surface sound pressure level contour map of the airfoil at 2000 Hz frequency.
Fluids 10 00152 g015
Figure 16. Time-averaged pressure fluctuation distribution of the original airfoil and the leading-edge and trailing-edge flap airfoil: (a) original airfoil; (b) leading-edge and trailing-edge flap airfoil.
Fluids 10 00152 g016
Figure 17. Comparison of the wake three-dimensional vorticity contour map between the original airfoil and the airfoil with leading-edge and trailing-edge flaps: (a) original airfoil; (b) leading-edge and trailing-edge flap airfoil.
Fluids 10 00152 g017
Figure 18. Surface radiated sound pressure level contour map of the leading-edge and trailing-edge flap airfoil at a specific frequency. (a) Surface sound pressure level contour map of the airfoil at 100 Hz frequency. (b) Surface sound pressure level contour map of the airfoil at 125 Hz frequency. (c) Surface sound pressure level contour map of the airfoil at 160 Hz frequency. (d) Surface sound pressure level contour map of the airfoil at 200 Hz frequency. (e) Surface sound pressure level contour map of the airfoil at 2 kHz frequency. (f) Surface sound pressure level contour map of the airfoil at 2.5 kHz frequency. (g) Surface sound pressure level contour map of the airfoil at 3.15 kHz frequency. (h) Surface sound pressure level contour map of the airfoil at 4 kHz frequency.
Fluids 10 00152 g018aFluids 10 00152 g018b
Table 1. Grid independence verification (comparison of lift and drag coefficients).
EXP6 × 1064 × 1062 × 106
Cl0.9310.9060.9140.89
Δ−2.76%−1.86%−4.61%
Cd1.5171.4671.4731.436
Δ−3.41%−2.99%−5.64%
Table 2. Validation of simulation results accuracy (comparison of lift-to-drag ratio coefficients).
EXPEADS-M400w
Cl0.9310.8890.914
Δ−4.51%−1.86%
Cd1.5171.4251.473
Δ−6.06%−2.99%
Table 3. Comparison of lift and drag coefficient results for the original airfoil and Gurney flap airfoil at deep stall conditions.
EXPCFD PlainCFD GurneyEnhancement Percentage
Cl0.4430.3320.64393.68%
Cd0.2850.2520.2530.39%
Lift-to-Drag Ratio1.5571.3172.54293.01%
Table 4. Comparison of lift and drag coefficients for the original airfoil and the leading-edge and trailing-edge flaps airfoil under deep stall conditions.
EXPCFD PlainCFD LEF&TEFEnhancement Percentage
Cl0.4430.3320.54865.06%
Cd0.2850.2520.34637.30%
Lift-to-Drag Ratio1.5541.3171.58320.19%
Disclaimer/Publisher’s Note: The statements, opinions and data contained in all publications are solely those of the individual author(s) and contributor(s) and not of MDPI and/or the editor(s). MDPI and/or the editor(s) disclaim responsibility for any injury to people or property resulting from any ideas, methods, instructions or products referred to in the content.

