Article

Performance of an L-Shaped Duct OWC-WEC Integrated into Vertical and Sloped Breakwaters by Using a Free-Surface RANS-Based Numerical Model

by
Eric Didier
1,* and
Paulo R. F. Teixeira
2
1
National Laboratory for Civil Engineering, 1700-066 Lisboa, Portugal
2
Federal University of Rio Grande, Av. Itália, km 8, Campus Carreiros, Rio Grande 96203-900, RS, Brazil
*
Author to whom correspondence should be addressed.
Fluids 2025, 10(5), 114; https://doi.org/10.3390/fluids10050114
Submission received: 28 February 2025 / Revised: 9 April 2025 / Accepted: 12 April 2025 / Published: 30 April 2025
(This article belongs to the Special Issue Computational Fluid Dynamics Applied to Transport Phenomena)

Abstract

:
Waves generated by the wind in oceans and seas have a significant available quantity of clean and renewable energy. However, harvesting their energy is still a challenge. The integration of an oscillating water column (OWC) wave energy converter into a breakwater leads to more viability, since it allows working as both harbor and coastal protection and harvesting wave energy. The main objective of this study is to investigate different configurations of L-shaped duct OWC devices inserted into vertical and sloped (2:3) impermeable breakwaters for different lengths of the lip by using a numerical model based on the Reynolds-Averaged Navier-Stokes equations. The ANSYS FLUENT® software (2016) is used in 2D numerical simulations by adopting the volume of fluid method to consider the two-phase free surface flow (water and air). It was observed that both the length of the lip and the length of the L-shaped duct OWC significantly influence the resonance and the efficiency of the OWC device. In addition, the performance of the OWC device varies significantly with its geometric configuration, which needs to be adapted for the local sea state.

1. Introduction

The global offshore wave power is around 32,000 TWh/yr and 16,000 TWh/yr when the direction of the energy is considered [1,2,3], which are the orders of magnitude of the electric demand of the world. Therefore, this clean and renewable energy may be a good alternative to use to diminish the well-known current environment damage. However, differently from wind and solar energies, which have consolidated technologies, wave harvesting technology is still under in development. Nowadays, there are several issues to be solved for wave energy converters to be a viable option, such as their high level of costs, the corrosion and loads that they are subjected to, the seasonality of the local sea states, and the large range of the frequency of the wave energy. This latter point causes difficulties in maintaining a high level of efficiency of the device at all incident wave periods in the range of certain sea states.
Several patents with different concepts and systems have been developed for wave energy converters [4]. These devices can be classified based on their operational principles, composed of oscillating water columns (OWCs), overtopping converters, and oscillating body systems [5,6]. The OWC wave energy converter is the most studied device, due to its simplicity and good efficiency. It consists of a chamber partially submerged with a turbine installed at its emerging part. A submerged opening allows the free surface inside the chamber to oscillate due to incident waves. Thus, air flow passes by the turbine which generates energy during air exhalation and inhalation [7]. The onshore OWC devices have been paid special attention because they can be integrated into breakwaters, which allow their use for both harbor and coastal protection and wave harvesting. Some prototypes with these characteristics have been constructed and tested around the world. Generally, the OWC device is integrated into a vertical breakwater, such as prototypes of Toftes (500 kW), in Norway; Sakata (60 kW), in Japan; Vizhinjam, in India; and Mutriku (300 kW), in Spain, but others are integrated into the cliffy coastline, such as LIMPET (500 kW) on Isley Island, United Kingdom, and Pico’s plant (400 kW), in Azores, Portugal. These prototypes are the results of several experimental and numerical investigations over decades, such as those reported by Takahashi et al. [8], Raju and Neelamani [9], Heath et al. [10], Falcão [11], Josset and Clément [12], Brito-Melo et al. [13], and Torre-Enciso et al. [14].
Several researchers have investigated different geometrical configurations that are capable of improving the performance of this device. Boccotti [15] proposed the U-OWC device, which has an additional vertical duct extending along the whole wave-beaten wall. Sentürk and Özdamar [16] studied the effect of the use of a fully submerged barrier with a gap instead of the standard partially submerged front wall in the OWC chamber. Ashlin et al. [17] investigated the influence of different bottom profiles on the performance of the OWC device by means of physical experiments. Rezanejad et al. [18], Ning et al. [19], and Haghighi et al. [20] analyzed the performance of dual chamber OWC devices, which consist of two rectangular chambers arranged in series. Dizadji et al. [21], Ram et al. [22], Gaspar et al. [23], and Güths et al. [24] investigated the influence of the chamber wall slopes on the performance of an OWC device.
In the majority of the cases, the entrance of water inside the OWC chamber is at the frontal wall of the breakwater or the device structure and the distance between the water entrance and the OWC chamber corresponds to the frontal wall thickness. However, sometimes the distance between the water entrance and the OWC chamber must be larger due to the requirement of the device conception. One example is the hybrid wave energy converter composed by the OWC and overtopping wave energy converter (OWEC) devices installed in sloped/rubble mound breakwaters [25,26,27]. In these cases, for design reasons and efficiency optimization of both OWC and OWEC devices, the presence of the OWEC device requires that the OWC vertical chamber must be displaced to the inside of the breakwater, enlarging the duct length between the water entrance and the OWC chamber. This device configuration, designed as an L-shaped duct OWC and studied by Howe and Nader [28], Rezanejad et al. [29], and López et al. [30], is similar to a bent duct.
A situation simpler than the hybrid device consists of the OWC device integrated into a slope/rubble mound breakwater, which is a very commonly used structure for harbor and coastal protection. Therefore, these existing structures can be an alternative to harvest the wave energy with reduced costs. In this case, the OWC chamber must be also displaced to the inside of the breakwater to preserve its slope, which also characterizes an L-shaped duct OWC.
The distance from the water entrance at the frontal part of the breakwater and the OWC chamber entrance, which corresponds to the horizontal part of the L-shaped duct OWC, influences the resonant period of the OWC device since it depends on the length that fluid particles run from the entrance to the chamber of the OWC device [31,32]. In addition, López et al. [30] analyzed several L-shaped duct OWC designs integrated into a vertical breakwater, and, among other conclusions, the authors reported that a larger water entrance of the horizontal duct and a shallower water entrance positively influence the efficiency of the device.
This study aims to investigate the influence of the horizontal length part of the L-shaped duct OWC on the performance of the device. Vertical and sloped impermeable breakwaters are investigated for OWC vertical chambers. In addition, in the case of the sloped breakwater, the OWC inclined chamber is also analyzed. A 2D numerical wave flume is employed to investigate the performance of these three configurations of OWC devices by using the free-surface RANS-based ANSYS-FLUENT® software [33]. A mesh convergence analysis is carried out at prototype scale and allows for defining the adequate mesh resolution to obtain accurate results, and also to verify the mesh resolution independence. The validation of the numerical model in Conde et al. [34], Didier et al. [35], Dias et al. [36], and Mendonça et al. [37] is presented before being applied to investigate the configurations of OWC devices integrated into the breakwater at prototype scale. Finally, the pneumatic power and the performance of the OWC device are analyzed, focusing on investigating the influence of the front wall submergence of the OWC device and the L-shaped duct OWC. Additionally, the energy balance around the OWC device [23,24,38,39], which identifies significant energy quantities due to viscous and turbulence losses and reflected wave energy, is also analyzed.

2. L-Shaped Duct OWC Integrated into Breakwaters

All study cases are carried out at real prototype scale and consist of a 2D wave flume with an L-shaped duct OWC device integrated into an impermeable breakwater at its end. Two types of standard breakwaters, vertical and 2:3 sloped, subject to incident regular waves, are investigated. Firstly, a vertical OWC chamber and different distances from the water entrance to the chamber, i.e., the horizontal part of the L-shaped duct OWC, are analyzed. Secondly, in the case of the sloped breakwater, an inclined OWC chamber and different lengths of the L-shaped duct OWC are also investigated, since it is an interesting configuration whose OWC chamber walls follow the same inclination as the sloped breakwater.
The wave flume has a horizontal bottom with depth, h, of 10 m. The cross-section of OWC devices is 10 × 10 m2 and the air chamber is 6 m high, as used by the authors in previous studies, such as Teixeira and Didier [40], Wiener et al. [41], and Didier and Teixeira [42]. The OWC device is equipped with a Wells turbine, which is characterized by a linear relation between the pressure drop, i.e., the difference between the air pressure inside the chamber and the atmospheric pressure, Δp, and the volumetric flow rate, Q, given by
Δ p = k t Q
where the turbine characteristic relation is kt = 100 Pa.s.m−3, which is an optimum value for the present OWC device design [41].
The three geometrical configurations of the L-shaped duct OWC devices integrated into the breakwaters are sketched in Figure 1. Figure 1a shows the case of the vertical OWC chamber integrated into a vertical breakwater. This configuration, with front wall thickness 0.5 m, was extensively studied by Gaspar et al. [23], Teixeira and Didier [40,43], Wiener et al. [41], and Didier and Teixeira [42,44]. Figure 1b represents the vertical OWC chamber integrated into the 2:3 sloped breakwater and Figure 1c shows the case of the inclined OWC chamber integrated into the 2:3 sloped breakwater, which is similar to the one previously studied by Gaspar et al. [23] and Güths et al. [24] with 40° angle walls and a front wall thickness of 0.5 m. In Figure 1, l is the length of the lip (in this study, two values are tested, l = 2.5 and 5.0 m); b is the distance from the water entrance to the OWC chamber of the device, i.e., the length of the L-shaped duct OWC, whose tested values are b = 0.5, 5, 10, and 15 m for the vertical OWC chamber integrated into the vertical breakwater and the inclined OWC chamber integrated into the sloped breakwater and b = 5, 10, and 15 m for the vertical OWC chamber integrated into the sloped breakwaters. It can be noticed that b = 0.5 m represents the thickness of the front chamber wall in the standard configuration, in which the OWC device is located in front of the breakwater.
The incident wave period, T, varies from 6 to 14 s, each 1 s, and the wave height, H, is 1 m.

3. Free-Surface Flow Model

The equations and numerical methodologies used in the study are shown. An analysis of the mesh refinement independence is presented, also allowing for the definition of the best mesh that conciliates accuracy and computation time, followed by the validation of the numerical model comparing numerical with experimental results through previous studies of OWC devices.

3.1. Governing Equations for the 2D Wave Flume

The 2D governing equations are composed by the continuity, momentum, and energy equations, in which the water is incompressible and the air is an ideal compressible gas. These equations are given by the following [45,46]:
ρ t + ρ u i x i = 0
( ρ u i ) t + ρ u i u j x j = p x i + ρ g i   + τ i j x j + S i
( ρ e ) t + u i ρ e + p x i = x i k e T e x i x i τ i j u j
τ i j = μ u i x j + u j x i 2 3 μ u k x k δ i j
where i, j, k = 1, 2; ρ is the specific mass, gi are the gravity acceleration components, ui are velocity components, p is the pressure, Si is a source term, e is the specific energy, Te is the temperature, and ke is the thermal conductivity coefficient. τij is the viscous stress tensor, μ is the fluid viscosity, and δij is the Kronecker delta.
The RANS equations, based on the decomposition of the instantaneous velocity and pressure fields of the Navier–Stokes equations and specific energy of energy equation into mean and fluctuating components, and the subsequent time-averaging of the set of equations, are used. This process introduces the Reynolds stress terms ρ u i u j ¯ associated with turbulence modeled considering the Boussinesq hypothesis, given by
ρ u i u j ¯ = 2 3 ρ κ δ i j + μ t u i x j + u j x i
where μt is the turbulent viscosity, and κ is the kinetic energy of turbulence per mass.
In this study, the hybrid turbulent/laminar model is used, in which a laminar zone is applied to the wave propagation region of wave flume, from the wave maker to the proximity of the OWC device, and the κ-ω SST (shear stress transport) turbulence model [47] is only applied in the proximity of the OWC device [48,49].
The interface-capturing techniques, developed primarily for free-surface and two-fluid interface flows, are formulated typically over non-moving meshes, using an advection equation in addition to the flow equations. The advection equation governs the evolution of an interface function that marks the location of the interface. Free surface motion is defined by using the VoF (volume of fluid) method [50], which is based on the transport equation of the volume fraction, f, that takes values 0 in the air, 1 in the water and 0.5 in the position of the free surface, given by the following:
f t + u j f x j = 0
The physical properties of the region between the two fluids are determined as weighted averages using the volumetric fraction. Consequently, density and viscosity are expressed as follows [46]:
ρ = f   ρ w a t e r + 1 f   ρ a i r
μ = f   μ w a t e r + 1 f   μ a i r

3.2. Numerical Model

The ANSYS-FLUENT® software [33], in which the finite volume method is used to discretize the governing equations, is used for numerical simulations of the wave flume. The SIMPLEC (Semi-Implicit Method for Pressure Linked Equations-Consistent) solver is used for pressure–velocity coupling and for solving the set of discretized equations. It is a common numerical procedure in the field of computational fluid dynamics for solving the Navier–Stokes equations [51]. Relaxation parameters are 0.3 for the pressure, 1.0 for the density, 0.7 for the momentum and 0.8 for turbulence kinetic energy and turbulence dissipation rate or specific dissipation rate. The PRESTO! (PREssure STaggering Option) method is used for the spatial discretization of pressure (which is the recommendation of the ANSYS-FLUENT® user guide [33] for modeling wave propagation), and the momentum is discretized by the third-order scheme MUSCL (Monotonic Upstream-Centered Scheme for Conservation Laws) that can provide highly accurate numerical solutions, even in cases where the solutions exhibit shocks, discontinuities, or large gradients [52]. The turbulence kinetic energy and dissipation rate or specific dissipation rate are discretized by the second order upwind scheme. The integration in time is performed by a first-order implicit scheme due to the use of the Geo-Reconstruct scheme, which is chosen for discretizing the transport equation of the volumetric fraction [33]. The Geo-Reconstruct technique allows the efficient treatment of the interface between water and air, preserving a thin transition between both fluids by means of a geometric interface reconstruction method and despite the great differences in the fluid physical properties [53]. These methodologies are found in detail in [23,24,36,37,40,41,42,43,44,49,54,55,56,57,58], among others.
A variable time step ranged from T/640 to T/200,00, with six non-linear iterations per time step, and the Courant number of 0.7 is used for time integration [49,57,58].

3.3. Boundary Conditions

Figure 2 shows the boundary conditions and the sketch of the computational domain for the OWC device integrated into a vertical breakwater. The non-slip condition is imposed on the walls of the OWC device, the breakwater, and the bottom of the wave flume. The atmospheric pressure is applied using the pressure outlet boundary condition to the top open boundary of the wave flume and the top of the OWC device air chamber, which permits the outflow of the air. Small values of turbulence kinetic energy (κ = 10−6 m2/s2) and specific dissipation rate (ω = 1 s−1) are imposed on the top boundary of the wave flume and the top boundary of the OWC device chamber, following Elhanafi et al. [38] and Lin and liu [59]. Specific boundary conditions, such as the Wells turbine, the wave generation at the wave maker, and the absorption of reflected waves at the wave maker, are also show in Figure 2 and described below.

3.3.1. Wells Turbine Model

The methodology for imposing the effect of the turbine damping inside the OWC chamber is the same as that used by Güths et al. [24], in which a porous zone located in two layers of cells on the top boundary of the OWC chamber along its length causes the pressure drop equivalent to the turbine one. This methodology was validated by comparing the air pressure drop inside the chamber of a 2D domain with that of a 3D computational domain [24]. The authors concluded that the pressure loss caused by the effect of the 3D flow inside the chamber and the duct modeled in the 3D domain case is not significant. The porous zone is modeled by means of source terms Si in the momentum equations, Equation (3), which, in a simple homogeneous porous medium, are given by Ansys [33]
S i = μ α + ρ C 2 2 u u i
where α is the permeability, C 2 is the inertial resistance factor, and |u| is the magnitude of the velocity. The pressure drop caused by porous media is p = d Si, where d is the thickness of the porous zone. Due to the linear relation between the pressure drop and the volumetric flow rate, Equation (1), the Wells turbine modeling follows Darcy’s law and, consequently, C 2 = 0 . Therefore, the permeability α is set considering the value of kt (100 Pa s m−3 in this study).

3.3.2. Wave Generation

The generation of an incident regular wave is performed using a static wave maker at the inlet boundary of the computational domain [54,55]. In this boundary, velocity component profiles, which are related to time and depth according to the second-order Stokes wave theory [60], are imposed at each instant and the corresponding free surface position is defined by the volume fraction value, 0 above and 1 under the free surface position. The second-order Stokes wave theory is used due to its better suitability for reproducing the characteristics of the incident regular wave for the present flume depth, which corresponds to intermediate water depth for the range of wave period under study, following the Chakrabarti diagram of wave theory application [61]. The horizontal ( u 1 W M ) and vertical ( u 2 W M ) components of the wave velocity and the water free surface elevation ( η W M ), at the wave maker, are given, respectively, by Dean and Dalrymple [60]
u 1 W M = H 2 g k σ cosh k h + x 2 cosh k h cos k x 1 σ t + 3 16 H 2 σ k cosh 2 k h + x 2   sinh ( k h ) 4 cos 2 k x 1 σ t
u 2 W M = H 2 g k σ sinh k h + x 2 cosh k h sin k x 1 σ t + 3 16 H 2 σ k sinh 2 k h + x 2   sinh ( k h ) 4 sin 2 k x 1 σ t
η W M = H 2 cos k x 1 σ t + H 2 k 16 cosh k h   sinh ( k h ) 3 2 + cosh 2 kh cos 2 k x 1 σ t
where σ = 2 π / T is the wave angular frequency and k = 2 π / L is the wave number (L is the wavelength). Equations (11)–(13) are imposed by means of user-defined functions (UDF) written in C code, which is dynamic linked with the ANSYS-FLUENT solver.
Small values of turbulence kinetic energy (10−6 m2/s2) and specific dissipation rate (1 s−1) are imposed on the wave maker boundary [38,59].

3.3.3. Wave Absorption Technique

Active wave absorption is widely known in physical modeling, as it is needed to cancel out reflected waves that reach the wave maker. The methodology proposed by Shäffer and Klopman [62] was implemented successfully in several numerical models [63,64,65]. It consists of correcting the horizontal velocity of the incident wave at the wave maker in real time, based on linear shallow water theory [60], to avoid wave reflection. For that, the free surface elevation of the reflected wave to be absorbed, ηR, is obtained by comparing the target-free surface, ηtarget, calculated using second-order Stokes wave theory, Equation (13), to the free surface recorded in front of the wave maker, ηrecord:
η R = η t a r g e t η r e c o r d
The horizontal velocity component u1 at the wave maker, Equation (11), has to be modified to match the velocity induced by the wave to be absorbed. The velocity correction owing to absorb the reflected wave, ucorr, can be written as follows [62]:
u c o r r = η R g / h 1 / 2
Then, the corrected velocity at the wave maker, u 1 , c o r r W M , is obtained by
u 1 , c o r r W M = u 1 W M u c o r r
This methodology was applied successfully in a 2D numerical wave flume [23,24,36,37,40,41,43,44,49,56,57,58,63,64,65] and 3D numerical wave tank [42,54,55,66].

3.4. Initial Conditions

The initial conditions consist of the free surface level at rest, null velocity components, hydrostatic pressure on the water, and atmospheric pressure on the air, and the turbulence kinetic energy and specific dissipation rate are 10−6 m2/s2 and 1 s−1, respectively, following [38,59].

3.5. Monitoring

The mean pneumatic power, PP, is calculated taking into consideration the time series of the instantaneous mean air pressure inside the chamber, pac, and the volume flow rate at the turbine, Q, during a wave period, given by [24]:
P P = 1 T T p a c Q d t
The volume flow rate is defined automatically at the top of the OWC air chamber by the ANSYS-FLUENT® software [33]. The mean pressure inside the air chamber is calculated taking into account the instantaneous air pressure on all cells containing only air, i.e., above the free surface.
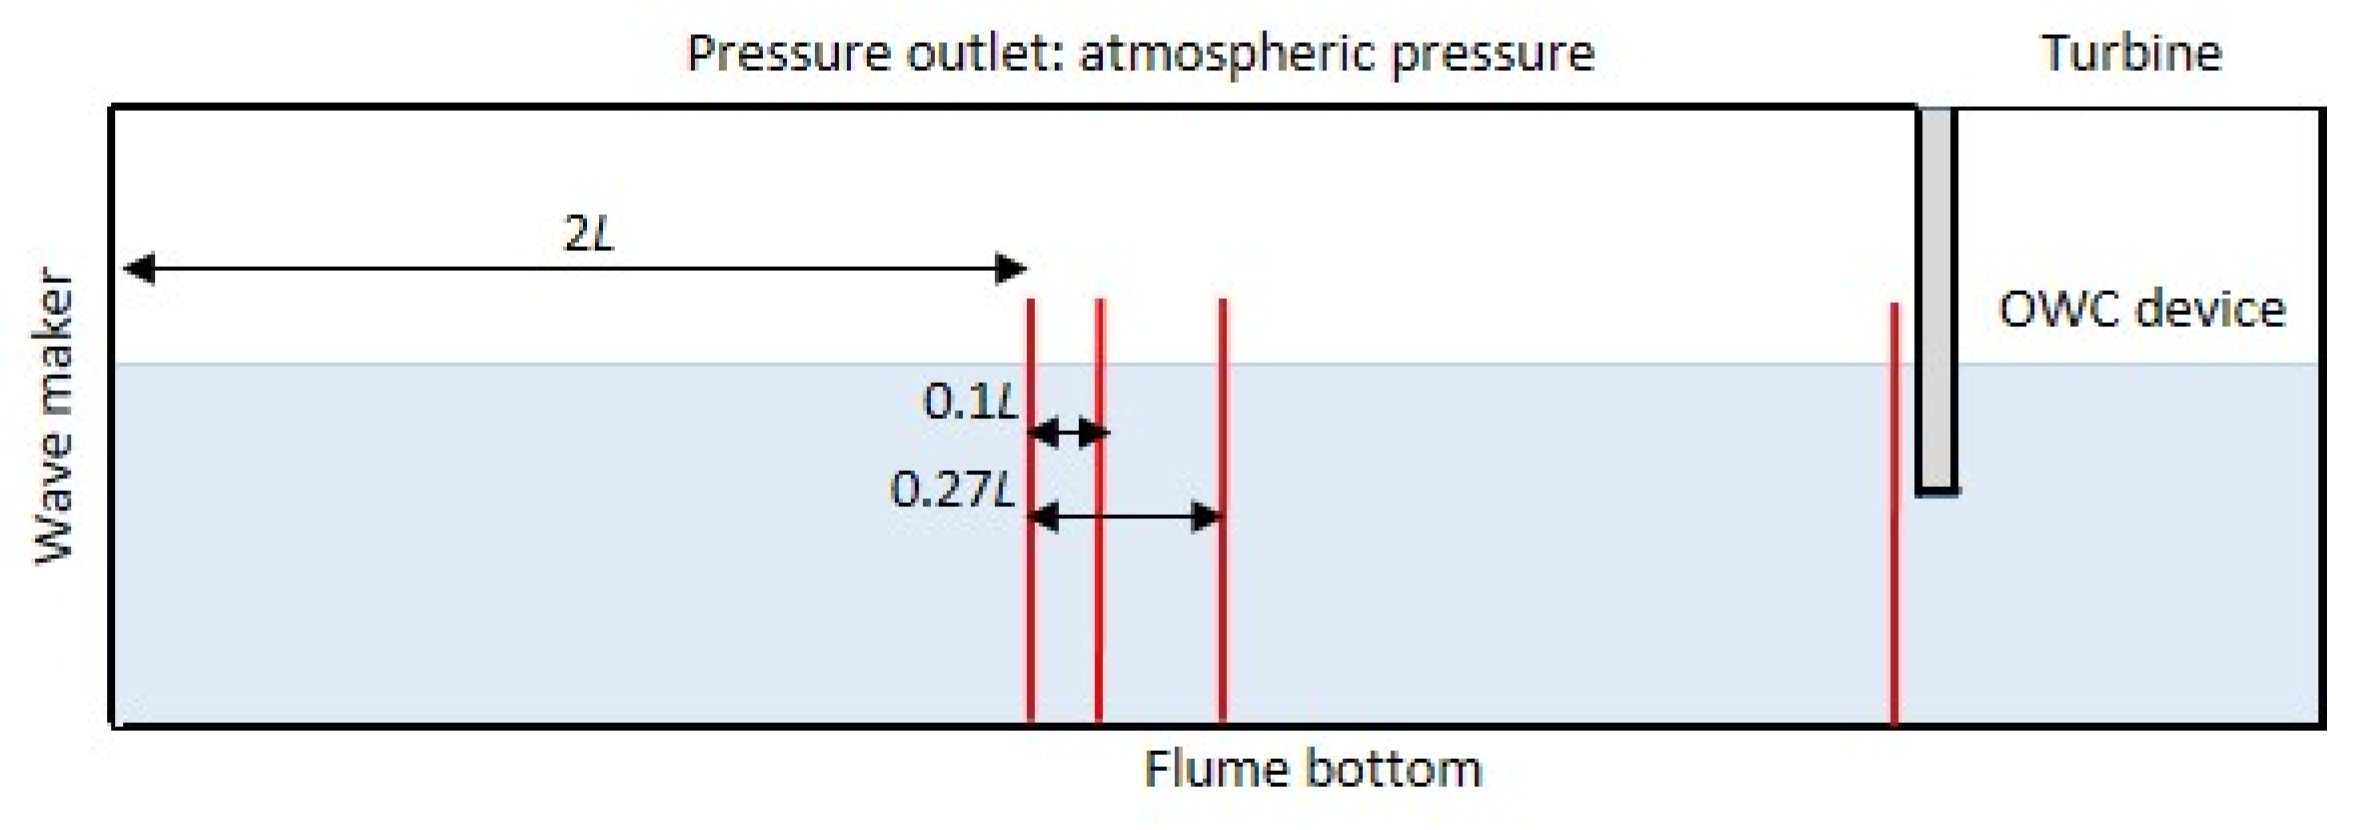
The reflected wave coefficient (Cr), which is the relation between reflected and incident wave heights, is calculated by using the three-gauge method of Mansard and Funke [67]. This method allows calculating the Cr by means of three gauges on the flume, in which the first gauge is 2L away from the wave maker and the second and third gauges are 0.1L and 0.27L from the first gauge, respectively.
Figure 3 shows the set of the three wave gauges used to define the reflected wave coefficient and the wave gauge in front of the OWC device to measure the free surface elevation in this locale. The mean free surface elevation inside the OWC device is calculated through the determination of the water volume inside the OWC chamber.
An analysis of energy balance for the OWC device is carried out considering that the incident wave energy (EI) is partitioned in the extracted energy by the device (EE), the reflected wave energy (ER), and the energy losses (EL) due to viscous forces, dissipation on the OWC device structure, and turbulence [23,24]. The energy balance is given by the following relation:
E I = E R + E E + E L
The incident wave energy is calculated considering the mean energy during a wave period according to the linear wave theory [33], as follows:
E I = 0 T ρ w g 2 32 π   H 2 T l O W C 1 + 2 k h s i n h 2 k h t a n h k h   d t
where ρw is the density of the water, k is the wave number and lowc is the chamber width (lowc = 10 m in this study).
The reflected wave energy depends on the reflected wave coefficient and is given by
E R = E I   C r 2
The extracted energy is calculated by the time-averaged pneumatic energy from Equation (17) as follows:
E E = T   P P
The energy losses are calculated from Equation (18).

3.6. Wave Flume Mesh and Validation

An analysis of convergence with mesh refinement is carried out to define the best compromise between accuracy and computational time, which also allows the definition of the characteristics of mesh resolution to be adopted for modeling wave interactions with OWC devices. In addition, the comparison between numerical and experimental results performed in previous studies shows that the adopted mesh resolution and free surface flow numerical model are well adapted for modeling OWC devices. The mesh characteristics used for the present study of OWCs integrated into breakwaters are presented.

3.6.1. Mesh Study

An analysis of the convergence and mesh resolution independence of the flow field is carried out for the vertical OWC integrated into the vertical breakwater with lip 2.5 m and L-shaped duct OWC length 0.5 m, for the incident wave with T = 12 s, H = 1 m, and the wave length of 113.3 m. Four levels of mesh refinement are used. Table 1 shows the resolution adopted for each mesh and indicates the control volume dimensions in horizontal, dx1, and vertical, dx2, directions inside the wave propagation zone and the OWC chamber, and the global number of cells. In the wave propagation zone, the vertical variation in free surface flow is defined with a height of 2H (considering that the maximum wave height can be obtained by the superposition of incident and reflected waves) and 3H in the OWC chamber (considering that the maximum amplitude is around two times the incident wave amplitude). The size of the cells, dx1 and dx2, is divided by a factor of two between each mesh in the wave propagation and OWC chamber zone. The stretching of the mesh to the bottom and top of the flume is adapted depending on the refinement inside the zones of variation in the free surface. The number of cells in the computational domain increases from 4950 for the coarser grid, M1, to 121,388 for the finer one, M4. In the wave propagation zone, the number of cells per wave length, NH, varies from 25 (mesh M1) to 151 (mesh M4) cells and the number of cells per wave height, NV, ranges from 5 to 40, for mesh M1 and M4, respectively. The mesh M3 has a resolution of 70 cells per wavelength and 20 per wave height.
Table 2 shows several relevant quantities for the four meshes: the mean pneumatic power, PP, Equation (7); the maximum pneumatic power, Pmax; the minimum and maximum mean pressure in the OWC air chamber, pac− and pac+, respectively; the minimum, η−, and maximum, η+, amplitude of the mean free surface elevation inside the OWC chamber; and the free surface elevation in front of the wall device. Table 3 shows the differences, in percentage, of the quantities calculated in Table 2, between the meshes M1, M2, and M3 and the finer one, M4. Mesh resolution independence is obtained with mesh M3, which exhibits differences of less than 0.5% compared with the finer mesh M4, confirming that a resolution of 70 cells per wavelength and 20 per wave height is well adapted and similar to the resolution adopted by Conde et al. [34], Dias et al. [36], Didier et al. [42,44,49,58], Gaspard et al. [23], Güths et al. [24], Lisboa et al. [56], Medonça et al. [37], Neves et al. [57], Teixeira et al. [40,43,68], Cisco et al. [69], and Wierner et al. [41], among others.

3.6.2. Validation of the Numerical Wave Flume and OWC Devices

The numerical methodology and mesh resolution used in this study were validated in previous studies by Conde et al. [34] and Didier et al. [35] who analyzed a simplified OWC-WEC subjected to regular incident waves. The case study was based on experiments of Lopes et al. [70] in which the prototype consisted of a vertical hollow cylinder open at the ends with an outer diameter of 0.0550 m, a thickness of 0.0025 m, and a submergence length of 0.18 m placed in the wave flume 0.40 m deep at the Department of Architecture and Civil Engineering at Instituto Superior Técnico (IST), Lisbon. A piece of porous membrane (textile) placed at the top of the vertical tube was used to consider the damping effect of the turbine. The mesh resolution follows the criteria of around 70 cells per wave length and around 20 cells per wave height. Regular incident waves with different frequencies were simulated with and without the presence of the membrane. Comparisons of the amplification factor and phase angle between the free surface elevation inside and outside the cylinder obtained numerically were in very good agreement with experimental ones. In addition, the validation of this methodology was also developed by Dias et al. [36] and Mendonça et al. [37] based on the physical modeling developed at the Laboratório Nacional de Engenharia Civil (LNEC), Lisbon, that consists of a wave flume and an onshore OWC-WEC with a fully open chamber with the main characteristics of the Pico’s plant with scale of about 1:35. The mesh resolution for the wave flume and the OWC device follows the criteria of around 70 cells per wave length and around 20 cells per wave height. For different conditions of regular incident waves, the time series of the free surface elevation at different locations along the flume and inside the OWC water chamber obtained numerically showed a very good agreement with experimental ones.

3.6.3. Wave Flume Meshes for the Study of OWC Integrated into Breakwaters

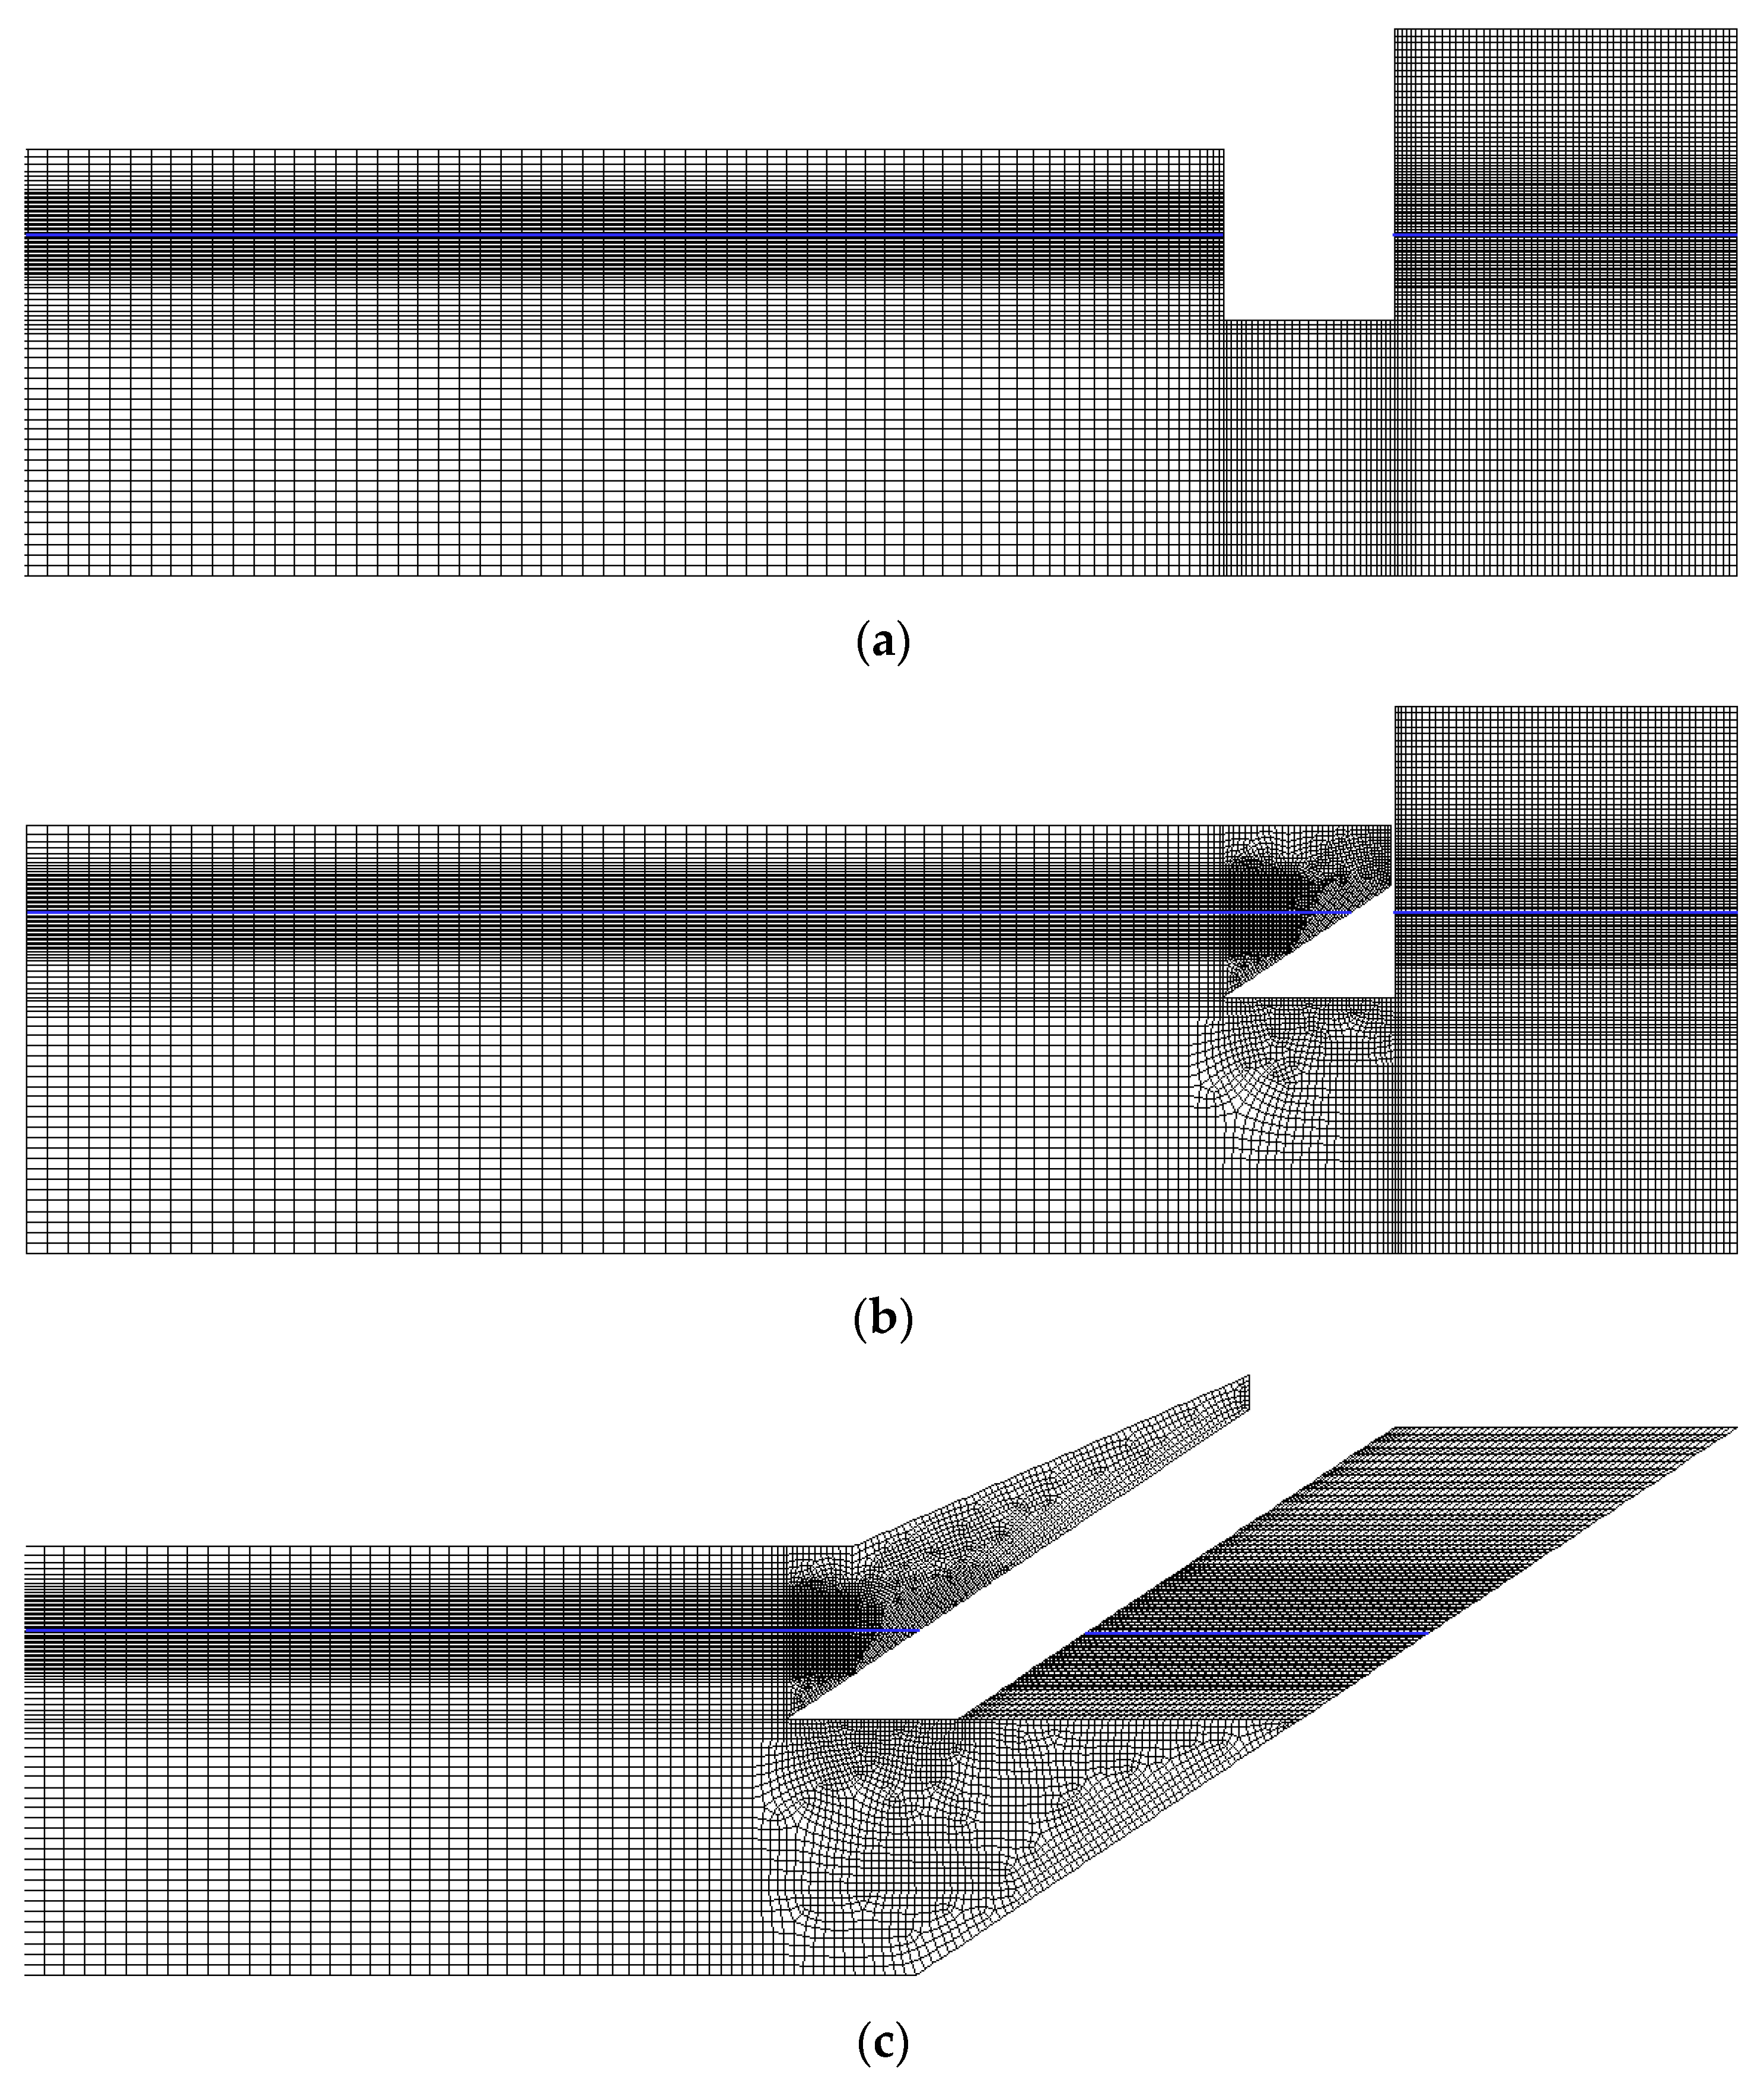
The computational mesh of the wave flume with the OWC device at its end is composed of two main zones with different mesh characteristics, as mentioned in Section 3.6.1: the propagation wave zone, in which the free surface is well behaved and a structured regular mesh is used, and the zone around the OWC device where the flow is more complex due to the wave–structure interaction and the occurrence of wave run-up/run-down above the breakwater. In this zone, a structured regular mesh or an unstructured regular one is adopted depending on the structure configuration. In the case of the unstructured regular mesh, it is recommended, especially above the ramp of the sloped breakwater where run-up/run-down occurs, to use preferentially regular cells with an aspect ratio close to 1 [71,72,73].
Figure 4 shows the mesh in the proximity of the breakwater and the OWC device for the three configurations with b = 5 m and l = 2.5 m for a wave period of 6 s. The wave flume length from the wave maker to the OWC device is 4L, which means that the length of the wave flume varies with each wave period. However, for the three devices tested, the mesh in the propagation wave zone is the same, for the same wave period, and only the mesh in the zone close to the breakwater and the OWC device is modified. The mesh characteristics are adapted depending on the type of the breakwater and OWC chamber: for the vertical OWC chamber integrated into the vertical breakwater, a fully regular mesh is used (Figure 4a); for the vertical and inclined OWC chamber integrated into sloped breakwater, structured and unstructured regular mesh are adopted (Figure 4b,c). The control volume varies from 31,200 to 48,000 in accordance with the wave period and the OWC device and breakwater configurations.

4. Results and Discussion

Investigations on the influence of the L-shaped duct OWC, the lip, and the OWC device configurations on the performance of the device were carried out using the mean pneumatic power. Additionally, the energy balance around the OWC device, which identifies significant energy quantities and the efficiency of the device, was also analyzed.

4.1. Mean Pneumatic Power Analysis

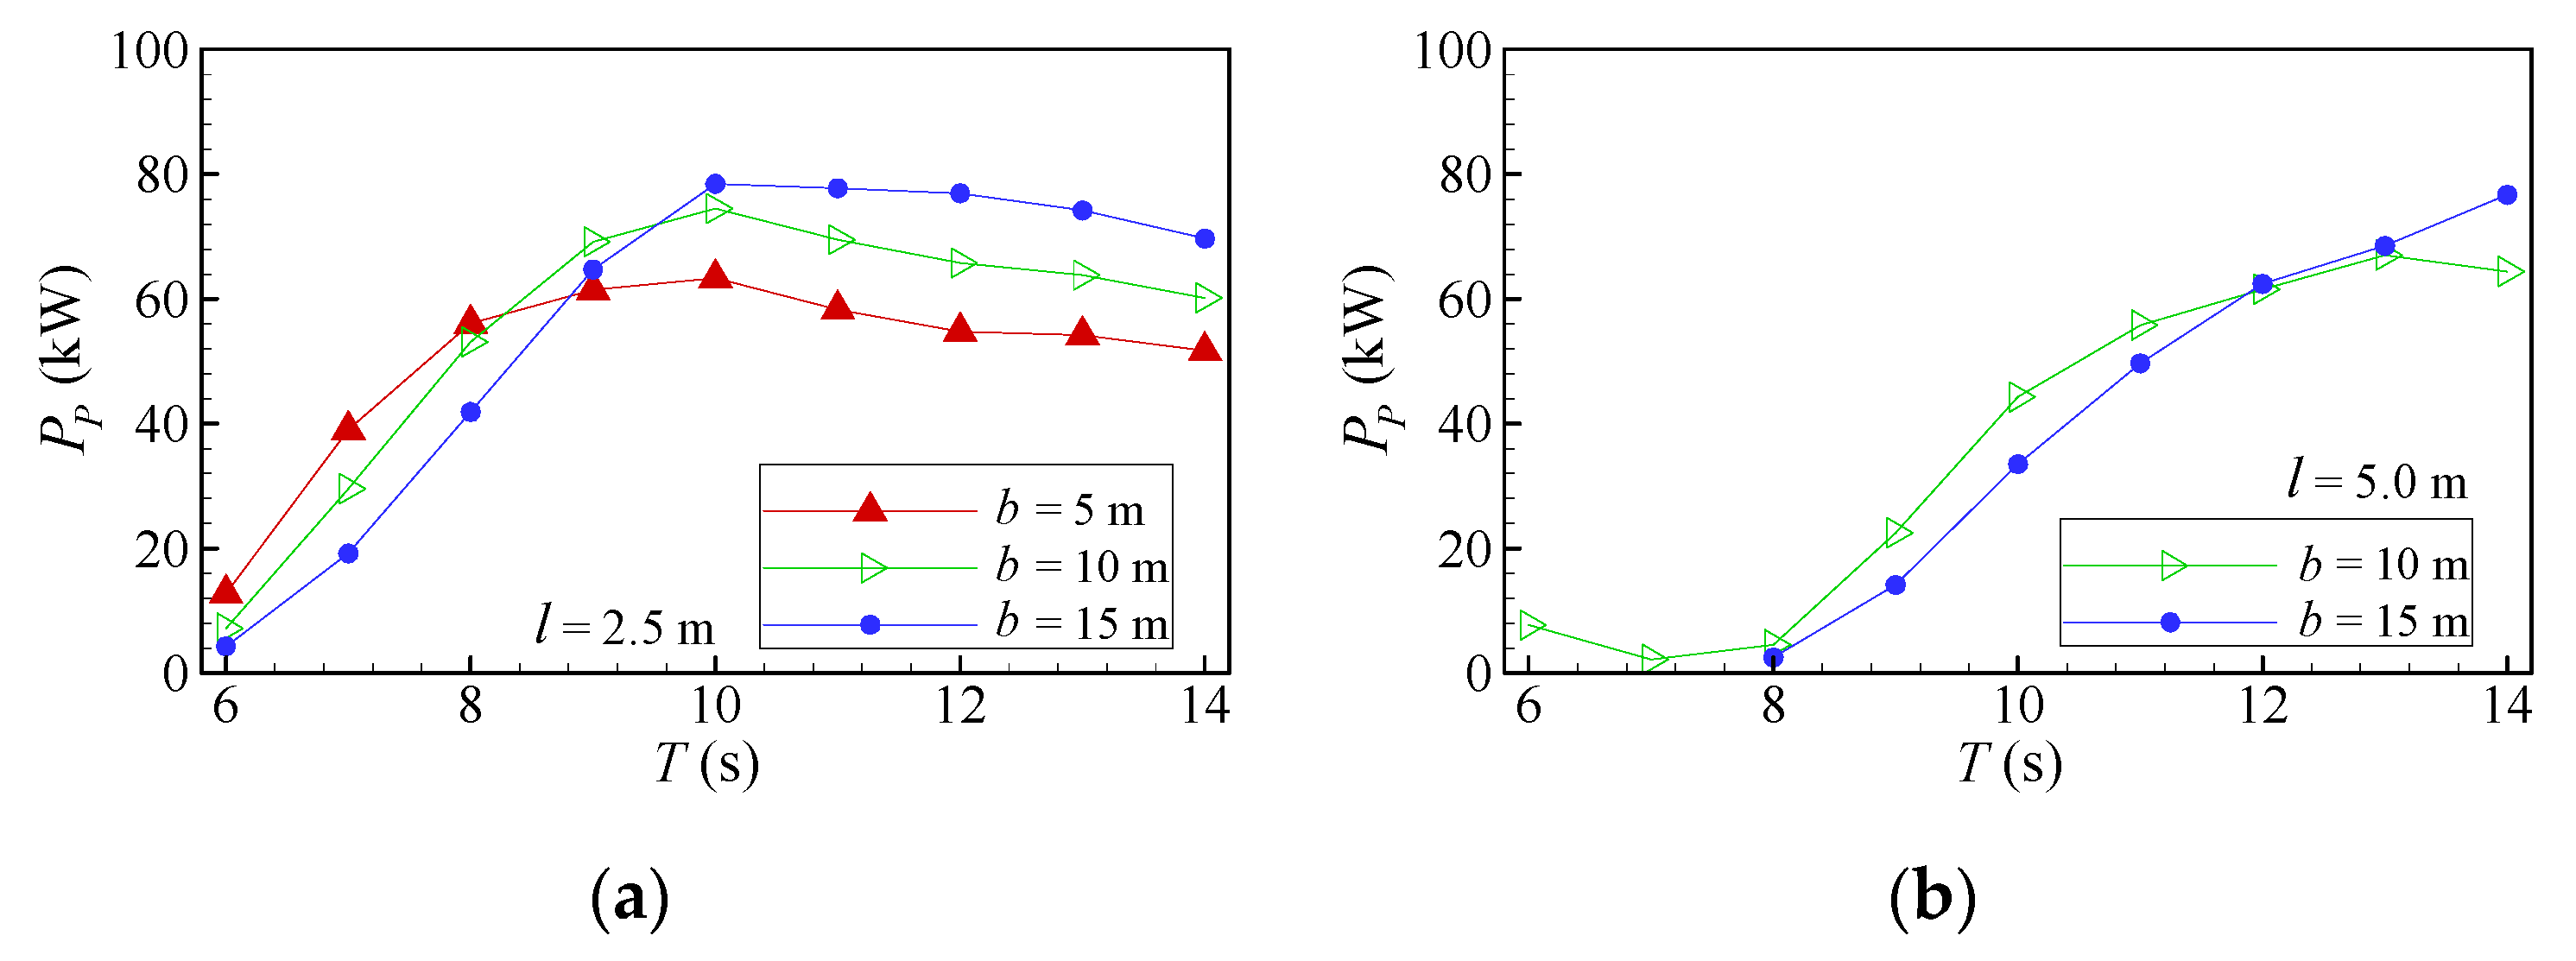
In this section, the mean pneumatic power over the wave period interval for all cases, shown in Figure 5, Figure 6 and Figure 7, is analyzed. Even if each configuration has its particularity, they present similar general behaviors in some aspects, which are the following:
  • There is a wave period, Tmax, in which PP reaches its maximum, PP,max, diminishing rapidly for wave periods below Tmax and decreasing smoothly above it, independently of the type of OWC chamber and breakwater, l and b.
  • PP,max and Tmax increase as the length of the L-shaped duct OWC, b, increases. In addition, the smaller PP,max and Tmax are always obtained for the smaller b and the larger ones for the larger b independently of the value of l.
  • In general, PP decreases with the increases of b for smaller wave periods. This behavior is inverted for larger wave periods. The shift in PP variation occurs in the intermediate wave period range. For this reason, none of the configurations provide the highest PP along the wave period range.
  • Tmax for l = 5.0 m is higher than the one for l = 2.5 m considering the same b.
  • Both behaviors, referred to in items (2) and (4), can be explained considering that the resonance depends on the length that fluid particles run from the water entrance to the OWC chamber [31,32]; therefore, the larger b and l are, the larger this length is.
In the case of vertical breakwaters with a vertical OWC chamber with l = 2.5 and 5.0 m, Figure 5, Tmax, in which PP,max occurs, varies from 8 to 11 s for l = 2.5 m, and from 10 to 13 s for l = 5.0 m, increasing with b. PP,max is displaced towards the larger wave periods increasing the submergence of the water entrance. PP,max obtained by b = 15 m at wave periods of 11 and 13 s, for l = 2.5 and 5.0 m, respectively, is around 37% higher than that of standard configurations (l = 2.5 and 5.0 m, and b = 0.5 m).
At the shortest wave period, 6 s, increasing b leads to a severe reduction of the PP: the difference between b = 0.5 and 15 m reaches 60 and 84% for l = 2.5 and 5.0 m, respectively. The reduction of PP, compared to b = 0.5 m, is more pronounced for l = 5.0 m than for 2.5 m and occurs in a wide wave period range. Conversely, at larger wave periods, PP is improved, increasing b. For l = 2.5 m, and wave periods larger than 11 s, the PP improvement is around 17, 34, and 50% for b = 5, 10, and 15 m, respectively, compared to the PP of the standard configuration. For l = 5.0 m, and wave periods larger than 13 s, the PP improvement is around 25, 45, and 75% for b = 5, 10, and 15 m, respectively, compared to the PP of the standard configuration.
The analysis based only on values of PP shows that the better value of b depends on the characteristics of the local sea state. The standard conception (b = 0.5 m) has the advantage that PP shows few variations along the wave period, for both l = 2.5 and 5.0 m. Although this standard configuration has the disadvantage that PP is lower than those obtained by larger b for intermediate and larger wave periods, PP has larger values at shorter wave periods. In comparison with the standard configuration, the case with b = 5 m and l = 2.5 m exhibits an interesting behavior since it is the unique one in which PP is higher at almost all wave periods. Therefore, this configuration can be a more favorable general conception for the OWC device.
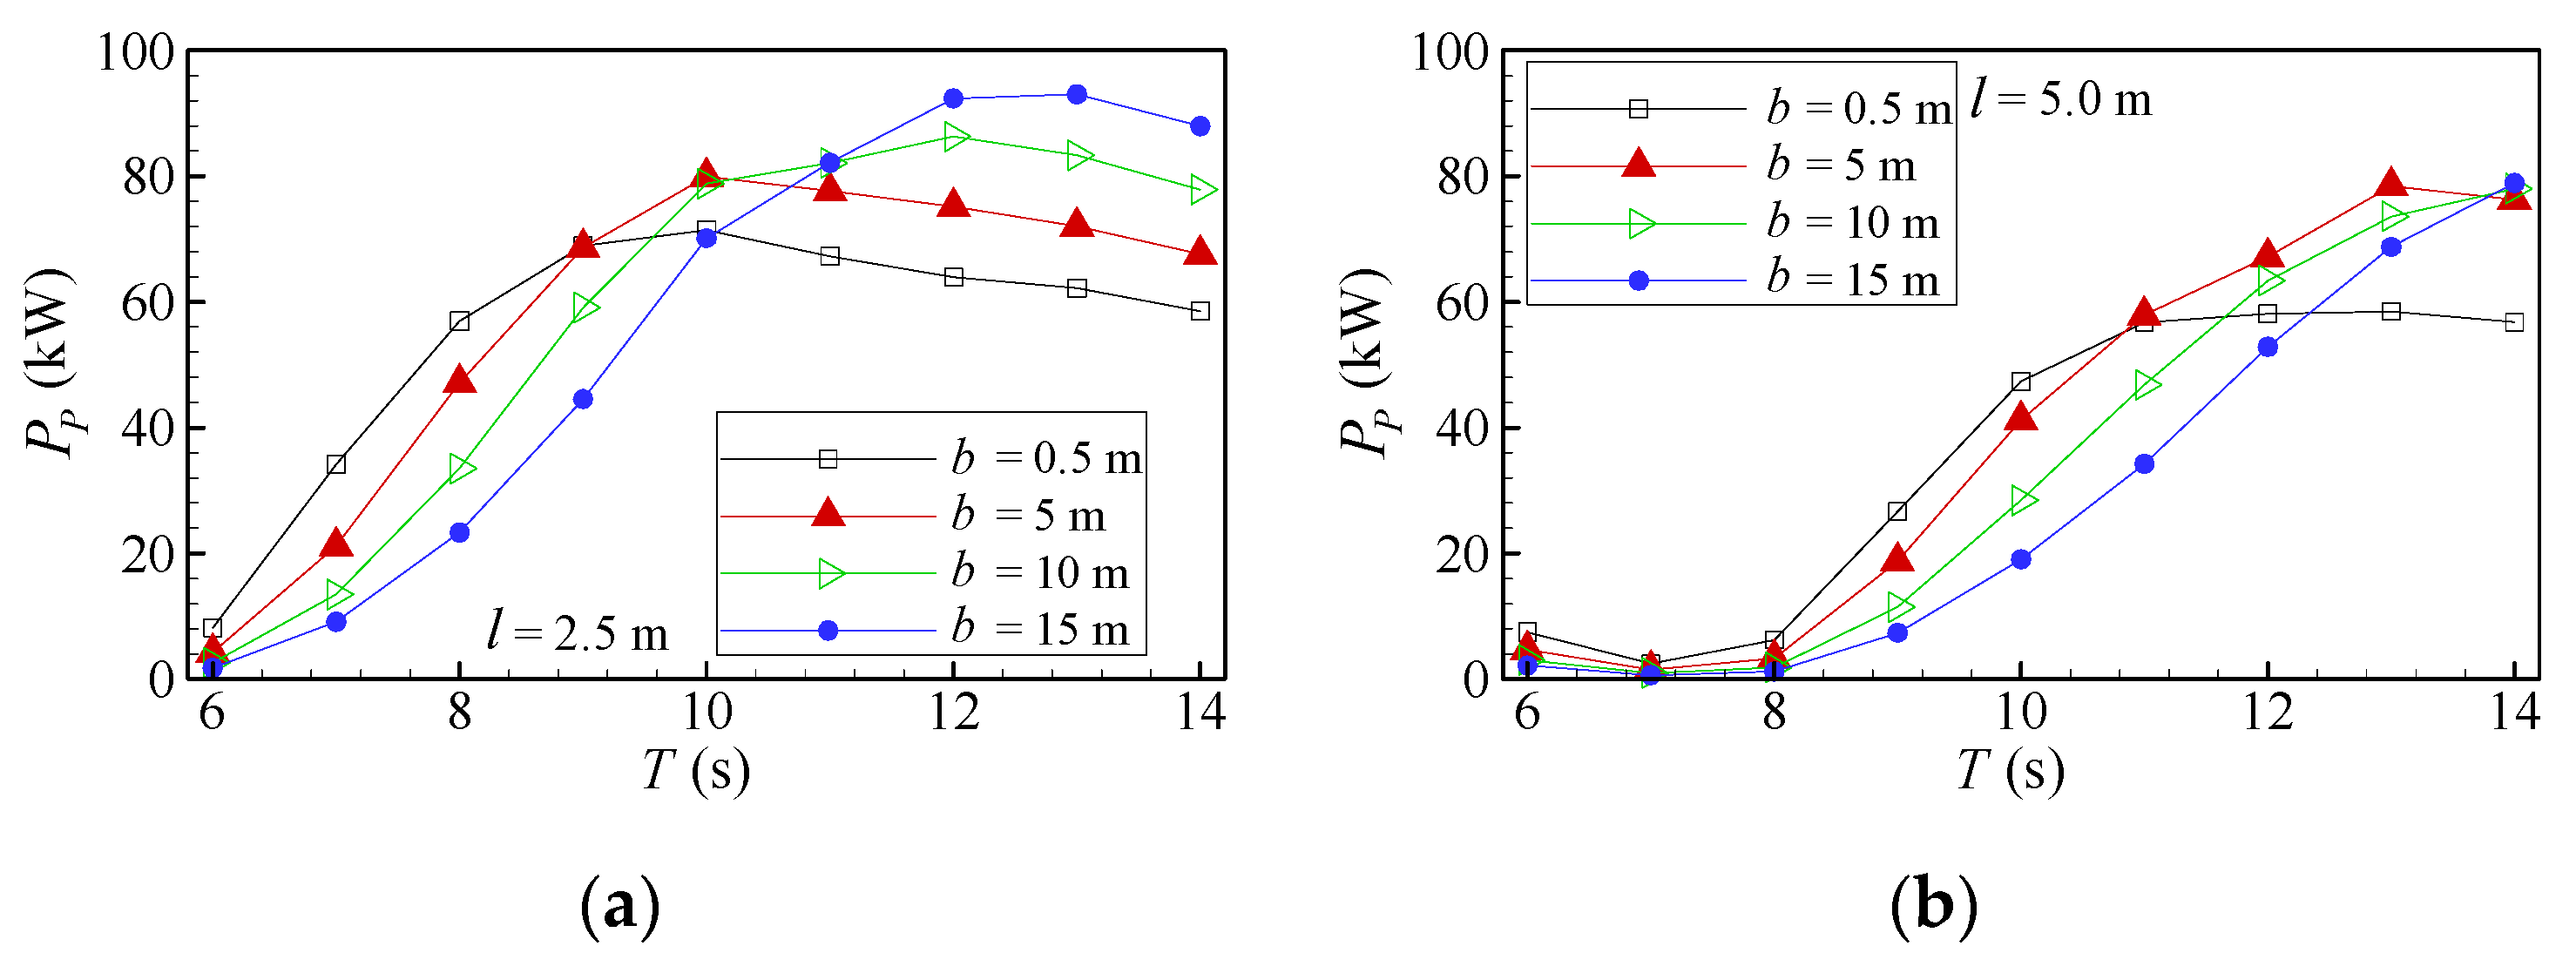
In the case of 2:3 sloped breakwaters with l = 2.5 and 5.0 m, and vertical and inclined OWC chambers, Figure 6 and Figure 7, respectively, a small PP at shorter wave periods is observed, with values around, and smaller than, 10 kW for T = 6 s and l = 2.5 m and near zero for T from 6 to 8 s for l = 5.0 m. In addition, configurations with vertical and inclined OWC chambers and l = 2.5 m show a similar trend, which is different from that observed for both configurations with l = 5.0 m.
In the case of both configurations with l = 2.5 m, Figure 6a and Figure 7a, PP follows more or less the same trend independently of b. Tmax is almost constant for the vertical OWC chamber, around 10 s, whereas it varies from 10 to 13 s for the inclined OWC chamber. The highest PP,max is obtained by b = 15 m at wave periods 10 s and 13 s, for vertical and inclined OWC chambers, respectively. It can also be noted that the PP,max is always greater for the inclined OWC chamber than the vertical OWC chamber for the same b; differences are 26, 16, and 18% for b = 5, 10, and 15 m, respectively. In addition, the PP of the inclined OWC chamber shows a larger PP than the one of the vertical OWC chamber for larger wave periods. The inverse occurs at smaller wave periods, and the shift between the two situations occurs around the intermediate wave periods.
Both configurations with l = 5.0 m, Figure 6b and Figure 7b, show a loss of performance compared to configurations with l = 2.5 m over a wide range of wave periods. The PP obtained at shorter wave periods is very small and, in general, smaller than the one obtained for l = 2.5 m for almost all values of b, except at the largest wave periods.
In summary, a larger water entrance of the L-shaped duct OWC, i.e., l = 2.5 m, and a vertical OWC chamber present a more suitable option for an OWC device integrated into a sloped breakwater for common sea states.
It may also be noticed that the values of PP obtained by the vertical OWC chamber integrated into the sloped breakwater are significantly lower than those obtained by the vertical breakwater. The inclined OWC chamber integrated into the sloped breakwater does not modify this general trend over a wide range of wave periods, even if this trend is slightly inverted for the largest wave periods.

4.2. Energy Balance Analysis

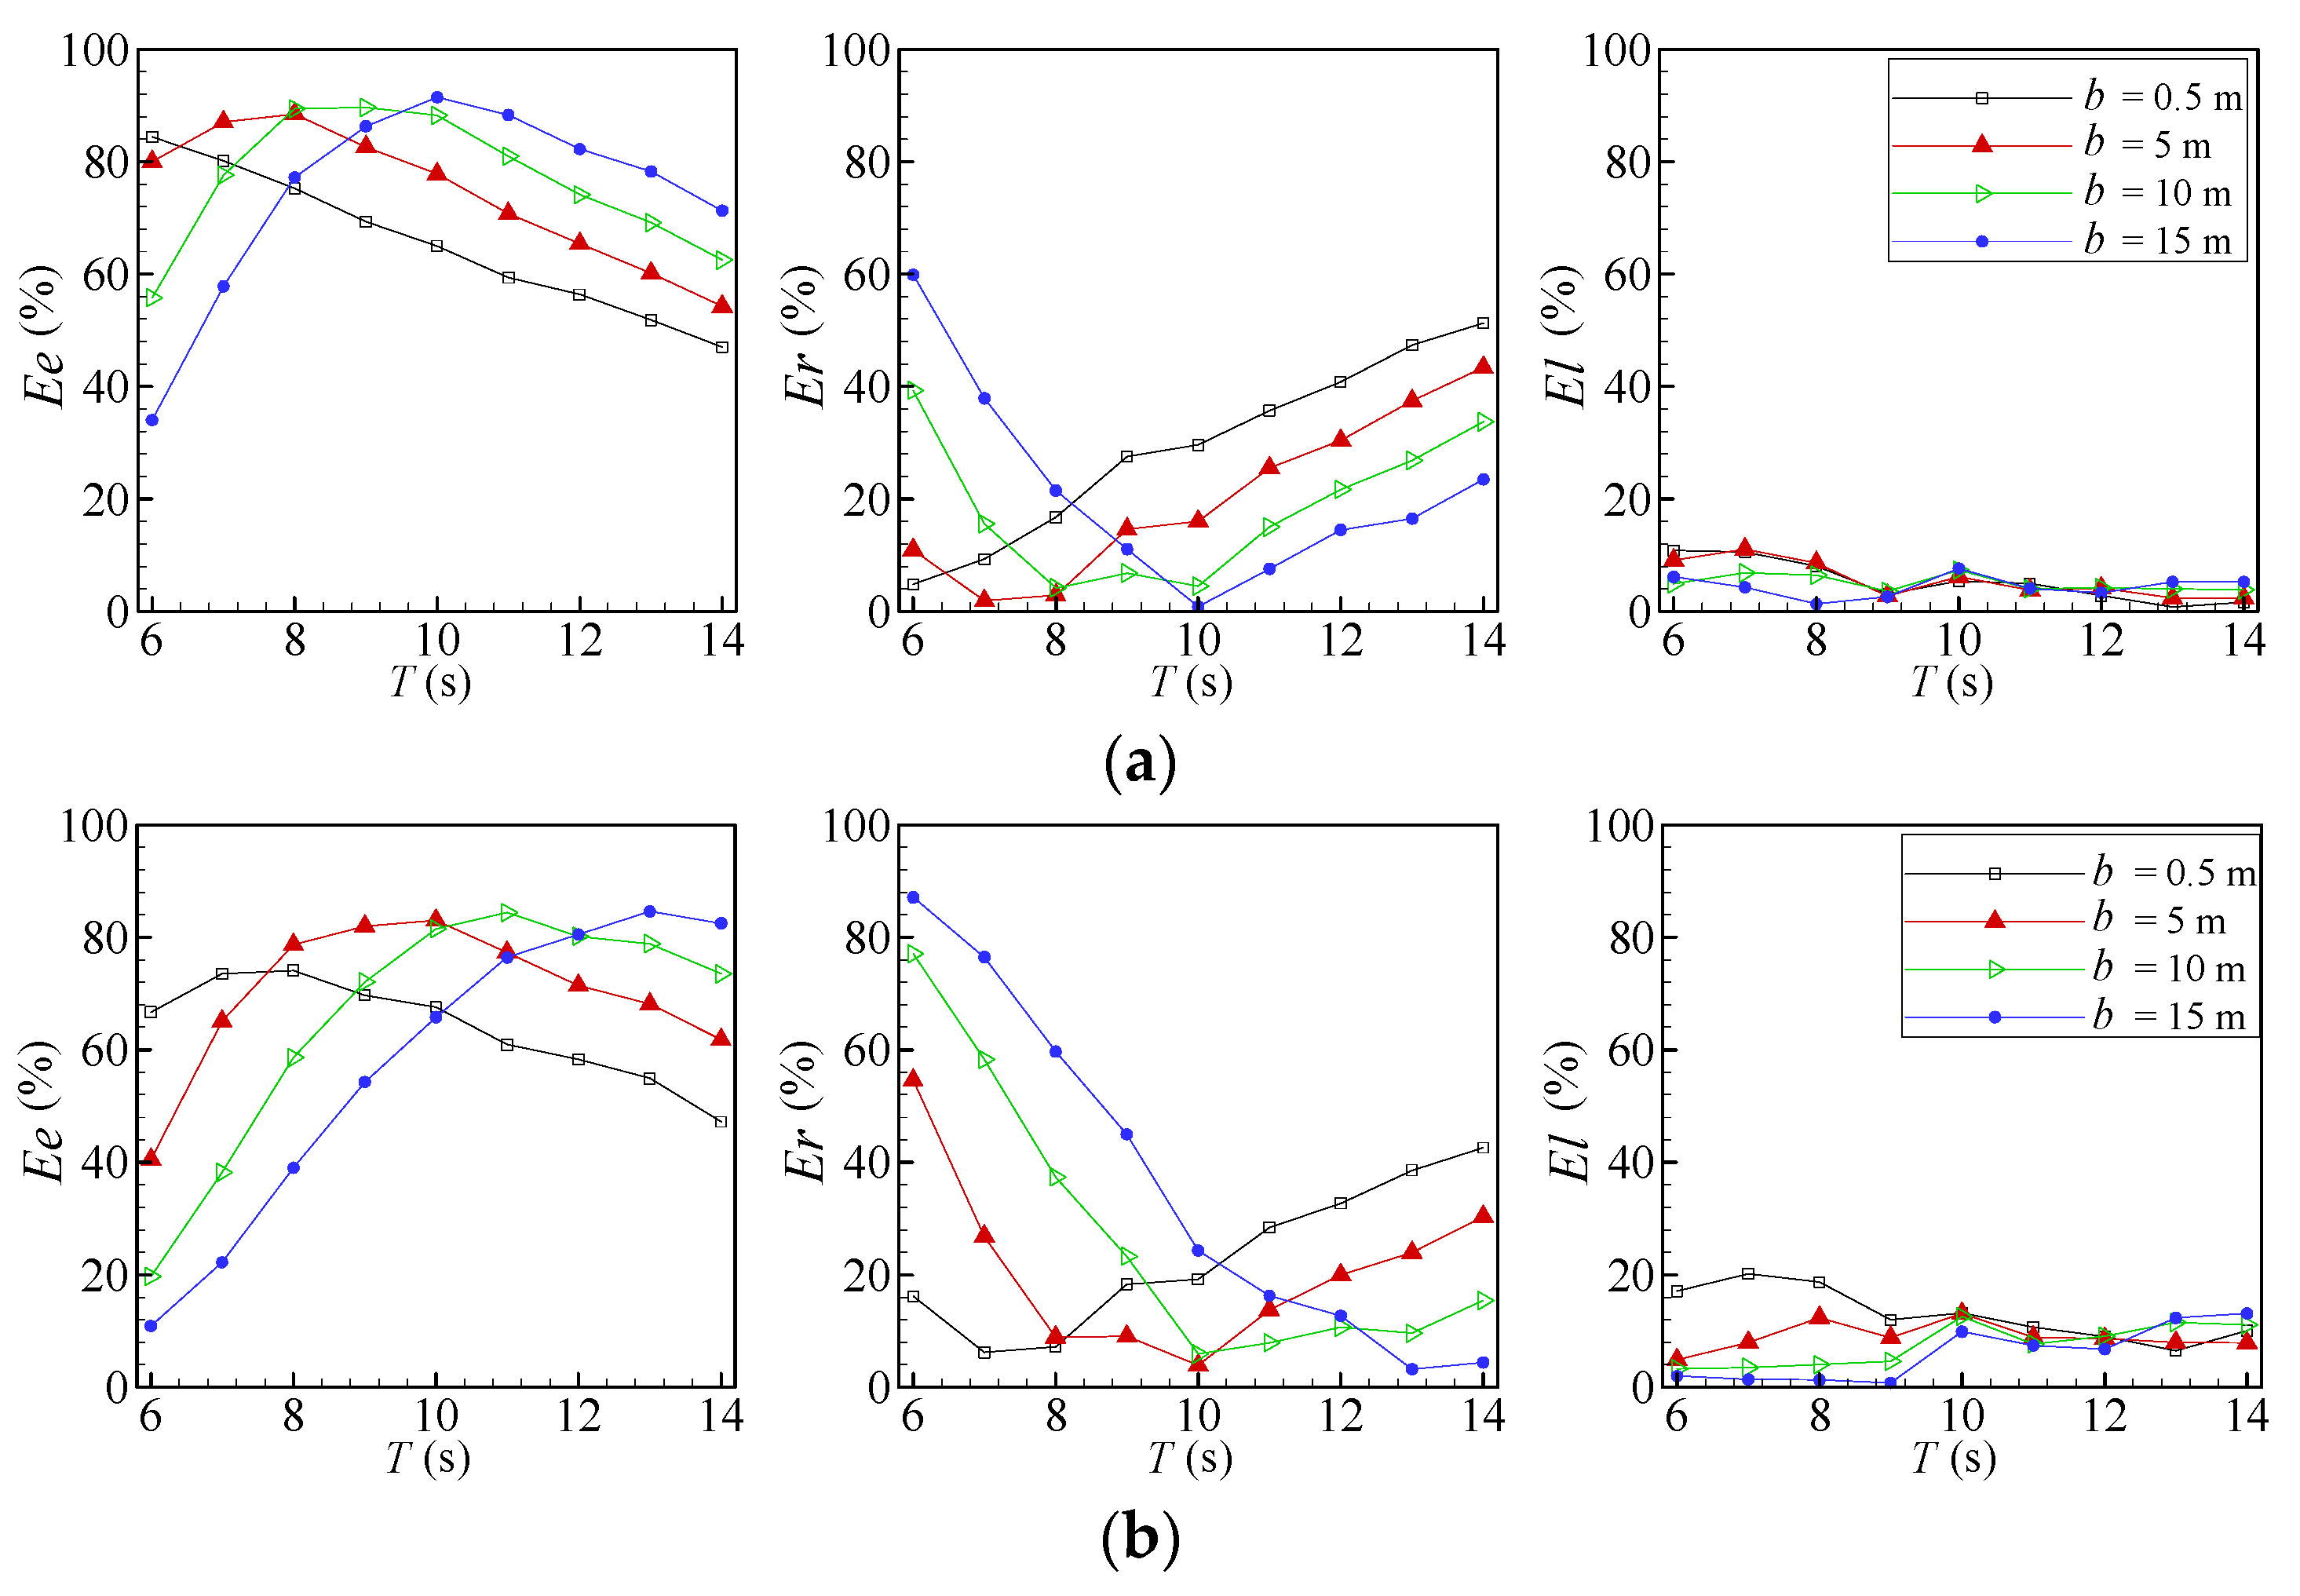
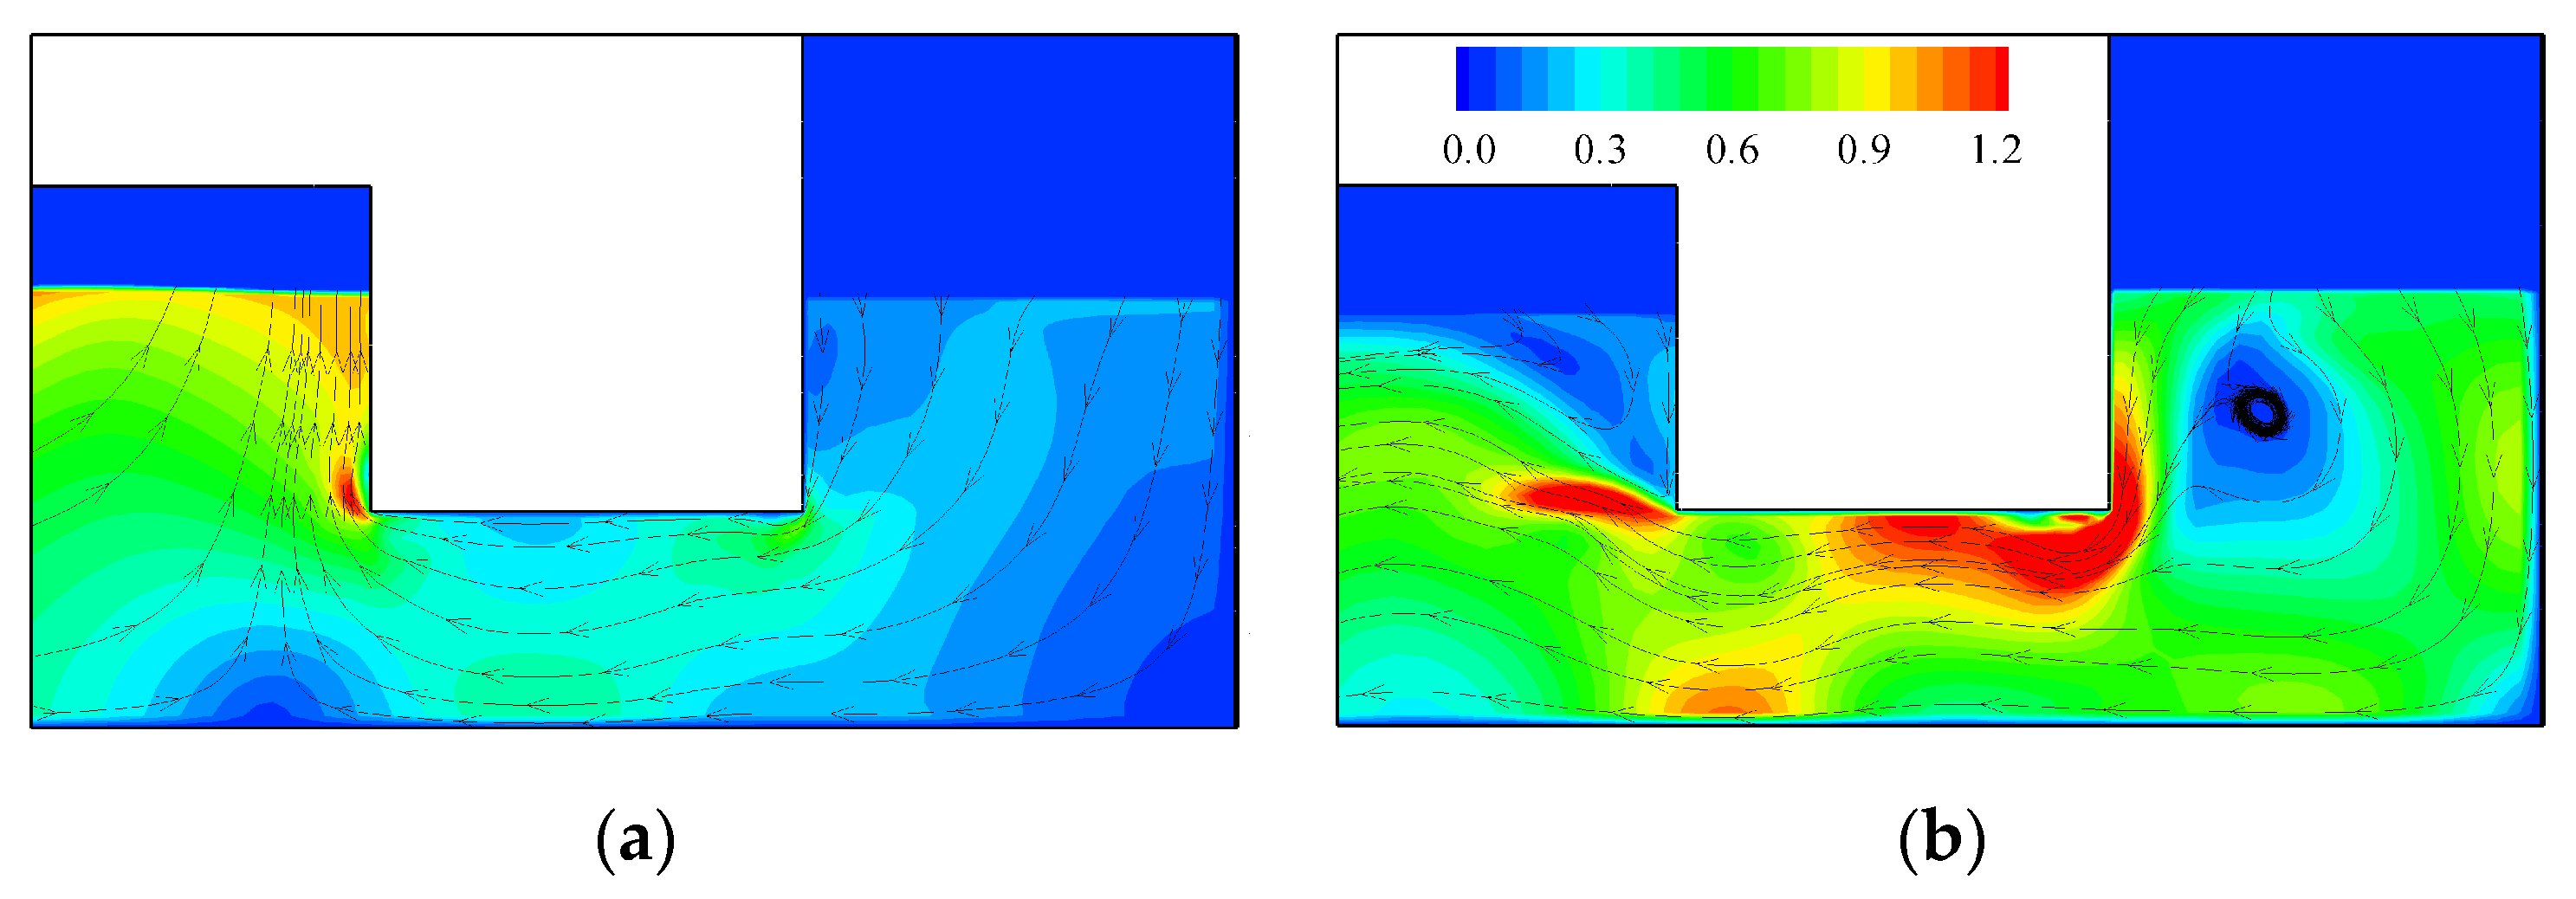
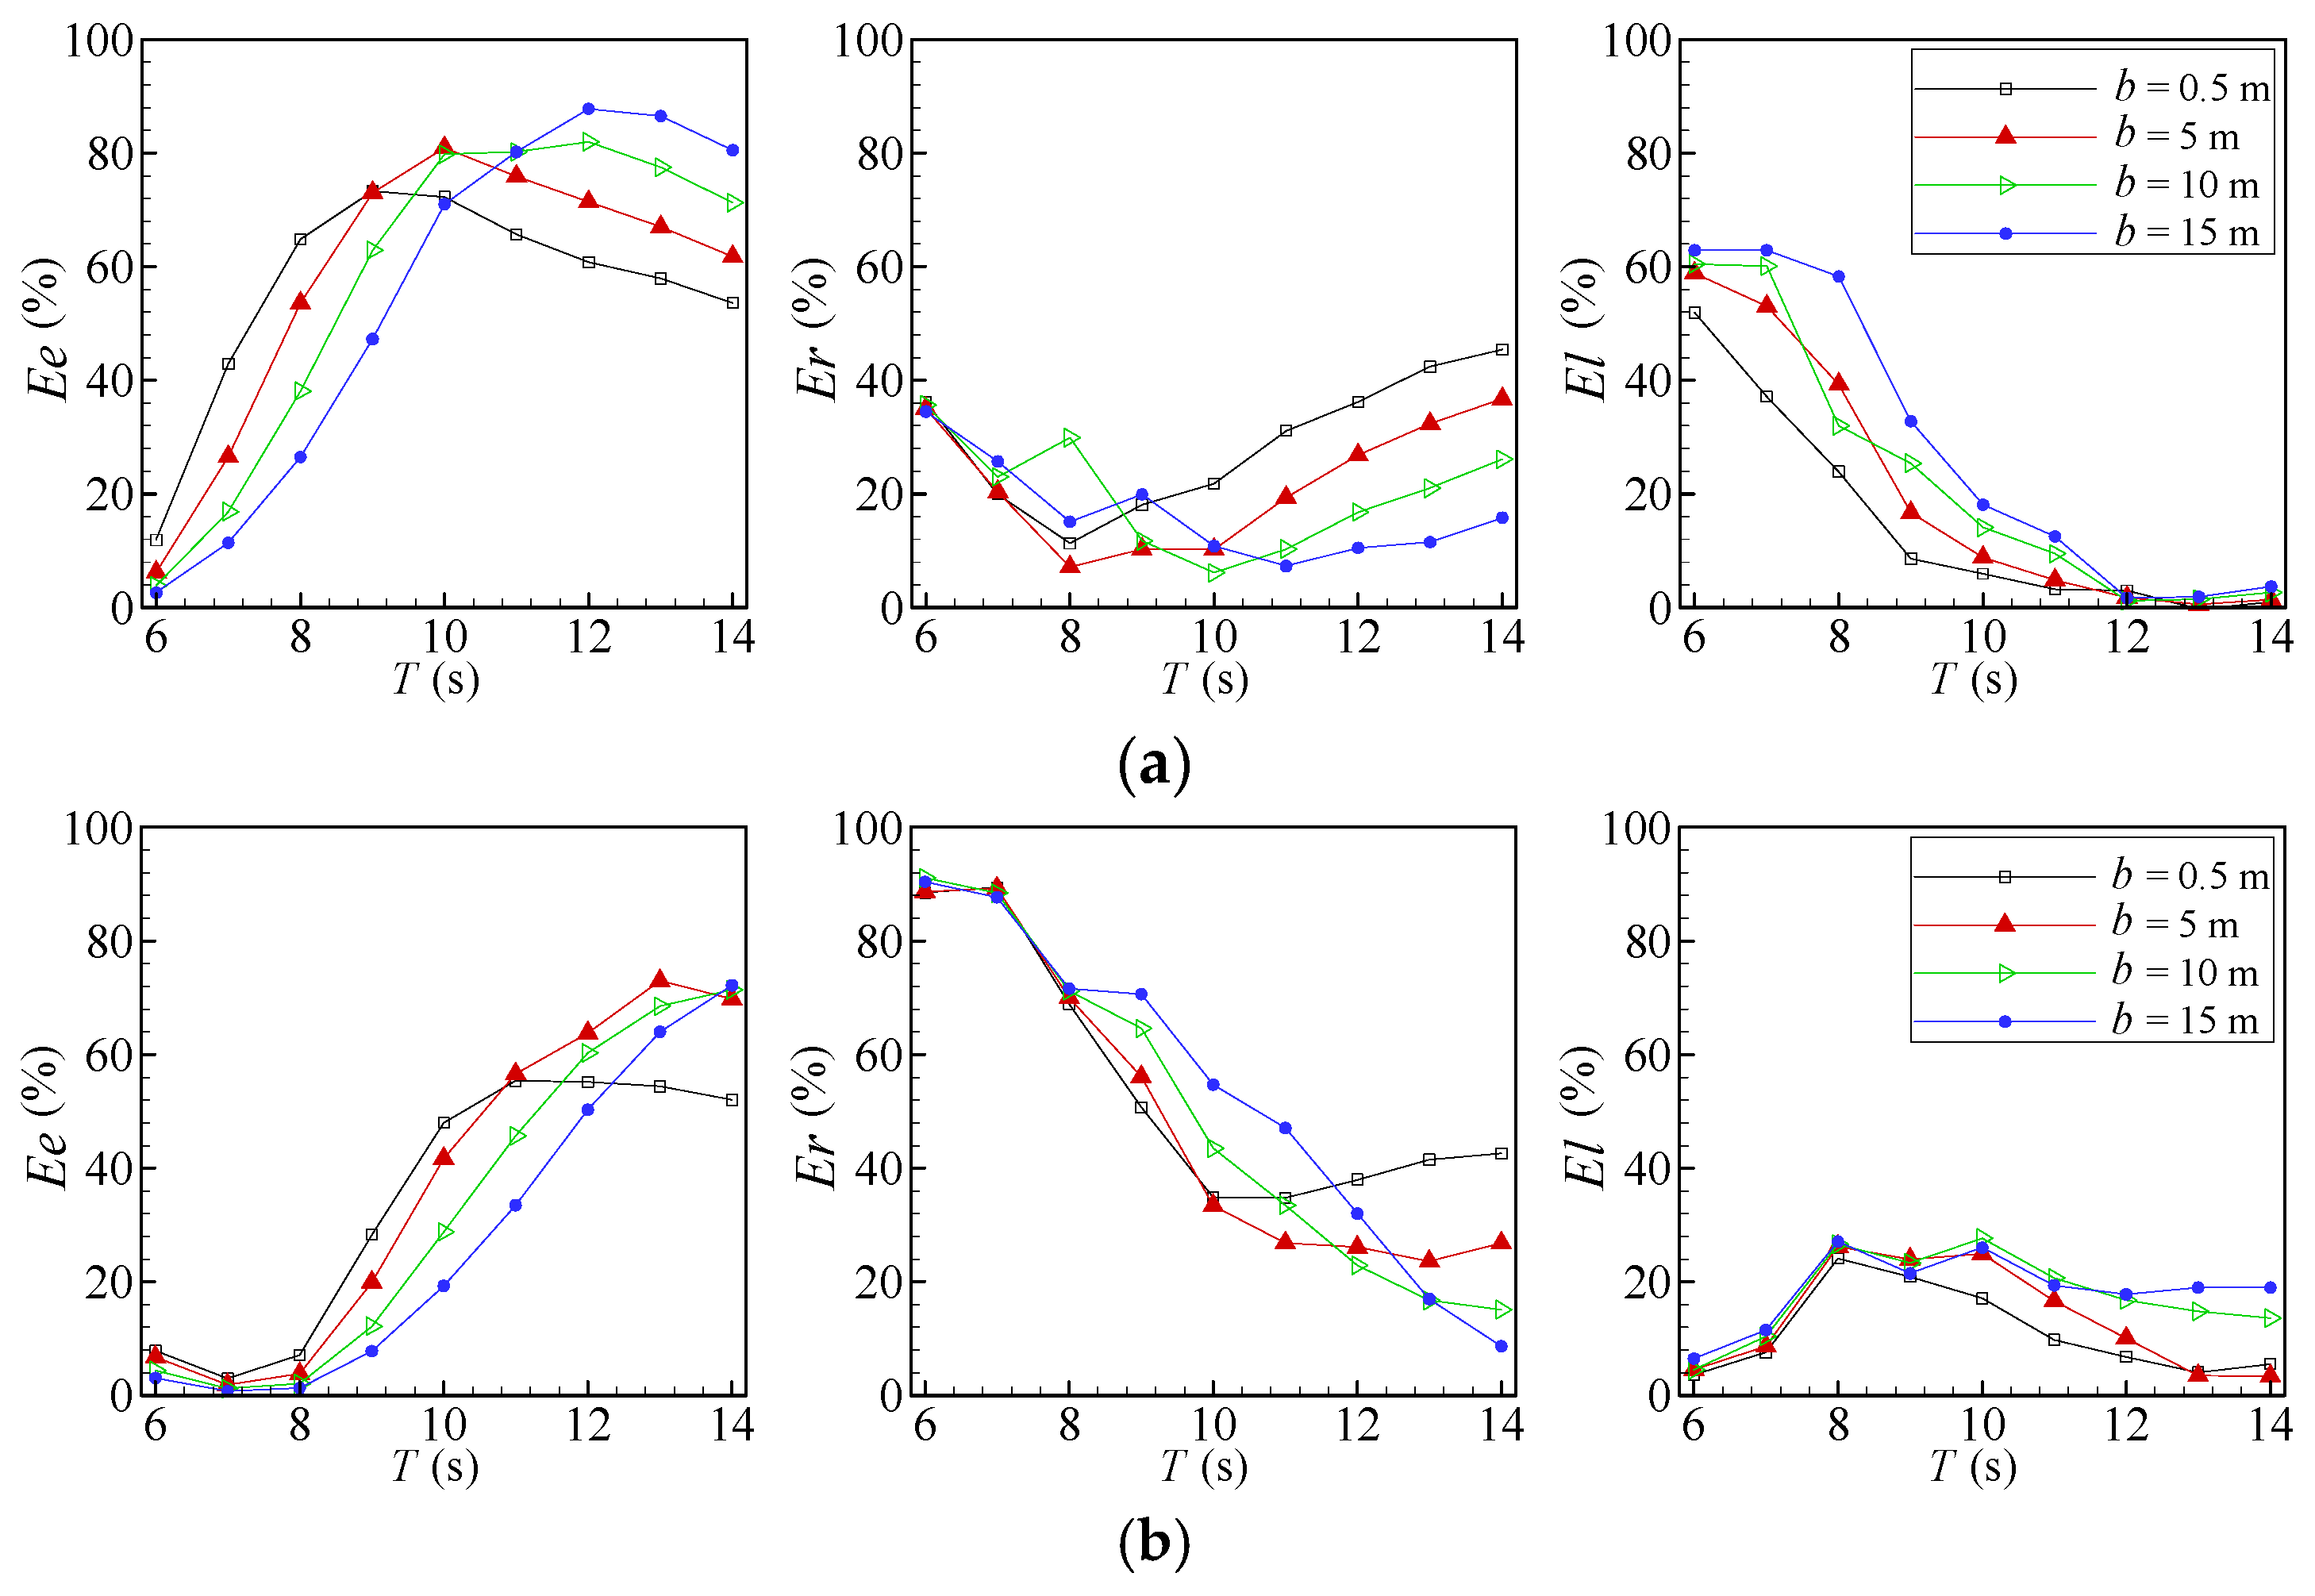
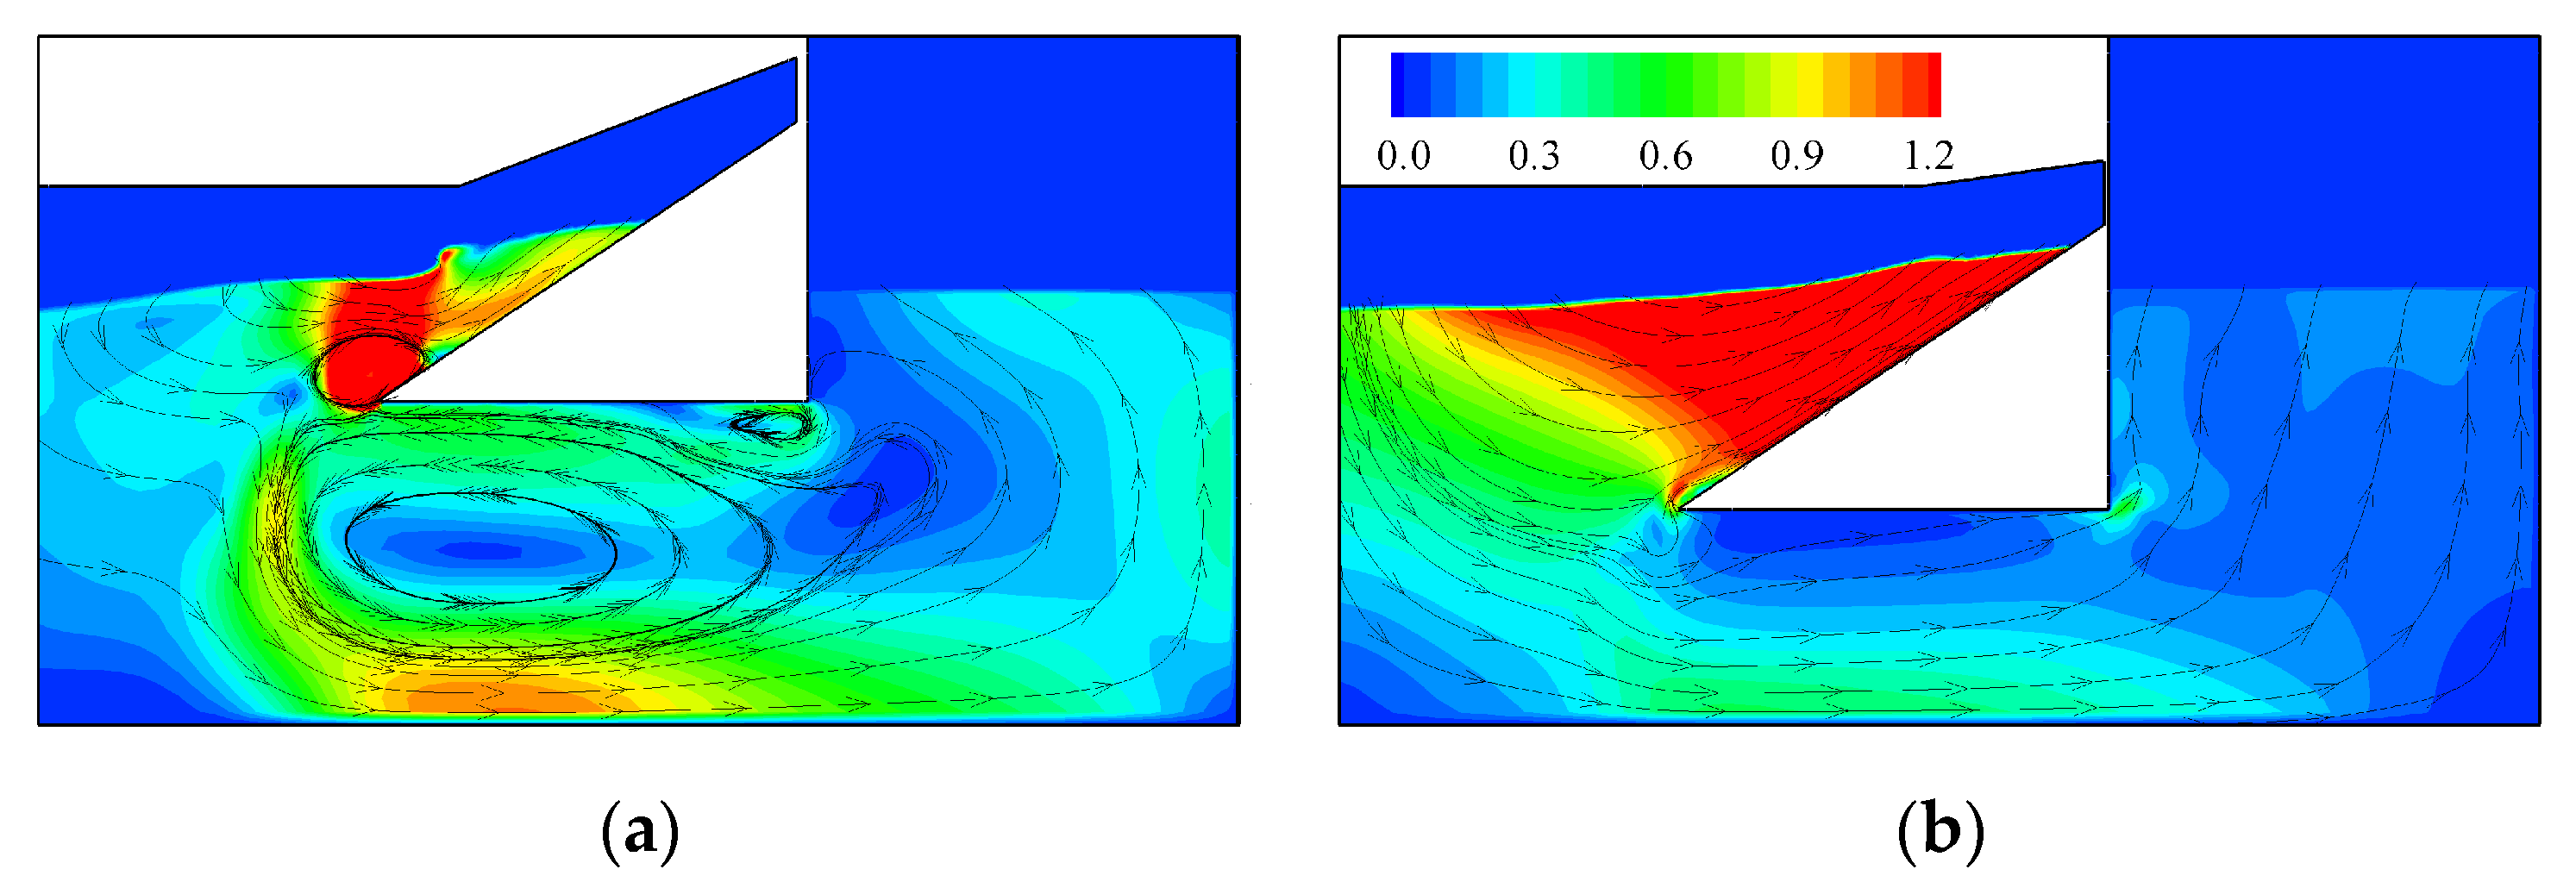
Figure 8 shows the energy balance obtained by the vertical OWC chamber integrated into a vertical breakwater with l = 2.5 and 5.0 m and Figure 9 compares the velocity magnitude and instantaneous streamlines in the proximity of the device for l = 5.0 m and b = 10 m at T = 6 and 14 s. Figure 10 and Figure 11 show the energy balance obtained by the vertical and inclined OWC chamber integrated into a 2:3 sloped breakwater with l = 2.5 and 5.0 m, and Figure 12 shows the velocity magnitude and instantaneous streamlines in the proximity of the device for the vertical OWC chamber integrated into the sloped breakwater for b = 10 m and both lips. The quantities Ee, Er, and El, which represent the percentage of the energy distribution of the incident wave energy EI, have some similar behaviors:
  • Ee and Er have inverse behaviors, i.e., when one percentage increases the other decreases. This is an expected trend since higher Cr implicates lower energy harvested by the device.
  • Ee is maximum when Er is minimum.
  • The increase in l, i.e., the reduction of the water entrance of the L-shaped duct OWC, leads to an increase in Er for smaller wave periods, which indicates that the frontal wall submersion blocks the water flow that passes through the OWC chamber and the energy flux that is essentially concentrated in the proximity of the free surface. At larger wave periods, Er decreases since the energy flux is distributed over the entire water column.
  • The efficiency (Ee) has similar behaviors to those observed in the variations in PP with b and l.
  • For the incident agitation conditions tested, there is no wave breaking, only a kind of standing wave for the vertical breakwater and a surging one for the sloped 2:3 breakwater.
In the case of vertical breakwaters with a vertical OWC chamber, with l = 2.5 and 5.0 m, Figure 8, El reaches a maximum value of around 20% for l = 5.0 m and b = 0.5 m at shorter wave periods. Nevertheless, in general, El remains less than around 10%, which indicates that the losses due to viscosity and turbulence are not the physical phenomenon that contributes most to the reduction of the extracted energy by the device.
The behaviors of Er with the wave period and b explain the behavior observed for Ee, and also PP: the lower the reflection is, the higher the extracted energy is, and vice versa. The maximum Ee, Eemax, increases slowly from b = 0.5 to 15 m: Eemax varies from 84.4 to 91.4% for l = 2.5 m and from 74.1 to 84.6% for l = 5.0 m. At a wave period of 6 s, Ee is drastically reduced, increasing b: for l = 2.5 m, Ee decreases from 84.4 to 34% for b = 0.5 and 15 m, respectively, and for l = 5.0 m, the Ee reduction is from 66.7 to 10.9% for b = 0.5 and 15 m, respectively. For T = 6 s and b = 15 m, the small value of Ee is essentially caused by the high Er, around 90%. The increase in the L-shaped duct OWC length induces a kind of flow blocking inside the OWC chamber for smaller wave periods, which leads to the decrease in Ee and the loss of performance of the OWC device. This is illustrated in Figure 9, which compares the velocity magnitude and instantaneous streamlines in the proximity of the device for l = 5.0 m and b = 10 m at T = 6 and 14 s at the instant of the maximum air flow rate inhalation. At T = 6 s, the flow dynamics inside the OWC chamber are low and lead to a strong reflection of incident waves.
In the case of 2:3 sloped impermeable breakwaters with l = 2.5 and 5.0 m, and vertical and inclined OWC chambers, Figure 10 and Figure 11, respectively, the water entrance dimension of the L-shaped duct OWC leads to a significant difference in balance energy. Viscous and turbulence energy losses, El, generally tend to an increase with b. Nevertheless, the behavior observed for l = 2.5 m is quite different from that for l = 5.0 m. For l = 2.5 m and both vertical and inclined OWC chambers, Figure 10a and Figure 11a, respectively, El varies around 40 to 60% at shorter wave periods and reduces to less than 10% at wave periods above, more or less, 11 s. For l = 5.0 m and both vertical and inclined OWC chambers, Figure 10b and Figure 11b, respectively, El is almost zero for T = 6 s and increases with T to reach a maximum of around 30% for intermediate wave periods before diminishing slightly at larger wave periods.
The behavior of Er is also quite different, varying l from 2.5 to 5.0 m, especially for shorter wave periods. For l = 5.0 m, Er is greater than 90% at T = 6 and 7 s, independently of the value of b, whereas it is only around 20 to 40% for l = 2.5 m. Er varies in a similar way to that observed for the vertical OWC chamber integrated into the vertical breakwater, for l = 2.5 m, which is also probably the case for l = 5.0 m, but the limit of the study interval of wave periods does not allow for the confirmation of this tendency.
The variation in Ee results from the losses due to viscosity, turbulence, and wave reflection. The Eemax, for l = 2.5 m, increases from 65.4 to 79.5% for b = 5 and 15 m, respectively, for the vertical OWC chamber and from 73.3 to 87.8% for b = 0.5 and 15 m, respectively, for the inclined OWC chamber. It can be noted, at shorter wave periods and especially T = 6 s, that the simultaneous large values of both El and Er lead to the smaller Ee. For l = 5.0 m, Ee is smaller than 10% from T = 6 to 8 s, for both vertical and inclined OWC chambers. At both wave periods of 6 and 7 s, the small Ee is essentially due to the large Er, as already seen before in the case of a vertical OWC chamber integrated into a vertical breakwater with l = 5.0 m and b = 15 m. The small value of Ee at the shortest wave period, i.e., T = 6 s, is related to the L-shaped duct OWC length and amplified by the water entrance depth, which modifies the length of the breakwater slope and affects the type of interaction with the incident wave. Figure 12 shows the velocity magnitude and instantaneous streamlines in the proximity of the device at the instant of the maximum air flow rate exhalation for the vertical OWC chamber integrated into the sloped breakwater for b = 10 m and both lips. In both configurations, a run-up can be noted on the breakwater slope. For l = 2.5 m, a large vortex almost fills the L-shaped duct OWC, the flow inside the chamber is weak, and a strong interaction occurs above the breakwater slope between the run-up and the vortex at the water entrance of the L-shaped duct OWC, which results in large values of El and Er. For l = 5.0 m, the flow inside the L-shaped duct OWC and the chamber is very weak, almost null in the chamber, causing a kind of flow blocking, such as a wall, with the flow being directed above the breakwater slope. The run-up/run-down is at a maximum, which leads to a high Er and a small El.

5. Conclusions

The L-shaped duct OWC device integrated into the vertical and 2:3 sloped impermeable breakwaters were investigated by means of the free-surface RANS-based ANSYS-Fluent® software for modeling the wave–structure interaction in a 2D wave flume. The performance and hydrodynamics, through the analysis of energy balance, of the vertical OWC chamber integrated into a vertical breakwater, and the vertical and inclined OWC chamber integrated into a 2:3 sloped breakwater were analyzed. The influence of the submergence of the device frontal wall, l = 2.5 and 5.0 m, and the length of the L-shaped duct OWC, b = 0.5, 5, 10, and 15 m, were investigated at regular incident wave periods from 6 to 14 s and a wave height of 1 m.
For the vertical breakwater, it may be concluded that the performance of the OWC device, Ee, with l = 2.5 m is better than the one with l = 5.0 m. Regarding the influence of the length b, the Ee increased with the increase in b for larger waves and diminished for shorter ones. For a larger b and smaller wave periods, a kind of flow blocking inside the OWC chamber occurs and leads to the loss of performance of the OWC device. The maximum Ee occurs at different wave periods depending on b and l, which means that the better parameters depend on the characteristics of the local sea state. It may be emphasized that the configuration with l = 2.5 m and b = 5 m allows for maintaining a high Ee while avoiding its strong reduction at shorter wave periods, as occurs with other configurations. Energy losses due to viscous forces, dissipation, and turbulence, (El), are lower than 20% and the larger part of incident wave energy that is not harvested by the OWC device is due to the wave energy reflection, Er, which has an inverse behavior to that of Ee, i.e., when one increases the other decreases. The maximum Ee occurs for smaller Er.
For the sloped breakwater, the two types of OWC devices with vertical and inclined OWC chambers presented similar behaviors. The results show that the inclination of the OWC chamber has only a little influence on the Ee. The increase in the submergence frontal wall of the device modifies the Ee significantly, which hardly reduces at shorter wave periods, due to a high reflection of incident wave energy, and exhibits its maximum at larger wave periods. These effects on Ee are amplified by the increase in the L-shaped duct OWC, b, which makes some configurations quite inviable in the common sea state. In general, the larger part of incident wave energy that is not harvested by the OWC device is due to the wave energy reflection. However, in the case of the configuration with l = 2.5 m, the energy losses are more significant, especially at shorter wave periods.
The results of this study showed that (i) the performance of the OWC device varies significantly with its geometric configuration, which needs to be adapted for the local sea state, and (ii) the vertical OWC chamber integrated into a vertical breakwater with a small lip and short L-shaped duct OWC length provides not the highest, but the most regular performance over a typical wave period interval of maritime agitation. It also highlights the unavoidable loss of OWC device performance that may occur, especially at shorter wave periods, in the case of hybrid devices that combine two well-known concepts, the OWC and an OWEC (overtopping wave energy converter) integrated into a rubble-mound breakwater. Studies considering the effect of porous media, which compose rubble mound breakwaters, on the performance of OWC devices, must be advanced. For a more complete study of the performance of the devices, the tidal effect should also be analyzed, as the submergence of the device inlet and local water depth necessarily have an impact on the efficiency of the OWC devices.

Author Contributions

Conceptualization, E.D. and P.R.F.T.; methodology, E.D. and P.R.F.T.; formal analysis, E.D. and P.R.F.T.; investigation, E.D. and P.R.F.T.; data curation, E.D.; writing—original draft preparation, E.D. and P.R.F.T.; writing—review and editing, E.D. and P.R.F.T.; visualization, E.D. All authors have read and agreed to the published version of the manuscript.

Funding

This research was funded by CNPq (307546/2921-7) and FAPERGS (21/2551-0002014-8).

Data Availability Statement

The data presented in this study are available on request from the corresponding author. The data are not publicly available due to privacy reasons.

Acknowledgments

The authors acknowledge the cooperation between the Federal University of Rio Grande—FURG, Brazil, and the National Laboratory of Civil Engineering—LNEC, Portugal. Paulo R. F. Teixeira acknowledges the support of CNPq and FAPERGS.

Conflicts of Interest

The authors declare no conflicts of interest.

References

  1. Mørk, G.; Barstow, S.; Kabuth, A.; Pontes, M.T. Assessing the Global wave energy potential. In Proceedings of the 29th International Conference on Ocean, Offshore Mechanics and Artic Engineering, OMAE (2010), Honolulu, HI, USA, 16–17 February 2010. [Google Scholar]
  2. Gunn, K.; Stock-Williams, C. Quantifying the Global wave power resource. Renew. Energy 2012, 44, 296–304. [Google Scholar] [CrossRef]
  3. Reguero, B.G.; Losada, I.J.; Méndez, F.J. A global wave power resource and its seasonal, interannual and long-term variability. Appl. Energy 2015, 148, 366–380. [Google Scholar] [CrossRef]
  4. Ahamed, R.; KcKee, K.; Howard, I. Advanced of wave energy converters based on power take off (PTO) systems: A review. Ocean Eng. 2020, 204, 107248. [Google Scholar] [CrossRef]
  5. Falcão, A.F.O. Wave energy utilization: A review of technologies. Renew. Sustain. Energy Rev. 2010, 14, 889–918. [Google Scholar] [CrossRef]
  6. Aderinto, T.; Li, H. Ocean wave energy converters: Status and challenges. Energies 2018, 11, 1250. [Google Scholar] [CrossRef]
  7. Masuda, Y.; McCormick, M.E. Experiences in Pneumatic Wave Energy Conversion in Japan. In Utilization of Ocean Waves: Wave to Energy Conversion; McCormick, M.E., Kim, Y.C., Eds.; ASCE: New York, NY, USA, 1987. [Google Scholar]
  8. Takahashi, S.; Nakada, H.; Ohneda, H.; Shikamori, M. Wave power conversion by a prototype wave power extracting caisson in Sakata port. In Proceedings of the 23rd International Conference on Coastal Engineering, ASCE, Reston, VA, USA, 29 January 1992. [Google Scholar]
  9. Raju, V.S.; Neelamani, S. Concrete caisson for a 150 KW wave energy pilot plant: Design, construction and installation aspects. In Proceedings of the 2nd International Offshore Polar Engineering Conference, San Francisco, CA, USA, 14–19 June 1992. [Google Scholar]
  10. Heath, T.; Whittaker, T.J.T.; Boake, C.B. The design, construction and operation of the LIMPET wave energy converter. In Proceedings of the 4th European Wave Energy Conference, Aalborg, Denmark, 4–6 December 2000. [Google Scholar]
  11. Falcão, A.F.O. Stochastic modelling in wave power-equipment optimization: Maximum energy production versus maximum profit. Ocean Eng. 2004, 31, 1407–1421. [Google Scholar] [CrossRef]
  12. Josset, C.; Clément, A.H. A time-domain numerical simulator for oscillating water column wave power plants. Renew. Energy 2007, 32, 1379–1402. [Google Scholar] [CrossRef]
  13. Brito-Melo, A.; Neuman, F.; Sarmento, A.J.N.A. Full-scale data assessment in OWC Pico plant. Int. J. Offshore Polar Eng. 2008, 18, 27–34. [Google Scholar]
  14. Torre-Enciso, Y.; Ortubia, I.; Lopez de Aguileta, L.I.; Marques, J. Mutriku wave power plant: From the thinking out to the reality. In Proceedings of the 8th European Wave Tidal Energy Conference, Uppsala, Sweden, 7–10 September 2009. [Google Scholar]
  15. Boccotti, P. Comparison between a U-OWC and a conventional OWC. Ocean Eng. 2007, 34, 799–805. [Google Scholar] [CrossRef]
  16. Sentürk, U.; Özdamar, A. Wave energy extraction by an oscillating water column with a gap on the fully submerged front wall. Appl. Ocean Res. 2012, 37, 174–182. [Google Scholar] [CrossRef]
  17. Ashlin, S.J.; Sundar, S.; Sannasiraj, S.A. Effects of bottom profile of an oscillating water column device on its hydrodynamic characteristics. Renew. Energy 2016, 96, 341–353. [Google Scholar] [CrossRef]
  18. Rezanejad, K.; Bhattacharjee, J.; Soares, G.C. Analytical and numerical study of dual-chamber oscillating water columns on stepped bottom. Renew. Energy 2015, 75, 272–282. [Google Scholar] [CrossRef]
  19. Ning, D.; Wang, R.; Chen, L.; Sun, K. Experimental investigation of a land-based dual-chamber OWC wave energy converter. Renew. Sustain. Energy Rev. 2019, 105, 48–60. [Google Scholar] [CrossRef]
  20. Haghighi, A.T.; Nikseresht, A.H.; Hayati, M. Numerical analysis of hydrodynamic performance of a dual-chamber Oscillating Water Column. Energy 2021, 221, 119892. [Google Scholar] [CrossRef]
  21. Dizadji, N.; Sajadian, S.E. Modeling and optimization of the chamber of OWC system. Energy 2011, 36, 2360–2366. [Google Scholar] [CrossRef]
  22. Ram, K.R.; Ahmed, M.R.; Zullah, M.A.; Lee, Y.-H. Experimental studies of the flow characteristics in an inclined bend-free OWC device. J. Ocean Eng. Sci. 2016, 1, 77–83. [Google Scholar] [CrossRef]
  23. Gaspar, A.L.; Teixeira, P.R.F.; Didier, E. Numerical analysis of the performance of two onshore oscillating water column wave energy converters at different chamber wall slopes. Ocean Eng. 2020, 201, 107119. [Google Scholar] [CrossRef]
  24. Güths, A.K.; Teixeira, P.R.F.; Didier, E. A Novel Geometry of an Onshore Oscillating Water Column Wave Energy Converter. Renew. Energy 2022, 201, 938–949. [Google Scholar] [CrossRef]
  25. Rosa-Santos, P.; Taveira-Pinto, F.; Clemente, D.; Cabral, T.; Fiorentin, F.; Belga, F.; Morais, T. Experimental study of a hybrid wave energy converter integrated in a harbor breakwater. J. Mar. Sci. Eng. 2019, 7, 33. [Google Scholar] [CrossRef]
  26. Koutrouveli, T.I.; Di Lauro, E.; das Neves, L.; Calheiros-Cabral, T.; Rosa-Santos, P.; Taveira-Pinto, F. Proof of concept of a breakwater-integrated hybrid wave energy converter using a composite modelling approach. J. Mar. Sci. Eng. 2021, 9, 226. [Google Scholar] [CrossRef]
  27. Cabral, T.; Clemente, D.; Rosa-Santos, P.; Taveira-Pinto, F.; Morais, T.; Belga, F.; Cestaro, H. Performance assessment of a hybrid wave energy converter integrated into a harbor breakwater. Energies 2020, 13, 236. [Google Scholar] [CrossRef]
  28. Howe, D.; Nader, J.R. OWC WEC integrated within a breakwater versus isolated: Experimental and numerical theoretical study. Int. J. Mar. Energy 2017, 20, 165–182. [Google Scholar] [CrossRef]
  29. Rezanejad, K.; Souto-Iglesias, A.; Guedes Soares, C. Experimental investigation on the hydrodynamic performance of an L-shaped duct oscillating water column wave energy converter. Ocean Eng. 2019, 173, 388–398. [Google Scholar] [CrossRef]
  30. López, I.; Carballo, R.; Fouz, D.M.; Iglesias, G. Design selection and geometry in OWC wave energy converters for performance. Energies 2021, 14, 1707. [Google Scholar] [CrossRef]
  31. Ma, Q.W. Nonlinear analysis of hydrodynamic performance of oscillating water column wave energy device with a lateral opening. In Proceedings of the 14th Offshore Mechanics and Artic Engineering Conference, Copenhagen, Denmark, 18–22 June 1995. [Google Scholar]
  32. Horko, M. CFD Optimisation of an Oscillating Water Column Wave Energy Converter. Master’s Thesis, University of Western Australia, Perth, Australia, 2007. [Google Scholar]
  33. Ansys. FLUENT—User’s Guide; ANSYS Inc.: Canonsburg, PA, USA, 2016. [Google Scholar]
  34. Conde, J.M.P.; Teixeira, P.R.F.; Didier, E. Numerical Simulation of an Oscillating Water Column Wave Energy Converter: Comparison of Two Numerical Codes. In Proceedings of the 21st International Offshore Polar Engineering Conference, Maui, HI, USA, 19–24 June 2011. [Google Scholar]
  35. Didier, E.; Conde, J.M.P.; Teixeira, P.R.F. Numerical simulation of an oscillation water column wave energy converter with and without damping. In Proceedings of the Fourth International Conference on Computational Methods in Marine Engineering, Lisbon, Portugal, 28–30 September 2011. [Google Scholar]
  36. Dias, J.; Mendonça, A.; Didier, E.; Neves, M.G.; Conde, J.M.P.; Teixeira, P.R.F. Application of URANS-VOF models in hydrodynamics study of oscillating water column. In Proceedings of the SCACR2015—International Short Course/Conference on Applied Coastal Research, Florence, Italy, 28 September–1 October 2015. [Google Scholar]
  37. Mendonça, A.; Dias, J.; Didier, E.; Fortes, C.J.E.M.; Neves, M.G.; Reis, M.T.; Paixão Conde, J.M.; Poseiro, P.; Teixeira, P.R.F. An Integrated Tool for Modelling OWC-WECs in Vertical Breakwaters: Preliminary Developments. J. Hydro-Environ. Res. 2018, 19, 198–213. [Google Scholar] [CrossRef]
  38. Elhanafi, A.; Fleming, A.; Leong, Z.; Macfarlane, G. Effect of RANS-based turbulence models on nonlinear wave generation in a two-phase numerical wave tank. Prog. Comput. Fluid Dyn. 2016, 17, 141–158. [Google Scholar] [CrossRef]
  39. Tseng, R.S.; Wu, R.H.; Huang, C.C. Model study of a shoreline wave-power system. Ocean Eng. 2000, 27, 801–821. [Google Scholar] [CrossRef]
  40. Teixeira, P.R.F.; Didier, E. Numerical analysis of performance of an oscillating water column wave energy converter inserted into a composite breakwater with rubble mound foundation. Ocean Eng. 2023, 278, 114421. [Google Scholar] [CrossRef]
  41. Wiener, G.F.; Teixeira, P.R.F.; Didier, E. Numerical evaluation of optimal sizes of Wells turbine and chamber of a cluster of Oscillating Water Columns integrated into a breakwater on the Southern Brazilian Coast. J. Waterw. Port Coast. Ocean Eng. 2022, 148, 04022009. [Google Scholar] [CrossRef]
  42. Didier, E.; Teixeira, P.R.F. Numerical analysis of 3D hydrodynamics and performance of an array of oscillating water column wave energy converters integrated into a vertical breakwater. Renew. Energy 2024, 225, 120297. [Google Scholar] [CrossRef]
  43. Teixeira, P.R.F.; Didier, E. Numerical analysis of the response of an onshore oscillating water column wave energy converter to random waves. Energy 2021, 220, 119719. [Google Scholar] [CrossRef]
  44. Didier, E.; Teixeira, P.R.F. Performance of an oscillating water column wave energy converter integrated with three type of harbor protection structures. Defect Diffus. Forum 2023, 427, 63–73. [Google Scholar] [CrossRef]
  45. Wilcox, D.C. Turbulence Modeling for CFD; DCW Industries, Inc.: La Canada, CA, USA, 1993. [Google Scholar]
  46. Versteeg, H.K.; Malalasekera, W. An Introduction to Computational Fluid Dynamics; Longman: Petaling Jaya, Malasia, 2007. [Google Scholar]
  47. Menter, F.R. Two-equation Eddy-viscosity Turbulence Models for Engineering Applications. AIAA J. 1994, 32, 1598–1605. [Google Scholar] [CrossRef]
  48. Zhan, J.-M.; Fan, Q.; Hu, W.-Q.; Gong, Y.-J. Hybrid realizable κ-ε/laminar method in the application of 3D heaving OWCs. Renew. Energy 2020, 155, 691–702. [Google Scholar] [CrossRef]
  49. Didier, E.; Teixeira, P.R.F. A RANS-based numerical model to simulate overtopping-type wave energy converters integrated into breakwaters. Int. J. Offshore Polar Eng. 2023, 33, 420–427. [Google Scholar] [CrossRef]
  50. Hirt, C.W.; Nichols, B.D. Volume of fluid (VoF) method for the dynamics of free boundaries. J. Comput. Phys. 1981, 39, 201–225. [Google Scholar] [CrossRef]
  51. van Doormall, J.P.; Raithby, G.D. Enhancements of the Simple Method for Predicting Incompressible Fluid Flows. Numer. Heat Transf. 1984, 7, 147–163. [Google Scholar]
  52. van Leer, B. Towards the ultimate conservative difference scheme. V. A second-order sequel to Godunov’s method. J. Comput. Phys. 1979, 32, 101–136. [Google Scholar] [CrossRef]
  53. Youngs, D.L. Time-dependent multi-material flow with large fluid distortion. Numer. Methods Fluid Dyn. 1982, 24, 273–285. [Google Scholar]
  54. Didier, E.; Teixeira, P.R.F.; Neves, M.G. A 3D Numerical Wave Tank for Coastal Engineering Studies. Defect Diffus. Forum 2017, 372, 1–10. [Google Scholar] [CrossRef]
  55. Teixeira, P.R.F.; Didier, E.; Neves, M.G. A 3D RANS-VOF wave tank for oscillating water column device studies. In Proceedings of the VII International Conference Computational Methods Marine Engineering, Nantes, France, 15–17 May 2017. [Google Scholar]
  56. Lisboa, R.C.; Teixeira, P.R.F.; Torres, F.R.; Didier, E. Numerical evaluation of the power output of an oscillating water column wave energy converter installed in the Southern Brazilian coast. Energy 2018, 162, 1115–1124. [Google Scholar] [CrossRef]
  57. Neves, M.G.; Didier, E.; Brito, M.; Clavero, M. Numerical and physical modelling of wave overtopping on a smooth impermeable dike with promenade under strong incident waves. J. Mar. Sci. Eng. 2021, 9, 865. [Google Scholar] [CrossRef]
  58. Didier, E.; Teixeira, P.R.F. Validation and comparisons of methodologies implemented in a RANS-VoF numerical model for applications to coastal structures. J. Mar. Sci. Eng. 2022, 10, 1298. [Google Scholar] [CrossRef]
  59. Lin, P.; Liu, P.L.-F. A numerical study of breaking waves in the surf zone. J. Fluid Mech. 1998, 359, 239–264. [Google Scholar] [CrossRef]
  60. Dean, R.G.; Dalrymple, R.A. Water Wave Mechanics for Engineers and Scientists, Advanced Series on Ocean Engineering; World Scientific: Singapore, 2000. [Google Scholar]
  61. Chakrabarti, S.K. Hydrodynamics of Offshore Structures: Mathematical Theory and Its Applications in Structures; WIT Press: Billerica, MA, USA, 1987. [Google Scholar]
  62. Schäffer, H.; Klopman, G. Review of multidirectional active wave absorption methods. J. Waterw. Port Coast. Ocean Eng. 2000, 126, 88–97. [Google Scholar] [CrossRef]
  63. Lara, J.L.; Ruju, A.; Losada, I.J. Reynolds averaged Navier-Stokes modelling of long waves induced by transient wave group on a beach. Proc. R. Soc. A 2011, 467, 1215–1242. [Google Scholar] [CrossRef]
  64. Higuera, P.; Lara, J.L.; Losada, I.J. Realistic wave generation and active wave absorption for Navier-Stokes models applications to OpenFoam®. Coast. Eng. 2013, 71, 102–118. [Google Scholar] [CrossRef]
  65. Didier, E.; Neves, M.G. A Semi-Infinite Numerical Wave Flume using Smoothed Particle Hydrodynamics. Int. J. Offshore Polar Eng. 2012, 22, 193–199. [Google Scholar]
  66. Didier, E.; Neves, M.G.; Teixeira, P.R.F. Analysis of Forces on a submarine outfall by RANS-VoF numerical wave tank. Defect Diffus. Forum 2019, 396, 50–59. [Google Scholar] [CrossRef]
  67. Mansard, E.P.D.; Funke, E.R. The Measurement of incident and reflected spectra using a least squares method. Coast. Eng. 1980, 4, 154–174. [Google Scholar] [CrossRef]
  68. Teixeira, P.R.F.; Davyt, D.P.; Didier, E.; Ramalhais, R. Numerical Simulation of an Oscillating Water Column Device Using a Code Based on Navier-Stokes Equations. Energy 2013, 61, 513–530. [Google Scholar] [CrossRef]
  69. Cisco, L.A.; Maciel, R.P.; Oleinik, P.H.; dos Santos, E.D.; Gomes, M.N.; Rocha, L.A.O.; Isoldi, L.A.; Machado, B.N. Numerical Analysis of the Available Power in an Overtopping Wave Energy Converter Subjected to a Sea State of the Coastal Region of Tramandaí, Brazil. Fluids 2022, 7, 359. [Google Scholar] [CrossRef]
  70. Lopes, M.F.P.; Ricci, P.; Gato, L.M.C.; Falcão, A.F.O. Experimental and numerical analysis of the oscillating water column inside a surface-piercing vertical cylinder in regular waves. In Proceedings of the 7th European Wave and Tidal Energy Conference, Porto, Portugal, 11–14 September 2007. [Google Scholar]
  71. Jacobsen, N.G.; Fuhrman, D.R.; Fredsoe, J. A Wave Generation Toolbox for the Open-source CFD Library: OpenFOAM(R). Int. J. Numer. Methods Fluids 2012, 70, 1073–1088. [Google Scholar] [CrossRef]
  72. Brown, S.A.; Greaves, D.M.; Magar, V.; Conley, D.C. Evaluation of Turbulence Closure Models under Spilling and Plunging Breakers in the Surf Zone. Coast. Eng. 2016, 114, 177–193. [Google Scholar] [CrossRef]
  73. Devolver, B.; Trouch, P.; Rauwoens, P. Performance of a Buoyancy-modified k-ω and k-ω SST Turbulence Model for Simulating Wave Breaking under Regular Waves Using OpenFOAM®. Coast. Eng. 2018, 138, 49–65. [Google Scholar] [CrossRef]
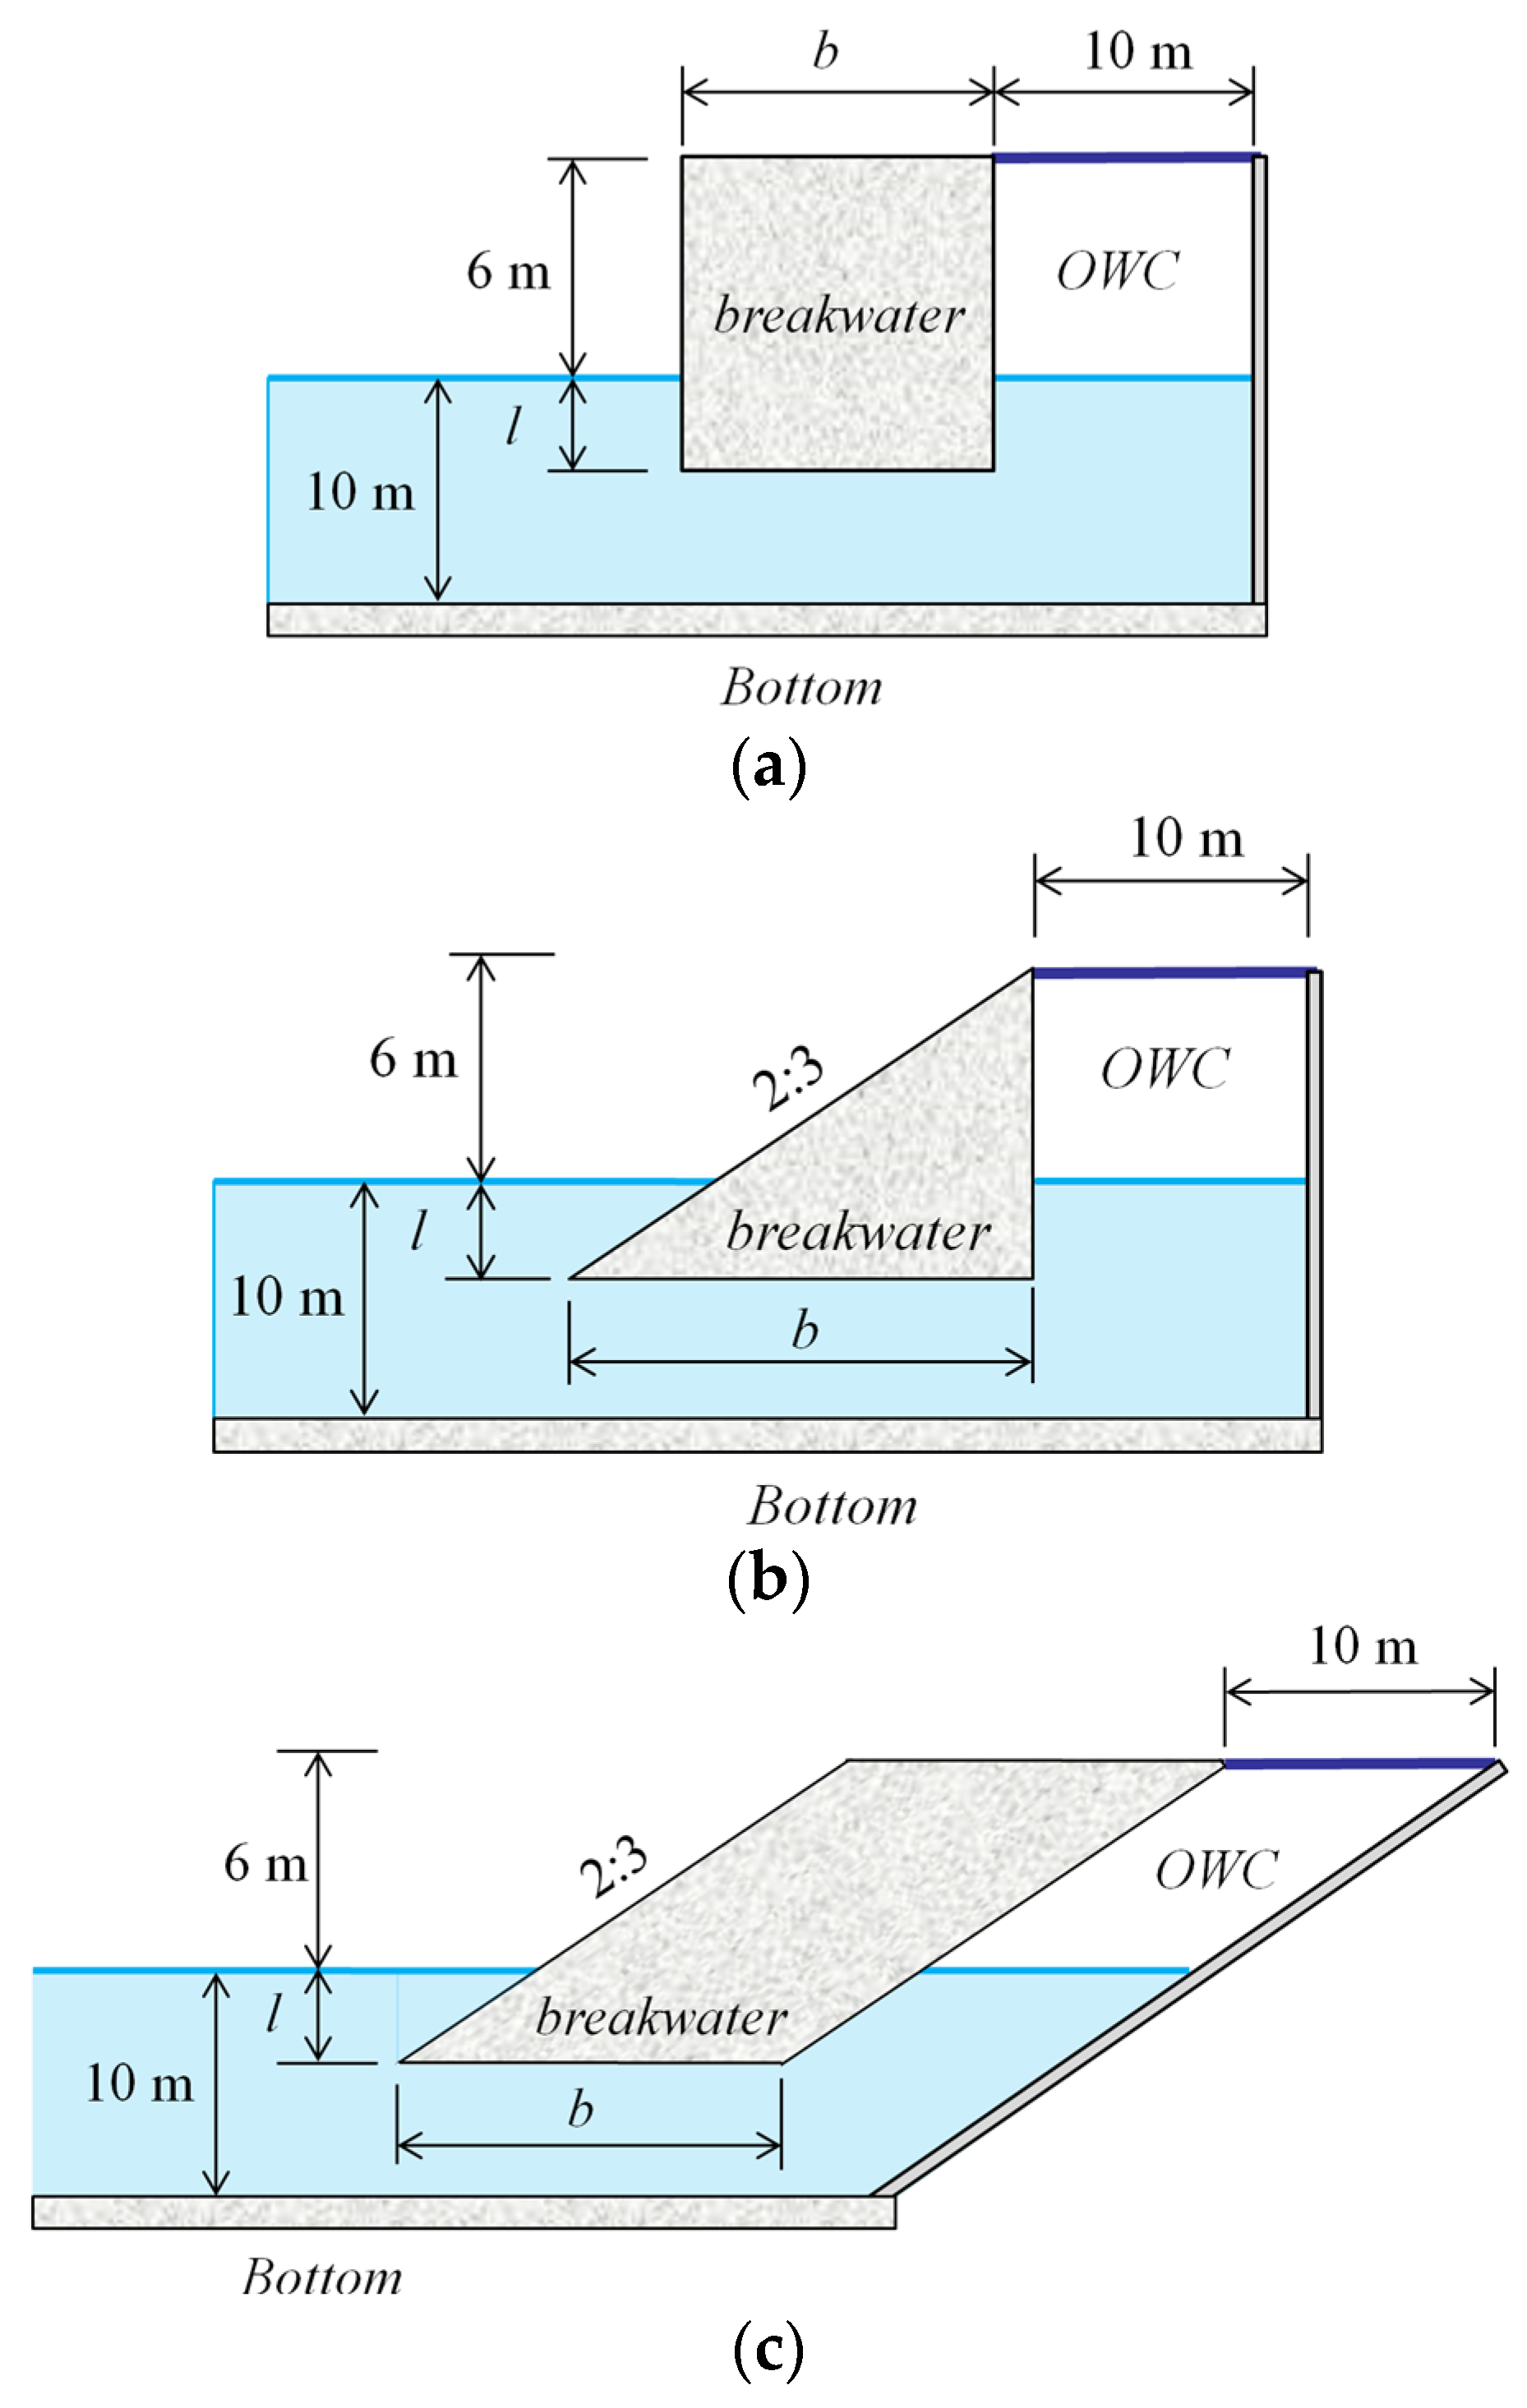
Figure 1. L-shaped duct OWC device with a vertical OWC chamber integrated into vertical (a) and 2:3 sloped (b) breakwaters, and with an inclined OWC chamber integrated into a 2:3 sloped breakwater (c).
Fluids 10 00114 g001
Figure 2. Sketch of the computational domain for the OWC device integrated into the vertical breakwater and boundary conditions.
Fluids 10 00114 g002
Figure 3. Sketch of the computational domain with the set of three wave gauges to determine the reflected wave coefficient and the wave gauge in front of the OWC device.
Fluids 10 00114 g003
Figure 4. Mesh in the proximity of the structure for b = 5 m and l = 2.5 m for the wave period of 6 s: a vertical OWC chamber integrated into vertical (a) and 2:3 sloped (b) breakwaters, and an inclined OWC chamber integrated into a 2:3 sloped breakwater (c). The blue line represents the free surface at rest.
Fluids 10 00114 g004
Figure 5. Mean pneumatic power for a vertical OWC chamber integrated into a vertical breakwater: (a) l = 2.5 m and (b) l = 5.0 m.
Fluids 10 00114 g005
Figure 6. Mean pneumatic power for a vertical OWC chamber integrated into a 2:3 sloped breakwater: (a) l = 2.5 m and (b) l = 5.0 m.
Fluids 10 00114 g006
Figure 7. Mean pneumatic power for an inclined OWC chamber integrated into a 2:3 sloped breakwater: (a) l = 2.5 m and (b) l = 5.0 m.
Fluids 10 00114 g007
Figure 8. Percentage of energy quantities for the vertical OWC chamber integrated into a vertical breakwater for l = 2.5 (a) and l = 5.0 m (b).
Fluids 10 00114 g008
Figure 9. Velocity magnitude (m/s) and streamlines for the vertical breakwater with a vertical OWC chamber with l = 5.0 m and b = 10 m at T = 6 (a) and 14 s (b) at the instant of the maximum air flow rate inhalation.
Fluids 10 00114 g009
Figure 10. Percentage of energy quantities for a vertical OWC chamber integrated into a 2:3 sloped breakwater for l = 2.5 (a) and l = 5.0 m (b).
Fluids 10 00114 g010
Figure 11. Percentage of energy quantities for an inclined OWC chamber integrated into a 2:3 sloped breakwater for l = 2.5 (a) and l = 5.0 m (b).
Fluids 10 00114 g011
Figure 12. Velocity magnitude (m/s) and streamlines for the vertical OWC chamber integrated into a 2:3 sloped breakwater for b = 10 m and l = 2.5 (a) and l = 5.0 m (b) at the instant of the maximum air flow rate exhalation.
Fluids 10 00114 g012
Table 1. Characteristics of the meshes: number of cells per wave length and wave height, number of cells in the computational domain, and mesh resolution (dx1 and dx2) inside the wave propagation zone and the OWC chamber.
MeshCells NumberWave Propagation ZoneOWC Chamber
NHNVDomaindx1 (m)dx2 (m)dx1 (m)dx2 (m)
M125549504.500.2200.6000.280
M237911,5853.100.1100.3400.140
M3702034,9851.600.0500.1920.070
M415140121,3880.750.0250.0960.035
Table 2. Mean and maximum pneumatic power, mean pressure and mean free surface amplitude inside the OWC chamber, and free surface amplitude in front of the wall device for the four meshes.
MeshPneum. Power (kW)pac (kPa)η OWC (m)η Front Wall (m)
PpPmaxpacpac+ηη+ηη+
M159.91166.963.2654.0620.5750.7480.5740.733
M259.88175.943.1494.1650.5800.7440.5990.745
M359.26177.183.1194.1760.5830.7380.5840.708
M459.22176.963.1204.1750.5820.7370.5820.711
Table 3. Convergence of relative errors with mesh refinement of mean and maximum pneumatic power, mean pressure and mean free surface amplitude inside the OWC chamber, and free surface amplitude in front of the wall device.
MeshPneum. Power (%)pac (%)η OWC (%)η Front Wall (%)
PpPmaxpacpac+ηη+ηη+
M11.175.654.652.711.201.491.373.09
M21.110.570.930.240.340.952.924.78
M30.070.130.030.020.170.140.340.42
M4--------
Disclaimer/Publisher’s Note: The statements, opinions and data contained in all publications are solely those of the individual author(s) and contributor(s) and not of MDPI and/or the editor(s). MDPI and/or the editor(s) disclaim responsibility for any injury to people or property resulting from any ideas, methods, instructions or products referred to in the content.