Article

Computational Study of a Utility-Scale Vertical-Axis MHK Turbine: A Coupled Approach for Flow–Sediment–Actuator Modeling

by
Mehrshad Gholami Anjiraki
,
Mustafa Meriç Aksen
,
Samin Shapourmiandouab
,
Jonathan Craig
and
Ali Khosronejad
*
Department of Civil Engineering, Stony Brook University, Stony Brook, NY 11794, USA
*
Author to whom correspondence should be addressed.
Fluids 2025, 10(12), 304; https://doi.org/10.3390/fluids10120304
Submission received: 15 October 2025 / Revised: 12 November 2025 / Accepted: 18 November 2025 / Published: 21 November 2025

Abstract

We present a coupled large-eddy simulation (LES) and bed morpho-dynamics study to investigate the influence of sediment dynamics on the performance of a utility-scale marine hydrokinetic vertical-axis turbine (VAT) parametrized by an actuator surface model. By resolving the interactions between turbine-induced flow structures and bed evolution, this study offers insights into the environmental implications of VAT deployment in riverine and marine settings. A range of tip speed ratios is examined to evaluate wake recovery, power production, and bed response. The actuator surface method (ASM) is implemented to capture the effects of rotating vertical blades on the flow, while the immersed boundary method accounts for fluid interactions with the channel walls and sediment layer. The results show that higher TSRs intensify turbulence, accelerate wake recovery over rigid beds, and enhance erosion and deposition patterns beneath and downstream of the turbine under live-bed conditions. Bed deformation under live-bed conditions induces asymmetrical wake structures through jet flows, further accelerating wake recovery and decreasing turbine performance by about 2%, compared to rigid-bed conditions. Considering the computational cost of the ASM framework, which is nearly 4% of the turbine-resolving approach, it provides an efficient yet robust tool for assessing flow–sediment–turbine interactions.

1. Introduction

Global investment in renewable energy has grown rapidly in recent years [1,2]. Hydrokinetic systems, unlike conventional hydropower, extract energy directly from flowing water without disrupting natural waterways such as rivers, tides, and ocean currents [3,4,5,6], and marine energy offers high reliability and predictable output [7,8,9]. Tidal stream technologies still face challenges, including high construction and maintenance costs [10,11,12,13] and limited supply-chain maturity [10,14]. Nevertheless, numerous pilot projects demonstrate strong global potential despite geographic and topographic constraints [9,11,15,16,17,18,19,20]. Although riverine energy is smaller in scale than ocean resources, its U.S. technical potential of 99 TWh per year could power roughly 9.3 million homes [7], and several deployments have begun exploring this resource [19,21]. Research in this area has historically focused on horizontal-axis turbines (HATs), which constitute about 75 % of studies [20,22,23], largely due to their similarity to wind-turbine technology [23,24].
At the same time, vertical-axis turbines (VATs) have gained attention in recent renewable energy research [3] due to several practical and environmental advantages in comparison to HATs [7,11,20,25,26,27]. While VATs are generally less efficient and not self-starting like HATs [28], they offer operational benefits in array configurations, such as faster wake recovery [26,29]. Their uniaxial rotation helps them manage unsteady fluid forces effectively [30], and their larger swept area and high power density make VATs well suited for shallow, near-shore waters [11,31,32]. Their omnidirectional flow acceptance [23,24,32], relatively simple installation requirements [33], and reduced ecological and hydrological impact [20,23] make them especially suitable for riverine environments. Extensive experimental research and design optimization efforts have advanced VAT technology [20,30,32,34,35,36,37,38,39,40], and they have been successfully deployed in industrial applications [41].
Since riverine currents are unidirectional, it is easier to model and manage them within experimental studies. Nevertheless, turbine installations in rivers can significantly impact river morphology which becomes a challenge for modeling. Given the high cost and time demands of physical experiments, computational fluid dynamics (CFD) is often used to complement laboratory studies to explore a wider range of scenarios [11,26]. In particular, large-eddy simulation (LES) exhibts strong agreement with theoretical predictions [42] and outperformance of unsteady Reynolds-averaged Navier–Stokes (URANS) as demonstrated in vertical-axis wind turbine (VAWT) studies [43]. For example, Posa et al. [44] applied LES to a wind tunnel study to discover that at high Reynolds numbers, lower tip speed ratios (TSRs) produce more asymmetric VAWT wakes and larger vortices due to stronger dynamic stall. Elkhoury et al. [45] employed LES to examine the effect of wind speed on VAWT output under different pitch conditions. Ouro and Stoesser [26] coupled LES with the Immersed Boundary Method (IBM) to simulate Darrieus-type VATs in turbulent flow across various TSRs. Further research by Posa [46] applied LES-IBM to observe that higher blockage ratios can enhance downstream turbine performance in turbine arrays. Based on LES-IBM simulations, Posa [47] found that higher dynamic solidity enhances wake recovery.
While turbine-resolving methods provide high-fidelity results with minimal modeling assumptions [48], their high computational cost limits widespread use; hence, less costly actuator-based approaches have been increasingly implemented for their computational feasibility and approximation of results [49]. For instance, Abkar and Dabiri [50] coupled the actuator line method (ALM) with LES to study VAWT wakes within the atmospheric boundary layer, finding that coarse-resolution simulations in large wind farms fail to adequately capture individual turbine wake structures. Similarly, Shamsoddin and Porté-Agel [51] used LES-ALM to optimize turbine solidity and TSR for maximum power output and further exploration of wake effects. Mohamed et al. [52] developed a three-dimensional (3D) simulation framework that couples the ALM with Volume of Fluid (VOF) modeling to evaluate VAT array performance in open-channel flows. Zanforlin and Nishino [53] employed URANS simulations with an actuator disk method (ADM) to compare array configurations across TSRs and flow directions. Bachant et al. [54] validated LES-ALM simulations against experimental data to demonstrate efficient and accurate predictions of flow behavior and power output. Subsequently, Gharaati et al. [55] employed LES–ALM to compare straight and helical blade designs by their effects on near-wake velocity. Bachant and Wosnik [29] reported relatively fast wake recovery in VATs compared to Reynolds-averaged Navier–Stokes (RANS)–ADM simulations. Shchur et al. [56] used RANS–ALM to support that dual-rotor counter-rotating VATs could boost individual turbines’ performance, which Gharib Yosry et al. [57] similarly observed with ADM and blockage.
Notwithstanding the ALM’s viability, several studies have also demonstrated the efficacy of the actuator surface method (ASM) for modeling VATs. Most extant ASM studies examine VAWTs instead of marine VATs; nevertheless, they present valuable implications and considerations for marine settings. Rajagopalan and Fanucci [58] first integrated Patankar’s SIMPLER algorithm [59] with ASM to investigate the wake flow and performance of a two-dimensional ( 2 D ) VAWT, which was later extended to 3 D ASM by Rajagopalan et al. [60]. Fortunato et al. [61] solved the 2 D compressible laminar Euler equations using a finite difference method with the ASM, to model the flow field around a VAWT. Shen et al. [62] effectively applied a 2 D ASM coupled with RANS to simulate the wake of a two-bladed VAWT with a NACA0015 airfoil. Shamsoddin and Porté-Agel [51,63] combined LES with both ALM and ASM to simulate 3 D wake structures for validation of blade forces. Through LES-ASM, Massie et al. [23] achieved more accurate upstream blade blockage effects compared to ALM, although turbulent kinetic energy (TKE) was underestimated with coarse grids. More recently, Küppers and Reinicke [64] employed ASM with an explicit momentum solver to study VAT wake flows, supporting its capture of more accurate wake dynamics and validated their approach with experimental measurements. A schematic of the ALM and ASM, together with the geometry resolving, is shown in Figure 1.
Interactions between marine hydrokinetic (MHK) VATs and bed morpho-dynamics have become a key research challenge, with growing concern over their uncertain impacts in riverine and tidal settings [65]. MHK turbines may substantially alter seabed morphology, including benthic habitats and water quality, by disrupting sediment transport [66,67,68,69,70,71]; yet, early models often failed to address sediment transport [72] due to greater emphasis on power optimization [73]. Analogies have emerged between MHK turbines and structures, including bridge piers and offshore turbines, to visualize local scour and debris effects more clearly [74,75,76,77,78,79], as turbine-sediment interactions introduce turbine fatigue and maintenance costs [80]. Previous studies on marine HATs have shown that they can intensify flow velocity and sediment erosion, especially with reduced tip clearance [81]. Hill et al. [82] found that larger rotors and steeper bedforms increased sediment interaction for worse turbine performance. Chen et al. [83] experimentally indicated that reduced tip clearance in HATs leads to greater scour, while Aksen et al. [78] numerically indicated that altered morpho-dynamics and debris affect utility-scale HAT power output. Musa et al. [72] uncovered both local and non-local effects on bed morpho-dynamics through small-scale HAT models in lab experiments. Afterwards, Musa et al. [84] explored how asymmetrically placed HATs affect morpho-dynamics. Further studies [72,81,82] showed that MHK HATs influence both local sediment transport and broader bedform migration.
Research on VAT–sediment interactions is relatively recent. Vybulkova [85] showed that different VATs significantly impact local morpho-dynamics and downstream shear stress. Lee et al. [86] proposed a drag-driven VAT design for live-bed conditions. Azrulhishama et al. [76] identified erosion-prone areas on VATs exposed to suspended sediments and suggested protective measures. Several studies have been conducted to better understand complex but relatively underexplored VAT–morpho-dynamics effects. For instance, Gao et al. [87] recommended mid-depth turbine deployment to reduce VAT–bed interaction. Gholami Anjiraki et al. [88] investigated the two-way interactions between VAT wake flow and sediment transport, but the computationally expensive geometry-resolving method limited its practicality for studying different utility-scale VATs. Due to limited research, accurate and cost-effective modeling of the two-way interaction between VATs and sediment transport remains a major challenge.
This study aims to explore the two-way interactions between a utility-scale VAT and sediment transport. We simulated live-bed sediment dynamics by considering a typical sand particle size commonly found in natural riverbeds [89]. It examines how different TSRs affect bed evolution and how evolving bed topography influences turbine performance and wake flow. Simulations under both rigid and live beds enable a comparative analysis to better understand VATs’ environmental impacts. Numerical simulations were conducted using the in-house virtual flow simulator (VFS)-Geophysics code [90,91], which couples hydrodynamics with bed morpho-dynamics. The turbulence is captured using the LES method, with a wall model to reduce the computational cost of LES at high Reynolds numbers. The ASM is used to model turbine blades, and the IBM handles the evolving bed geometry [92,93]. Sediment dynamics are captured by solving the sediment mass balance equation within the bed load layer using a dual time-stepping scheme [79,94], and a sand slide model is implemented to maintain physically realistic bed slopes.
The paper proceeds as follows: Section 2 presents the governing equations for hydrodynamics and morpho-dynamics; Section 3 details the test-case setup (turbine, flow, and channel) and the sediment-transport model; Section 4 reports and discusses the results; and Section 5 concludes with key findings and implications for future work.

2. Governing Equations

2.1. The Hydrodynamic Model

The hydrodynamics model solves the spatially filtered Navier–Stokes equations for incompressible flow in non-orthogonal generalized curvilinear coordinates. In compact Newton notation, with repeated indices indicating summation, the equations are expressed as follows [92,95,96,97]:
J U j ξ j = 0
U i t = ξ l i J ξ j U j u i + 1 ρ ξ j μ G j k J u i ξ k 1 ρ ξ j ξ i j p J 1 ρ τ i j ξ j + F ext
where the Jacobian of the geometric transformation, J = ξ 1 , ξ 2 , ξ 3 / x 1 , x 2 , x 3 , transforms the coordinate system from Cartesian into curvilinear. The contravariant volume flux is U i = ( ξ m i / J ) u m , where ξ l i = ξ i / x l . The i-th filtered velocity component in Cartesian coordinates is denoted by u i , and μ represents the dynamic viscosity ( P a · s ) of the fluid (i.e., water). The contravariant metric tensor is G j k = ξ l j ξ l k . The fluid density is ρ = 1000 kg / m 3 , and p represents the pressure field ( P a ). The subgrid-scale stresses are modeled using the dynamic Smagorinsky formulation within the LES turbulence model, defined as [98,99,100]:
τ i j = 2 μ t S ¯ i j + 1 3 τ k k δ i j
μ t = C s Δ 2 S ¯
where μ t denotes the eddy viscosity ( P a · s ), S ¯ i j is the filtered strain-rate tensor ( ( m · s ) / m ), and δ i j is the Kronecker delta. The Smagorinsky constant is represented by C s , and the strain-rate magnitude is S ¯ = 2 S ¯ i j S ¯ i j ( ( m · s ) / m ). The filter width, Δ (m), is taken as the cubic root of the cell volume, such that Δ = J 1 / 3 [98].

2.2. Turbine Modeling

Two widely adopted strategies are commonly used to simulate flow–turbine interactions [48]. The first strategy involves turbine parameterization techniques such as actuator models, which introduce lift and drag forces as body force terms into the governing flow equations to represent the turbine’s influence as momentum sinks (see Equation (2)) [97,101,102,103]. The second strategy is the geometry-resolving approach [48,88,96,104,105,106,107] which explicitly resolves the turbine blades’ geometry using sufficiently fine computational grids to capture fluid–structure interactions in detail. Although this latter approach offers high-fidelity results with minimal modeling assumptions [48], its significant computational cost limits its feasibility for turbine simulations. Therefore, in this study, we employ the ASM, which offers a balanced trade-off between computational efficiency and the resolution of turbine-induced flow features whilst maintaining acceptable accuracy even on coarse meshes [23].

Actuator Surface Method

The ASM represents turbine blades and nacelles as immersed surfaces that apply lift and drag forces to the flow. These forces are computed over a Lagrangian mesh embedded in the fluid domain and incorporated into the momentum equations, enabling efficient simulation of the effects of rotating blades on the flow field without resolving the full blade geometry. Using the blade element theory [108], the lift and drag forces (N) are calculated as follows [109]:
F D = c 2 ρ C D V rel 2
F L = c 2 ρ C L V rel 2
where c denotes the turbine blade chord length (m), V rel is relative velocity (m/s), and C D and C L correspond to the drag and lift coefficients which depend on the Reynolds number and the angle of attack [101]. For an in-depth discussion on tip-loss effects and the corresponding corrections to the lift and drag coefficients, the reader is referred to Ref. [101]. The relative velocity, V rel , is defined as follows [109]:
V rel = u x , u θ Ω r
where Ω denotes the rotor’s angular velocity ( r a d / s ), and r (m) represents the radial distance from the rotor center to the blade element at the same vertical elevation, which corresponds to the turbine radius. The velocity components u x and u θ (m/s), respectively, represent the axial and azimuthal flow components. For more information about ASM, the reader is referred to Refs. [101,109]. Additionally, prior wind-turbine studies recommend 17 cells per D for actuator surface model [110]. In the present work, we adopted 50 cells per D, exceeding the recommended threshold to mitigate resolution-induced errors. This choice balances accuracy and cost for the coupled hydro- and morpho-dynamic simulations. Finally, the ASM has been validated in multiple studies [101,111,112].

2.3. Bed Morpho-Dynamics

The non-cohesive bed material, consisting of sand with a d 50 of 0.7 mm, was considered. Sediment transport occurs through rolling or sliding, saltation, or suspension, depending on the bed shear velocity relative to the critical threshold [88]. As described by Van Rijn [113], sediment transport can be classified into three modes: bed load, which includes rolling and saltation; suspended load, where particles are maintained in motion by turbulence; and wash load, which consists of fine particles that remain continuously in transport. The temporal change in the bed elevation (i.e., the elevation of the sediment/water interface), Z b (m), is governed by the non-equilibrium Exner–Polya mass balance equation, as follows [114]:
( 1 γ ) Z b t + 1 A h · q BL = D b E b
where γ denotes the sediment porosity (= 0.4), and A h ( m 2 ) indicates the projected area on the horizontal plane of a triangular bed cell. D b and E b represent the net rates of sediment deposition and entrainment, respectively [90]. In this study, both D b (m) and E b (m) are set to zero, since suspended load transport is not considered. The divergence operator ∇ is applied to the bed load flux vector q BL ( m 3 / s ), representing net sediment transport within the bed load layer. The bed load flux vector is defined as follows [115]:
q BL = ψ d s δ BL u BL
where d s (m) denotes the edge length of each triangular bed mesh element, δ BL = 0.005 m is the thickness of the bed load layer, u BL (m/s) represents the velocity component parallel to the bed surface, and ψ is the sediment concentration defined as follows:
ψ = 0.015 d 50 δ BL T 3 / 2 D * 3 / 10
D * = d 50 ρ s ρ ρ v 2 g 1 / 3
where d 50 (m) is the mean grain size, ρ s = 2650 k g / m 3 is the sediment particle density, and ν ( m 2 / s ) denotes the kinematic viscosity of water. T denotes the non-dimensional excess shear stress and is defined as follows:
T = τ * τ cr τ cr
where τ * ( P a ) is the bed shear stress and τ * cr is the critical bed shear stress. More details are provided in Refs. [90,92,113,115,116,117,118,119].
The bed load sediment flux ( q BL ) is computed at cell faces using a second-order GAMMA differencing scheme [119] after obtaining all parameters from cell centers. To ensure a physically realistic bed topography, a mass-balanced sand slide model is applied when bed local slopes exceed the angle of repose [90,92,93,95,119]. The model redistributes excess sediment from flagged cells to neighbors iteratively, until all local slopes fall below 99 % of the angle of repose [88].

2.4. The Coupled Hydro–Morpho Dynamics

Two primary fluid structure interaction (FSI) coupling approaches are used to model hydro- and morpho-dynamic interactions: strong and loose coupling [115]. Strong coupling updates boundary conditions (BC) iteratively within each time step (implicit in time), offering higher stability but at a greater computational cost. Loose coupling, by contrast, updates boundaries using solutions from the previous time step (explicit in time), avoiding extra iterations and improving efficiency. Given its computational advantages and demonstrated robustness in similar studies [88], the loose coupling method is adopted in this work [90,92,93,95,118,119].
Due to the significant difference in convergence time scales between hydrodynamics (seconds to minutes) and morpho-dynamics (hours to days), a dual time-stepping method is employed [94], allowing the use of larger time steps for the morpho-dynamic solver. In this study, the morpho-dynamic solver employs a time step that is two orders of magnitude greater than that of the flow solver [88].
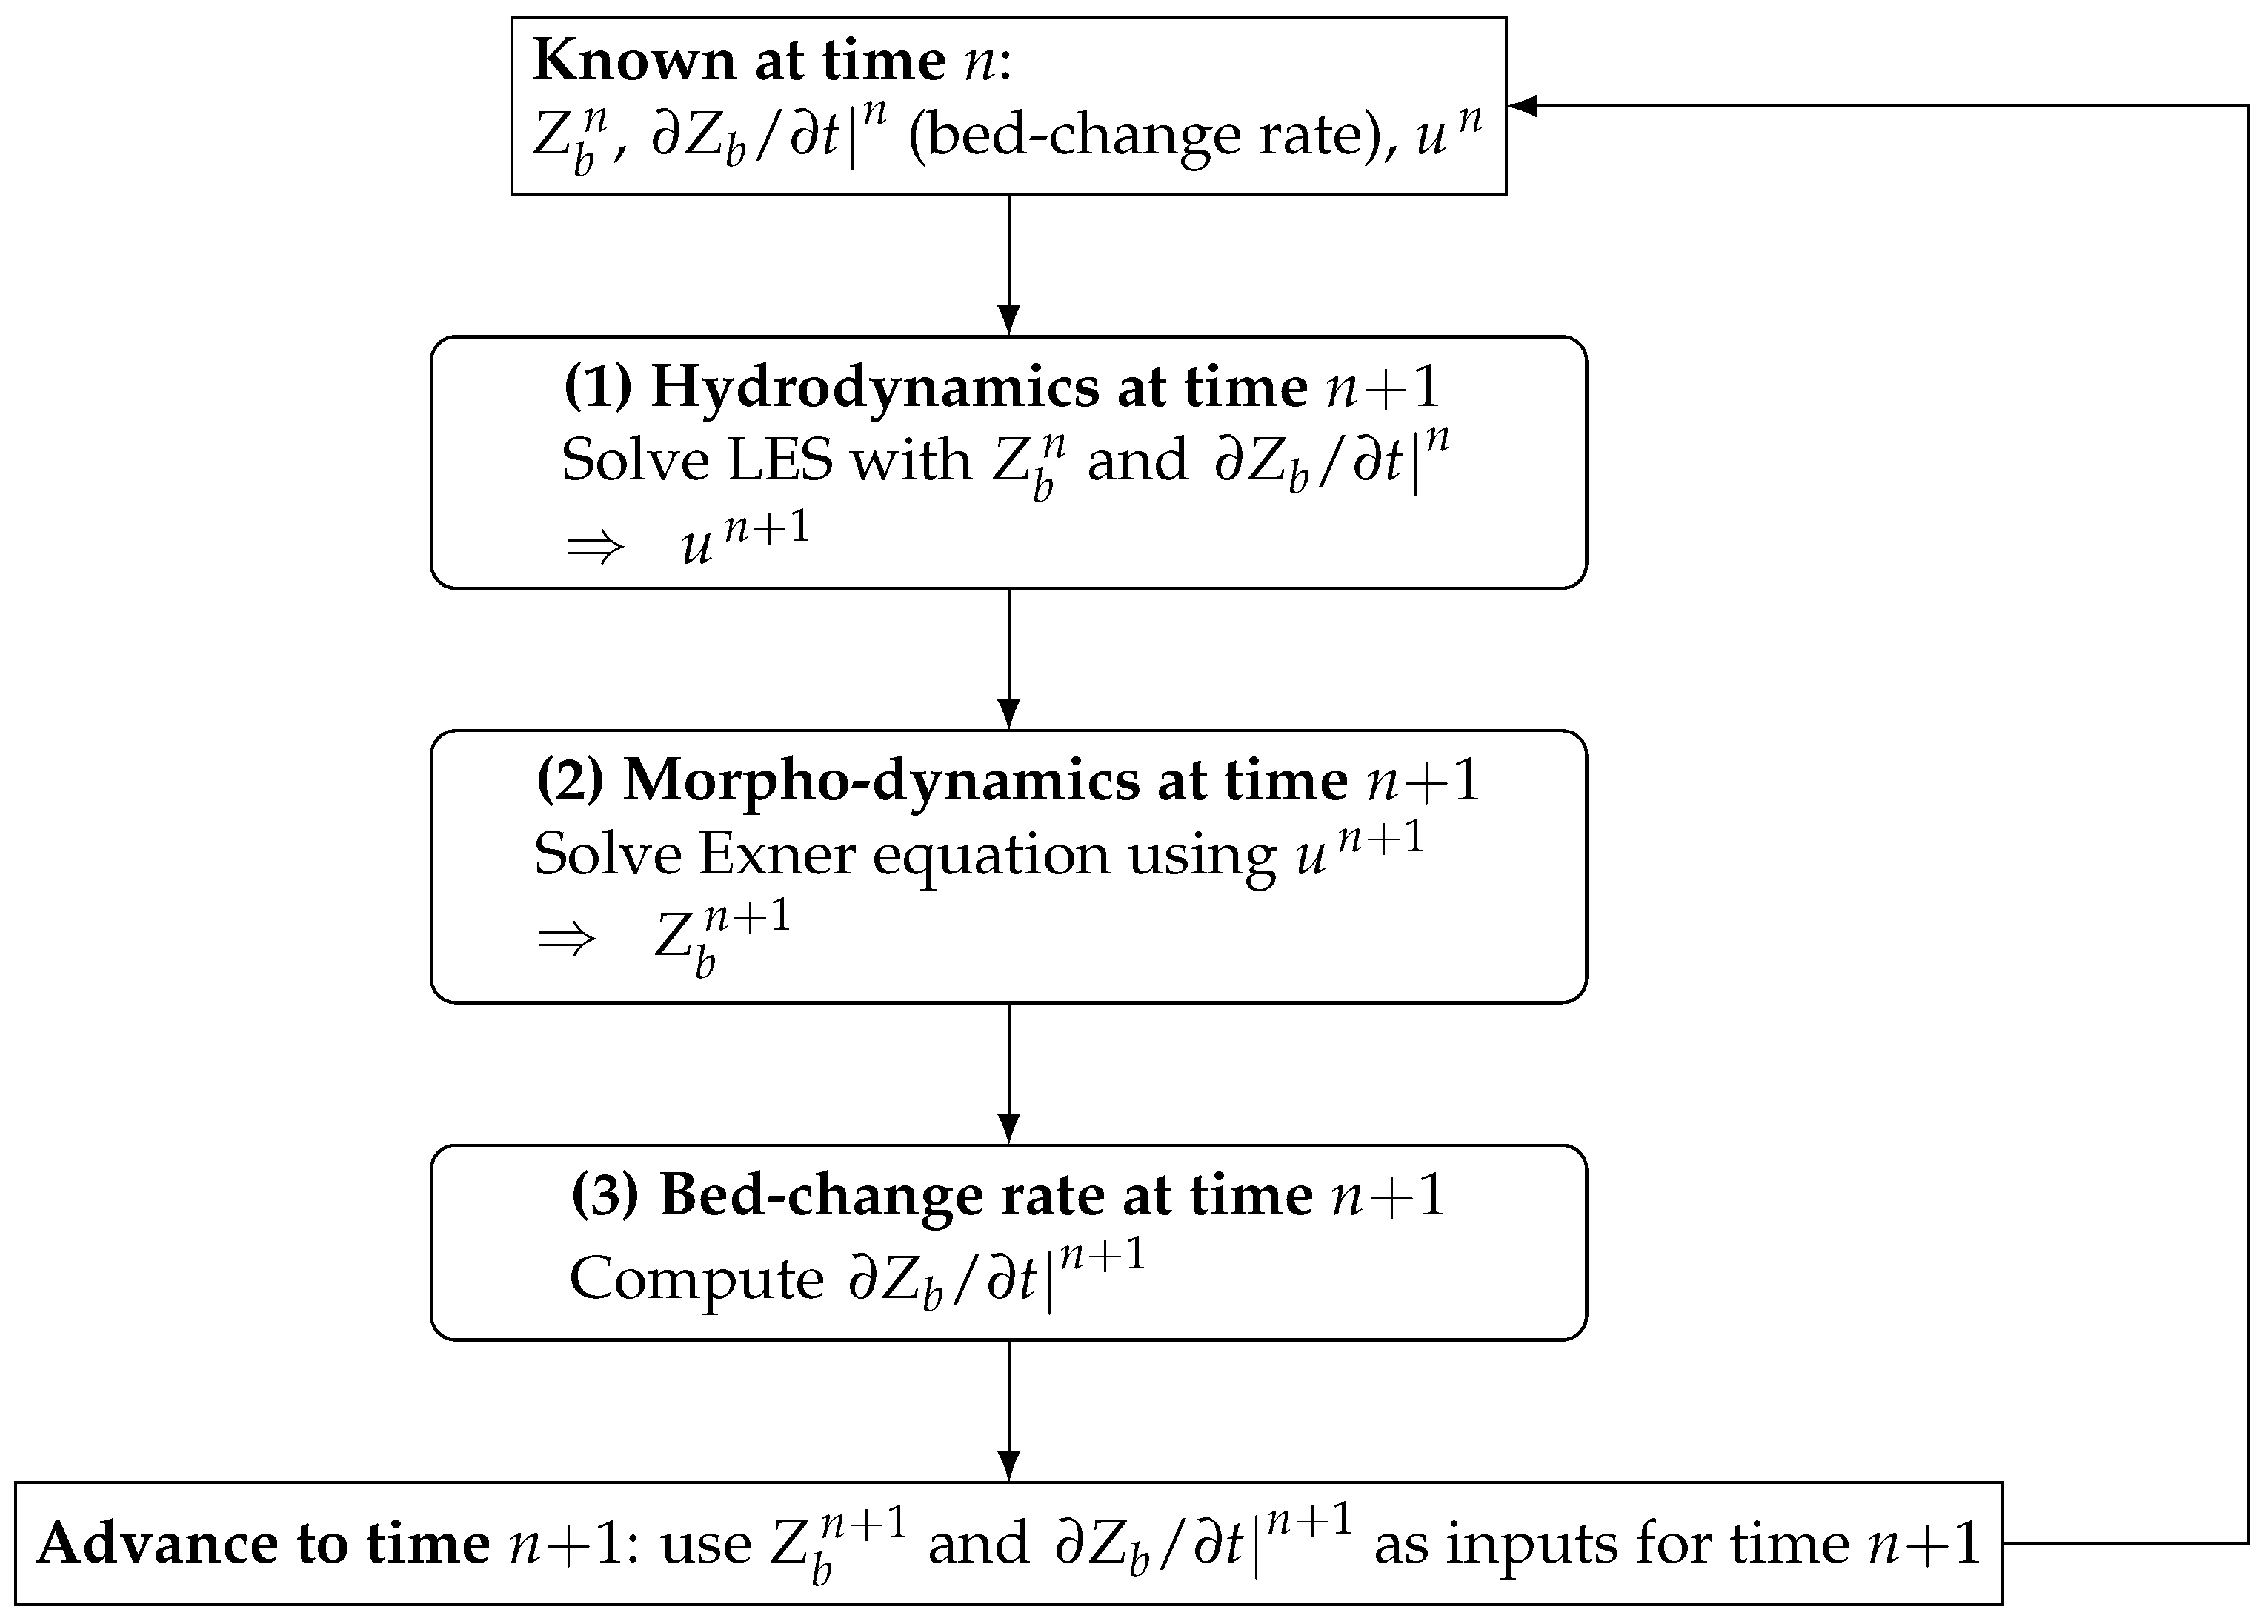
The flow and morpho-dynamics coupling within the curvilinear immersed boundary (CURVIB) framework involves solving hydro- and morpho-dynamic equations in separate domains, while incorporating boundary conditions from the other domain at the sediment–water interface. More specifically, the flow solver implements updated bed elevations and bed vertical velocities as boundary conditions, whereas the morpho-dynamic solver uses flow velocities and shear stresses from the hydrodynamics solver [88]. Figure 2 explains the loose-coupling hydro- and morpho-dynamic procedure in more details. Additionally, the coupled hydro–morpho dynamic model employed in this study has been rigorously validated against experimental datasets at both laboratory and field scales [74,94,120].

3. Test Case Description and Computational Details

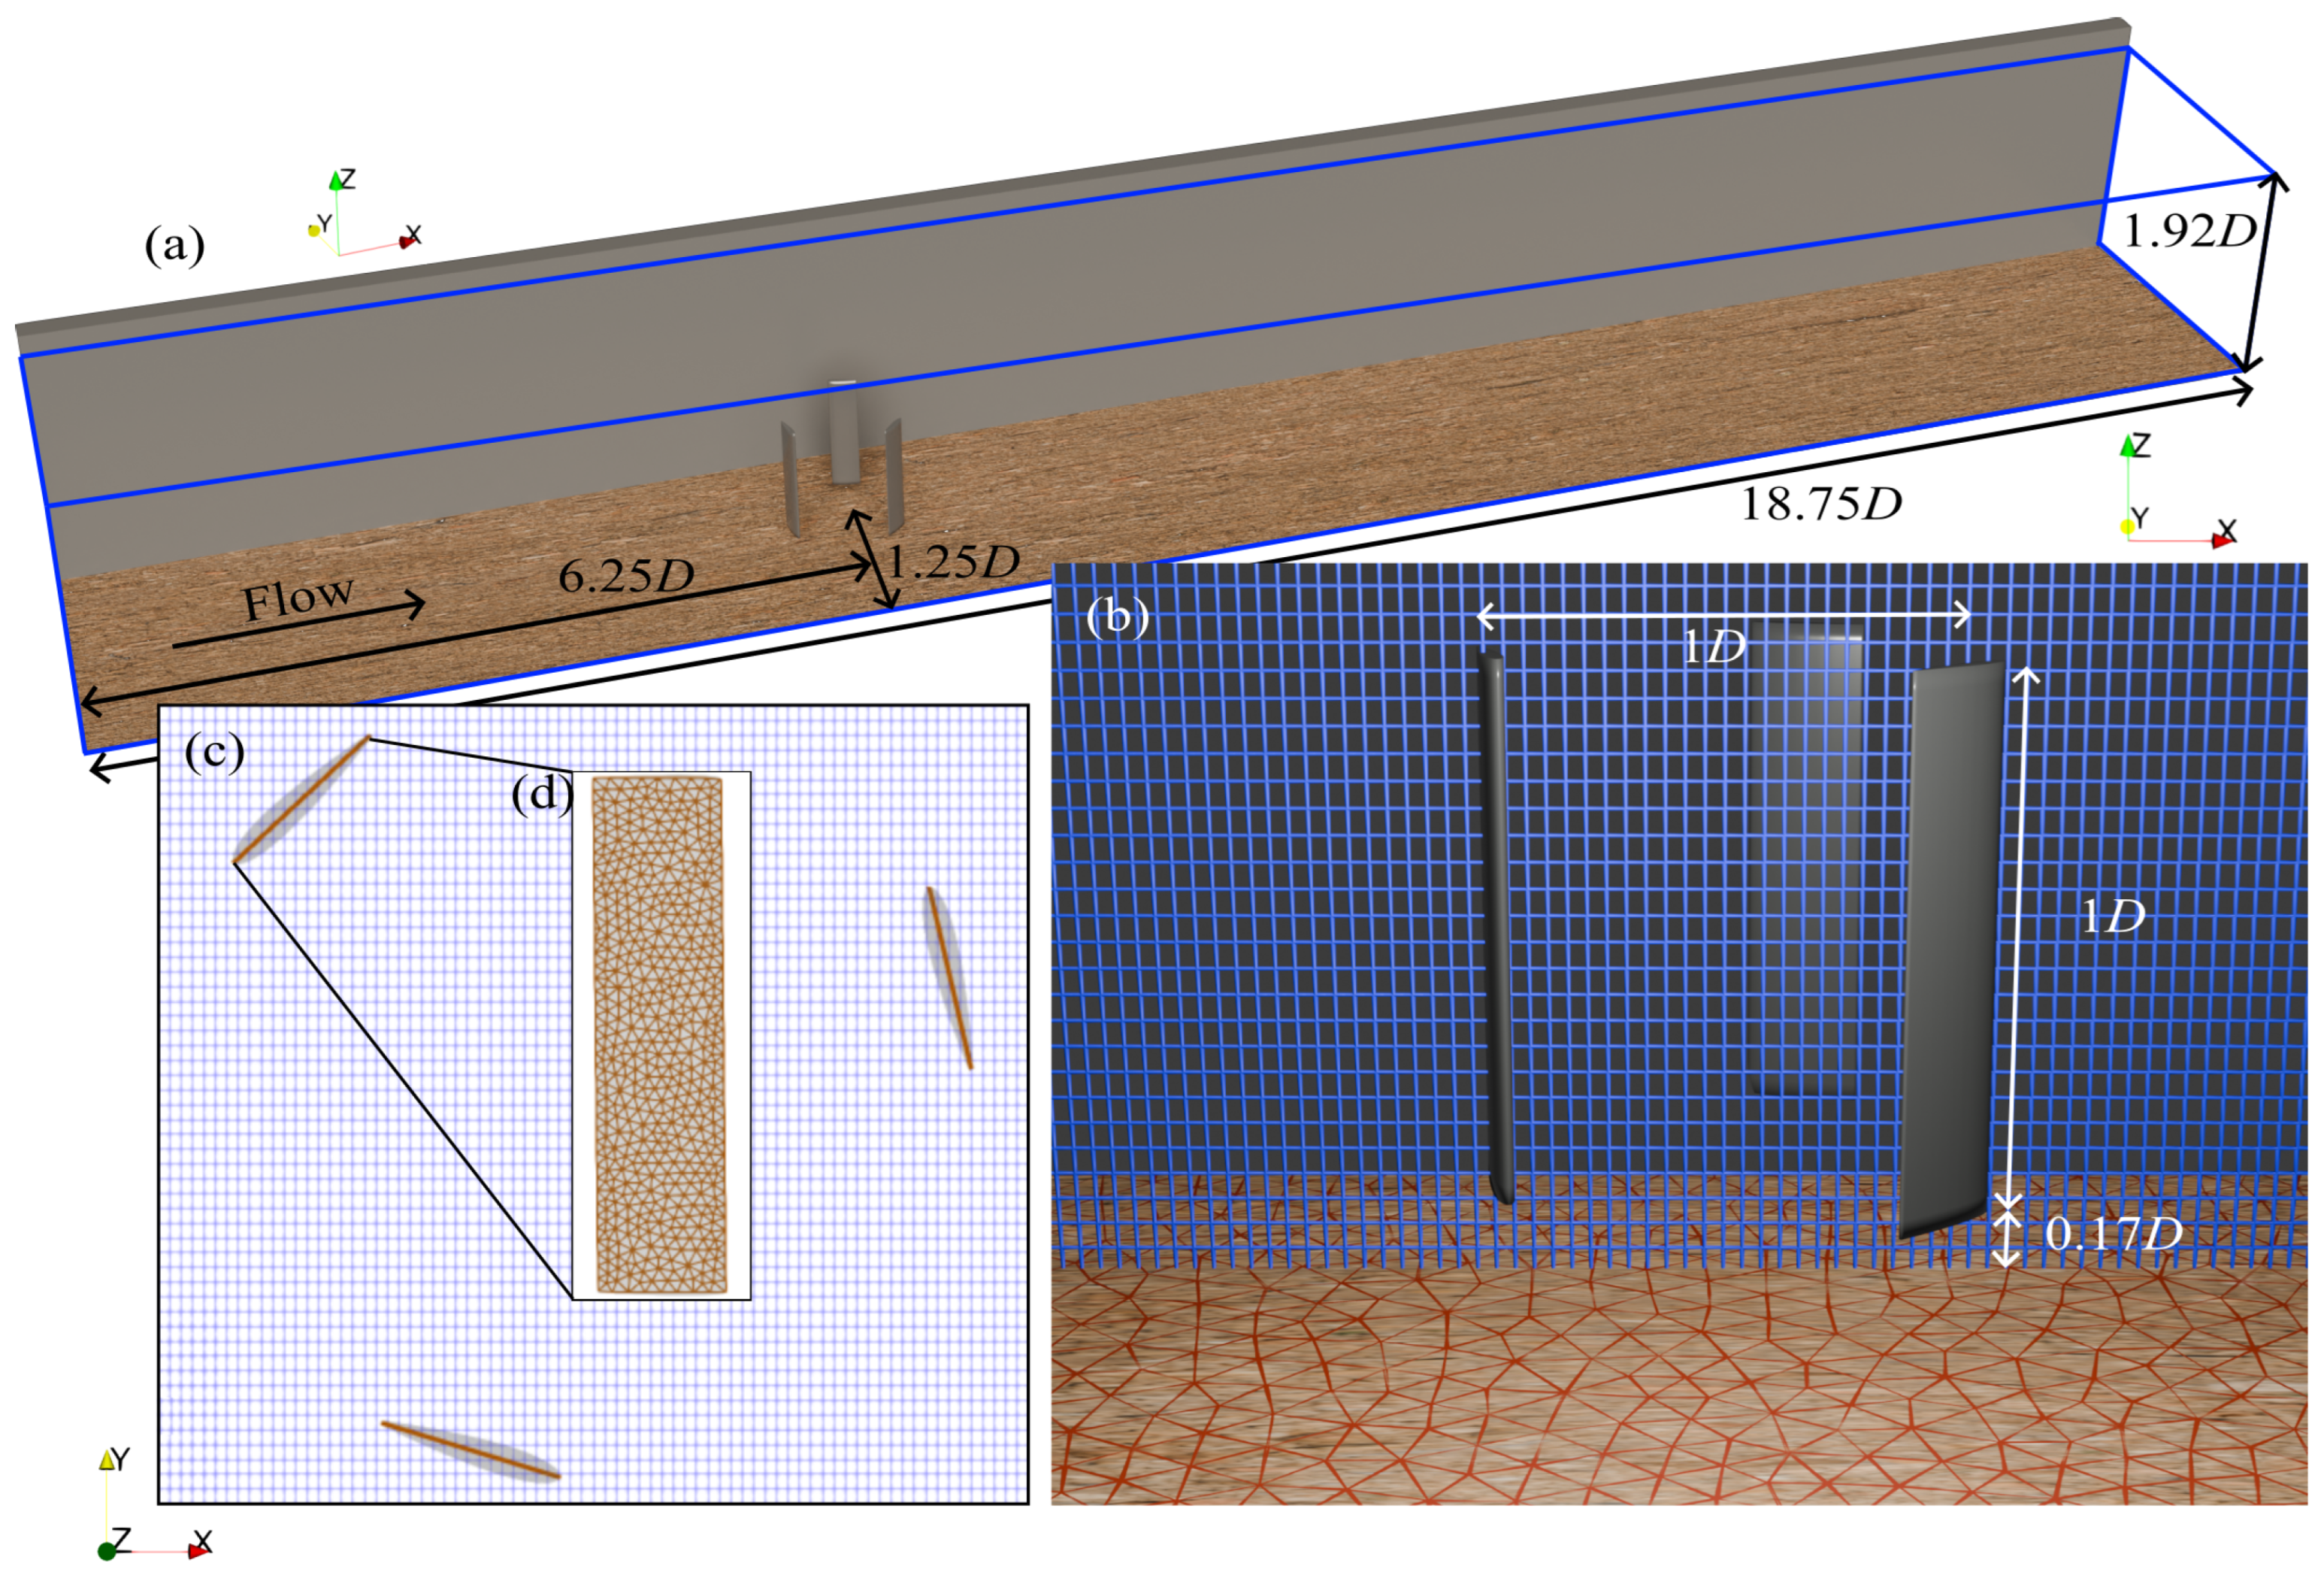
This section outlines the numerical simulation setup by detailing flow conditions, turbine specifications, channel properties, and sediment particle properties. The simulated domain of the channel is 5 m wide, 37.5 m long, and 3.84 m high. A utility-scale three-bladed H-Darrieus vertical-axis turbine, using a NACA0015 hydrofoil [32,33], is positioned at the centerline and 6.25 D downstream from the channel’s inlet (Figure 3a). The turbine has a diameter of 2 m, chord length of 0.5 m, and blade height of 2 m (Figure 3b), yielding a geometric solidity of σ = 0.24 [88]. As noted by Gholami Anjiraki et al. [88], the effects of turbine struts and the central shaft on both the flow field and bed morpho-dynamics are negligible. Consequently, only the turbine blades are modeled in this study, allowing for more computationally efficient simulations. Simulations are conducted at a bulk velocity of U = 1.5 m/s, corresponding to a Reynolds number of R e = 3 × 10 6 .
The flow domain is discretized using a uniform grid with 941 × 133 × 117 nodes respectively in the streamwise, spanwise, and vertical directions. This leads to a total of approximately 17 million background grid nodes, with an approximate spatial resolution of 0.02 D . The minimum grid spacing in the vertical direction corresponds to approximately 1100 inner wall units. A non-dimensional time step of Δ t * = 0.0005 is employed, where Δ t * = Δ t U / D . The corresponding physical time step is Δ t = 0.00067 s, ensuring that the Courant–Friedrichs–Lewy (CFL) number remains below unity throughout the simulation.
The mean grain size in sandy riverbeds typically ranges from 0.05 mm to 2 mm [89]. The considered sand bed material has a mean grain size of d 50 = 0.7 , mm with the porosity of γ = 0.4 , and the angle of repose of ϕ = 40 .
Additionally, three TSR values ( = Ω D / 2 U ) of 1.6 , 2.0 , and 2.4 with counterclockwise blade rotation are considered in this study. Centered around the experimentally determined optimum TSR of 1.9 [32], this range is selected to examine the influence of live-bed conditions on the near-optimal performance of the VAT [88]. Additionally, in total, six numerical experiments were conducted by combining the three TSRs with rigid- and live-bed conditions (see Table 1).
Table 2 lists the parameters in both the hydro- and morpho-dynamic solvers. The computational grid resolution is denoted by ( N x , N y , N z ) in the streamwise, spanwise, and vertical directions. Spatial steps of the flow solver ( Δ x , Δ y , Δ z ) are normalized by the rotor diameter D, and Δ s is used in the morpho-dynamic solver. The minimum wall-normal spacing is reported as Δ z + . Time steps are expressed in non-dimensional form as Δ t * for the flow solver and Δ t s for the morpho-dynamic solver. Sediment porosity is denoted by γ , the angle of repose by ϕ , sediment particle density by ρ s , and the mean grain size by d 50 .
For live-bed cases (4–6), the bed was initially frozen while the flow solver ran until the flow reached a statistically steady state, indicated by stabilized total kinetic energy [88]. Then, the sediment transport module was activated to allow the live bed’s evolution. To reduce computational cost, a rigid-lid assumption was used to neglect water surface fluctuations around immersed bodies [78,79].
A separate precursor simulation with periodic boundary conditions in the streamwise direction was run in a rigid-bed channel without any turbine to generate fully developed turbulence identified by a plateau in total kinetic energy [88]. The instantaneous flow field at mid-length was extracted as the inlet condition for test cases, and a Neumann boundary condition was applied at the outlet.
Simulations were performed on a 19-core AMD Epyc Linux cluster. Rigid-bed cases required approximately 4400 CPU hours to achieve flow convergence, whereas live-bed cases required about 6200 CPU hours so that the live bed could reach a state of equilibrium. Compared with turbine-resolving simulations [88], the ASM reduced computational cost by a factor of roughly 24.5 for rigid-bed cases and 26.6 for live-bed cases.

4. Results and Discussions

This section presents the analysis of hydro- and morpho-dynamic results, starting with instantaneous and time-averaged flow over a rigid bed, followed by live-bed simulation results. It concludes with an evaluation of turbine performance to assess the impact of sediment dynamics on VAT efficiency.

4.1. Wake Flow Under Rigid-Bed Conditions

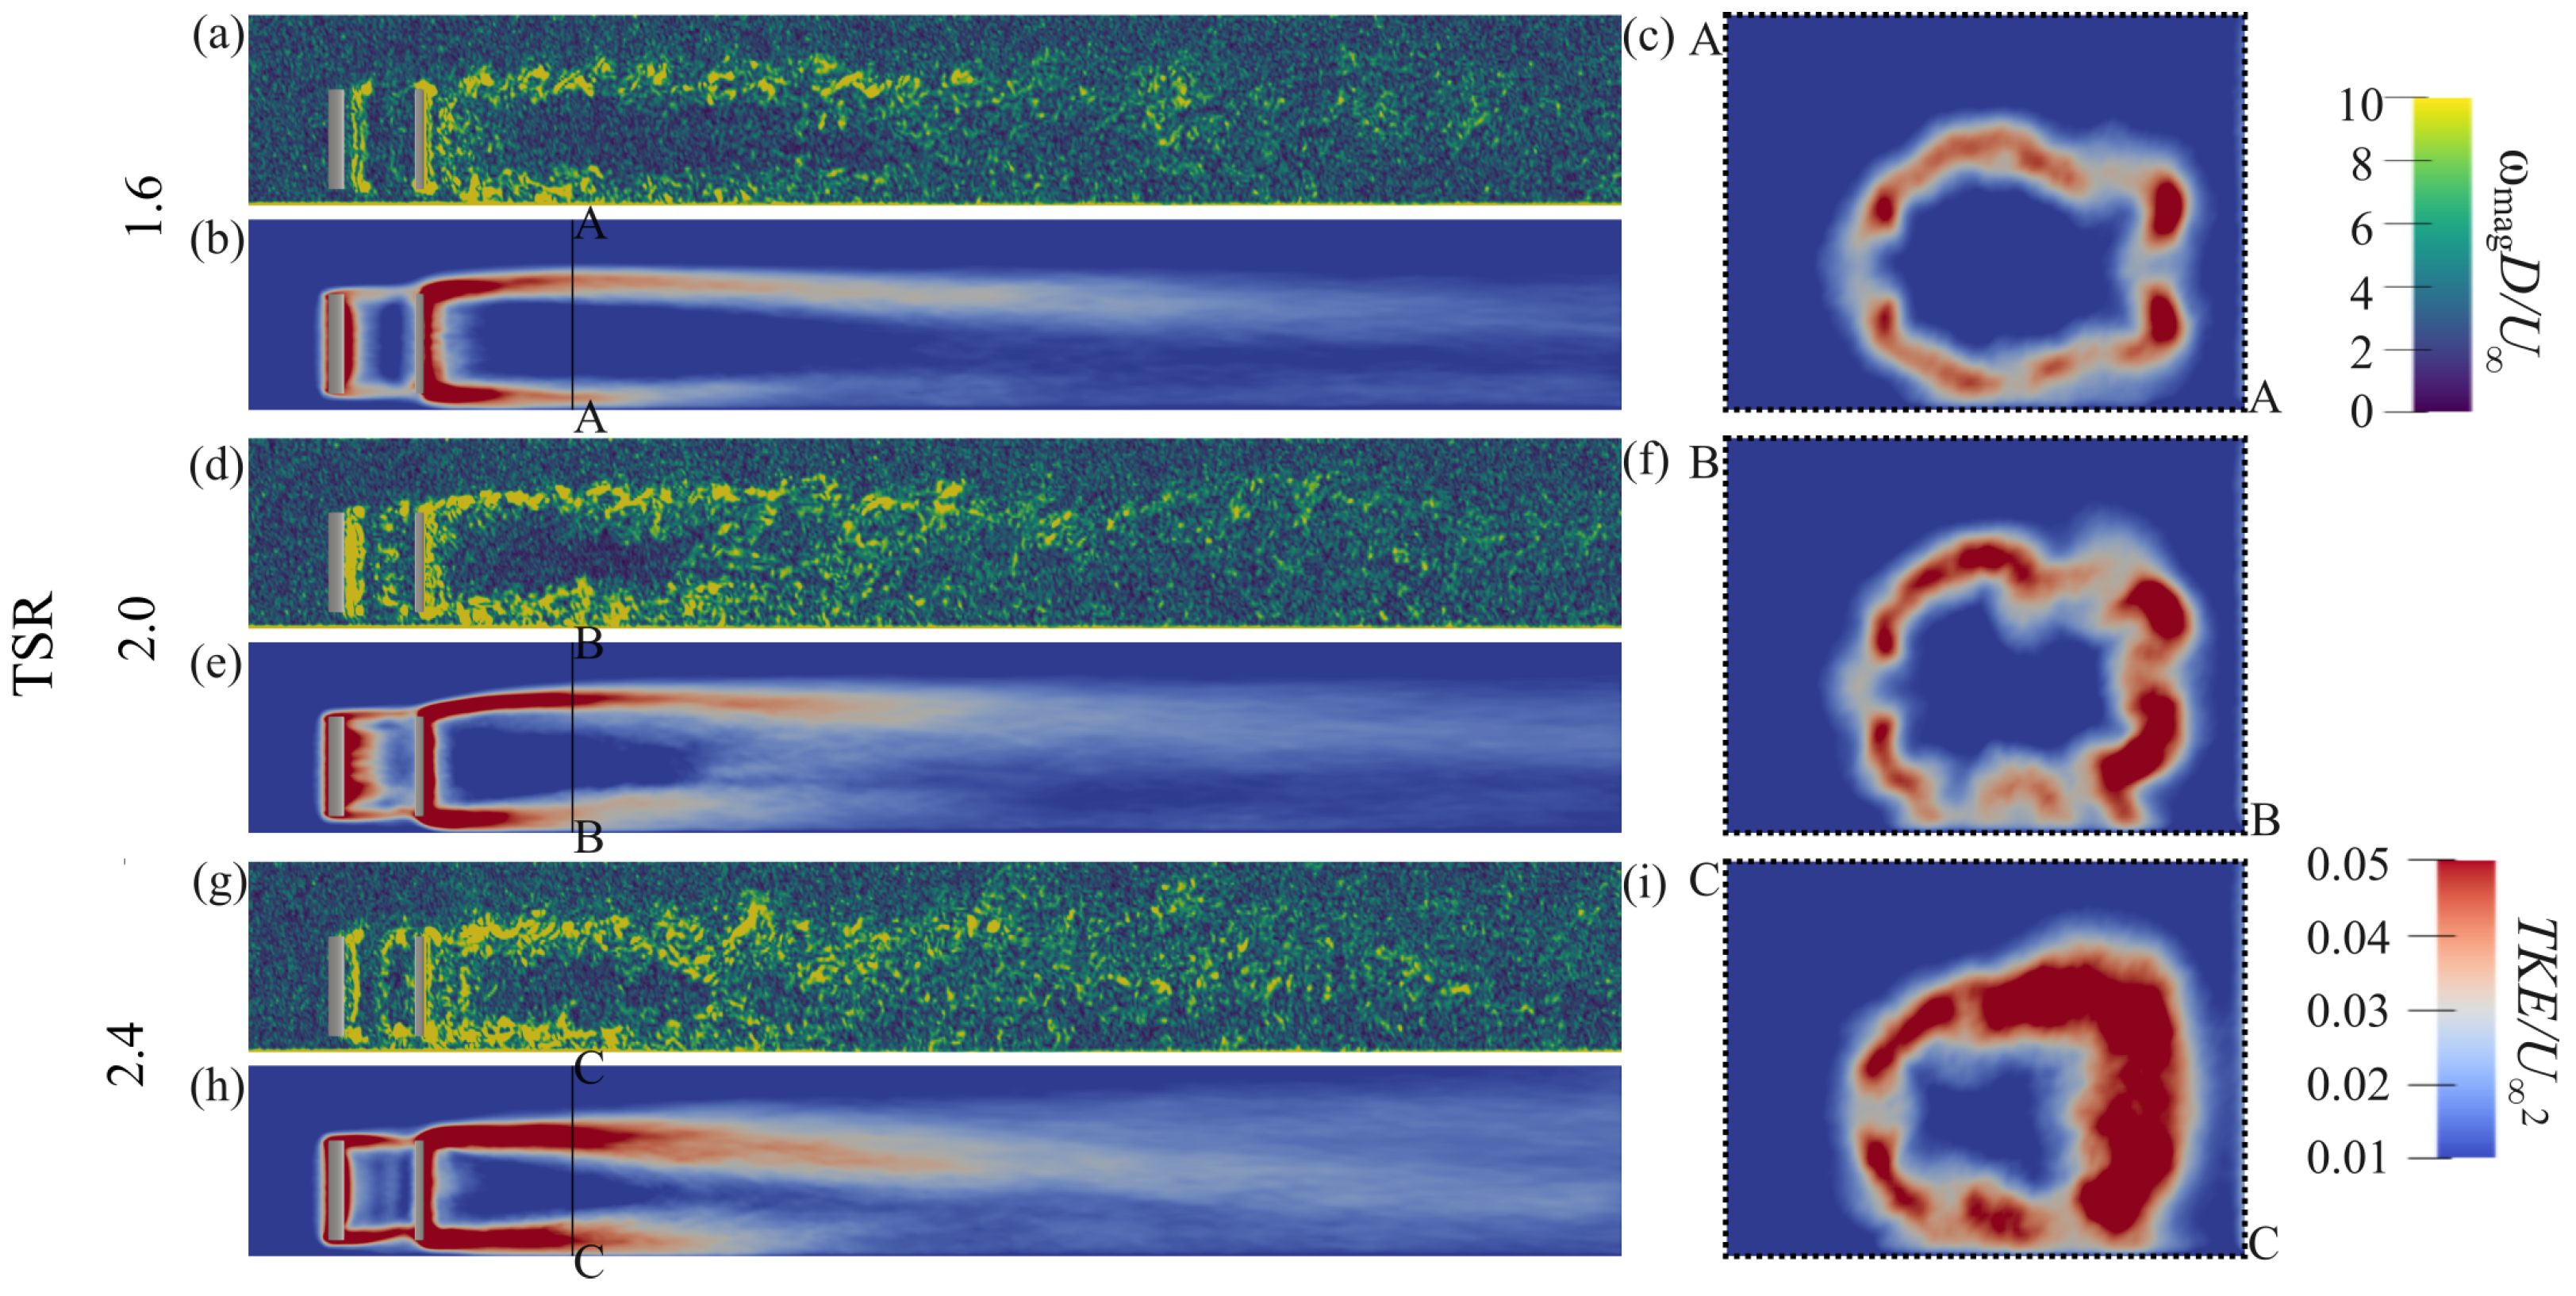
Figure 4a,d,g presents side-view slices of the non-dimensional instantaneous vorticity magnitude under rigid-bed conditions at the channel centerline. In all cases, pronounced vorticity and flow separation around the blades indicate dynamic stall [121]. At TSR = 1.6 , weak shear layers extend into the near wake but dissipate downstream, while increasing TSR to 2.0 and 2.4 strengthens blade–flow and blade-to-blade interactions [44], producing more intense near-wake shear layers and energetic regions closer to the turbine [88]. This correlation between TSR, turbulence production, and near-wake energy aligns with previous findings [44]. At higher TSRs, wake structures persist farther downstream, and turbulence intensifies near the bed and within the rotor, influencing both bed morphology and turbine performance.
Figure 4b,e,h presents color maps of TKE along the longitudinal section at the channel centerline. As TSR increases, regions of elevated TKE become more concentrated around the mid-depth and shift closer to the turbine and near-wake. As noted by Posa [122], this reflects the intensification of local turbulence induced by higher blade rotational speeds. Given the established relationship between TKE and sediment erosion reported by [88,123], such distributions have important implications for live-bed channels, which will be further discussed in subsequent sections.
Figure 4c,f,i presents cross-plane color maps of normalized TKE at 2 D downstream of the turbine. For all TSRs, turbulence is concentrated near the blade edges, while the centerline and mid-depth remain comparatively lower. With increasing TSR, these regions intensify and expand toward the channel center, driven by stronger flow–blade and blade-to-blade interactions [44,88]. Moreover, the turbulence distribution also becomes increasingly asymmetric toward the upper sidewall, reflecting the effect of counterclockwise blade rotation. These features have important implications for turbine farms, where cumulative turbulence and wake interactions influence array performance and contribute to fatigue loading on individual turbines.
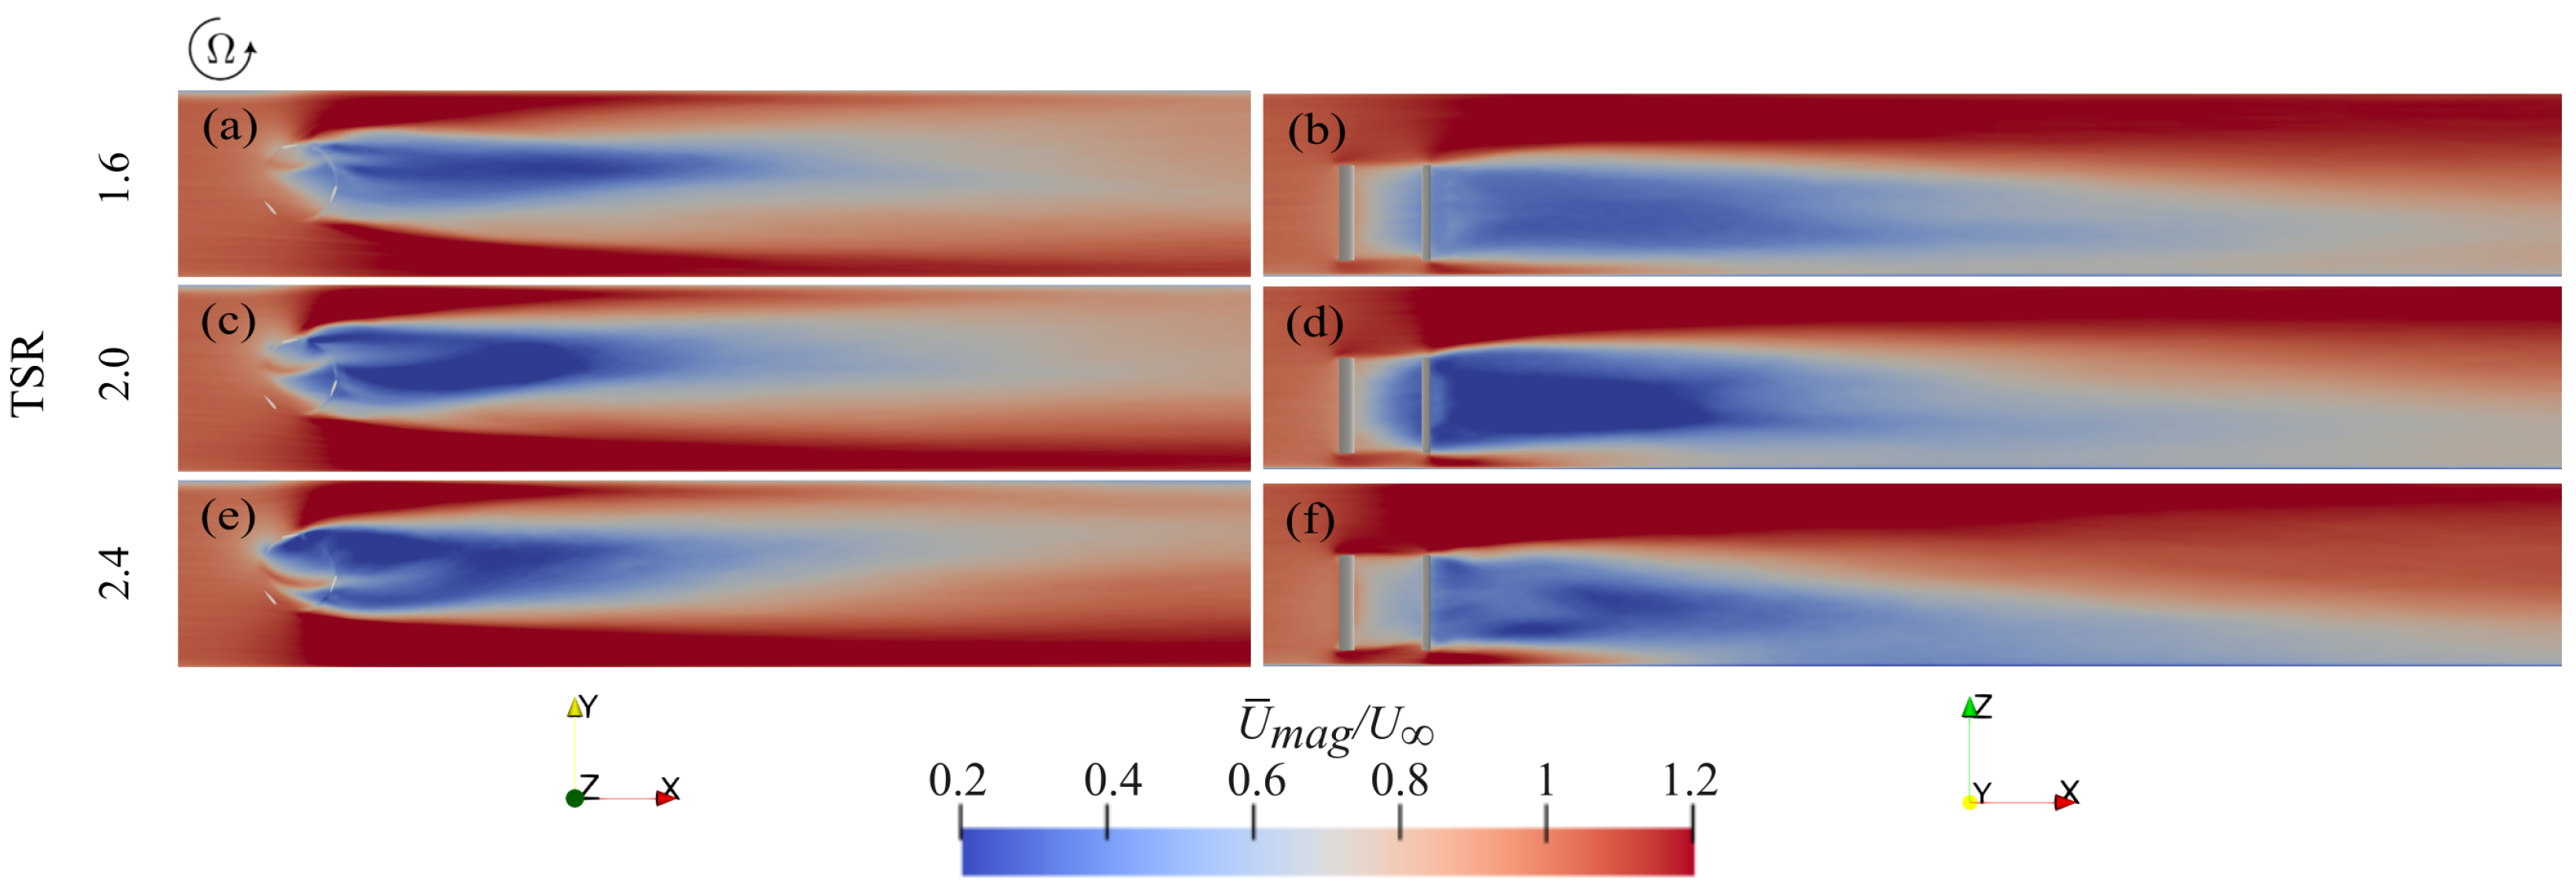
Figure 5a,c,e presents top-view color maps of the non-dimensional, time-averaged velocity magnitude ( U ¯ m a g / U ) at blade mid-depth under rigid-bed conditions. As TSR increases, the wake intensifies and becomes more confined to the near field and rotor regions (see, for example, Figure 5a,e), reflecting stronger near-field turbulence that elevates bed shear stress and promotes sediment transport in the wake region. In contrast, at lower TSR, the wake extends farther downstream and spans almost the entire channel width, with its expansion suppressed by the channel sidewalls. This behavior is particularly relevant for natural riverine environments and turbine farms, where broader wakes at low TSR may influence downstream turbine performance and overall power production.
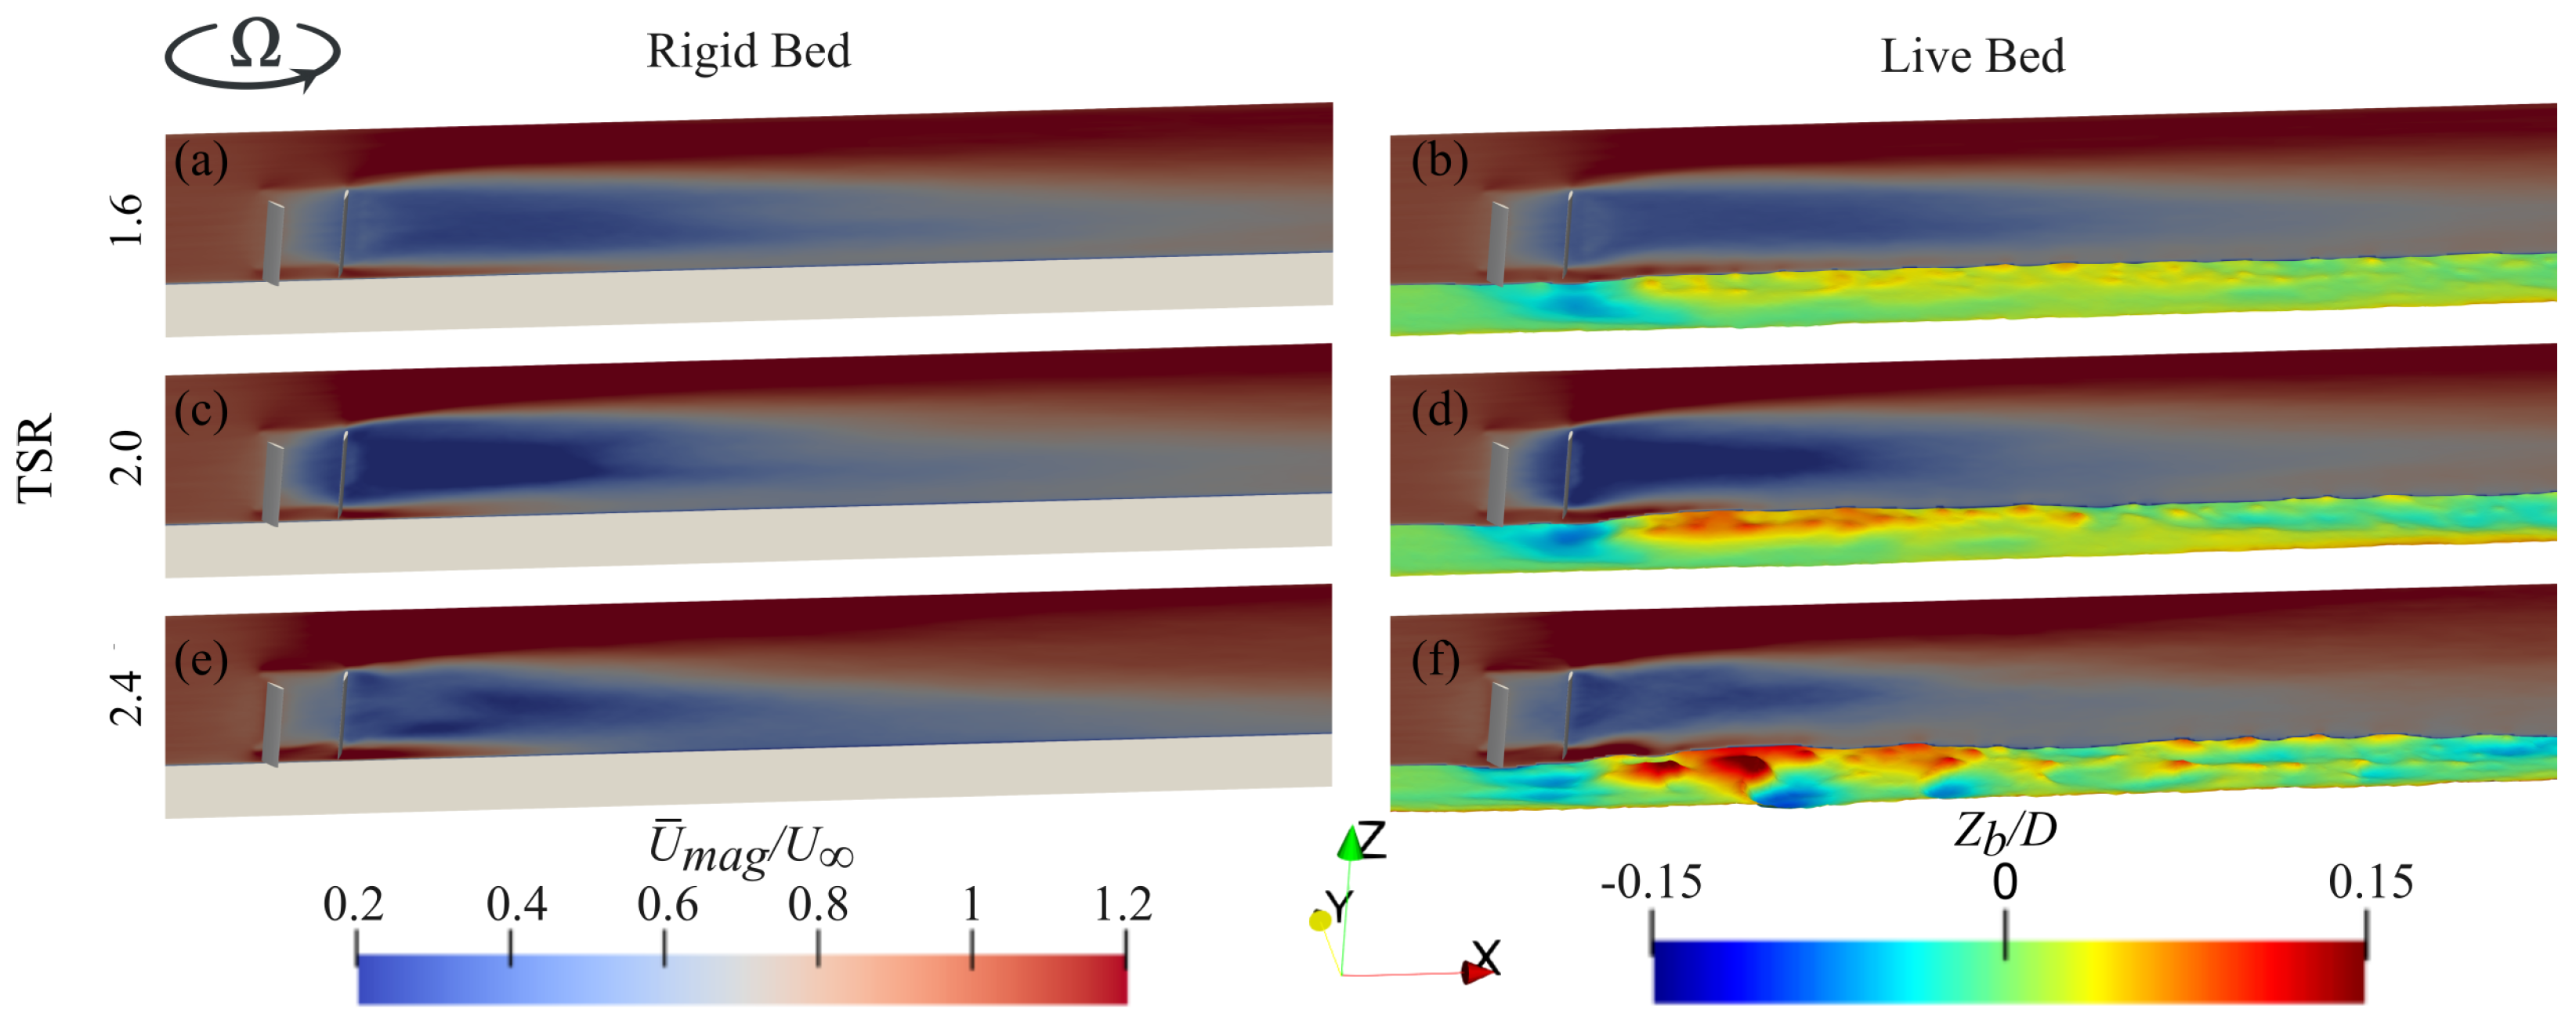
Figure 5b,d,f presents side-view color maps of the non-dimensional, time-averaged velocity magnitude ( U ¯ m a g / U ) along the channel centerline under rigid-bed conditions. With increasing TSR, a distinct high-momentum zone develops beneath the turbine, indicating intensified potential sediment transport. The turbulent wake core also shifts downward in both the near and far field, aligning more closely with the bed over an extended downstream distance, suggesting enhanced sediment transport under live-bed conditions.

4.2. Wake Flow Under Live-Bed Conditions

The hydrodynamic results from the coupled hydro- and morpho-dynamic simulations under live-bed conditions are analyzed herein. The simulations begin with a fixed bed until the flow reaches statistical convergence, after which the bed is allowed to deform. As turbulence interacts with the live bed, sediment motion gradually reshapes the surface until a dynamic equilibrium is achieved, characterized by stable sand-wave migration and nearly constant maximum scour depth and sand-bar height. Once equilibrium is reached, the bed geometry is fixed, and the flow solver is reactivated to compute time-averaged turbulence statistics.
Figure 6 presents the dimensionless, time-averaged velocity magnitude ( U ¯ m a g / U ) at the dynamic equilibrium state of the live bed for different TSRs, compared with the rigid-bed cases. Under live-bed conditions (Figure 6b,d,f), near-bed flow momentum around the turbine is slightly reduced due to bed deformation, while above approximately 0.3 D , the velocity field closely matches that of the rigid-bed configuration, consistent with Gholami Anjiraki et al. [88]. The near-wake results further reveal that live-bed conditions produce a shorter wake and faster velocity recovery than rigid-bed cases. This enhanced recovery arises from scour near the turbine base and downstream deposition, which generate localized turbulence and a near-bed jet that injects momentum into the wake core, accelerating flow recovery and redistributing energy [88], as well as promoting asymmetry consistent with Aksen et al. [79].
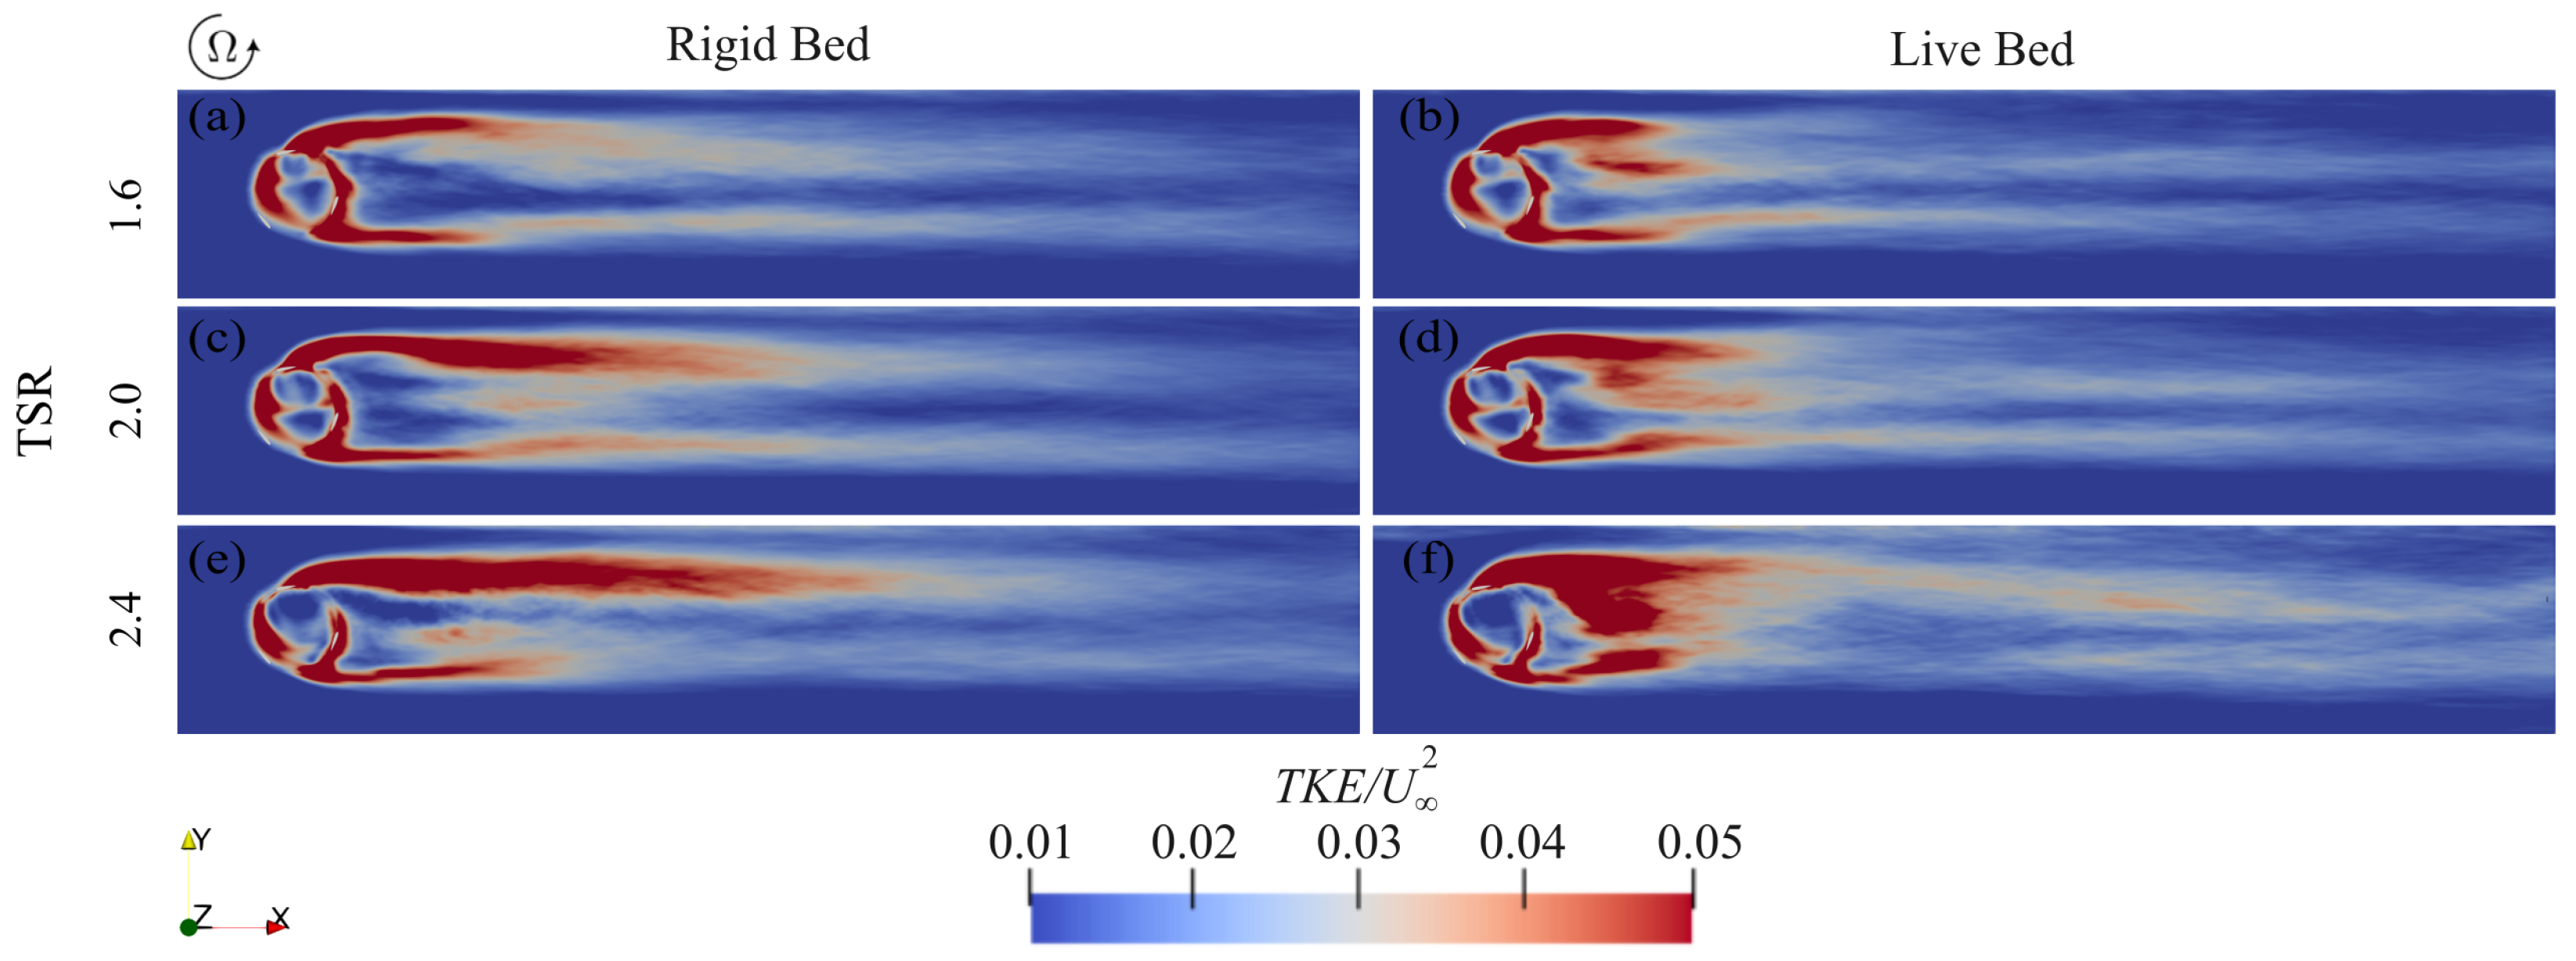
Figure 7 presents top-view maps of TKE, normalized by U 2 , at a height of 0.35 D , slightly above the maximum live-bed deposition at TSR = 2.4 . Under rigid-bed conditions (Figure 7a,c,e), increasing TSR produces an increasingly asymmetric turbulence field, with higher TKE concentrated along the upper part of the channel and extending farther downstream. Under live-bed conditions (Figure 7b,d,f), turbulence shifts closer to the turbine, intensifying the near-wake. At higher TSR, this elevated turbulence also decays more rapidly than in the rigid-bed cases (see Figure 7e,f). Additionally, the influence of the live bed on turbulence progressively weakens with increasing distance from the bed.
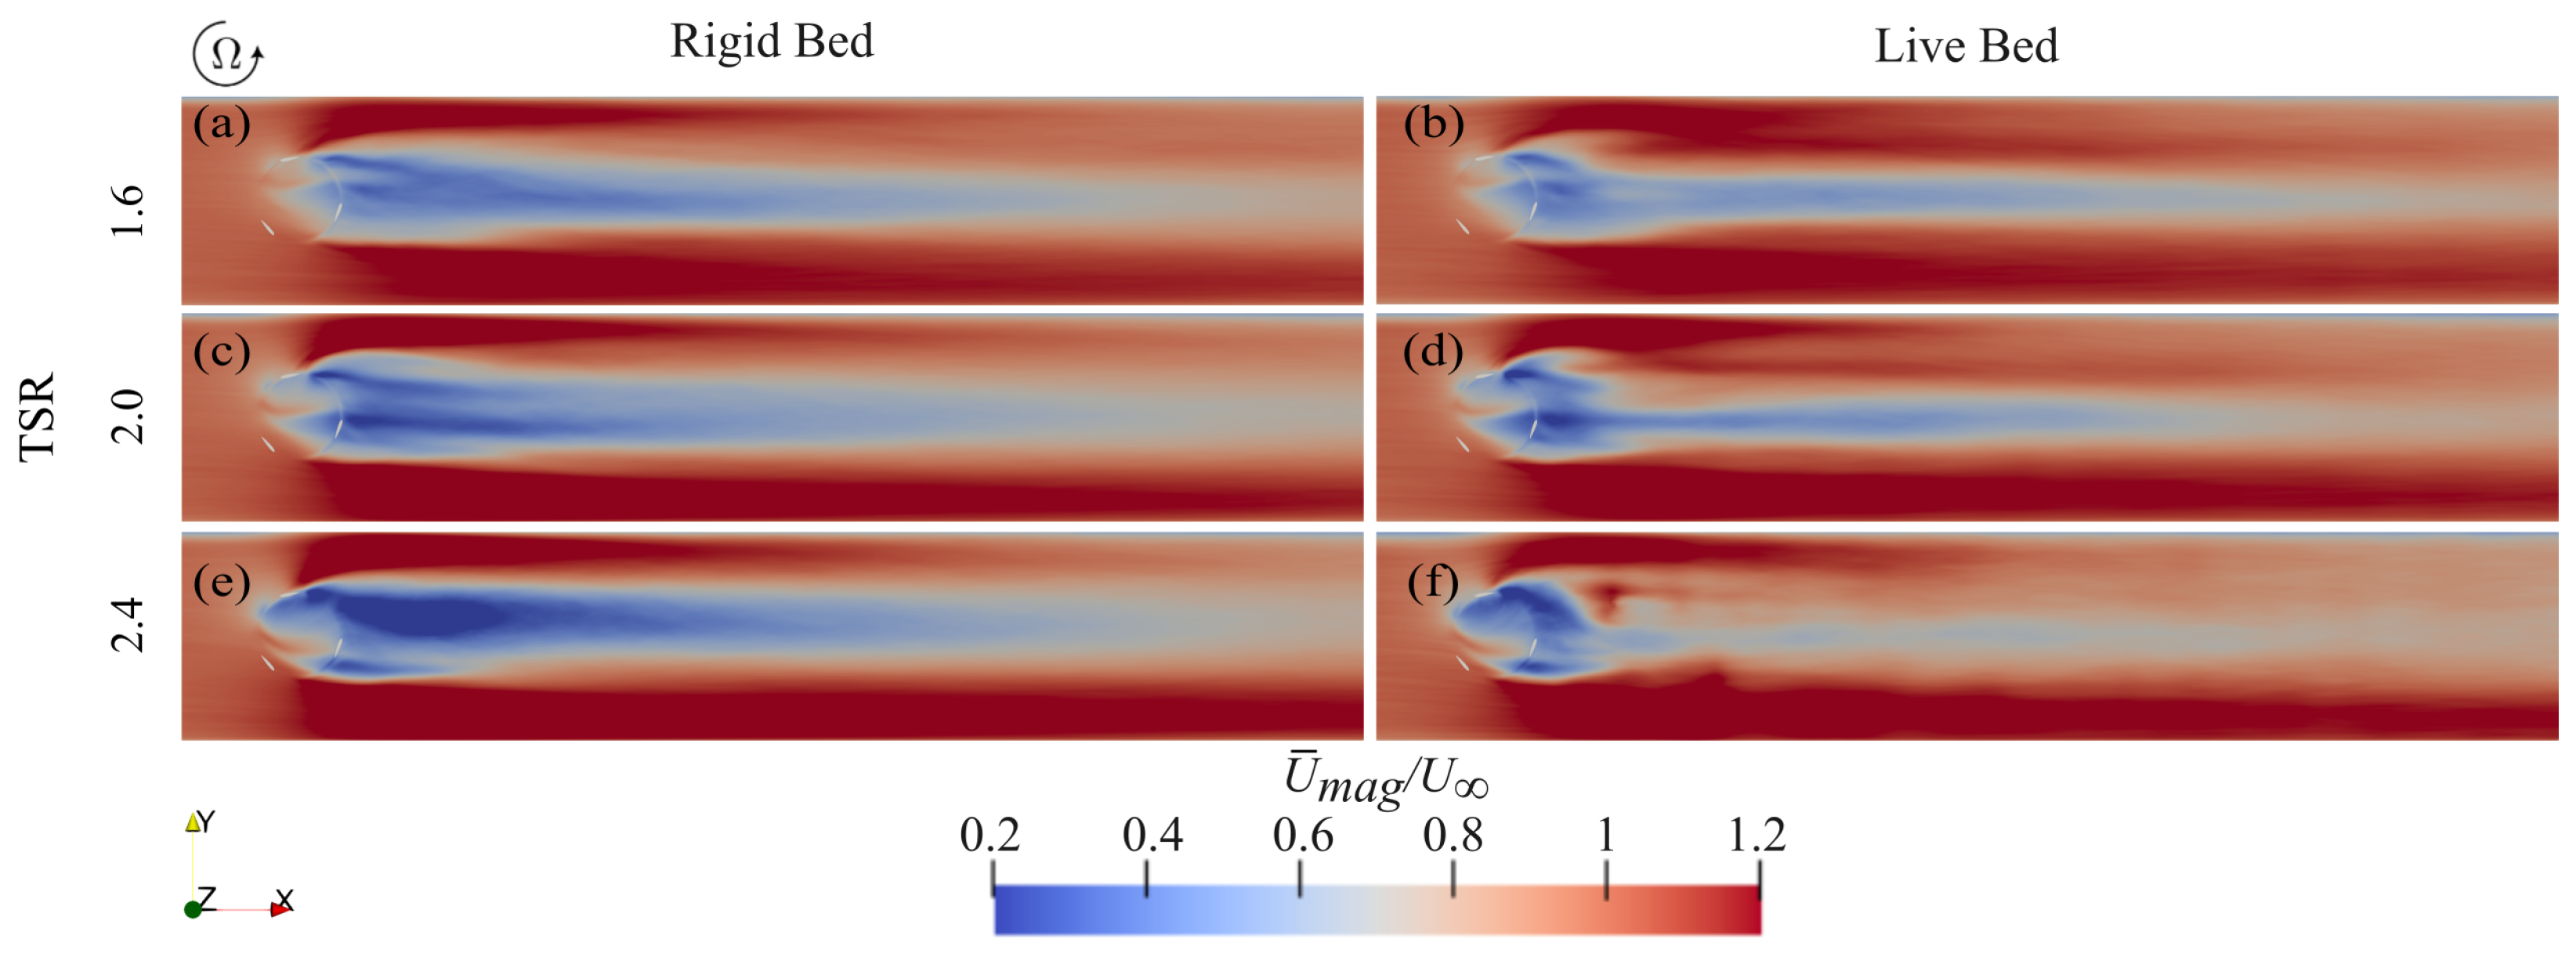
Figure 8 illustrates the normalized time-averaged velocity magnitude under both rigid- and live-bed cases, captured at 0.35 D above the bed. As seen under rigid-bed conditions (Figure 8a,c,e), increasing TSR produces a highly intensified momentum-deficit region in the near wake, consistent with the findings of Posa [122]. This high-deficit region is slightly asymmetric. More specifically, a larger velocity deficit appears along the upper part of the channel and persists farther downstream, which is aligned with previous findings [88]. Under live-bed conditions (Figure 8b,d,f), sediment particles transported from beneath the turbine and deposited in the near field deforms the bed and generates bed-induced jet flows that penetrate the wake core, leading to faster velocity recovery through the mixing process. At TSR = 1.6 (Figure 8a,b), this effect is more apparent in the near field and diminishes farther downstream. As TSR increases, however, the effect becomes more pronounced in both the near and far fields. In other words, under live-bed conditions, increasing TSR yields faster wake recovery due to higher downstream sand bars and deeper erosion beneath the turbine, which generate stronger jet flows that inject additional momentum into the downstream wake core, consistent with previous findings [88].
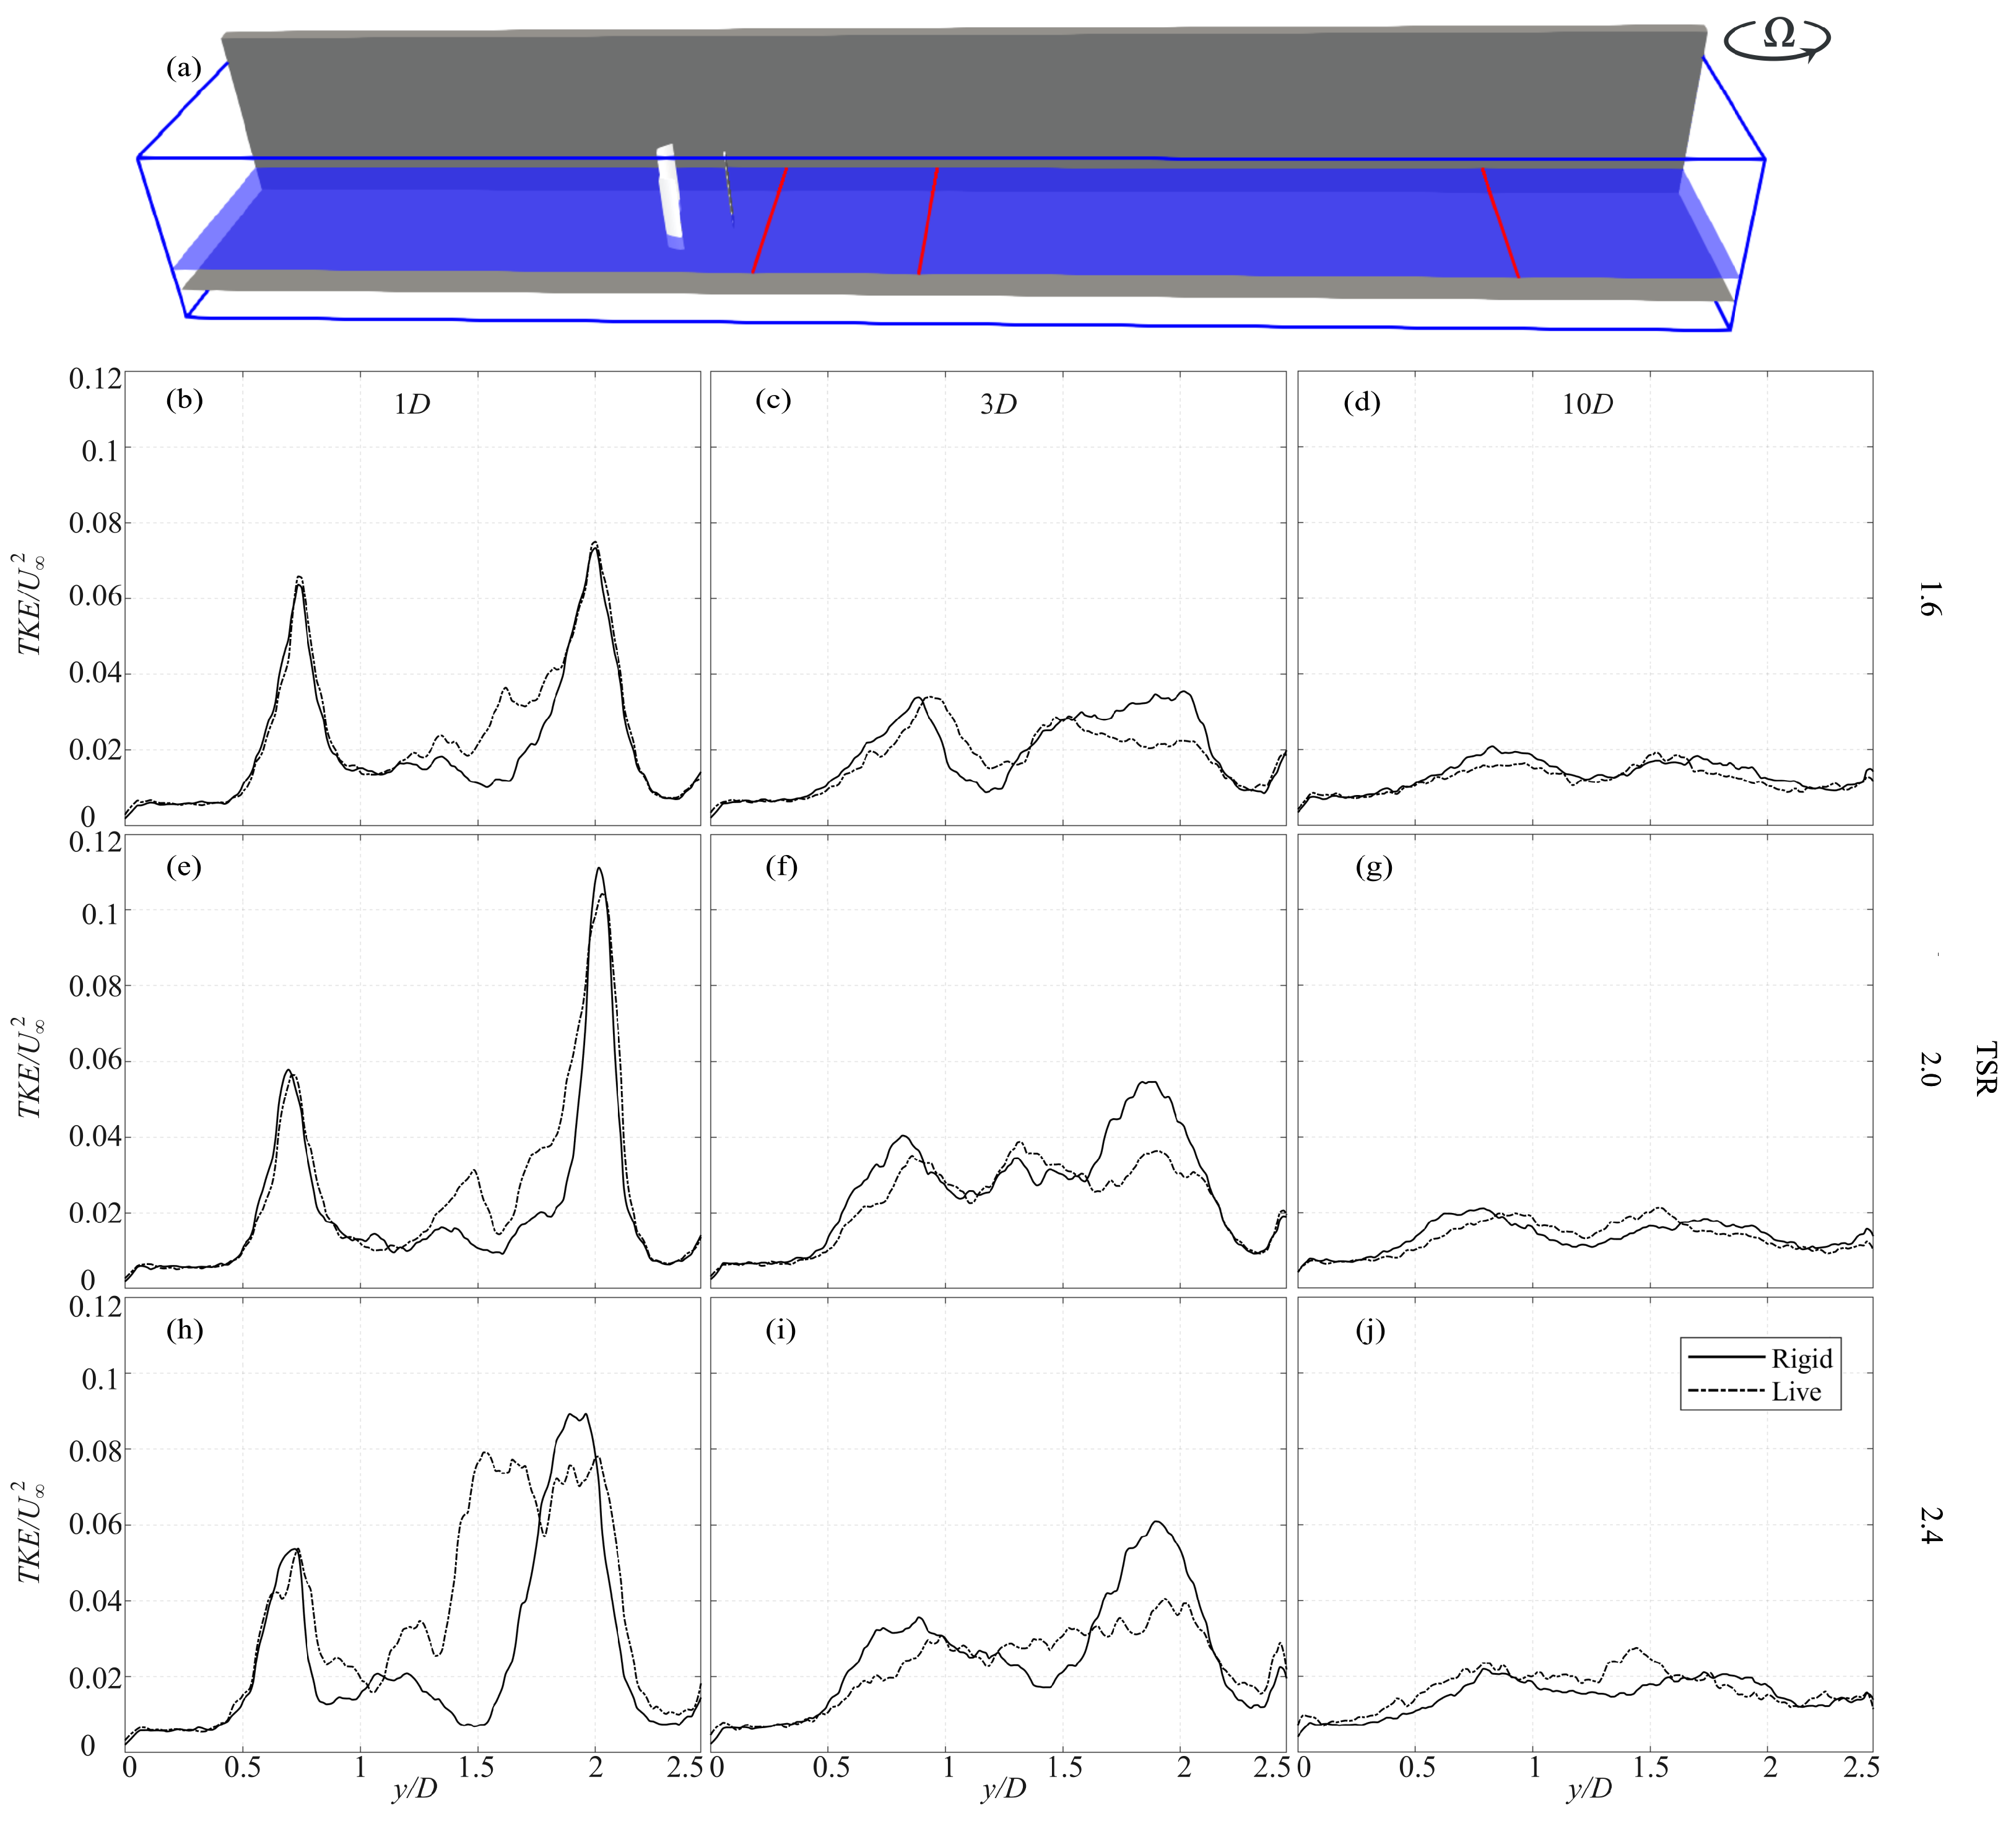
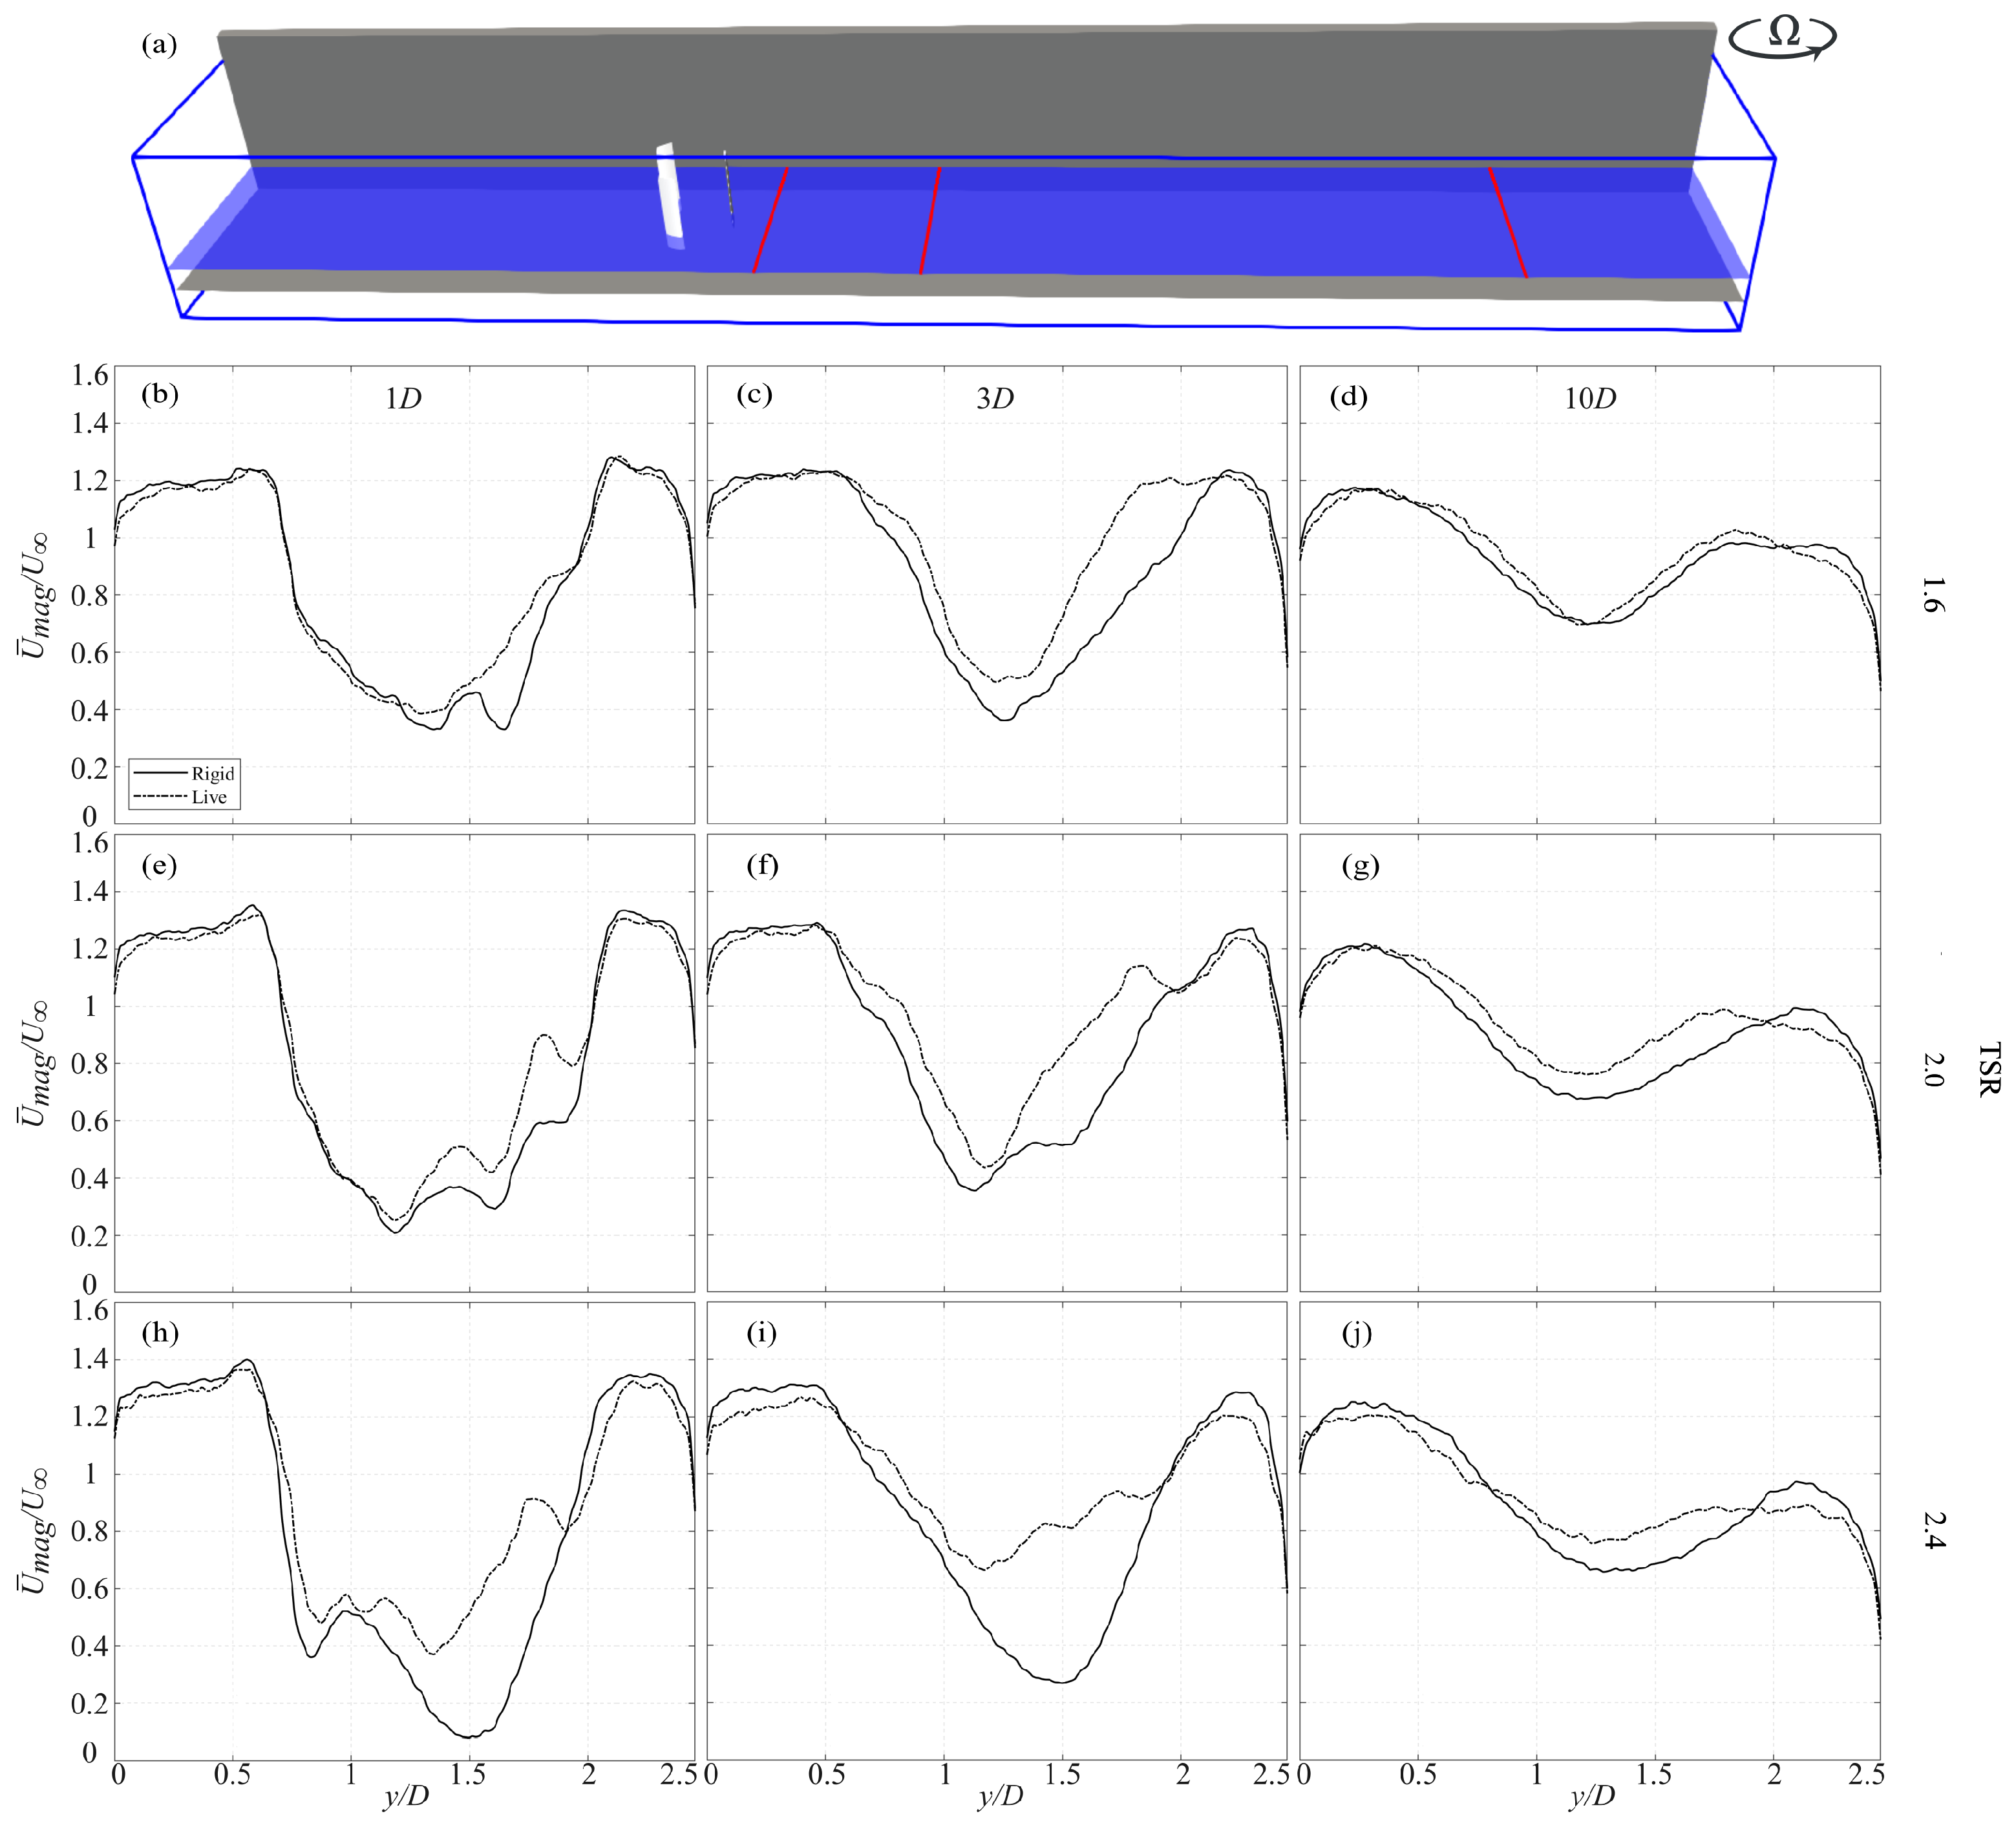
For a quantitative assessment of the turbulent flow under both rigid- and live-bed conditions, Figure 9 and Figure 10 correspond to the TKE and velocity magnitude profiles, respectively, extracted at 0.35 D above the bed along the spanwise direction. The profiles are sampled at three downstream locations, x / D = 1 , x / D = 3 , and x / D = 10 , corresponding to the near, mid, and far field. We begin with the analysis of TKE. Under rigid-bed conditions at x / D = 1 (Figure 9b,e,h), increasing TSR generally elevates TKE. However, in the lower part of the channel (i.e., y / D 0.75 ), the differences across cases remain below 3 % and are therefore negligible. Approaching the centerline, the inter-case difference grows to about 5 % , with the highest TSR exhibiting the largest turbulence. From the channel centerline toward the upper region, where the blades encounter the incoming flow and turbulence intensifies, the inter-case differences grow progressively, reaching their maximum near the edge of the shear layer. More specifically, at y / D 1.75 , TKE increases from 0.022 for TSR = 1.6 to 0.058 for TSR = 2.4 , which is about a 163 % increase. For 1.95 y / D 2.1 , TKE decreases for all cases except TSR = 2.0 , which peaks near y / D 2.0 at 0.11 . Finally, in the upper part of the channel ( y / D 2.1 ), blade effects on the flow almost diminish, and TKE declines at nearly the same rate across all cases. Under live-bed conditions, the bed deformations increase TKE in all cases. This probably stems from the deformed bed beneath and in front of the turbine. The elevated TKE is primarily concentrated in 1.2 y / D 1.75 , the region most influenced by blade rotation, where the associated bed deformations further amplify the turbulence. Additionally, the difference in TKE between the live- and rigid-bed cases increases with increasing TSR. More specifically, under live-bed conditions, TKE increases on average by 14.4 % , 19.2 % , and 43.1 % for T S R = 1.6 , 2.0 , and 2.4 , respectively.
At x / D = 3 (Figure 9c,f,i), TKE increases under live-bed conditions along the channel centerline region ( 0.95 y / D 1.5 ), driven by tall downstream sand bars that alter the local momentum distribution and enhance turbulence. Outside this region, particularly near the sidewalls, TKE decreases. More specifically, under live-bed conditions, TKE increases along the centerline by 66.2 % , 48.1 % , and 58.8 % for TSR = 1.6 , 2.0 , and 2.4 , respectively, compared to that under rigid-bed conditions. Conversely, near the sidewalls, it decreases by 42.9 % , 38.8 % , and 96.7 % for TSR = 1.6 , 2.0 , and 2.4 , respectively. These reductions near the sidewalls may help mitigate erosion in narrow riverine environments, potentially improving bank stability in real deployments. At x / D = 10 (Figure 9d,g,j), the turbulent structures generated in the near and mid wake weaken, and live-bed effects in the far field remain relatively small, with an average influence below 3 % . As in the mid field, TKE increases near the centerline and decreases toward the sidewalls, except for TSR = 2.4 , where live-bed conditions produce increased TKE near the lower sidewall due to more pronounced downstream bed deformation at higher TSR.
We then proceed with the analysis of velocity magnitude in Figure 10. Under rigid-bed conditions at x / D = 1 (Figure 10b,e,h), wake symmetry is influenced by TSR. At lower TSR, the downstream wake remains more symmetric, whereas higher TSR values skew the wake upwards, reflecting the counterclockwise blade rotation, which was previously reported by Tescione et al. [36] and Posa et al. [44]. Moreover, increasing TSR reduces the minimum near-wake velocity around the channel centerline to 0.33 , 0.20 , and 0.07 for TSR = 1.6 , 2.0 , and 2.4 , respectively. In contrast, velocities near the sidewalls ( y / D 0.7 and y / D 2.0 ) remain nearly unchanged, indicating the faster wake recovery in the spanwise direction with increasing TSR. Under live-bed conditions (Figure 10c,f,i), the near wake recovers considerably in all TSRs. This recovery is driven by jet flows induced by near-wake bed deformation, which inject momentum into the wake core and modify its structure. The effect intensifies with increasing TSR, as taller sand bars amplify the jet and its influence on the wake. More specifically, the minimum wake velocity under live-bed conditions is 0.39 , 0.25 , and 0.37 for TSR = 1.6 , 2.0 , and 2.4 , respectively. Near the sidewalls, the influence of the live bed diminishes, and the flow pattern closely resembles that observed over a rigid bed.
Further downstream at x / D = 3 (Figure 10c,f,i), the wake deficit persists under both rigid- and live-bed conditions. Under the rigid bed, increasing TSR reduces the minimum wake velocity to 0.36 , 0.33 , and 0.27 for TSR = 1.6 , 2.0 , and 2.4 , respectively. Comparison with values at x / D = 1 shows faster velocity recovery at higher TSRs, consistent with previous findings [37,47,122]. From x / D = 1 to x / D = 3 , the minimum velocity increases by approximately 9 % , 65 % , and 237 % for TSR = 1.6 , 2.0 , and 2.4 , respectively, a trend also associated with dynamic solidity effects [37,47,124]. Under live-bed conditions, the minimum wake velocity increases to 0.45 , 0.46 , and 0.66 for TSR = 1.6 , 2.0 , and 2.4 , representing gains of 25 % , 39 % , and 144 % relative to the rigid-bed cases. These trends agree with previous observations of wake recovery in sediment-laden environments for both horizontal- and vertical-axis turbines [79,88]. At x / D = 10 (Figure 10f,g,j), most of the velocity deficit has recovered under both bed conditions. For the rigid bed, minimum velocities reach 0.70 , 0.64 , and 0.63 for TSR = 1.6 , 2.0 , and 2.4 , respectively. Under live-bed conditions, these values increase slightly to 0.71 , 0.77 , and 0.79 . This indicates that lower TSRs produce less bed deformation, and in the far field, the influence of the live bed on wake dynamics becomes small.

4.3. Sediment Dynamics

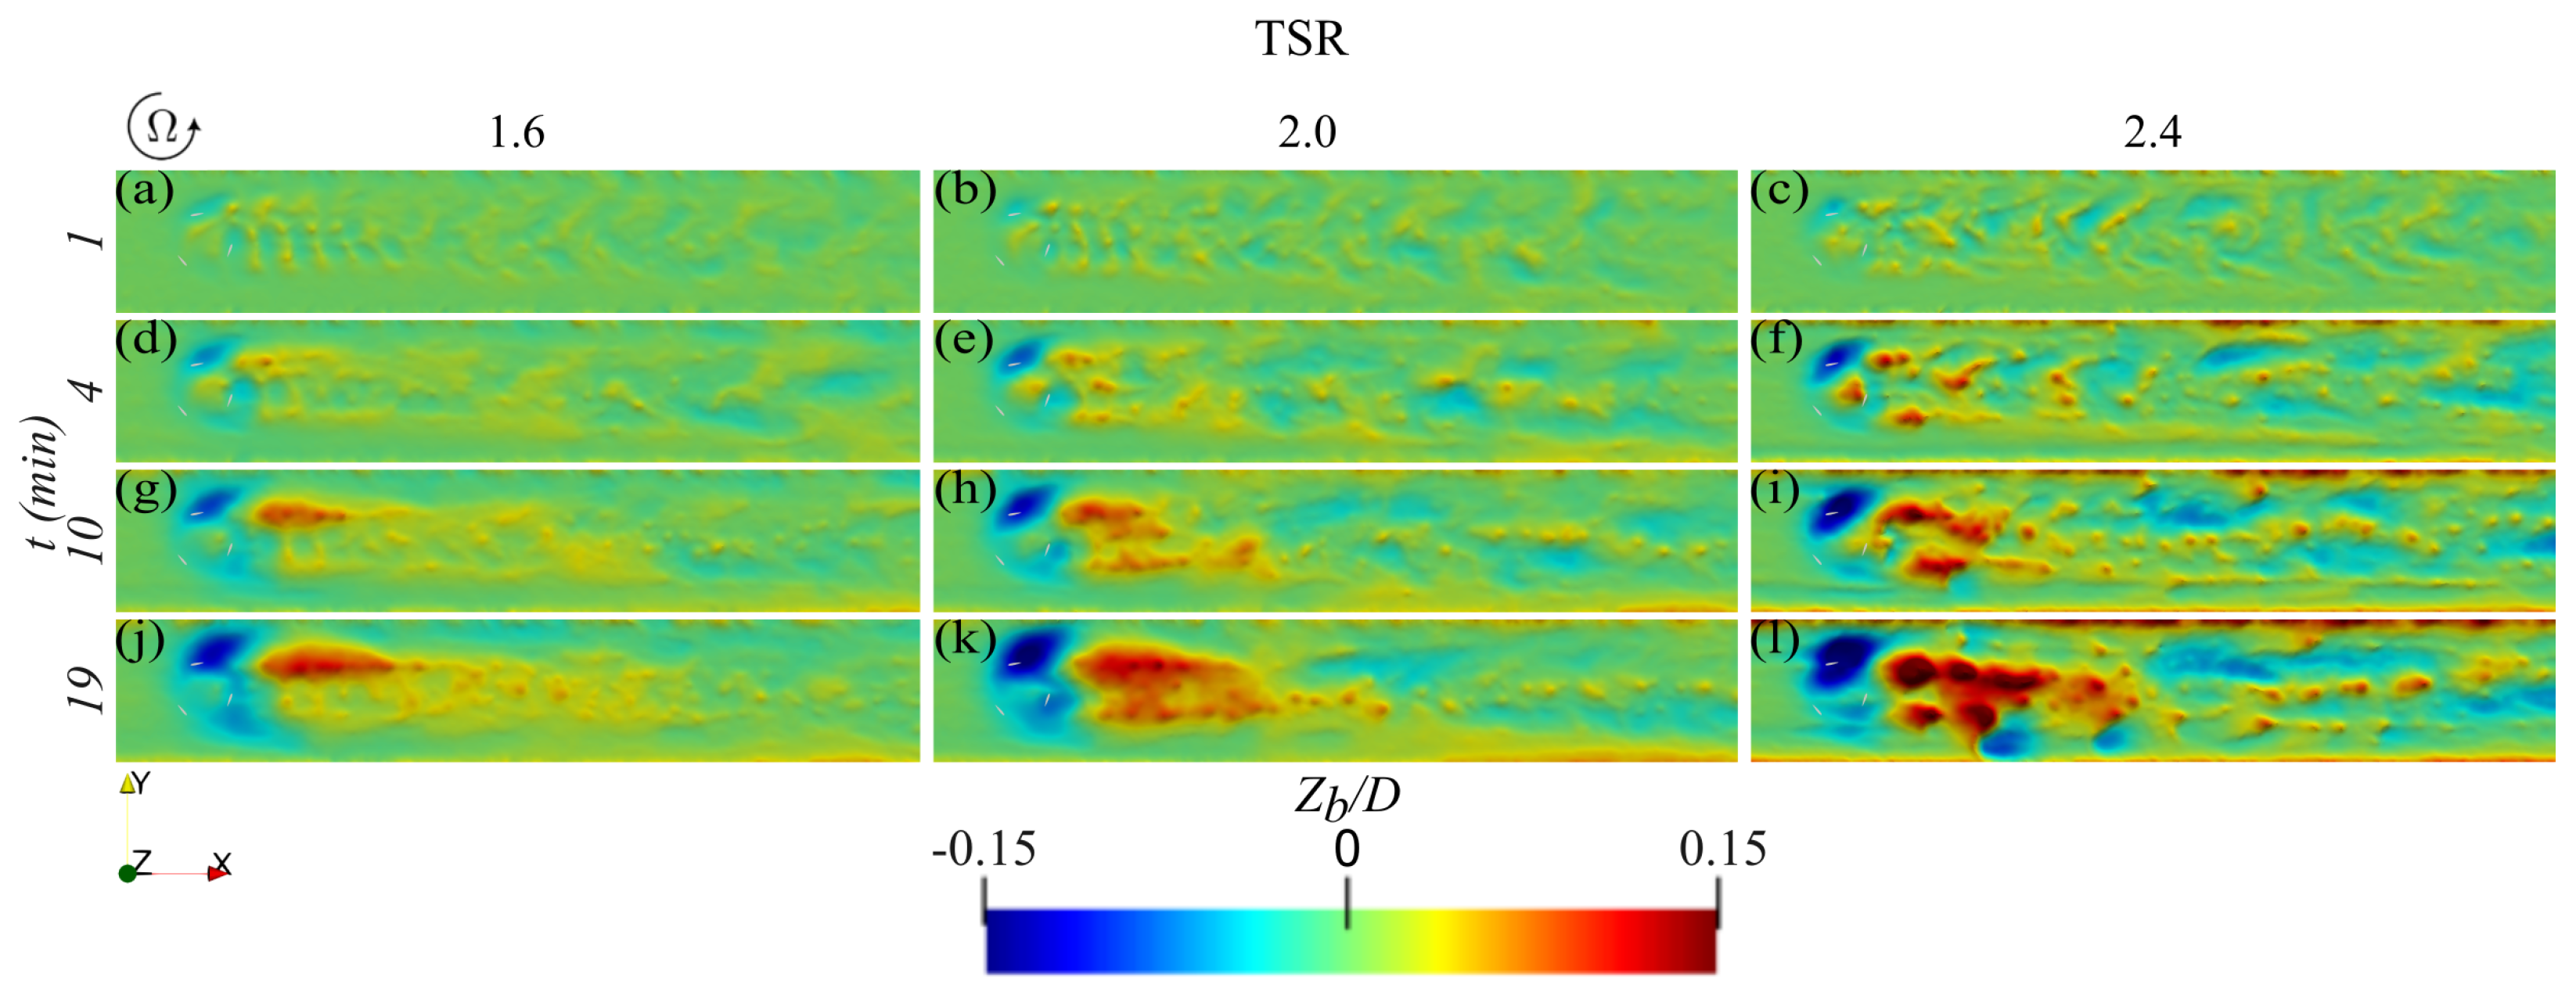
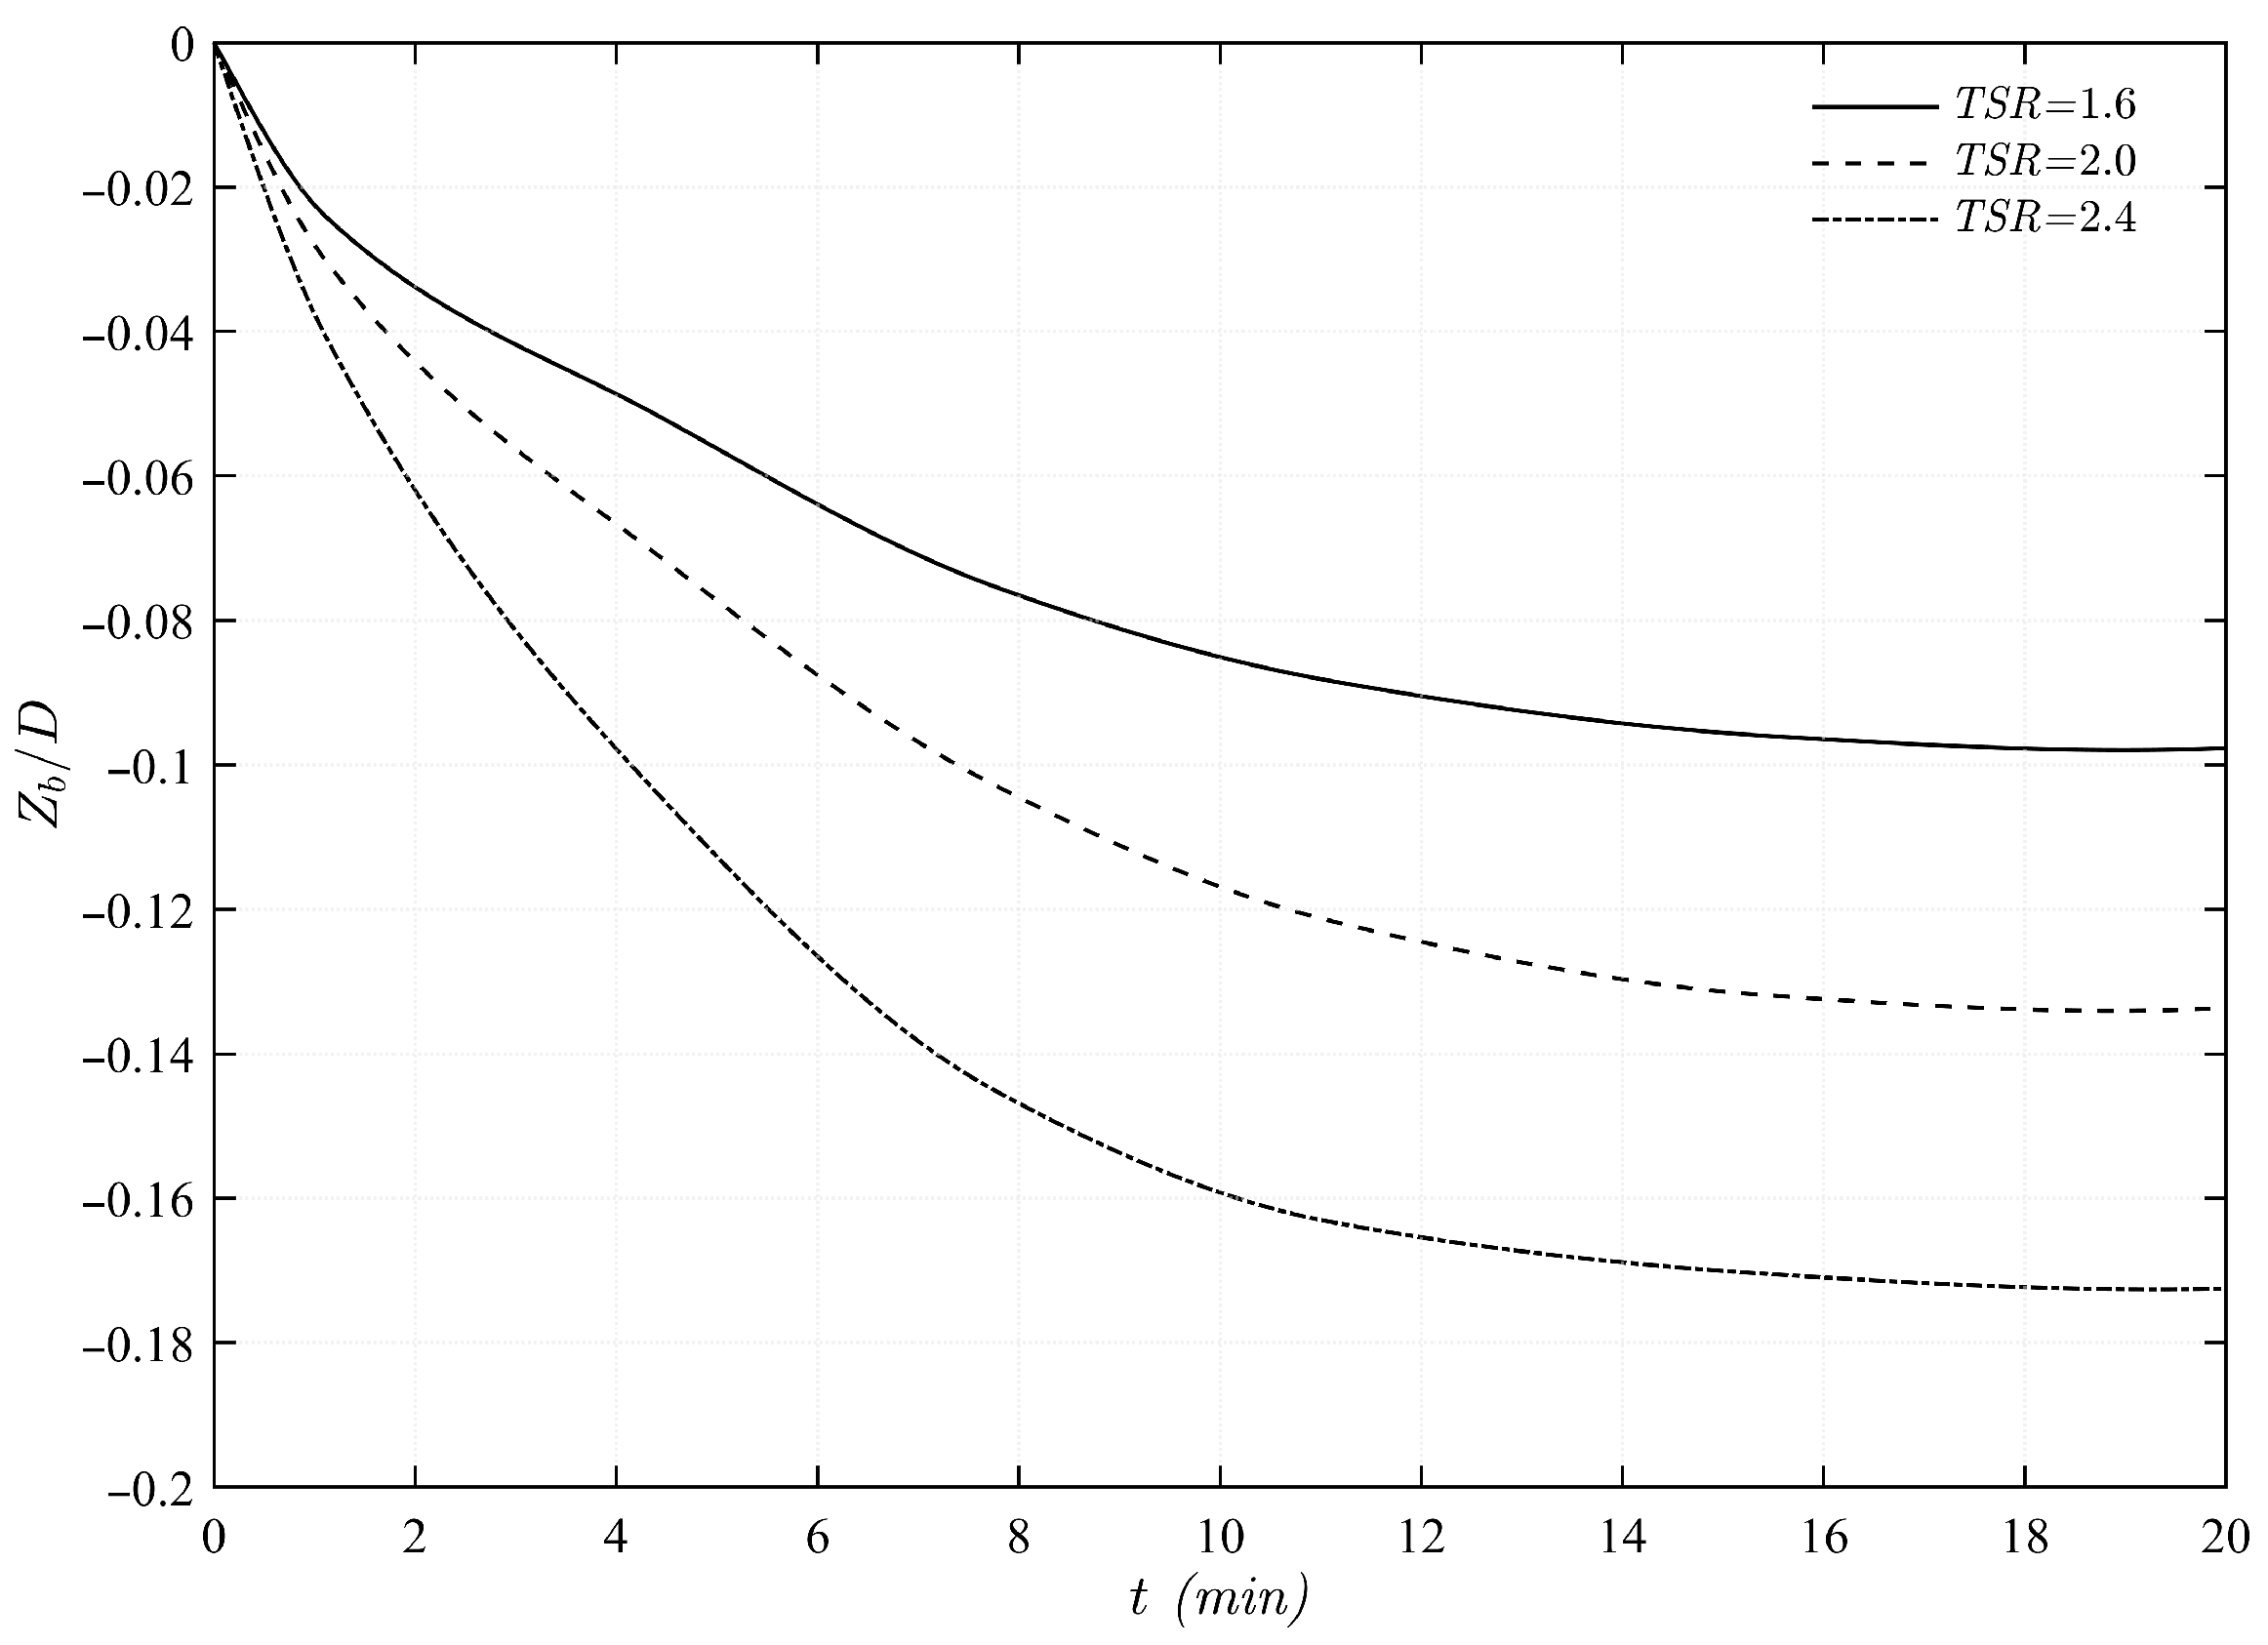
In Figure 11, the time evolution of bed deformation, normalized by rotor diameter ( Z b / D ), is shown from 1 to 19 min of physical time from the morpho-dynamic simulations. As the flow interacts with the sediment particle, small-scale sand waves (ripples) form, grow, and migrate downstream [88]. These migrating bedforms generate pronounced deformation in the near-wake region, characterized by the development of a dominant scour hole beneath the turbine followed by downstream sand-bar deposition. Both the scour depth and bar height increase until a dynamic equilibrium is reached. To quantify this behavior, the maximum erosion across the channel, occurring beneath the turbine and slightly above the channel centerline, is tracked over time and plotted in Figure 12. The maximum erosion decreases and eventually levels off, indicating the attainment of dynamic equilibrium [79]. This equilibrium state is used for subsequent bed-deformation analyses. For all cases, the morpho-dynamic simulations reach equilibrium at approximately 19 min of physical time.
As shown in the equilibrium state of the live bed (Figure 11j,k,l), the rotating blades and associated turbulence generate substantial sediment transport in both the near and far field of the turbine. While bed deformation remains negligible upstream, downstream transport forms migrating sand waves with varying amplitudes. The rotating blades erode sediment beneath the turbine and carry it downstream, where the decaying wake velocity promotes deposition and the formation of sand bars. As the bed evolves, these bars trap incoming sediment and grow taller over time. TSR strongly influences these morpho-dynamic features. As TSR increases, turbulence intensifies, producing deeper and wider scour holes beneath the turbine and larger downstream sand bars. At equilibrium, scour depths reach approximately 0.0979 D , 0.1340 D , and 0.1726 D for TSR values of 1.6 , 2.0 , and 2.4 , respectively, while sand-bar heights reach 0.122 D , 0.143 D , and 0.240 D for the same TSRs. In the far field, turbine-induced wake structures continue transporting sediment, with higher TSRs driving increased downstream sediment movement, which is aligned with previous findings by Gholami Anjiraki et al. [88]. These deformation patterns are particularly important for VAT farms, as they modify downstream flow structures and may influence the performance of turbine arrays.
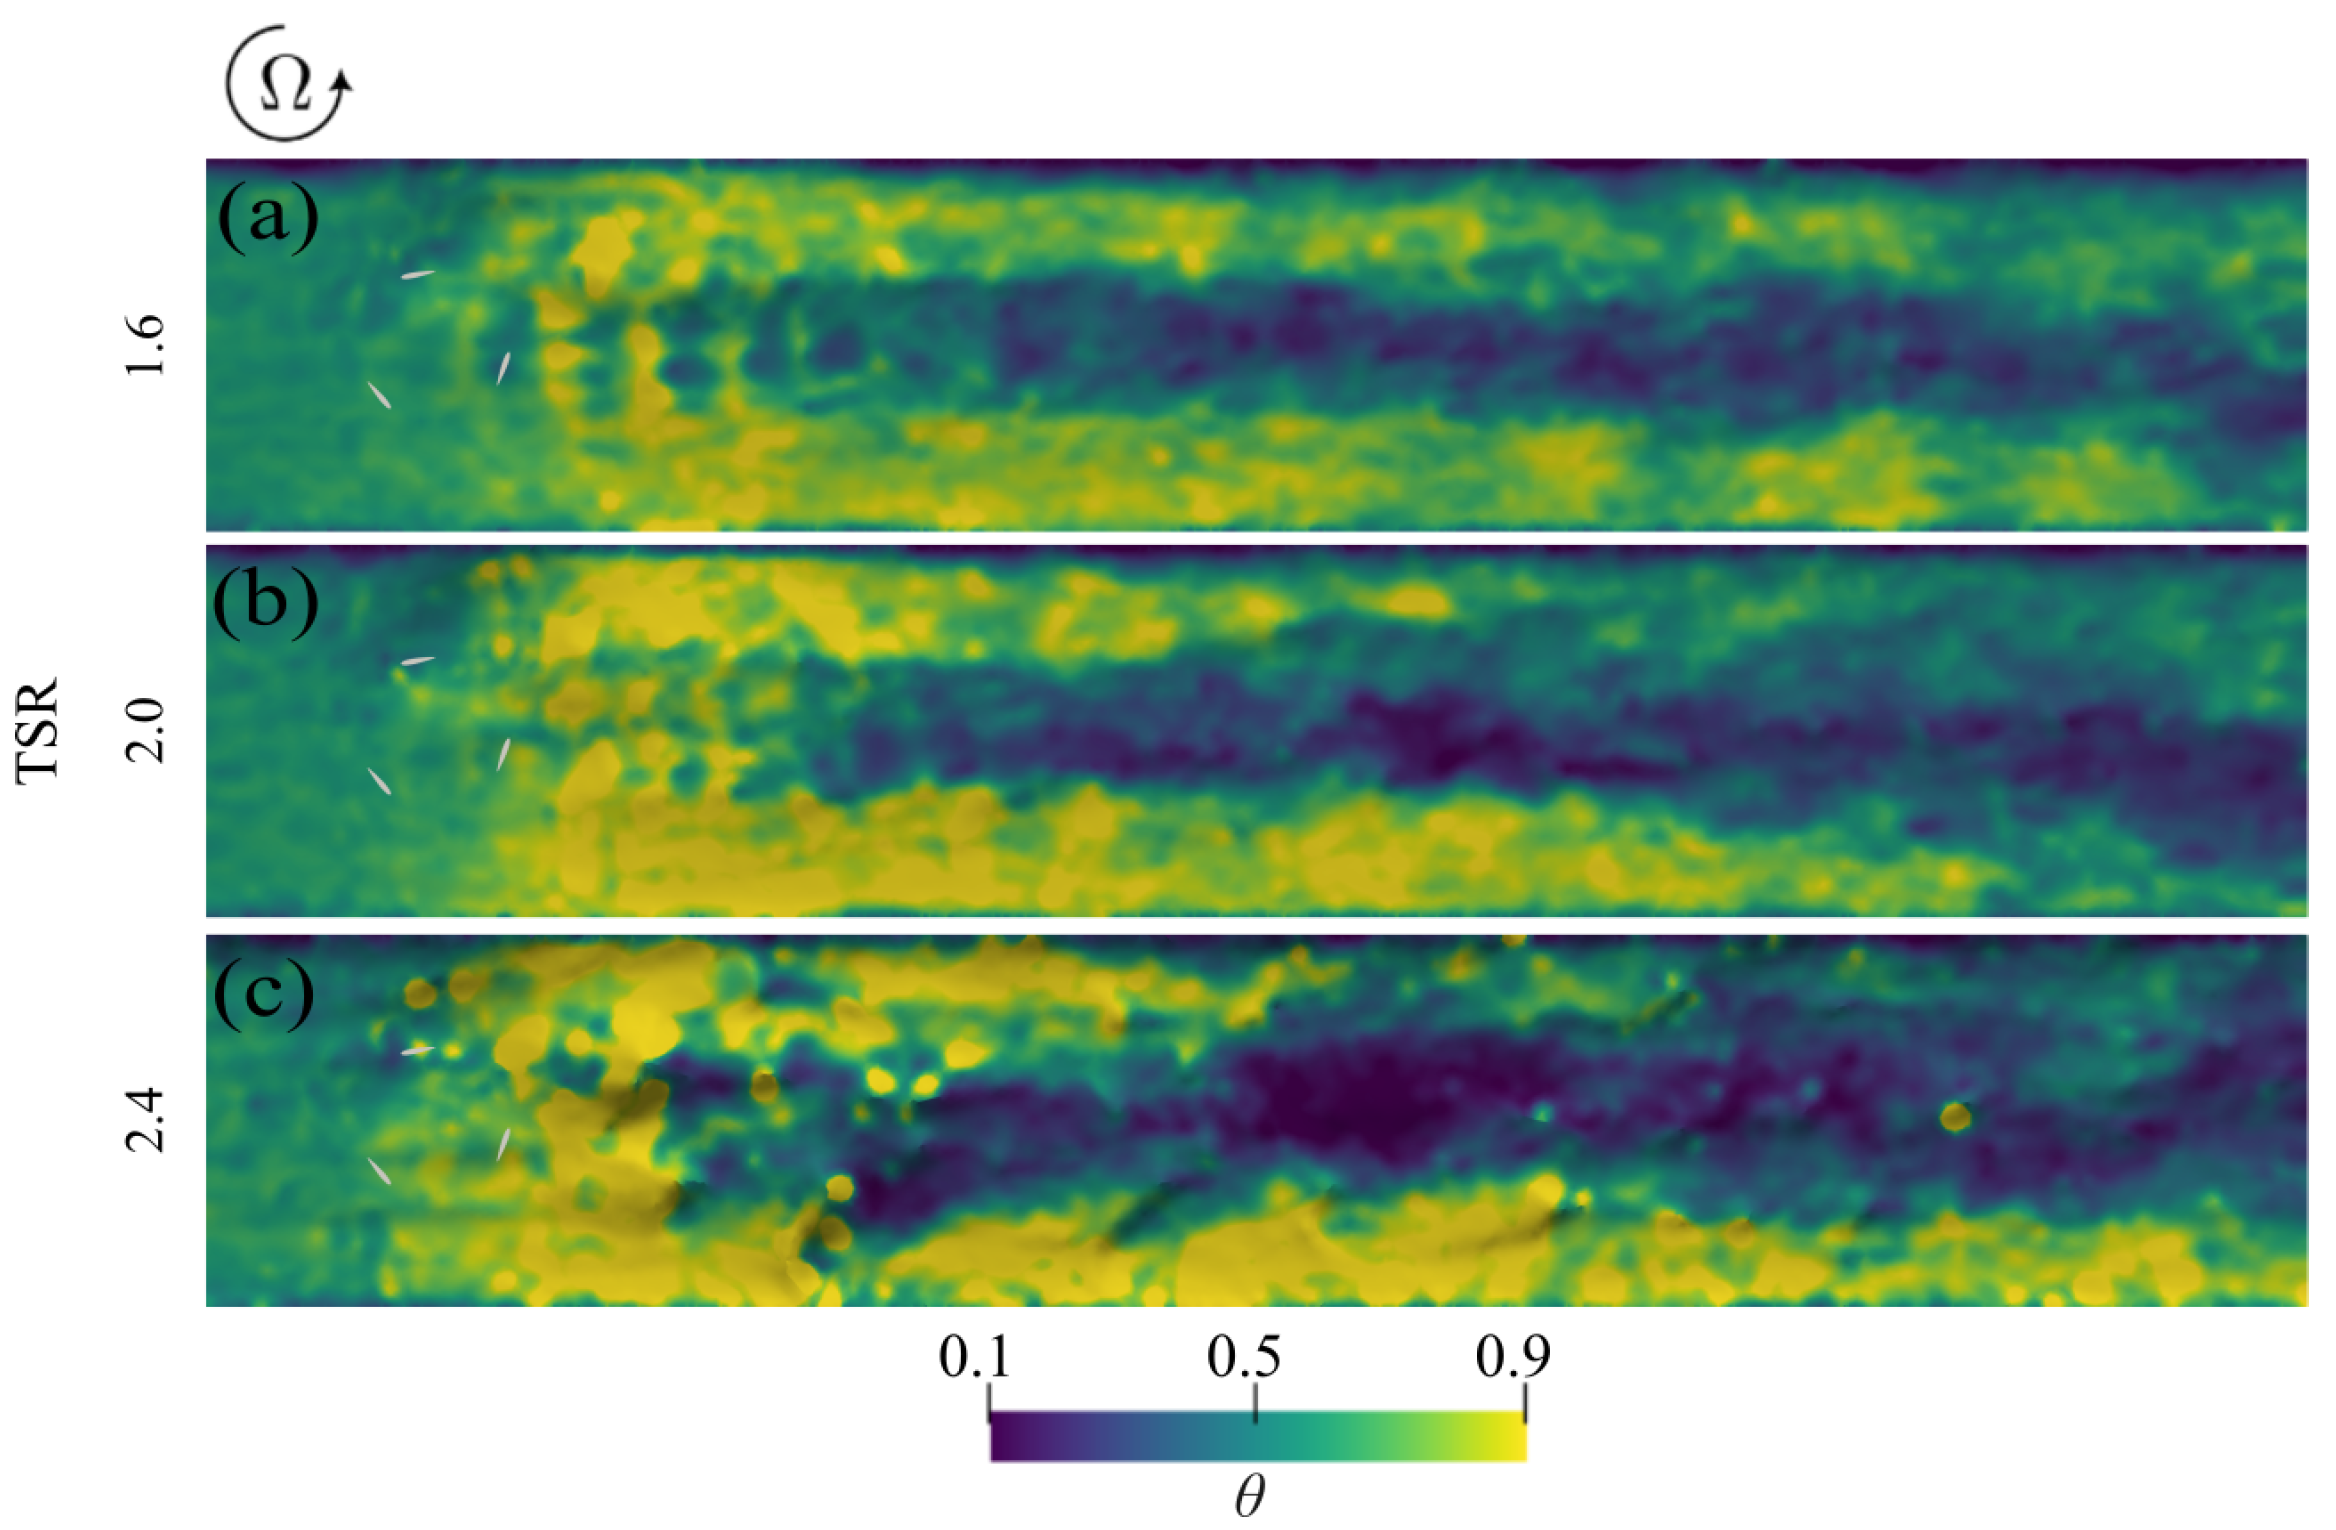
In Figure 13, we present the distribution of the dimensionless instantaneous bed shear stress at equilibrium state, i.e., Shields parameter ( θ ) [113].
As observed, the signature of the rotating blades produces a strong shear layer downstream of the turbine that extends farther downstream. A zone of elevated bed shear stress develops beneath and immediately downstream of the turbine as a result of blade rotation, while an additional high-shear region forms near the sidewall, reflecting the interaction of turbulent flow with the solid boundary. In contrast, farther downstream, the lower-shear region around the channel centerline, shows the opposite behavior with respect to bed elevation. Moreover, a comparison of Figure 11 and Figure 13 highlights the strong relationship between major bed deformations and the Shields parameter, θ . Regions exhibiting large variations in θ correspond to significant divergences in sediment flux, which ultimately drive pronounced bed deformation. In particular, sediment entrained within the relatively high-shear zone beneath the turbine is carried downstream, and as bed shear stress diminishes farther downstream, this sediment is deposited to form sand bars (see, for example, Figure 11l and Figure 13c). Moreover, although the shear layer extends downstream at all TSRs, its intensity grows with increasing TSR. For example, at TSR = 2.4 (Figure 13c), the region of elevated bed shear stress not only stretches farther downstream but also exhibits higher intensity, reaching closer to the lower sidewall, where it mobilizes sediment particles and generates substantial bed deformations that persist to the end of the channel.

4.4. Turbine Performance

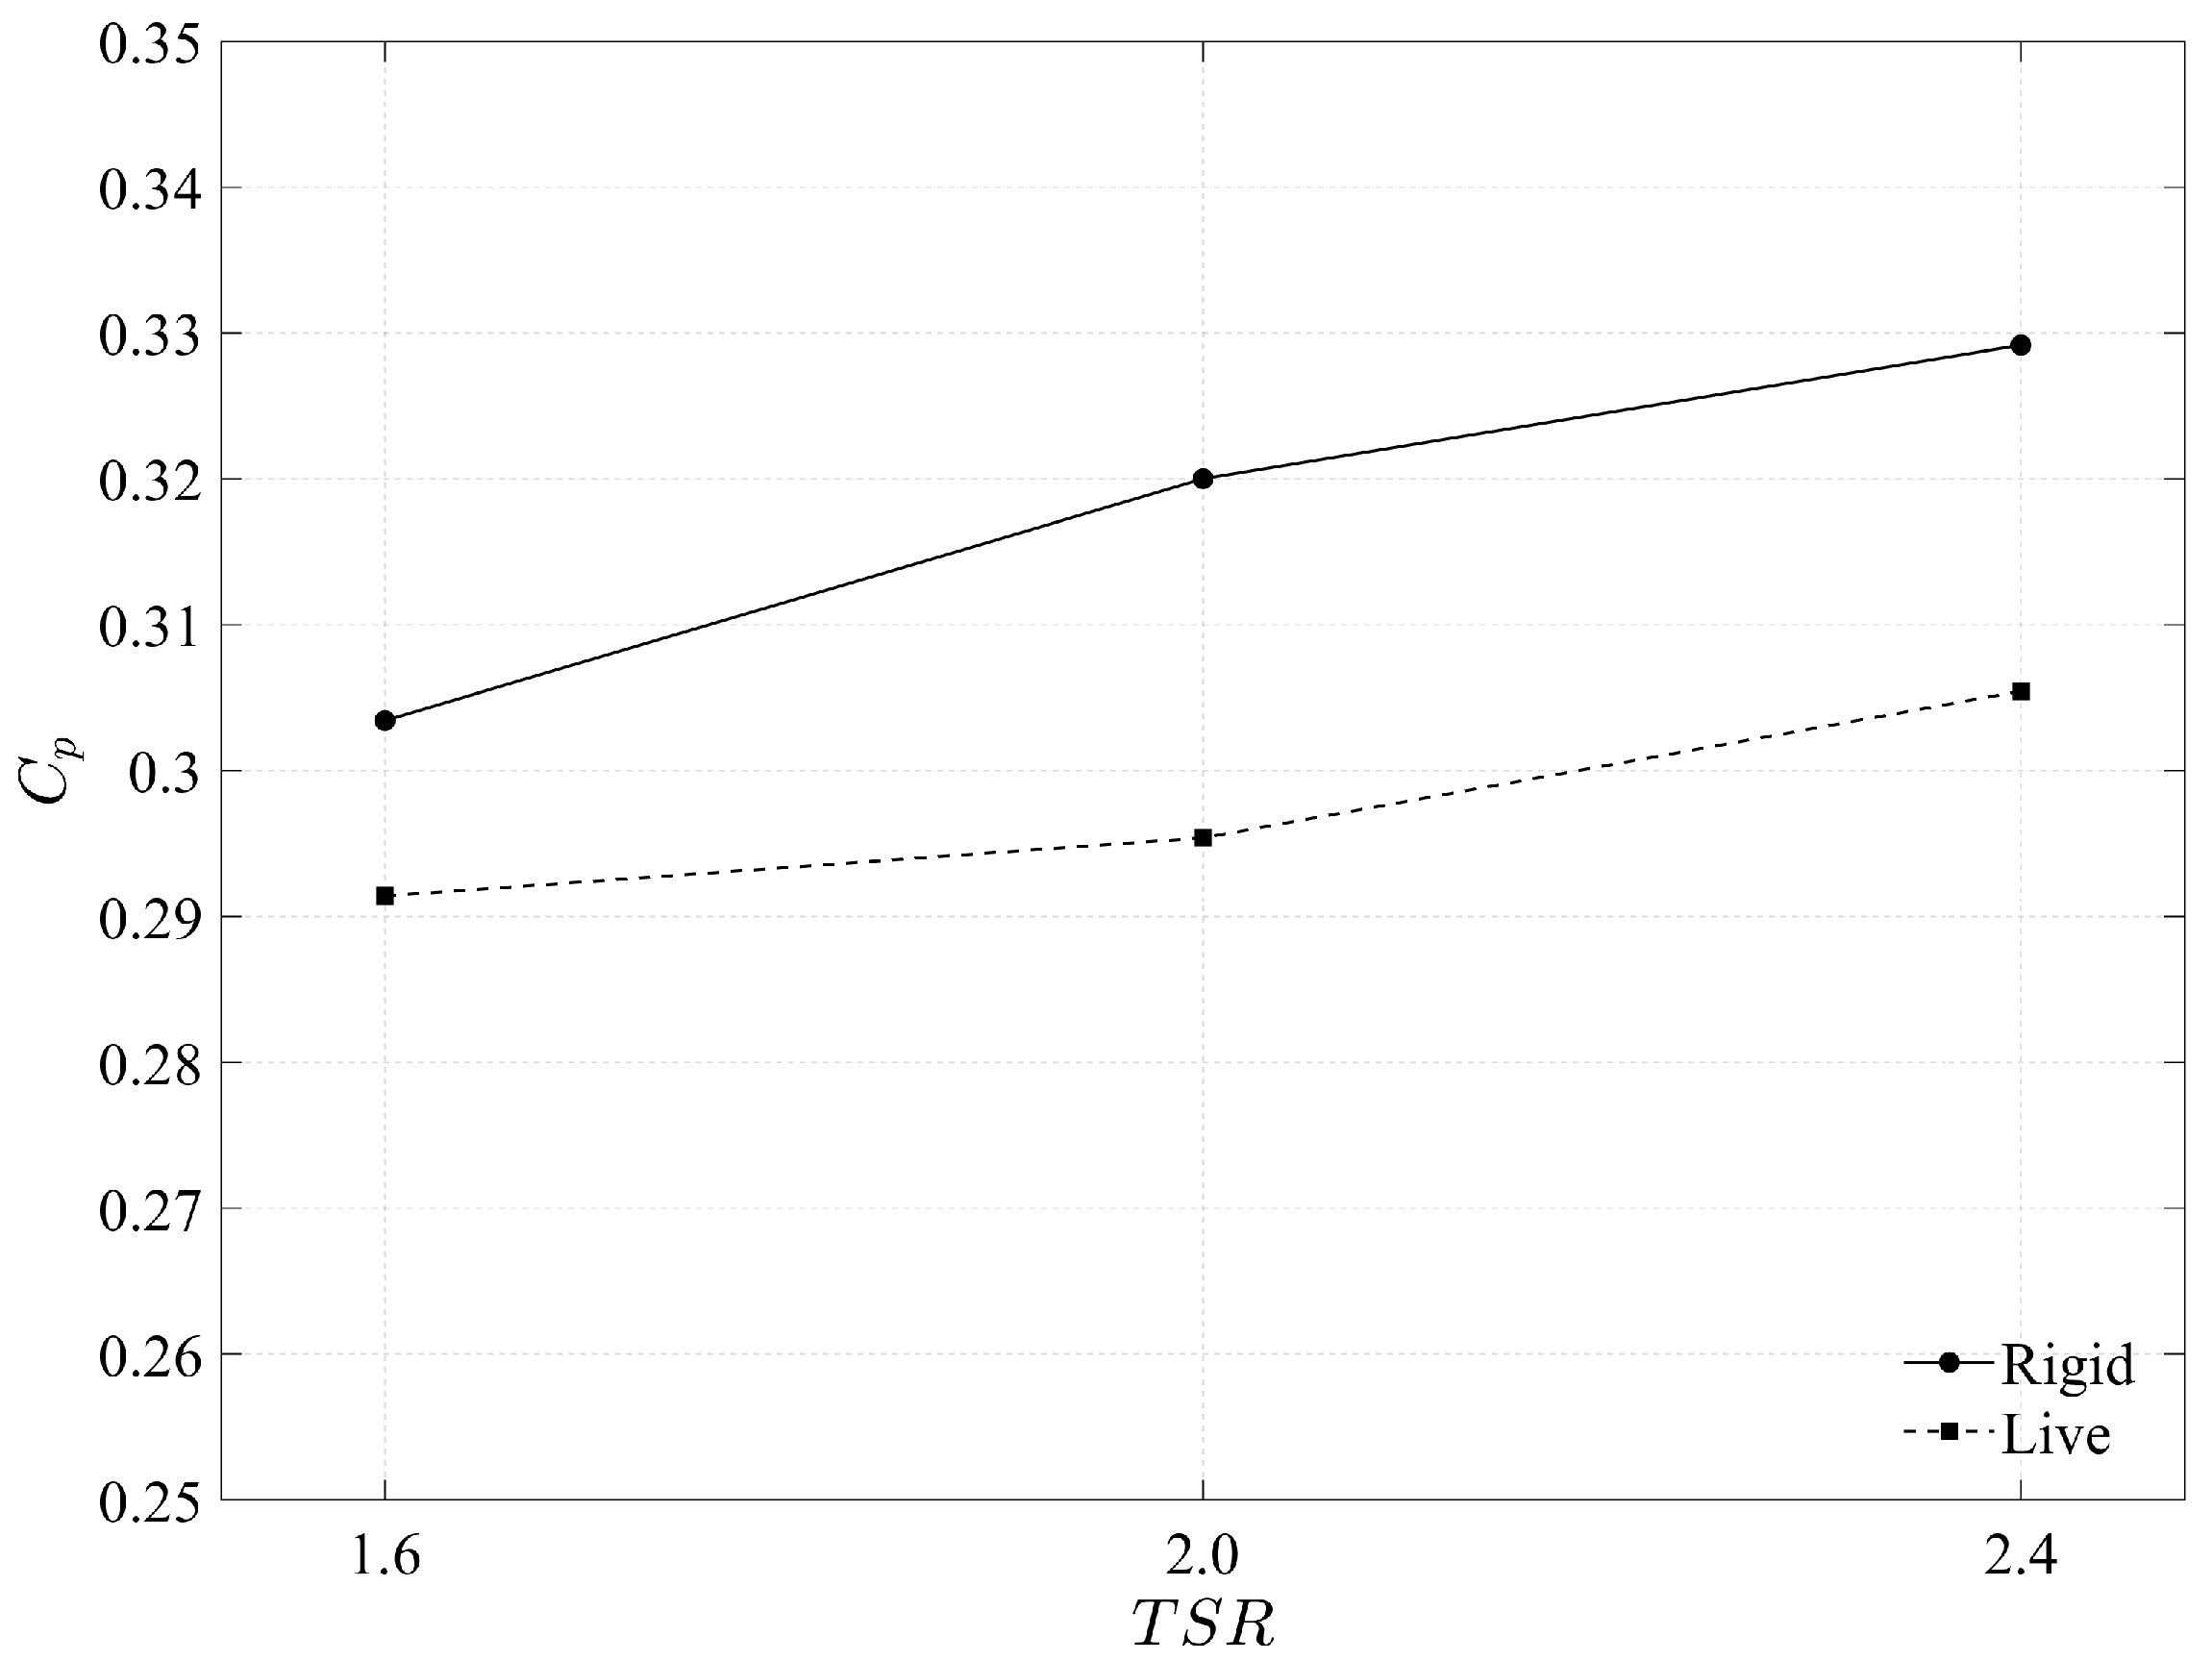
Herein, we examine the turbine’s performance ( C p ) under both rigid- and live-bed conditions. To this end, the mean power coefficient is defined as the ratio of the average extracted power to the theoretical maximum power available in the flow [26,38,79,88,125]. According to Betz’s theory, the upper limit of C p is 16 / 27 [126].
As shown in Figure 14, the mean power coefficient is presented for all cases under both rigid- and live-bed conditions. Under rigid-bed conditions, the power coefficient is observed to decline with decreasing TSR. This behavior aligns with earlier findings by Ouro and Stoesser [26], which indicate that operation below the optimal TSR is accompanied by intensified dynamic stall effects, ultimately resulting in reduced turbine efficiency. More specifically, the power coefficient decreases progressively with TSR, taking values of 0.329 , 0.320 , and 0.303 for TSR = 2.4 , 2.0 , and 1.6 , respectively. This behavior is consistent with the results reported by Gholami Anjiraki et al. [88].
Under live-bed conditions, the mean power coefficient decreases for all TSRs compared to rigid-bed results, with efficiency losses of 1.1 % , 2.2 % , and 2.5 % for TSR = 1.6 , 2.0 , and 2.4 , respectively. As shown in Figure 14, turbine performance under rigid-bed conditions increases with TSR and approaches an optimum near 2.4 , where gains in C p become marginal [26]. Under live-bed conditions, however, this trend is altered and the optimum TSR shifts to values greater than 2.4 , indicating that sediment–turbine interactions both reduce efficiency and modify the operating condition for peak performance. Nonetheless, additional simulations would be needed to determine the precise optimum TSR [88]. While turbines in real-world deployments generally operated under live-bed conditions, evaluating their performance under rigid-bed conditions remains relevant for installations on coarse, stable beds where sediment transport is limited.

5. Conclusions

We investigated the two-way interactions between a utility-scale VAT and sediment dynamics using a typical riverine sand size. Various TSRs were tested to analyze how turbine-induced wake flow affects bed deformation and how the evolving bed, in turn, influences turbine performance. The ASM was implemented to model the turbine blades, and the immersed boundary method was used to capture the evolving bed geometry. Sediment transport was captured by solving a sediment mass balance equation and using a dual time-stepping scheme and a sand slide model to maintain realistic bed slopes. To that end, comparative simulations under rigid- and live-bed conditions were carried out with the VFS-Geophysics model, which couples hydro- and morpho-dynamics. The simulation results were carefully analyzed to gain insights into the interactions between turbine wake flows and sediment transport in terms of bed evolution as well as turbine wake structure and performance.
Analysis of simulation results under rigid-bed conditions demonstrated that increasing TSR strengthens blade–flow interactions, producing more intense shear layers, elevated turbulence, and sustained wake structures extending farther downstream. Higher TSR confined turbulence to the near-wake and rotor region, raised bed shear stress, and generated a downward-shifting wake core closer to the bed, enhancing erosion potential. Turbulence in the near wake intensified along the blade edges and expanded toward the channel center. The counterclockwise rotation of the blades also introduced an asymmetry in wake flow, skewing turbulence toward the upper sidewall.
Analysis of coupled hydro- and morpho-dynamic simulations under live-bed conditions showed that bed deformation slightly reduced near-bed momentum but had a limited influence beyond approximately 0.3 D above the bed. Crucially, live-bed effects shortened the wake and accelerated velocity recovery compared to rigid-bed cases. This enhanced recovery was driven by scour beneath the turbine and downstream deposition, which generated near-bed jet flows injecting momentum into the wake core. Additionally, under live-bed conditions, turbulence becomes concentrated in the near field and around the centerline, particularly as TSR increases. Conversely, TKE decreases near the sidewalls, a mechanism that could help stabilize riverbanks in practical deployments.
The bed morpho-dynamics analysis began with distinguishing the dynamic equilibrium state, characterized by the growth of the maximum scour depth along the live bed. At equilibrium, higher TSRs intensified turbulence, deepening scour holes from 0.0979 D to 0.1726 D and raising sand-bar heights from 0.122 D to 0.240 D as TSR increased from 1.6 to 2.4 , respectively. Increasing the TSR also transported more sediment farther downstream and altered the downstream flow structure. Consequently, in real-world deployments and VAT farms, these changes have important implications for array design and performance, as prior studies have shown that wake–wake interactions within turbine arrays can be substantially detrimental [127,128]. Moreover, bed shear stress analysis confirmed that rotating blades generated strong downstream shear layers, with elevated zones beneath the turbine and near the sidewalls. Large variations in the Shields parameter correlate with major bed deformations, as sediment entrained in high-shear zones is transported and deposited downstream of the turbine, where bed shear stress decreases.
Finally, turbine performance analysis revealed that under rigid-bed conditions, efficiency decreased with TSR reduction, yielding C p values of 0.329 , 0.320 , and 0.303 for TSR = 2.4 , 2.0 , and 1.6 , respectively. Under live-bed conditions, C p decreased across all cases relative to rigid-bed conditions, with efficiency losses of 1.1 % , 2.2 % , and 2.5 % for TSR = 1.6 , 2.0 , and 2.4 , respectively. Additionally, analysis of turbine efficiency under rigid-bed conditions suggested an optimum TSR near 2.4 . Under live-bed conditions, however, the optimum TSR shifts to values greater than 2.4 , indicating that sediment–turbine interactions both reduce efficiency and change the TSR associated with peak performance.

Author Contributions

M.G.A.: Conceptualization (equal); data curation (equal); formal analysis (equal); investigation (equal); methodology (equal); visualization (equal); writing—original draft (equal); writing—review and editing (equal). M.M.A.: investigation (equal); visualization (equal); writing—review and editing (equal). S.S.: investigation (equal); writing—original draft (equal); writing—review and editing (equal). J.C.: investigation (equal); writing—original draft (equal); writing—review and editing (equal). A.K.: conceptualization (equal); data curation (equal); formal analysis (equal); funding acquisition (lead); investigation (equal); methodology (equal); project administration (lead); resources (lead); software (lead); supervision (lead); validation (equal); visualization (equal); writing—original draft (equal); writing—review and editing (equal). All authors have read and agreed to the published version of the manuscript.

Funding

This work was supported by grants from the U.S. Department of Energy (DOE)’s Office of Energy Efficiency and Renewable Energy (EERE) under the Water Power Technologies Office (WPTO) Award Numbers DE-EE0009450 and DE-EE00011379. Partial support was provided by NSF (grant number 2233986). The computational resources for the simulations of this study were partially provided by the Institute for Advanced Computational Science at Stony Brook University. The views expressed herein do not necessarily represent the view of the U.S. DOE or the United States Government.

Institutional Review Board Statement

Not applicable.

Informed Consent Statement

Not applicable.

Data Availability Statement

The software code (VFS- 3.1 model) (https://doi.org/10.5281/zenodo.15002824), along with the hydrodynamic results (https://doi.org/10.5281/zenodo.15002375), power production data (https://doi.org/10.5281/zenodo.15001388), wake recovery (https://doi.org/10.5281/zenodo.15001454), the instantaneous morpho-dynamic results (https://doi.org/10.5281/zenodo.15001934) for the test cases, and the channel and VAT surface files (https://doi.org/10.5281/zenodo.15002280), are available in the Zenodo online repository.

Conflicts of Interest

The authors declare no conflict of interest. The funders had no role in the design of the study; in the collection, analyses, or interpretation of data; in the writing of the manuscript; or in the decision to publish the results.

References

  1. International Energy Agency. Renewables 2023; Technical Report; International Energy Agency: Paris, France, 2023. [Google Scholar]
  2. REN21. Renewables 2024 Global Status Report; Technical Report; Renewable Energy Policy Network for the 21st Century: Paris, France, 2024. [Google Scholar]
  3. Khan, M.; Bhuyan, G.; Iqbal, M.; Quaicoe, J. Hydrokinetic energy conversion systems and assessment of horizontal and vertical axis turbines for river and tidal applications: A technology status review. Appl. Energy 2009, 86, 1823–1835. [Google Scholar] [CrossRef]
  4. Behrouzi, F.; Nakisa, M.; Maimun, A.; Ahmed, Y.M. Global renewable energy and its potential in Malaysia: A review of Hydrokinetic turbine technology. Renew. Sustain. Energy Rev. 2016, 62, 1270–1281. [Google Scholar] [CrossRef]
  5. Kamal, M.M.; Saini, R. A numerical investigation on the influence of savonius blade helicity on the performance characteristics of hybrid cross-flow hydrokinetic turbine. Renew. Energy 2022, 190, 788–804. [Google Scholar] [CrossRef]
  6. Neill, S.P.; Haas, K.A.; Thiébot, J.; Yang, Z. A review of tidal energy—Resource, feedbacks, and environmental interactions. J. Renew. Sustain. Energy 2021, 136, 062702. [Google Scholar] [CrossRef]
  7. Kilcher, L.; Fogarty, M.; Lawson, M. Marine Energy in the United States: An Overview of Opportunities; National Renewable Energy Laboratory: Golden, CO, USA, 2021; NREL/TP-5700-78773. [Google Scholar]
  8. Hussaina, A.; Arifb, S.M.; Aslamc, M. Emerging renewable and sustainable energy technologies: State of the art. Renew. Sustain. Energy Rev. 2017, 71, 12–28. [Google Scholar] [CrossRef]
  9. Jump, E.; Macleod, A.; Wills, T. Review of tidal turbine wake modelling methods—State of the art. Int. Mar. Energy J. 2020, 3, 91–100. [Google Scholar] [CrossRef]
  10. Hydropower Explained. 2024. Available online: https://www.eia.gov/energyexplained/hydropower/tidal-power.php (accessed on 10 May 2025).
  11. Stansby, P.; Ouro, P. Modelling marine turbine arrays in tidal flows. J. Hydraul. Res. 2022, 60, 1–18. [Google Scholar] [CrossRef]
  12. Fairley, I.; Karunarathna, H.; Masters, I. The influence of waves on morphodynamic impacts of energy extraction at a tidal stream turbine site in the Pentland Firth. Renew. Energy 2018, 125, 630–647. [Google Scholar] [CrossRef]
  13. Guillou, N.; Thiébot, J.; Chapalain, G. Turbines’ effects on water renewal within a marine tidal stream energy site. Energy 2019, 189, 116113. [Google Scholar] [CrossRef]
  14. Tidal Energy. 2021. Available online: https://www.pnnl.gov/explainer-articles/tidal-energy (accessed on 10 May 2025).
  15. Roosevelt Island Tidal Energy (RITE) Project Pilot. 2019. Available online: https://tethys.pnnl.gov/project-sites/roosevelt-island-tidal-energy-rite-project-pilot (accessed on 10 May 2025).
  16. Cobscook Bay Tidal Energy Test Site. 2024. Available online: https://tethys.pnnl.gov/project-sites/cobscook-bay-tidal-energy-project (accessed on 10 May 2025).
  17. Wang, T.; Yang, Z. A Tidal Hydrodynamic Model for Cook Inlet, Alaska, to Support Tidal Energy Resource Characterization. J. Mar. Sci. Eng. 2020, 8, 254. [Google Scholar] [CrossRef]
  18. Yang, Z.; Wang, T.; Branch, R.; Xiao, Z.; Deb, M. Tidal stream energy resource characterization in the Salish Sea. Renew. Energy 2021, 172, 188–208. [Google Scholar] [CrossRef]
  19. Chawdhary, S.; Angelidis, D.; Colby, J.; Corren, D.; Shen, L.; Sotiropoulos, F. Multiresolution Large-Eddy Simulation of an Array of Hydrokinetic Turbines in a Field-Scale River: The Roosevelt Island Tidal Energy Project in New York City. Water Resour. Res. 2018, 54, 10188–10204. [Google Scholar] [CrossRef]
  20. Saini, G.; Saini, R.P. A review on technology, configurations, and performance of cross-flow hydrokinetic turbines. Int. J. Energy Res. 2019, 43, 6639–6679. [Google Scholar] [CrossRef]
  21. Ali, J.; Khan, J.; Khalid, M.S.; Mehmood, N. Harnessing marine energy by horizontal axis marine turbines. In Proceedings of the 2015 12th International Bhurban Conference on Applied Sciences and Technology (IBCAST), Islamabad, Pakistan, 13–17 January 2015. [Google Scholar] [CrossRef]
  22. Uihlein, A.; Magagna, D. 2014 JRC Ocean Energy Status Report; Technical Report; Publications Office of the European Union: Luxembourg City, Luxembourg, 2015. [Google Scholar] [CrossRef]
  23. Massie, L.; Ouro, P.; Stoesser, T.; Luo, Q. An Actuator Surface Model to Simulate Vertical Axis Turbines. Energies 2019, 12, 4741. [Google Scholar] [CrossRef]
  24. Le, T.Q.; Lee, K.S.; Park, J.S.; Ko, J.H. Flow-driven rotor simulation of vertical axis tidal turbines: A comparison of helical and straight blades. Int. J. Nav. Archit. Ocean. Eng. 2014, 6, 257–268. [Google Scholar] [CrossRef]
  25. Quadrennial Technology Review 2015; Technical Report; United States Department of Energy: Washington, DC, USA, 2015.
  26. Ouro, P.; Stoesser, T. An immersed boundary-based large-eddy simulation approach to predict the performance of vertical axis tidal turbines. Comput. Fluids 2017, 152, 74–87. [Google Scholar] [CrossRef]
  27. REN21. Renewables 2016: Global Status Report; Technical Report; Renewable Energy Policy Network for the 21st Century: Paris, France, 2016. [Google Scholar]
  28. Nachtane, M.; Tarfaoui, M.; Goda, I.; Rouway, M. A review on the technologies, design considerations and numerical models of tidal current turbines. Renew. Energy 2020, 157, 1274–1288. [Google Scholar] [CrossRef]
  29. Bachant, P.; Wosnik, M. Characterising the near-wake of a cross-flow turbine. J. Turbul. 2015, 16, 392–410. [Google Scholar] [CrossRef]
  30. Strom, B.; Brunton, S.L.; Polagye, B. Intracycle angular velocity control of cross-flow turbines. Nat. Energy 2017, 2, 17103. [Google Scholar] [CrossRef]
  31. Roberts, A.; Thomas, B.; Sewell, P.; Khan, Z.; Balmain, S.; Gillman, J. Current tidal power technologies and their suitability for applications in coastal and marine areas. J. Ocean. Eng. Mar. Energy 2016, 2, 227–245. [Google Scholar] [CrossRef]
  32. Müller, S.; Muhawenimana, V.; Wilson, C.A.; Ouro, P. Experimental investigation of the wake characteristics behind twin vertical axis turbines. Energy Convers. 2021, 247, 114768. [Google Scholar] [CrossRef]
  33. Müller, S.; Muhawenimana, V.; Sonnino-Sorisio, G.; Wilson, C.A.M.E.; Cable, J.; Ouro, P. Fish response to the presence of hydrokinetic turbines as a sustainable energy solution. Sci. Rep. 2023, 13, 7459. [Google Scholar] [CrossRef]
  34. Brochier, G.; Fraunie, P.; Beguier, C.; Paraschivoiu, I. Water channel experiments of dynamic stall on Darrieus wind turbine blades. J. Propuls. 2012, 2, 445–449. [Google Scholar] [CrossRef]
  35. Bachant, P.; Wosnik, M. Performance measurements of cylindrical- and spherical-helical cross-flow marine hydrokinetic turbines, with estimates of exergy efficiency. Renew. Energy 2015, 74, 318–325. [Google Scholar] [CrossRef]
  36. Tescione, G.; Ragni, D.; He, C.; Simão Ferreira, C.; van Bussel, G. Near wake flow analysis of a vertical axis wind turbine by stereoscopic particle image velocimetry. Renew. Energy 2014, 70, 47–61. [Google Scholar] [CrossRef]
  37. Araya, D.B.; Colonius, T.; Dabiri, J.O. Transition to bluff-body dynamics in the wake of vertical-axis wind turbines. J. Fluid Mech. 2017, 813, 346–381. [Google Scholar] [CrossRef]
  38. Ouro, P.; Runge, S.; Luo, Q.; Stoesser, T. Three-dimensionality of the wake recovery behind a vertical axis turbine. Renew. Energy 2019, 133, 1066–1077. [Google Scholar] [CrossRef]
  39. Nguyen, M.T.; Balduzzi, F.; Goude, A. Effect of pitch angle on power and hydrodynamics of a vertical axis turbine. Ocean Eng. 2021, 238, 109335. [Google Scholar] [CrossRef]
  40. Yang, M.H.; Gu, Z.T.; Yeh, R.H. Numerical and experimental analyses of the performance of a vertical axis turbine with controllable-blades for ocean current energy. Energy Convers. 2023, 285, 117009. [Google Scholar] [CrossRef]
  41. Kist, S. America’s First Ocean Energy Delivered to the Grid: ORPC Sells Tidal Power in Maine. 2012. Available online: https://orpc.co/wp-content/uploads/2021/10/americas-first-ocean-energy-delivered-to-the-grid-orpc-sells-tidal-power-in-maine-sept.-13-2012-2012913155.pdf (accessed on 10 May 2025).
  42. Iida, A.; Kato, K.; Mizuno, A. Numerical Simulation of Unsteady Flow and Aerodynamic Performance of Vertical Axis Wind Turbines with LES. In Proceedings of the 16th Australasian Fluid Mechanics Conference, Crown Plaza, Gold Coast, QLD, Australia, 3–7 December 2007. [Google Scholar]
  43. Li, C.; Zhu, S.; Xu, Y.; Xiao, Y. 2.5D large eddy simulation of vertical axis wind turbine in consideration of high angle of attack flow. Renew. Energy 2013, 51, 317–330. [Google Scholar] [CrossRef]
  44. Posa, A.; Parker, C.M.; Leftwich, M.C.; Balaras, E. Wake structure of a single vertical axis wind turbine. Int. J. Heat Fluid Flow 2016, 61, 75–84. [Google Scholar] [CrossRef]
  45. Elkhoury, M.; Kiwata, T.; Aoun, E. Experimental and numerical investigation of a three-dimensional vertical-axis wind turbine with variable-pitch. J. Wind. Eng. Ind. Aerodyn. 2015, 139, 111–123. [Google Scholar] [CrossRef]
  46. Posa, A. Wake characterization of coupled configurations of vertical axis wind turbines using Large Eddy Simulation. Int. J. Heat Fluid Flow 2019, 75, 27–43. [Google Scholar] [CrossRef]
  47. Posa, A. Dependence of the wake recovery downstream of a Vertical Axis Wind Turbine on its dynamic solidity. J. Wind. Eng. Ind. Aerodyn. 2020, 202, 104212. [Google Scholar] [CrossRef]
  48. Kang, S.; Borazjani, I.; Colby, J.A.; Sotiropoulos, F. Numerical simulation of 3D flow past a real-life marine hydrokinetic turbine. Adv. Water Resour. 2012, 39, 33–43. [Google Scholar] [CrossRef]
  49. Barnes, A.; Marshall-Cross, D.; Hughes, B.R. Towards a standard approach for future Vertical Axis Wind Turbine aerodynamics research and development. Renew. Sustain. Energy Rev. 2021, 148, 111221. [Google Scholar] [CrossRef]
  50. Abkar, M.; Dabiri, J.O. Self-similarity and flow characteristics of vertical-axis wind turbine wakes: An LES study. J. Turbul. 2016, 18, 373–389. [Google Scholar] [CrossRef]
  51. Shamsoddin, S.; Porté-Agel, F. A Large-Eddy Simulation Study of Vertical Axis Wind Turbine Wakes in the Atmospheric Boundary Layer. Energies 2016, 9, 366. [Google Scholar] [CrossRef]
  52. Mohamed, O.S.; Melani, P.F.; Soraperra, G.; Brighenti, A.; Ferrara, G.; Betti, V.; Schippa, L.; Guerrero, M.; Balduzzi, F.; Bianchini, A. Three-dimensional CFD-ALM-VOF modeling of hydrokinetic turbines in realistic open-channel conditions. Ocean Eng. 2024, 313, 119411. [Google Scholar] [CrossRef]
  53. Zanforlin, S.; Nishino, T. Fluid dynamic mechanisms of enhanced power generation by closely spaced vertical axis wind turbines. Renew. Energy 2016, 99, 1213–1226. [Google Scholar] [CrossRef]
  54. Bachant, P.; Goude, A.; Wosnik, M. Actuator line modeling of vertical-axis turbines. arXiv 2018, arXiv:1605.01449. [Google Scholar] [CrossRef]
  55. Gharaati, M.; Xiao, S.; Wei, N.J.; Martínez-Tossas, L.A.; Dabiri, J.O.; Yang, D. Large-eddy simulation of helical- and straight-bladed vertical-axis wind turbines in boundary layer turbulence. J. Renew. Sustain. Energy 2022, 14, 053301. [Google Scholar] [CrossRef]
  56. Shchur, I.; Klymko, V.; Xie, S.; Schmidt, D. Design Features and Numerical Investigation of Counter-Rotating VAWT with Co-Axial Rotors Displaced from Each Other along the Axis of Rotation. Energies 2023, 16, 4493. [Google Scholar] [CrossRef]
  57. Gharib Yosry, A.; Fernández-Jiménez, A.; Álvarez Álvarez, E.; Blanco Marigorta, E. Design and characterization of a vertical-axis micro tidal turbine for low velocity scenarios. Energy Convers. Manag. 2021, 237, 114144. [Google Scholar] [CrossRef]
  58. Rajagopalan, R.G.; Fanucci, J.B. Finite difference model for vertical axis wind turbines. J. Propuls. Power 1985, 1, 432–436. [Google Scholar] [CrossRef]
  59. Patankar, S.V. Numerical Heat Transfer and Fluid Flow, 1st ed.; CRC Press: Boca Raton, FL, USA, 1980. [Google Scholar] [CrossRef]
  60. Rajagopalan, R.G.; Berg, D.E.; Klimas, P.C. Development of a Three-Dimensional Model for the Darrieus Rotor and Its Wake. J. Propuls. Power 1995, 11, 185–195. [Google Scholar] [CrossRef]
  61. Fortunato, B.; Dadone, A.; Trifoni, V. A Two-Dimensional Methodology to Predict Vertical Axis Wind Turbine Performance. J. Sol. Energy Eng. 1995, 117, 187–193. [Google Scholar] [CrossRef]
  62. Shen, W.Z.; Zhang, J.H.; Sørensen, J.N. The Actuator Surface Model: A New Navier–Stokes Based Model for Rotor Computations. J. Sol. Energy Eng. 2009, 131, 011002. [Google Scholar] [CrossRef]
  63. Shamsoddin, S.; Porté-Agel, F. Large Eddy Simulation of Vertical Axis Wind Turbine Wakes. Energies 2014, 7, 890–912. [Google Scholar] [CrossRef]
  64. Küppers, J.P.; Reinicke, T. Numerical modelling of vertical axis turbines using the actuator surface model. J. Fluids Struct. 2021, 104, 103318. [Google Scholar] [CrossRef]
  65. Hill, C.; Mirko Musa, M.G. Interaction between instream axial flow hydrokinetic turbines and uni-directional flow bedforms. Renew. Energy 2016, 86, 409–421. [Google Scholar] [CrossRef]
  66. Shields, M.A.; Woolf, D.K.; Grist, E.P.; Kerr, S.A.; Jackson, A.; Harris, R.E.; Bell, M.C.; Beharie, R.; Want, A.; Osalusi, E.; et al. Marine renewable energy: The ecological implications of altering the hydrodynamics of the marine environment. Ocean Coast. Manag. 2011, 54, 2–9. [Google Scholar] [CrossRef]
  67. Jacobson, P.T.; Amaral, S.V.; Castro-Santos, T.; Giza, D.; Haro, A.J.; Hecker, G.; McMahon, B.; Perkins, N.; Pioppi, N. Environmental Effects of Hydrokinetic Turbines on Fish: Desktop and Laboratory Flume Studies; Technical Report; Electric Power Research Institute: Palo Alto, CA, USA, 2012. [Google Scholar]
  68. Lee, J.; Oh, J. A study on the characteristics of organic matter and nutrients released from sediments into agricultural reservoirs. Water 2018, 10, 980. [Google Scholar] [CrossRef]
  69. Hauer, C.; Kail, J.; Schmütz, C.; Sendzimir, J. The role of sediment and sediment dynamics in the aquatic environment. In Riverine Ecosystem Management: Science for Governing Towards a Sustainable Future; Springer: Cham, Switzernland, 2018; pp. 123–145. [Google Scholar]
  70. Ross, L.; Sottolichio, A.; Huybrechts, N.; Brunet, P. Tidal turbines in the estuarine environment: From identifying optimal location to environmental impact. Renew. Energy 2021, 169, 700–713. [Google Scholar] [CrossRef]
  71. Cada, G.; Ahlgrimm, J.; Bahleda, M.; Bigford, T.; Stavrakas, S.D.; Hall, D.; Moursund, R.; Sale, M. Potential Impacts of Hydrokinetic and Wave energy Conversion Technologies on Aquatic environments. Fisheries 2007, 32, 174–181. [Google Scholar] [CrossRef]
  72. Musa, M.; Heisel, M.; Guala, M. Predictive model for local scour downstream of hydrokinetic turbines in erodible channels. Phys. Rev. Fluids 2018, 3, 024606. [Google Scholar] [CrossRef]
  73. Copping, A.; Sather, N.; Hanna, L.; Whiting, J.; Zydlewski, G.; Staines, G.; Gill, A.; Hutchison, I.; O’Hagan, A.M.; Simas, T.; et al. Annex IV 2016 State of the Science Report: Environmental Effects of Marine Renewable Energy Development Around the World; Technical Report; Pacific Northwest National Laboratory (PNNL): Richland, WA, USA, 2016. [Google Scholar]
  74. Yang, X.; Khosronejad, A.; Sotiropoulos, F. Large-eddy simulation of a hydrokinetic turbine mounted on an erodible bed. Renew. Energy 2017, 113, 1419–1433. [Google Scholar] [CrossRef]
  75. Deng, X.; Zhang, J.; Lin, X. Proposal of actuator line-immersed boundary coupling model for tidal stream turbine modeling with hydrodynamics upon scouring morphology. Energy 2024, 292, 130451. [Google Scholar] [CrossRef]
  76. Azrulhishama, E.A.; Jamaluddinb, Z.Z.; Azric, M.A.; Yusoff, S.B.M. Potential Evaluation of Vertical Axis Hydrokinetic Turbine Implementation in Equatorial River. In Proceedings of the International Conference on Energy, Electrical and Power Engineering. Journal of Physics: Conference Series, Seoul, Republic of Korea, 15–18 June 2018. [Google Scholar] [CrossRef]
  77. Jeona, J.; Kima, Y.; Kim, D.; Kang, S. Flume Experiments for Flow around Debris Accumulation at a Bridge. J. Civ. Eng. 2024, 28, 1049–1061. [Google Scholar] [CrossRef]
  78. Aksen, M.M.; Flora, K.; Seyedzadeh, H.; Anjiraki, M.G.; Khosronejad, A. On the impact of debris accumulation on power production of marine hydrokinetic turbines: Insights gained via LES. Theor. Appl. Mech. Lett. 2024, 14, 100524. [Google Scholar] [CrossRef]
  79. Aksen, M.M.; Seyedzadeh, H.; Anjiraki, M.G.; Craig, J.; Flora, K.; Santoni, C.; Sotiropoulos, F.; Khosronejad, A. Large eddy simulation of a utility-scale horizontal axis turbine with woody debris accumulation under live bed conditions. Renew. Energy 2025, 239, 122110. [Google Scholar] [CrossRef]
  80. Wang, C.; Tan, L.; Chen, M.; Fan, H.; Liu, D. A review on synergy of cavitation and sediment erosion in hydraulic machinery. Front. Energy Res. 2022, 10, 1047984. [Google Scholar] [CrossRef]
  81. Lin, X.; Zhang, J.; Wang, R.; Zhang, J.; Liu, W.; Zhang, Y. Scour around a mono-pile foundation of a horizontal axis tidal stream turbine under steady current. Ocean Eng. 2019, 192, 106571. [Google Scholar] [CrossRef]
  82. Hill, C.; Kozarek, J.; Sotiropoulos, F.; Guala, M. Hydrodynamics and sediment transport in a meandering channel with a model axial-flow hydrokinetic turbine. Water Resour. Res. 2016, 52, 860–879. [Google Scholar] [CrossRef]
  83. Chen, L.; Hashim, R.; Othman, F.; Motamedi, S. Experimental study on scour profile of pile-supported horizontal axis tidal current turbine. Renew. Energy 2017, 114, 744–754. [Google Scholar] [CrossRef]
  84. Musa, M.; Hill, C.; Guala, M. Interaction between hydrokinetic turbine wakes and sediment dynamics: Array performance and geomorphic effects under different siting strategies and sediment transport conditions. Renew. Energy 2019, 138, 738–753. [Google Scholar] [CrossRef]
  85. Vybulkova, L. A Study of the Wake of an Isolated Tidal Turbine with Application to Its Effects on Local Sediment Transport. Ph.D Thesis, University of Glasgow, Glasgow, UK, 2013. [Google Scholar]
  86. Lee, J.; Musa, M.; Feist, C.; Gao, J.; Shen, L.; Guala, M. Wake Characteristics and Power Performance of a Drag-Driven in-Bank Vertical Axis Hydrokinetic Turbine. Energies 2019, 12, 3611. [Google Scholar] [CrossRef]
  87. Gao, J.; Liu, H.; Lee, J.; Zheng, Y.; Guala, M.; Shen, L. Large-eddy simulation and Co-Design strategy for a drag-type vertical axis hydrokinetic turbine in open channel flows. Renew. Energy 2022, 181, 1305–1316. [Google Scholar] [CrossRef]
  88. Gholami Anjiraki, M.; Aksen, M.M.; Craig, J.; Seyedzadeh, H.; Khosronejad, A. Large eddy simulation of a utility-scale vertical-axis marine hydrokinetic turbine under live-bed conditions. Phys. Fluids 2025, 37, 056609. [Google Scholar] [CrossRef]
  89. Zhang, L.; Zhang, H.; Tang, H.; Zhao, C. Particle size distribution of bed materials in the sandy river bed of alluvial rivers. Int. J. Sediment Res. 2017, 32, 331–339. [Google Scholar] [CrossRef]
  90. Khosronejad, A.; Limaye, A.B.; Zhang, Z.; Kang, S.; Yang, X.; Sotiropoulos, F. On the Morphodynamics of a Wide Class of Large-Scale Meandering Rivers: Insights Gained by Coupling LES With Sediment-Dynamics. J. Adv. Model. Earth Syst. 2023, 15, e2022MS003257. [Google Scholar] [CrossRef]
  91. Seyedzadeh, H.; Oaks, W.; Craig, J.; Aksen, M.; Sanz, M.S.; Khosronejad, A. Lagrangian dynamics of particle transport in oral and nasal breathing. Phys. Fluids 2023, 35, 081903. [Google Scholar] [CrossRef]
  92. Khosronejad, A.; Sotiropoulos, F. Numerical simulation of sand waves in a turbulent open channel flow. J. Fluid Mech. 2014, 753, 150–216. [Google Scholar] [CrossRef]
  93. Khosronejad, A.; Sotiropoulos, F. On the genesis and evolution of barchan dunes: Morphodynamics. J. Fluid Mech. 2017, 815, 117–148. [Google Scholar] [CrossRef]
  94. Khosronejad, A.; Kozarek, J.L.; Sotiropoulos, F. Simulation-Based Approach for Stream Restoration Structure Design: Model Development and Validation. J. Hydraul. Eng. 2014, 140, 04014042. [Google Scholar] [CrossRef]
  95. Zhang, Z.; Gholami Anjiraki, M.; Seyedzadeh, H.; Sotiropoulos, F.; Yang, X.; Khosronejad, A. Predicting Equilibrium Bed Morphology of Large-Scale Meandering Rivers Using a Novel LES-Trained Machine Learning Approach. J. Adv. Model. Earth Syst. 2025, 17, e2024MS004710. [Google Scholar] [CrossRef]
  96. Seyedzadeh, H.; Anjiraki, M.G.; Sorisio, G.S.; Wilson, C.; Sotiropoulos, F.; Khosronejad, A. On the interaction of fish and marine hydrokinetic turbines: Insights gained through experimental and computational observations. arXiv 2025, arXiv:2508.04558. [Google Scholar] [CrossRef]
  97. Anjiraki, M.G.; Santoni, C.; Shapourmiandouab, S.; Seyedzadeh, H.; Craig, J.; Sotiropoulos, F.; Khosronejad, A. Wind farm layout optimization using a novel machine learning approach. arXiv 2025, arXiv:2509.07868. [Google Scholar] [CrossRef]
  98. Flora, K.; Khosronejad, A. Uncertainty quantification of bank vegetation impacts on the flood flow field in the American River, California, using large-eddy simulations. Earth Surf. Process. Landforms 2024, 49, 967–979. [Google Scholar] [CrossRef]
  99. Germano, M.; Piomelli, U.; Moin, P.; Cabot, W.H. A dynamic subgrid-scale eddy viscosity model. Phys. Fluids Fluid Dyn. 1991, 3, 1760–1765. [Google Scholar] [CrossRef]
  100. Smagorinsky, J. GENERAL CIRCULATION EXPERIMENTS WITH THE PRIMITIVE EQUATIONS: I. THE BASIC EXPERIMENT. Mon. Weather. Rev. 1963, 91, 99–164. [Google Scholar] [CrossRef]
  101. Yang, X.; Sotiropoulos, F. A new class of actuator surface models for wind turbines. Wind Energy 2018, 1, 285–302. [Google Scholar] [CrossRef]
  102. Yang, X.; Sotiropoulos, F.; Conzemius, R.J.; Wachtler, J.N.; Strong, M.B. Large-eddy simulation of turbulent flow past wind turbines/farms: The Virtual Wind Simulator (VWiS). Wind Energy 2015, 18, 2025–2045. [Google Scholar] [CrossRef]
  103. Yang, X.; Kang, S.; Sotiropoulos, F. Computational study and modeling of turbine spacing effects in infinite aligned wind farms. Phys. Fluids 2012, 24, 115107. [Google Scholar] [CrossRef]
  104. Sørensen, N.N.; Michelsen, J.A.; Schreck, S. Navier–Stokes predictions of the NREL phase VI rotor in the NASA Ames 80 ft × 120 ft wind tunnel. Wind Energy 2002, 5, 151–169. [Google Scholar] [CrossRef]
  105. Johansen, J.; Sørensen, N.N.; Michelsen, J.A.; Schreck, S. Detached-eddy simulation of flow around the NREL Phase VI blade. Wind Energy 2002, 5, 185–197. [Google Scholar] [CrossRef]
  106. Sezer Uzol, N.; Long, L. 3-D Time-Accurate CFD Simulations of Wind Turbine Rotor Flow Fields. In Proceedings of the 44th AIAA Aerospace Sciences Meeting and Exhibit, Reno, NV, USA, 9–12 January 2006; p. 394. [Google Scholar] [CrossRef]
  107. Zahle, F.; Sørensen, N.N.; Johansen, J. Wind turbine rotor-tower interaction using an incompressible overset grid method. Wind Energy 2009, 12, 594–619. [Google Scholar] [CrossRef]
  108. Froude, W. On the Elementary Relation Between Pitch, Slip, and Propulsive Efficiency; Technical Memorandum No. NACA–TM–1; National Advisory Committee for Aeronautics (NACA): Washington, DC, USA, 1920. [Google Scholar]
  109. Santoni, C.; Khosronejad, A.; Seiler, P.; Sotiropoulos, F. Toward control co-design of utility-scale wind turbines: Collective vs. individual blade pitch control. Energy Rep. 2023, 9, 793–806. [Google Scholar] [CrossRef]
  110. Santoni, C.; Sotiropoulos, F.; Khosronejad, A. A Comparative Analysis of Actuator-Based Turbine Structure Parametrizations for High-Fidelity Modeling of Utility-Scale Wind Turbines under Neutral Atmospheric Conditions. Energies 2024, 17, 753. [Google Scholar] [CrossRef]
  111. Zhang, Z.; Santoni, C.; Herges, T.; Sotiropoulos, F.; Khosronejad, A. Time-Averaged Wind Turbine Wake Flow Field Prediction Using Autoencoder Convolutional Neural Networks. Energies 2022, 15, 41. [Google Scholar] [CrossRef]
  112. Yang, X.; Pakula, M.; Sotiropoulos, F. Large-eddy simulation of a utility-scale wind farm in complex terrain. Appl. Energy 2018, 229, 767–777. [Google Scholar] [CrossRef]
  113. Van Rijn, L.C. Principles of Sediment Transport in Rivers, Estuaries, and Coastal Seas; Aqua Publications: Telangana, India, 1993. [Google Scholar]
  114. Paola, C.; Voller, V.R. A generalized Exner equation for sediment mass balance. J. Geophys. Res. Earth Surf. 2005, 110, F04014. [Google Scholar] [CrossRef]
  115. Borazjani, I.; Ge, L.; Sotiropoulos, F. Curvilinear immersed boundary method for simulating fluid structure interaction with complex 3D rigid bodies. J. Comput. Phys. 2008, 227, 7587–7620. [Google Scholar] [CrossRef]
  116. Soulsby, R.L.; Whitehouse, R.J. Threshold of Sediment Motion in Coastal Environments. In Pacific Coasts and Ports ’97: Proceedings of the 13th Australasian Coastal and Ocean Engineering Conference and the 6th Australasian Port and Harbour Conference, Volume 1, Christchurch, New Zealand, 7–11 September 1997; Centre for Advanced Engineering, University of Canterbury: Christchurch, New Zealand, 1997. [Google Scholar]
  117. Chou, Y.J.; Fringer, O.B. A model for the simulation of coupled flow-bed form evolution in turbulent flows. J. Geophys. Res. Ocean. 2010, 115. [Google Scholar] [CrossRef]
  118. Khosronejad, A.; Rennie, C.D.; Neyshabouri, S.A.A.S.; Townsend, R.D. 3D Numerical Modeling of Flow and Sediment Transport in Laboratory Channel Bends. J. Hydraul. Eng. 2007, 133, 1123–1134. [Google Scholar] [CrossRef]
  119. Khosronejad, A.; Kang, S.; Borazjani, I.; Sotiropoulos, F. Curvilinear immersed boundary method for simulating coupled flow and bed morphodynamic interactions due to sediment transport phenomena. Adv. Water Resour. 2011, 34, 829–843. [Google Scholar] [CrossRef]
  120. Khosronejad, A.; Flora, K.; Kang, S. Effect of Inlet Turbulent Boundary Conditions on Scour Predictions of Coupled LES and Morphodynamics in a Field-Scale River: Bankfull Flow Conditions. J. Hydraul. Eng. 2020, 146, 04020020. [Google Scholar] [CrossRef]
  121. Fujisawa, N.; Shibuya, S. Observations of dynamic stall on Darrieus wind turbine blades. J. Wind Eng. Ind. Aerodyn. 2001, 89, 201–214. [Google Scholar] [CrossRef]
  122. Posa, A. Influence of Tip Speed Ratio on wake features of a Vertical Axis Wind Turbine. J. Wind Eng. Ind. Aerodyn. 2020, 197, 104076. [Google Scholar] [CrossRef]
  123. Khosronejad, A.; Diplas, P.; Sotiropoulos, F. Simulation-based optimization of in–stream structures design: Bendway weirs. Environ. Fluid Mech. 2017, 17, 79–109. [Google Scholar] [CrossRef]
  124. Ouro, P.; Stoesser, T. Wake Generated Downstream of a Vertical Axis Tidal Turbine. In Proceedings of the 12th European Wave and Tidal Energy Conference (EWTEC), Cork, Ireland, 27 August–1 September 2017. [Google Scholar]
  125. Liu, K.; Yu, M.; Zhu, W. Performance analysis of vertical axis water turbines under single-phase water and two-phase open channel flow conditions. Ocean Eng. 2021, 238, 109769. [Google Scholar] [CrossRef]
  126. Betz, A. Introduction to the Theory of Flow Machines; Pergamon Press: Oxford, UK, 1966. [Google Scholar]
  127. Lee, J.; Kim, Y.; Khosronejad, A.; Kang, S. Experimental study of the wake characteristics of an axial flow hydrokinetic turbine at different tip speed ratios. Ocean Eng. 2020, 196, 106777. [Google Scholar] [CrossRef]
  128. Liu, X.; Li, Z.; Yang, X.; Xu, D.; Kang, S.; Khosronejad, A. Large-Eddy Simulation of Wakes of Waked Wind Turbines. Energies 2022, 15, 2899. [Google Scholar] [CrossRef]
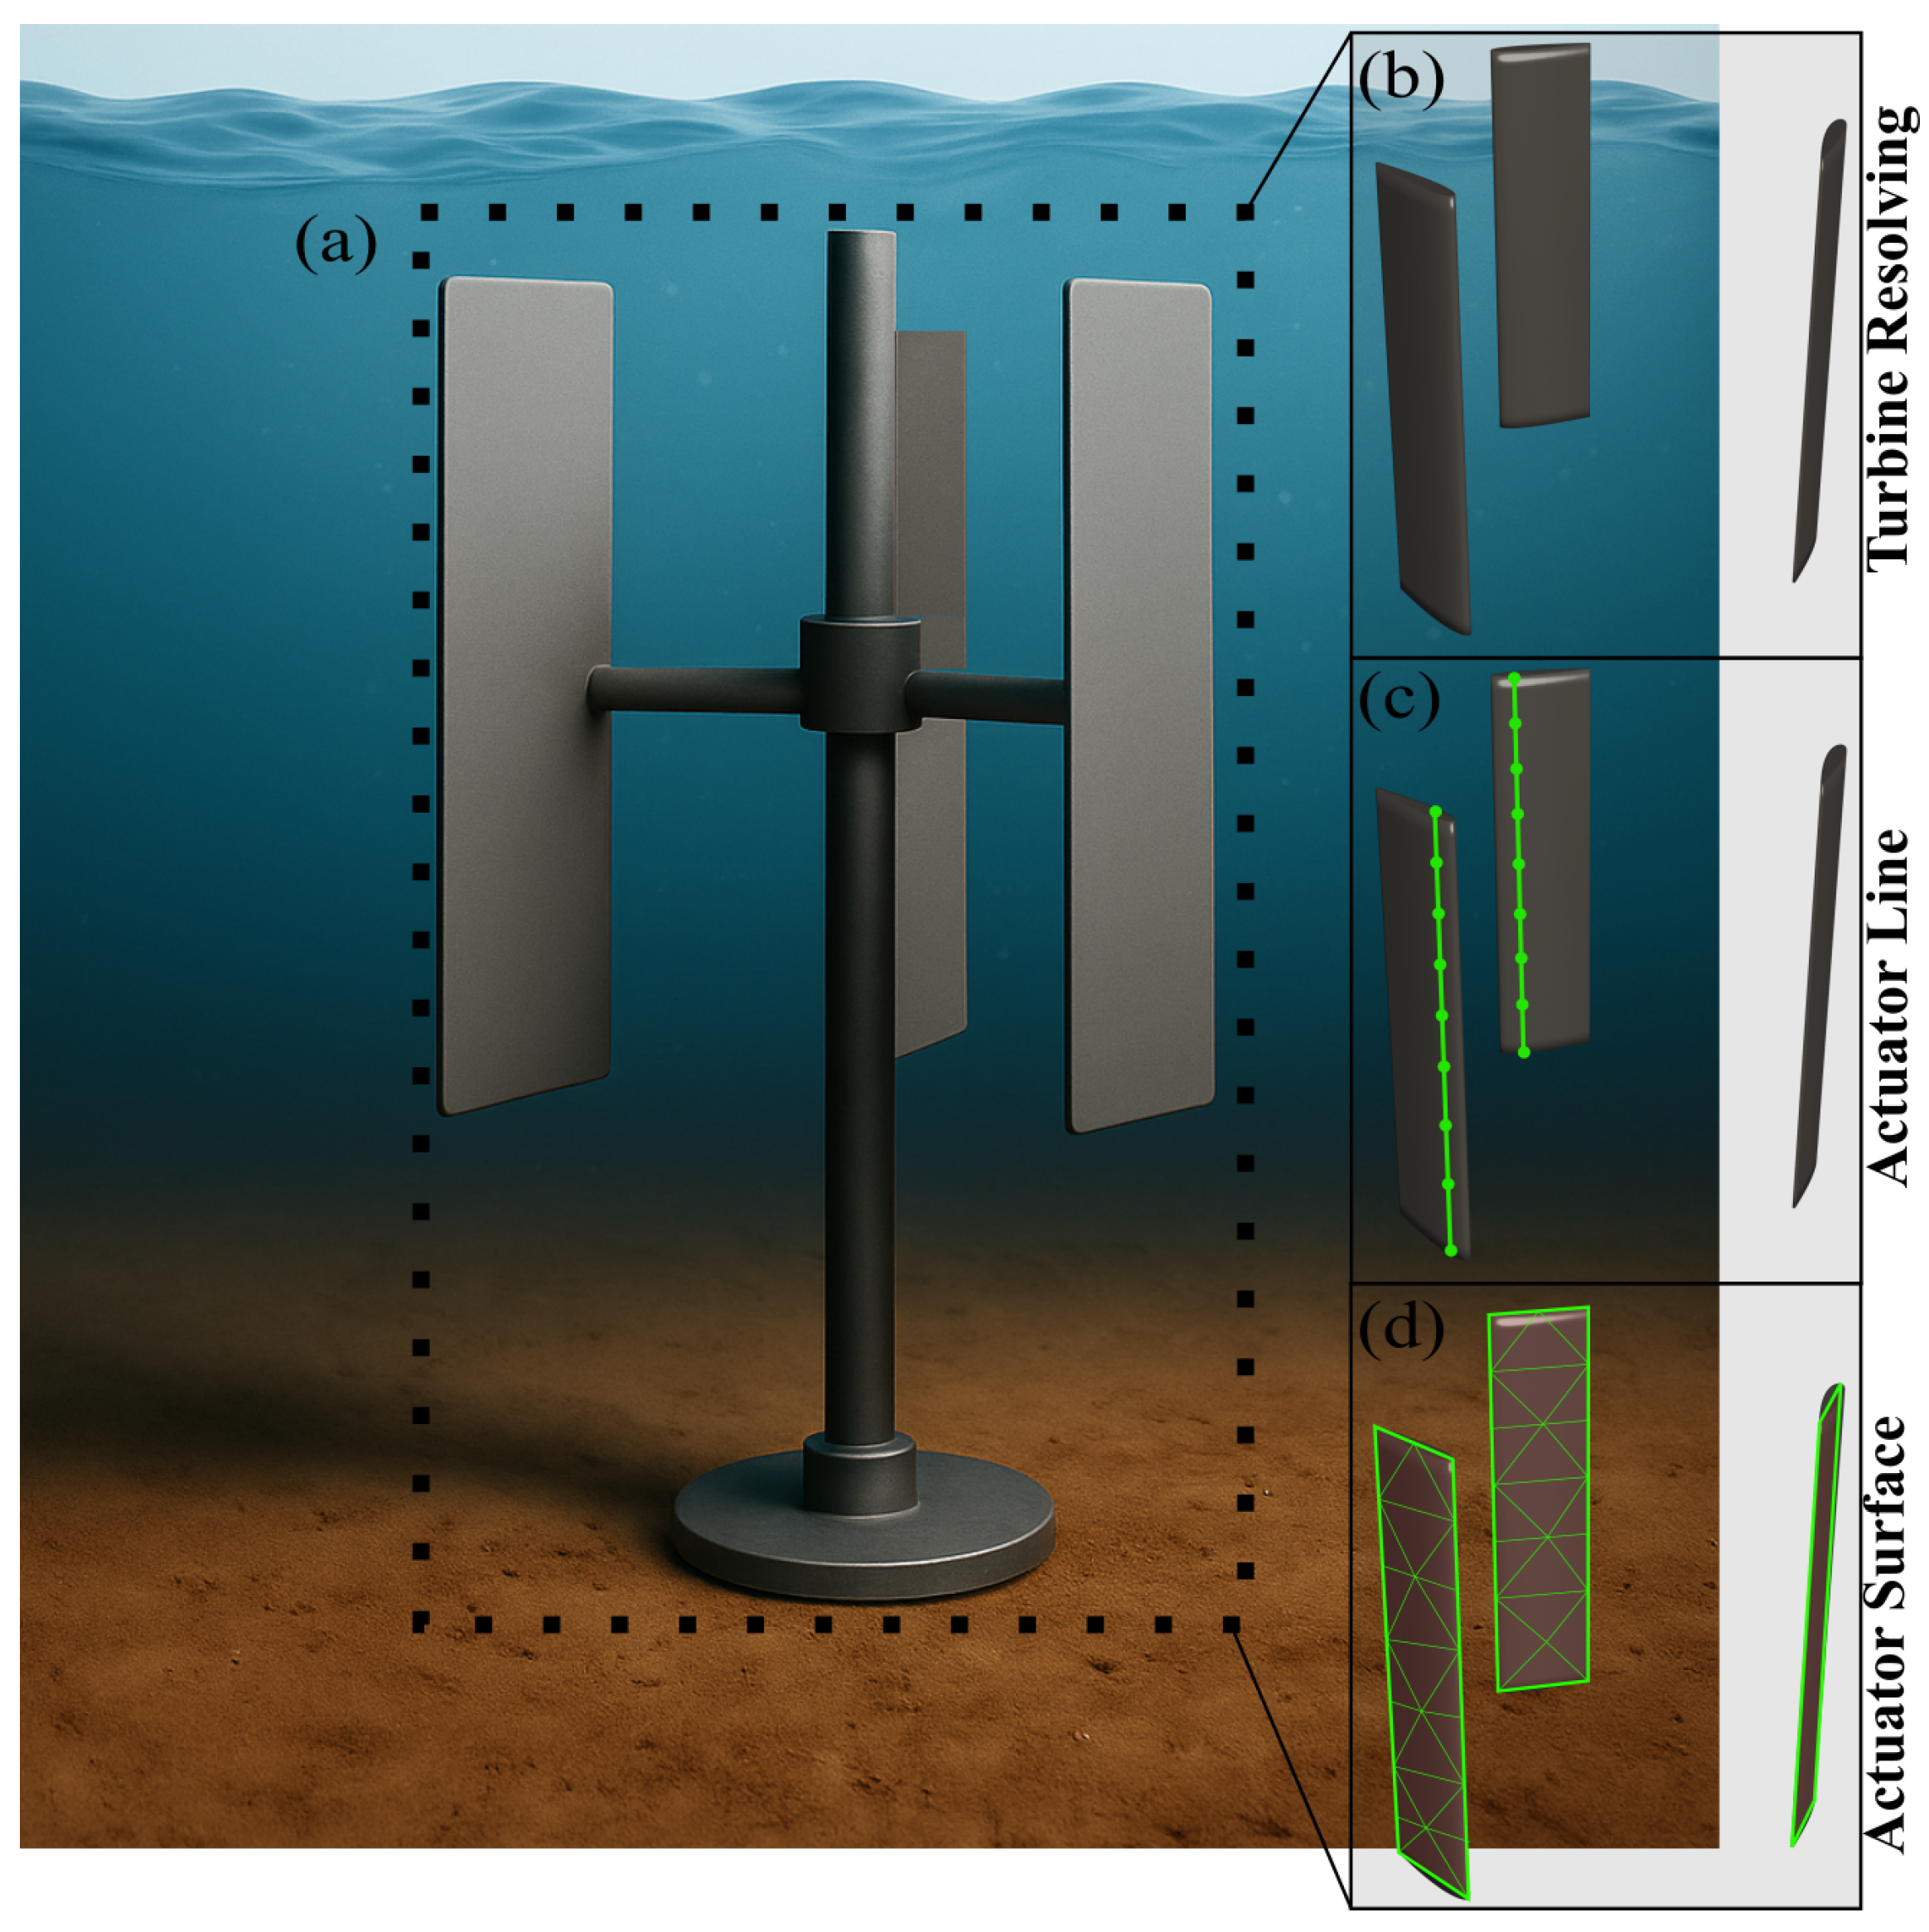
Figure 1. Schematic of a vertical-axis turbine: turbine-resolving (a), actuator line (b), and actuator surface (c). The figure was generated by ChatGPT (OpenAI), version 4.
Fluids 10 00304 g001
Figure 2. The employed loose-coupling algorithm.
Fluids 10 00304 g002
Figure 3. The computational domain and VAT setup (dimensions normalized by D = 2 m): (a) shows the channel geometry, turbine position, and flow direction; (b) depicts the blade dimensions with structured (flow) and unstructured (bed) grids, coarsened by factors of 10 and 5, respectively, for clarity; (c) depicts the top view of the actuator surface; and (d) shows the actuator-surface triangular mesh.
Fluids 10 00304 g003
Figure 4. Hydrodynamic results of the model under rigid-bed conditions (cases 1–3). Panels (a,d,g) show instantaneous vorticity magnitude from side view at the channel centerline, while (b,e,h) display TKE from the same plane, and (c,f,i) present TKE from a cross-plane 2 D downstream of the turbine for TSR = 1.6 , 2.0 , and 2.4 , respectively. Flow direction is from left to right.
Fluids 10 00304 g004
Figure 5. Hydrodynamic results of the model under rigid-bed conditions (cases 1–3). Panels (a,c,e) display the non-dimensional mean velocity magnitude from the top view at blade mid-depth, while (b,d,f) present the same parameter from the side view along the channel centerline. The first, second, and third rows correspond to TSR = 1.6 , 2.0 , and 2.4 , respectively, with flow direction from left to right.
Fluids 10 00304 g005
Figure 6. Contours of the normalized mean streamwise velocity, shown over vertical planes along the centerline of the channel under rigid-bed (left column) and live-bed (right column) conditions. Live-bed cases include bed elevation at equilibrium. The first, second, and third rows correspond to TSR = 1.6 , 2.0 , and 2.4 , respectively, with flow direction from left to right.
Fluids 10 00304 g006
Figure 7. Contours of the computed TKE normalized by U 2 at an elevation of z = 0.35 D above the bed and under rigid-bed (left column) and live-bed (right column) conditions. The first, second, and third rows correspond to TSR = 1.6, 2.0, and 2.4, respectively. Flow direction is from left to right.
Fluids 10 00304 g007
Figure 8. Contours of the computed mean velocity magnitude normalized by the bulk velocity (=1.5 m/s) at an elevation of z = 0.35 D above the bed and under rigid-bed (left column) and live-bed (right column) conditions. The first, second, and third rows correspond to TSR = 1.6, 2.0, and 2.4, respectively. Flow direction is from left to right.
Fluids 10 00304 g008
Figure 9. Computed profiles of TKE across the channel at 0.35 D above the bed at 1 D , 3 D , and 10 D downstream of the turbine (locations indicated by red lines in subfigure (a)), normalized by U 2 , under both rigid and live-bed conditions. The first, second, and third rows correspond to TSR = 1.6 , 2.0 , and 2.4 , respectively.
Fluids 10 00304 g009
Figure 10. Computed profiles of TKE across the channel at 0.35 D above the bed at 1 D , 3 D , and 10 D downstream of the turbine (locations indicated by red lines in subfigure (a)), normalized by the bulk velocity ( = 1.5 m/s), under both rigid and live-bed conditions. The first, second, and third rows correspond to TSR = 1.6 , 2.0 , and 2.4 , respectively.
Fluids 10 00304 g010
Figure 11. Computed contours of bed elevation (normalized by rotor diameter, D = 2 m) for cases 4–6 from top view. The first to fourth columns correspond to 1, 4, 10, and 19 (dynamic equilibrium state) minutes of live-bed evolution. The first, second, and third rows correspond to TSR = 1.6, 2.0, and 2.4, respectively, with flow direction from left to right.
Fluids 10 00304 g011
Figure 12. Computed evolution of maximum bed erosion across the live-bed channel for TSR of 1.6 (bold line), 2.0 (dashed line), and 2.4 (dotted-dashed line).
Fluids 10 00304 g012
Figure 13. Contours of instantaneous bed shear stress (i.e., Shield’s parameter) on a horizontal plane 0.35 D above the bed at the dynamic equilibrium state for cases 4 to 6. The first, second, and third rows correspond to TSR = 1.6 , 2.0 , and 2.4 , respectively. The flow is from left to right.
Fluids 10 00304 g013
Figure 14. The mean power coefficient of the single utility-scale turbine under the rigid- and live-bed conditions.
Fluids 10 00304 g014
Table 1. Test-cases 1 to 3 are conducted under rigid-bed, while test-cases 4 to 6 are conducted under live-bed conditions. TSR denotes tip-speed ratio.
Test-CaseMobilityTSR
1Rigid 1.6
2Rigid 2.0
3Rigid 2.4
4Live 1.6
5Live 2.0
6Live 2.4
Table 2. Computational details of the coupled hydro- and morpho-dynamics model. Grid resolution in streamwise, spanwise, and vertical directions are defined as N x , N y , and N z with spatial steps of Δ x , Δ y , and Δ z , respectively. Non-dimensional time steps are shown as Δ t * (flow solver) and Δ t s (morpho-dynamics solver). Key sediment transport parameters are presented as Δ s , γ , and ϕ , ρ s , and d 50 representing the sediment layer’s grid resolution, sediment porosity, density, angle of repose, and median grain size. D is the rotor diameter.
N x , N y , N z 941 × 133 × 117
Δ x , Δ y , Δ z 0.02 D
Δ t * 0.0005
z + 1100
Δ t s 0.05
Δ s 0.048 D
γ 0.41
ρ s ( kg / m 3 ) 2650
ϕ 40
d 50 (mm) 0.7
Disclaimer/Publisher’s Note: The statements, opinions and data contained in all publications are solely those of the individual author(s) and contributor(s) and not of MDPI and/or the editor(s). MDPI and/or the editor(s) disclaim responsibility for any injury to people or property resulting from any ideas, methods, instructions or products referred to in the content.