Article

Numerical Study of Side Boundary Effects in Pore-Scale Digital Rock Flow Simulations

1
Exploration and Development Research Institute, Tarim Oilfield Company, China National Petroleum Corporation, Korla 841000, China
2
R&D Center for Ultra-Deep Complex Reservoir Exploration and Development, China National Petroleum Corporation, Korla 841000, China
3
Engineering Research Center for Ultra-Deep Complex Reservoir Exploration and Development, China National Petroleum Corporation, Korla 841000, China
4
Xinjiang Key Laboratory of Ultra-Deep Oil and Gas, China National Petroleum Corporation, Korla 841000, China
5
TenFong Technology, Shenzhen 518055, China
6
Department of Mechanical Engineering, City University of Hong Kong, Hong Kong 999077, China
*
Author to whom correspondence should be addressed.
Fluids 2025, 10(12), 305; https://doi.org/10.3390/fluids10120305
Submission received: 16 October 2025 / Revised: 17 November 2025 / Accepted: 19 November 2025 / Published: 21 November 2025

Abstract

This work presents a numerical study of side boundary effects in pore-scale digital rock flow simulations, where the side boundaries are often treated as no-slip walls. While the capillary end effects from inlet and outlet boundaries are well known, the influence of side boundaries has not been systematically studied, especially for two-phase flow. We employ a well-established three-dimensional color-gradient lattice Boltzmann model to simulate immiscible two-phase flow on both real and synthetic rock samples. Our results reveal significant artifacts in small samples caused by side boundaries, leading to non-representative saturation profiles, even though absolute permeability remains consistent with larger samples. In drainage, non-wetting phase saturation is substantially lower near the side boundaries due to increased trapping of the wetting phase, while in imbibition, the wetting phase preferentially flows along the walls, forming steep V-shaped saturation profiles near the side boundaries. Increasing sample size can reduce boundary influence, but this is often impractical for certain samples, owing to, for instance, high computational demands. Enforcing periodic boundary conditions directly on the side boundaries only marginally improves saturation near the boundaries for the drainage cases, as poor pore connectivity across quasi-periodic boundaries remains a limitation, especially in low-porosity media, while the approach causes unphysically high wetting phase saturation near the side boundaries during imbibition. An alternative approach is to generate synthetic rock samples that are inherently periodic in the transverse directions, enabling more representative two-phase flow simulations. By comparing simulations with no-slip and periodic boundary conditions on a low porosity synthetic rock sample, the side boundary effects can cause more than 10% differences in steady-state saturation. Thus, synthetically generated periodic digital rock samples offer a promising solution for pore-scale studies of low-porosity media.

1. Introduction

Pore-scale simulations of complex fluid flows in porous media have garnered significant attention in recent years due to their critical role in various scientific and engineering applications, including hydrocarbon recovery, geological carbon sequestration, groundwater remediation as well as various industrial processes that involve porous structures [1,2]. The pore-scale interaction between capillary, viscous, and gravitational forces governs displacement efficiency and residual trapping, thereby influencing oil recovery, CO2 storage capacity [3,4] et cetera. Consequently, understanding the detailed pore-scale mechanisms of fluid phase displacement is vital for optimizing these industrial and environmental applications.
Two primary methods are implemented by researchers to perform pore-scale simulations: direct numerical simulation (DNS) [5,6] and pore-network modeling (PNM) [7]. DNS methods—including traditional computational fluid dynamics (CFD) approaches and the lattice Boltzmann method (LBM) [8,9,10]—directly solve the governing equations of fluid flow. They work on detailed pore geometries, often obtained from high-resolution imaging like X-ray micro-computed tomography (micro-CT) [3]. While these methods make minimal assumptions and can capture highly detailed fluid dynamics and interfacial phenomena, they are computationally intensive, particularly for large or complex domains. In contrast, PNM simplifies the porous space into a network of interconnected pores and throats. This approach allows for more efficient simulations by using simplified flow equations. Although PNM is less computationally demanding, it relies on assumptions about the network’s connectivity and may not capture all the complexities of real pore structures, such as fractures. Both DNS and PNM have their own strengths and weaknesses. The choice between them depends on the specific research question, available computational resources, and the level of detail required. The present work will primarily focus on DNS methods.
When using pore-scale DNS methods, the computational cost is a significant obstacle. These simulations often demand a great deal of memory and processing power to accurately capture fine details in complex geometries. The LBM has become a popular pore-scale DNS method. It is well-suited for handling complex no-slip boundaries and interfacial dynamics and can run efficiently on modern Graphics Processing Units (GPUs) [6,11,12,13,14]. LBM was, in fact, one of the first numerical schemes ported to GPUs [15]. As GPU technology has advanced, the power of a single GPU is now comparable to that of a small CPU cluster, making it feasible to perform LBM simulations on large domains using a single GPU server.
Despite these advancements, the computational cost of DNS methods—including LBM—remains high, especially when simulating 3D multiphase flows with realistic physical properties and capillary numbers. To manage computational costs, researchers often simulate smaller domains extracted from larger rock samples, provided the domains meet the Representative Elementary Volume (REV) criteria. However, while it is straightforward to estimate the REV size for single-phase flow properties like porosity and absolute permeability, doing so for two-phase flow is far more challenging due to the complex interplay of capillary, viscous, and inertial forces within the pore space. Most of the existing studies only provide REV evidence of single-phase flow properties, and the rock sample size is often chosen based on computational feasibility rather than a rigorous REV analysis for two-phase flow. Table 1 lists the sample sizes used in some selected previous pore-scale multiphase simulation studies. Rigorous REV analyses for two-phase flow are extremely time consuming and computationally expensive. Among those studies, Ahrenholz et al. [6] tries to tackle this issue by simulating multiple subsamples of the same size extracted from a larger beadpack sample to estimate the uncertainty. Akai et al. [16] conducted a pore-scale simulation and experiment on the exact same sample to validate their simulation method which does not require a REV analysis. Overall, even for the most studied rock types like the Bentheimer sandstones, the sample sizes and grid resolution vary significantly, ranging from 1003 to nearly 10003 voxels, with resolutions spanning from 1.7 to 6.7 micrometers. This variability highlights the lack of consensus on appropriate sample sizes and simulation resolution for two-phase flow simulations, underscoring the need for further investigation into the effects of sample size and boundary conditions on simulation outcomes. For example, a well-known issue is the capillary end effect at the outlet boundary, which can significantly influence steady-state saturation, particularly during drainage. This effect can be mitigated by using a sufficiently long sample and only analyzing the middle section, which, in turn, increases the computational cost.
Digital rock flow simulations, like real core-flooding experiments, often employ no-slip wall boundary conditions on the sample’s sides. While these no-slip side boundary effects are mostly negligible in real experiments because the rock sample is significantly larger than the pore size, they can become non-trivial in 3D pore-scale simulations where the sample size is limited by computational resources as shown in Table 1. This is especially true for low-porosity rocks with poor pore connectivity, as the side walls can further reduce connectivity across the boundaries. To date, very few studies have explicitly focused on side boundary effects in pore-scale porous media simulations. Galindo-Torres et al.’s work [22] is one of the few highlighting this issue. They demonstrated the significance of such boundary influences in LBM simulations of unsaturated flow, showing that the presence of lateral walls can affect the computed capillary-pressure saturation curves. However, their study is limited to simple beadpack geometries and focused mainly on the the capillary-pressure saturation curves where they applied pressure boundary conditions on the side boundaries, which is not applicable for general displacement simulations on digital rocks. Overall, choosing an appropriate sample size to minimize side wall effects is not straightforward, as it depends on the rock type, pore structure, and flow conditions.
This study investigates the influence of side boundary effects on flow behavior during drainage and imbibition through a series of high-fidelity, pore-scale direct numerical simulations on both real and synthetic rock samples. While a complete REV analysis for two-phase flow is beyond the scope of this work, our focus is on understanding how side boundary conditions affect saturation profiles and fluid distributions in samples of various sizes typically used in pore-scale simulations. We employ a well-established three-dimensional color-gradient lattice Boltzmann model [13,23,24] to simulate immiscible two-phase flow. The primary advantages of this model include its ability to enforce strict phase separation, handle high viscosity ratios, exceptional efficiency, and low spurious velocities, making it well-suited for simulating realistic two-phase flow in porous media. Comparisons with advanced simulations and experiments have demonstrated the model’s accuracy and reliability [13,16].
The simulation code is based on the open-source MF-LBM code [13,25] but has been further optimized for low-porosity geometries by implementing a type of semi-direct addressing data structure [26], which allows us to conduct comparison studies on samples of various sizes and boundary conditions within a reasonable timeframe.
The remainder of this paper is organized as follows. Section 2 introduces the numerical method for two-phase flow simulations. Section 3 validates the numerical model using two test cases: two-phase layered flow between parallel plates and a capillary intrusion problem. Section 4 presents results of two-phase flow simulations on both real and synthetic rock samples, analyzing side boundary effects on saturation profiles and fluid phase distribution. Section 5 summarizes the findings and discusses implications for future pore-scale flow studies.

2. Lattice Boltzmann Method for Two-Phase Flow

In this work, we employ the continuous-surface-force (CSF) based color-gradient LBM [23] and geometrical wetting model [24] to simulate immiscible two-phase flow in porous media. The key points of this color-gradient LBM is summarized below [13]:
  • The present color-gradient LBM uses the continuous surface force model [27] to capture the effects of surface tension at the fluid interface, and incorporates the forces directly into the lattice Boltzmann equation through a forcing term [9,28]. This will reduce spurious velocities and improve numerical stability.
  • A multiple-relaxation-time (MRT) collision model [29,30] is used to enhance numerical stability, especially for simulating two-phase flows with high viscosity ratios or large surface tensions.
  • The geometrical wetting model [19,23,24] is used to account for the wettability of the solid phase. Compared to the traditional fictitious density wetting model [31], the geometrical wetting model can accurately prescribe the contact angle on complex solid surfaces while avoiding forming non-physical films on the solid surfaces [24].
  • A zero-interfacial-force scheme [32] is applied to minimize color gradient near the three-phase contact line, which significantly reduces spurious currents and improve numerical stability.
This multiphase model has been extensively validated and applied in various studies [13,16,23,24,33]. More detailed descriptions of the numerical method can be found in our previous publications [13]. Here, we provide a brief introduction of the method. For most pore-scale simulations in digital rocks, the gravitational force is negligible compared to capillary and viscous forces, so we will not consider gravity in this work, and use a unity density ratio for both fluids to reduce complexity while increasing stability and efficiency.

2.1. The CSF-Based Color-Gradient LBM

The immiscible two-phase fluid system is solved using the color-gradient LBM, which is originally proposed by Gunstensen et al. [34]. In this method, the distribution functions f i r and f i b are introduced to represent the red and blue fluids, respectively. The bulk distribution function of the fluid mixture is defined as f i = f i r + f i b , where the subscript i denotes the ith discrete velocity direction and ranges from 0 to 18 for the three-dimensional 19-velocity model (D3Q19) used in two-phase flow simulation. Like in f i r and f i b , we will hereafter use the superscripts or subscritps r and b to refer to the red and blue fluids, respectively.
The lattice Boltzmann equations for both fluid r and fluid b are [35],
f i s ( x + e i δ t , t + δ t ) = f i s ( x , t ) + Ω i s ( 3 ) { Ω i s ( 1 ) + Ω i s ( 2 ) } , s = r , b , i = 0 , . . . , 18 ,
where superscript s indicates either fluid r or fluid b, e i is the lattice velocity of the D3Q19 model, and Ω i s ( 1 ) , Ω i s ( 2 ) and Ω i s ( 3 ) are the collision operators responsible for the viscous effects, surface tension effects and the separation of different fluids, respectively. For fluids with identical density, it is not necessary to calculate the collision operators Ω i s ( 1 ) and Ω i s ( 2 ) separately for each component [36]. Then, the evolution of the total distribution function f i can be expressed as [13]
f i s ( x + e i δ t , t + δ t ) = f i s ( x , t ) + Ω i s ( 3 ) { M 1 S [ ( M f ) m e q ] } , s = r , b , i = 0 , . . . , 18 ,
where M is a transformation matrix [30] used to transform f i to the moment space, m e q is a vector composed of the equilibrium moments, and S is a diagonal collision matrix,
S = d i a g ( 0 , s e , s ξ , 0 , s q , 0 , s q , 0 , s q , s ν , s π , s ν , s π , s ν , s ν , s ν , s m , s m , s m ) ,
where s ν is related to the fluid viscosity, while other terms can be tuned to improve numerical stability [30].
The color gradient C is defined as
C = ϕ = 3 δ t i ω i e i ϕ ( t , x + e i δ t ) ,
where ω i is the weight coefficient for the D3Q19 lattice [37] and the order parameter ϕ is defined by
ϕ = ρ r ρ b ρ r + ρ b .
The surface tension force F s based on the CSF model [27] is calculated as [23]
F s = 1 2 σ κ C ,
where σ is the surface tension, C is the color gradient defined in Equation (4) and κ is the interface curvature which can be calculated by [27]
κ = I n n · · n ,
where
n = ϕ ϕ
is the normal direction vector of the fluid interface. F s is then incorporated into the lattice Boltzmann equation through a forcing term [9,28] to improve numerical stability and reduce spurious velocities.

2.2. The Geometrical Wetting Boundary Condition

The fundamental concept of the geometrical wetting boundary condition [19,23,24] is to numerically adjust the fluid interface near a solid surface to achieve a desired contact angle. While this angle is simply the slope of the interface in 2D, it is defined as the angle between the tangent plane of the fluid interface and the solid surface at the three-phase contact line in 3D. For 3D systems with complex solid surfaces, calculating the normal vector of the fluid interface can be computationally intensive. Leclaire et al. [19] proposed a method that uses a secant iterative approach, which may increase computational cost. A more efficient, simplified method was later proposed by Akai et al. [24], which calculates the normal vector without the need for an iterative process. In this work, we employ the geometrical wetting boundary condition with this simplified method. For a more detailed introduction of this method, we refer the reader to Ref. [24].

3. Validation

3.1. Two-Phase Layered Flow Between Two Parallel Plates

In this section, simulations of two-phase layered flow between parallel plates are performed to assess the model’s ability to capture fluid interfaces and handle viscosity contrasts in binary fluids. The computational setup is illustrated in Figure 1, where two immiscible fluids with different viscosities occupy the channel. The red fluid fills the central region | y | Y i , while the blue fluid occupies the lateral regions Y i < | y | H .
Fluids with equal densities ( ρ r = ρ b = 1 ) but different dynamic viscosities for the red and blue phases are considered. A constant body force is applied for both the red and the blue fluid along the z-direction, denoted by F (equivalently, a constant streamwise pressure gradient p / z ). For two-phase layered channel flow, the analytical solution [36] of the steady velocity profile u z ( y ) can be written as
u z ( y ) = A 1 y 2 + C 1 , | y | Y i , A 2 y 2 + B 2 y + C 2 , Y i < | y | H ,
with the coefficients
A 1 = F 2 μ r , A 2 = F 2 μ b , B 2 = 2 ( A 1 A 2 ) Y i , C 1 = ( A 2 A 1 ) Y i 2 B 2 ( H Y i ) A 2 H 2 , C 2 = A 2 H 2 B 2 H .
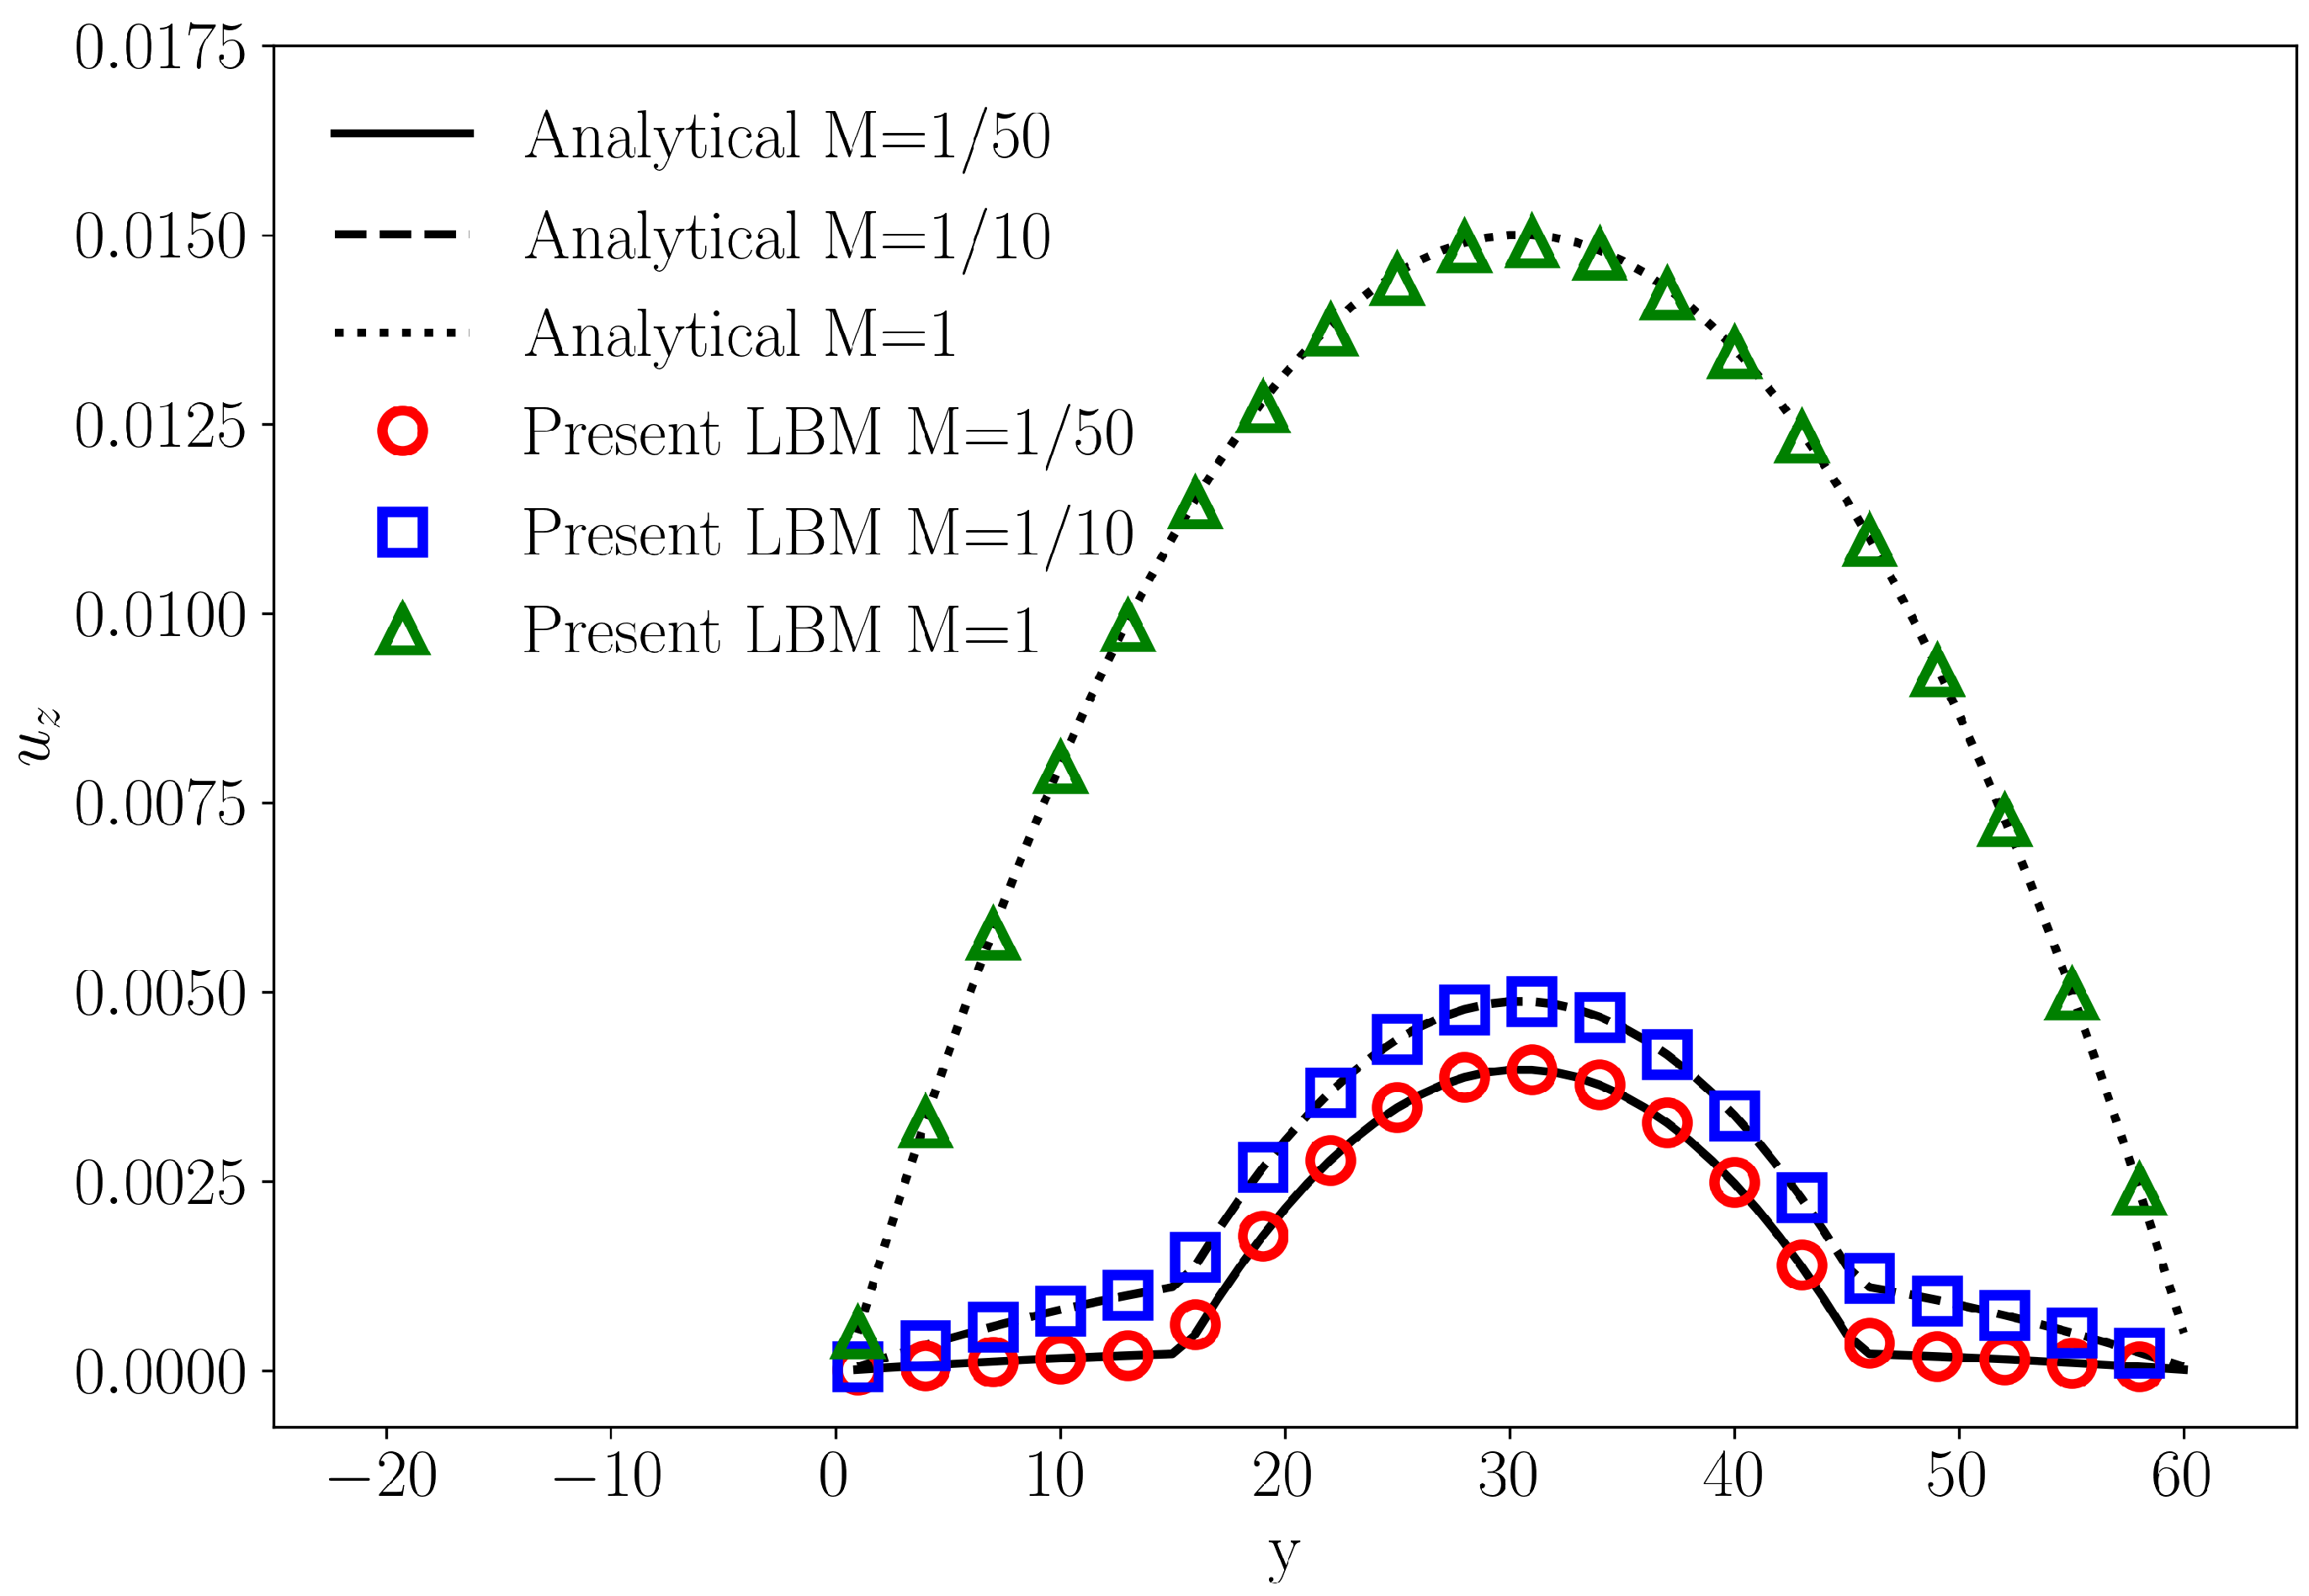
No-slip boundary conditions are imposed at y = ± H . Numerical simulations are performed on a 3 × 40 × 60 lattice with Y i = 15 , using periodic boundary conditions in the x and z directions. The initial velocity throughout the domain is set to zero, with a specified surface tension of σ = 5 × 10⁻³ and contact angle θ = 30°. A constant body force F = 5 × 10⁻⁷ is applied in the z direction. Three cases with viscosity ratios M = 1 / 50 , M = 1 / 10 and M = 1 are examined. For all cases, the viscosity of the red fluid is held constant at μ r = 0.0015 , while the viscosity of the blue fluid, μ b , is varied according to the chosen ratio. Figure 2 shows the velocity profiles for cases with identical densities and three viscosiy ratios. The present LBM results agree well with the analytical solutions.

3.2. Three-Dimensional Capillary Intrusion

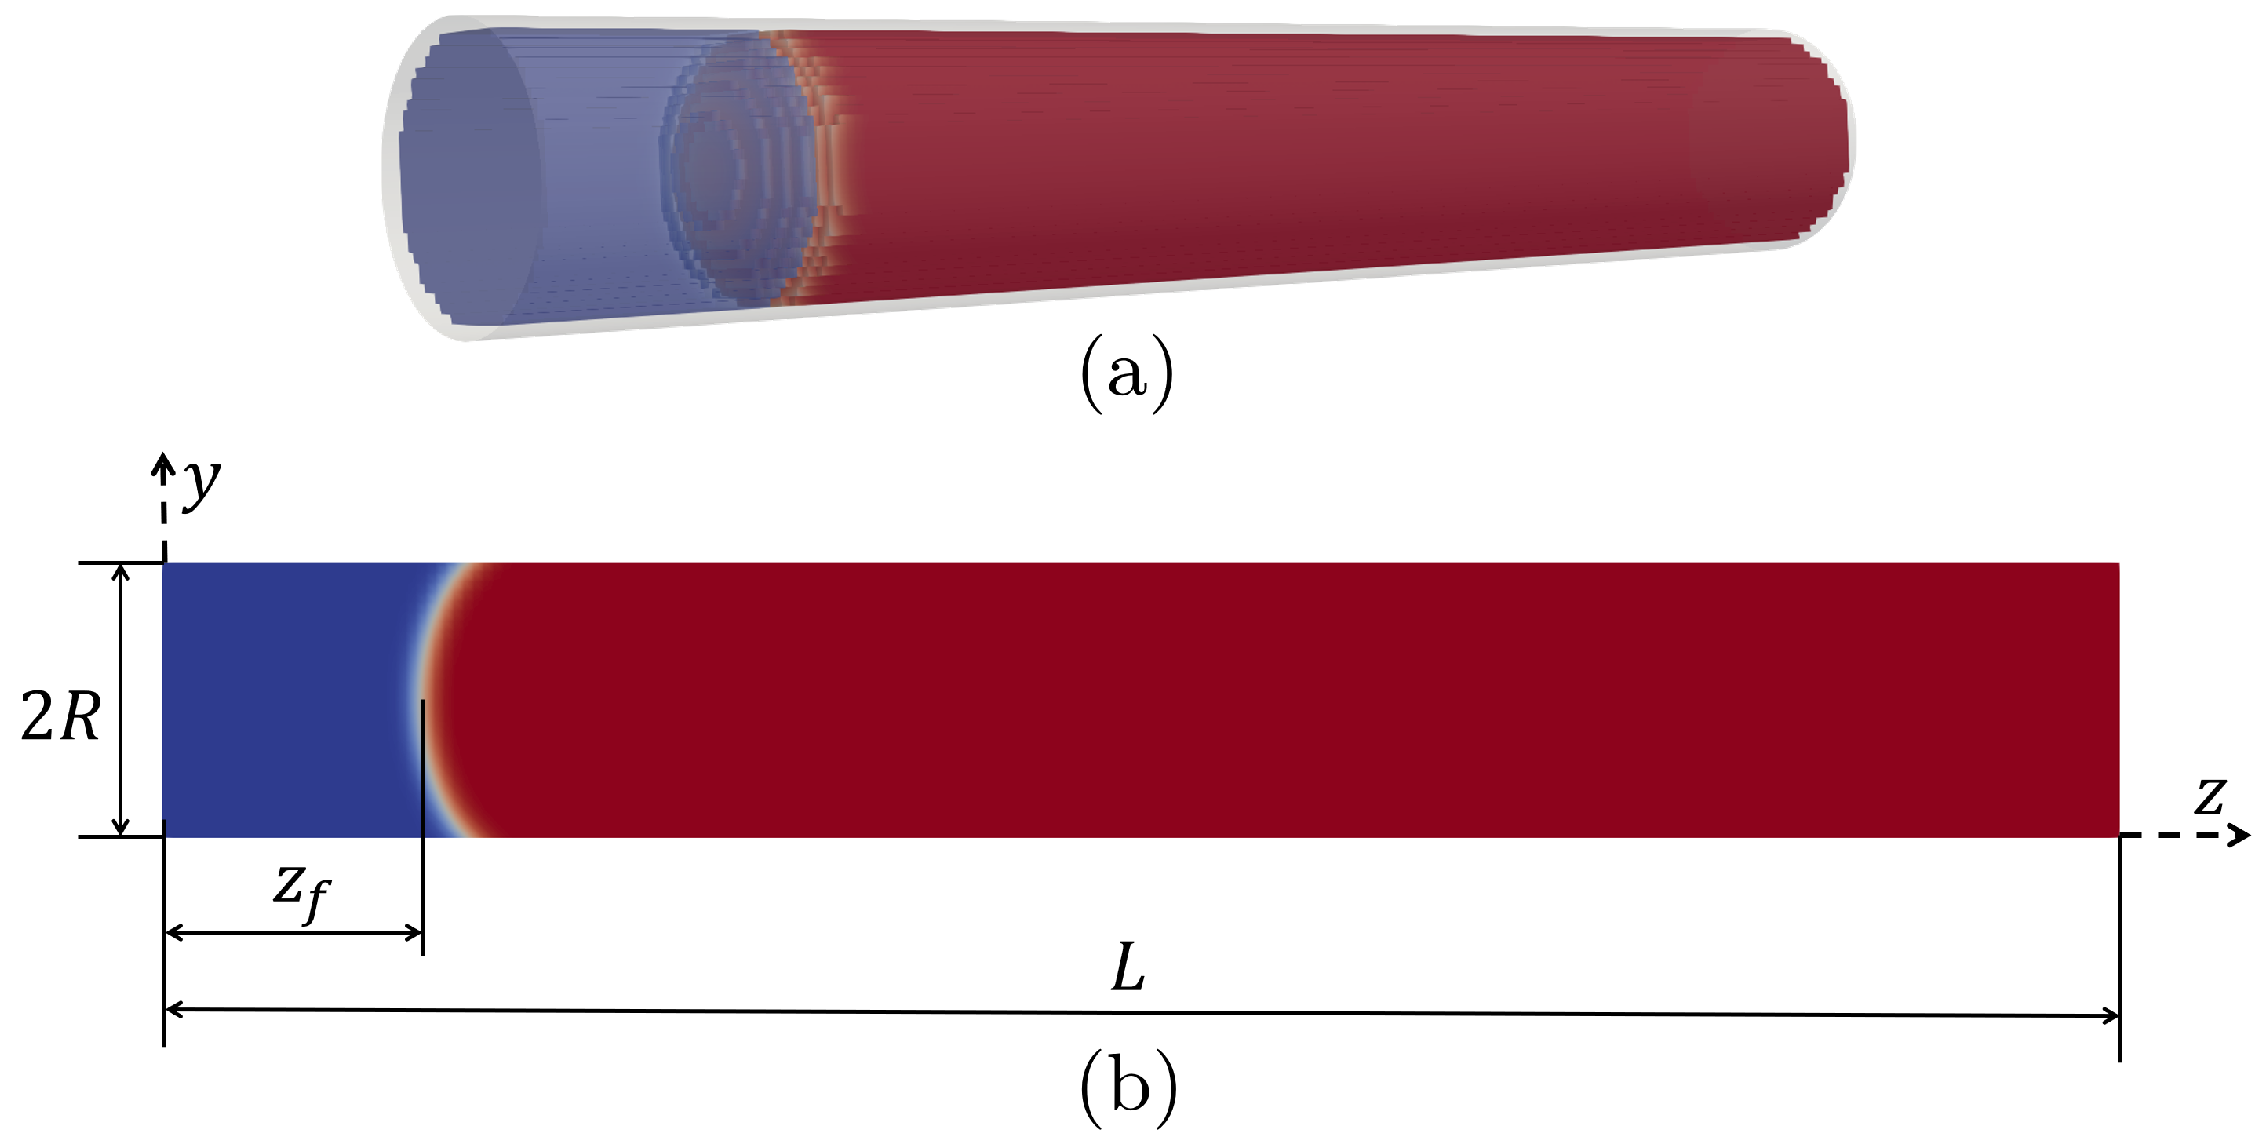
Wettability boundary conditions are crucial in two-phase flow simulations because they impose the fluid–solid contact angle. We further assess the capability of the present 3D color-gradient lattice Boltzmann model to capture moving contact lines by simulating the capillary intrusion phenomenon. The problem considers a wetting phase that spontaneously invades a tubular capillary under capillary effect when gravity and inertial effects are negligible. As illustrated in Figure 3, the capillary is cylindrical, in which the red region denotes the non-wetting phase, and the blue region is the non-wetting phase. The capillary tube has length L and inner radius R. No external body force is applied. During spontaneous imbibition, the invasion speed of the wetting phase results solely from the competition between capillary force and viscous resistance. The meniscus position z f ( t ) thus satisfies
d z f d t = 2 R σ cos θ d 2 μ z f ,
where θ d is the dynamic contact angle measured through the wetting phase side from the simulation, σ the interfacial tension, μ the dynamic viscosity of the invading fluid. z f = 0 at the capillary entrance. Integrating Equation (11) yields the classic Washburn relation [38]
z f 2 ( t ) = ( 2 R σ cos θ d / μ ) t ,
for constant θ d . This benchmark is considered to verify that the present model reproduces the correct penetration dynamics.
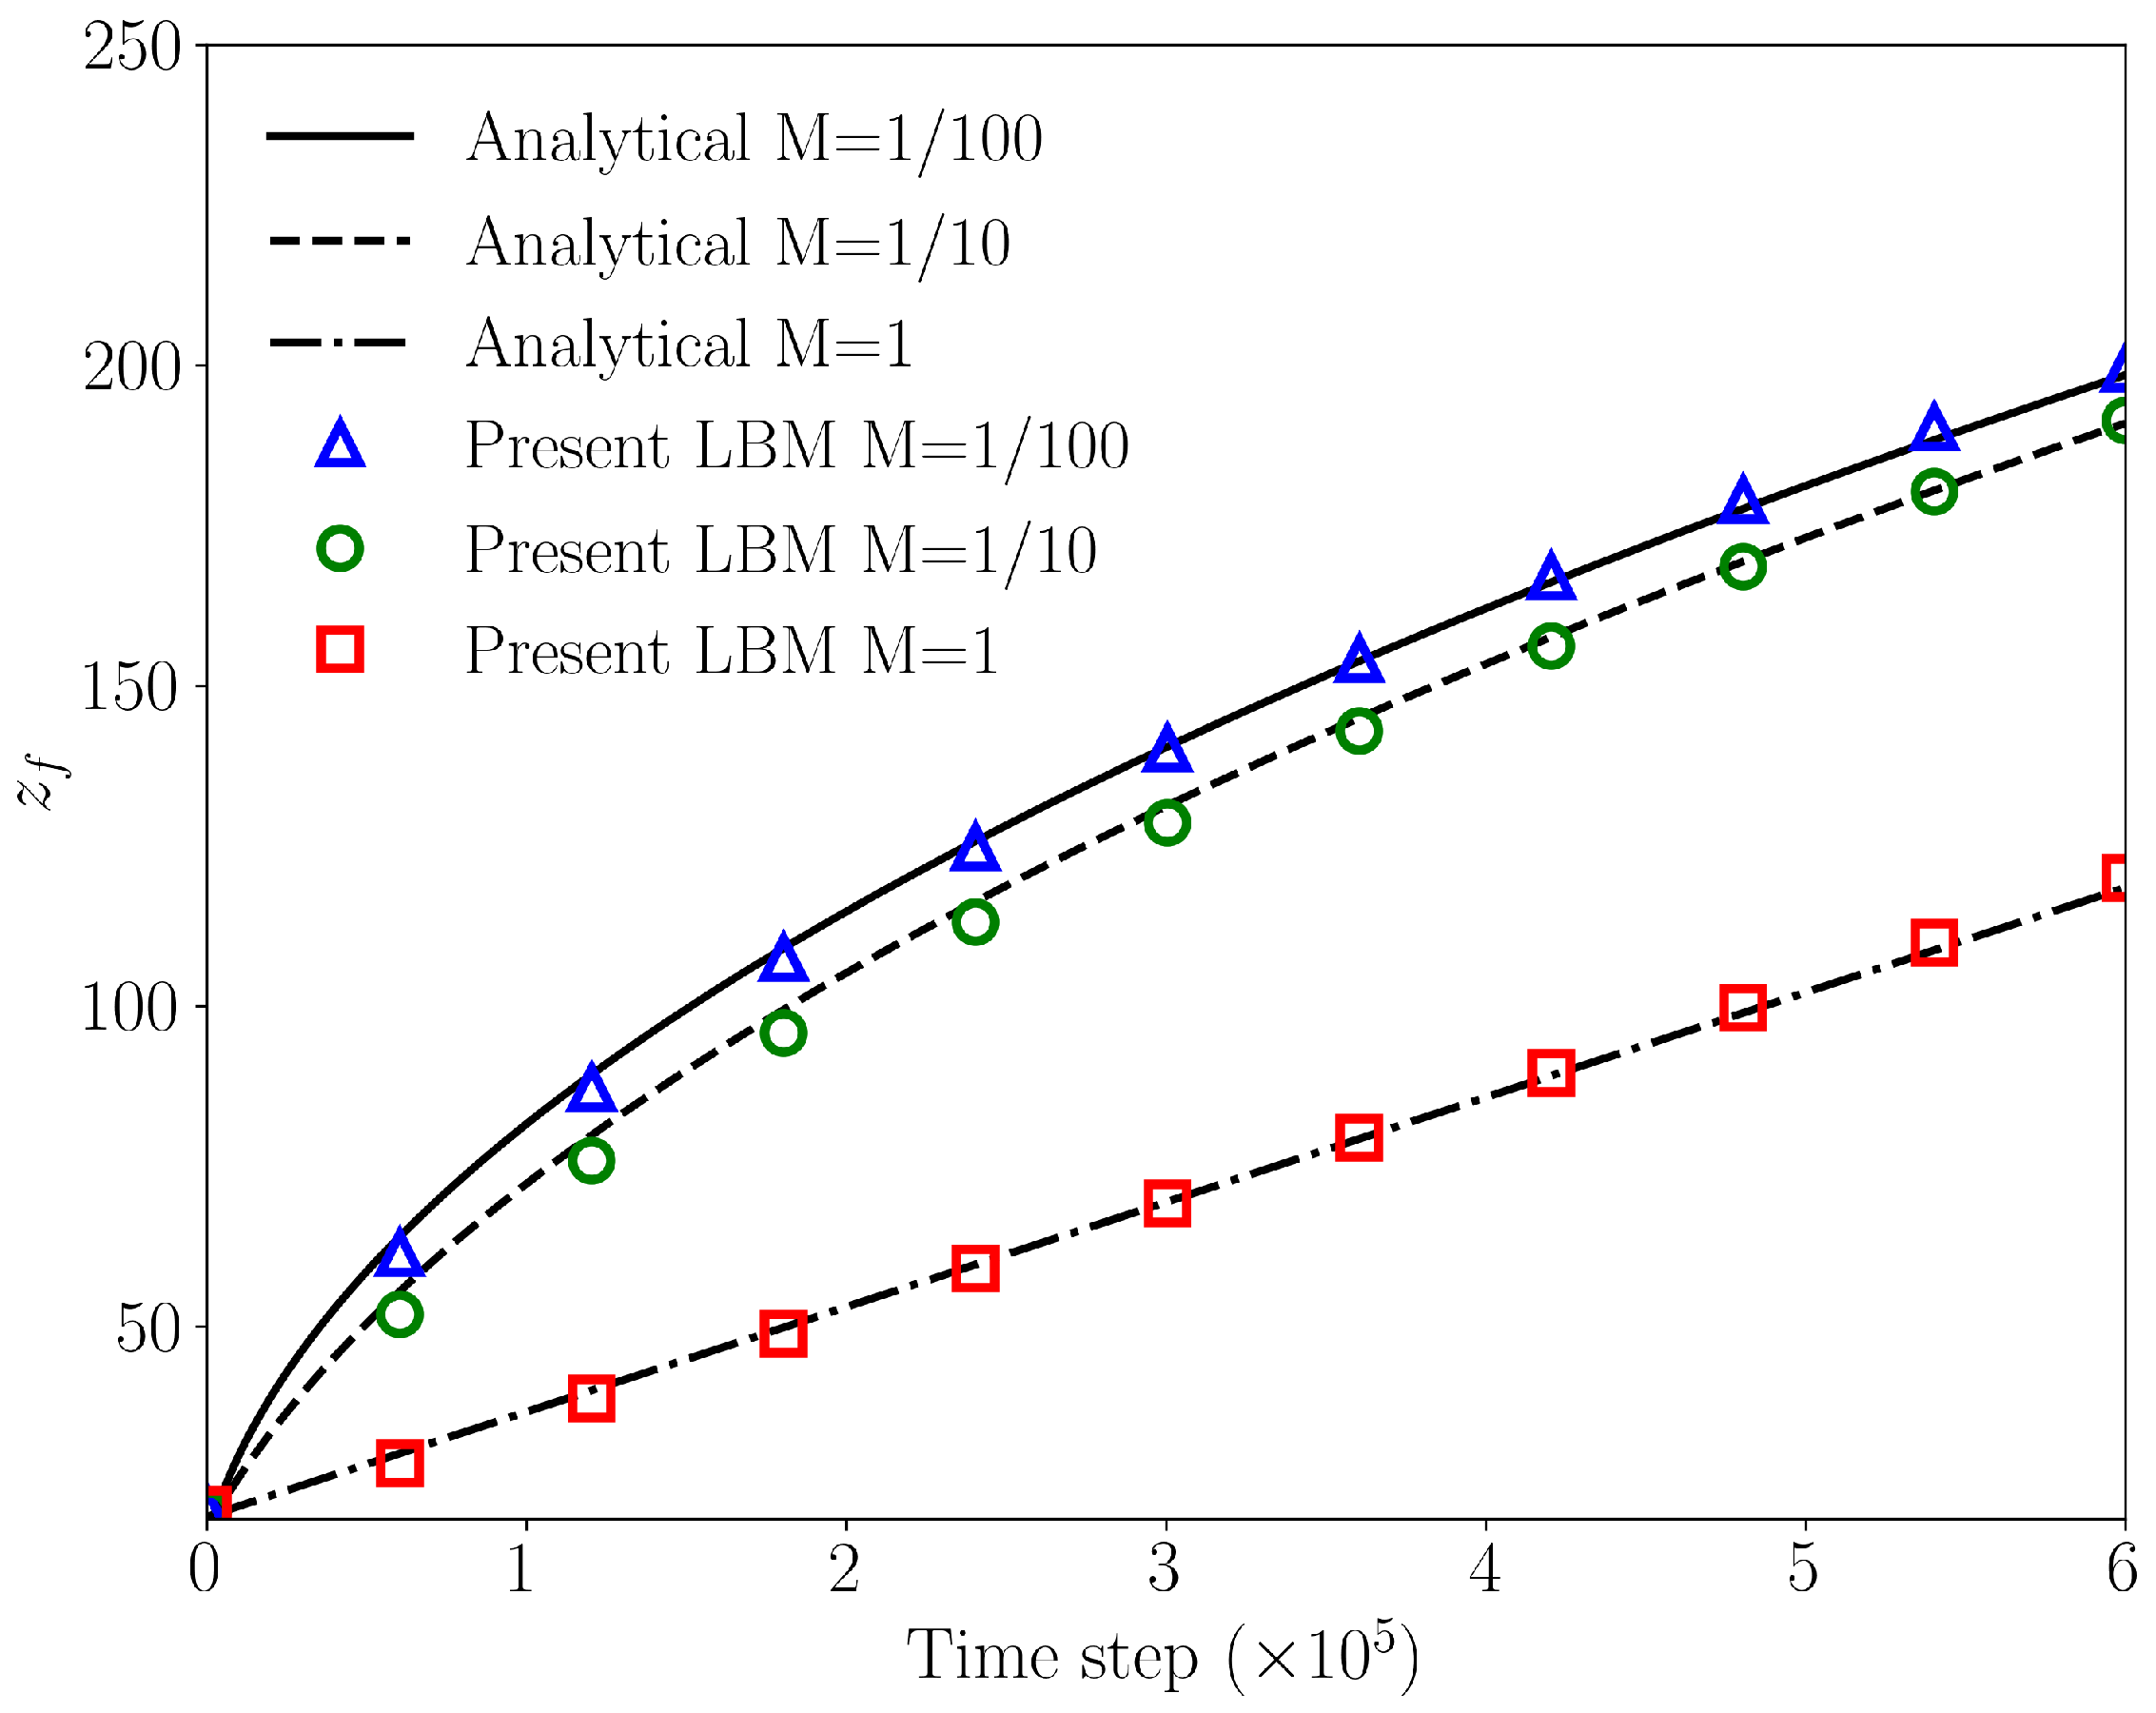
The three-dimensional capillary intrusion problem is simulated in a computational domain of 30 × 30 × 200 lattice units. A cylindrical capillary channel is placed at the center of the domain, with length L = 200 and inner radius R = 15 . The inlet of the capillary tube is considered connected to the wetting phase reservoir, while the outlet is connected to the non-wetting phase reservoir. The tube wall uses the bounce-back no-slip boundary condition, and periodic boundary conditions are applied at both ends. Three cases with viscosity ratios M = μ nw / μ w = 1 / 100 , 1 / 10 and 1 are examined. When varying the viscosity ratio, only the viscosity of the wetting phase is changed; the viscosity of the non-wetting phase is kept constant at μ w = 0.35 . The surface tension is set as σ = 0.04 , and the contact angle θ = 45° for all cases. Figure 4 shows the time evolution of the meniscus position and compares the simulation results with the theoretical prediction computed from Equation (11). Black line denotes the theoretical solution, and the colored markers represent the current computational results. For all tested viscosity ratios, the present model is able to accurately reproduce the motion of the contact line.

4. Results

4.1. Two-Phase Flow Simulations on a Bentheimer Sandstone

4.1.1. Simulation Setup

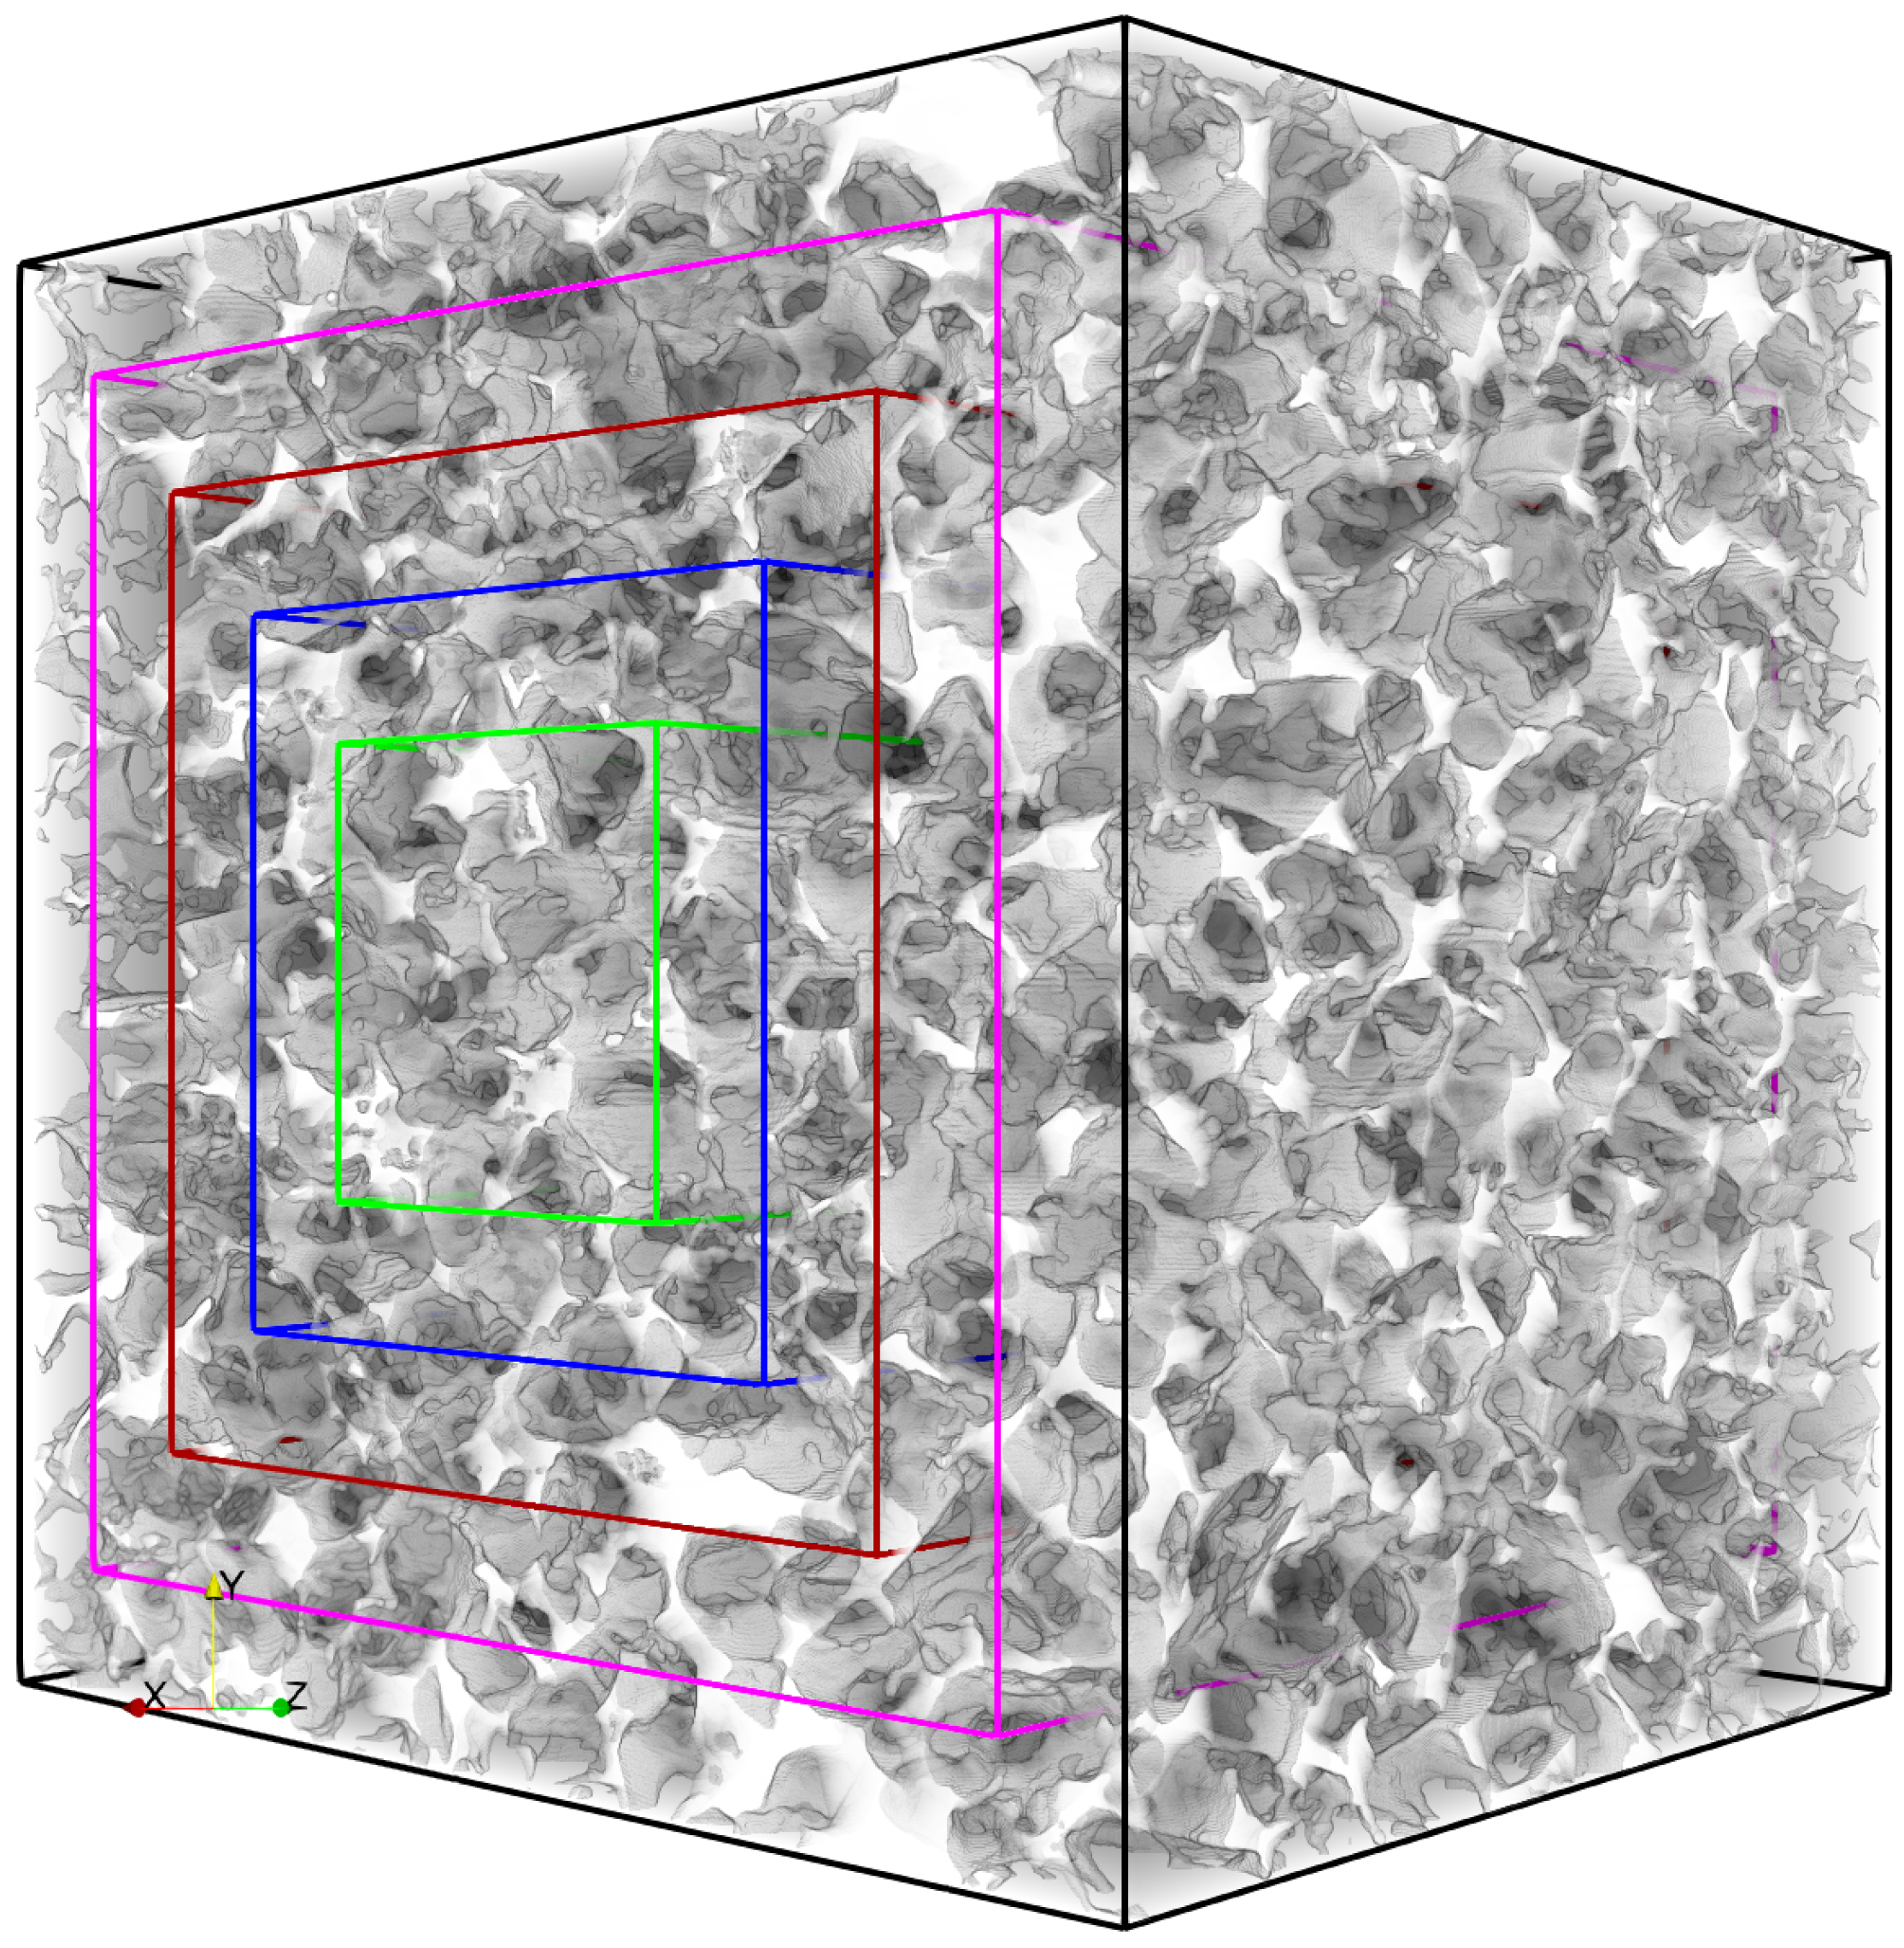
The rock sample used in this study is a Bentheimer sandstone imaged by X-ray micro-CT at a voxel resolution of 3.182 µm [39]. The baseline sample, denoted by B850, has a size of 850 × 850 × 700 voxels. Flow direction is along the z-axis. Additional 10 layers of grid cells are added as buffer zones at both z-boundaries of the computational domain to reduce inlet-outlet boundary effects. Since the main focus of this work is to investigate the side boundary effects, four subsamples are further extracted from the central region of the baseline sample, preserving the z-extent, and are of x y cross-sectional edge lengths of 700, 550, 400, and 250 voxels, denoted by B700, B550, B400 and B250, respectively, as shown in Figure 5. Despite their different transverse dimensions, the five samples exhibit similar porosities and absolute permeabilities, as shown in Table 2, indicating that they are all representative for single-phase flow. The permeability of B400 is slightly lower than the others, while the smallest sample, B250, has properties very similar to those of the largest baseline sample B850. We will investigate how these samples behave in two-phase flow simulations and how the side boundary effects influence the results.
For the drainage process, supercritical CO2 ( s c C O 2 ) displacing water is studied, with fluid properties chosen following Chen et al. [13], resulting in a viscosity ratio M = μ w / μ s c C O 2 of approximately 37.7. Contact angles of 30° and 45° (measured through the defending-phase, water) are used to examine wettability effects. For the imbibition process, water displacing oil is studied, with a viscosity ratio of 5 and a contact angle of 150° (measured through the defending-phase, oil).
A constant velocity boundary condition is imposed at the inlet ( z = z m i n i m u m ), a convective boundary condition is applied at the outlet ( z = z m a x i m u m ), and no-slip boundary conditions are applied at all other faces of the domain. The velocity boundary condition uses the moving-bounce-back scheme [40], and the convective boundary condition follows the approach of Lou et al. [41], being applied only to the unknown distribution functions at the outlet nodes. This method has been shown to effectively reduce unphysical pressure buildup at the outlet during two-phase flow simulations. Combined with the color-gradient LBM introduced in Section 2, this setup has been successfully used to simulate liquid CO2 displacing water in a heterogeneous sandstone micromodel, showing good agreement with experimental data [13].
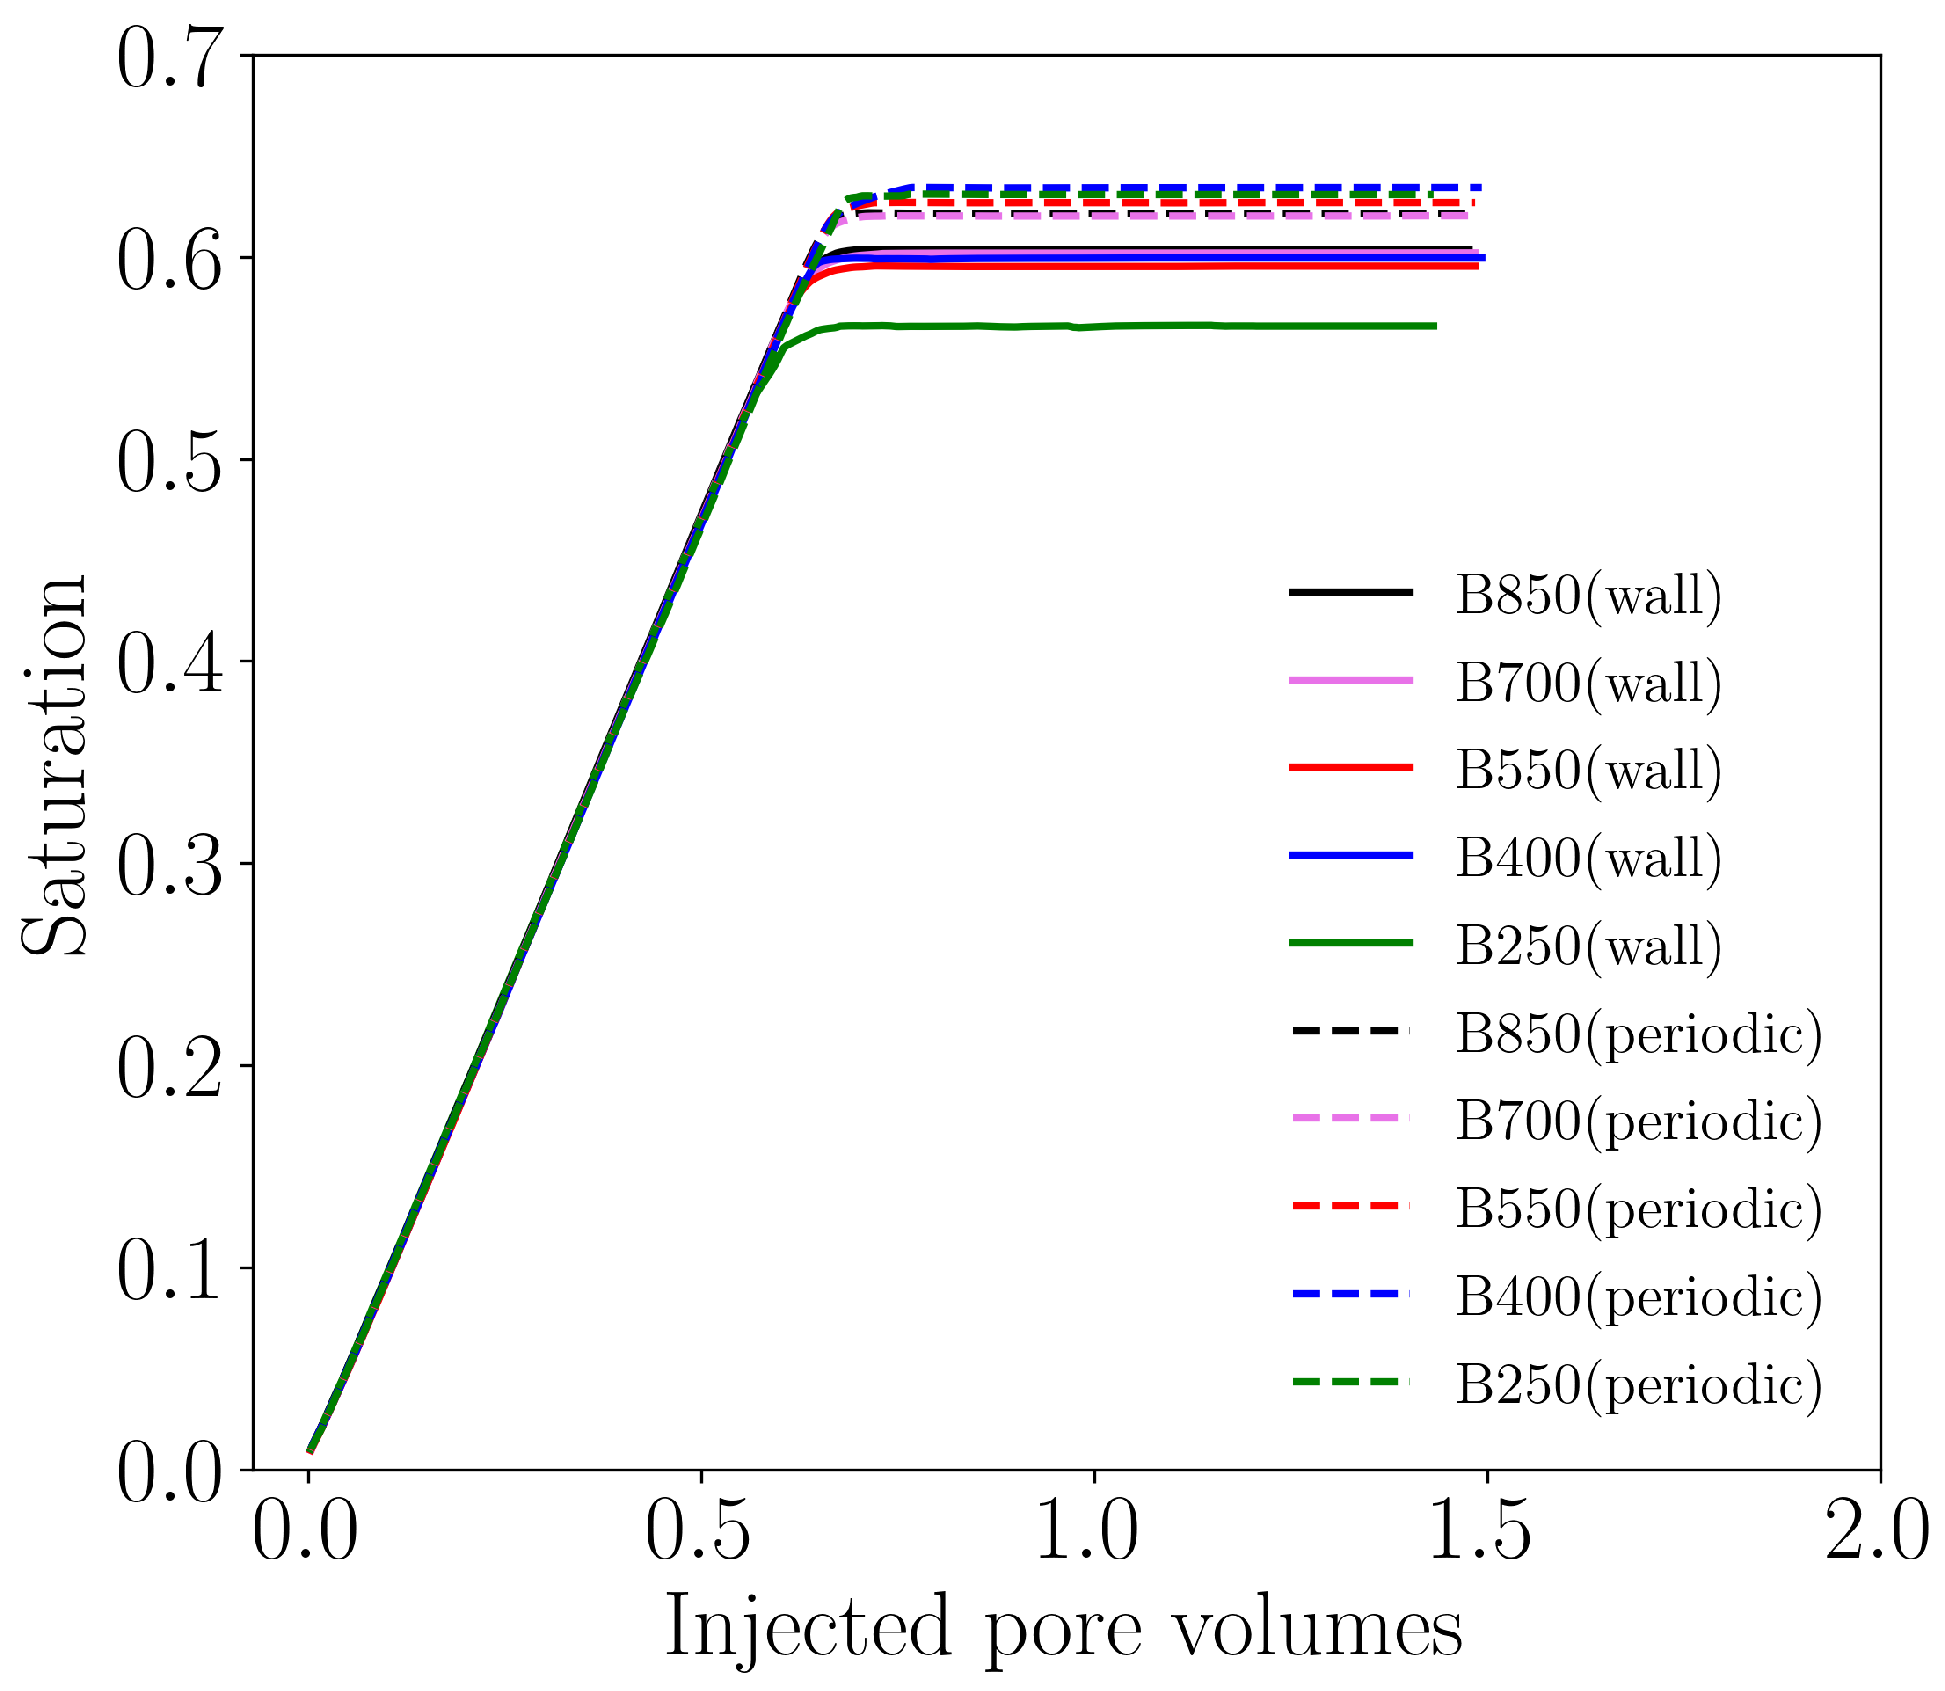
The full details of the fluid properties and flow conditions used in the two-phase flow simulations are summarized in Table 3. The fluid properties are given in lattice units. The total number of iterations and injected pore volumes are also listed in the table. Overall, the resulting capillary numbers are sufficiently low to ensure capillary-dominated flow regimes, and total injected pore volumes are adequate to reach steady states in both drainage and imbibition processes.
As no-slip boundary conditions applied on the four transverse faces of the domain block the transverse flow at the side boundaries, one alternative approach to reduce the side boundary effects is imposing periodic boundary conditions on these domain faces instead, despite the fact that the geometry is not periodic. The misalignment of pore structures across the quasi-periodic boundaries may still lead to reduced connectivity of the pore network. Nevertheless, we will conduct simulations using both the no-slip wall and periodic approaches to compare the results.

4.1.2. Results of Drainage Simulations

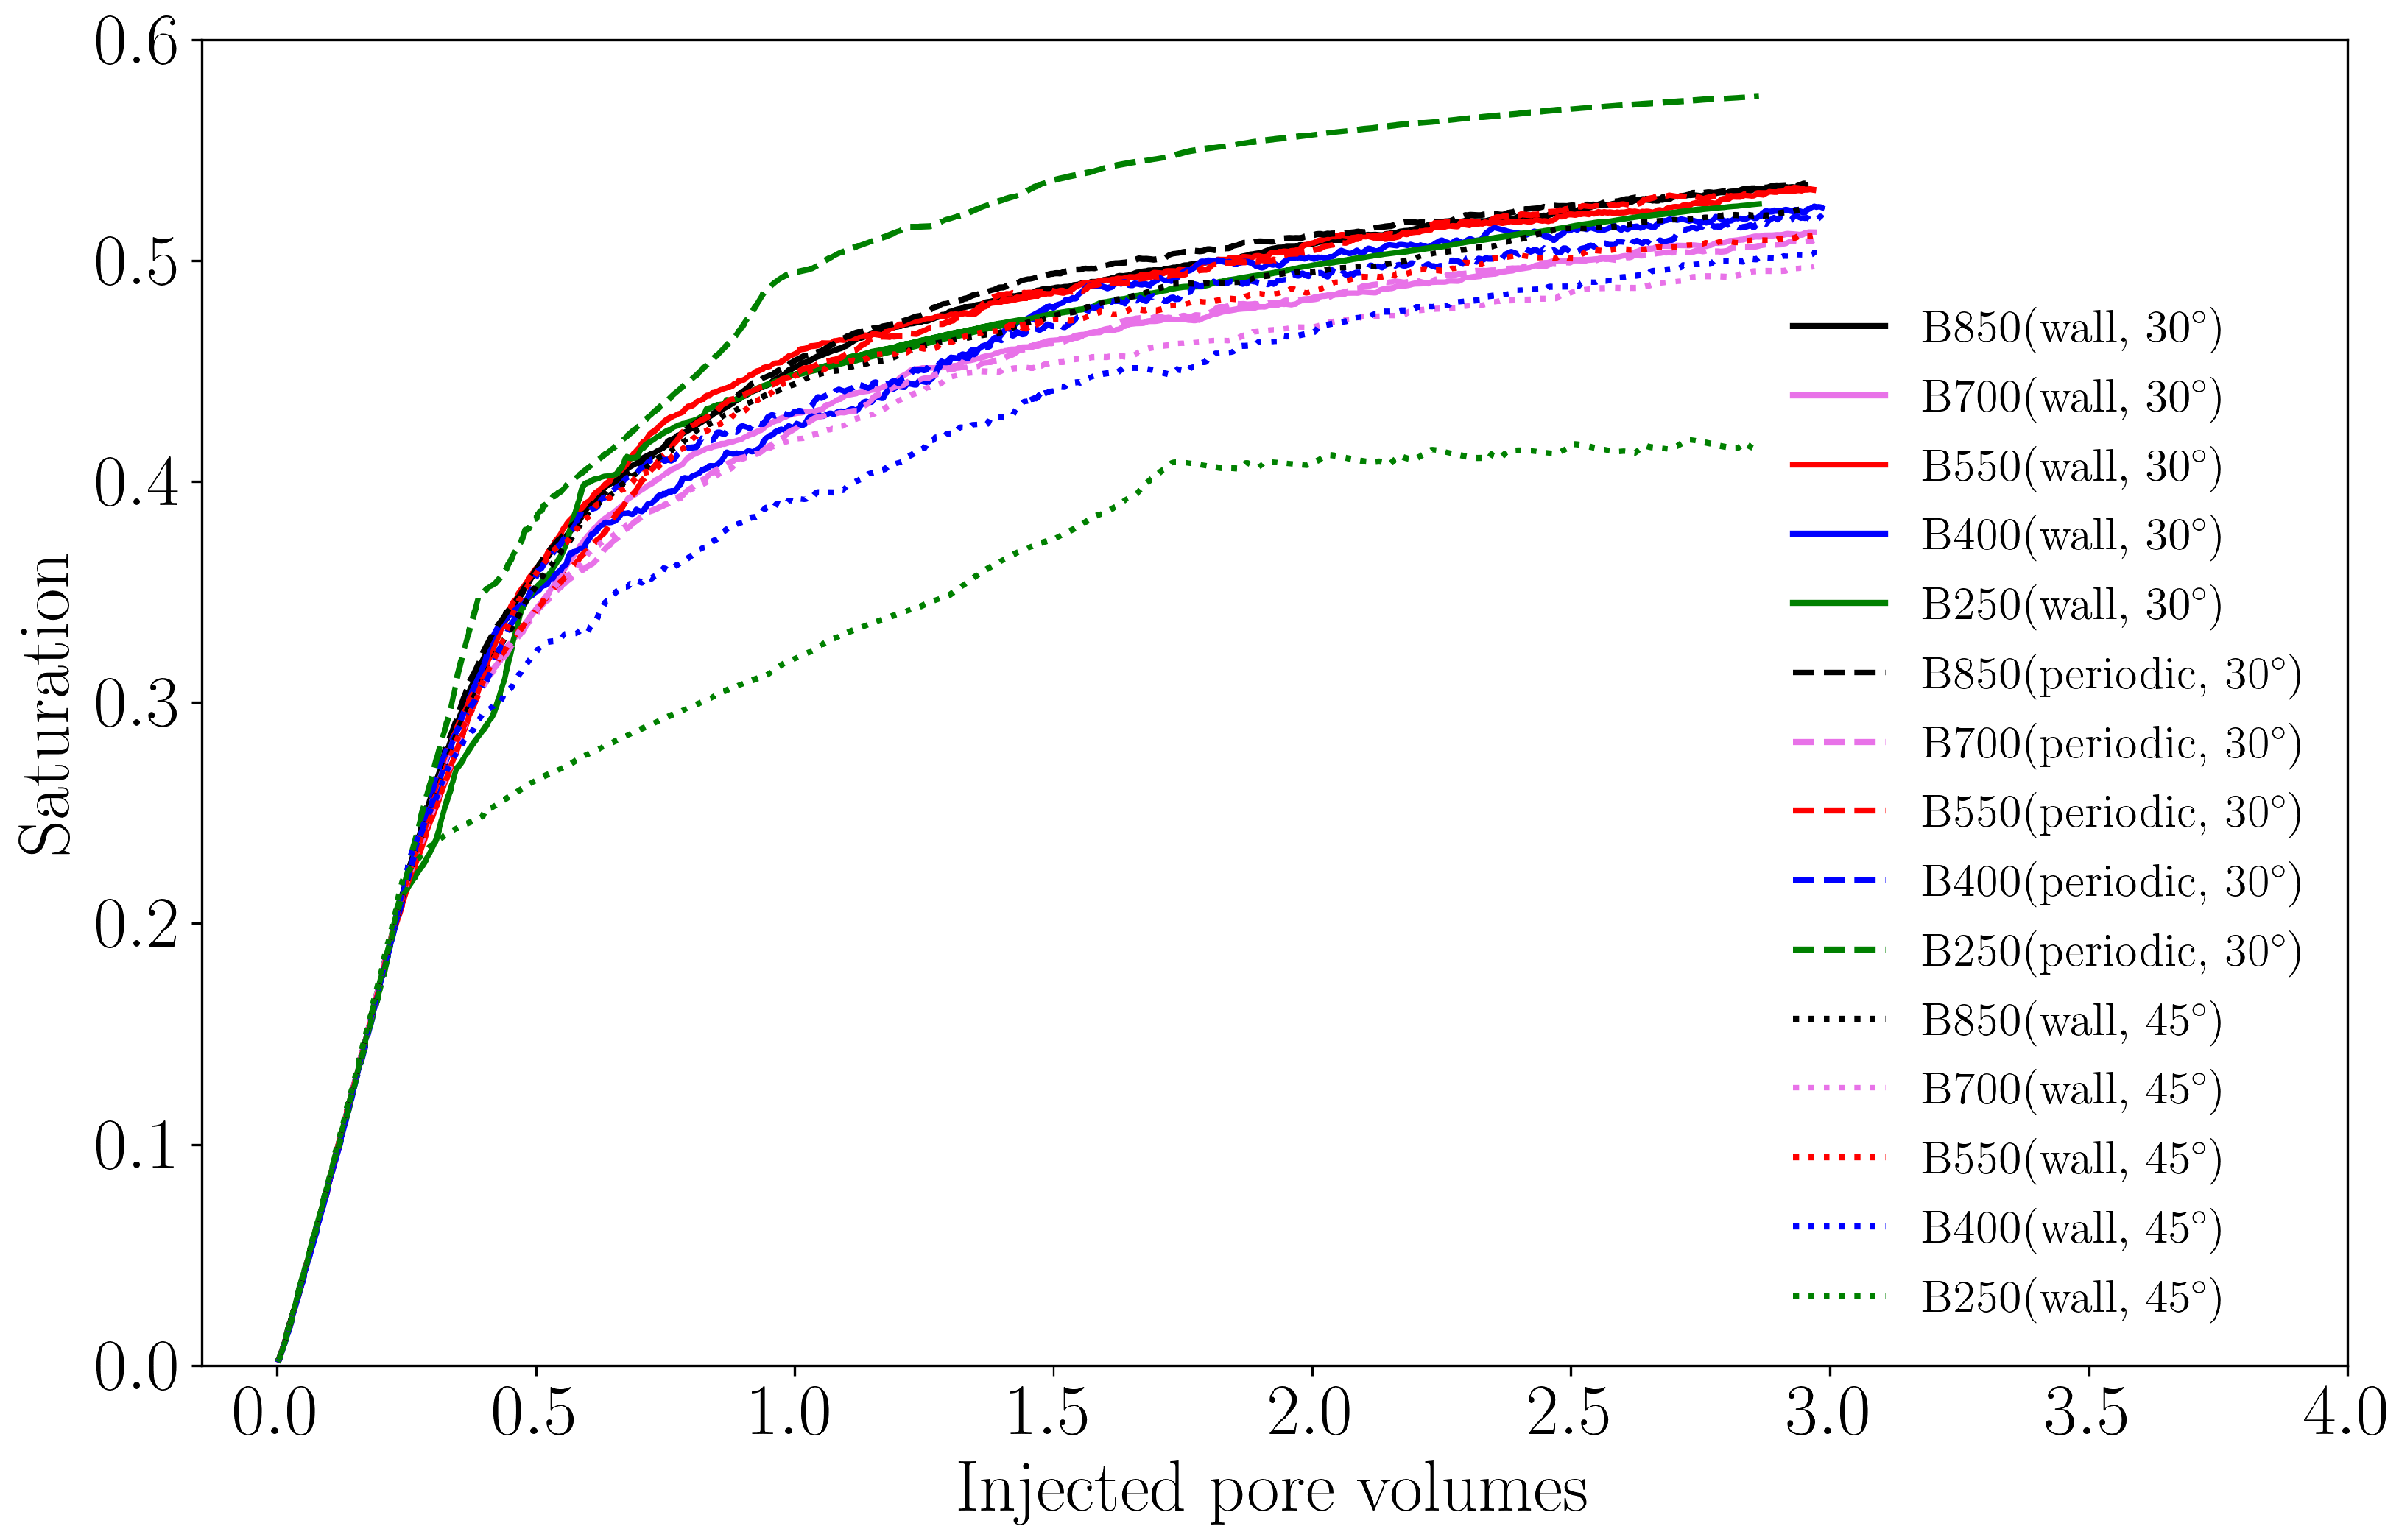
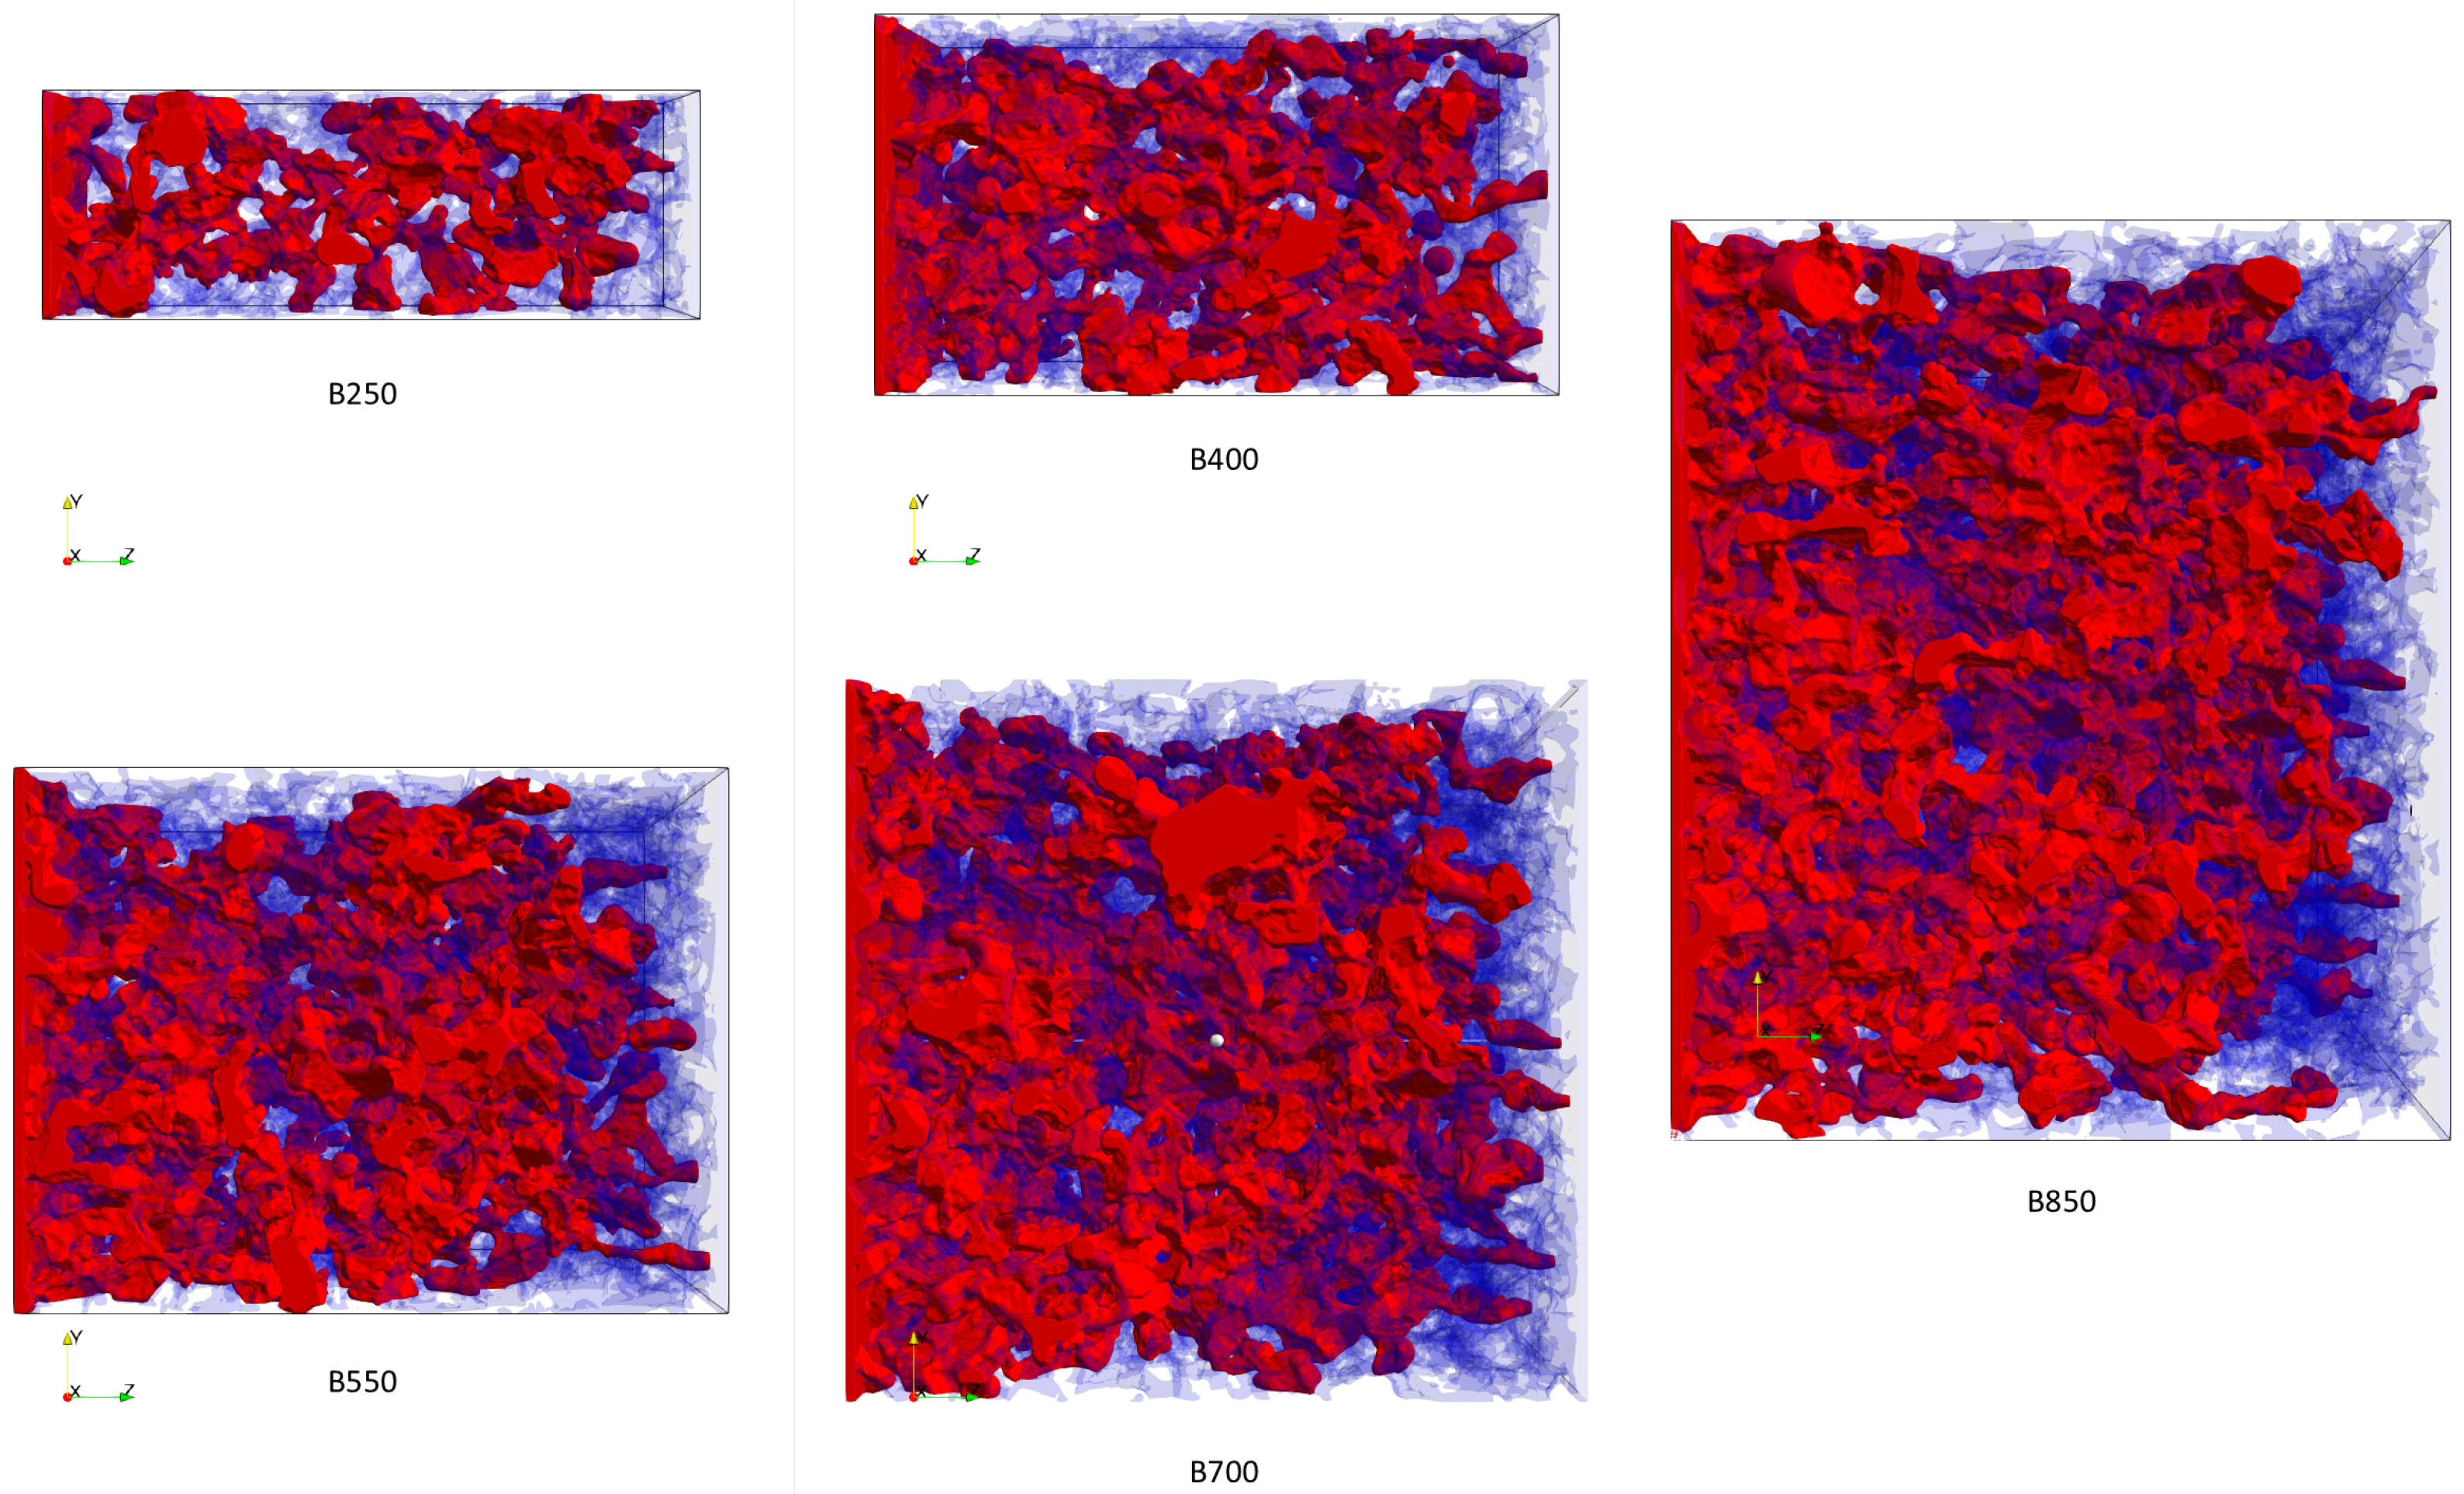
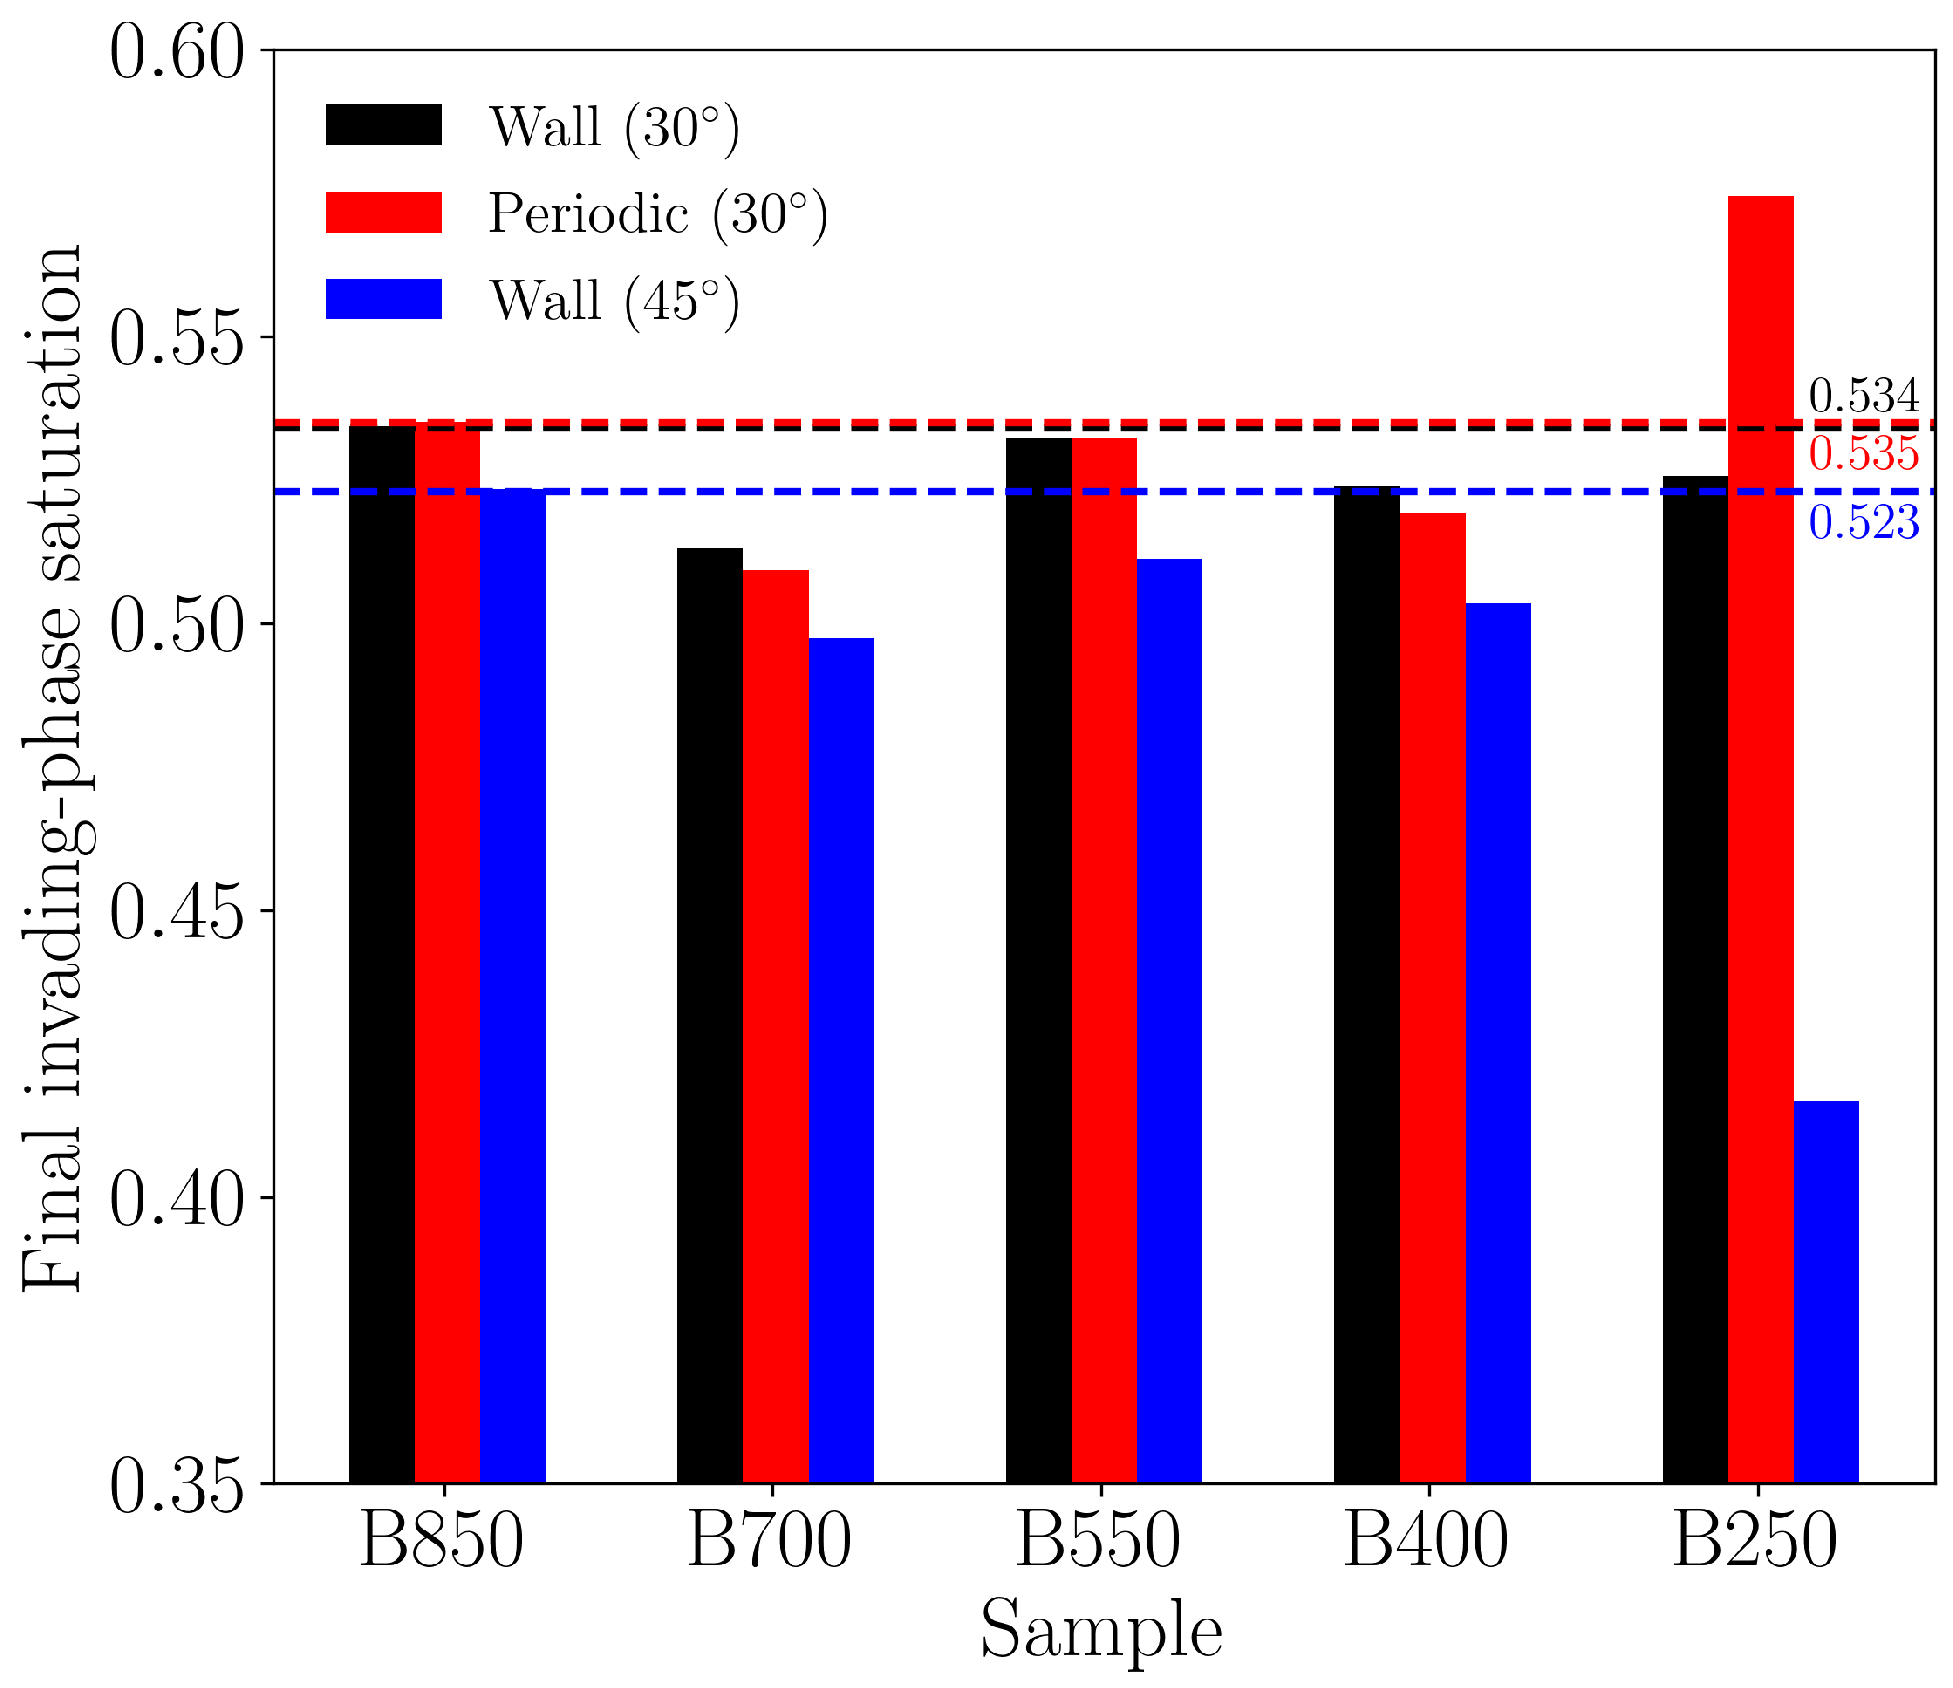
For the drainage process, we simulate the displacement of water by supercritical CO2 ( s c C O 2 ). Figure 6 presents the evolution of invading-phase saturation for the five Bentheimer samples with varying transverse dimensions. After 4 million iterations (corresponding to the injection of 3 pore volumes), all simulations reach steady state, as indicated by the plateauing of the saturation curves. Figure 7 displays the steady-state fluid distributions for the five samples with no-slip boundary conditions applied to the side boundaries and a contact angle of 30°. Distinct capillary fingering patterns are evident in all cases, which is expected given the high viscosity ratio and low capillary number. Figure 8 summarizes the final non-wetting phase saturation for each simulation.
For the cases with no-slip boundary conditions at the side boundaries and 30° contact angle, the maximum saturation difference between different samples is about 4%. One may argue that the side boundary effects are negligible in these cases. When the contact angle is increased to 45°, the non-wetting phase saturation for all samples decreases slightly, while case B250 shows significantly lower saturation than the other four samples. For the cases with periodic boundary conditions at the side boundaries and 30° contact angle, no significant difference in non-wetting phase saturation is observed among samples B850, B700, B550 and B400 compared with the no-slip boundary condition counterparts. This is due to the fact that the pore geometry is not a real periodic structure, and there are fewer shared pore networks across the quasi-periodic boundaries compared to the interior. The non-wetting phase has to overcome large capillary forces due to the misaligned pores to flow across the quasi-periodic boundaries. Sample B250 shows higher saturation than the other four samples. Overall, sample B250 exhibits the most significant deviation from the other four samples, in two of the three groups of simulations as indicated by the green lines in Figure 6. This suggests that the side boundary effects are more pronounced in smaller samples, particularly in the case of B250.
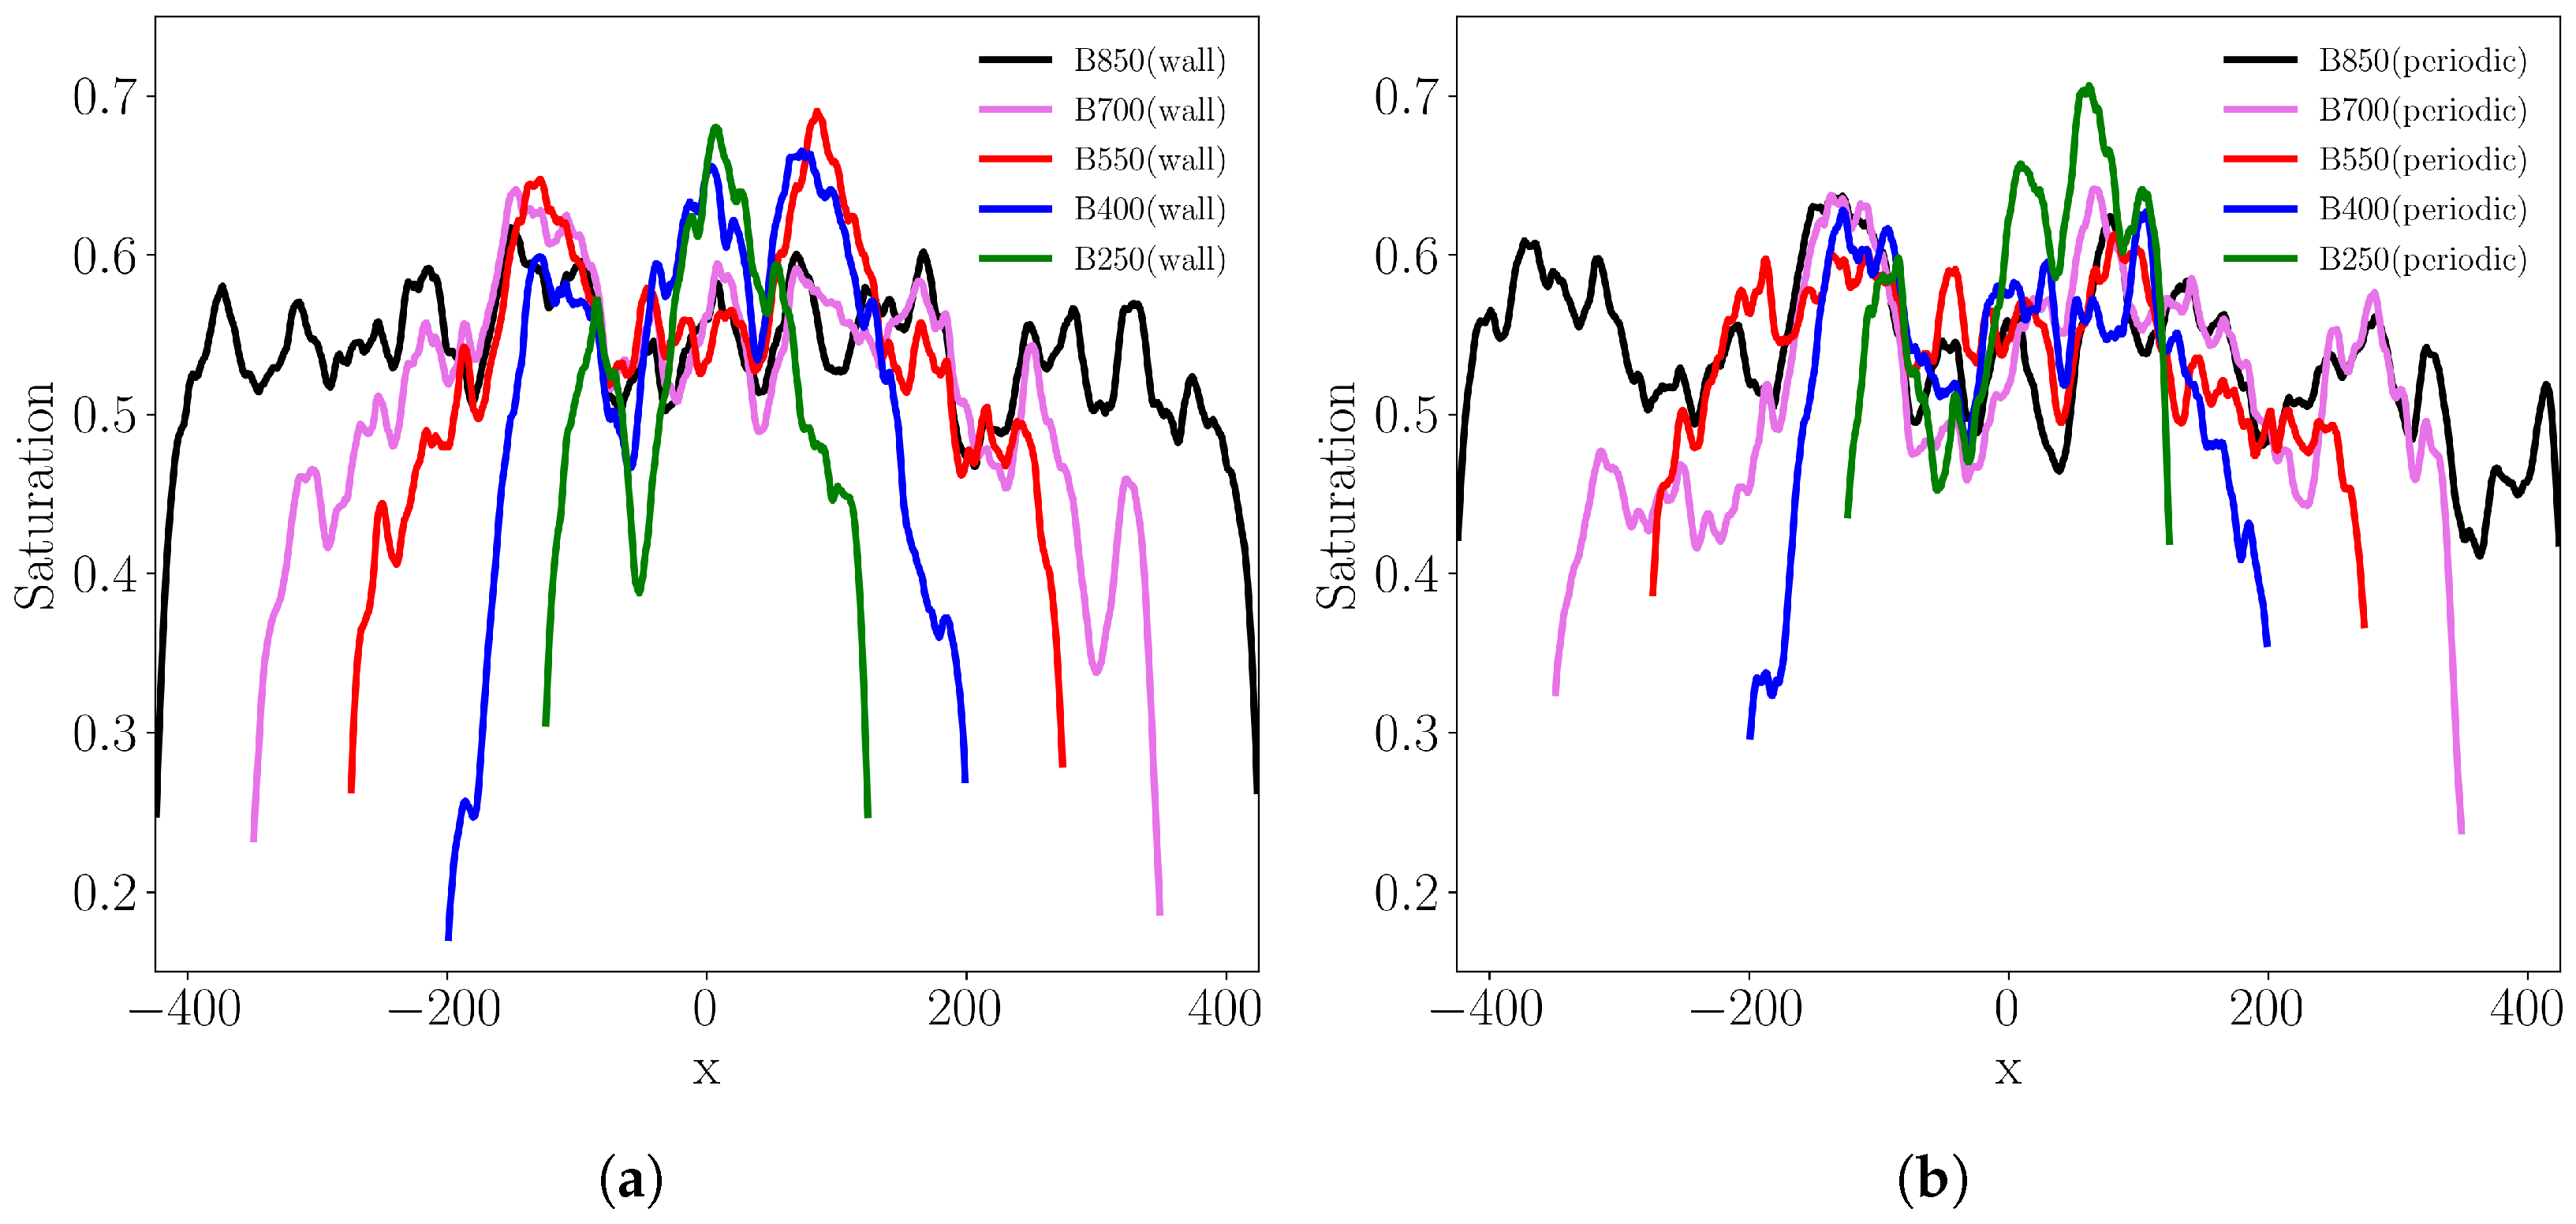
In order to further investigate the side boundary effects, we examine the transverse saturation profile in the x direction by integrating saturation over the y z plane, as shown in Figure 9. The saturation profiles are significantly affected by the boundary conditions applied at the side boundaries. Due to blocked flow near the side boundaries, the non-wetting phase saturation is considerably lower in these regions, as shown in Figure 9a, leading to increased trapping of the wetting phase. Enforcing periodic boundary conditions on the side boundaries slightly mitigates this effect, as shown in Figure 9b, but the improvement is small due to the poor pore-space connectivity across the periodic boundaries. Non-wetting phase fluid still have a difficult time pass through the limited shared pores across the quasi-periodic boundaries. Meanwhile, both cases show that the middle region of the domain has higher saturation than the baseline sample, indicating that the side boundary effects extend into the interior of the domain. This effect is more pronounced in smaller samples, as seen in the results for B250. One explanation for this observation is that significant more wetting-phase is trapped near the side boundaries, the invading non-wetting phase with constant flowrate is squished into the middle region of the domain, leading to higher saturation there. Therefore, despite the difference between overall final saturation values being small, the fluid distribution within the domain is significantly influenced by the side boundaries, especially in smaller samples.
Figure 10 shows the difference of phase distribution fields between the baseline sample B850 and the other subsamples, with no-slip wall boundary conditions at the side walls and 30° contact angle. The yellow region, which roughly indicates the direct side boundary effects region, shows that the fluid phase distribution is significantly altered by the presence of the walls, trapping more wetting phase than the baseline sample at the same location without walls. In the middle region of the domain, the phase distribution is also affected as more non-wetting phase is present in the subsample. This observation is consistent with the saturation profiles shown in Figure 9a.

4.1.3. Results of Imbibition Simulations

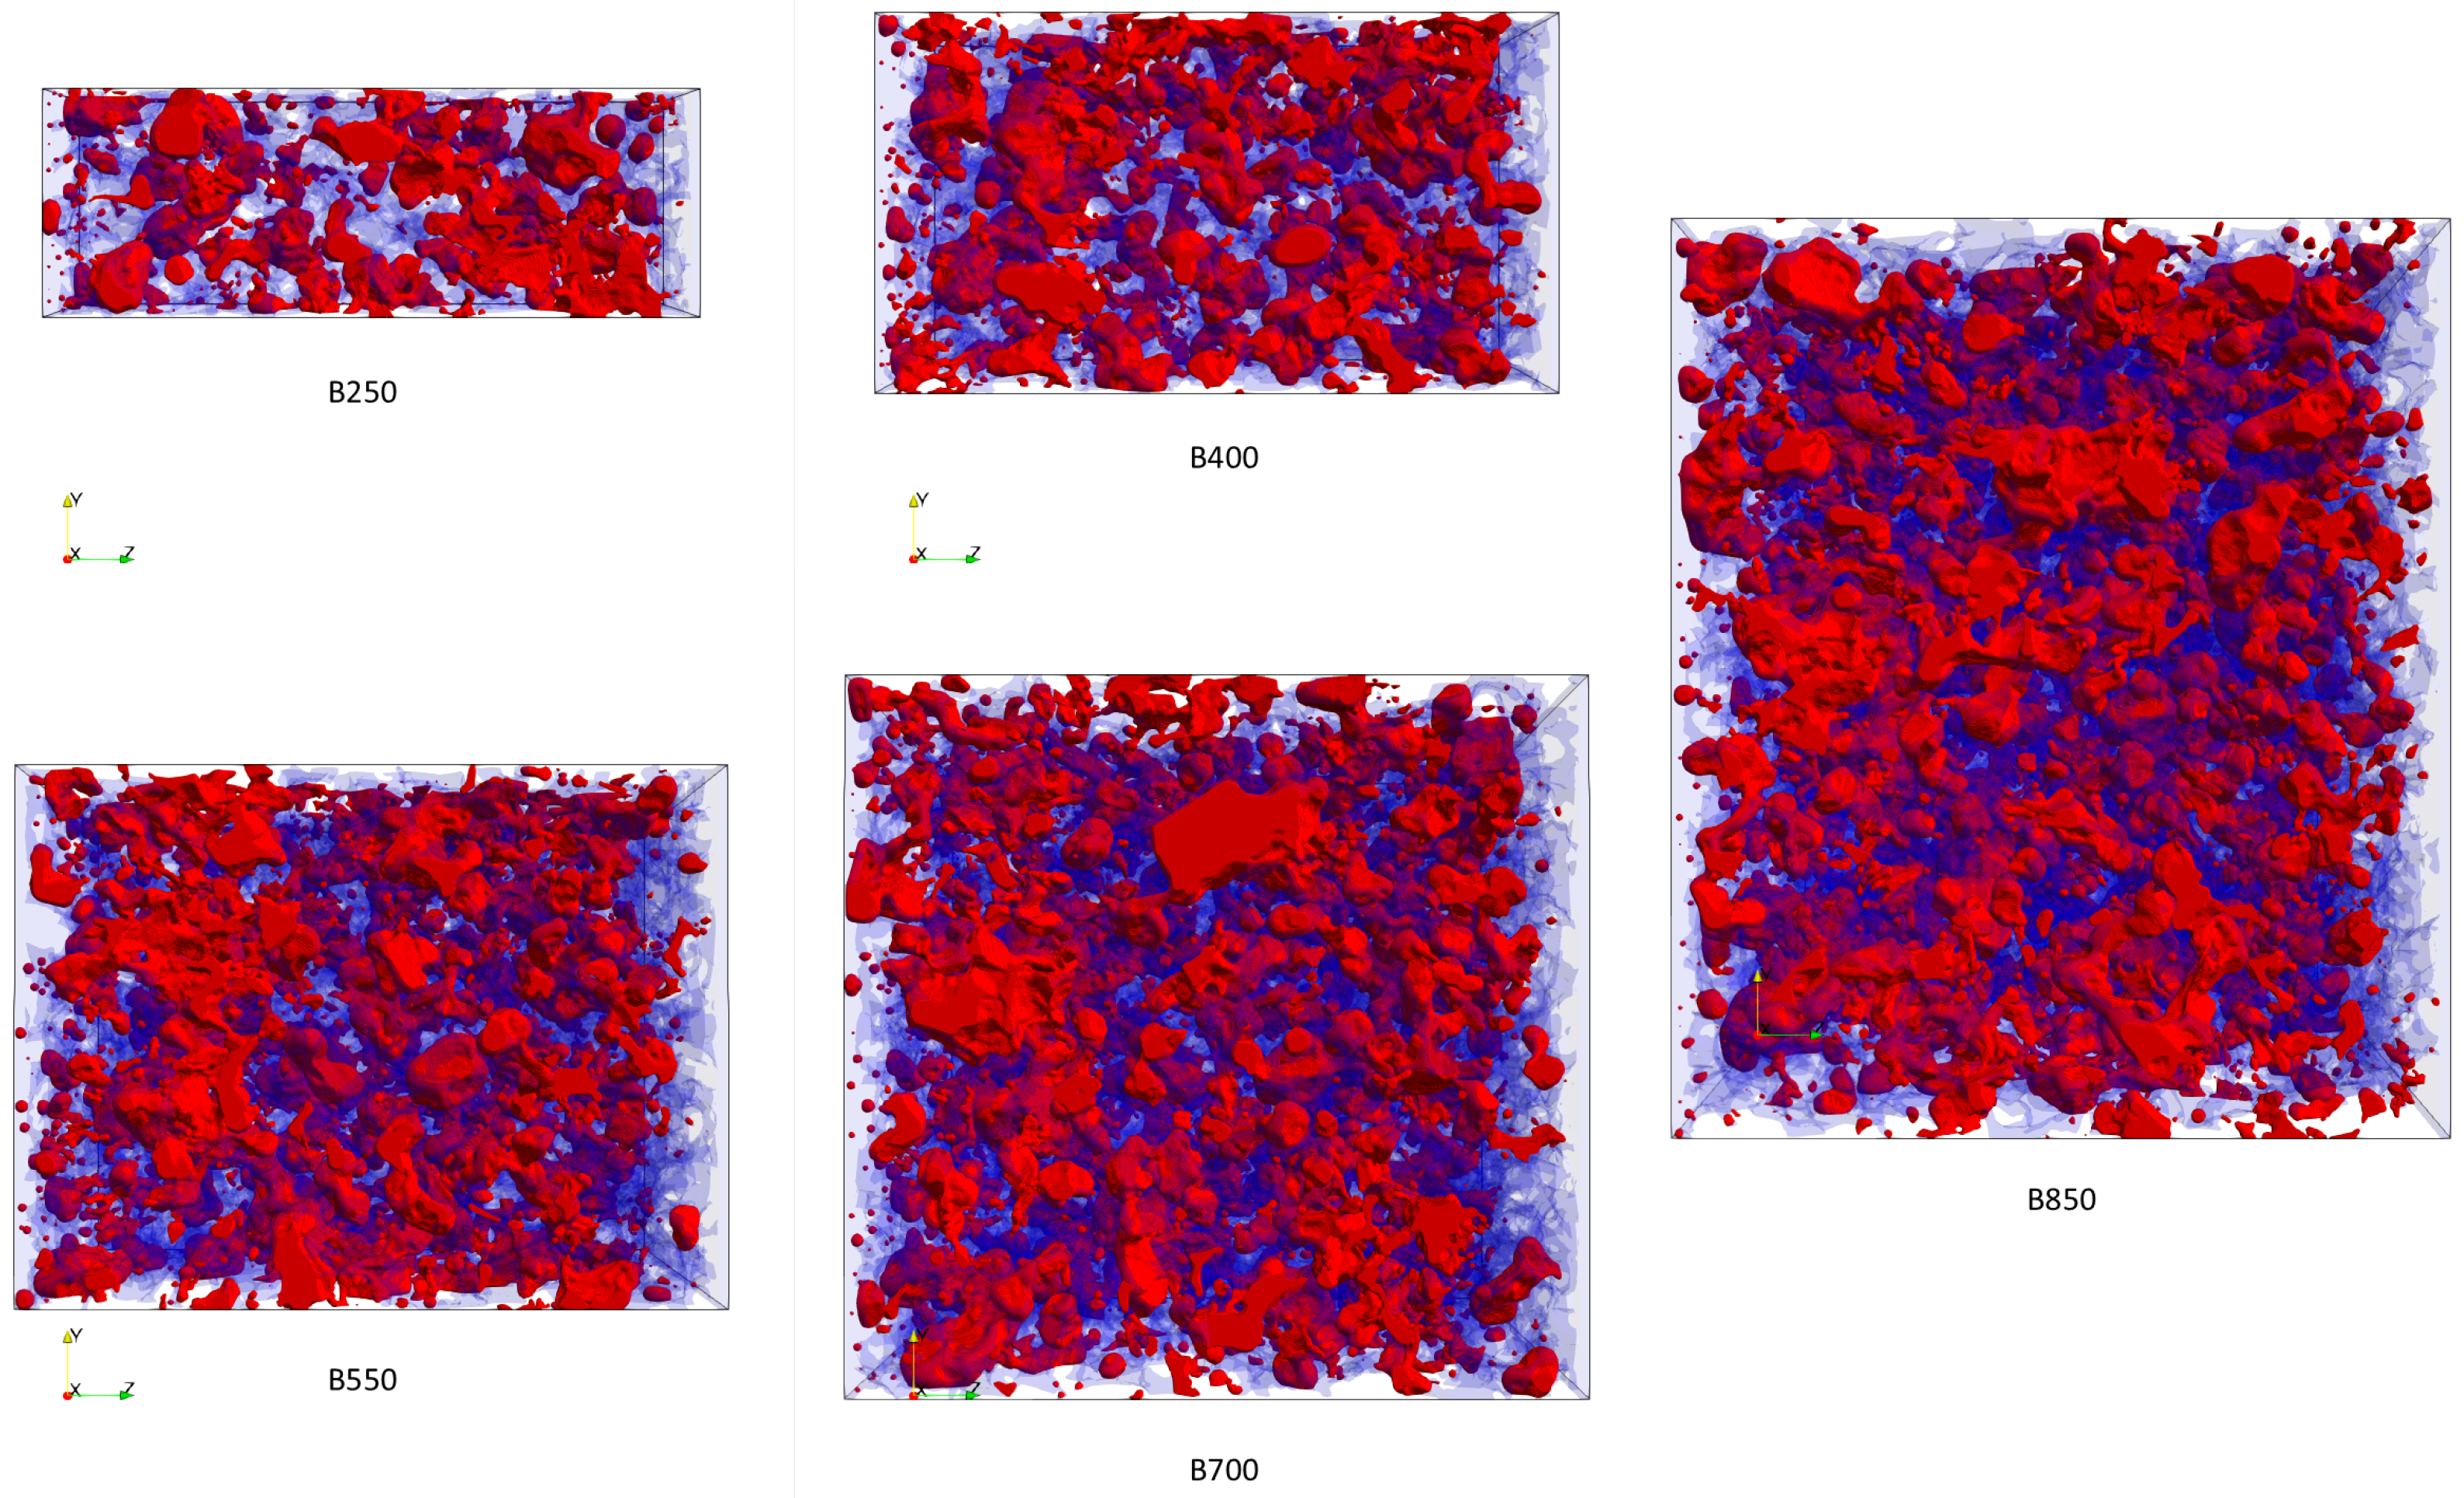
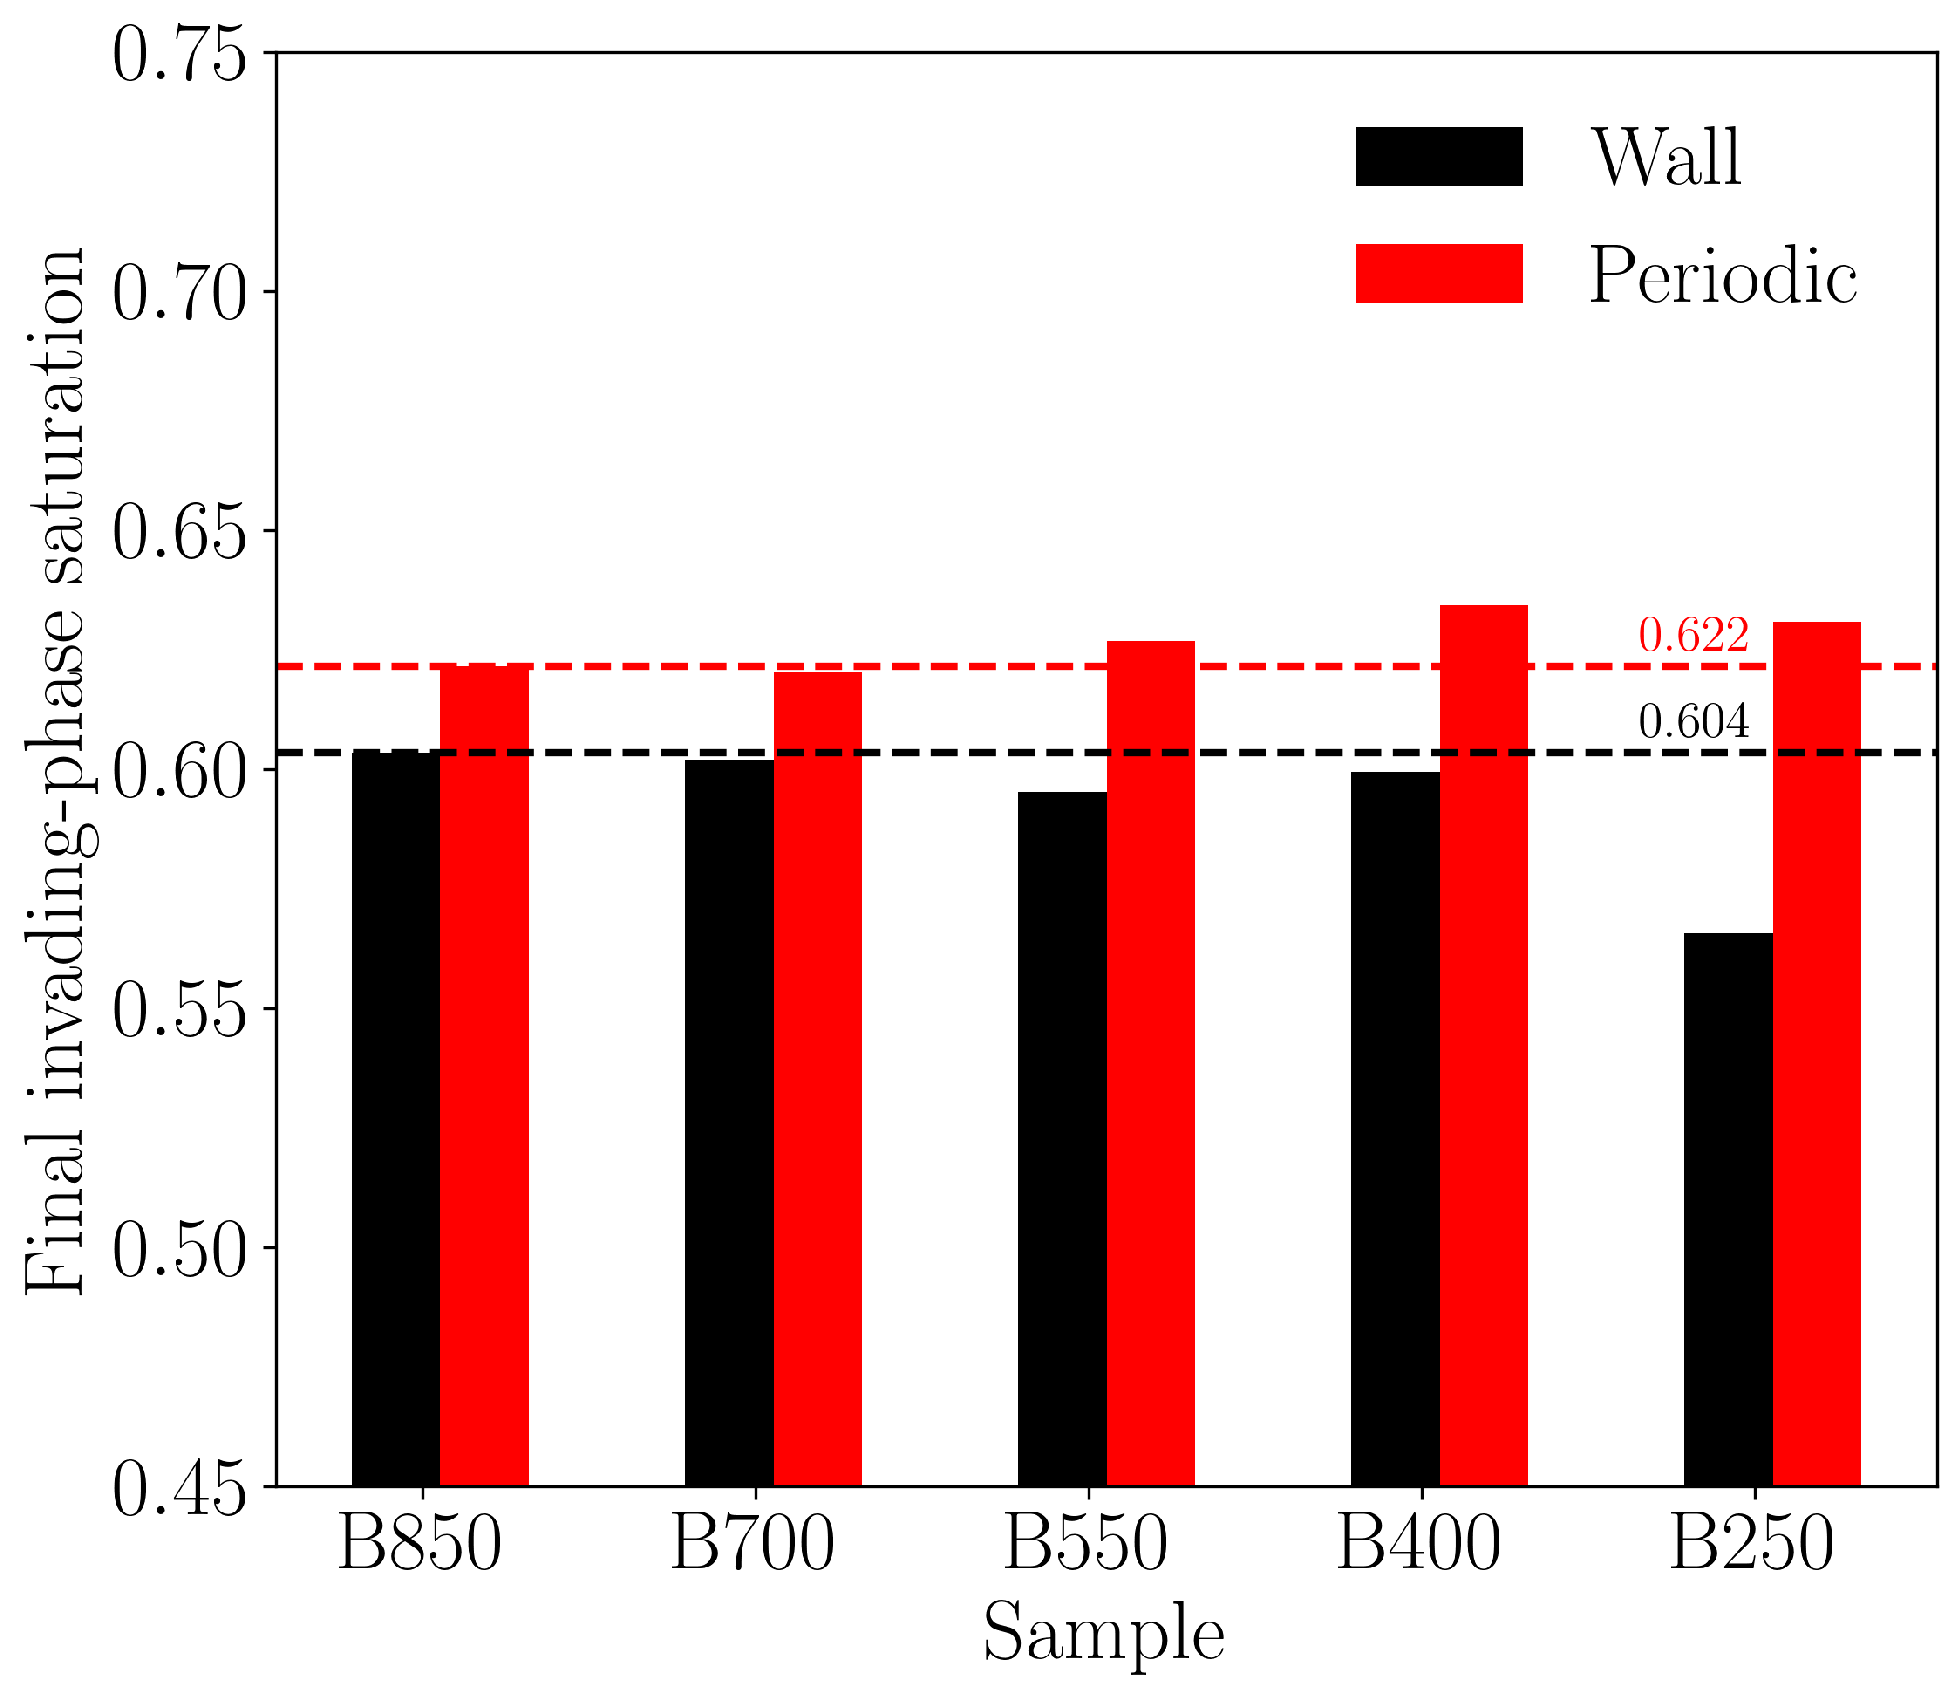
For the imbibition process, we simulate the displacement of oil by water. Figure 11 shows the evolution of invading-phase, water, saturation during imbibition processes for the five Bentheimer samples with different transverse dimensions. After 2 million iterations (equivalent to injecting 1.5 pore volumes), all simulations reach steady states, as indicated by the plateauing of saturation curves. Figure 12 shows the fluid distribution at steady state for the five samples with no-slip boundary conditions applied on the side boundaries. The residual non-wetting phase is relatively evenly distributed throughout the domain, with some isolated clusters trapped in the pore space. Figure 13 shows the final non-wetting phase saturation for the different simulations.
In contrast to the drainage cases, those with periodic boundary conditions at the side boundaries show noticeable higher wetting phase saturation than those with no-slip wall boundary conditions. Despite misalignment of pore structures across the quasi-periodic boundaries, the capillary forces drive the invading wetting phase across the quasi-periodic boundaries, while in the drainage cases, the non-wetting phase has to overcome the capillary forces to pass through the limited shared pores across the quasi-periodic boundaries. The variations between different samples for the same type of boundary condition are relatively small, except for the small sample B250 with no-slip wall boundary conditions, which shows noticeable lower wetting phase saturation than the other four samples.
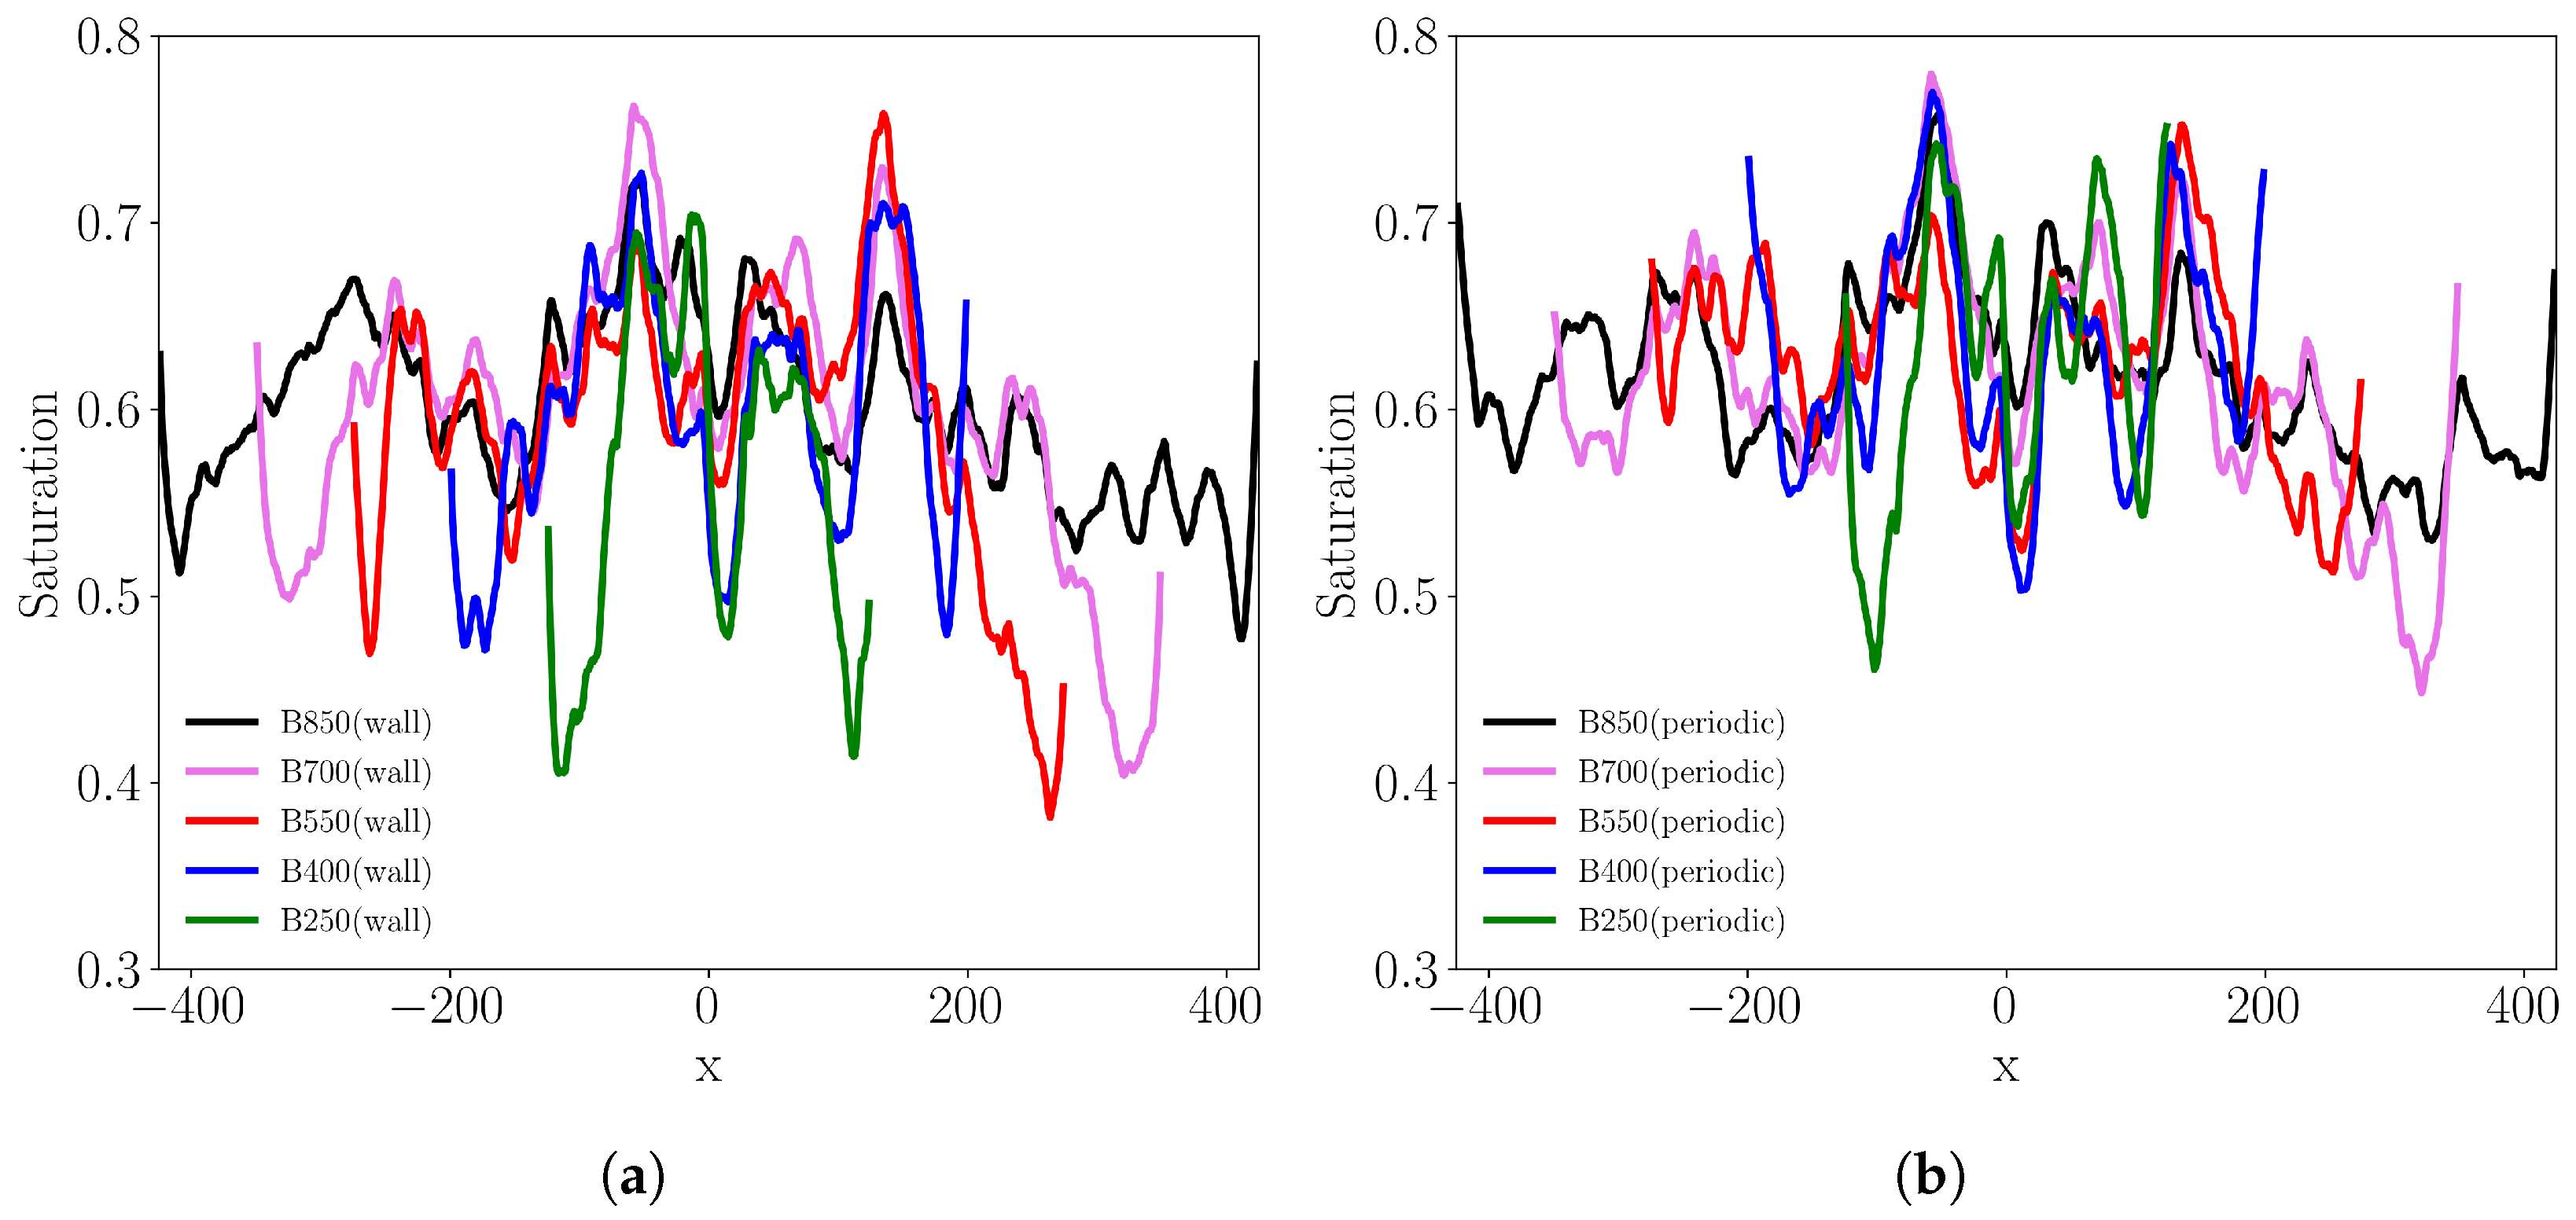
Figure 14 shows the transverse wetting phase saturation profile in the x direction by integrating saturation over the y z plane. For the cases with no-slip wall boundary conditions at the side walls, as shown in Figure 14a, there are steep V-shaped saturation profiles near the side walls for all samples. The invading wetting phase form film flows along the walls due to the strong wettability, leading to high saturation near the walls. The saturation decreases sharply from the peak value at the wall to a valley point within a short distance, and then gradually increases towards the middle region of the domain. Unlike the drainage cases, the middle region of the domain does not show noticeable higher saturation than the baseline sample. This is likely because the invading wetting phase can easily flow along the walls, and the side boundary effects do not extend far into the interior of the domain. For the cases with periodic boundary conditions at the side walls, as shown in Figure 14b, there are also the V-shaped saturation profiles near the side walls, but the saturation peaks near the walls are significantly higher than those in the no-slip wall cases. This is because the invading wetting phase can easily flow across the quasi-periodic boundaries due to the strong wettability, potentially displacing more non-wetting phase out of the adjacent pores.
Overall, the saturation profiles in imbibition cases are also significantly altered near the side boundaries, forming steep V-shaped profiles near the boundaries, regardless of the type of boundary conditions applied. Away from the side boundaries, the saturation profiles seems more consistent across the domain between the different samples compared to the drainage cases, indicating that the side boundary effects do not extend far into the interior of the domain in imbibition processes.
Figure 15 shows the difference in fluid phase distribution between the baseline sample B850 and the other subsamples at steady state in imbibition simulations with no-slip wall boundary conditions at the side boundaries. Similar to the drainage cases, the yellow region, which roughly indicates the direct side boundary effect region, shows that the fluid phase distribution is significantly altered by the presence of the side no-slip walls. Large amounts of the red regions can be observed near the side walls, which is reflected by the steep V-shaped saturation profiles near the side walls compared to the regular profiles of the baseline sample without boundary effects, as shown in Figure 14a. Also, blue regions can be observed close to the side walls, which reflects the high saturation peaks near the walls in Figure 14a. In the middle region of the domain, the phase distribution is also affected as shown by the existence of large amounts of both red and blue regions in the middle region of the domain, with no clear trend of more wetting or non-wetting phase.

4.2. Two-Phase Flow Simulations on a Synthetic Tight Sandstone

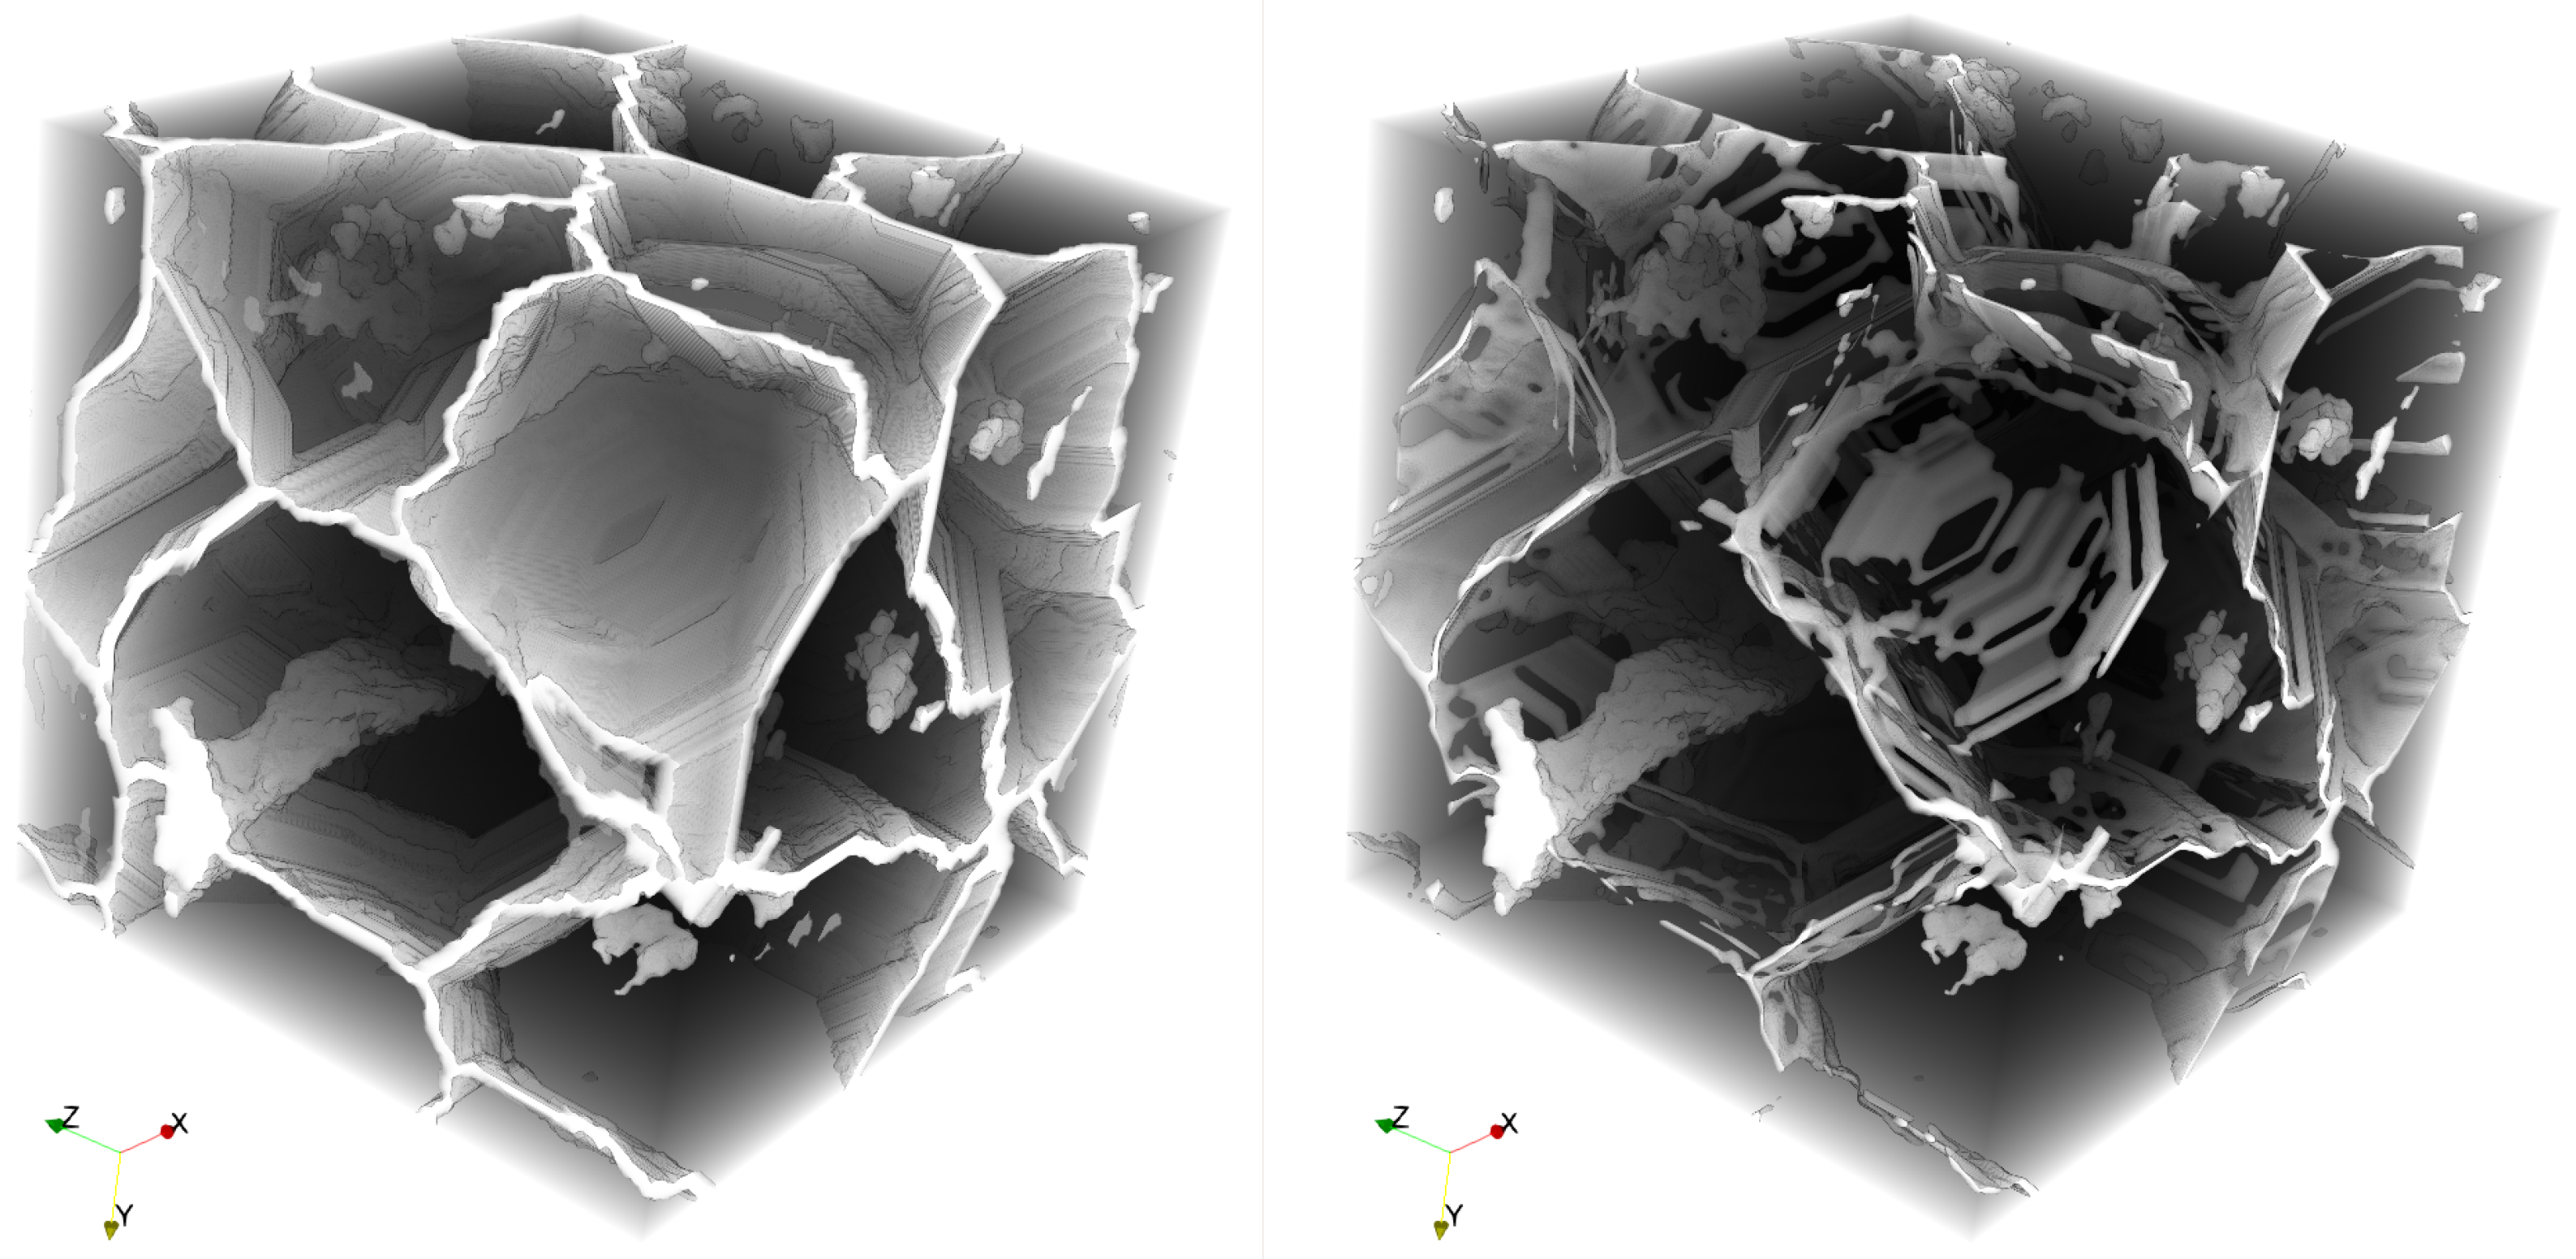
Tight sandstones are characterized by low porosity and permeability, making them challenging for fluid flow and hydrocarbon recovery. Nevertheless, they have become important unconventional reservoirs in recent years [42]. Due to the high heterogeneity and complex pore structures of tight sandstones, micro-CT imaging often fails to capture the fractures between grains where most of the fluid flow occurs, while FIB-SEM imaging can only provide very small samples with limited pore volumes. In this section, a synthetic periodic tight sandstone-like porous structure is generated, where the fractures are created via grain growth and surface gap distance check with periodic boundary conditions. The reason of choosing a periodic structure is to completely eliminate the side boundary effects which enable us to perform a comparison between the results with and without side boundary effects. By dilating or eroding the solid phase in the synthetic rock, we can further alter the sample’s porosity and permeability. Figure 16 shows the initial fracture network created by grain growth and gap distance check, and the final synthetic tight sandstone sample after dilating the pore space. The dimensions are 1200 × 1200 × 1200 voxels, with a resolution of 0.1 µm per voxel. The final sample has a porosity of 4.1% and an absolute permeability of 0.72 mD.
In this case, we simulate the displacement of methane gas by water. The fluid properties and flow conditions are summarized in Table 4. Simulation settings are similar to those used in the Bentheimer sandstone cases, with constant velocity boundary condition imposed at the inlet, convective boundary condition at the outlet. The total number of iterations and injected pore volumes are also listed in Table 4.
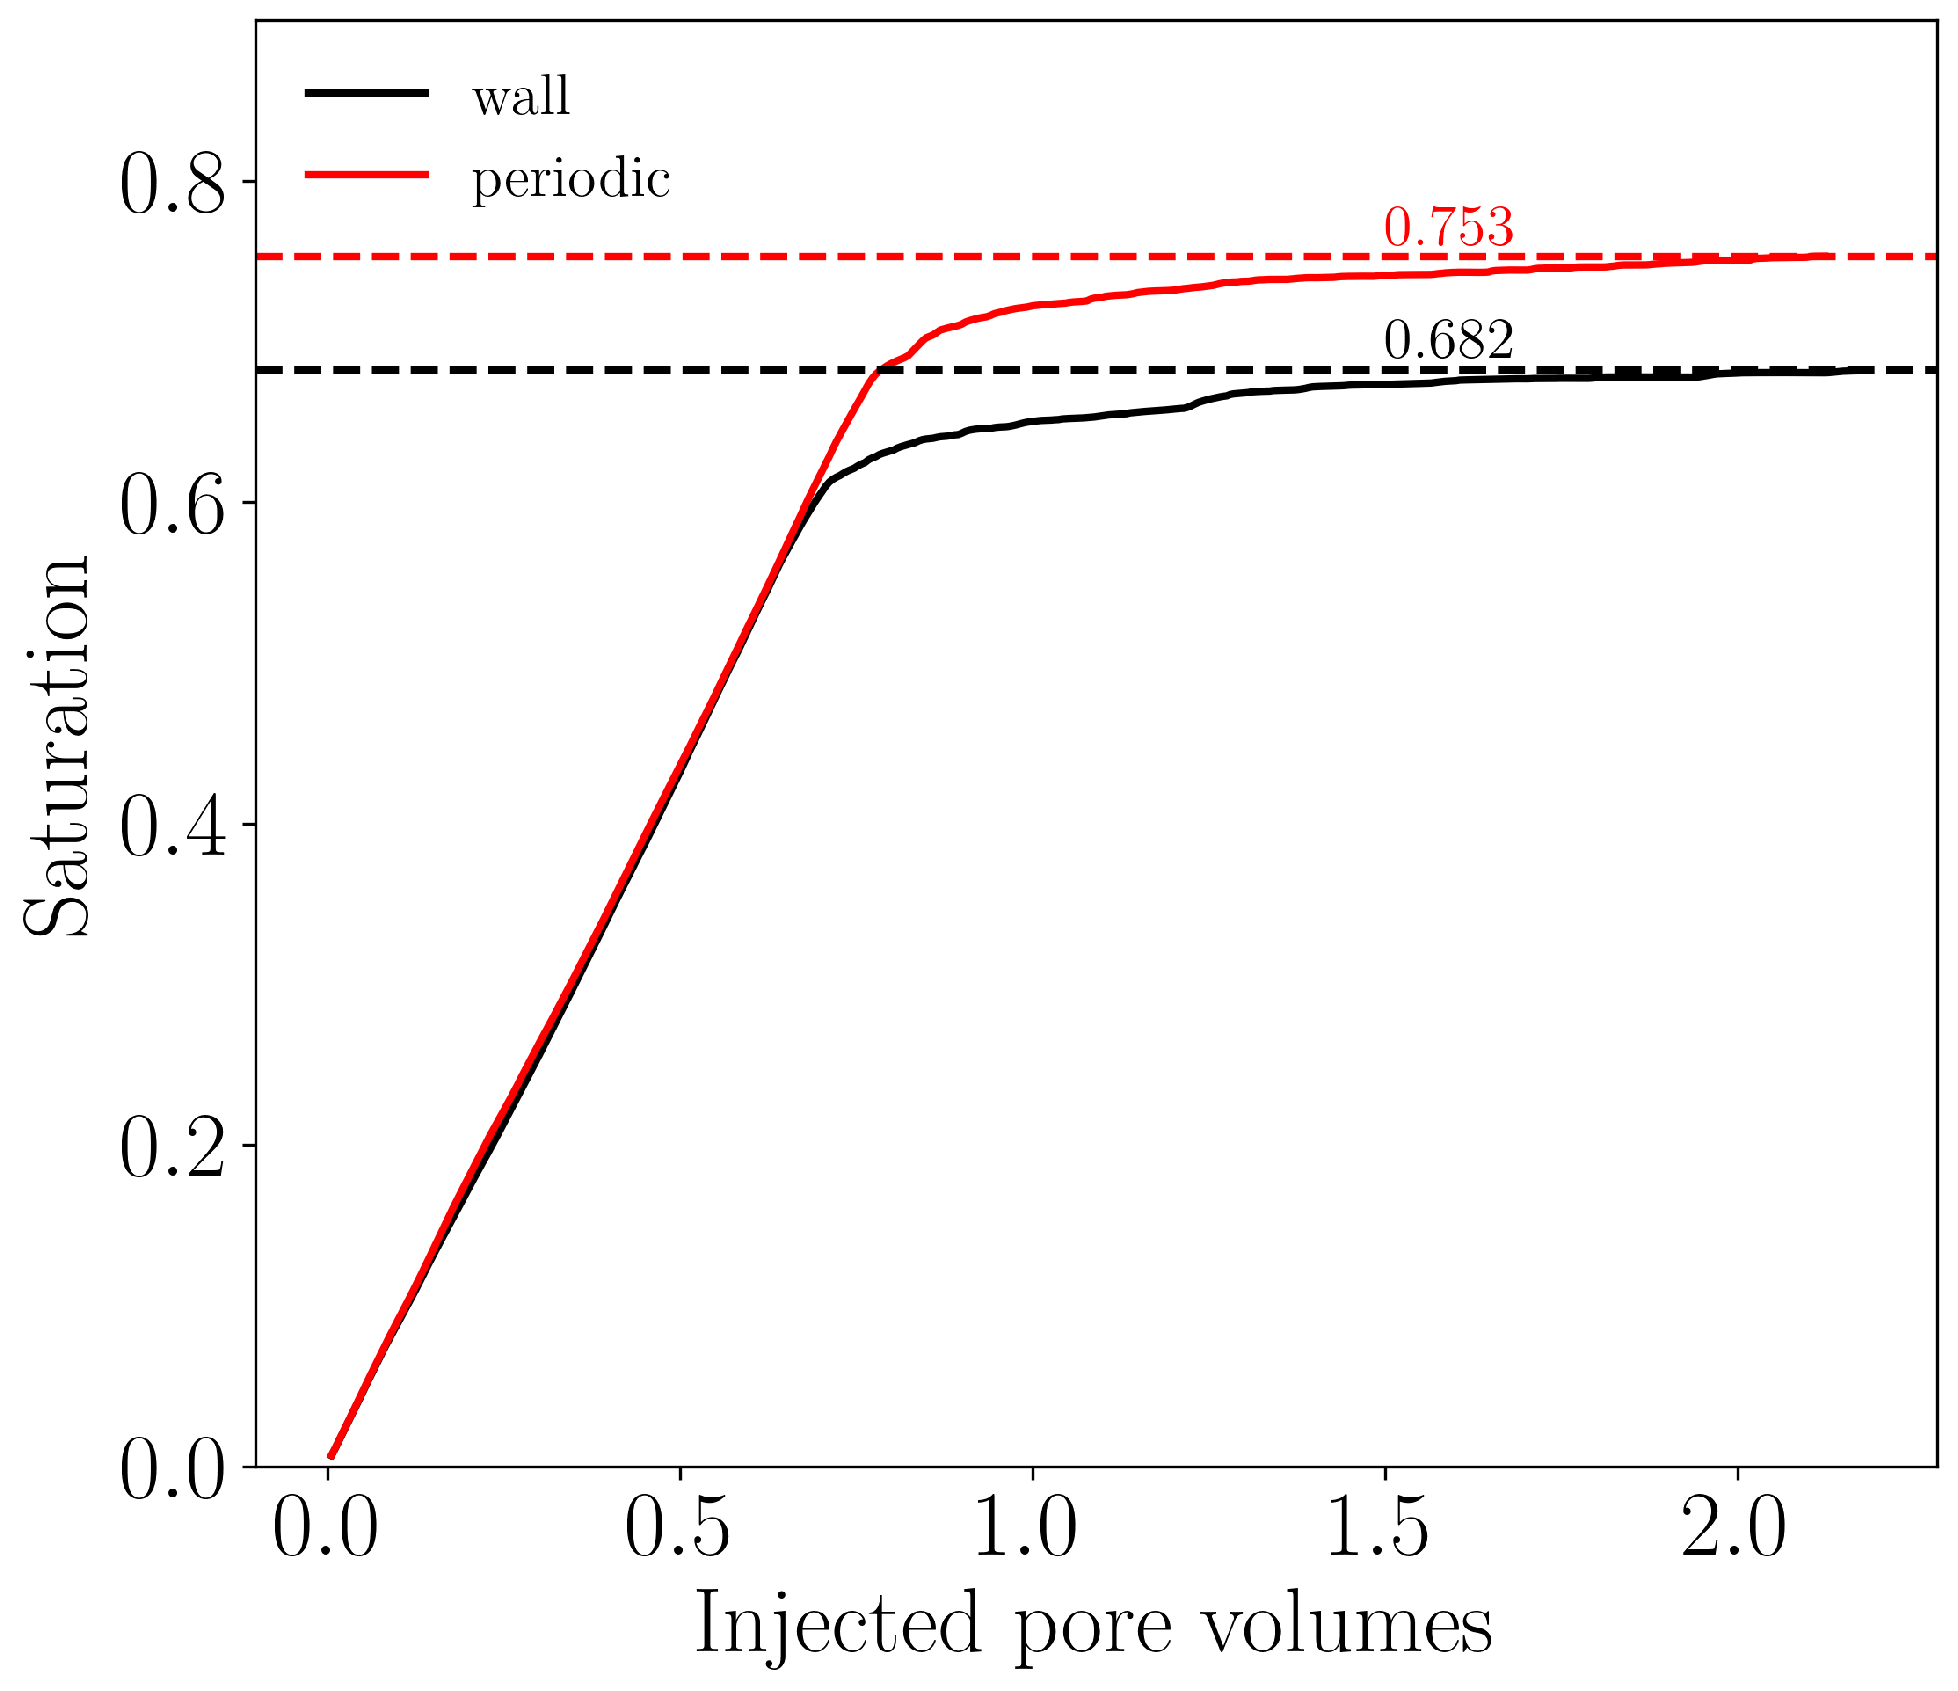
Figure 17 shows the evolution of phase saturation during imbibition processes for the synthetic tight sandstone sample with different boundary conditions applied on the side boundaries. After 2 million iterations (equivalent to injecting 2 pore volumes), both simulations reach steady states, as indicated by the plateauing of saturation curves. The final wetting phase saturation is 0.071 or 10% higher in the case with periodic boundary conditions than in the case with no-slip wall boundary conditions.
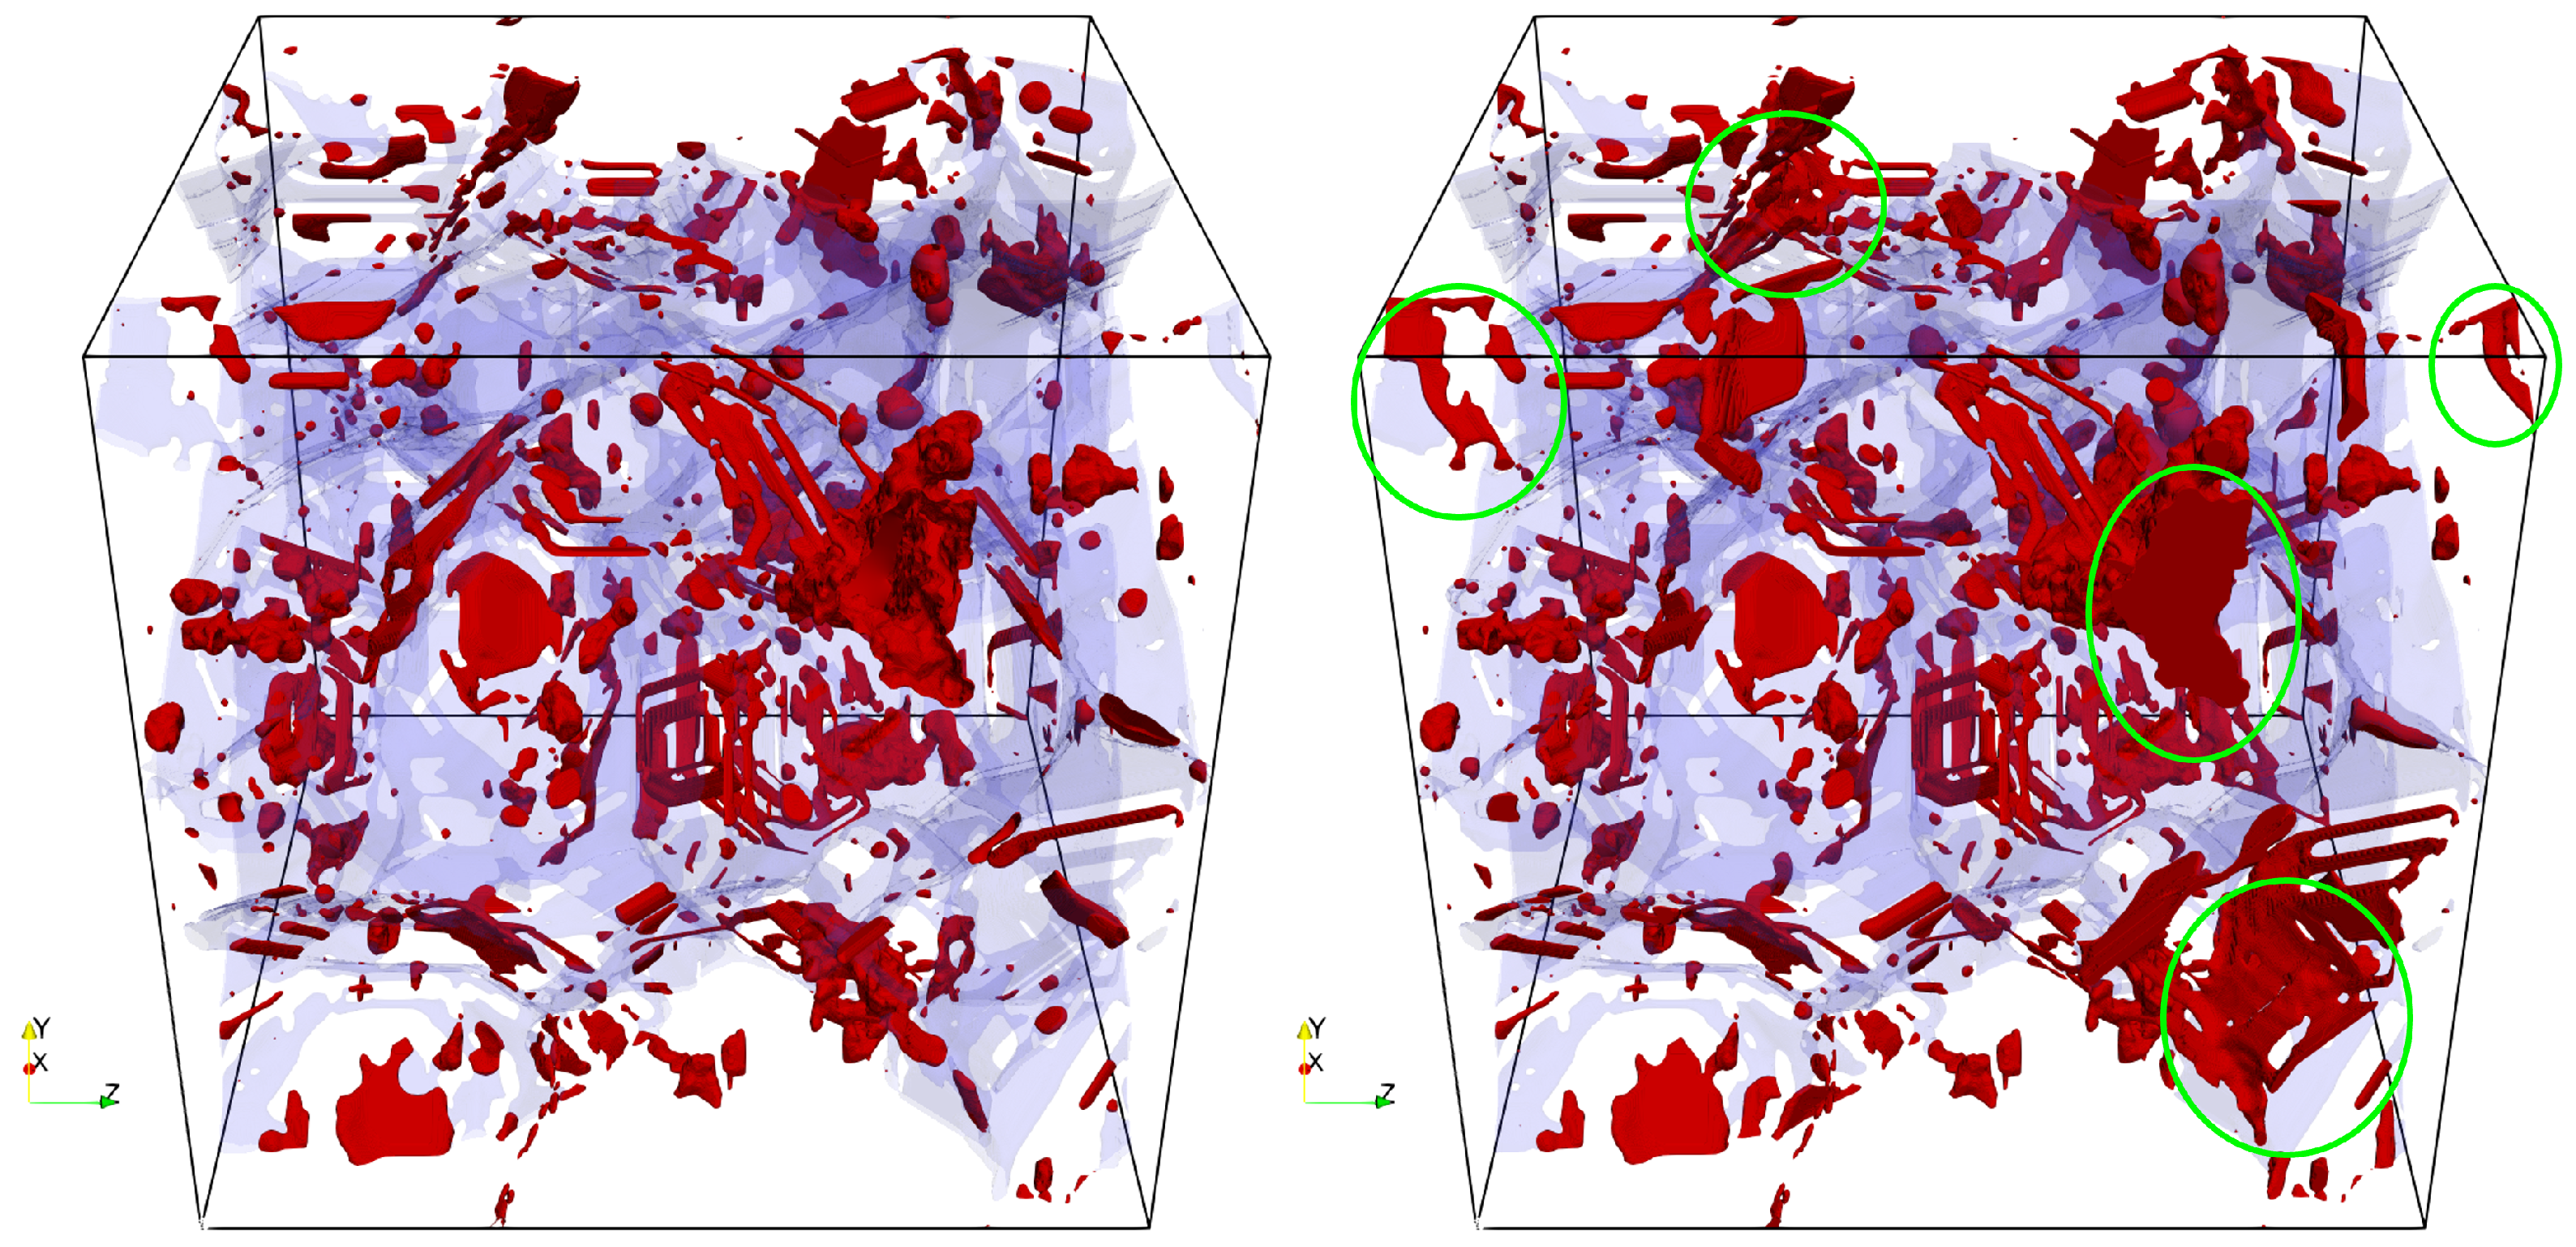
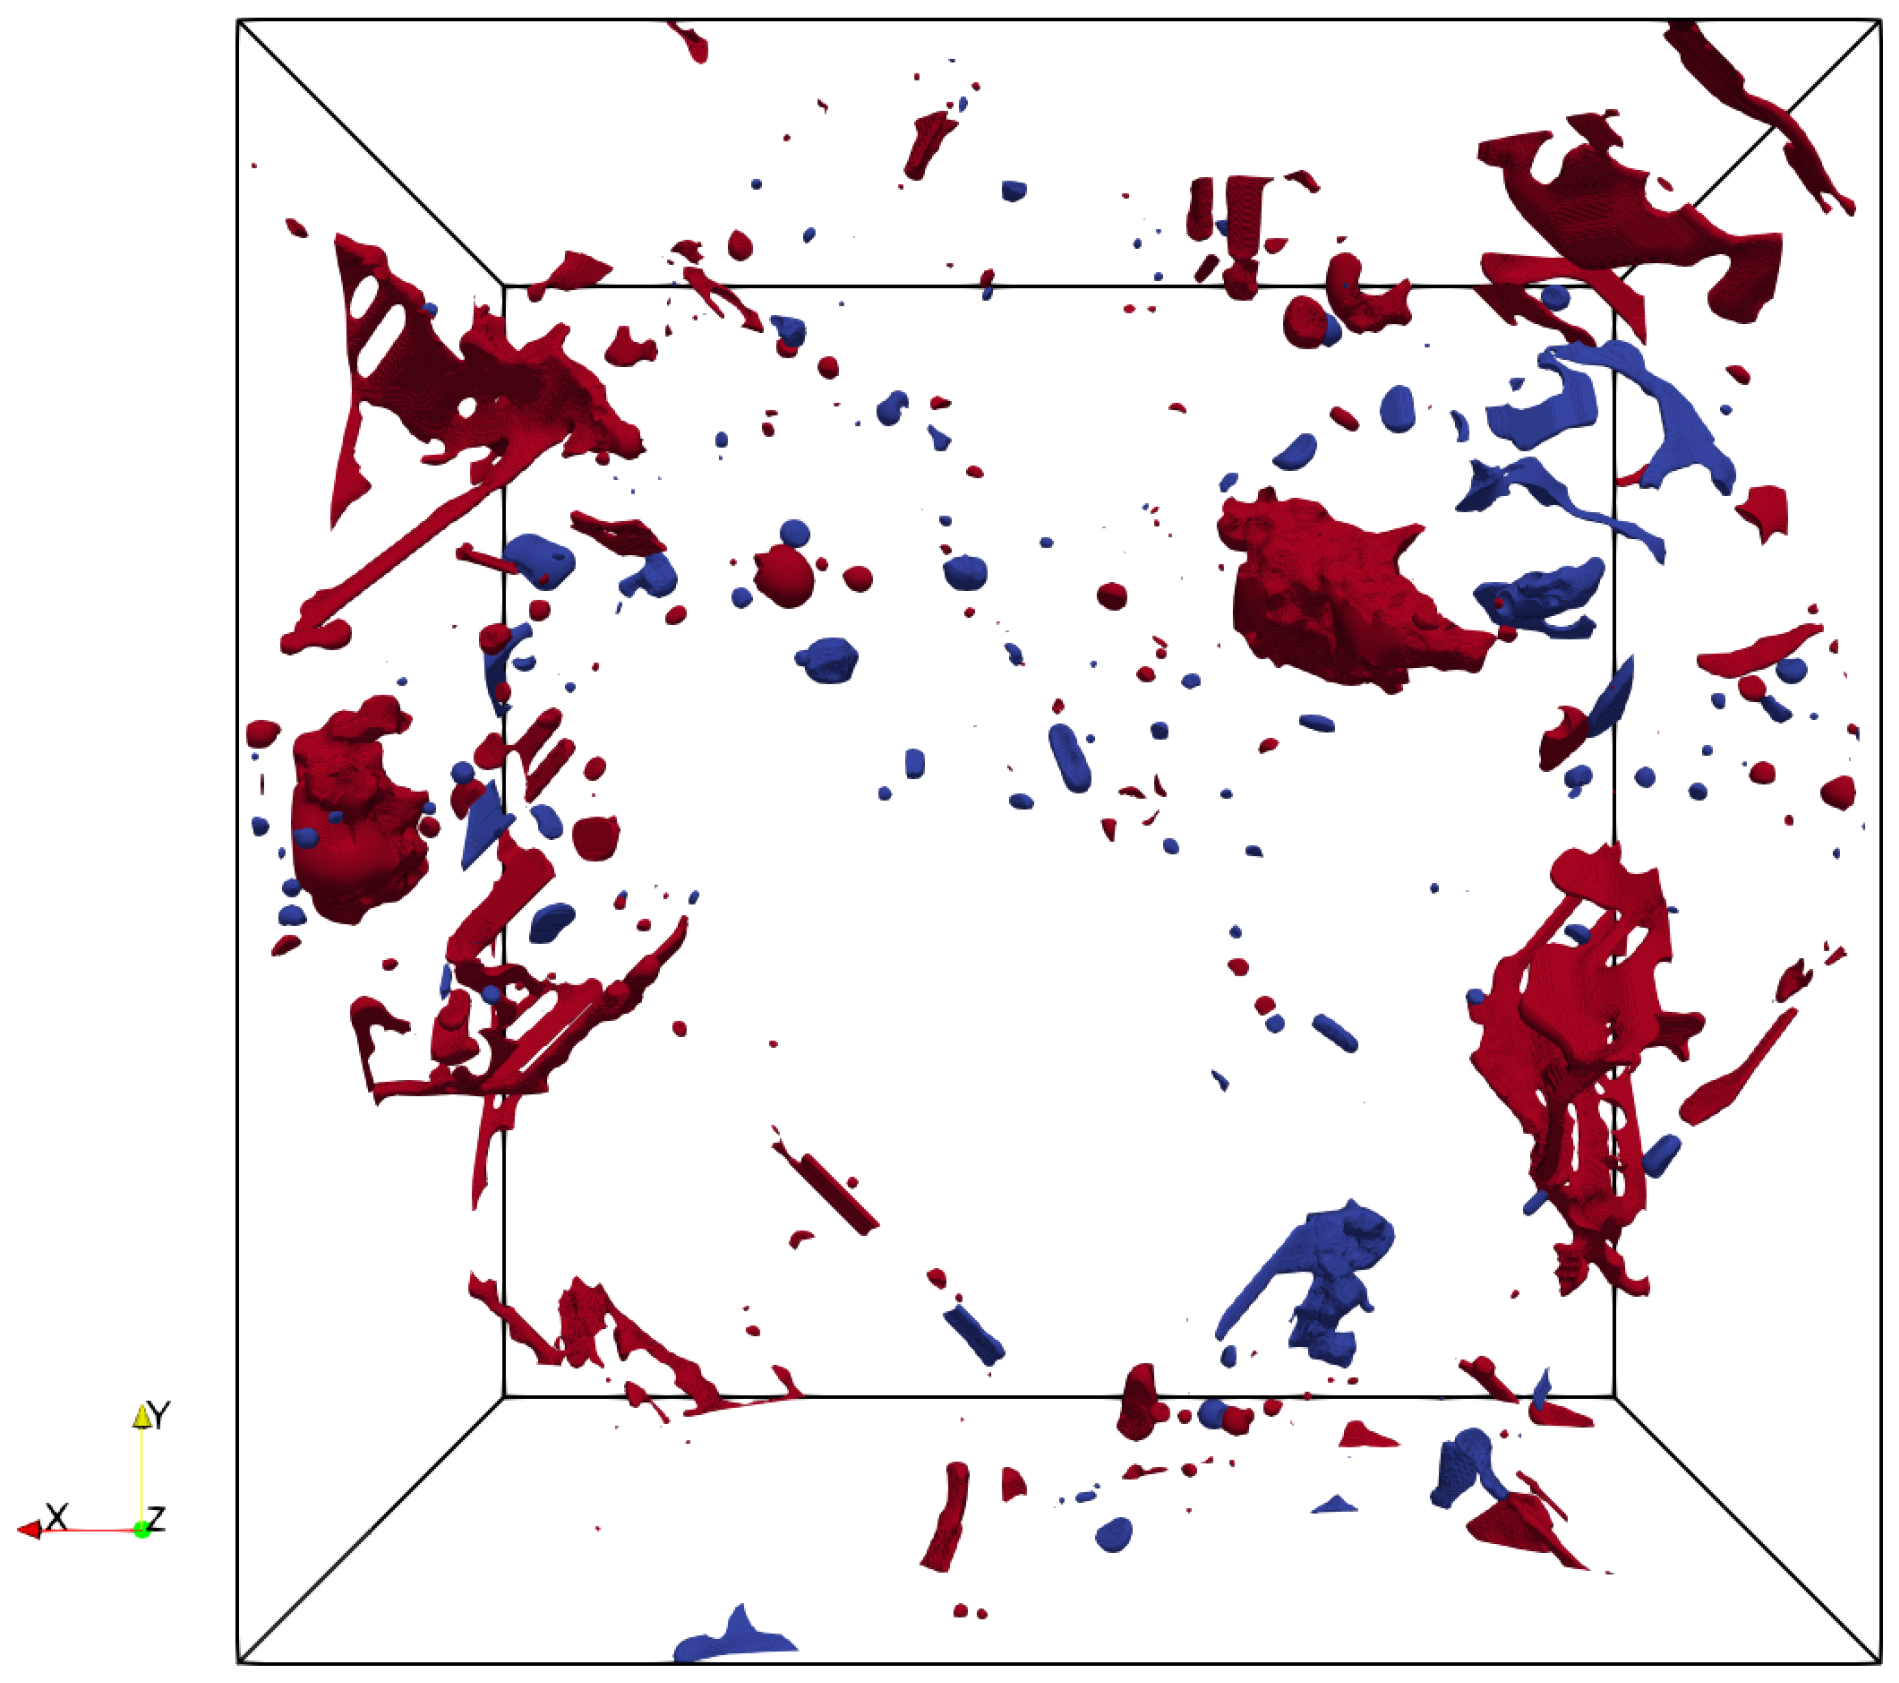
Figure 18 shows the residual non-wetting phase distribution at steady state in the imbibition simulations on the synthetic tight sandstone sample. It can be observed that the case with no-slip boundary conditions applied to the side boundaries shows significantly more non-wetting phase trapped in the pore space than the case with periodic boundary conditions. Figure 19 shows the difference between the fluid phase fields of the two imbibition simulations on the synthetic tight sandstone sample with different boundary conditions applied to the side boundaries at steady state, which further highlights the difference in phase distribution between the two cases is mostly near the side boundaries.
Overall, side boundary effects are pronounced in the synthetic tight sandstone sample, which is characterized by low porosity and permeability. This results in substantial differences in both final saturation and fluid phase distribution, even though the sample contains more than one billion voxels (1200 × 1200 × 1200 voxels). For samples with poor pore connectivity, the presence of no-slip walls at the side boundaries can significantly alter flow pathways and fluid trapping mechanisms. In contrast, the periodic boundary conditions used here differ from those in Section 4.1 because the geometry is truly periodic; the periodic boundaries provide continuous flow paths for the fluids without artifacts from misaligned geometries, effectively eliminating side boundary effects.

5. Conclusions

In this study, a color-gradient lattice Boltzmann method (LBM) is applied to simulate two-phase flow in porous media. Our primary focus is to investigate the impact of boundary effects caused by no-slip walls at the transverse boundaries of the computational domain. We first validate our LBM implementation using two-phase layered flow and the capillary intrusion benchmarks, which showed strong agreement with analytical solutions across various viscosity ratios. We then apply this method to two-phase flow simulations on a Bentheimer sandstone sample and a synthetic tight sandstone sample to examine how these boundary effects influence steady state saturation and fluid distribution.
Present results show that side boundary effects can significantly alter fluid distributions, especially in smaller samples and those with low porosity and permeability. In the drainage simulations of the Bentheimer sandstone, no-slip side walls lead to more trapped wetting-phase fluid near the boundaries. This effect is pronounced in smaller samples, where the central region of the domain has a higher non-wetting phase saturation compared to a larger baseline sample. Imposing quasi-periodic boundary conditions offered limited improvement due to poor connectivity across these boundaries. During imbibition, the invading wetting phase formed film flows along the walls, creating steep, V-shaped saturation profiles. However, unlike drainage, these effects did not extend far into the domain’s interior, and the saturation profiles in the central region are more consistent across different sample sizes.
In the synthetic periodic tight sandstone case side boundary effects are significant even with over one billion voxels. The presence of no-slip walls trapped a substantial amount of non-wetting phase, resulting in a 10% lower wetting-phase saturation compared to simulations with true periodic boundary conditions.
To mitigate side boundary effects, one common strategy is to use a sufficiently large computational domain. However, despite advances in high-performance computing, simulating two-phase flow in large porous media samples is still computationally demanding. Academic researchers often have limited access to such resources, and many simulation codes may not be fully optimized for modern hardware architectures. Consequently, it is a standard practice to use smaller subsamples extracted from larger samples to reduce computational costs. This approach, as demonstrated in Section 4, can lead to significantly altered saturation profiles and fluid distributions due to side boundary effects, even when the differences in overall saturation are small. On the other hand, many modern open-source codes [14,43,44,45,46] are highly optimized for high-performance computing, making it feasible to simulate two-phase flow in larger samples with limited resources.
For some rock samples, the limited field of view of micro-CT imaging at the required resolution makes it impractical to obtain a sufficiently large sample to minimize side boundary effects. In such cases, an alternative approach is to generate periodic synthetic rock samples. As shown in Section 4.2, using a periodic synthetic rock sample can effectively eliminate side boundary effects. The main challenge with this approach is to generate periodic rock samples that closely resemble real rocks in terms of pore structure and connectivity, while also ensuring that the periodic boundaries provide continuous flow paths for the fluids. Addressing this challenge is beyond the scope of the present work and will be explored in future studies.

Author Contributions

Conceptualization, Y.C., Q.Z. and Y.Z.; methodology, Y.C., Q.Z., Y.Z. and D.W.; software, Y.C., M.L. and D.W.; validation, Q.Z., M.L. and D.W.; formal analysis, Q.Z., M.L., D.W., X.P. and L.T.; investigation, Q.Z., M.L., X.P. and L.T.; resources, Q.Z., Y.Z., J.Y. and B.Z.; data curation, Q.Z., L.T. and X.P.; writing—original draft preparation, Q.Z. and Y.C.; writing—review and editing, Y.C., Y.Z., Q.Z., M.L., D.W. and X.P.; visualization, Q.Z. and X.P.; supervision, Y.Z.; project administration, J.Y. and B.Z.; funding acquisition, Y.Z., J.Y. and B.Z. All authors have read and agreed to the published version of the manuscript.

Funding

This research was supported by the XinJiang Science and Technology Major Program (No. 2024A01010-5) and the Project of R&D Center for Ultra Deep Complex Reservoir Exploration and Development, CNPC (No. YF202408.01).

Institutional Review Board Statement

Not applicable.

Informed Consent Statement

Not applicable.

Data Availability Statement

Data can be provided by the authors upon request.

Conflicts of Interest

Authors Qihui Zhang, Yongbin Zhang, Jianping Yang, Liandong Tang, Xuehao Pei and Bihui Zhou were employed by the company PetroChina and CNPC. Authors Meijian Liang, Dong Wang and Yu Chen were employed by the company TenFong Technology. The remaining authors declare that the research was conducted in the absence of any commercial or financial relationships that could be construed as a potential conflict of interest.

References

  1. Blunt, M.J.; Bijeljic, B.; Dong, H.; Gharbi, O.; Iglauer, S.; Mostaghimi, P.; Paluszny, A.; Pentland, C. Pore-scale imaging and modelling. Adv. Water Resour. 2013, 51, 197–216. [Google Scholar] [CrossRef]
  2. Zhao, B.; MacMinn, C.W.; Primkulov, B.K.; Chen, Y.; Valocchi, A.J.; Zhao, J.; Kang, Q.; Bruning, K.; McClure, J.E.; Miller, C.T.; et al. Comprehensive comparison of pore-scale models for multiphase flow in porous media. Proc. Natl. Acad. Sci. USA 2019, 116, 13799–13806. [Google Scholar] [CrossRef] [PubMed]
  3. Berg, S.; Ott, H.; Klapp, S.A.; Schwing, A.; Neiteler, R.; Brussee, N.; Makurat, A.; Leu, L.; Enzmann, F.; Schwarz, J.O.; et al. Real-time 3D imaging of Haines jumps in porous media flow. Proc. Natl. Acad. Sci. USA 2013, 110, 3755–3759. [Google Scholar] [CrossRef] [PubMed]
  4. Geistlinger, H.; Golmohammadi, S.; Zulfiqar, B.; Kuechler, M.; Reuter, D.; Schlueter, S.; Segre, E.; Holtzman, R.; Amro, M. A New Phase Diagram for Fluid Invasion Patterns as a Function of Pore-Scale Heterogeneity, Surface Roughness, and Wettability. Water Resour. Res. 2024, 60, e2023WR036036. [Google Scholar] [CrossRef]
  5. Raeini, A.Q.; Blunt, M.J.; Bijeljic, B. Modelling two-phase flow in porous media at the pore scale using the volume-of-fluid method. J. Comput. Phys. 2012, 231, 5653–5668. [Google Scholar] [CrossRef]
  6. Ahrenholz, B.; Tölke, J.; Lehmann, P.; Peters, A.; Kaestner, A.; Krafczyk, M.; Durner, W. Prediction of capillary hysteresis in a porous material using lattice-Boltzmann methods and comparison to experimental data and a morphological pore network model. Adv. Water Resour. 2008, 31, 1151–1173. [Google Scholar] [CrossRef]
  7. Blunt, M.J. Flow in porous media—pore-network models and multiphase flow. Curr. Opin. Colloid Interface Sci. 2001, 6, 197–207. [Google Scholar] [CrossRef]
  8. Chen, S.; Doolen, G.D. Lattice Boltzmann method for fluid flows. Annu. Rev. Fluid Mech. 1998, 30, 329–364. [Google Scholar] [CrossRef]
  9. Guo, Z.; Shu, C. Lattice Boltzmann Method and Its Applications in Engineering; World Scientific: Singapore, 2013; Volume 3. [Google Scholar]
  10. Krüger, T.; Kusumaatmaja, H.; Kuzmin, A.; Shardt, O.; Silva, G.; Viggen, E.M. The Lattice Boltzmann Method; Springer: Berlin/Heidelberg, Germany, 2017; Volume 10. [Google Scholar]
  11. Liu, H.; Kang, Q.; Leonardi, C.R.; Schmieschek, S.; Narváez, A.; Jones, B.D.; Williams, J.R.; Valocchi, A.J.; Harting, J. Multiphase lattice Boltzmann simulations for porous media applications: A review. Comput. Geosci. 2016, 20, 777–805. [Google Scholar] [CrossRef]
  12. Tsuji, T.; Jiang, F.; Christensen, K.T. Characterization of immiscible fluid displacement processes with various capillary numbers and viscosity ratios in 3D natural sandstone. Adv. Water Resour. 2016, 95, 3–15. [Google Scholar] [CrossRef]
  13. Chen, Y.; Valocchi, A.J.; Kang, Q.; Viswanathan, H.S. Inertial effects during the process of supercritical CO2 displacing brine in a sandstone: Lattice Boltzmann simulations based on the continuum-surface-force and geometrical wetting models. Water Resour. Res. 2019, 55, 11144–11165. [Google Scholar] [CrossRef]
  14. McClure, J.E.; Li, Z.; Berrill, M.; Ramstad, T. The LBPM software package for simulating multiphase flow on digital images of porous rocks. Comput. Geosci. 2021, 25, 871–895. [Google Scholar] [CrossRef]
  15. TeraFLOP computing on a desktop PC with GPUs for 3D CFD. Int. J. Comput. Fluid Dyn. 2008, 22, 443–456. [CrossRef]
  16. Akai, T.; Alhammadi, A.M.; Blunt, M.J.; Bijeljic, B. Modeling Oil Recovery in Mixed-Wet Rocks: Pore-Scale Comparison Between Experiment and Simulation. Transp. Porous Media 2019, 127, 393–414. [Google Scholar] [CrossRef]
  17. Ramstad, T.; Idowu, N.; Nardi, C.; Øren, P.E. Relative permeability calculations from two-phase flow simulations directly on digital images of porous rocks. Transp. Porous Media 2012, 94, 487–504. [Google Scholar] [CrossRef]
  18. Raeini, A.Q.; Bijeljic, B.; Blunt, M.J. Modelling capillary trapping using finite-volume simulation of two-phase flow directly on micro-CT images. Adv. Water Resour. 2015, 83, 102–110. [Google Scholar] [CrossRef]
  19. Leclaire, S.; Parmigiani, A.; Malaspinas, O.; Chopard, B.; Latt, J. Generalized three-dimensional lattice Boltzmann color-gradient method for immiscible two-phase pore-scale imbibition and drainage in porous media. Phys. Rev. E 2017, 95, 033306. [Google Scholar] [CrossRef] [PubMed]
  20. Liu, Y.; Berg, S.; Ju, Y.; Wei, W.; Kou, J.; Cai, J. Systematic investigation of corner flow impact in forced imbibition. Water Resour. Res. 2022, 58, e2022WR032402. [Google Scholar] [CrossRef]
  21. Yang, Y.; Wang, J.; Wang, J.; Zhang, Q.; Yao, J. Pore-scale numerical simulation of supercritical CO2-brine two-phase flow based on VOF method. Nat. Gas Ind. B 2023, 10, 466–475. [Google Scholar] [CrossRef]
  22. Galindo-Torres, S.A.; Scheuermann, A.; Li, L. Boundary effects on the Soil Water Characteristic Curves obtained from lattice Boltzmann simulations. Comput. Geotech. 2016, 71, 136–146. [Google Scholar] [CrossRef]
  23. Xu, Z.; Liu, H.; Valocchi, A.J. Lattice B oltzmann simulation of immiscible two-phase flow with capillary valve effect in porous media. Water Resour. Res. 2017, 53, 3770–3790. [Google Scholar] [CrossRef]
  24. Akai, T.; Bijeljic, B.; Blunt, M.J. Wetting boundary condition for the color-gradient lattice Boltzmann method: Validation with analytical and experimental data. Adv. Water Resour. 2018, 116, 56–66. [Google Scholar] [CrossRef]
  25. Chen, Y.; Li, Y.; Valocchi, A.J.; Christensen, K.T. Lattice Boltzmann simulations of liquid CO2 displacing water in a 2D heterogeneous micromodel at reservoir pressure conditions. J. Contam. Hydrol. 2018, 212, 14–27. [Google Scholar] [CrossRef] [PubMed]
  26. Herschlag, G.; Lee, S.; Vetter, J.S.; Randles, A. Analysis of GPU data access patterns on complex geometries for the D3Q19 lattice Boltzmann algorithm. IEEE Trans. Parallel Distrib. Syst. 2021, 32, 2400–2414. [Google Scholar] [CrossRef]
  27. Brackbill, J.; Kothe, D.B.; Zemach, C. A continuum method for modeling surface tension. J. Comput. Phys. 1992, 100, 335–354. [Google Scholar] [CrossRef]
  28. Guo, Z.; Zheng, C.; Shi, B. Discrete lattice effects on the forcing term in the lattice Boltzmann method. Phys. Rev. E 2002, 65, 046308. [Google Scholar] [CrossRef]
  29. Lallemand, P.; Luo, L.S. Theory of the lattice Boltzmann method: Dispersion, dissipation, isotropy, Galilean invariance, and stability. Phys. Rev. E 2000, 61, 6546–6562. [Google Scholar] [CrossRef]
  30. d’Humières, D. Multiple-relaxation-time lattice Boltzmann models in three dimensions. Philos. Trans. R. Soc. London Ser. Math. Phys. Eng. Sci. 2002, 360, 437–451. [Google Scholar] [CrossRef]
  31. Latva-Kokko, M.; Rothman, D.H. Static contact angle in lattice Boltzmann models of immiscible fluids. Phys. Rev. E 2005, 72, 046701. [Google Scholar] [CrossRef]
  32. Yu, Y.; Liu, H.; Zhang, Y.; Liang, D. Color-gradient lattice Boltzmann modeling of immiscible two-phase flows on partially wetting surfaces. Proc. Inst. Mech. Eng. Part C J. Mech. Eng. Sci. 2018, 232, 416–430. [Google Scholar] [CrossRef]
  33. Purswani, P.; Guiltinan, E.J.; Chen, Y.; Kang, Q.; Mehana, M.Z.; Neil, C.W.; Germann, T.C.; Gross, M.R. Pore-scale modeling of carbon dioxide and hydrogen transport during geologic gas storage. Geophys. Res. Lett. 2024, 51, e2024GL109216. [Google Scholar] [CrossRef]
  34. Gunstensen, A.; Rothman, D.; Zaleski, S.; Zanetti, G. Lattice Boltzmann model of immiscible fluids. Phys. Rev. A 1991, 43, 4320–4327. [Google Scholar] [CrossRef]
  35. Tolke, J.; Krafczyk, M.; Schulz, M.; Rank, E. Lattice Boltzmann simulations of binary fluid flow through porous media. Philos. Trans. A Math. Phys. Eng. Sci. 2002, 360, 535–545. [Google Scholar] [CrossRef] [PubMed]
  36. Huang, H.; Huang, J.J.; Lu, X.Y. Study of immiscible displacements in porous media using a color-gradient-based multiphase lattice Boltzmann method. Comput. Fluids 2014, 93, 164–172. [Google Scholar] [CrossRef]
  37. Qian, Y.; d’Humières, D.; Lallemand, P. Lattice BGK models for Navier–Stokes equation. EPL Europhys. Lett. 1992, 17, 479. [Google Scholar] [CrossRef]
  38. Washburn, E.W. The Dynamics of Capillary Flow. Phys. Rev. 1921, 17, 273–283. [Google Scholar] [CrossRef]
  39. Herring, A.L.; Andersson, L.; Wildenschild, D. Enhancing residual trapping of supercritical CO2 via cyclic injections. Geophys. Res. Lett. 2016, 43, 9677–9685. [Google Scholar] [CrossRef]
  40. Ladd, A.J. Numerical simulations of particulate suspensions via a discretized Boltzmann equation. Part 1. Theoretical foundation. J. Fluid Mech. 1994, 271, 285–309. [Google Scholar] [CrossRef]
  41. Lou, Q.; Guo, Z.; Shi, B. Evaluation of outflow boundary conditions for two-phase lattice Boltzmann equation. Phys. Rev. E 2013, 87, 063301. [Google Scholar] [CrossRef] [PubMed]
  42. Lai, J.; Wang, G.; Wang, Z.; Chen, J.; Pang, X.; Wang, S.; Zhou, Z.; He, Z.; Qin, Z.; Fan, X. A review on pore structure characterization in tight sandstones. Earth-Sci. Rev. 2018, 177, 436–457. [Google Scholar] [CrossRef]
  43. Latt, J.; Malaspinas, O.; Kontaxakis, D.; Parmigiani, A.; Lagrava, D.; Brogi, F.; Belgacem, M.B.; Thorimbert, Y.; Leclaire, S.; Li, S.; et al. Palabos: Parallel lattice Boltzmann solver. Comput. Math. Appl. 2021, 81, 334–350. [Google Scholar] [CrossRef]
  44. Krause, M.J.; Kummerländer, A.; Avis, S.J.; Kusumaatmaja, H.; Dapelo, D.; Klemens, F.; Gaedtke, M.; Hafen, N.; Mink, A.; Trunk, R.; et al. OpenLB—Open source lattice Boltzmann code. Comput. Math. Appl. 2021, 81, 258–288. [Google Scholar] [CrossRef]
  45. Bauer, M.; Eibl, S.; Godenschwager, C.; Kohl, N.; Kuron, M.; Rettinger, C.; Schornbaum, F.; Schwarzmeier, C.; Thönnes, D.; Köstler, H.; et al. waLBerla: A block-structured high-performance framework for multiphysics simulations. Comput. Math. Appl. 2021, 81, 478–501. [Google Scholar] [CrossRef]
  46. Geier, M.; Kutscher, K.; Schönherr, M.; Wellmann, A.; Peters, S.; Alihussein, H.; Linxweiler, J.; Krafczyk, M. VirtualFluids–open source parallel LBM solver. Comput. Phys. Commun. 2025, 317, 109810. [Google Scholar] [CrossRef]
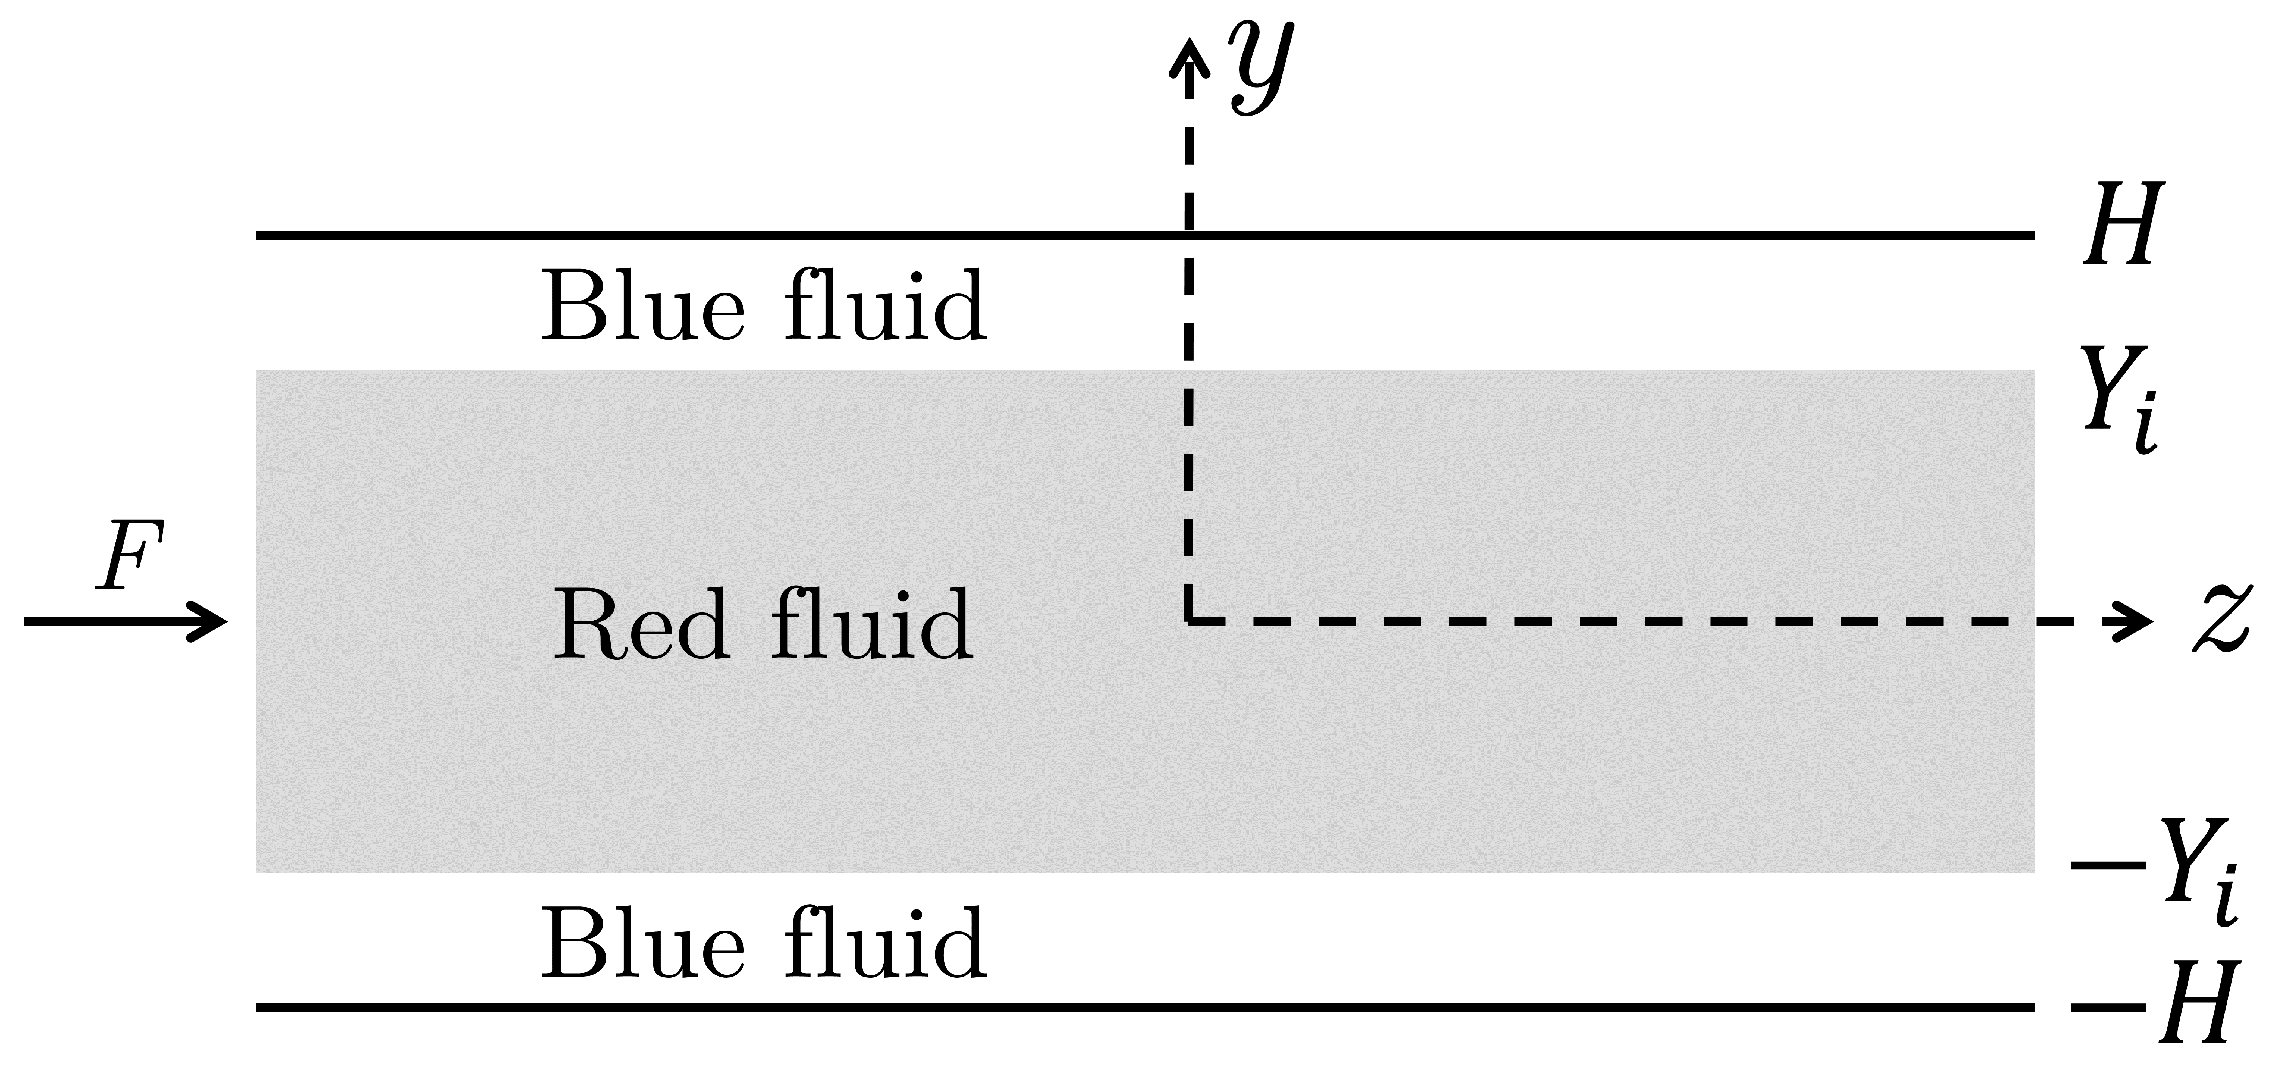
Figure 1. Schematic of two-phase layered flow between parallel plates. The red fluid occupies the central region | y | Y i , while the blue fluid fills the outer regions Y i < | y | H . Flow is driven by a constant pressure gradient p / z .
Fluids 10 00305 g001
Figure 2. z-velocity profiles between two plates of cases M = 1 / 50 , M = 1 / 10 , M = 1 : black lines represent analytical profiles; colored symbols represent current results.
Fluids 10 00305 g002
Figure 3. (a) Schematic of tubular capillary intrusion. (b) Schematic of central cross section of the capillary tube, showing the two-phase fluid distribution during capillary intrusion with markings of tube dimensions and interface position.
Fluids 10 00305 g003
Figure 4. Evolution of the two-phase interface position over time steps of cases in three viscosity ratios M = 1 / 100 , M = 1 / 10 , M = 1 . Black lines: analytical solutions; colored markers: present computational results.
Fluids 10 00305 g004
Figure 5. Bentheimer sandstone samples of different sizes used in the current study. The flow direction is along the z-axis. The black box denotes the baseline sample of 850 × 850 × 700 voxels. The purple, red, blue, and green boxes denote the subsamples with x y cross-sectional edge lengths of 700, 550, 400, and 250 voxels, respectively.
Fluids 10 00305 g005
Figure 6. Invading phase saturation against injected pore volumes of different drainage simulations on the Bentheimer sandstone samples. Three groups of simulations are presented: no-slip wall boundary conditions with 30° contact angle (solid lines), no-slip wall boundary conditions with 45° contact angle (dotted lines), and periodic boundary conditions with 30° contact angle (dashed lines). Different colors represent different samples as indicated in the legend.
Fluids 10 00305 g006
Figure 7. Fluid distribution at steady state in the drainage simulations with no-slip boundary conditions applied on the side boundaries and a 30° contact angle. From top left to bottom right: B250, B400, B550, B700, and B850 samples. The non-wetting phase is shown in red, the wetting phase is shown in blue with 90% transparency, and the solid phase is fully transparent.
Fluids 10 00305 g007
Figure 8. Final non-wetting phase saturation of different drainage simulations on the Bentheimer sandstone samples.
Fluids 10 00305 g008
Figure 9. Transverse non-wetting phase saturation profiles in the x direction after reaching steady state in drainage simulations with (a) no-slip wall boundary conditions and (b) periodic boundary conditions on the side walls. Different colors represent different samples as indicated in the legends.
Fluids 10 00305 g009
Figure 10. Difference of fluid phase distribution between the baseline sample B850 and the other subsamples at steady state in drainage simulations with no-slip wall boundary conditions at the side walls and a 30° contact angle. The view is along the flow direction (z-axis). The red regions indicate non-wetting phase present only in the subsample but not in the baseline sample, while the blue regions indicate non-wetting phase present only in the baseline sample but not in the subsample. The yellow band roughly marks the region directly affected by the side walls, where the phase distribution is significantly altered (from left to right: B850 - B700, B850 - B550, B850 - B400, and B850 - B250).
Fluids 10 00305 g010
Figure 11. Invading phase saturation against injected pore volumes of different imbibition simulations on the Bentheimer sandstone samples. Two groups of simulations are presented: no-slip wall boundary conditions with 150° contact angle (solid lines), and periodic boundary conditions with 150° contact angle (dashed lines). Different colors represent different samples as indicated in the legend.
Fluids 10 00305 g011
Figure 12. Fluid distribution at steady state in the imbibition simulations with no-slip boundary conditions applied on the side boundaries. From top left to bottom right: B250, B400, B550, B700, and B850 samples. The non-wetting phase is shown in red, the wetting phase is shown in blue with 90% transparency, and the solid phase is fully transparent.
Fluids 10 00305 g012
Figure 13. Final non-wetting phase saturation of different imbibition simulations on the Bentheimer sandstone samples.
Fluids 10 00305 g013
Figure 14. Transverse wetting phase saturation profile in the x direction after reaching steady state in imbibition simulations with (a) no-slip wall boundary conditions and (b) periodic boundary conditions on the side walls. Different colors represent different samples as indicated in the legends.
Fluids 10 00305 g014
Figure 15. Difference in fluid phase distribution between the baseline sample B850 and the other subsamples at steady state in imbibition simulations with no-slip wall boundary conditions at the side walls. The view is along the flow direction (z-axis). The red regions indicate wetting phase present only in the subsample but not in the baseline sample, while the blue regions indicate wetting phase present only in the baseline sample but not in the subsample. The yellow band roughly marks the region directly affected by the side walls, where the phase distribution is significantly altered (from left to right: B850 - B700, B850 - B550, B850 - B400, and B850 - B250).
Fluids 10 00305 g015
Figure 16. (Left) is the initial periodic fracture network created by grain growth and gap distance check. (Right) is the final periodic synthetic tight sandstone sample after dilating the pore space. The dimensions are 1200 × 1200 × 1200 voxels, with a resolution of 0.1µm per voxel. The porosity is 4.1% and the absolute permeability is 0.72 mD.
Fluids 10 00305 g016
Figure 17. Invading phase saturation against injected pore volumes of imbibition simulations on the synthetic tight sandstone sample.
Fluids 10 00305 g017
Figure 18. Residual non-wetting phase distribution at steady state in the imbibition simulations on the synthetic tight sandstone sample with (left) periodic boundary conditions and (right) no-slip wall boundary conditions applied to the side boundaries. The non-wetting phase is shown in red, the wetting phase in blue with 90% transparency, and the solid phase is fully transparent. Green circles highlight clusters of non-wetting phase trapped in the pore space, which are observed only in the case with no-slip wall boundary conditions.
Fluids 10 00305 g018
Figure 19. Difference in fluid phase distribution between the two imbibition simulations on the synthetic tight sandstone sample with different boundary conditions applied to the side boundaries at steady state. The red regions indicate non-wetting residual phase present only in the simulation with no-slip wall boundary conditions, while the blue regions indicate non-wetting residual phase present only in the simulation with periodic boundary conditions.
Fluids 10 00305 g019
Table 1. A summary of selected previous pore-scale multiphase simulation studies. This table is not exhaustive but provides a representative overview of typical sample sizes and methods used in the literature.
ReferenceRock TypeSample Size (Voxels)Resolution (µm)Method
Ahrenholz et al., 2007 [6]Beadpack200 × 200 × 20011LBM
Ramstad et al., 2012 [17]Bentheimer/Berea Sandstone256 × 256 × 2566.7/5.3LBM
Raeini et al., 2015 [18]Berea Sandstone330 × 210 × 2105.5VOF
Tsuji et al., 2016 [12]Berea Sandstone400 × 200 × 2003.2LBM
Leclaire et al., 2017 [19]Berea Sandstone400 × 400 × 4005.3LBM
Chen et al., 2019 [13]Bentheimer Sandstone720 × 720 × 8643.2LBM
Akai et al., 2019 [16]Carbonate256 × 256 × 2005LBM
McClure et al., 2021 [14]Bentheimer Sandstone900 × 900 × 16001.7LBM
Liu et al., 2022 [20]Bentheimer Sandstone512 × 512 × 5123LBM
Yang et al., 2023 [21]Berea100 × 100 × 2005.5VOF
Table 2. Properties of the Bentheimer sandstone samples used in this study. The permeabilities are computed from single-phase flow simulations along the z-axis.
Sample NameB850B700B550B400B250
Dimensions (voxels)8502 × 7207002 × 7205502 × 7204002 × 7202502 × 720
Porosity0.19350.19240.19250.19140.1996
Permeability (mD)1979.81898.91826.11677.71887.6
Table 3. Fluid properties and flow conditions used in the two-phase flow simulations on Bentheimer sandstone samples. The fluid properties are given in lattice units. The inlet velocity is the constant velocity imposed at the inlet boundary. The capillary number is calculated based on the inlet velocity, invading-phase viscosity, and surface tension.
PropertyDrainageImbibition
Surface tension0.040.04
Invading-phase viscosity0.00180.005
Defending-phase viscosity0.06790.025
Viscosity ratio37.75
Contact angle30°, 45°150°
Inlet velocity0.00010.0001
Capillary number4.5 × 10−61.25 × 10⁻⁵
Total iterations4 million2 million
Injected pore volumes3.01.5
Table 4. Fluid properties and flow conditions used in the two-phase flow simulations on the synthetic tight sandstone sample. The fluid properties are given in lattice units. The inlet velocity is the constant velocity imposed at the inlet boundary. The capillary number is calculated based on the inlet velocity, invading-phase viscosity, and surface tension.
PropertyImbibition
Surface tension0.03
Invading-phase viscosity0.08
Defending-phase viscosity0.002
Viscosity ratio0.025
Contact angle45°
Inlet velocity0.00005
Capillary number1.22 × 10−4
Total iterations2 million
Injected pore volumes2.0
Disclaimer/Publisher’s Note: The statements, opinions and data contained in all publications are solely those of the individual author(s) and contributor(s) and not of MDPI and/or the editor(s). MDPI and/or the editor(s) disclaim responsibility for any injury to people or property resulting from any ideas, methods, instructions or products referred to in the content.