Abstract
Thermosyphon heat pipes (THPs) are increasingly employed in advanced thermal management applications due to their highly effective thermal conductivity, compact design, and passive operation. In this study, a numerical investigation was conducted on a copper or aluminum thermosyphon charged with different working fluids, with methanol serving as a reference case. A two-dimensional compressible CFD model was implemented in OpenFOAM, coupling the Volume of Fluid (VOF) method with a hybrid phase-change formulation that integrates the Lee and Tanasawa approaches. It provides, indeed, a balance between computational efficiency and physical fidelity. The vapor flow, considered as an ideal gas, was assumed compressible. The isoAdvector algorithm was applied as a reconstruction technique in order to improve interface capturing, to reduce spurious oscillations and parasitic currents, and to ensure more realistic simulation of boiling and condensation phenomena. The performance dependency on operating parameters such as the inclination angle, liquid filling ratio, and thermophysical properties of the working fluid is analyzed. The numerical predictions were validated against experimental measurements obtained from a dedicated test bench, showing discrepancies below 3% under vertical operation. This work provides new insights into the coupled influence of orientation, fluid inventory, and working fluid properties on THP behavior. Beyond the experimental validation, it establishes a robust computational framework for predicting two-phase heat and mass transfer phenomena by linearizing and treating the terms involved in thebalances to be satisfied implicitly. The results reveal a strong interplay between the inclination angle and filling ratio in determining the overall thermal resistance. At low filling ratios, the vertical operation led to insufficient liquid return and increased resistance, whereas inclined orientations enhanced the liquid spreading and promoted more efficient evaporation. An optimal filling ratio range of 40–60% was identified, minimizing the thermal resistance across the working fluids. In contrast, excessive liquid charge reduced the vapor space and degraded the performance due toflow restriction and evaporationflooding.
1. Introduction
Thermosyphon heat pipes (THPs) are efficient passive heat transfer devices that rely on phase-change processes to transport thermal energy with a reduced temperature difference. Their simple design, highly effective conductivity, and absence of moving mechanical components make them attractive for a wide range of thermal management applications. However, their performance is strongly dependent on orientation, working fluid charge, and geometric configuration. Deviations from vertical operation or improper filling ratios often lead to degraded heat transfer efficiency, increased thermal resistance, and unstable operation.
The demand for reliable and high-performance passive cooling systems has increased considerably due to the rapid development of high-power electronics, renewable energy systems, and advanced energy storage technologies. THPs are also being explored in building energy systems, and sustainable technologies where robust operation under different inclinations and power input conditions are essential for their design. Despite their proven efficiency, some uncertainties still remain concerning the coupled effects of inclination, liquid inventory, and heat input distribution.
Over the past few decades, extensive experimental and numerical investigations have been conducted on thermosyphon heat pipes (THPs), covering working fluid selection, heat transfer limitations, filling ratios, and transient operation [1,2,3]. More recent advances have integrated multiphase computational fluid dynamics (CFD) approaches, particularly the Volume of Fluid (VOF) method, to capture liquid–vapor interface dynamics [4,5,6]. Hybrid formulations that couple VOF with phase-change models, such as those of Lee and Tanasawa, have significantly improved the prediction of evaporation and condensation in two-phase flows [7,8].
CFD has progressively been adopted for different configurations, including conventional heat pipes [9], rotating heat pipes [9], wickless thermosyphons [10], and loop heat pipes [11,12]. These models provide not only valuable predictive capability but also valuable visual insights into internal heat transfer mechanisms such as flow evolution, bubble nucleation, and liquid film propagation. Various numerical methods have been developed to capture multiphase flows in heat pipes, including VOF [2,13], Front Tracking [14], and Level Set [15]. Among them, VOF has become the preferred method due to its mass conservation properties and computational efficiency. Schepper et al. [16] provided detailed demonstrations of boiling simulations using VOF.
Phase-change modeling is often incorporated through source terms in the governing equations, linking interfacial mass, momentum, and energy transfer. The Schrage and Lee models [17,18] are widely used, with Lee’s model emerging as the most common due to its robustness in simulating evaporation and condensation both at the interface and within the saturated phase. Its ease of implementation in OpenFOAM, through user-defined source terms, has reinforced its popularity in THP simulations. OpenFOAM also used to model the interaction between thermal conduction, convection, and evaporation within a porous medium, with the aim of analyzing the efficiency of transpiration cooling involving a phase-change process [19].
Despite these advances, the inherently complex nature of THP operation continues to pose challenges for accurate and predictive modeling. Lataoui et al. [20] experimentally demonstrated that THP performance depends strongly on the working fluid, heat flux input, condenser cooling temperature, and filling ratio (FR). They observed that insufficient filling (FR = 10%) causes dry-out and sharp temperature rises, while optimal (FR = 20%) and overfilled (FR = 35%) conditions yield comparable performance, with a slight advantage for overfilled thermosyphons due to improved isothermal behavior.
To enhance predictive accuracy, pressure-dependent phase-change models have also been introduced. Wang et al. [8] developed such a model for ammonia thermosyphons, calibrated using optimized Lee’s coefficients for vaporization and condensation (, and –). Their results showed good agreement with experiments, with errors around 3.7%. The model demonstrated that vapor–liquid transitions are governed by the difference between local and saturation pressures, which directly affects wall temperatures, heat generation, and thermal resistance.
Lataoui et al. [6] developed a model demonstrating bubble nucleation near the upper region of the evaporator at heat fluxes of approximately 12–16 kW·m−2, along with the formation of a stable condensate film along both the condenser and adiabatic sections.
The same authors (Z. Lataoui et al.) [21] investigated the thermal optimization of a TPCT in vacuum tube solar collectors using a numerically validated model. Their findings reveal that tilt angle and heating power strongly affect thermal stratification and heat transfer mechanisms. They recommend an optimal tilt angle of approximately 60° for temperatures below 130 °C and nearly 90° for temperatures exceeding 150 °C.
Alammar et al. [22] conducted an experimental study showing that the tilt angle and the fill ratio govern the onset and duration of “geyser” boiling across the entire power range. A fill ratio of 100% reduces the activation threshold compared to 25% and 65% for all tested angles. At an inclination of 10°, the required input power is higher than at larger inclination angles, whereas at higher power levels, the phenomenon nearly disappears between 60° and 90°, regardless of the fill ratio.
Zhang et al. [23] investigated numerically a flat, disc-shaped two-phase thermosiphon designed for electronic cooling. By comparing simulation results with experimental measurements, they identified the key parameters governing the axial thermal resistance of the TPCT. However, their model presents a major limitation: the internal flow is simplified to a single-phase vapor, neglecting completely the role of the liquid phase.
Xu et al. [24] developed a numerical model using the VOF method, incorporating evaporator wettability through the contact angle. To validate their predictions, they tested a water-charged copper thermosyphon over a range of tilt angles. The results showed that as the heat input increased, the thermal resistance decreased more sharply for hydrophilic evaporators than for hydrophobic ones. This improvement was attributed to a faster rise in bubble emission frequency on near-vertical hydrophilic surfaces.
Min et al. [5] recently analyzed the condensation mass transfer time relaxation parameter numerically and proposed an empirical correlation relating it to the filling ratio, working fluid properties, and saturation temperature. To develop and validate this correlation, they measured the thermal performance of a smooth copper thermosyphon charged either with water, ethanol, or methanol under various operating conditions (fill level, heat flux, and saturation temperature). The proposed expressions were calibrated through nonlinear curve fitting of the experimental data. Their findings indicate that the vapor temperature has a relatively minor influence, whereas the filling ratio plays the dominant role.
In addition, Julien et al. [4] studied a two-phase loop thermosyphon numerically using VOF coupled with a hybrid Lee–Tanasawa phase-change model implemented in OpenFOAM. Their findings indicate that the system reaches a pseudo-stationary regime within five minutes, with a wall temperature rise of approximately 70 K and a thermal resistance of 0.25 K/W. They also analyzed the impact of the filling ratio, showing that a lower filling ratio increases vapor flow rate and reduces thermal resistance, though an excessively low filling ratio can induce long-term dry-out in loop sections.
In general, while CFD has provided remarkable insights into THP operation, most existing studies have focused on incompressible two-phase flows. Further efforts are still required to refine compressible models and better capture the coupled hydrodynamic and thermal mechanisms governing thermosyphon performance.
Despite substantial progress in the research and application of thermosyphon heat pipes (THPs), several knowledge gaps remain unaddressed. Previous investigations have often focused on single parameters such as the tilt angle or filling ratio in isolation, neglecting their coupled influence on liquid redistribution, surface dryness, and vapor–liquid flow dynamics. This has limited the ability to capture complex interactions that are expected to affect thermal resistance considerably. Additionally, many existing numerical models rely on incompressible assumptions or oversimplified phase-change treatments, reducing their accuracy in predicting compressible two-phase flow behaviors where evaporation–condensation interactions are dominant. Experimental studies, while useful, are often constrained to specific configurations and provide seldom direct validation of CFD models across varying operating and geometric conditions. These shortcomings hinder the development of robust predictive tools and practical design guidelines for THPs under realistic constraints. To overcome these limitations, the present work advances the field in four keyways. First, it provides a systematic analysis of the combined effects of the inclination, filling ratio, and evaporator–condenser configuration on the THP thermal performance. Second, it develops a robust compressible CFD framework in OpenFOAM, coupling the Volume of Fluid (VOF) technique with a hybrid phase-change approach based on the Lee and Tanasawa models. The framework achieves strong agreement with experiments, maintaining deviations below 3%. Third, a purpose-built experimental setup enables comprehensive evaluation of operating conditions, ensuring rigorous validation of the numerical predictions. Finally, the results reveal an optimal filling range of 40–60% and demonstrate how tilt configurations enhance wettability and heat transfer. Together, these contributions provide both fundamental insights and practical guidelines relevant to electronics cooling, renewable energy devices, and sustainable thermal management systems.
The objectives of this study are as follows:
- (1)
- To develop and validate experimentally a compressible CFD model of thermosyphon heat pipes in OpenFOAM, capable of capturing evaporation, condensation, and heat transfer.
- (2)
- To quantify the influence of a variety of operating conditions.
- (3)
- To identify optimal filling and tilt conditions for improved wettability and enhanced heat and mass transfer.
The remainder of this paper is organized as follows. Section 2 presents the mathematical model and numerical methodology. Section 3 is dedicated to the numerical method. Section 4 validates the CFD model against the experimental data. Section 5 discusses the results with emphasis on the tilt, filling ratio, and working fluid effects. Section 6 concludes with the main findings, contributions, and future research directions.
2. Mathematical Model
2.1. Proposed Studied System
Figure 1 provides a schematic representation of the thermosyphon heat pipe (THP) investigated in this study together with the adopted coordinate system. The device consists of a sealed cylindrical copper tube charged with methanol, selected for its favorable thermophysical properties. (Other working fluids and tube materials are assessed later on.) To capture the role of gravity in the return of the condensate, the tilt angle of the THP was varied from 90° (vertical orientation) down to 20°.
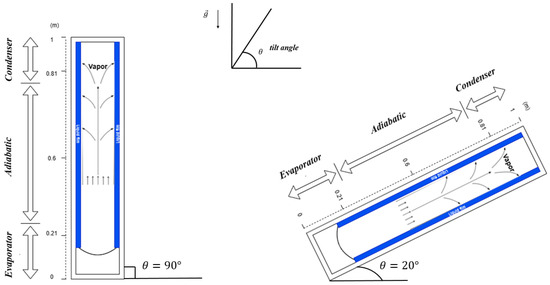
Figure 1.
The geometry of the heat pipe thermosyphon.
The operating principle of the THP relies on the phase-change cycle of the working fluid. Heat supplied at the lower section, referred to as the evaporator, vaporizes the liquid layer adjacent to the heated wall. The generated vapor is transported upward through the central vapor core and the adiabatic section, driven by the pressure difference between the evaporator and condenser. Once reaching the upper section, the condenser, the vapor releases its latent heat of condensation to the external heat sink and transforms back into liquid. This condensate subsequently returns to the evaporator under the action of gravity, thereby completing the thermosyphon cycle.
The device is divided into three functional zones: the evaporator, where heat input initiates the phase change; the adiabatic zone, where vapor and liquid move without heat exchange; and the condenser, where the phase change releases heat to the environment. The key geometrical dimensions of the THP and the thermophysical properties of copper are summarized in Table 1.

Table 1.
Geometrical characteristics and thermophysical properties of THP tube.
The thermosiphon (THP) contains 3.7 mL of methanol, with the evaporator being almost half-filled and a thin liquid layer covering the walls. The main parameters defining the geometry of THP and thermophysical properties of copper are summarized in Table 1.
2.2. Governing Equations
The two-phase system is represented within a single-fluid, Volume-of-Fluid (VOF) formulation, where mixture properties are expressed as the volume-fraction-weighted averages of the liquid () and vapor () phases. This homogenized approach allows the conservation equations to be applied uniformly throughout the computational domain, including the interfacial regions:
where , , and denote the dynamic viscosity, thermal conductivity, and fluid density of the mixture, respectively. The weighting coefficients and represent the local liquid and vapor volume fractions. This homogenized treatment ensures a smooth variation of thermophysical properties across the computational domain and is particularly suitable for capturing interface dynamics in two-phase systems [4,21].
To simplify the modeling of heat and mass transfer in a thermosyphon while preserving the dominant physical mechanisms, the following assumptions are adopted. The liquid phase is considered incompressible as density variations are negligible, whereas the vapor is treated as an ideal gas, which is valid under typical operating ranges. At the liquid–vapor interface, the phase change is assumed to occur under quasi-equilibrium, ensuring consistency with saturation conditions. Thermophysical properties (density, viscosity, and conductivity) are estimated as volume-fraction-weighted averages in the VOF approach and are taken as constant within each homogeneous phase. Vapor bubbles generated early during the boiling stage are assumed as spherical, providing a simplified yet effective representation of the interfacial curvature effects. Finally, surface tension is assumed constant and chosen to correspond to the steady-state saturation conditions. These assumptions enable the derivation of tractable conservation equations.
2.2.1. Mass Balance
The fluid flow is supposed incompressible in general, and the continuity equation is expressed as follows:
where (i = l for liquid or v for vapor) is the density of phase “i”, and is the local velocity.
When the two phases are present in the VOF method, the continuity equation is written:
where represents the mass source term employed for computing mass transfer during evaporation and condensation.
2.2.2. Momentum Balance
In the VOF method, both the liquid and vapor phases follow the same momentum equation, which is expressed as follows:
where p, , and g are the pressure, the viscous stress tensor, and the gravity accleration, respectively. In the case of a Newtonian fluid and an assumed constant viscosity, , the viscous stress tensor is expressed as follows:
: the Continuum Surface Force is a force acting on a surface due to molecular non-compensated potential within a fluid. It reduces the surface area of the bubbles, lowers the surface energy, and influences the mobility of the bubbles as well as the wetting properties of the fluids [25]. In this work, the surface tension force is modeled by the Continuous Surface Force mode [26].
with being the surface tension and the local curvature computed from the volume fraction .
2.2.3. Energy Balance
The energy equation is also applicable to both phases, and is given by
with e, q, and being the specific internal energy, the conductive heat flux density, and the phase-change energy volumic source term, respectively.
The temperature equation takes the following form:
The equations already mentioned apply to the fluid region only. For the solid region, the enthalpy conservation equation is used, expressed as follows
where , , , and are density, the specific enthalpy, the thermal conductivity, and the specific heat capacity, respectively, of the solid material.
2.3. Modified Phase-Change Module
To capture the vapor–liquid distribution in a computational domain, it is necessary to trace the fraction of mass that evaporates or condenses at the liquid–vapor interface. In this study, a hybrid phase-change approach is employed, combining the Lee model and the Tanasawa model to improve accuracy in predicting evaporation and condensation process.
2.3.1. Lee Model
The Lee model is implemented as a sub-grid approach that estimates phase change by measuring the deviation from saturation conditions, without requiring explicit interface tracking. When the temperature of pure liquid exceeds the saturation temperature, vapor generation is predicted; conversely, condensation occurs in pure vapor if the temperature falls below the saturation temperature. The governing expression for the mass transfer rate is [5,18]
where and are the relaxation coefficients for evaporation and condensation.
Tsat is determined using an empirical correlation fitted with NIST data [27].
For methanol, constants were identified as a = 24.064 and b = 67.912, providing a good match with experimental pressure–temperature data in the relevant temperature range (see Figure 2).
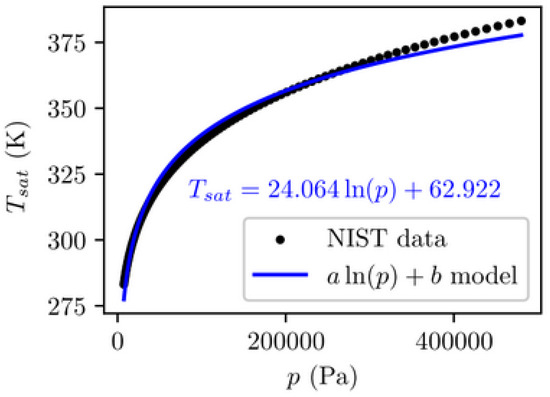
Figure 2.
Temperature–pressure saturation data for methanol.
2.3.2. Hertz–Kundsen Model (Tanasawa)
The Tanasawa model complements the Lee formulation by introducing a molecular-kinetic description of interfacial heat transfer occurring along a resolved liquid–vapor interface. Like Lee’s model, it accounts for the temperature difference between the local temperature and Tsat, yielding the interfacial heat flux:
where f is the accommodation coefficient, is the latent heat of vaporization, and is the specific gas constant of the vapor. The corresponding volumetric source term in the energy equation is obtained as
where A is the interface area that crossed a volume V and is called the interface density.
This hybrid formulation provides a balance between computational efficiency and physical fidelity. The Lee model captures the macroscopic evaporation–condensation trends, while the Tanasawa model refines the heat flux at the interface based on the molecular-scale dynamics. The reported values of the accommodation coefficient for methanol range between 0.8 and 0.9 in the near-equilibrium region , while values for hydrocarbons such as hexane and hexadecane vary between 0.9 and 1.0, reflecting fluid-specific interfacial behaviors.
2.4. Volume-of-Fluid (VOF) Method
The thermosyphon inner space is governed by boiling and condensation, both leading to discontinuities in local flow properties across the liquid–vapor interface. To capture these complex multiphase interactions, the Volume-of-Fluid (VOF) method is widely used. This approach computes the volume fractions of liquid () and vapor () within each cell, subject to the following condition:
A cell may be fully liquid (), fully vapor (), or partially filled with both phases. The interface position is determined by solving a continuity equation for the liquid fraction. Although the VOF method provides a robust framework for phase distribution, its ability to sharply resolve the liquid–vapor interface is limited.
To enhance accuracy, the isoAdvector algorithm is applied. This geometric reconstruction technique defines the interface as a cutting plane that partitions the computational cell into distinct sub-cells. The orientation of this plane is established from the interface normal vector and the cell’s phase fraction (see Figure 3). Subsequently, the velocity field is interpolated from surrounding cells, and the phase distribution is updated accordingly. This method significantly improves interface capturing, reducing spurious oscillations and parasitic currents and ensuring more realistic simulation of boiling and condensation phenomena.
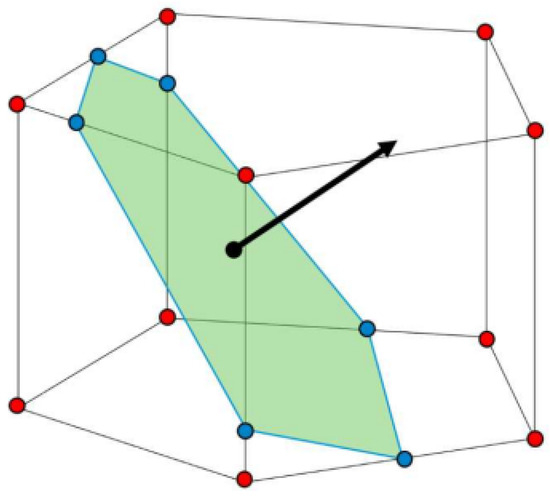
Figure 3.
Representation of volume fraction iso-surfaces [28].
On the other hand, this method generally has the effect of making the interface diffuse and modifying it. To overcome this difficulty, geometric methods perform an interface reconstruction operation, which leads to greater accuracy. The isoAdvector method was developed by Roenby et al. for improved interface resolution and minimizing the foretold parasitic currents [28]. This reconstruction is derived from the iso-surfaces of the phase volume fraction, whose surface consists of a set of points intersecting the edges of the cells.
2.5. Boundary Conditions
The heat flow boundary conditions are imposed on four distinct sections of the thermosyphon wall in order to accurately capture the thermal behavior of the system.
In the evaporator, a prescribed heat flux density is applied to initiate phase change and drive vapor generation. This boundary condition ensures that the model reflects the physical heating process, where the thermal energy input is transformed into a latent heat of vaporization, leading to a vapor rise within the tube.
The adiabatic region is fully insulated, preventing heat exchange through the thickness of the lateral wall. This treatment eliminates parasitic heat transfer and ensures that the energy transport is confined to the evaporation and condensation zones, thereby improving the fidelity of the simulation. In the condenser, heat rejection is governed by convective transfer to an external medium. The boundary is defined by a fixed external temperature and an imposed convective heat transfer coefficient. This allows the model to realistically reproduce condensation phenomena and helps quantify the efficiency of thermal drainage.
Finally, the top and bottom closures of the thermosyphon are also treated as adiabatic, suppressing any spurious leakage and preserving global energy balance.
Together, these boundary conditions establish a robust thermal framework that links the evaporator’s heat input with the condenser’s heat removal. This consistent treatment guarantees energy conservation across the system and enhances the predictive accuracy of the numerical model. Figure 4 summarizes and illustrates the spatial distribution of all boundaries and their functional roles in the overall thermal cycle.
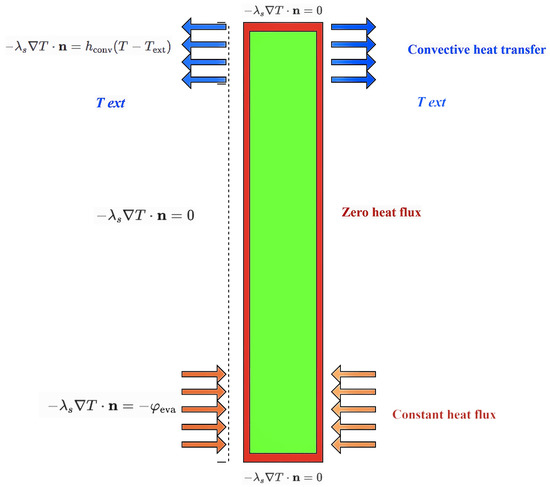
Figure 4.
Applied boundary conditions in thermosyphon simulation. n is the outward pointing normal vector to the external wall of the thermosyphon.
3. Numerical Method
To balance the computational efficiency and physical accuracy, a two-dimensional (2D) modeling strategy was adopted. This choice significantly reduces the simulation time compared to the three-dimensional (3D) models while preserving the essential physics of thermosyphon operation. A symmetrical mesh was constructed to represent the geometry, allowing the analysis to capture the dominant mechanisms of heat and mass transfer.
In order to ensure equivalence, the two-dimensional domain is set so that the hydraulic diameter is the same as the three-dimensional model. In addition, for the sake of that very equivalence, the heat input flux density is set the same for both models instead of the heat input power itself.
3.1. Pressure–Velocity Coupling
The simulations employ the PIMPLE algorithm, which combines the strengths of the PISO (Pressure-Implicit with Splitting of Operators) and SIMPLE (Semi-Implicit Method for Pressure-Linked Equations) methods. PISO focuses on pressure correction and momentum coupling, whereas SIMPLE introduces additional iterations to improve stability and ensure energy conservation. Therefore, the PIMPLE framework provides a robust solution for transient compressible multiphase flows with phase change. The iterative loop of this algorithm is illustrated in Figure 5, showing the sequence of interface updating, property calculation, velocity prediction, and pressure correction.
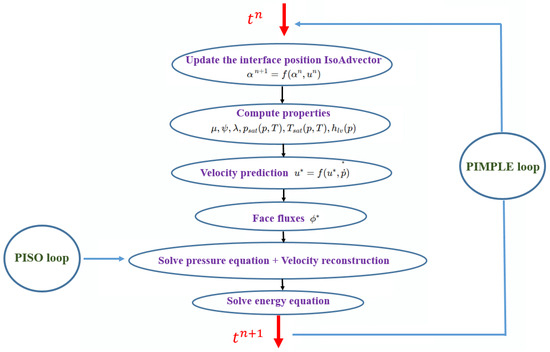
Figure 5.
Problem-solving process (loop PIMPLE).
3.2. CFD Modeling
The computational model was implemented in OpenFOAM-v1812, an open-source CFD platform that offers extensive flexibility for multiphysics simulations. The solver is based on the finite volume method and adapted from the Multi-Region Phase-Change Flow library, enabling the treatment of non-isothermal compressible flows with evaporation and condensation.
The pressure equation is retrieved by combining Equation (5), which includes the phase-change term (either Equation (14) or (16)), and the divergence of Equation (7), resulting in Poisson’s equation. Taking its original form makes the phase-change term included in this equation explicit as it depends on the formerly computed temperature. Therefore, to make it implicit, it is mandatory to use Clausius–Clapeyron relation. Doing so enhanced the diagonal dominance of the discretized problem and helped to increase the stability and robustness of the solution method. In the energy equation, the formulation as a function of the phase-change term is, however, retained, allowing the source term in this equation to be made implicit.
These elements contribute to the overall robustness of the numerical scheme used.
3.3. Mesh Generation
The geometry of the thermosyphon was discretized using blockMesh, producing a structured mesh composed of 12,800 cells (8000 in the fluid region and 4800 in the solid region). The mesh is uniform in the vertical direction but locally refined near the liquid–vapor interface and solid–fluid boundaries, where strong gradients are expected to occur. The refinement ratio in the horizontal direction was set to 4, ensuring enhanced accuracy without excessive computational cost. The final mesh structure is shown in Figure 6, highlighting the separation between the solid wall and fluid domain. The actual mesh resolution is much higher than the illustration. A study of the influence of mesh size on the one-dimensional Stefan problem and the spherical phase-change problem, not included in this article, showed low sensitivity of the results for cell sizes smaller than 20 µm. Therefore, in the simulations presented in this paper, the mesh was constructed so that the size of the fluid cell adjacent to the solid wall does not exceed 20 µm, thus ensuring a correct representation of bubble growth.
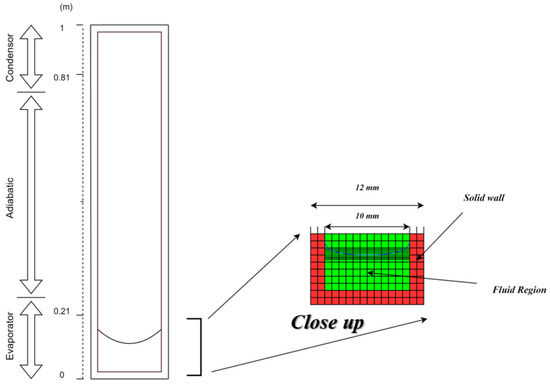
Figure 6.
Mesh structure visualization.
4. Validation of the Model
The validation of the proposed numerical model was performed against experimental measurements obtained from a dedicated thermosyphon test bench designed and set up at the Pprime Institute laboratory [29].
To apply the heat flow, heating cartridges are inserted into a copper block encompassing the evaporator. The thermosyphon is cooled by a condenser, consisting of a second copper tube wrapped around the first and through which a water–glycol circuit flows.
A particular contribution of this work lies in the design of a versatile experimental rig that incorporates an inclination adjustment system; this frame can be divided into two separate elements. The first is attached to the thermosyphon and consists of a modular frame made of T-slotted aluminum profiles, forming a rigid structure. Two horizontal crossbars support a front plate (for adjusting the angle) to which the insulated tube is securely clamped. The grooves in the profiles provide numerous anchor points for adjusting the height and alignment of the thermosyphon and facilitate the passage of cables, sensors, and hoses. This architecture ensures stability, accessibility, and modularity of assembly, while the auxiliary equipment visible at the base of the frame remains motionless and close at hand for power supply and thermal control (Figure 7). This feature allows a systematic investigation of inclination effect, which is critical for practical applications although often neglected in conventional validation studies.
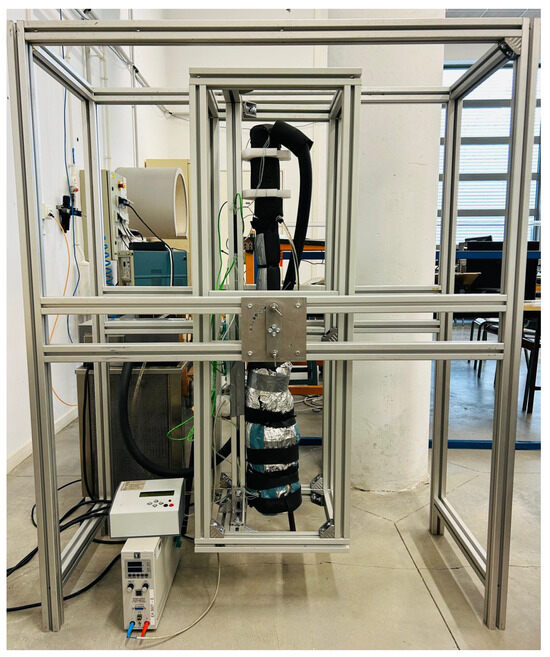
Figure 7.
Experimental device: thermosyphon with inclination adjustment system.
The experimental thermosyphon consists of three functional zones:
Evaporator: Located at the base of the tube, this section comprises a copper block into which electrical heating cartridges are embedded along its entire length. The heat input is regulated by a variac (variable voltage regulator) and monitored using a wattmeter. For safety, an automatic cut-off device interrupts the power supply if the temperature exceeds a critical threshold.
Adiabatic section: A central tube portion serving as a vapor transport path without heat exchange.
Condenser: Positioned at the upper end, the condenser is formed by a second copper tube coiled around the thermosyphon. This coil is supplied with a glycol–water mixture maintained at a constant input temperature by a regulated cryothermostat. This arrangement ensures effective condensation and stable operating conditions.
To capture the wall temperature distribution, sixteen type-K thermocouples were placed along the external surface of the thermosyphon. Their location is detailed in Table 2: seven in the evaporator, four in the adiabatic section, and five in the condenser. Data acquisition was carried out in real time using LabVIEW® software, which centralizes both measurements and control equipment on the same computer.

Table 2.
Positions (from the evaporator’s bottom end) of the thermocouples along the thermosyphon (grouped by section).
The experimental mean temperatures of the evaporator and condenser walls are calculated as
These averaged values are representative of the global thermal behavior in each zone.
The total thermal resistance of the thermosyphon is expressed as
where is the supplied heat input.
To assess the uncertainty associated with the thermal resistance, it is necessary to quantify the uncertainty related to the temperature measurements made by type-K thermocouples, as well as the uncertainty related to the heat flux supplied by the power supply. The uncertainty assessment was carried out in accordance with the standards of the Guide to the Expression of Uncertainty in Measurement (GUM, JCGM). The uncertainty calculation indicates that, for the reference case, the margin of error in the temperature measured using a type-K thermocouple is estimated at 0.71 K. The uncertainty values for the applied fluxes and resistances are shown in Table 3.

Table 3.
Applied heat flux and associated experimental uncertainties.
represents the uncertainty in the applied heat flux, while corresponds to the uncertainty in the thermal resistance.
To assess the agreement between experimental and numerical predictions, the relative error is computed as
Validation tests were conducted at a vertical inclination (90°) with heat inputs of 50, 100, 150, and 200 W. Table 4 summarizes the comparison between experimental and numerical thermal resistances, while Figure 8 illustrates their variation as a function of the applied heat flux.

Table 4.
Comparison between the experimental and numerical resistance values in the vertical position, along with the error rate.
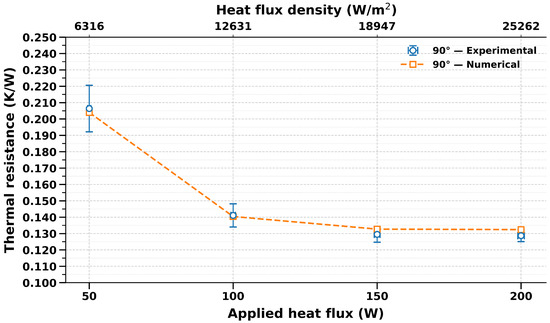
Figure 8.
Evolution of thermal resistance as a function of imposed heat flux.
As expected, the overall thermal resistance decreased with increasing heat input, from approximately 0.21 K/W at 50 W to 0.13 K/W at 200 W, confirming the improved efficiency of phase-change heat transfer under higher boiling intensities. The numerical results closely reproduced the experimental trends, with deviations remaining below 2.9% and typically within 1–1.5%. This excellent agreement demonstrates the robustness of the proposed model in capturing the coupled mechanisms of nucleate boiling, vapor transport, and condensation.
The decrease in the thermal resistance can be inferred by the increase in the slope of the saturation pressure with increasing temperature; in order to overcome the pressure loss in the vapor phase, the larger the vapor temperature, the smaller the difference of the temperature between the evaporator and the condenser.
5. Results and Discussion
5.1. Analysis of the Effects of the Inclination Angle
Figure 9 shows the variation in thermal resistance as a function of the inclination angle of the methanol thermosiphon at a fill rate of 17% of the evaporator volume, under different applied heat fluxes. The results of the model provide a good agreement with the experimental data, with the error rate remaining below 6% across all the simulations. Table 5 summarizes the relative error obtained.
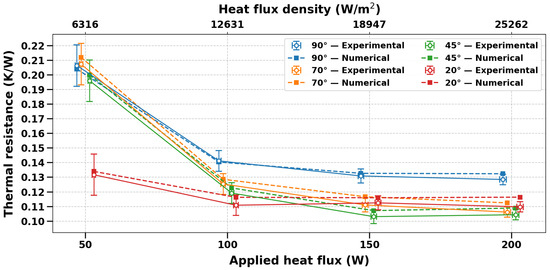
Figure 9.
Variations of thermal resistance as a function of inclination for different applied heat fluxes. The experimental and numerical measurement points are intentionally offset horizontally to avoid overlapping of symbols and error bars.

Table 5.
The relative error for the different angles used.
The highest resistance values are observed in the vertical position. At a heat input of 50 W, the thermal resistance is nearly identical at angles of 90°, 70°, and 45° but decreases significantly at 20°, where it reaches 0.132 K/W. For heat inputs of 100 W and 150 W, resistance decreases as the angle increases (from 90° to 20°). Finally, at 200 W, the values measured at 70°, 45°, and 20° are very close to each other, while the vertical configuration (90°) has the highest thermal resistance.
With an evaporator fill rate of approximately 17%, the thermosyphon contains only a limited amount of working fluid. In a vertical position, the liquid tends to accumulate at the bottom of the evaporator, reducing the wetted surface area and weakening evaporation. The inclination of the device helps the liquid to spread along a larger distance of the wall, thereby increasing the active evaporation surface area and reducing the liquid resistance as it becomes thinner and thus dropping down the thermal resistance [30]. In addition, the vapor pressure drop decreases when the tilt angle decreases. The vapor temperature difference decreases accordingly. Finally, an increase in the liquid film thickness, according to the classical Nusselt model, induces a smaller shear effect at the liquid–vapor interface and thus mitigates the entrainement effect for smaller tilt angles.
5.2. Analysis of the Filling Ratio Effects
To investigate the effect of the filling ratio on the THP’s performance and its influence on the overall thermal resistance profile of the THP, the variation of the resistance is plotted as a function of the liquid charge at rest. It is particularly insightful to examine how the resistance changes at different filling ratios. The variations in the thermal resistance of the thermosyphon with changes in the initially introduced filling ratio are presented in Figure 10. By increasing the filling ratio, the thermal resistance initially decreases and then reaches a minimum; at which point, there is sufficient fluid to efficiently feed the evaporation–condensation exchanges. The simulations indicate that a range of (40% to 60%) provides the best performance, with minimal thermal resistance. Beyond this range, when the filling ratio becomes high (>70–100%), the thermal resistance increases again. This is due to excessive liquid accumulation in the evaporator. This flooding reduces the space available for vapor formation and slows down two-phase circulation, thereby degrading heat transfer efficiency.
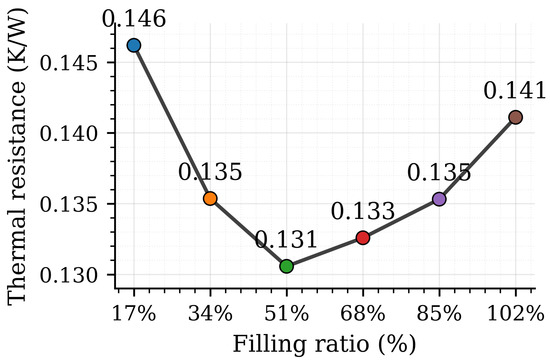
Figure 10.
Variations of the thermal resistance as a function of the evaporator filling ratio using methanol.
Many studies in the literature have also found that the optimal filling ratio is around 50% for this type of thermosiphon. W. Min [31] used ethanol as the working fluid in a device measuring 0.6 m in length and 10 mm in internal diameter and showed that the best thermal performance was achieved with a filling ratio of 50%. Adnan et al. [32] employed water as the working fluid in a loop thermosyphon with dimensions comparable to the present geometry and reported that the optimal filling ratio was also around 50%.
Figure 11 illustrates the temperature profile along the evaporator for different filling ratios. At the inlet, a low filling ratio (e.g., 17%) leads to a sharp temperature rise. This effect results from insufficient liquid supply, which generates dry zones and localized overheating.
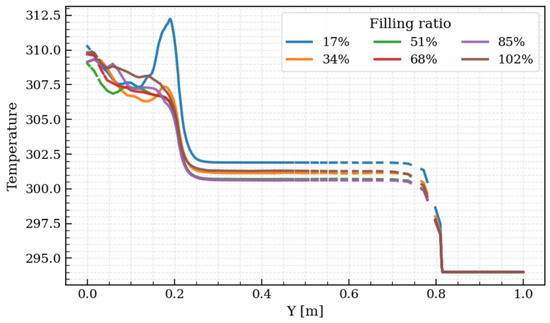
Figure 11.
Temperature variation in steady state along the TCPT wall with an applied heat flux of 100 W.
As the filling ratio increases, this phenomenon becomes much less significant. The shift of the plateau in the adiabatic region is governed by the position of the liquid–vapor interface, which is strongly affected by the filling ratio. At low filling ratios, the reduced liquid volume lowers the liquid level, causing the vapor region to extend further in the evaporator. This leads to a higher equilibrium temperature and a plateau located at an elevated level. Conversely, at higher filling ratios (50% and above), the liquid level rises, pushing the liquid–vapor interface upward. As a result, the adiabatic plateau appears lower and more stable (because of the liquid inertia) since heat transfer occurs under more regular conditions. Therefore, both the value and the position of the plateau in this region are directly related to the vertical distribution of liquid and vapor phases imposed by the filling ratio. Finally, at the outlet, a strong temperature drop is observed in all cases, corresponding to condensation and heat rejection, where the profiles overlap due to the imposed boundary temperature.
5.3. Analysis of Fluid Nature Effects
In order to assess the influence of fluid type on the thermal performance of the thermosyphon, a filling ratio of 50% was chosen as Section 5.2 demonstrates that this value lies within the optimal range for maximizing thermal efficiency.
The change in thermal resistance as a function of applied heat flux is studied for ammonia, water, and methanol as illustrated in Figure 12. As expected, thermal resistance decreases with increasing heat flux for all three fluids but at varying degrees. In the case of ammonia, the thermosyphon walls are made of aluminum, whereas for methanol and water, the walls are made of copper.
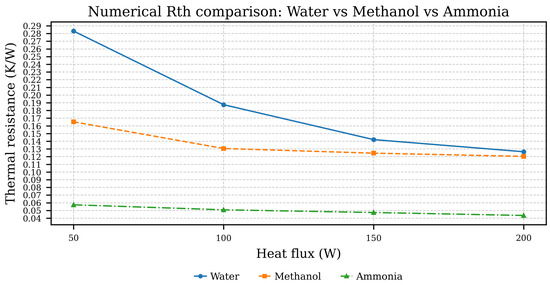
Figure 12.
Thermal resistance vs. applied heat flux: ammonia, methanol, and water.
Ammonia performs best, with resistance decreasing from 0.057 K/W to 0.040 K/W as the flow increases from 50 W to 200 W. Methanol also shows a decrease in thermal resistance, from 0.165 K/W to 0.120 K/W, but with lower performance than ammonia. Finally, water shows the least favorable results, with thermal resistance varying from 0.282 K/W to 0.125 K/W over the same flux range.
6. Conclusions
This work presented a comprehensive experimental and numerical investigation of thermosyphon heat pipes (THPs), with emphasis on the coupled influence of the applied heat flux, inclination angle, and filling ratio. A dedicated experimental facility, equipped with an adjustable inclination system, enabled systematic characterization of thermal behavior under various operating conditions. In parallel, a compressible two-phase CFD framework was developed in OpenFOAM, combining the Volume-of-Fluid (VOF) method with a hybrid phase-change model that integrates the Lee and Tanasawa approaches.
The numerical predictions exhibited excellent agreement with experimental measurements, with deviations in thermal resistance systematically below 3%. Both experimental and numerical analyses confirmed that thermal resistance decreases with increasing heat input, falling from approximately the 0.21 K/W at 50 W to 0.13 K/W at 200 W for the present geometry using methanol at a 17% filling ratio. The results further highlighted the strong dependence of performance on the inclination and working fluid substance. Vertical operation under insufficient filling ratios led to liquid dry-out and increased resistance, whereas inclined orientations promoted liquid redistribution and enhanced evaporation efficiency. An optimal filling ratio between 40% and 60% was identified as the range that minimizes thermal resistance while ensuring operational stability.
Compared with previous studies, which typically report numerical–experimental discrepancies of 3–6%, the present model achieves significantly predictive accuracy. This outcome confirms the robustness of the hybrid phase-change approach and validates the reliability of the developed CFD tool as a predictive design instrument.
Beyond methodological contributions, the study provides valuable insights for the deployment of THPs in advanced thermal management applications. The findings are directly relevant to electronics cooling, renewable energy systems, and sustainable building technologies, where passive, more efficient, and reliable heat transfer solutions are still required. Future research will extend this framework to non-vertical orientations, transient conditions, multiphysics couplings, such as radiation, and surface wetting property in order to further broaden its applicability.
Author Contributions
Methodology, H.M. and A.M.B.; Software, H.M. and A.M.B.; Investigation, Z.L., Y.B. and A.J.; Data curation, H.M. and A.M.B.; Writing—original draft, H.M., Z.L., A.M.B., Y.B. and A.J.; Supervision, Y.B. and A.J. All authors have read and agreed to the published version of the manuscript.
Funding
This research received no external funding.
Institutional Review Board Statement
Not applicable.
Informed Consent Statement
Not applicable.
Data Availability Statement
The original contributions presented in this study are included in the article. Further inquiries can be directed to the corresponding authors.
Acknowledgments
This work was partly funded by the French-Tunisian project PHC-Utique number CMCU-23G1104.
Conflicts of Interest
The authors declare no conflicts of interest.
References
- Ding, L.; Wang, W.; Li, B.; Shuai, Y.; Li, B. Numerical Simulation of a Thermosyphon Radiator Used in Electronic Devices. J. Robot. Mech. Eng. 2021, 1, 1–6. [Google Scholar] [CrossRef]
- Rudman, M. A volume-tracking method for incompressible multifluid flows with large density variations. Int. J. Numer. Methods Fluids 1998, 28, 357–378. [Google Scholar] [CrossRef]
- Temimy, A.A.B.; Abdulrasool, A.A.; Hamad, F.A. Study of heat pipe thermal performance with internal modified geometry. Fluids 2021, 6, 231. [Google Scholar] [CrossRef]
- Caner, J.; Videcoq, E.; Benselama, A.M.; Girault, M. Simulation of a two-phase loop thermosyphon using a new interface-resolved phase change model. Int. J. Heat Mass Transf. 2024, 228, 125607. [Google Scholar] [CrossRef]
- Min, W.; Zhong, W.; Zhang, Y.; Cao, X.; Yuan, Y. Investigation of the condensation mass transfer time relaxation parameter for numerical simulation of the thermosyphon. Int. J. Heat Mass Transf. 2023, 201, 123599. [Google Scholar] [CrossRef]
- Lataoui, Z.; Benselama, A.M. Modelling of heat and mass transfer in a two-phase closed thermosyphon. Energy 2024, 313, 133851. [Google Scholar] [CrossRef]
- Ding, L.; Wang, W.; Peng, B.; Li, B.; Li, B.; Sunden, B. A modified dynamic Lee model for two-phase closed thermosyphon (TPCT) simulation. Numer. Heat Transf. Part B Fundam. 2024, 85, 1041–1055. [Google Scholar] [CrossRef]
- Wang, X.; Zhu, Y.; Wang, Y. Development of pressure-based phase change model for CFD modelling of heat pipes. Int. J. Heat Mass Transf. 2019, 145, 118763. [Google Scholar] [CrossRef]
- Alizadehdakhel, A.; Rahimi, M.; Alsairafi, A.A. CFD modeling of flow and heat transfer in a thermosyphon. Int. Commun. Heat Mass Transf. 2010, 37, 312–318. [Google Scholar] [CrossRef]
- Wang, X.; Yao, H.; Li, J.; Wang, Y.; Zhu, Y. Experimental and numerical investigation on heat transfer characteristics of ammonia thermosyhpons at shallow geothermal temperature. Int. J. Heat Mass Transf. 2019, 136, 1147–1159. [Google Scholar] [CrossRef]
- He, W.; Hong, X.; Zhao, X.; Zhang, X.; Shen, J.; Ji, J. Operational performance of a novel heat pump assisted solar façade loop-heat-pipe water heating system. Appl. Energy 2015, 146, 371–382. [Google Scholar] [CrossRef]
- Zhang, L.; Fan, L.; Hua, M.; Zhu, Z.; Wu, Y.; Yu, Z.; Hu, Y.; Fan, J.; Cen, K. An indoor experimental investigation of the thermal performance of a TPLT-based natural circulation steam generator as applied to PTC systems. Appl. Therm. Eng. 2014, 62, 330–340. [Google Scholar] [CrossRef]
- Hirt, C.W.; Nichols, B.D. Volume of fluid (VOF) method for the dynamics of free boundaries. J. Comput. Phys. 1981, 39, 201–225. [Google Scholar] [CrossRef]
- Unverdi, S.O.; Tryggvason, G. A front-tracking method for viscous, incompressible, multi-fluid flows. J. Comput. Phys. 1992, 100, 25–37. [Google Scholar] [CrossRef]
- Osher, S.; Sethian, J.A. Fronts propagating with curvature-dependent speed: Algorithms based on Hamilton-Jacobi formulations. J. Comput. Phys. 1988, 79, 12–49. [Google Scholar] [CrossRef]
- De Schepper, S.C.K.; Heynderickx, G.J.; Marin, G.B. Modeling the evaporation of a hydrocarbon feedstock in the convection section of a steam cracker. Comput. Chem. Eng. 2009, 33, 122–132. [Google Scholar] [CrossRef]
- Kharangate, C.R.; Mudawar, I. Review of computational studies on boiling and condensation. Int. J. Heat Mass Transf. 2017, 108, 1164–1196. [Google Scholar] [CrossRef]
- Lee, W.H. A pressure iteration scheme for two-phase flow modeling. Multiph. Transp. Fundam. React. Safety Appl. 1980, 1, 407–431. [Google Scholar]
- Ghedira, A.; Lataoui, Z.; Benselama, A.M.; Bertin, Y.; Jemni, A. Simulation of Transpiration Cooling with Phase Change Process in Porous Media. Fluids 2025, 10, 52. [Google Scholar] [CrossRef]
- Lataoui, Z.; Jemni, A. Experimental investigation of a stainless steel two-phase closed thermosyphon. Appl. Therm. Eng. 2017, 121, 721–727. [Google Scholar] [CrossRef]
- Lataoui, Z.; Benselama, A.M.; Jemni, A. Heat Transfer Characteristics of Thermosyphons Used in Vacuum Water Heaters. Fluids 2025, 10, 199. [Google Scholar] [CrossRef]
- Alammar, A.A.; Al-Dadah, R.K.; Mahmoud, S.M. Effect of inclination angle and fill ratio on geyser boiling phenomena in a two-phase closed thermosiphon: Experimental investigation. Energy Convers. Manag. 2018, 156, 150–166. [Google Scholar] [CrossRef]
- Zhang, M.; Lai, Y.; Zhang, J.; Sun, Z. Numerical study on cooling characteristics of two-phase closed thermosyphon embankment in permafrost regions. Cold Reg. Sci. Technol. 2011, 65, 203–210. [Google Scholar] [CrossRef]
- Xu, Z.; Zhang, Y.; Li, B.; Wang, C.C.; Li, Y. The influences of the inclination angle and evaporator wettability on the heat performance of a thermosyphon by simulation and experiment. Int. J. Heat Mass Transf. 2018, 116, 675–684. [Google Scholar] [CrossRef]
- Wu, J.M.; Huang, X.; Zhang, H. Numerical investigation on the heat and mass transfer in a direct evaporative cooler. Appl. Therm. Eng. 2009, 29, 195–201. [Google Scholar] [CrossRef]
- Brackbill, J.U.; Kothe, D.B.; Zemach, C. A continuum method for modeling surface tension. J. Comput. Phys. 1992, 100, 335–354. [Google Scholar] [CrossRef]
- Linstrom, P.J.; Mallard, W.G. The NIST Chemistry WebBook: A chemical data resource on the internet. J. Chem. Eng. Data 2001, 46, 1059–1063. [Google Scholar] [CrossRef]
- Roenby, J.; Bredmose, H.; Jasak, H. A computational method for sharp interface advection. R. Soc. Open Sci. 2016, 3, 160405. [Google Scholar] [CrossRef]
- Romestant, C. Etudes Théoriques et Expérimentales de Caloducs et de Thermosiphons Soumis à de fortes accélérations. Ph.D. Thesis, Université de Poitiers, Poitiers, France, 2000. [Google Scholar]
- Wu, Y.; Zhang, Z.; Li, W.; Xu, D. Effect of the inclination angle on the steady-state heat transfer performance of a thermosyphon. Appl. Sci. 2019, 9, 3324. [Google Scholar] [CrossRef]
- Min, W.; Zhong, W.; Wang, L.; Cao, X.; Yuan, Y. Numerical investigation of the thermal performance of a loop thermosyphon considering dynamic condensation mass transfer time relaxation parameter. Int. J. Heat Mass Transf. 2024, 235, 126210. [Google Scholar] [CrossRef]
- Adnan, S.I.; Ahmad, A.A.; Abdulrasool, A.A. Effect of fill ratio on evaporator wall temperature in a loop thermosyphon used in electronic cooling applications. J. Eng. Sustain. Dev. 2020, 24, 18–29. [Google Scholar] [CrossRef]
Disclaimer/Publisher’s Note: The statements, opinions and data contained in all publications are solely those of the individual author(s) and contributor(s) and not of MDPI and/or the editor(s). MDPI and/or the editor(s) disclaim responsibility for any injury to people or property resulting from any ideas, methods, instructions or products referred to in the content. |
© 2025 by the authors. Licensee MDPI, Basel, Switzerland. This article is an open access article distributed under the terms and conditions of the Creative Commons Attribution (CC BY) license (https://creativecommons.org/licenses/by/4.0/).