Article

A Hybrid CFD and Potential Flow Motion Analysis of Spar Buoys with Damping-Enhanced Appendages

by
Murtala Nyako Musa
and
Deniz Bayraktar Bural
*
Faculty of Naval Architecture and Ocean Engineering, Istanbul Technical University, 34469 Istanbul, Turkey
*
Author to whom correspondence should be addressed.
Fluids 2025, 10(11), 281; https://doi.org/10.3390/fluids10110281
Submission received: 6 October 2025 / Revised: 24 October 2025 / Accepted: 25 October 2025 / Published: 30 October 2025

Abstract

This study investigates the hydrodynamic response of a spar-type buoy equipped with a solid, perforated, and novel corrugated plate appendage introduced here for the first time to enhance motion damping. A hybrid approach combining time-domain CFD simulations and frequency-domain potential-flow analysis was employed, providing a framework to incorporate viscous effects that are often omitted in potential-flow models. In the first stage, free-decay simulations were carried out in ANSYS Fluent for a baseline spar and three appendage-equipped configurations. The resulting heave and pitch decay responses were analyzed to determine natural frequencies and viscous damping coefficients. Prior to that, the CFD solver was validated and verified against published experimental data, confirming the reliability of the numerical setup. In the second stage, frequency-domain hydrodynamic diffraction analysis was conducted in ANSYS AQWA, and the CFD-derived viscous damping coefficients were incorporated into the potential-flow model to improve motion predictions near resonance. The comparison between RAOs with and without viscous damping indicated reductions of approximately 55–62% in heave and 41–60% in pitch at resonance, with the perforated plate consistently yielding the highest damping and lowest RAO peaks. This work introduces the first corrugated plate appendage design for spar buoys and establishes a validated CFD–potential-flow hybrid framework that enables more realistic motion predictions and provides practical design guidance for damping-enhanced spar buoys in offshore energy applications.

1. Introduction

Spar-buoy platforms are widely used in offshore oil exploration and renewable energy applications. They provide stable floating support for deep-sea drilling systems and serve as robust foundations for offshore wind turbines where fixed-bottom solutions are not feasible. Their deep draft and slender cylindrical geometry ensure excellent stability under harsh ocean conditions. They are always stable because their center of buoyancy is above the center of gravity, as pointed out by Ciba et al. [1]. Significant advances in offshore oil production and wind energy have been supported by the development of cylindrical spar platforms.
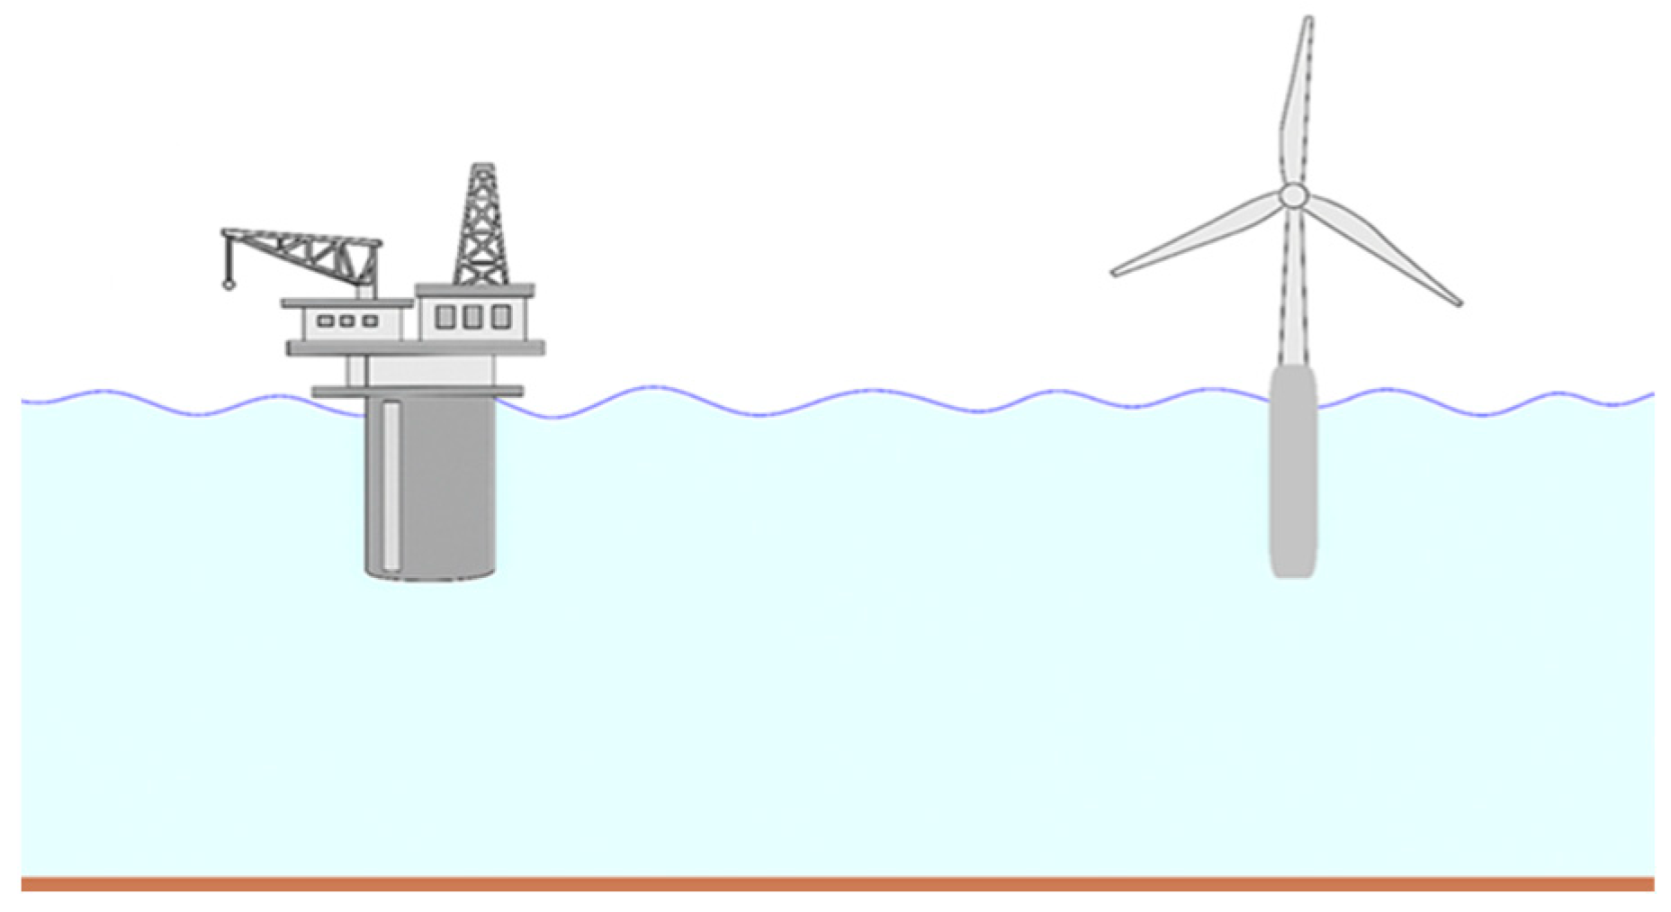
Spar platforms were first used in the oil industry as floating storage and offloading systems. A well-known example is the Devil’s Tower Spar, operated by Dominion Oil in 1710 m of water in the Gulf of Mexico. In September 1996, Oryx Energy deployed the first spar production platform in the Gulf of Mexico, demonstrating their feasibility for deep-water oil extraction [2]. Today, the same technology forms the basis of modern floating offshore wind turbines (FOWTs), linking traditional offshore oil exploitation with renewable energy generation. This transition is especially important because around 80% of the global practical offshore wind energy resource lies in waters deeper than 60 m [3]. Figure 1 shows typical applications of spar-type cylindrical hulls in both oil and gas platforms and floating wind turbines.
Recent studies have focused on improving the motion performance of spar buoys through advances in hydrodynamic analysis and damping enhancement strategies. For example, Lee et al. [4] investigated the effect of hull flexibility on a 15 MW spar-type floating offshore wind turbine and found that flexibility shifts natural frequencies and increases nacelle accelerations and tower-base bending moments, while the 6-DOF motion platform and mooring tensions remain largely unchanged, underscoring its importance in large-scale FOWT performance analysis.
Several experimental studies have been conducted on spar buoys. For instance, Hegde et al. [5] investigated spar-buoy platforms with heave plates through wave tank experiments and numerical simulations. Using 1:100 scale models, they compared configurations with plates at the keel and near the free surface. Results showed that a spar buoy-form with a heave plate near the free surface reduced peak heave response by about 75% and pitch by around 30%, demonstrating significant motion suppression and recommending this configuration for practical design applications. Capobianco et al. [6] conducted an experimental study on cylindrical buoys to assess their accuracy in wave measurement. Eleven configurations, eight of which had disks at the waterline, were tested in a basin. Transfer functions were determined in regular waves and then applied to irregular wave measurements. Their analysis concluded that a buoy with a medium-sized disk provides the best compromise, accurately following the free surface while minimizing parasitic motions. Zhu et al. [7] experimentally investigated the effect of heave plates on motion suppression for a cylindrical floating structure. Their wave flume tests showed that heave plates significantly increase added mass and reduce the peak heave Response Amplitude Operator (RAO) by about 40% compared to a plain cylinder. Similarly, Tao et al. [8] experimentally studied the influence of solid and porous heave plates on added mass and damping in offshore structures. Bernal-Camacho et al. [9] experimentally demonstrated that a Centerboard and Heave plate (CH) system significantly enhances the stability of a Floating Offshore Wind Turbine (FOWT). Testing in a Wave–Wind Flume, they recorded an average 27% reduction in pitch motion and a 25% mean decrease in surge, heave, and pitch responses across various sea states, validating the efficacy of appendages for motion suppression.
As an alternative to experimental approaches, computational fluid dynamics (CFD) and potential flow solvers have become increasingly important tools for offshore platforms. These numerical tools enable accurate prediction of floating platform responses under complex fluid–solid interactions [10]. Advances in computational power now allow detailed analyses of flow–structure interactions, including vortex shedding induced by spar motion and its influence on wake characteristics [11]. Although these simulations are computationally intensive, the availability of high-performance computing enables such complex problems to be addressed within practical timeframes.
Several numerical studies have investigated the hydrodynamic performance of spar buoys and floating offshore wind turbines (FOWTs). Nematbakhsh et al. [12] employed a nonlinear Navier–Stokes model to analyze a 5 MW spar-buoy wind turbine under both extreme and operational sea states. Their approach captured large platform motions and nonlinear hydrodynamics without relying on experimental data or linearizing assumptions. They reported that higher aspect ratios reduce mean pitch and surge but may introduce nonlinear trends in the response standard deviations due to increased environmental loading. Similarly, Silva et al. [13] used a statistical quaternization method to efficiently model the nonlinear, second-order response of an FOWT. Their approach accurately captured mooring forces and wave–current interactions by replacing nonlinearities with equivalent polynomial terms, solved via Volterra theory, and demonstrated excellent agreement with time-domain simulations at a computational cost roughly one hundred times lower. Xue [14] developed a novel spar-buoy concept to support a 10 MW wind turbine by upscaling an existing 5 MW design. Using a coupled numerical model, they showed that the blade pitch controller can excite significant platform resonances and reported that the spar concept exhibits the largest surge oscillations among various platform types, whereas a semi-submersible shows larger pitch motions, and a TLP with taut moorings shows the smallest motions overall. Finally, Son et al. [15] analyzed the motions of a newly developed lightweight buoy and, using CFD-based free-decay tests, estimated viscous damping coefficients and incorporated them into potential-flow simulations. Their results showed that the addition of appendages significantly reduced heave and pitch motions, enhancing buoy performance under wave conditions.
Hybrid experimental–numerical approaches are often used to validate and improve the fidelity of numerical models; in this case, the numerical model is used as a supplement to the experimental model. For instance, An et al. [16] investigated the forced harmonic heave motions of submerged perforated rectangular plates through combined experiments and numerical modelling. By integrating potential-flow theory with viscous pressure loss and a boundary element method, they predicted added mass and damping coefficients that agreed well with experimental results, particularly at greater submergence depths. Yu et al. [17] employed a combined experimental and RANS-based CFD approach to analyze a two-body point absorber wave energy converter. Their results showed that nonlinear effects, including viscous damping and wave overtopping, significantly reduce system motions and power absorption, especially in larger waves. Similarly, Rao et al. [18] combined experiments and simulations to study spars with circular heave plates and reported significant nonlinear damping effects. Plate size, location, and spacing strongly influenced both damping and added mass, offering practical guidance for heave compensation device design; however, Rao’s plates do not have perforations. Srinivasamurthy et al. [19] experimentally investigated spar platforms with damping plates for floating offshore wind turbines and showed that the Type-B and Type-C plate configurations effectively reduced pitch response compared with a classic spar, improving platform stability under wave loading. Although it deals with heave plates, it does not have perforation or corrugation, as in the present study. Colling et al. [20] examined the free-decay heave motion of a spherical buoy through experiments and VOF-based simulations, demonstrating how draft strongly affects oscillation frequency and damping. While their work provides insights for buoy design in energy applications, the present study advances this by analyzing spar buoys with multiple appendages using a hybrid CFD–potential flow framework, focusing on viscous damping and motion reduction in heave and pitch.
Hybrid numerical models that combine fundamentally different governing principles, such as CFD and potential-flow solvers, offer a powerful approach to capturing viscous effects and improving the reliability of load response predictions. For example, Yang et al. [21] investigated the load response of a 10 MW floating offshore wind turbine (FOWT) on a semi-submersible platform using CFD and hydrodynamic correction methods. By comparing damping-, drag-, and hybrid-based correction approaches, they found that the hybrid method, which combines both drag and damping coefficients, most accurately captured viscous effects and improved load-response predictions. Their results highlight the importance of integrating free-decay data with real-world conditions to enhance the accuracy of hydrodynamic modelling for large-scale FOWTs. A common approach to determine the added mass and damping coefficients of floating bodies is the free-decay test in calm water, traditionally performed with physical scale models. More recently, CFD simulations have been used to replicate these tests, allowing a detailed evaluation of viscous effects. For instance, Bezunartea et al. [22] investigated scale effects on heave-plate hydrodynamics for floating wind platforms and showed that motion amplitude (KC number) has a much stronger influence on hydrodynamic coefficients than the scale factor itself.
Corrugated surfaces have been investigated in various hydrodynamic contexts, mainly for their capability to modulate flow separation and mitigate vortex-induced vibrations. Yu et al. [23] experimentally analyzed a circular cylinder with symmetrically arranged corrugated surfaces and reported substantial reductions in mean drag (≈58%) and fluctuating lift (≈82%), attributed to modified shear-layer development and wake vortex reorganization. Their results demonstrated that surface corrugation can effectively weaken vortex coherence and suppress unsteady loading through flow modulation. Zhao [24] numerically investigated the vortex-induced vibration (VIV) of a circular cylinder in spanwise shear flow and showed that transitions between vortex-shedding modes (2S–2P–2T) strongly influence vibration amplitude and frequency response, underscoring the sensitivity of bluff-body dynamics to wake topology. Together, these studies provide a physical foundation for the present work, in which corrugation is not employed for drag reduction or VIV suppression but rather as a plate-type hydrodynamic appendage aimed at enhancing viscous damping of a spar buoy under oscillatory wave-induced motion.
Building on these advances, the present study develops a hybrid CFD–potential flow framework to evaluate the motion performance of a cylindrical spar buoy while accurately capturing viscous damping effects and maintaining computational efficiency. Four spar configurations are examined under identical conditions: a baseline cylinder, a solid heave plate, a perforated plate, and a corrugated plate introduced as a novel damping mechanism. The analysis focuses on heave and pitch motions, where restoring forces are well-defined and appendages have a dominant influence on damping behavior. By benchmarking the corrugated plate against conventional alternatives, the study demonstrates how geometry-driven flow manipulation can enhance damping efficiency without significantly increasing added mass.
This work addresses a critical gap in prior studies, which have largely concentrated on spar-type buoys equipped with solid or perforated heave plates analyzed using potential-flow models that neglect viscous effects. Limited attention has been given to geometry-induced damping enhancement through structured or corrugated surfaces. To fill this gap, the present study introduces and evaluates a corrugated plate appendage as a novel passive damping mechanism within a hybrid CFD–potential flow framework. The approach quantitatively links geometry-driven flow behavior with viscous damping performance, thereby improving the predictive accuracy of motion analysis and providing new design insights for damping-optimized floating structures.

2. Hybrid Numerical Framework Methodology

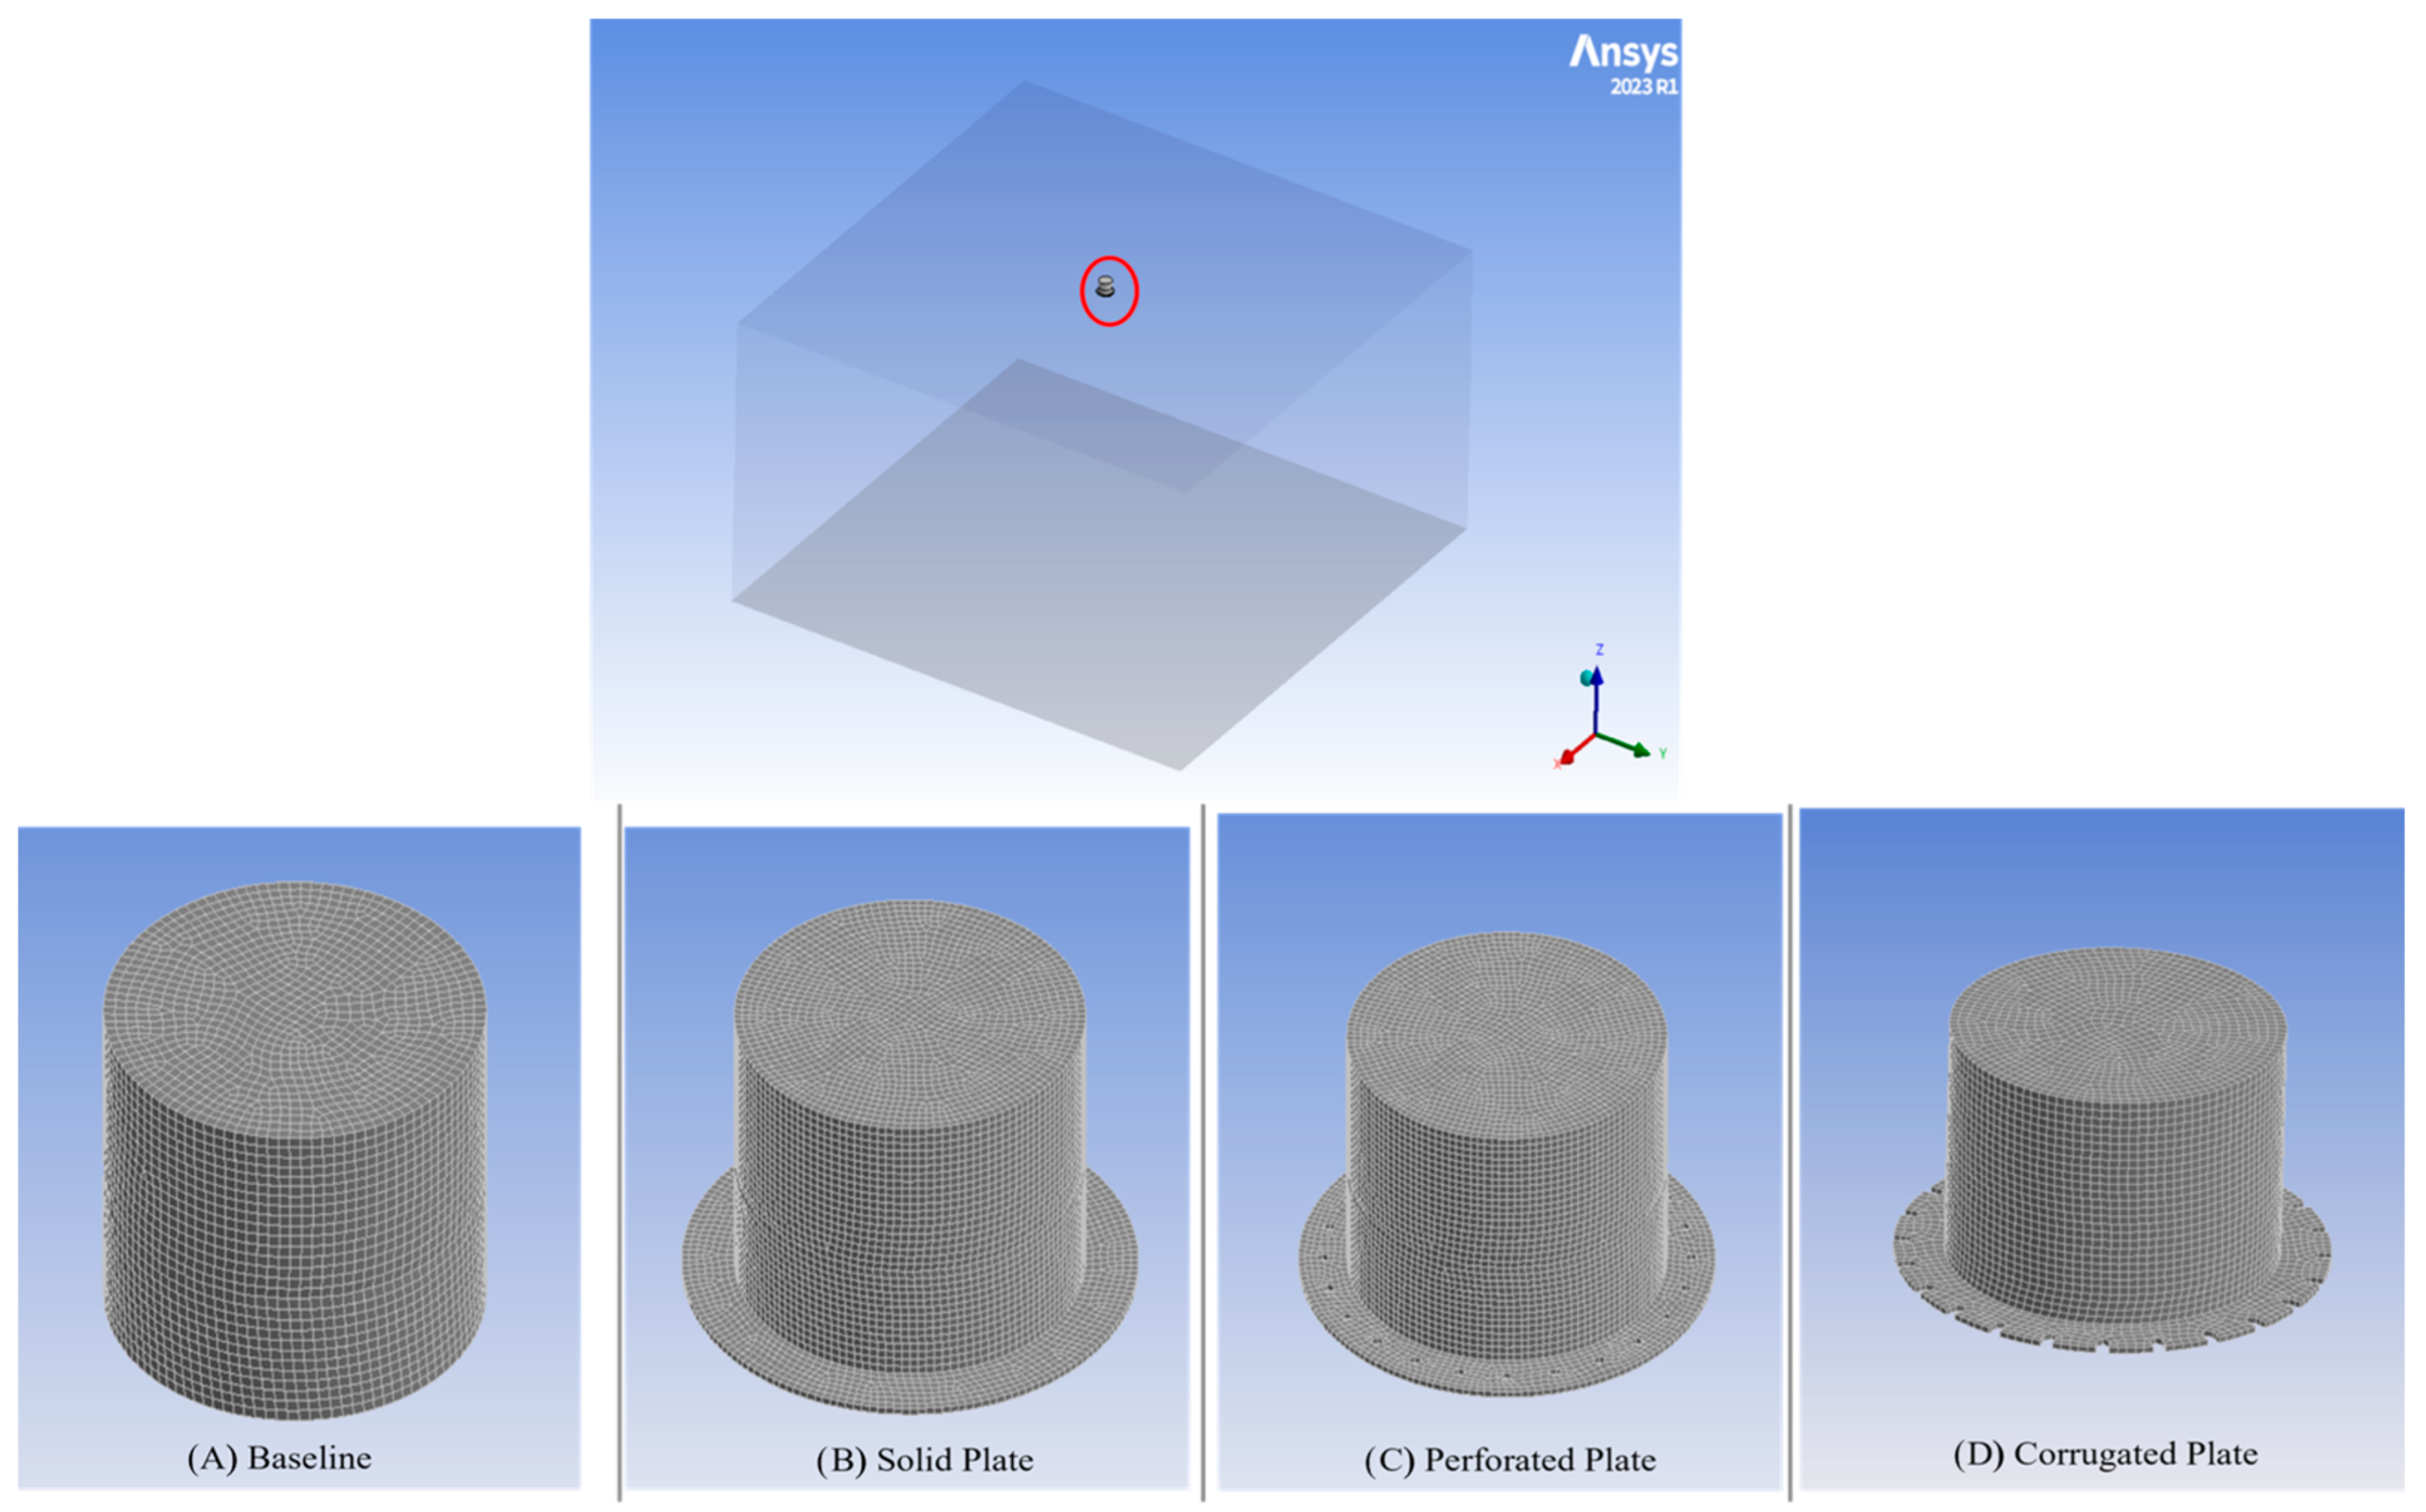
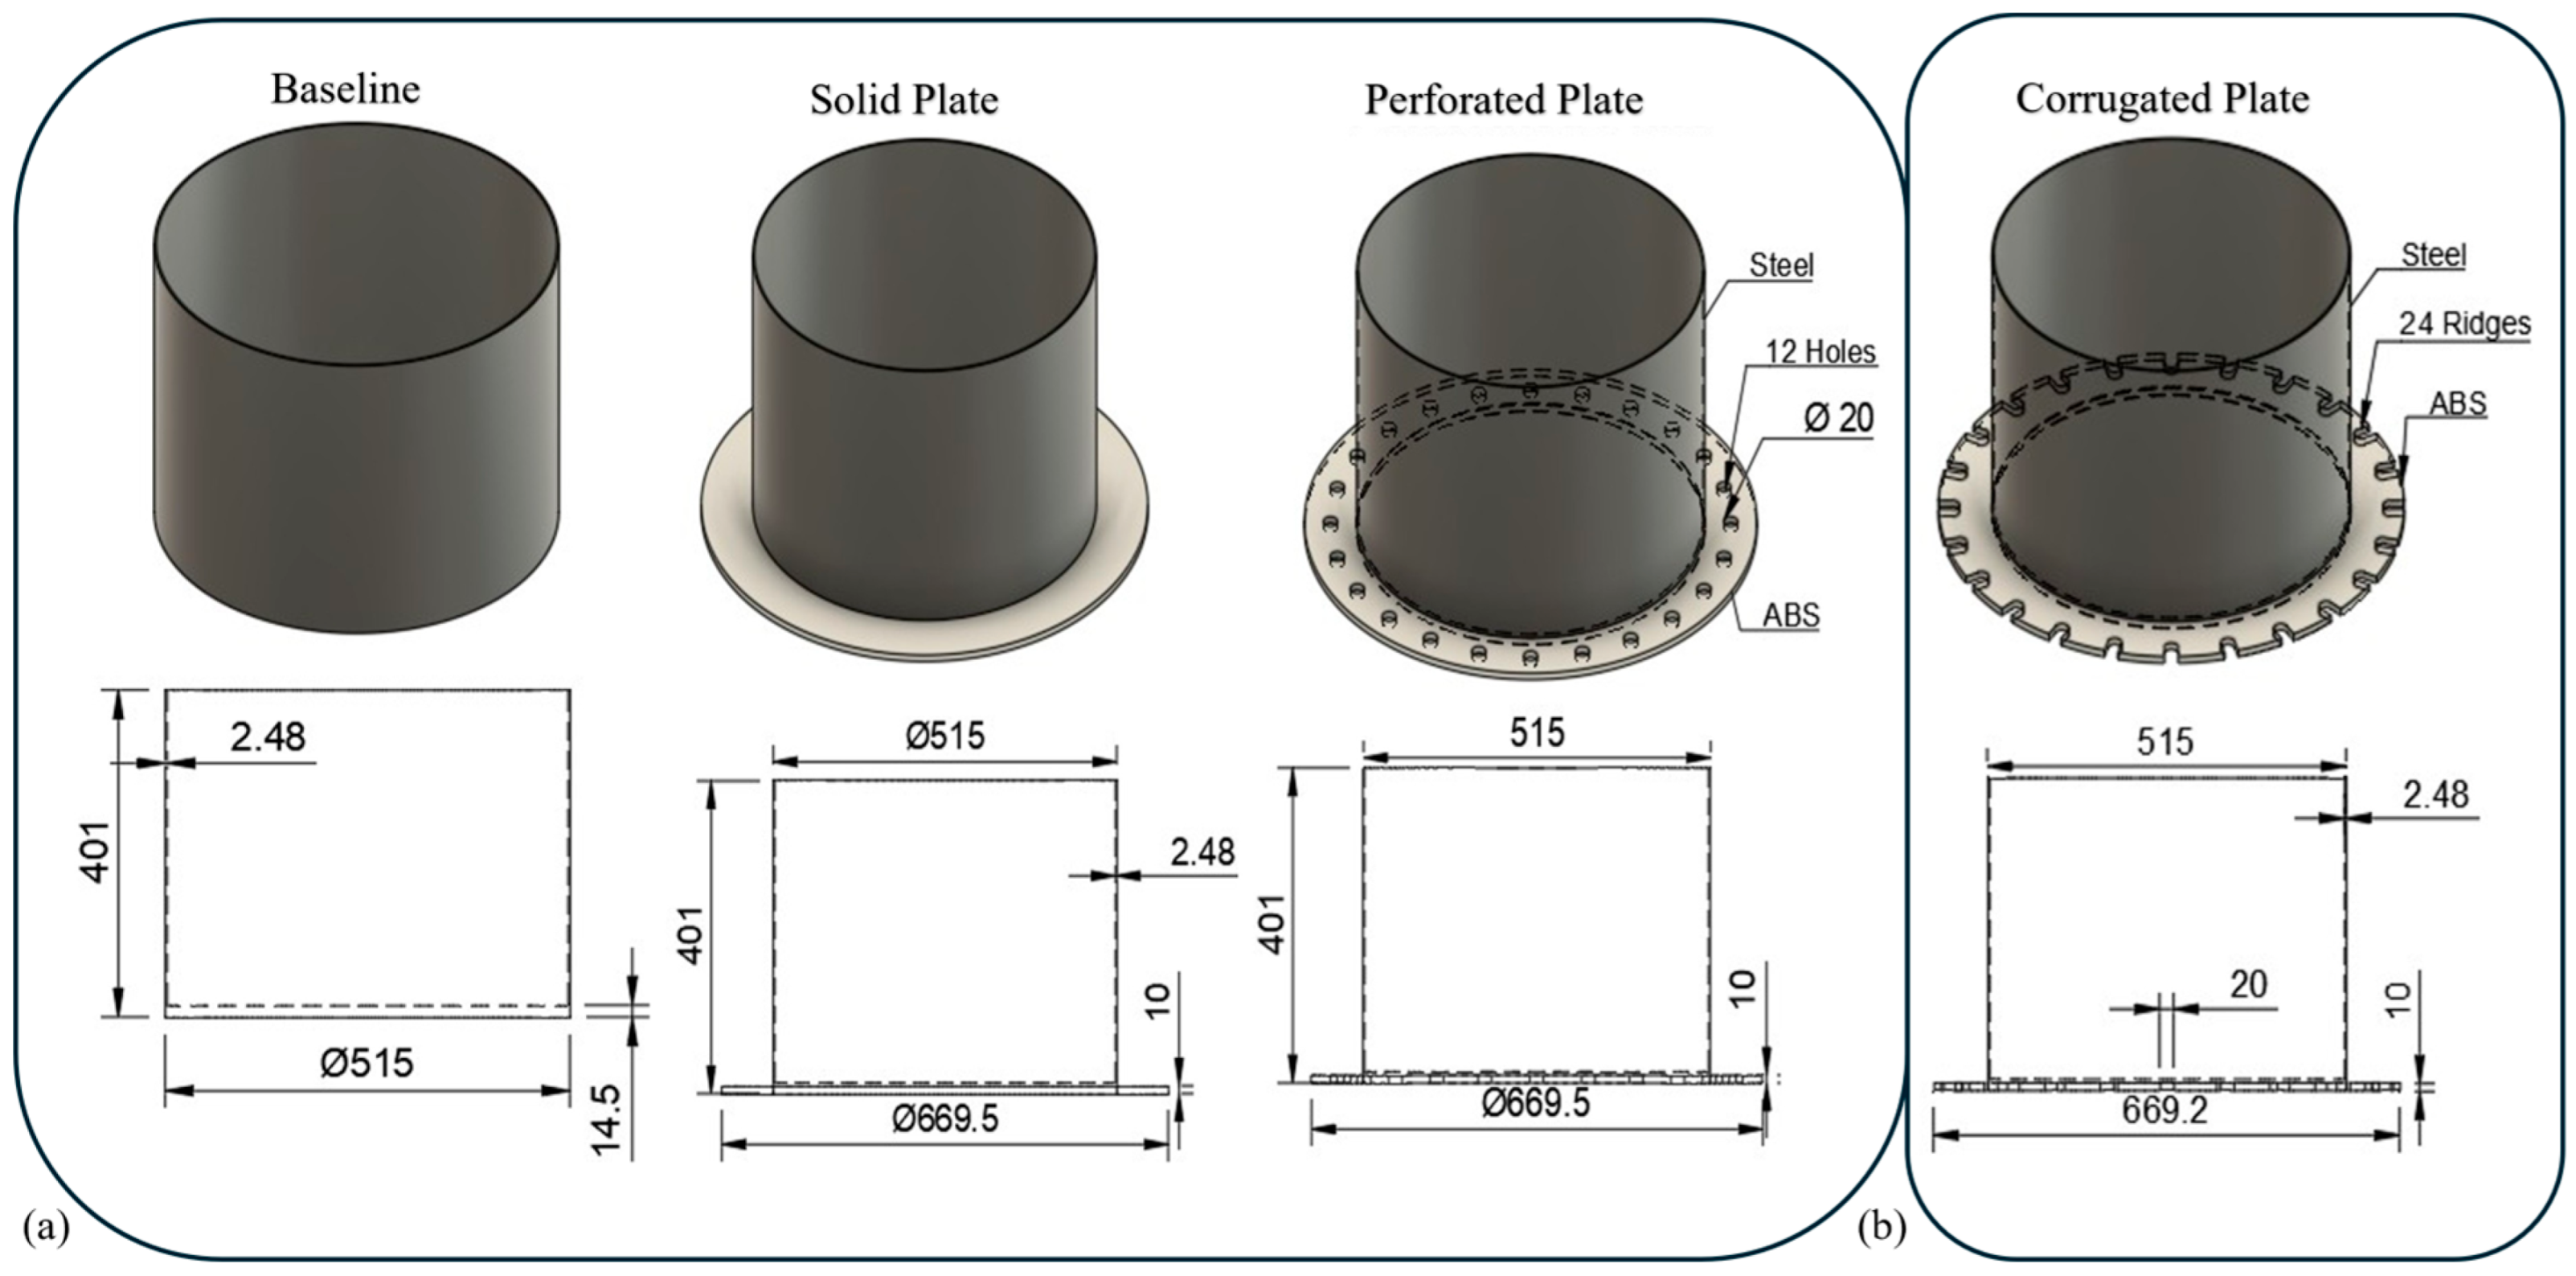
Four spar cylinder configurations were examined using a consistent numerical model scale: (i) a bare (baseline) spar, (ii) a solid plate appendage, (iii) a perforated plate appendage, and (iv) a corrugated plate appendage. The Baseline, Solid Plate, and Perforated Plate are grouped as conventional appendages, similar to those examined in earlier studies, such as [1,5,18,19,25,26], and provide useful reference cases for comparison. In contrast, the Corrugated Plate introduces a new design concept, intended to improve damping by altering the surface geometry and increasing the plate edge perimeter. Figure 2 illustrates the spar cylinder along with the detailed geometries of all appended configurations.
The Baseline configuration consists of a smooth cylindrical spar fabricated from steel, with a diameter of 0.515 m. All appendage configurations incorporating plates employ a heave plate manufactured from acrylonitrile butadiene styrene (ABS) plastic, which was selected as a lightweight material to limit the increase in structural mass relative to the steel hull. The heave plate diameter is set at 1.3 times that of the spar cylinder. In the Solid Plate configuration, the plate is continuous, whereas the Perforated Plate configuration incorporates 24 uniformly distributed circular openings of equal size. The Corrugated Plate configuration replaces the perforations with 24 radial ridges designed to enhance hydrodynamic interaction by increasing the perimeter of the plate edge.
The inclusion of plates increases the total mass by approximately 4% relative to the Baseline case; the associated increase in buoyancy counteracted this effect, ensuring that the hydrostatic stability of all configurations was preserved. The configurations and their respective dimensions in millimeters are illustrated in Figure 2.
The principal hydrostatic characteristics of the baseline and appendage-equipped configurations were evaluated to provide input for the subsequent motion analysis. These include displacement volume, draft, centers of gravity (CG) and buoyancy (CM), metacentric height (GM), and mass moment of inertia. The results are summarized in Table 1. These quantities form the basis for the restoring stiffness terms C33 (heave) and C55 (pitch), as well as for the effective mass and inertia definitions, with the corresponding equations given in Section 2.2 Governing Equations of Motion. Notably, the mass increase due to the plate appendages was limited to approximately 4% relative to the baseline, with minimal impact on draft and buoyancy, which remains within acceptable limits. This is evident from the draft in Table 1 below.

2.1. Coupling Procedure and Study Workflow

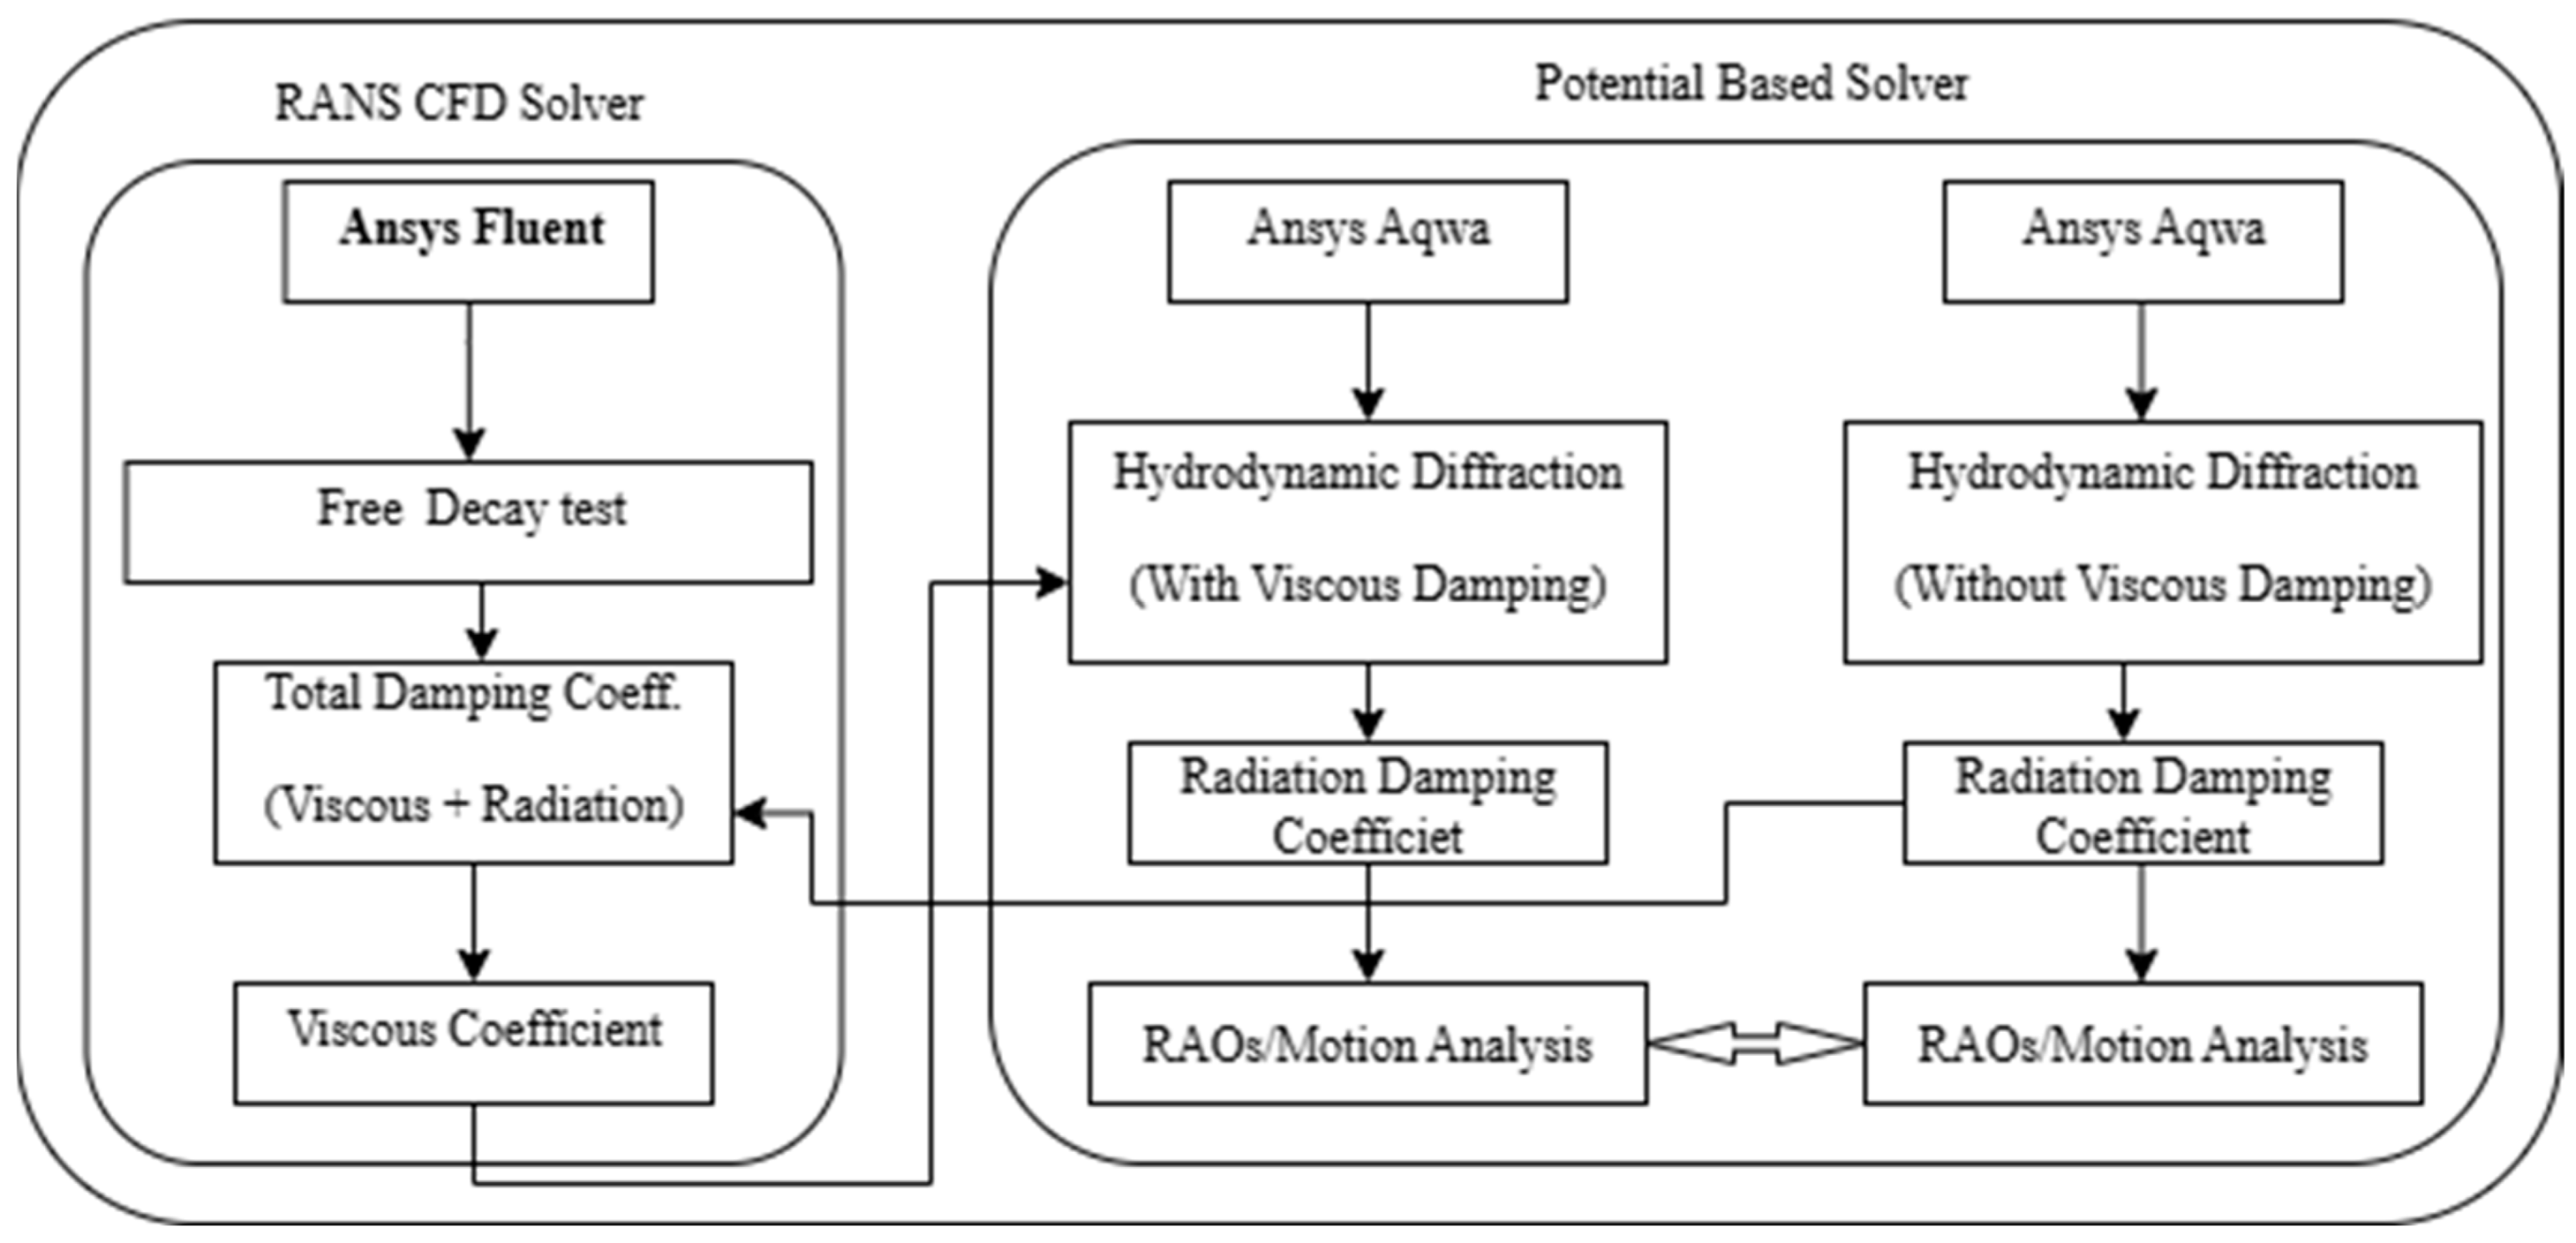
This study implements a hybrid numerical framework that couples a RANS-based CFD solver (ANSYS Fluent) with a potential-flow solver (ANSYS AQWA) to predict RAOs with explicit inclusion of viscous effects. The overall procedure, illustrated in the workflow diagram in Figure 3, begins with free-decay simulations in Fluent for heave and pitch, yielding decay curves from which the total damping coefficients were calculated using the logarithmic decrement ratio, as defined in Equation (17) in Section 2.3. At the corresponding decay natural frequencies, radiation damping coefficients were obtained from AQWA and subtracted from the total damping to isolate the viscous component, following Equation (20) in Section 2.3. These viscous damping coefficients were then incorporated into AQWA’s hydrodynamic diffraction analysis to compute RAOs, ensuring that both radiation and viscous effects were represented in the motion predictions. This procedure was applied to all configurations to enable consistent comparison of their hydrodynamic performance under regular wave forcing.

2.2. Governing Equations

The motion of a floating body subjected to wave-induced forces is governed by second-order differential equations, accounting for inertia, damping, and restoring forces. The general form of the equation of motion [27], is given by:
M x ¨ ( t ) + B x ˙ ( t ) + C x ( t ) = F ( t )
Here M denotes the generalized mass matrix (kg), incorporating both structural and added mass components. B is the hydrodynamic damping matrix (kg/s), while C is the stiffness matrix (kg/s2) representing restoring forces. The vector x(t) describes the translational and rotational displacements, and F(t) represents the external force vector.
For the heave and pitch degrees of freedom, the governing equations can be decoupled and written as:
( M 33 + a 33 ) z ¨ + B 33 z ˙ + C 33 z = F z ( t )
( I 55 + a 55 ) θ ¨ + B 55 θ ˙ + C 55 θ = T θ ( t )
In Equations (2) and (3), z denotes the vertical (heave) displacement of the floating body in meters, and θ represents the pitch angle in radians. M33 and I55 correspond to the structural mass and mass moment of inertia, respectively, while a33 and a55 refer to the added mass and added moment of inertia components. The coefficients B33 and B55 account for hydrodynamic damping (in kg/s), and C33 and C55 represent the hydrostatic restoring stiffness (in kg/s2). The terms Fz(t) and Tθ(t) denote the external wave-induced force and moment acting on the body in the heave and pitch directions, respectively.
The governing fluid motion is described by the continuity and Reynolds-Averaged Navier–Stokes (RANS) equations. For incompressible, turbulent flow, the continuity equation is expressed as [28]:
u x + v y + w z = 0
The RANS momentum equations in the x, y, and z directions are:
ρ u t + u u x + v u y + w u z = p x + μ 2 u x 2 + 2 u y 2 + 2 u z 2 + f x
ρ v t + u v x + v v y + w v z = p y + μ 2 v x 2 + 2 v y 2 + 2 v z 2 + f y
ρ w t + u w x + v w y + w w z = p z + μ 2 w x 2 + 2 w y 2 + 2 w z 2 + f z
Here ρ is the fluid density, u, v, and w are the velocity components in each direction, p is the pressure, μ is the dynamic viscosity of the fluid and f x , f y and f z denote the body forces per unit volume, such as gravity. ANSYS Fluent solves these equations using the Finite Volume Method (FVM) [29], which discretizes the computational domain into control volumes. The governing equations are then integrated over each control volume, ensuring local conservation of mass and momentum.
The hydrodynamic analysis in ANSYS AQWA is based on the linear potential-flow theory, assuming the fluid to be inviscid, incompressible, and irrotational [30,31]. The total velocity potential, ϕ, is expressed as
ϕ = ϕ I + ϕ D + j = 1 6   ξ j ϕ R j
where ϕI is the incident potential, ϕD the diffraction potential, and ϕRj the radiation potential corresponding to a unit motion in the j-th degree of freedom. Each potential satisfies the Laplace equation in the fluid domain,
2 ϕ = 0
subject to the linearized boundary conditions for small-amplitude waves. The free-surface condition is given as
2 ϕ t 2 + g ϕ z = 0   at   z = 0
The seabed condition is
ϕ z   =   0   at   z = h
and the body-surface condition is expressed as
ϕ n = V b n
where g denotes gravitational acceleration, h is the water depth, n is the outward unit normal vector on the body surface, and Vb is the body velocity vector. Solving these boundary-value problems yields the frequency-dependent hydrodynamic coefficients of added mass aij(ω) and radiation damping rij(ω) and wave-excitation force F i e x c (ω), which are related by
F i ( ω ) = F i e x c ( ω ) j = 1 6   r i j ( ω ) + i ω a i j ( ω ) ξ j ( ω )
These coefficients form the linear frequency-domain equation of motion used to compute the response-amplitude operators (RAOs):
ω 2 ( M + a ( ω ) ) + i ω r ( ω ) + C ξ ( ω ) = F e x c ( ω )
where M and C denote the structural mass and hydrostatic restoring-stiffness matrices, respectively.
The hydrodynamic added-mass and radiation-damping coefficients are obtained over the wetted body surface Sb as
a i j ( ω ) = ρ ω I S b   Φ R i Φ R j * n d S , r i j ( ω ) = ρ R S b   Φ R i Φ R j * n d S
where ΦRi is the radiation potential due to a unit motion in the i-th degree of freedom, ρ is the water density, and the operators [⋅] and [⋅] denote the real and imaginary parts corresponding to radiation damping and added mass, respectively.
The natural frequency and total damping ratio of each motion mode i can then be expressed as
ω n , i = C i i M i i + a i i ω n , i , ζ i = B i i 2 M i i + a i i C i i ,
where Bii denotes the overall damping coefficient including both radiation and viscous components.
The corresponding frequency-response function or Response-Amplitude Operator (RAO) is defined as
R A O i ( ω ) = ξ i ( ω ) A
with A being the incident-wave amplitude.
In the present study, the heave RAO is reported in nondimensional form as the ratio between the heave response amplitude and the incident-wave amplitude, ∣Z∣/A, while the pitch RAO is reported in dimensional form as the angular response amplitude per unit incident-wave amplitude, expressed in degrees per meter.
The hydrodynamic coefficients obtained from AQWA are subsequently coupled with the viscous-damping components derived from CFD simulations (see Section 2.3 Separation of Damping Components) to form the hybrid prediction framework.

2.3. Separation of Damping Coefficient

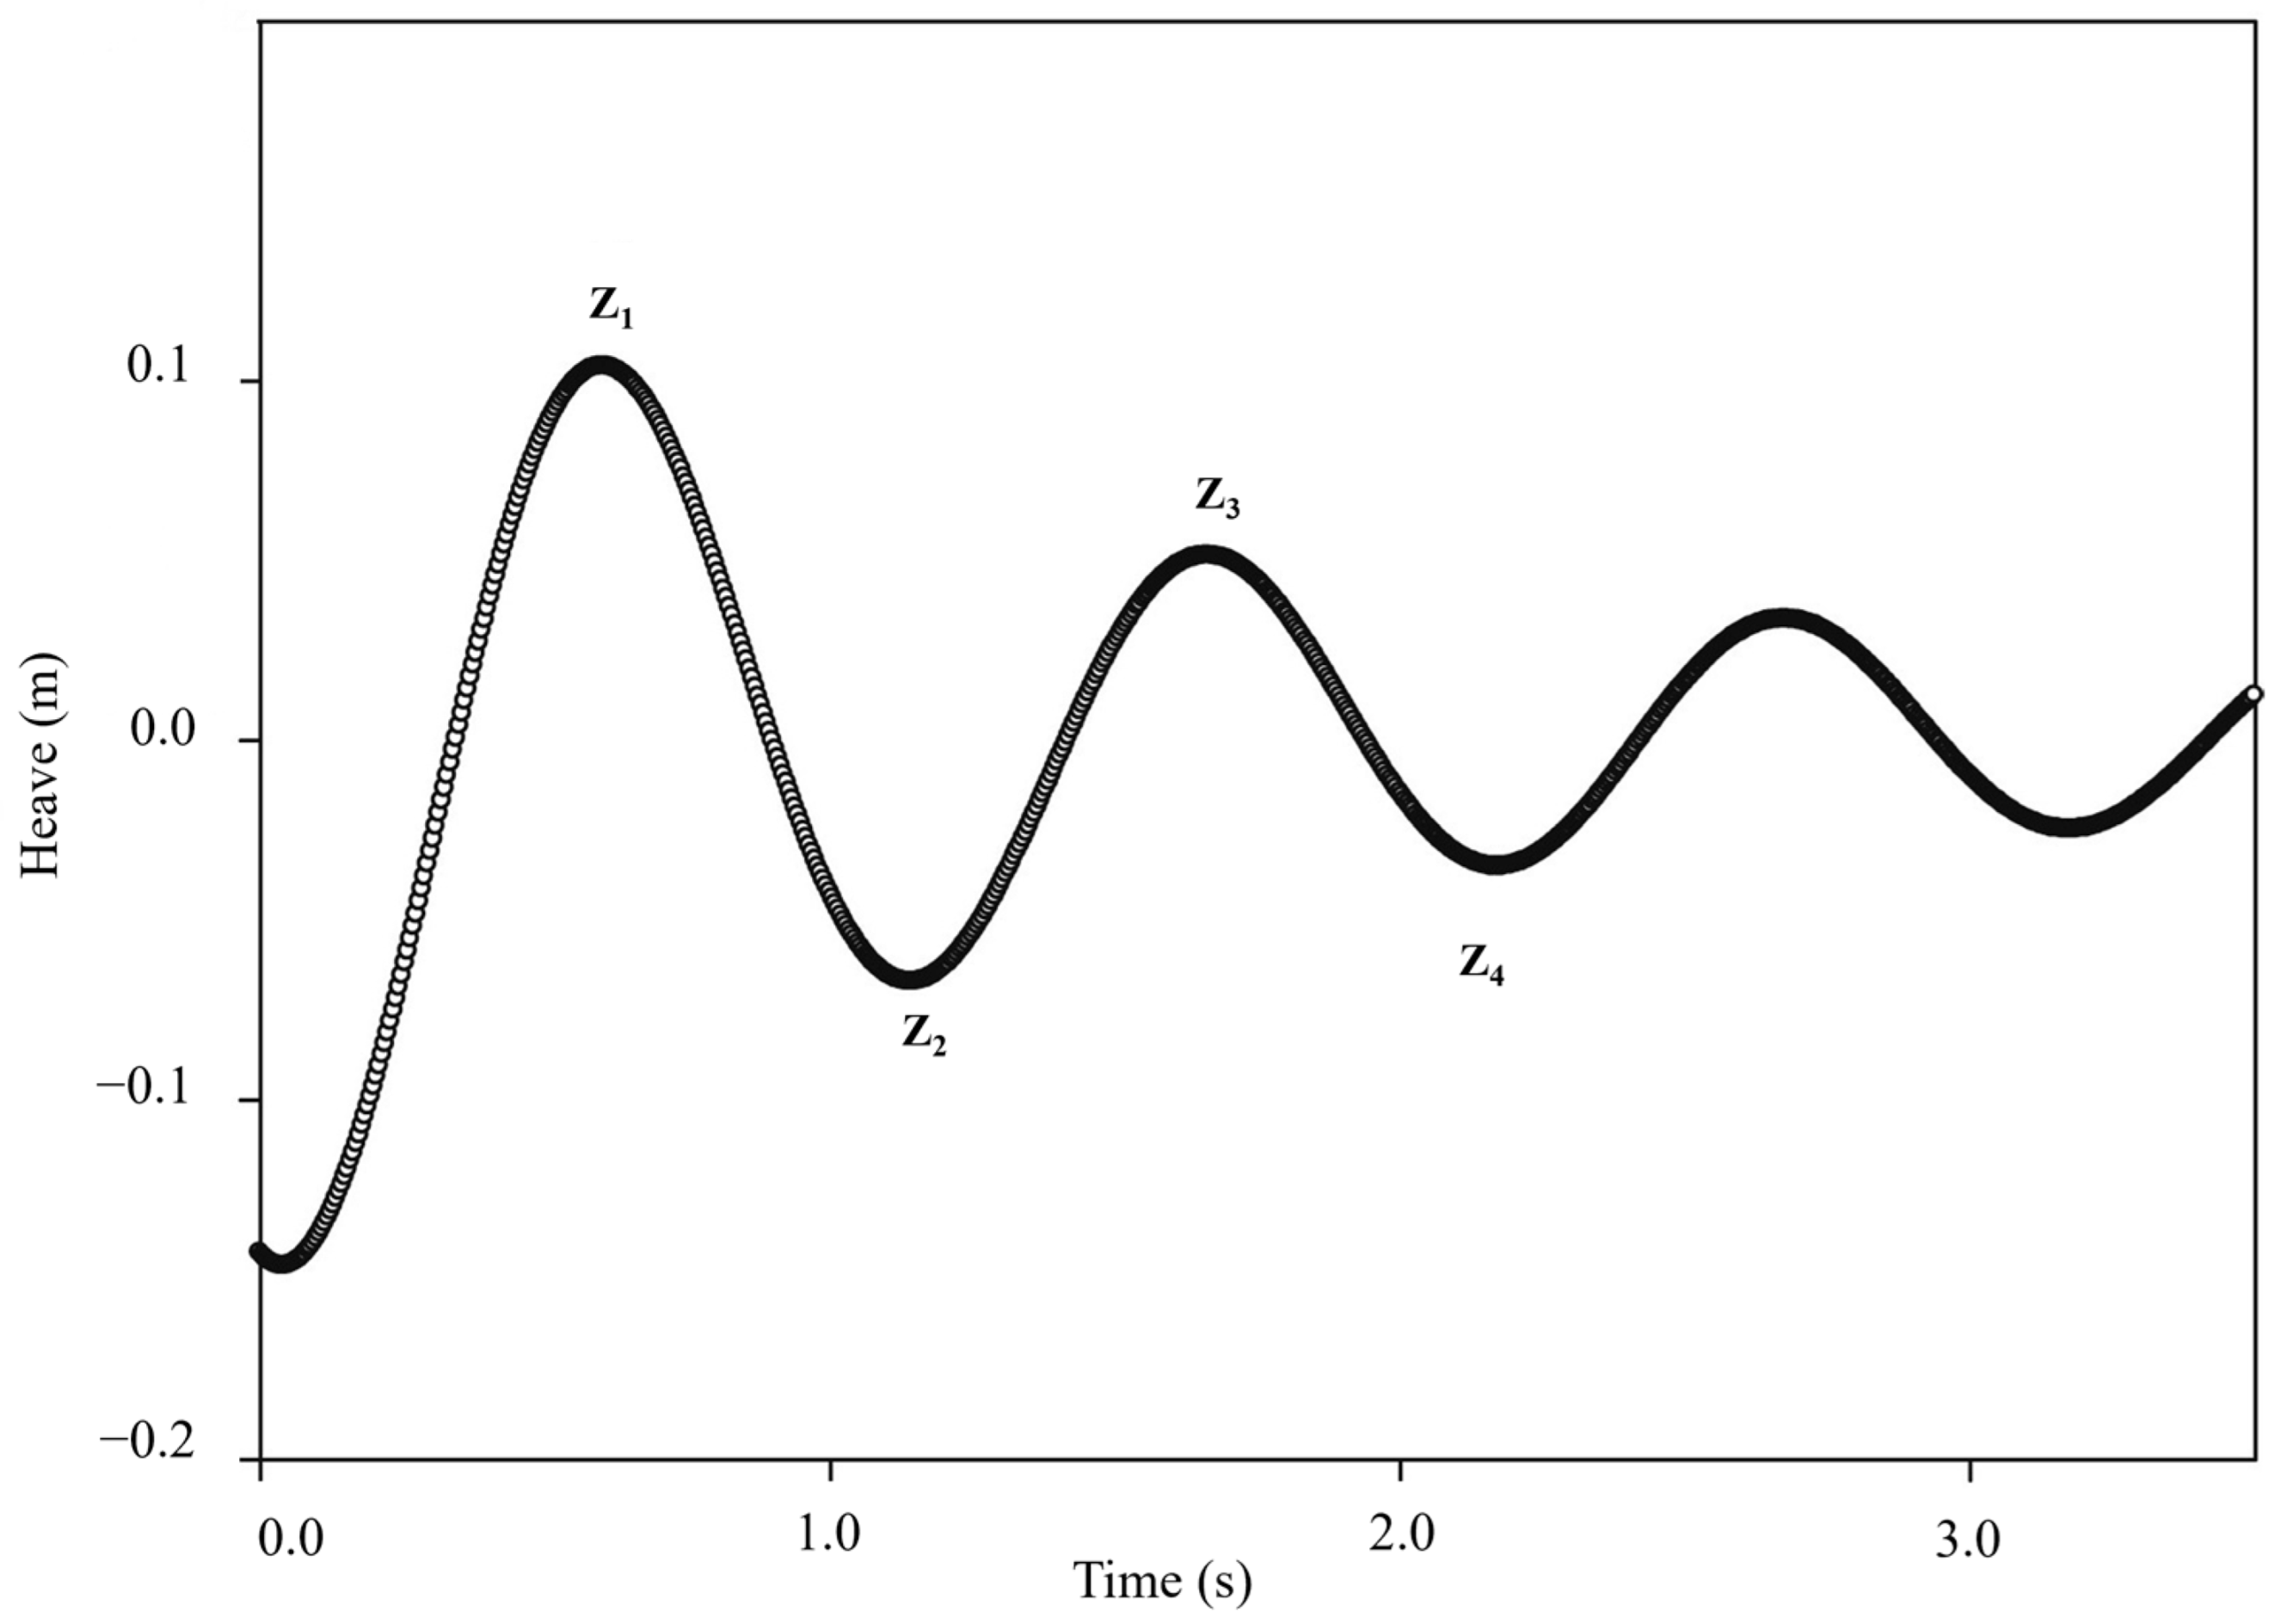
The viscous damping coefficients for heave and pitch are estimated from free decay tests, where one degree of freedom is isolated. This decoupling enables the application of simplified motion equations (Equations (2) and (3)). The damping ratio ζ is calculated using the logarithmic decrement method [31] as defined in Equation (16), based on four successive extrema, two peaks, and two troughs from the free decay curve shown in Figure 4. It should be noted that Figure 4 shows a representative heave-free decay curve only to illustrate the logarithmic decrement procedure described in Equation (16). The full CFD decay results for all configurations are presented later in Section 5.
ζ = 1 2 π l n z 1 z 2 z 3 z 4
Once ζ is determined, the total damping coefficient Bii or heave (i = 3) and pitch (i = 5) is obtained as [26]:
B i i = 2 ζ i i M i i + a i i C i i             i = 3,5
where Mii denotes the structural mass (or moment of inertia), aii the added mass (or added moment of inertia), and Cii is the hydrostatic restoring stiffness.
The stiffness terms for heave and pitch are computed using the equation below [32]:
C 33 = ρ g A w
C 55 = ρ g G M
where Aw is the waterplane area, is the displaced volume, and GM is the metacentric height.
To separate the viscous effects from the total damping obtained in CFD, radiation damping riio) obtained from AQWA at the natural frequency ωo are subtracted from Bii as expressed in Equation (20a,b):
B v i s c o u s   =   B t o t a l     B R a d i a t i o n
        b i i , v i s = B i i r i i ω o         i = 3,5
The viscous damping coefficient B v i s c o u s was determined from the results of free-decay simulations performed in ANSYS Fluent, following a systematic procedure to isolate viscous effects from the total damping. During the decay tests, the spar buoy was displaced in heave and pitch from its equilibrium position and released to oscillate freely under gravity and hydrostatic restoring forces. The resulting time-history decay curves of motion amplitude were recorded and analyzed to determine the total damping coefficient B t o t a l using the logarithmic-decrement method defined in Equation (16). This method evaluates damping from the exponential decay of successive oscillation peaks, thus capturing both radiation and viscous contributions present in the CFD solution. To isolate the viscous component, the radiation-damping coefficients r i i ω o corresponding to the natural frequencies identified from the decay tests were obtained independently from ANSYS AQWA. The viscous damping term B v i s c o u s was then calculated as the residual difference between the total damping from CFD and the radiation damping from the potential-flow analysis, as shown in Equation (20a,b). Once computed, the B v i s c o u s values were implemented in AQWA as external linear damping coefficients for the heave (i = 3) and pitch (i = 5) modes. These coefficients were combined with AQWA’s frequency-dependent radiation damping during the RAO analysis, enabling the hybrid framework to incorporate nonlinear viscous effects into the AQWA potential-flow solver.
As for hydrostatics, the metacentric height GM is given by:
GM = BMBG
where BM is the distance from the center of buoyancy to the metacenter, and BG is the distance from the center of buoyancy to the center of gravity. Finally, the effective mass and moment of inertia for each mode are expressed as
m e f f = C h e a v e ω d _ H e a v e 2
I e f f = C P i t c h ω d _ P i t c h 2

3. CFD Modeling and Verification

Section 3 presents the CFD methodology, including the model setup, computational domain, and boundary conditions (Section 3.1). The validation of the CFD model is described in Section 3.2, ensuring the accuracy and reliability of the simulation results. Section 3.3 covers the mesh-convergence analysis, and Section 3.4 details the setup and procedure of the free-decay simulations. The corresponding results for all configurations are discussed later in Section 5.

3.1. CFD Model Set-Up, Computational Domain and Boundary Conditions

The CFD simulations for the free-decay tests of all appendage configurations were performed in ANSYS Fluent 2023 R1 using a three-dimensional, pressure-based, transient solver. To capture the air–water free surface, the Volume of Fluid (VOF) method was employed. The interface between the phases was tracked by solving a continuity equation for the volume fraction of the secondary phase (water) [33,34]
α t + ( α v ) = 0
where α is the volume fraction of water, t is time, and v is the velocity vector. Both fluids share a single set of momentum equations (Equation (5a–c)), and their properties in each control volume are volume-weighted according to
ρ = α ρ water   + ( 1 α ) ρ air  
In the VOF formulation, the free surface is implicitly reconstructed from the transport of the volume fraction. Surface tension effects at the interface are modeled using the continuum surface-force approach, allowing accurate resolution of free-surface deformation during the oscillatory decay motion of the spar buoy. This setup provides a consistent transition to the subsequent meshing and boundary-condition configuration used in the CFD analysis.
Several previous studies on free-surface wave simulations have successfully employed the k–ε turbulence model [1,35,36,37]. Building on this knowledge, the present work adopts the same k–ε turbulence model as well, as it offers a practical balance between computational efficiency and accuracy while reliably capturing flow separation and vortex shedding in free-surface applications. For the present simulations, a fixed time step of 0.0005 s was applied; this ensures stable numerical resolution of transient free-surface behavior.
The computational domain was defined as a rectangular box of 4 × 4 × 2 m, with the spar buoy located at the middle (x ∈ [−2, 2] m, y ∈ [−1, 1] m, z ∈ [−2, 2] m). The domain contained approximately 1.2 million cells in total, as illustrated in Figure 5 below, which shows the domain geometry with symmetry boundaries and placement of the spar buoy. Boundary conditions were carefully implemented to replicate realistic open-sea conditions. The outer domain walls employed symmetry conditions that enforce zero normal velocity (   v     ·     n   =   0 ) and zero normal gradients for all flow variables ( ϕ / n = 0 ). This formulation creates a non-reflecting environment by preventing wave energy from reflecting back into the computational domain, which is crucial for accurate damping estimation. The buoy surface utilized a no-slip wall condition ( v =   0 ), generating viscous shear stresses that contribute to the total damping. For the VOF model, symmetry boundaries maintained zero normal gradient for the volume fraction (   α / n = 0 ), allowing the free surface to interact naturally with the domain extents [38].
Each appendage was modeled to initially begin decay with its center of gravity at the global origin (0,0,0). Separate computational domains were generated for heave and pitch free-decay simulations. The required initial displacements were embedded directly into the CAD geometry z = 0.0075 m for heave and θ = 9.8° for pitch, and motions were tracked at the spar keel relative to the hydrostatic equilibrium position to ensure accurate evaluation of decay responses.
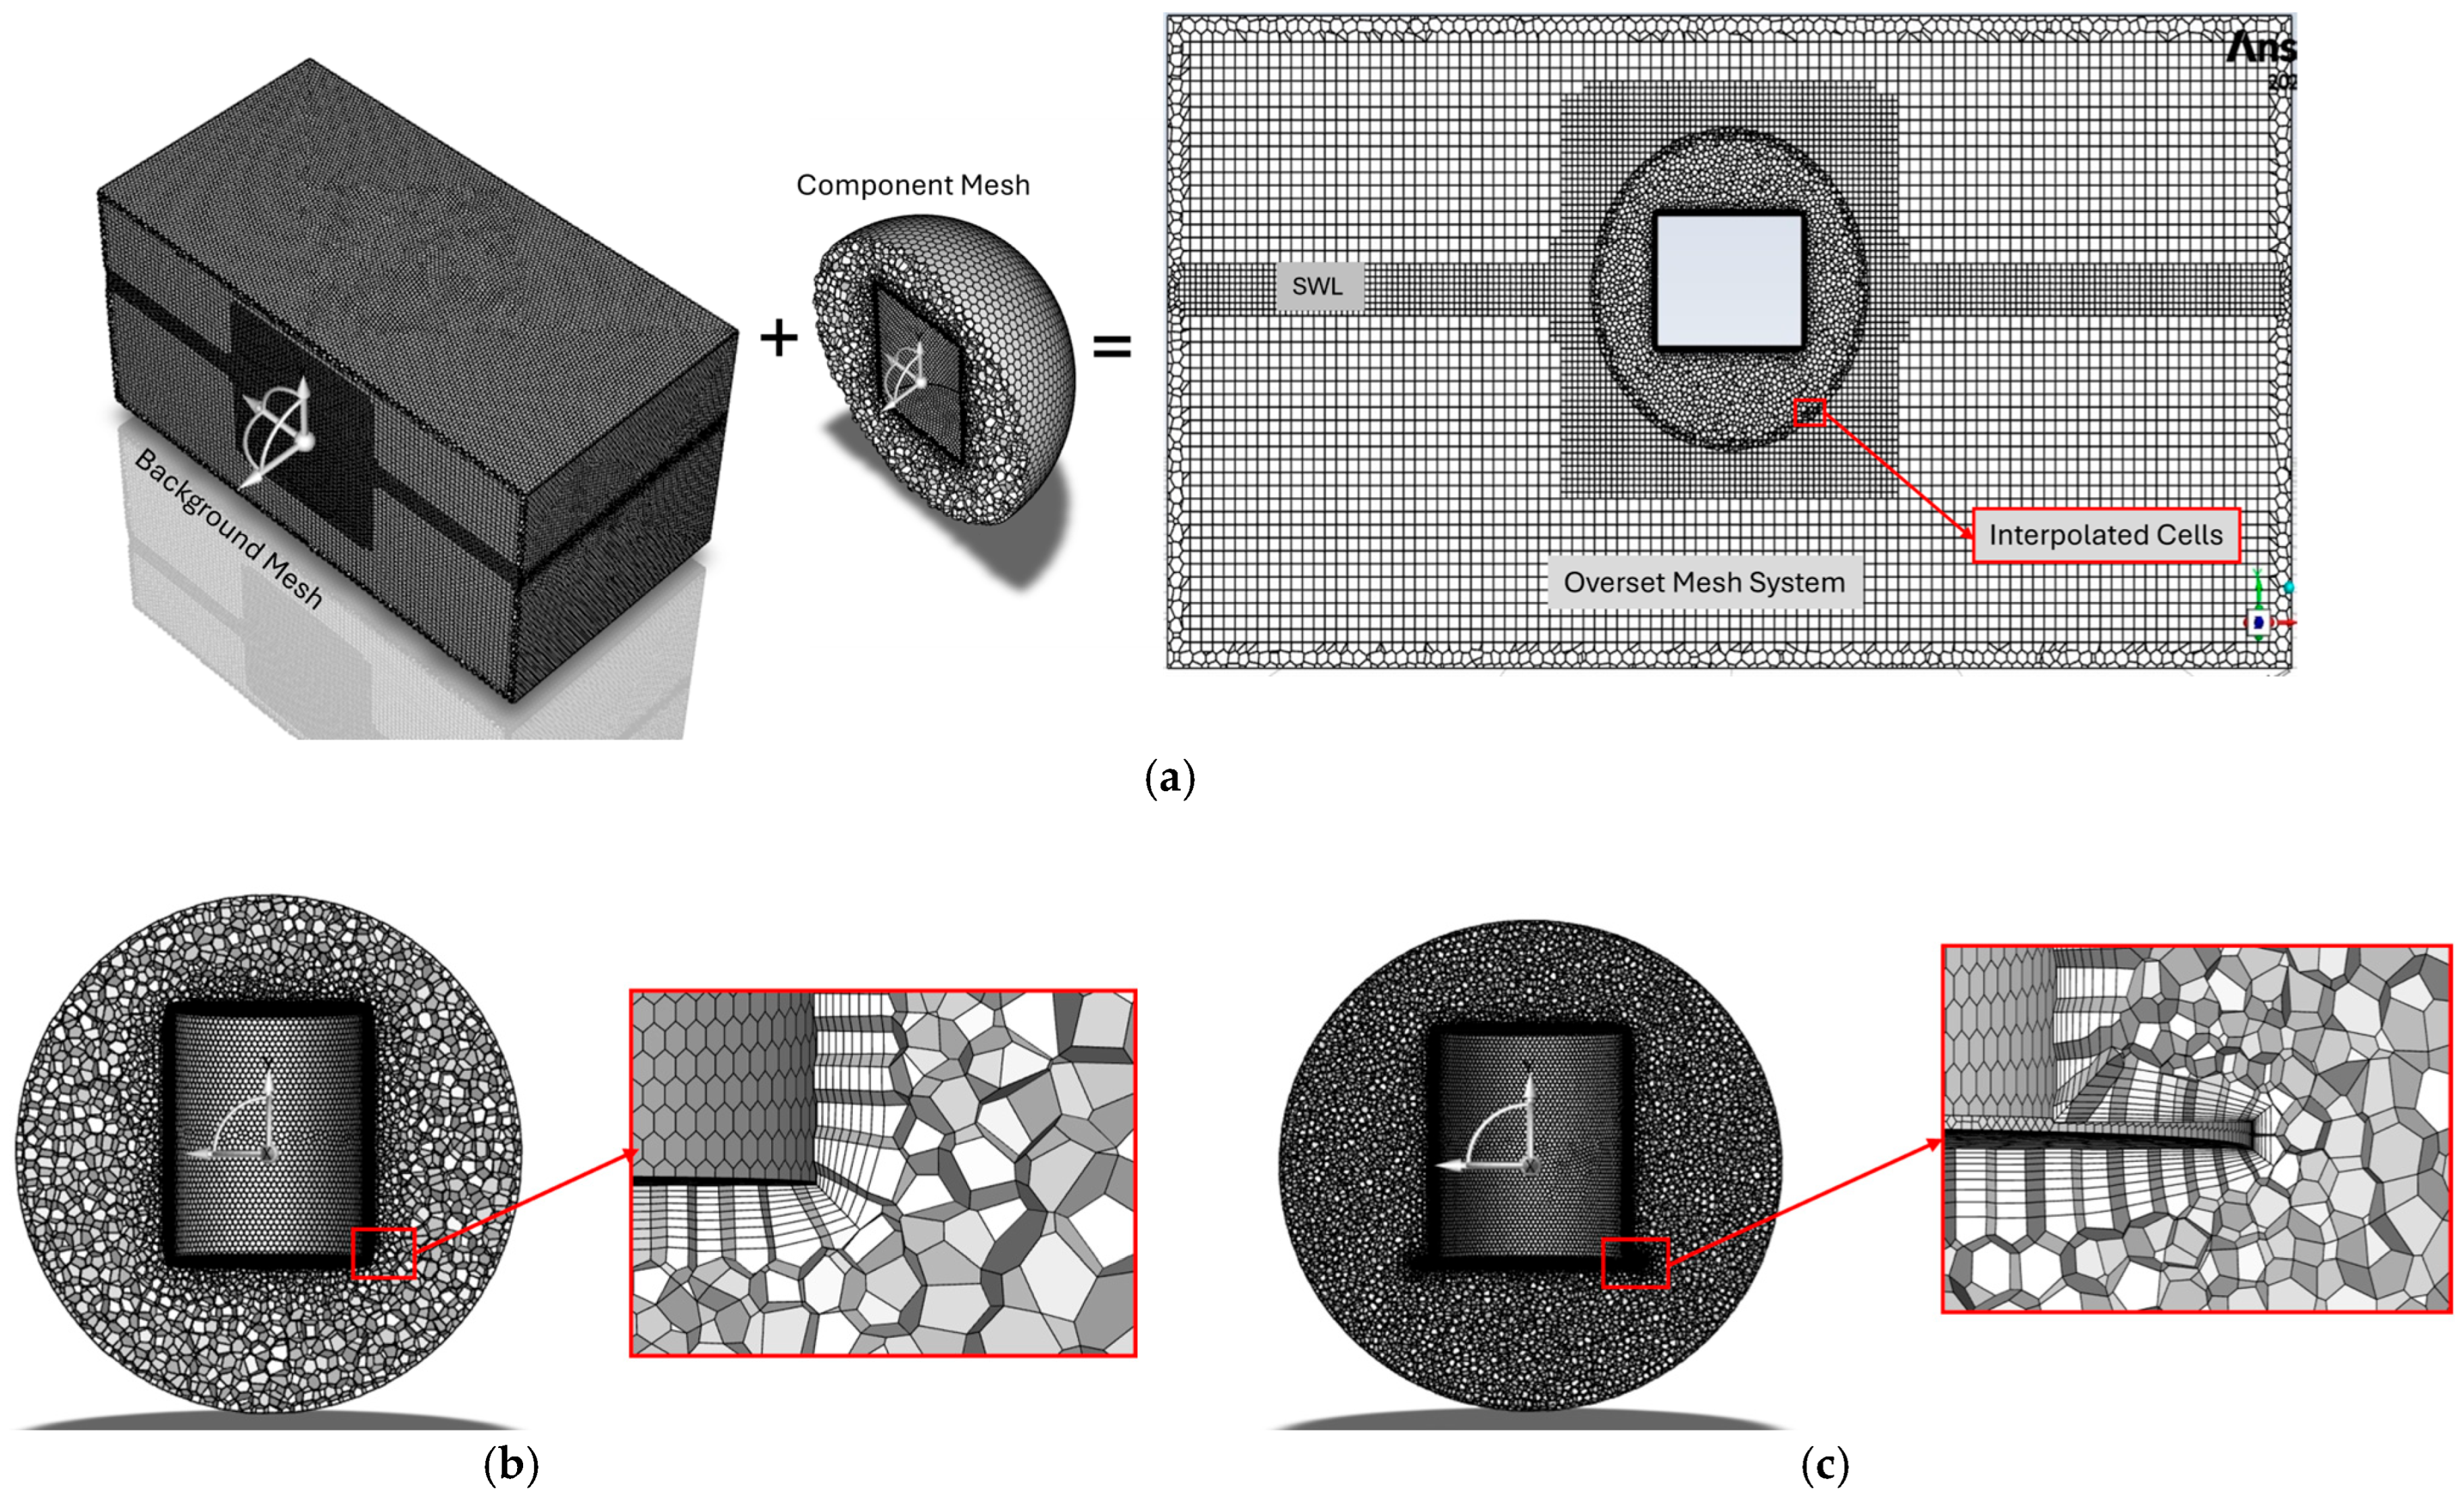
An overset (chimera) meshing strategy was adopted to accurately simulate the large-amplitude heave and pitch motions during free decay tests. The mesh system consisted of two distinct parts: a stationary background mesh encompassing the entire fluid domain, and a finer component mesh that moved with the spar buoy. Figure 6a provides an overview of this assembly, showing the overset region surrounding the spar and its overlap with the background domain. This approach maintains grid quality during rigid-body motion by allowing the component mesh to move freely through the background grid, with flow variables interpolated in the overlapping region to ensure solution continuity and numerical stability [38]. The background mesh consisted of approximately 0.9 million poly-hexcore cells, generated using Fluent’s Mosaic technology. The component mesh surrounding the spar was composed of roughly 0.3 million polyhedral cells. Figure 6b shows a close-up of the baseline configuration, highlighting the prism layers applied to the buoy surface. Eight prism layers with a growth rate of 1.2 were generated to resolve the viscous sublayer, with the first cell height set to maintain a y+ between 25 and 100, consistent with the requirements of the standard k-ε turbulence model. Figure 6c confirms this near-wall treatment was consistently applied to appendages, as shown for the solid plate [1,36].
Mesh quality was verified through standard metrics, with orthogonal quality maintained above 0.4 and mean skewness below 0.7 across all domains. The overset interface between the component and background meshes preserved solution accuracy during motion while preventing mesh deformation issues. This robust mesh configuration provided the foundation for all validation, convergence, and comparative analyses presented in subsequent sections

3.2. Validation of the CFD Model

To assess the reliability of the present CFD numerical modelling approach, CFD simulations were conducted for free heave and pitch decay tests using a vertically truncated cylindrical spar, replicating the experimental and numerical study performed on a model scale presented by Palm et al. [36]. All simulations in the present work were carried out at the same model scale as the reference study to ensure direct comparability and to eliminate potential scale effects in the validation. In their reference study, the test cylinder had a diameter of 0.52 m and a total mass of 35.9 kg and was examined in a wave tank with 0.9 m water depth. The moment of inertia about the center of gravity was reported as 0.9 kg·m2, with the center of gravity located 0.0758 m above the cylinder base along the vertical axis. To ensure consistency, the same initial conditions, geometry, and hydrostatic properties were modelled in the present Fluent-based simulations. Palm et al. [36] also conducted a numerical verification of the experiment using OpenFOAM CFD, proving the accuracy of both the experimental and CFD data. Although the validation case involves a bare cylinder, the accurate replication of the heave and pitch decay viscous and radiation behaviors by the CFD solver setup establishes a reliable foundation for modeling the enhanced damping effects of appended configurations, ensuring consistent comparability between the validated baseline and the extended appendage cases.
The present Fluent CFD validation results are shown in Figure 7a (heave) and Figure 7b (pitch), where they are directly compared to experimental and the OpenFOAM-based numerical results of Palm et al. [36]. Overall, there is good agreement of the present Fluent results with both experimental data and OpenFOAM-based reference simulations, which confirms the validity of the numerical methodology employed in this study. The heave response demonstrates close agreement with both reference datasets. As for pitch motion in Figure 7b, a slight deviation is observed between the experimental and numerical predictions, and this is consistent with the findings of Palm et al. [36], who attributed such discrepancies to small-scale experimental limitations, such as measurement uncertainties in draft and center of gravity positioning. Additional deviation between the Ansys Fluent and OpenFOAM results may stem from variations in numerical implementation schemes, such as pressure–velocity coupling, discretization order, and turbulence modelling strategies. Although both studies employed the k–ε turbulence model, their numerical implementation approaches differ. These solver-specific differences can influence transient decay predictions, particularly in pitch-dominated motions where damping is sensitive to overset mesh interactions and added mass representation.

3.3. Mesh Convergence

A mesh convergence study was conducted in accordance with the methodology of Celik et al. [39] to verify the numerical reliability and achieve mesh-independent results for the CFD simulations. The study analyzed the pitch free-decay motion of the validation model established by Palm et al. [36]. The computational domain for each case consisted of a background mesh and a component overset mesh surrounding the hull. Three global mesh resolution levels were defined: a Coarse mesh (~0.9 million cells), a Medium mesh (~1.2 million cells), and a Fine mesh (~1.7 million cells). However, recognizing that the hydrodynamic forces during pitch decay are governed primarily by the flow resolution around the hull, the convergence study focused specifically on the overset component region. Consequently, the three systemically refined overset meshes were: Coarse (130,000 cells), Medium (270,000 cells), and Fine (410,000 cells), each with enhanced refinement near the hull and free surface to capture critical viscous interactions. The discretization error was quantified using the Grid Convergence Index (GCI) method applied to three key quantities of interest (QOIs) from the pitch decay curve: the first peak, first trough, and second trough. Our QOI (φ) in this case is the pitch decay response.
Table 2 summarizes the computed Grid Convergence Index (GCI) and observed order of accuracy (p). Here, N1, N2, and N3 denote the component mesh total cell counts of the fine, medium, and coarse meshes, respectively. r21 and r32 are the grid-refinement ratios between successive mesh levels. ϕ1, ϕ2, and ϕ3 represent the values of the quantity of interest (QOI)—the pitch displacement—computed on each grid. p is the observed order of accuracy, ϕ e x t 21 is the extrapolated value based on Richardson extrapolation, e a 21 and e e x t 21 are the approximate and extrapolated relative errors, and G C I f i n e 21 is the Grid Convergence Index expressing the numerical uncertainty of the fine-grid solution. The results show good numerical consistency, with GCI values below 4% across all regions. The first Peak demonstrates the best convergence behavior (GCI = 0.72%), confirming mesh independence at this stage, while the second Trough exhibits slightly higher uncertainty (GCI = 3.90%) due to stronger nonlinear effects and vortex shedding during oscillation reversal.
ϕ e x t 21 e a 21 e e x t 21 G C I f i n e 21
This analysis confirms that the selected fine-grid resolution provides an acceptable balance between computational cost and numerical accuracy, with discretization errors maintained within acceptable limits (<4%), ensuring confidence in the CFD-based damping and motion response predictions presented in this study. The combination of low GCI values and near-identical medium/fine decay curves provides quantitative assurance of grid-independent CFD predictions.
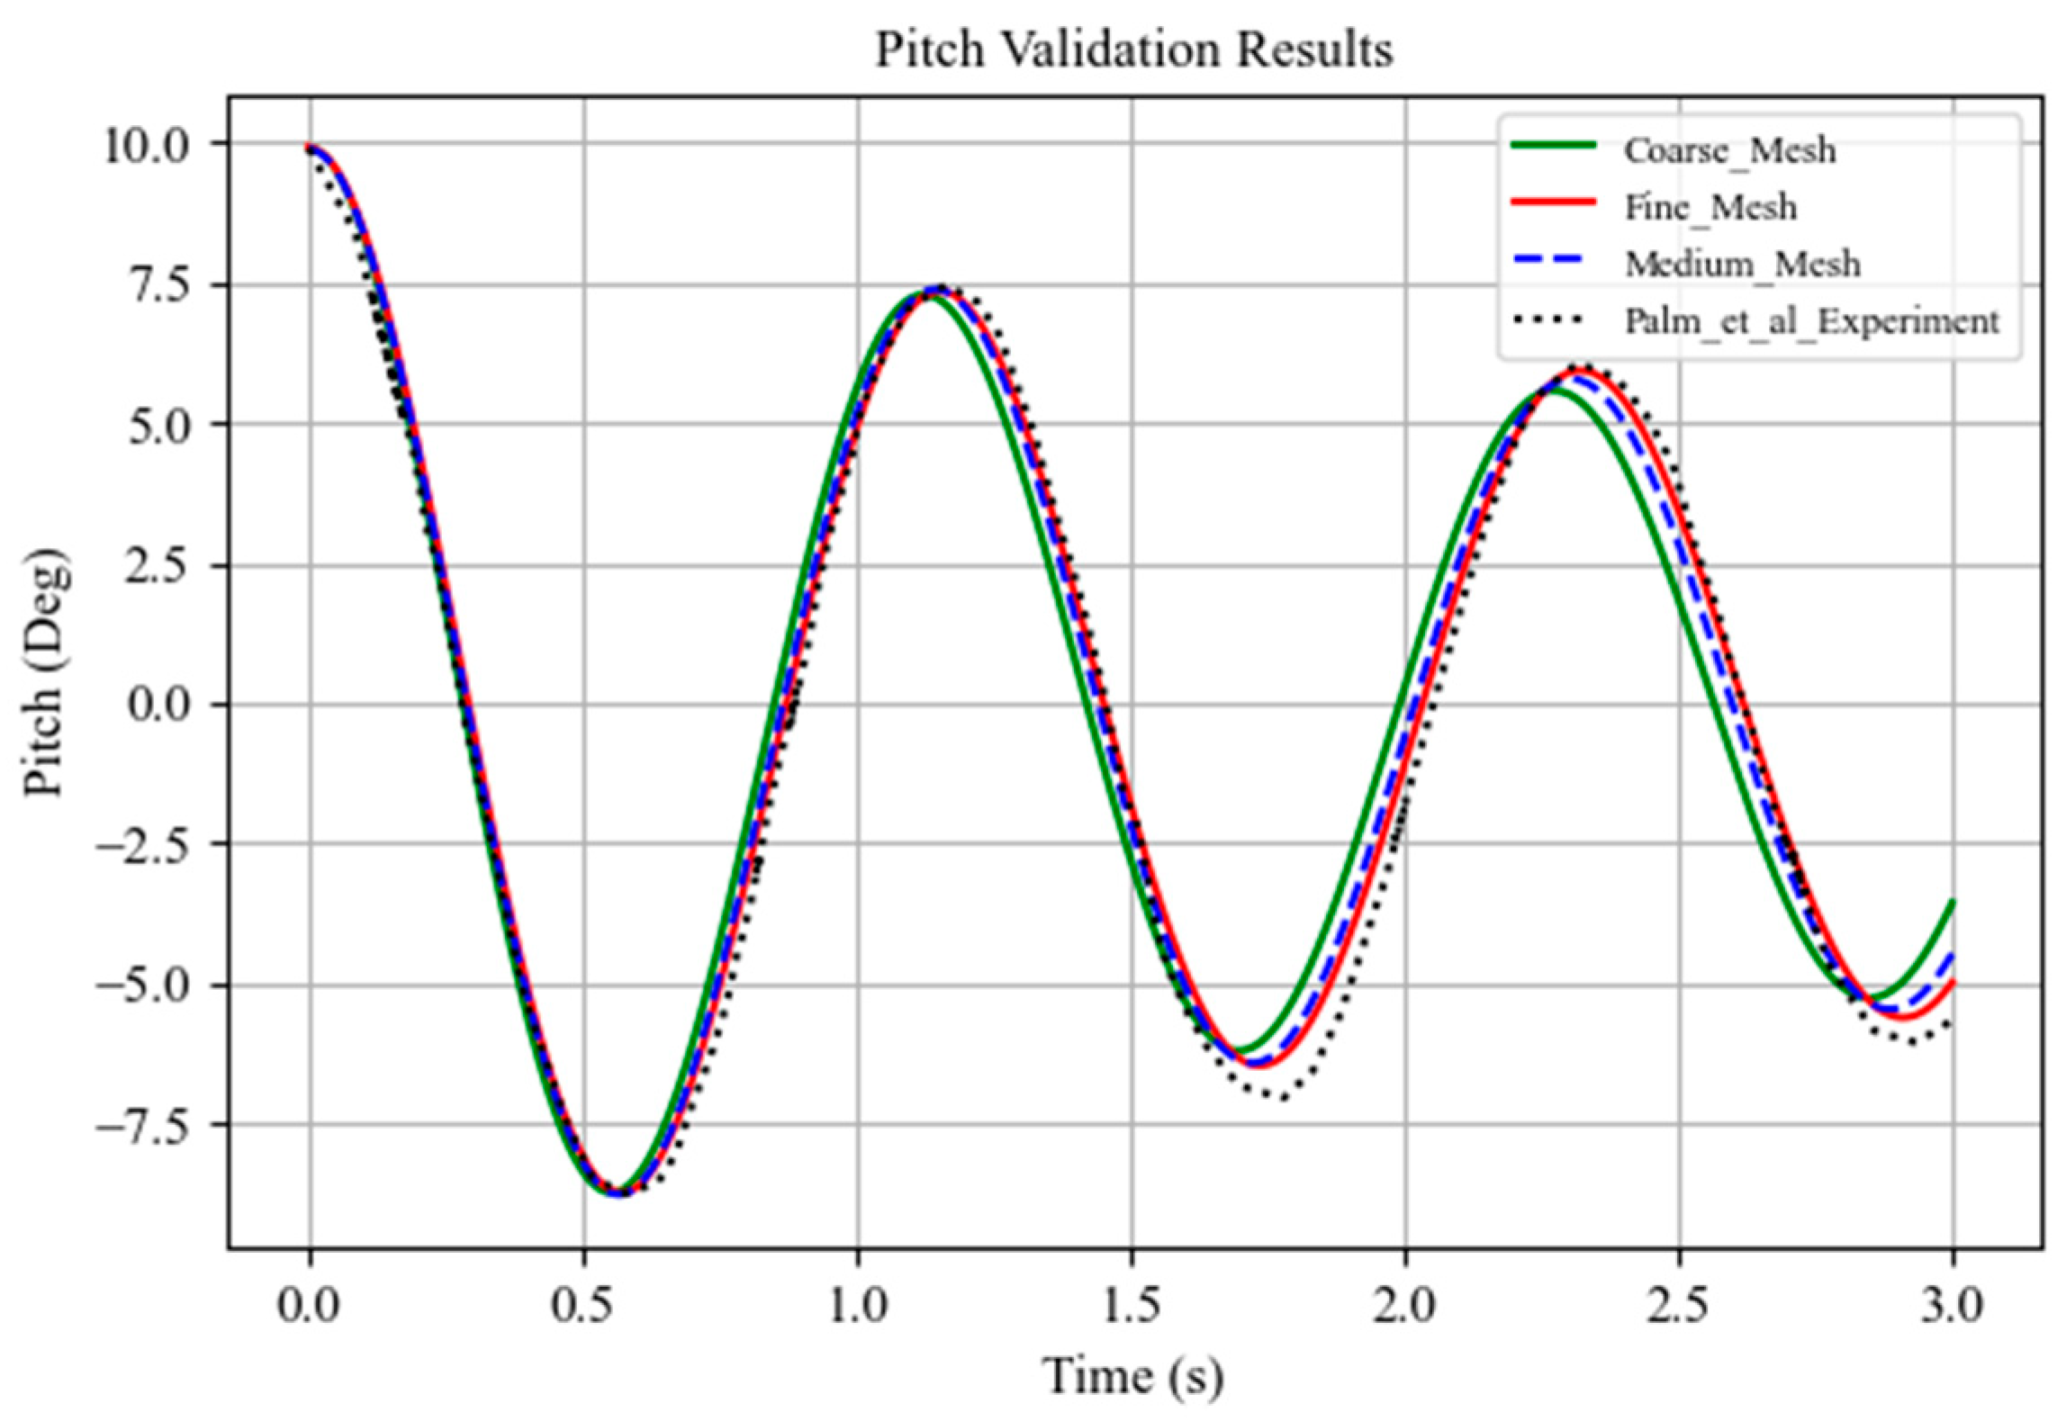
As illustrated in Figure 8, the coarse mesh under-predicted the first and second peak amplitudes, leading to a discernible phase lag by the third oscillation cycle. In contrast, the medium and fine mesh solutions demonstrated strong convergence, exhibiting nearly identical decay histories with aligned peak amplitudes and oscillation periods agreeing within 0.02 s. While the fine mesh offered marginally higher resolution, the gain in accuracy was negligible and did not justify the substantial computational expense. The coarse mesh, though efficient, proved insufficient for capturing key flow dynamics. Consequently, the medium mesh was selected for all subsequent simulations, as it achieves high fidelity in resolving the essential physics while maintaining computational efficiency.

3.4. Free-Decay Simulations

Free-decay simulations were performed in ANSYS Fluent for each appendage configuration to estimate the viscous damping characteristics in heave and pitch. Each model was given a prescribed initial displacement (z = 0.0075 m in heave and θ = 9.8° in pitch) and then released in calm water to record the time-domain response. The overset mesh and solver settings described in Section 3.1 and Section 3.2 were employed to ensure numerical consistency across cases. Damping ratios (ζ) were evaluated using the logarithmic decrement method (Equation (16) in Section 2.3), based on successive extrema from the simulated decay curves. The total damping coefficients Bii for heave (i = 3) and pitch (i = 5) were then computed using Equation (17), and radiation damping values rii0) obtained from AQWA were subtracted to isolate the viscous component (Equation (20a,b)). The resulting decay curves, natural periods, and damping coefficients for all configurations are presented and discussed in Section 5.

4. Potential-Flow Modeling

4.1. AQWA Model Setup

A hydrodynamic diffraction analysis of the spar-type buoy configurations was performed in ANSYS AQWA using the linear potential-flow theory. Each configuration was discretized using a constant-panel surface mesh, consisting of approximately 12,000–15,000 elements to ensure sufficient geometric resolution. The analysis was conducted within a cubic fluid domain extending 50 m in all directions from the body center, as illustrated in Figure 9. The free-surface effects were represented through the linearized free-surface boundary condition described in Section 2.2, rather than by explicit surface meshing. This formulation allows accurate computation of diffraction and radiation hydrodynamics within the defined domain.
To evaluate motion response, hydrodynamic diffraction analysis was conducted under two conditions: (i) neglecting viscous damping and (ii) incorporating viscous damping coefficients obtained from the CFD-based free-decay simulations described in Section 3. This dual approach enabled a clear quantification of the influence of viscous damping on the motion response of the spar buoys.

4.2. Inclusion of Viscous Damping

The viscous damping coefficients applied in AQWA were not computed internally but imported externally from CFD-based free decay analysis results given in Section 5.1. Since AQWA’s potential flow framework inherently neglects nonlinear viscous effects, the explicit inclusion of CFD-derived damping values offers a more physically realistic prediction, especially near the natural frequency of the free decay test.
Hydrodynamic diffraction analysis using ANSYS AQWA was employed to estimate the frequency-dependent added mass and radiation damping coefficients for the spar buoy appendages. Since both added mass and radiation coefficients parameters vary with wave frequency, the frequency at which we calculate added mass and radiation coefficients was aligned with the natural frequencies, which are estimated in the CFD-based heave and pitch free-decay tests in Section 5.1. This alignment ensured that the extracted hydrodynamic coefficients represent the most dynamically relevant frequencies, thus enhancing the accuracy of motion response predictions.

5. Results and Discussion

5.1. Decay Results of the Appendages from CFD

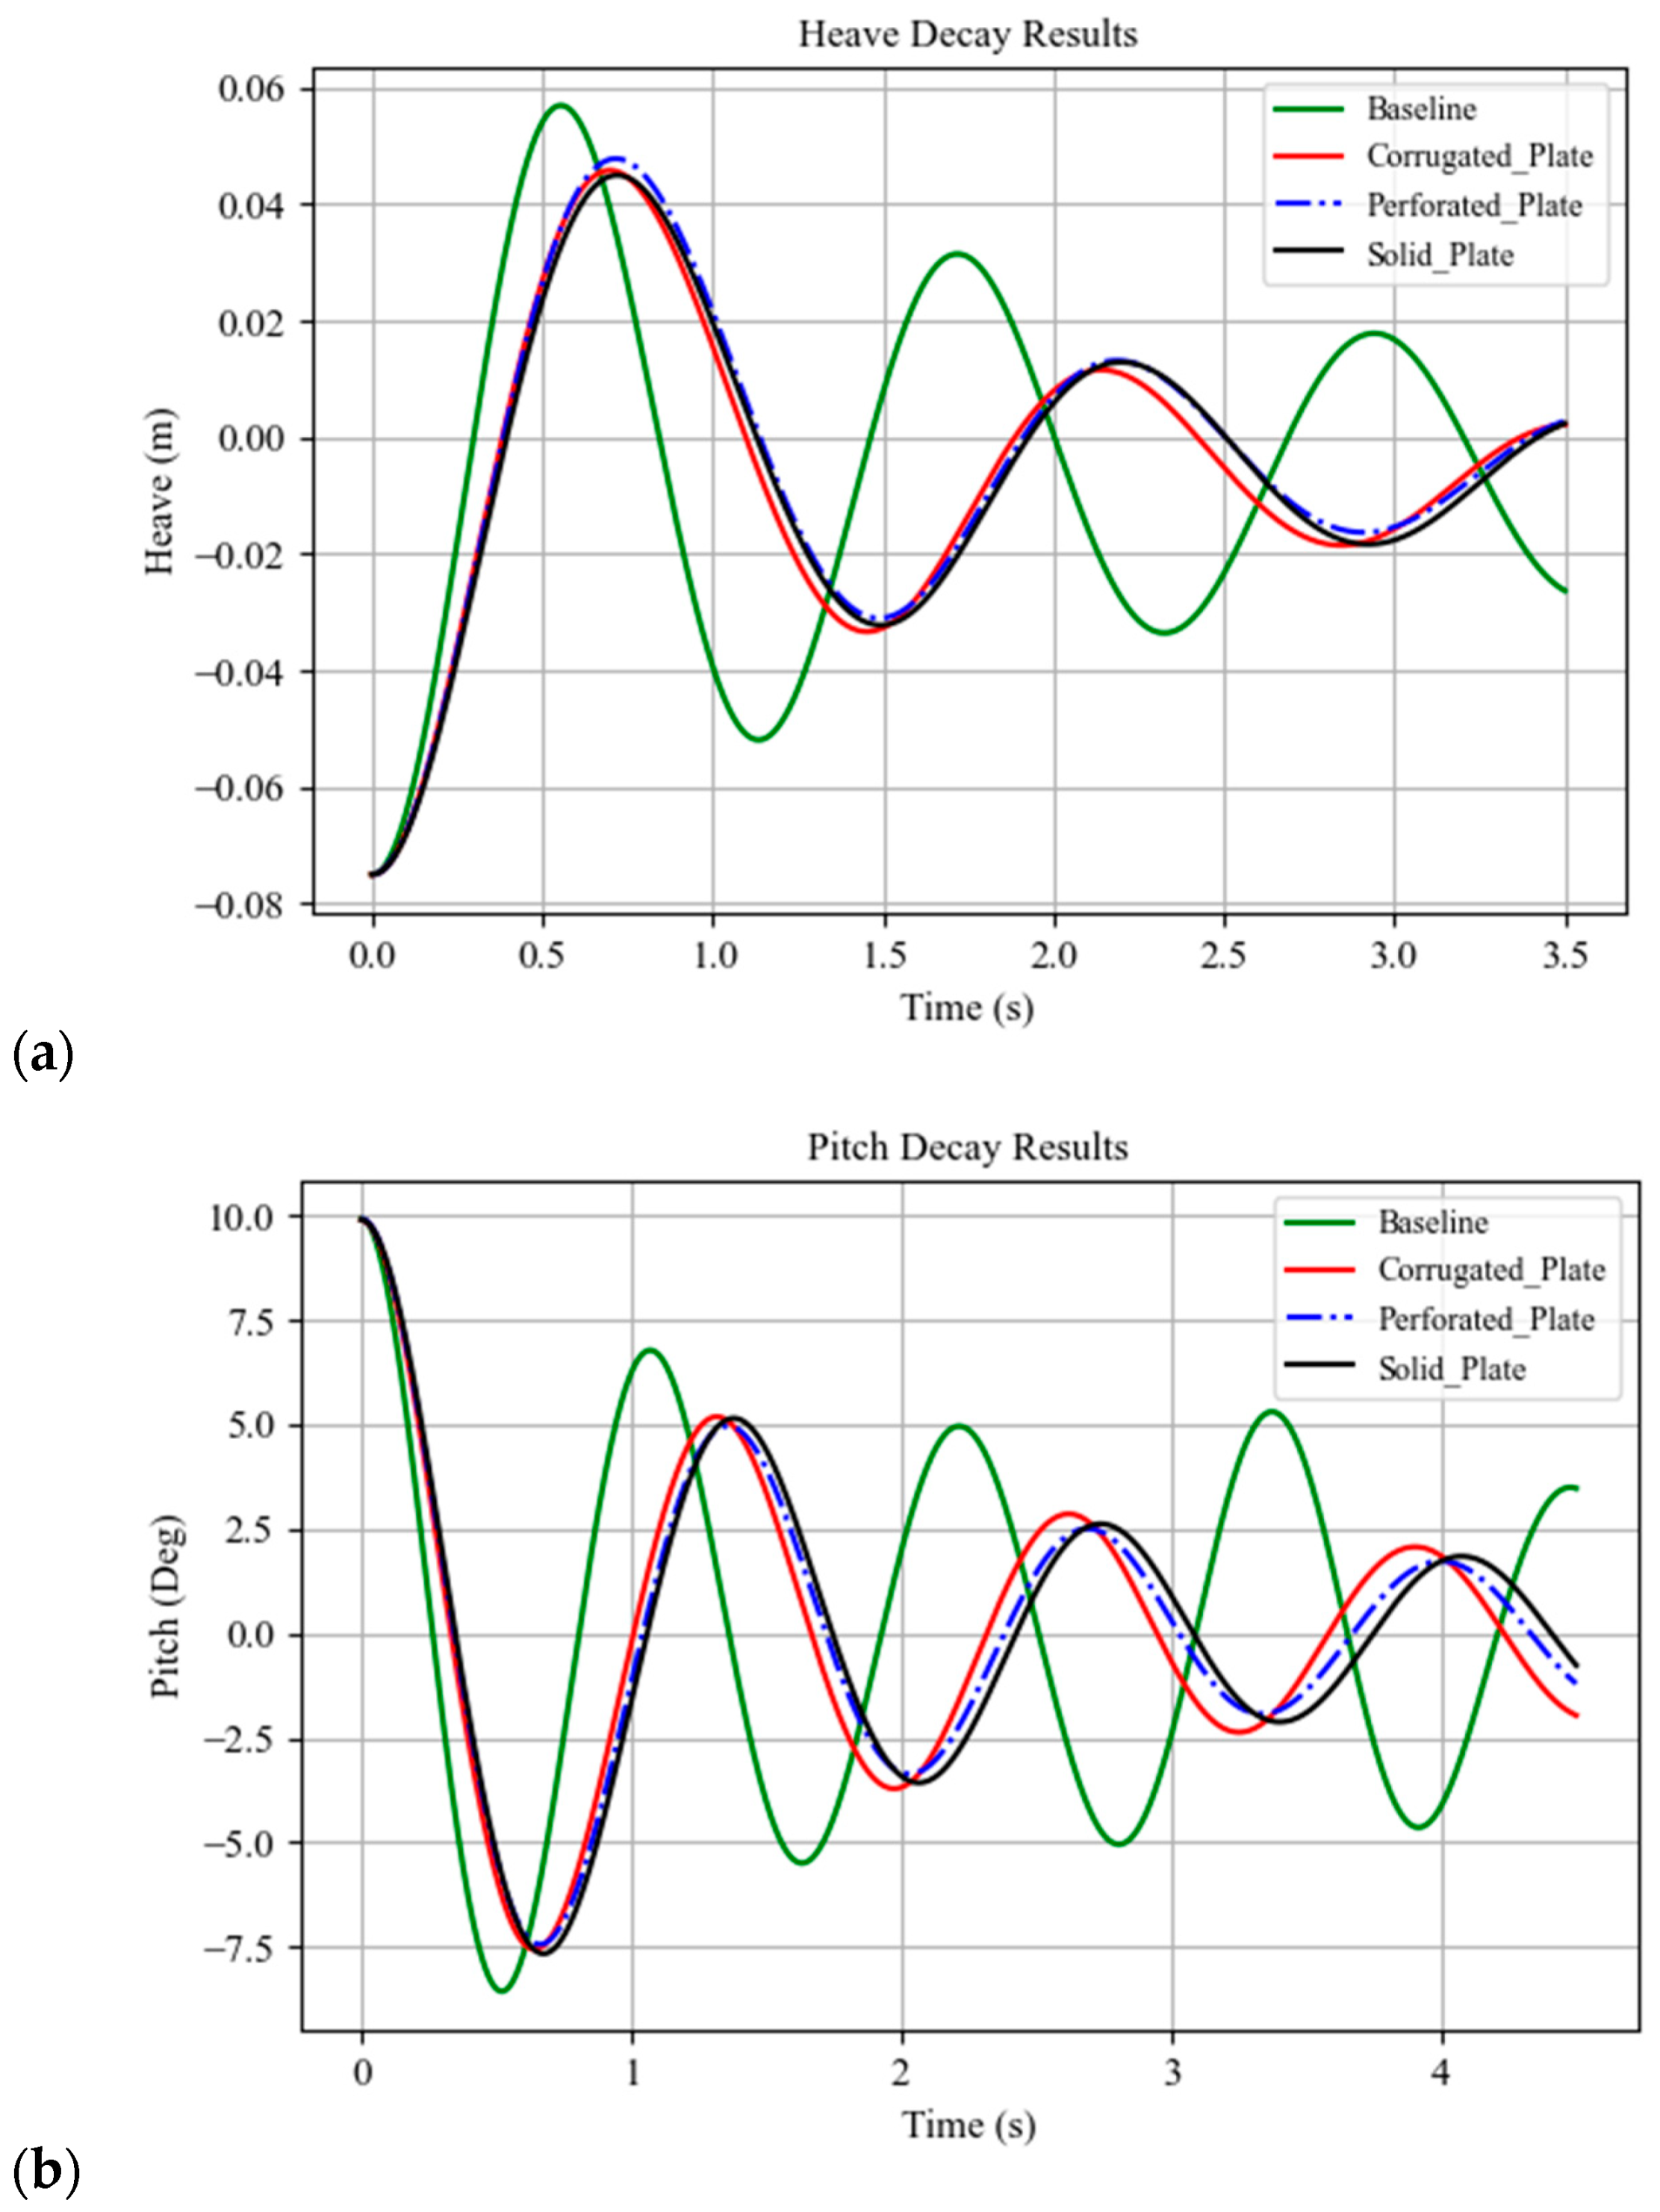
The free-decay simulations conducted in ANSYS Fluent provide the basis for evaluating the damping characteristics of each appendage configuration. Figure 10 shows the CFD-derived heave and pitch free-decay responses described in Section 3.4 for all configurations. The inclusion of appendages enhances damping performance, as indicated by the more rapid reduction in oscillation amplitudes across both heave and pitch. In the early stages of motion (t < 2 s), the baseline configuration maintains significantly higher amplitudes compared to all modified cases. The decay persists longer in pitch than in heave, implying relatively lower rotational damping across all cases.
To complement the time-domain decay responses shown in Figure 10, Table 3 provides the corresponding damping ratios, natural frequencies, and total damping coefficients obtained from the decay curves of the CFD results.

Vorticity and Turbulent Intensity in Pitch Decay

Among the two degrees of freedom studied, detailed flow-field analysis was performed for the pitch-decay case, since its rotational motion generates asymmetric vortex shedding and more pronounced viscous effects than heave.
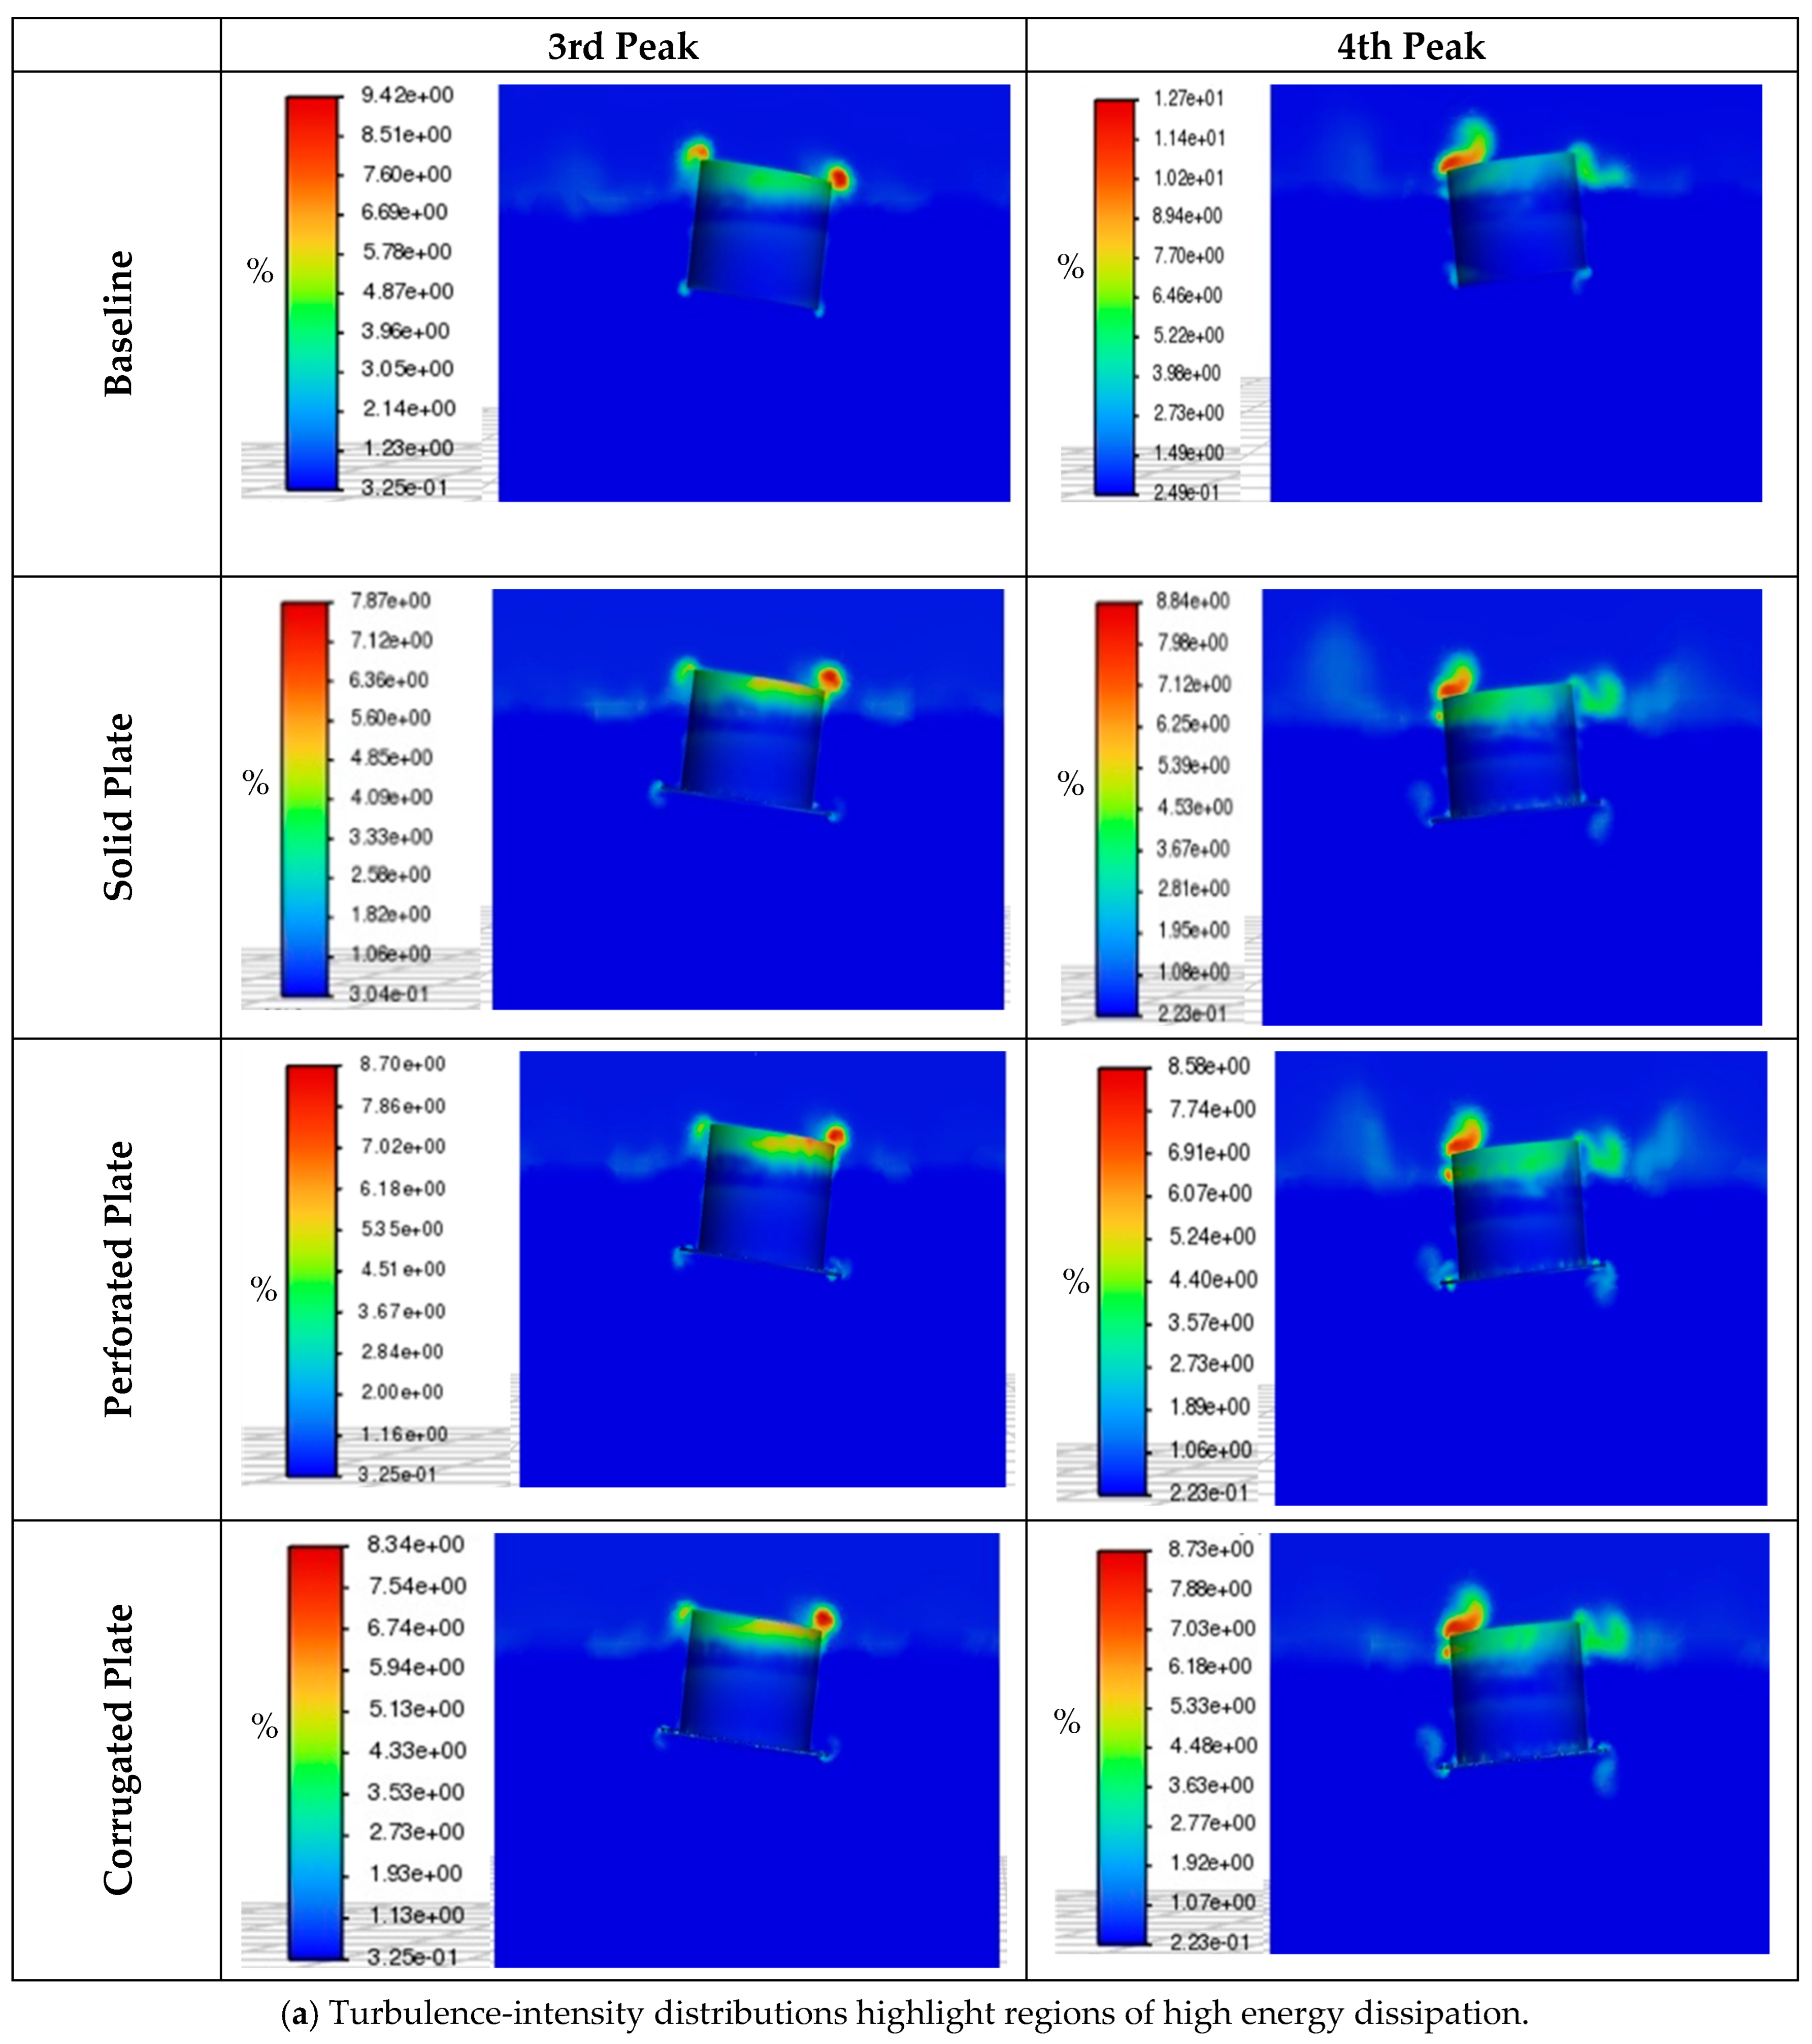
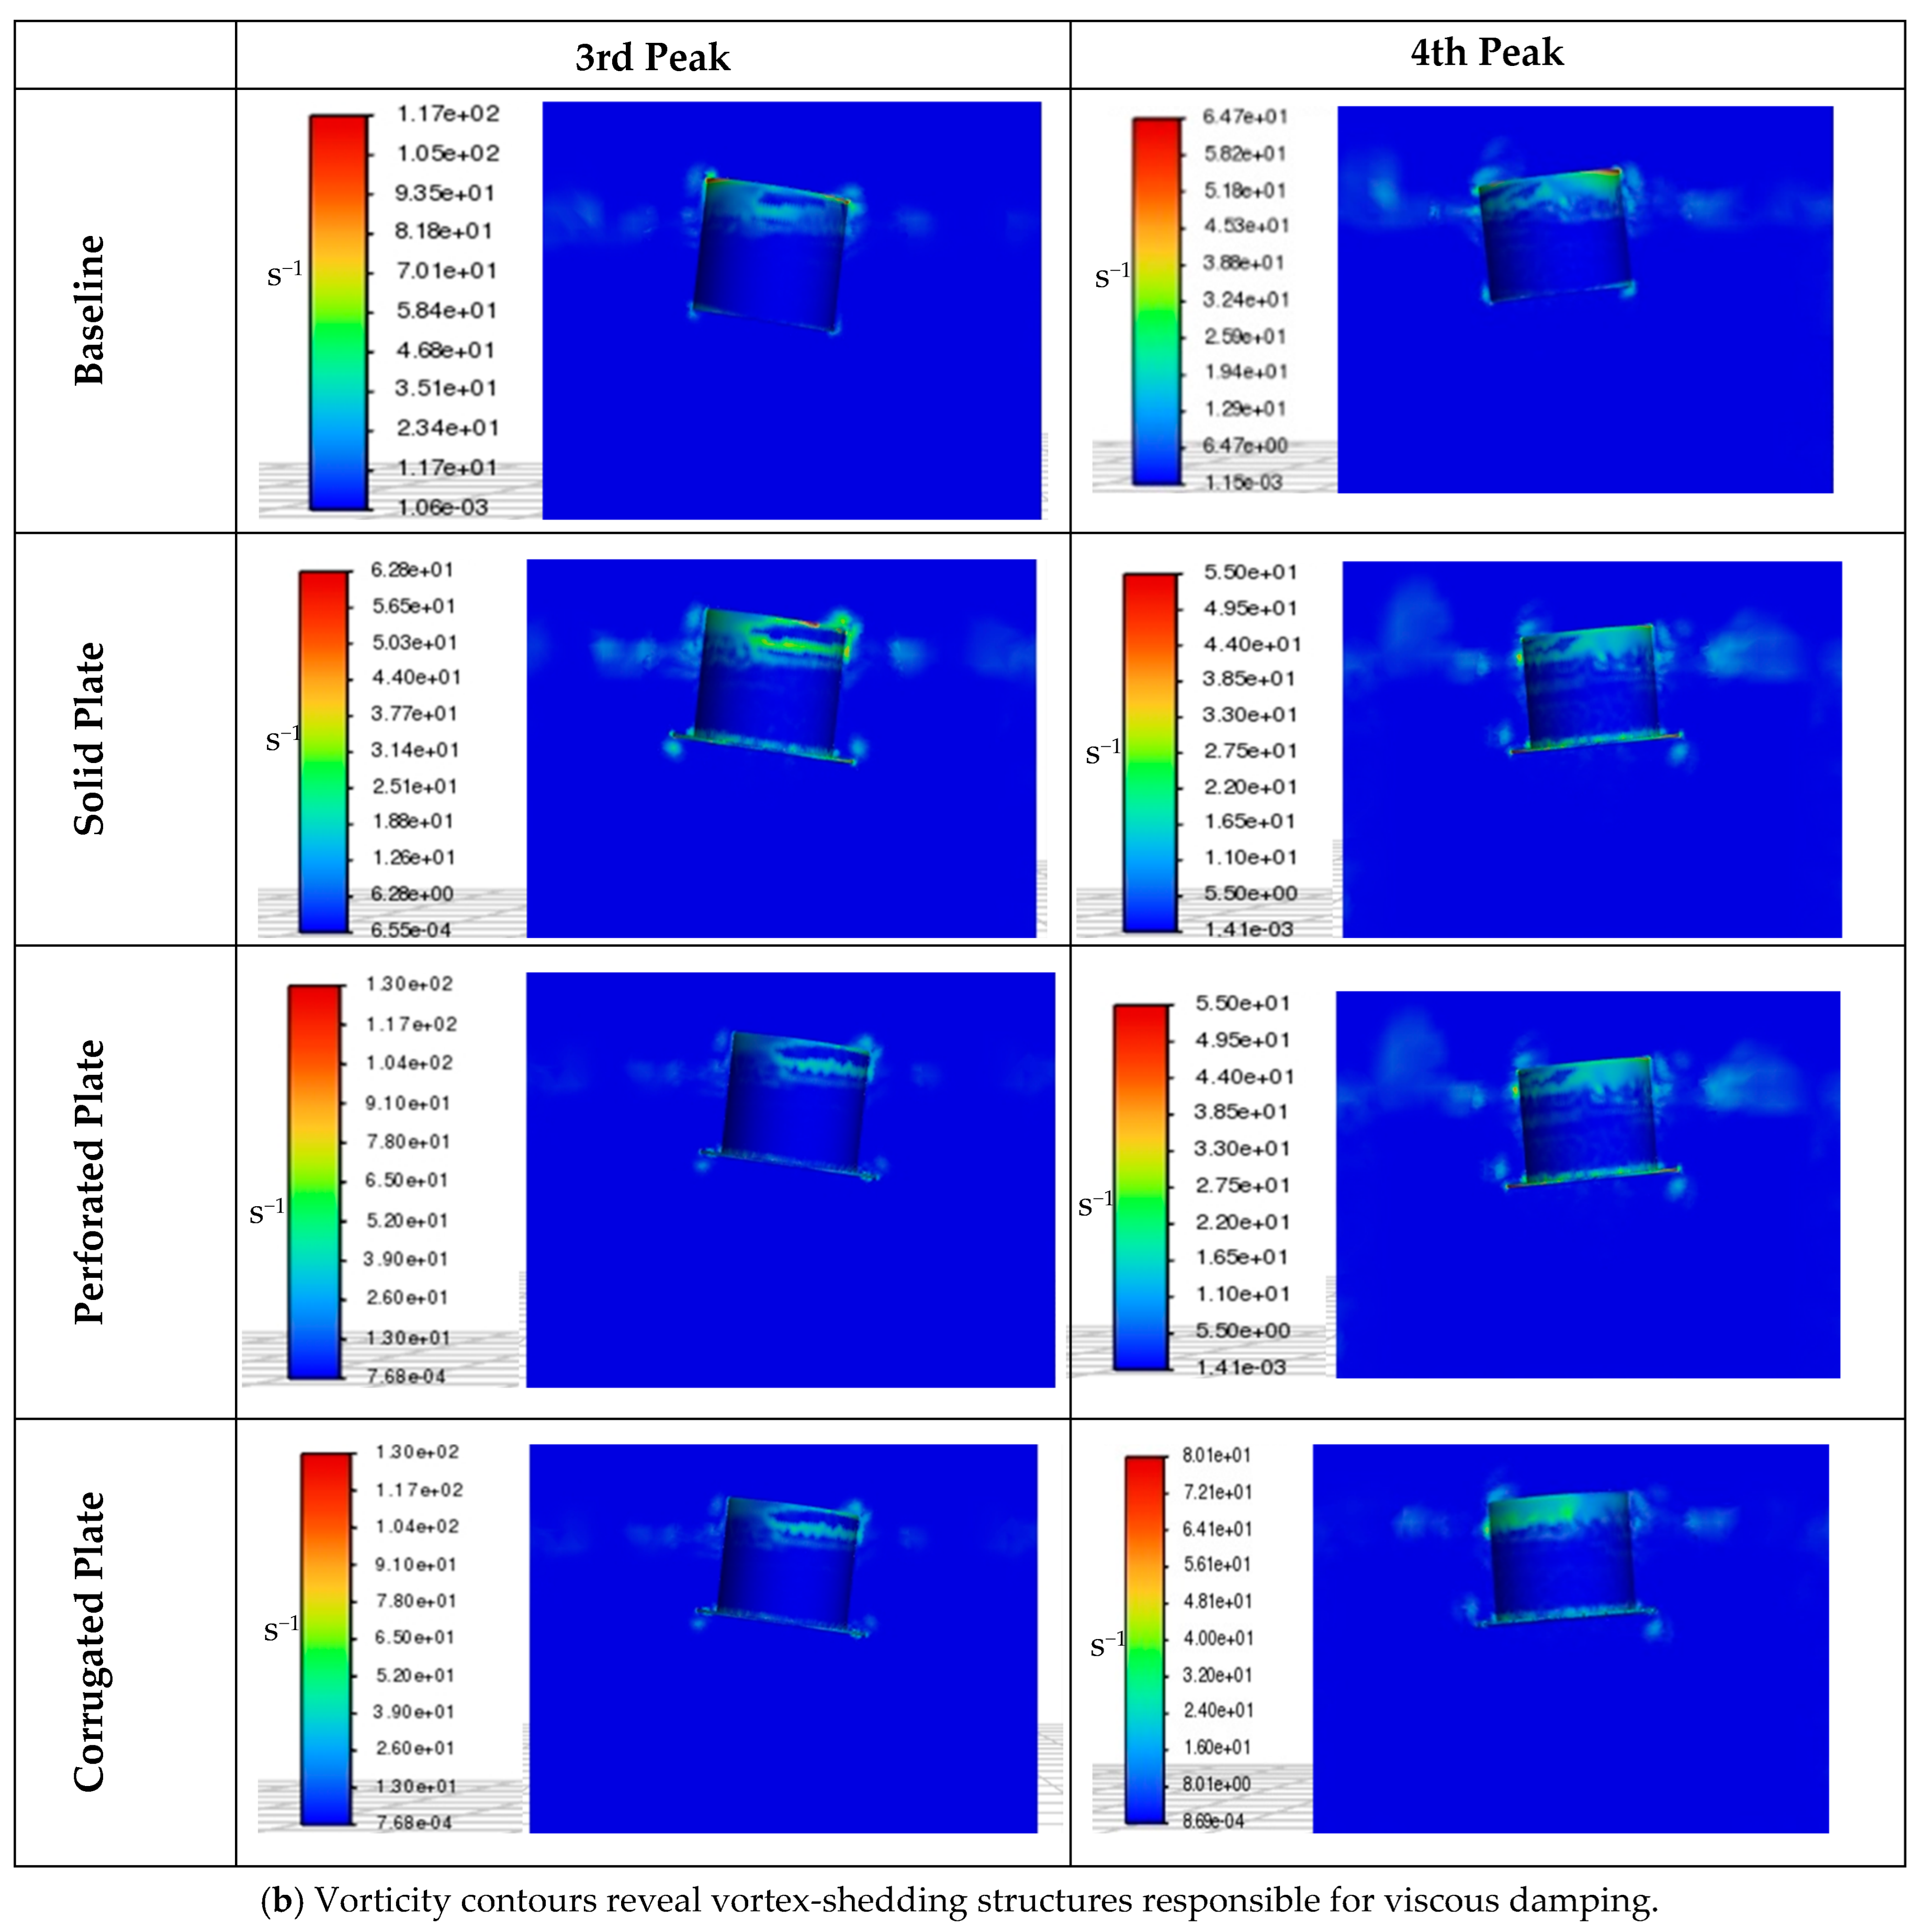
To clarify the physical origin of the damping behavior, vorticity and turbulence-intensity fields were evaluated at the third and fourth oscillation peaks. Vorticity identifies regions of high shear and rotational motion, while turbulence intensity represents the degree of unsteady mixing and energy dissipation.
The turbulent intensity was calculated in ANSYS Fluent using I = Urms/Umean where Urms is the root-mean-square of velocity fluctuations and Umean is the mean flow velocity. Higher values of I indicate stronger turbulent activity. Figure 11a compares the turbulence-intensity distributions at the 3rd and 4th oscillation peaks for all configurations. The perforated and corrugated plates produce the largest turbulence intensity levels near the appendages, demonstrating enhanced energy dissipation, whereas the baseline configuration shows relatively calm flow fields consistent with its lower damping ratio.
The vorticity magnitude was obtained as the curl of the velocity vector field,
ω = × v
where ω is the vorticity vector. ANSYS Fluent computes this quantity directly from the solved velocity field, and the magnitude ∣ω∣ was used for visualization. This quantity is directly available as a post-processing variable within ANSYS Fluent, which calculates it from the solved velocity field.
Figure 11b presents the vorticity contours at the same instants (3rd and 4th peaks). The baseline model shows weak, axisymmetric vortices near the cylinder base, while appendage-equipped cases, especially the corrugated plate, exhibit intense vortex structures and shear layers responsible for their enhanced viscous damping.
Among the four configurations, the corrugated plate exhibits a sequence of small-scale vortices that align with its ridge pattern, maintaining a moderately energetic but spatially distributed wake. This pattern contrasts with the perforated plate, which generates localized jet-like vortices near its openings, and the solid plate, which forms a broad but confined recirculation zone beneath the plate. The corrugated configuration, therefore, promotes repeated boundary-layer separation and reattachment along the ridge crests, leading to sustained viscous dissipation without strong localized turbulence peaks. These flow characteristics account for its balanced damping response and support the efficiency trends discussed later in Section 5.4.

5.2. Hydrodynamic Viscous Coefficients from CFD Decay Analysis

The viscous and radiation damping characteristics derived from the CFD-based decay tests form the basis for quantifying hydrodynamic coefficients in heave and pitch. The total damping ratios reported in Table 3 represent the combined effects of radiation and viscous damping. To isolate the viscous component, radiation damping coefficients at the natural frequencies of the decay curves were estimated using AQWA and subtracted from the total damping. For both heave and pitch, the radiation damping coefficients r33 and r55 and the added mass and inertia terms a33 and a55 were extracted at the relevant natural frequencies. Table 4 summarizes the heave-related hydrodynamic coefficients, while Table 5 provides the corresponding pitch-related coefficients.
The trends identified in heave are mirrored in pitch, where the addition of appendages again alters the balance between inertia and damping. Table 5 lists the pitch-related coefficients, including added inertia, effective inertia, and damping contributions.

5.3. Potential Flow Motion Analysis with and Without Viscous Damping

To evaluate the impact of viscous effects on wave-induced motions, the damping coefficients obtained from the CFD-based free-decay simulations were incorporated into the potential-flow analysis.
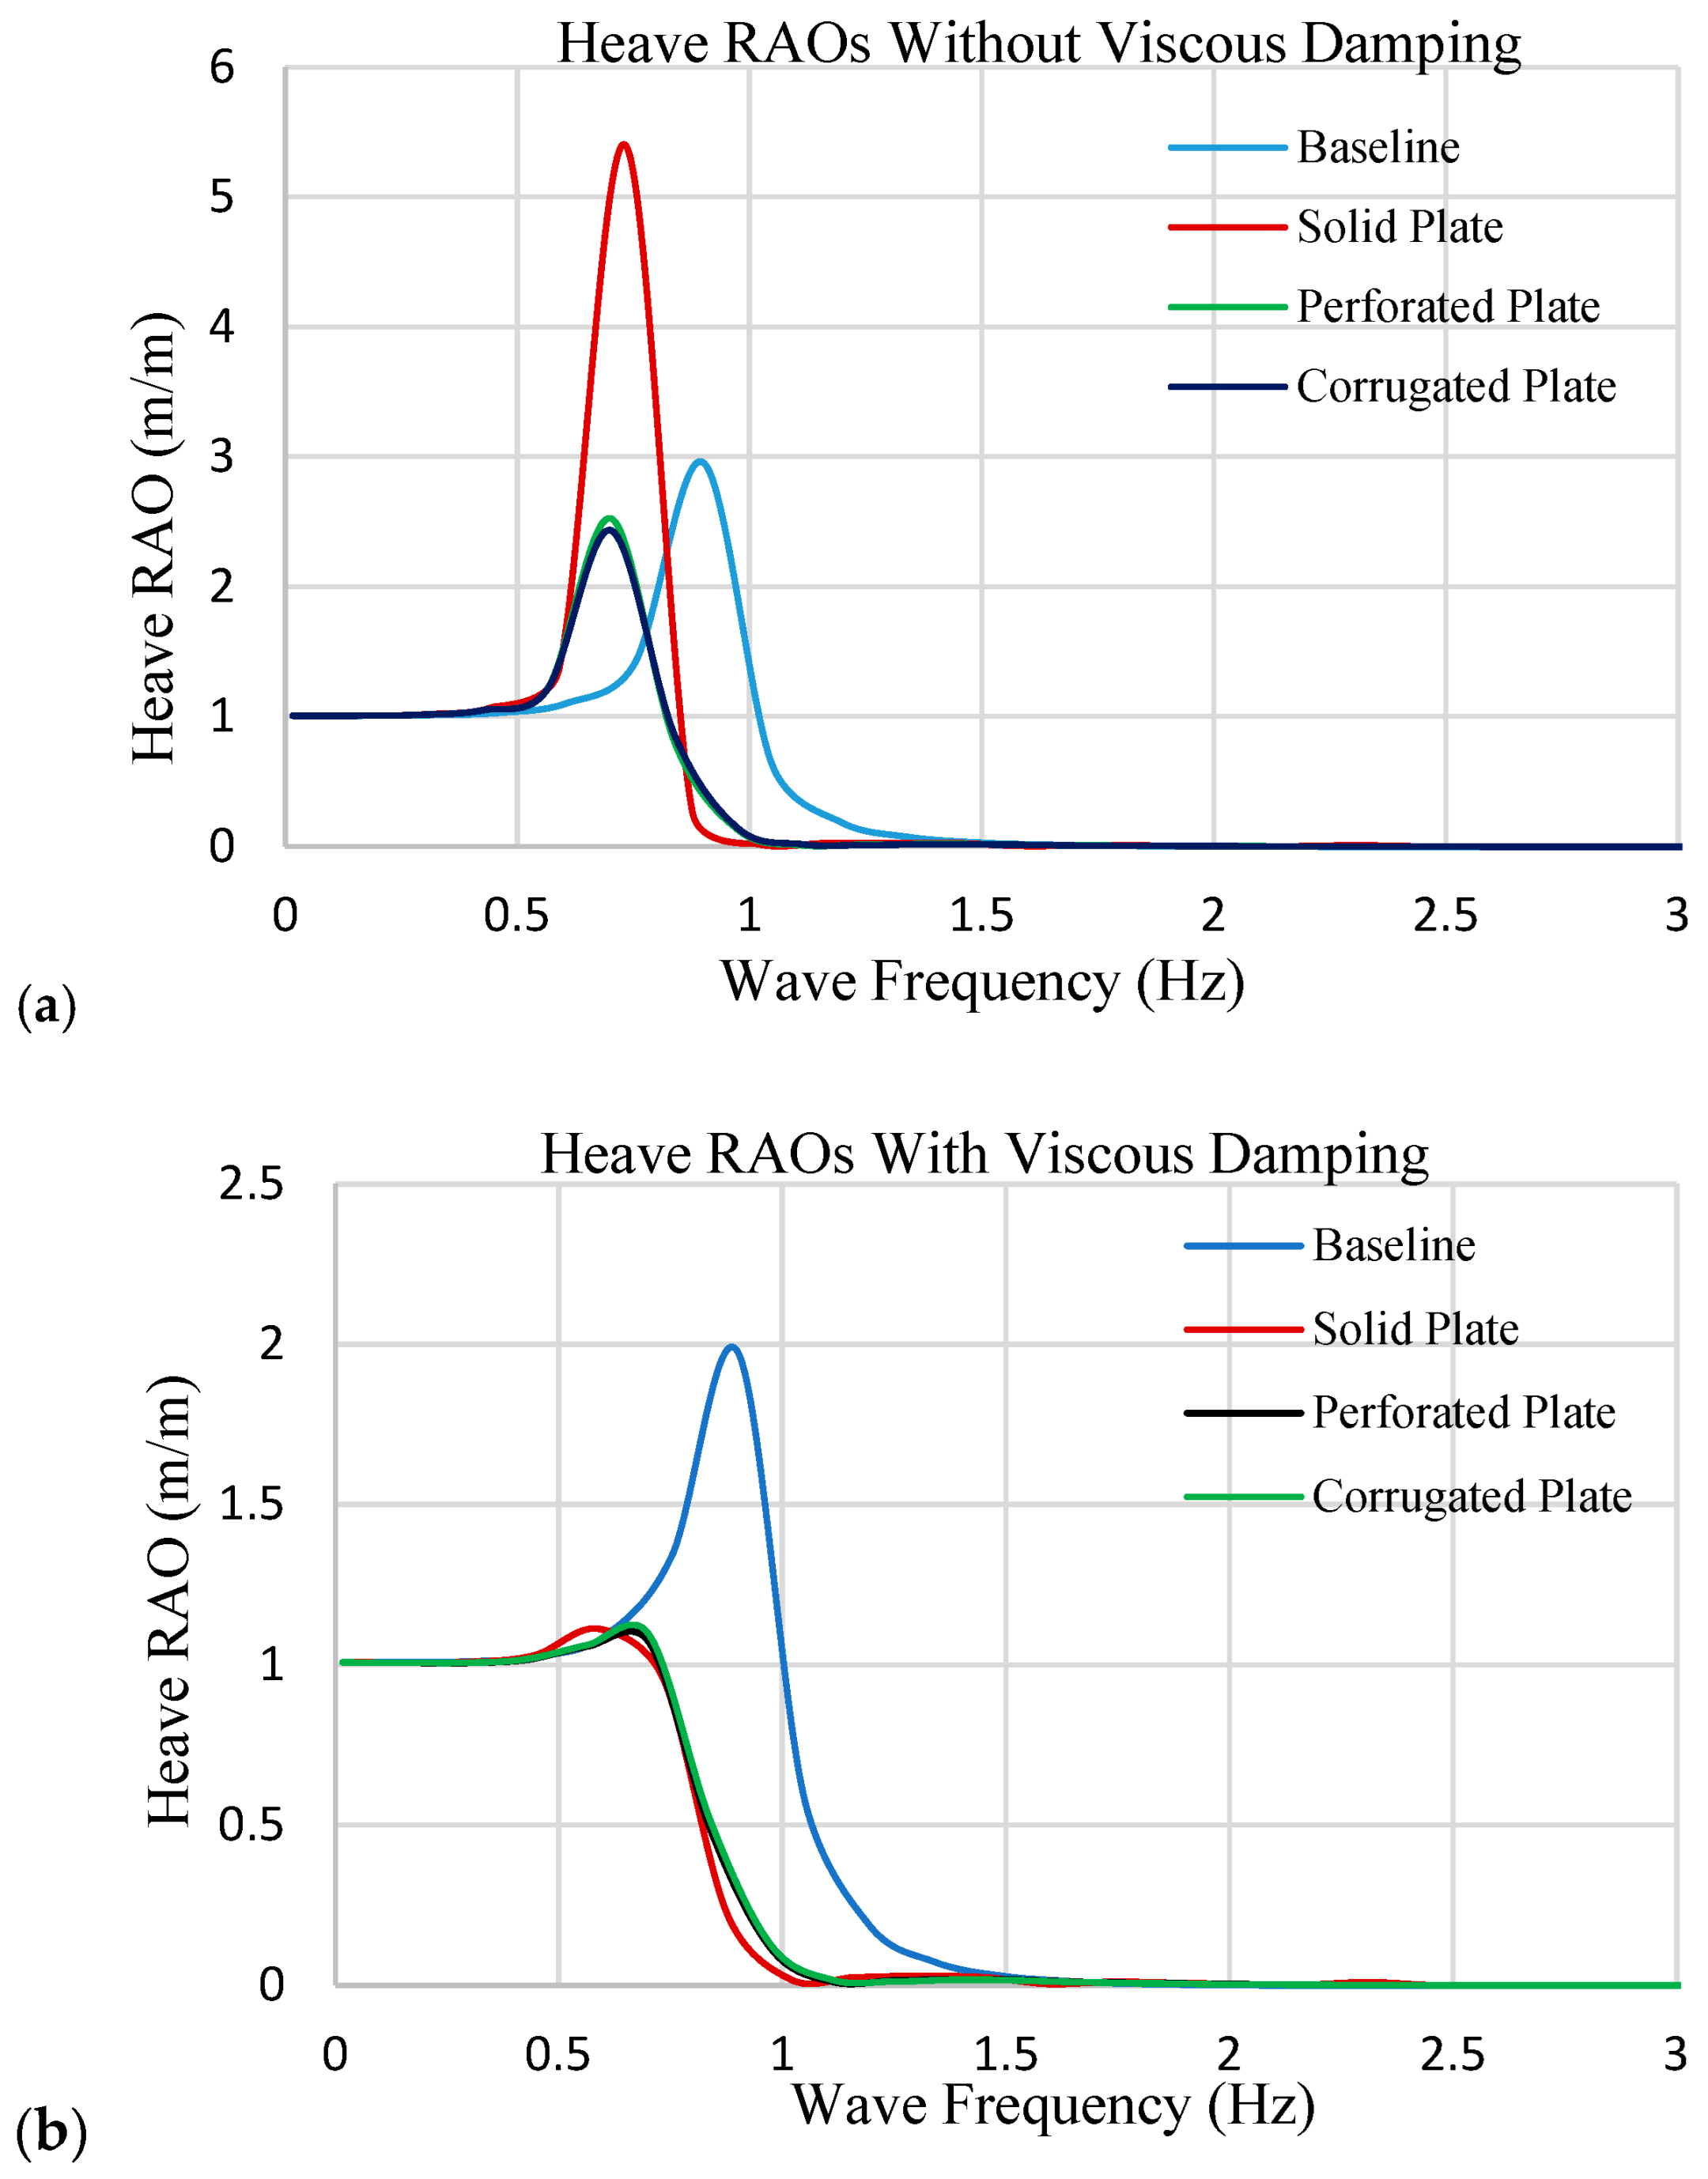
Figure 12 below presents the heave Response Amplitude Operators (RAOs) for all spar buoy configurations under two conditions: without and with applied viscous damping coefficients derived from CFD simulations. In the absence of viscous damping, all configurations exhibit sharp resonance peaks, particularly for the solid plate and baseline model. When viscous damping is included, these peaks are substantially reduced, especially near the natural frequencies identified in Table 2.
While Figure 12 illustrates the effect of viscous damping on the heave RAOs, the reductions at resonance can be compared directly with the damping coefficients reported earlier in Table 4 and Table 5. These quantitative changes in RAOs are summarized in Table 6.
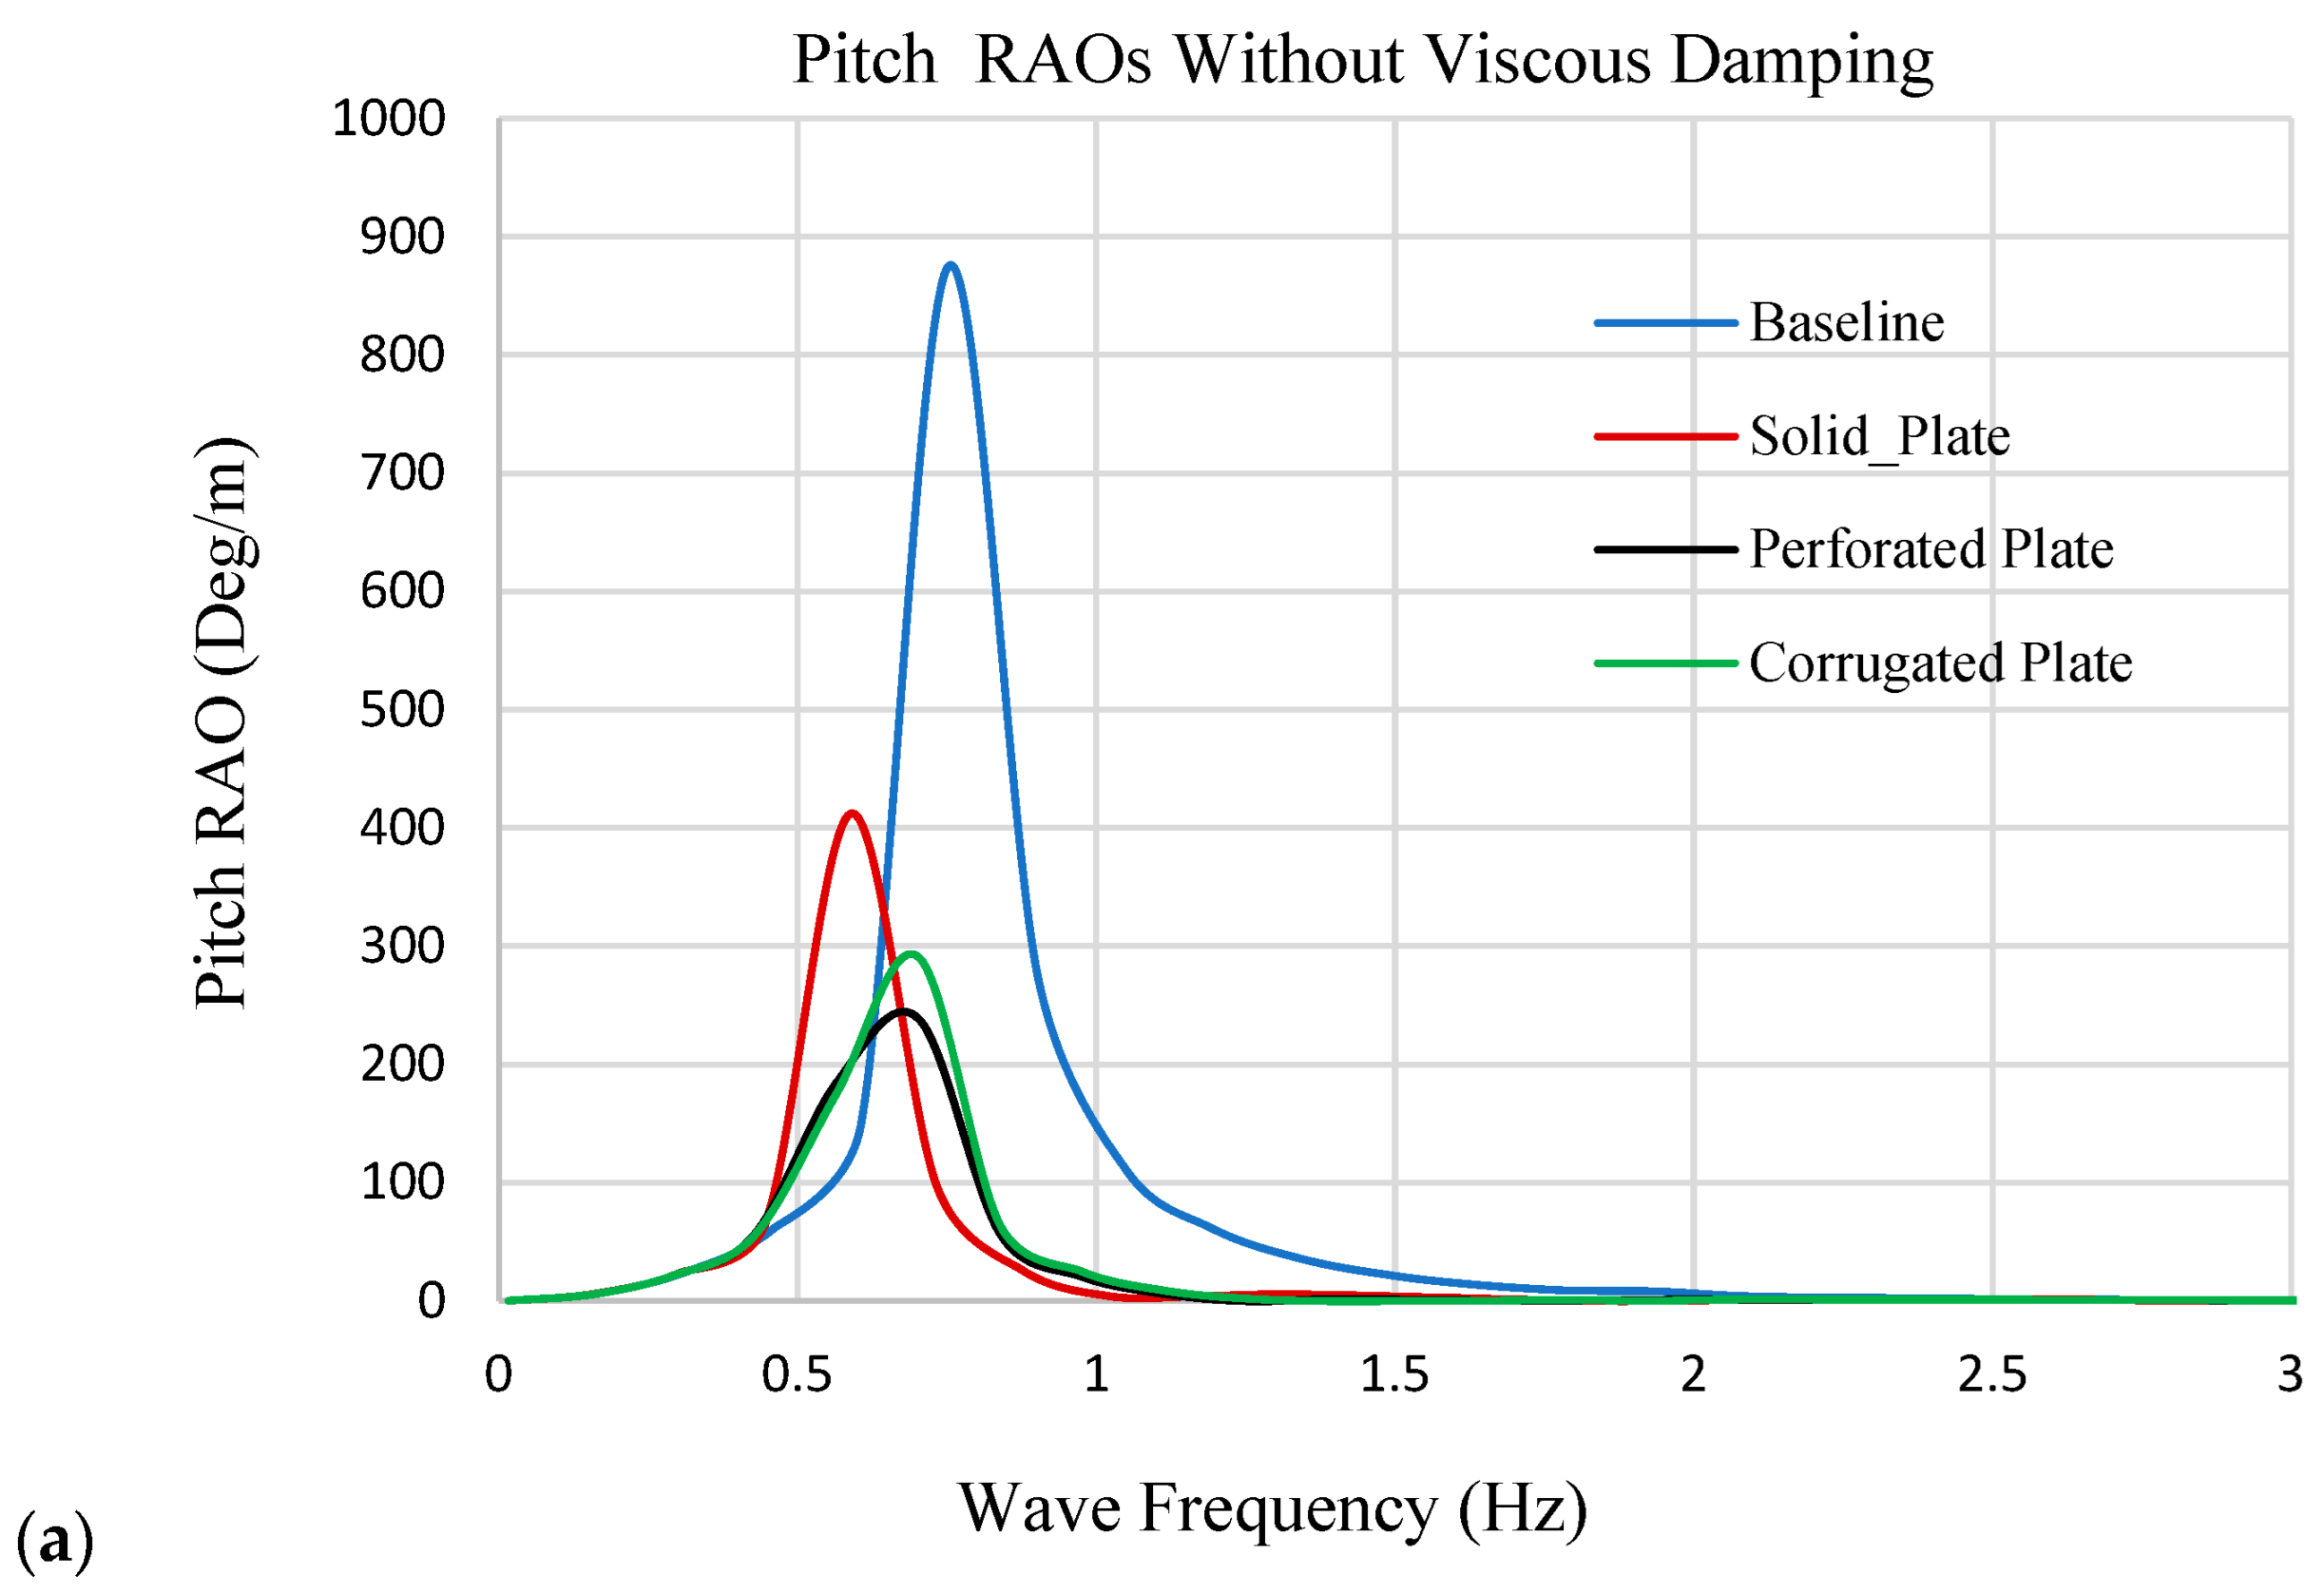
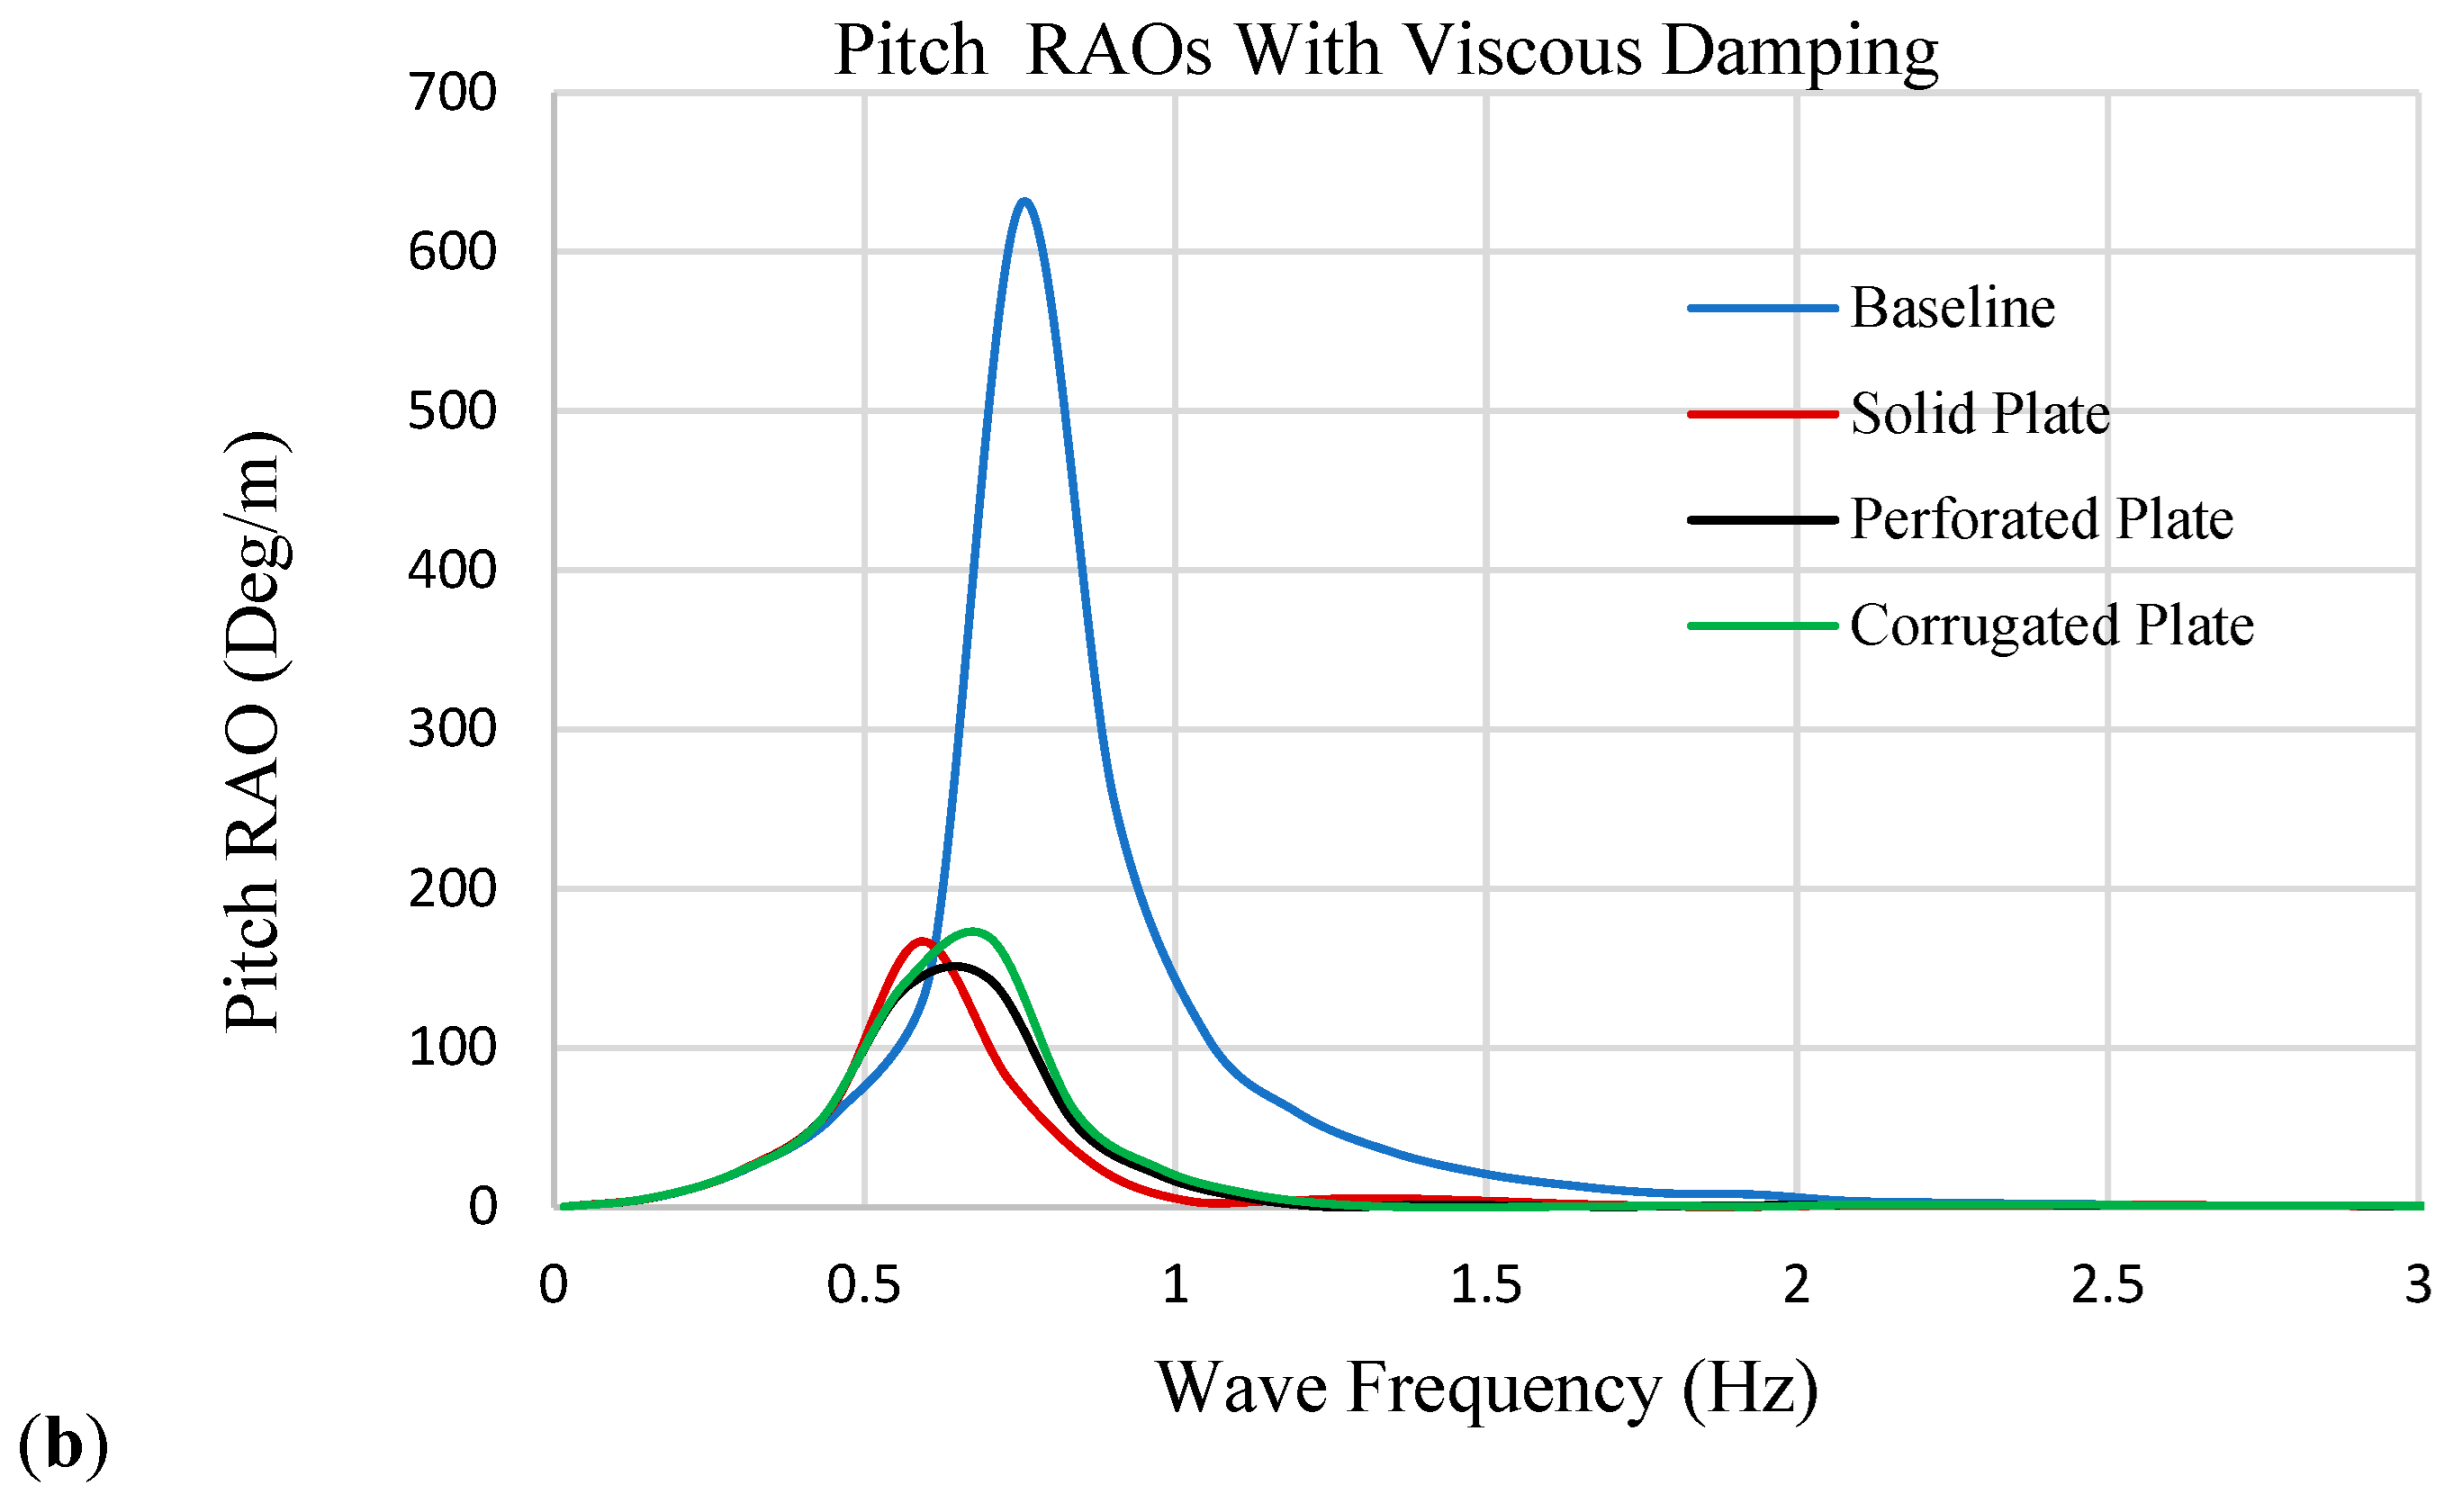
The trends observed in the heave extend to pitch motion as well. To complement the pitch damping and inertia coefficients already presented in Table 4, Figure 13 below shows the corresponding RAO curves with and without viscous damping. As in the heave case, the inclusion of viscous damping reduces the resonance peaks, with stronger effects observed in appendage-equipped cases.
Consistent with the coefficients discussed in Table 2 and Table 4, the numerical reductions in pitch RAOs at resonance are presented in Table 7, allowing a direct comparison of appendage effectiveness across both motion modes.

5.4. Integrated Discussion of Damping Effects

To synthesize the findings presented in Section 5.1, Section 5.2 and Section 5.3, this section provides an integrated discussion that connects the decay responses, hydrodynamic coefficients, and RAO analyses, thereby highlighting the overall influence of appendage on damping mechanisms and motion reduction.
The combined evidence from Table 2, Table 3, Table 4, Table 5 and Table 6 and Figure 9, Figure 10, Figure 11, Figure 12 and Figure 13 demonstrates that appendage geometry fundamentally alters flow structures and damping behavior, establishing a consistent hierarchy among the perforated, corrugated, and solid plate configurations.
Figure 10 presents the free-decay curves and the detailed time histories, in Figure 10a (heave) and Figure 10b (pitch), together with the damping ratios in Table 2, which highlight the strong influence of the perforated plate. In heave, the damping ratio almost doubled compared with the baseline (ζ = 0.160 vs. 0.082), while in pitch it increased from ζ = 0.061 to 0.117. The corresponding total damping coefficient more than doubled, increasing from 59.95 to 138.41 kg/s. The corrugated plate achieved slightly higher heave damping than the solid plate (ζ = 0.154 vs. 0.144) but fell short in pitch (ζ = 0.105 vs. 0.116). The solid plate mainly lengthened the natural period, producing the largest frequency reduction (to 4.32 rad/s). In pitch, all appendage cases exceeded 2.0 kg·m2/s in total damping, well above the baseline value of 0.94 kg·m2/s. These comparisons underline that while every appendage improves damping, the perforated plate is the most efficient, the corrugated plate shows balanced behavior, and the solid relies more on inertia than on viscous dissipation.
The flow fields in Figure 11a (turbulence intensity) and Figure 11b (vorticity) help explain these differences. In the baseline case, vortices were weak and turbulence stayed close to the cylinder base, so little energy was lost. By contrast, the perforated plate created fragmented vortices and intense turbulence around its openings, which explains its high viscous damping. The corrugated plate produced distributed vortices and wake turbulence, giving it intermediate performance. The solid plate drove broad recirculation and localized turbulence, but this mechanism depended more on added inertia than on dissipation. These flow patterns tie directly to the stronger decay rates seen in Figure 10 and Table 3.
Table 4 and Table 5 add further context by quantifying the hydrodynamic coefficients. In heave, viscous damping became the dominant term once appendages were fitted. The perforated plate reached b33 = 111.21 kg/s compared with only 19.39 kg/s for the baseline. Total damping rose to 138.41 kg/s for the perforated, 136.31 kg/s for the corrugated, and 131.28 kg/s for the solid, while radiation damping decreased from 40.55 kg/s in the baseline to 27.58 kg/s for the corrugated. In pitch, the solid plate showed the largest added inertia (1.156 vs. 0.718 kg·m2 for the baseline). Viscous damping values were consistently higher than radiation damping: 2.25 kg·m2/s for the solid, 2.18 for the perforated, and 1.98 for the corrugated. Radiation damping dropped sharply, from 0.286 kg·m2/s in the baseline to just 0.021 kg·m2/s for the corrugated. This confirms a clear shift from radiation- to viscous-dominated behavior when appendages are present.
The flow-field visualizations discussed in Section 5.1 (Figure 11a,b) provide physical evidence for these quantitative differences. The corrugated plate generates distributed vortices and moderate turbulence intensity along its ridge lines, sustaining energy dissipation over a broader region without forming strong localized jets. This contrasts with the perforated plate, which produces concentrated high-intensity vortices around its openings, and the solid plate, which induces a broad but inertia-dominated recirculation zone. These observed flow patterns explain the intermediate yet highly efficient damping behavior of the corrugated configuration, as later confirmed by the normalized metrics in Table 8 and Table 9.
To enable objective comparison among appendage types with nearly equal wet surface areas and similar added mass, a normalized efficiency metric was defined. The heave and pitch damping efficiencies were computed as the incremental total damping relative to the baseline configuration (ΔB = B − Bbaseline) divided by the total mass of each appendage configuration. The damping coefficients (B33 and B55) were obtained from the CFD results in Table 4 and Table 5. The masses attributed to each appendage configuration are shown in Table 1.
As presented in Table 8 below, this metric calculates the total damping increment per unit mass of the appendage. The analysis reveals that while the Perforated Plate has the highest absolute damping per unit mass, the Corrugated Plate offers a good efficiency (2.05) compared to the Solid Plate (1.91) and is highly competitive with the Perforated Plate (2.10). This demonstrates that the corrugated design is not merely novel but is an efficient solution for its weight, effectively balancing high damping performance with minimal mass addition.
Following the heave results in Table 8, the corresponding pitch damping efficiencies are summarized in Table 9. These results show that, although the corrugated plate exhibits slightly lower pitch damping efficiency (0.0285) than both the solid (0.0351) and perforated (0.0338) plates, it still achieves effective motion suppression. This reduction in efficiency is attributed to the distributed vortex pattern along the corrugations, which moderates localized energy dissipation compared with the more compact wake structures of the solid and perforated plates. Consequently, while the corrugated configuration offers superior balance and weight efficiency, its pitch damping capacity may be somewhat limited for extreme sea states or high-frequency oscillations where concentrated viscous dissipation is beneficial.
This indicates that the corrugated design provides sufficient pitch damping for effective motion suppression, while its superior heave efficiency (2.05 vs. 1.91 for the solid plate) yields a more balanced overall performance. The slightly lower pitch efficiency results from its distributed vortex pattern, which reduces localized energy loss yet maintains effective global damping, as confirmed by its RAO reduction. Although this mechanism may be less effective under high-frequency pitch oscillations, its overall balance between viscous dissipation and added-mass effects underscores the corrugated plate’s potential as a lightweight and hydrodynamically efficient damping enhancement.
The RAO analyses in Figure 12a (heave without viscous damping), Figure 12b (heave with viscous damping), and similarly, Figure 13a (Pitch without viscous damping), Figure 13b (with viscous damping) illustrate the practical consequences of the viscous effect close to the natural frequency, and the viscous effect is summarized in Table 6 and Table 7. Without viscous damping, resonance peaks were sharp and motions amplified, especially for the baseline and solid cases. When CFD-derived damping was included, amplitudes dropped considerably. In heave, reductions were about 33% for the baseline and 55–62% for appendage-equipped cases. In pitch, suppression reached nearly 60% for the solid plate and around 40–42% for the perforated and corrugated designs. Absolute pitch RAOs values remained high, but this outcome is consistent with small-scale free-floating, unmoored setup, which had low restoring stiffness and limited natural damping. Even so, the relative reductions confirm that viscous dissipation is the controlling factor. Among the appendages, the perforated plate consistently gave the lowest RAO amplitudes, the corrugated plate provided balanced reductions, and the solid plate produced strong absolute suppression but mainly through inertia.
This study’s findings are subject to certain limitations, yet they collectively offer clear design insights. The use of the RANS-based k–ε model, while computationally efficient, may under-resolve transient vortex interactions and small-scale turbulence structures, particularly for the novel corrugated plate. Although mesh convergence was achieved, minor discretization errors can accumulate over long decay durations, and the benchmark validation retains measurement and scale-related uncertainties. Moreover, the present analysis was limited to calm-water decay and regular-wave conditions, excluding mooring stiffness, coupled motions, and irregular seas.
Despite these constraints, the results clearly demonstrate that geometry dictates the balance between inertia-driven and dissipation-driven damping mechanisms. The perforated plate maximizes viscous energy loss through vortex shedding and turbulence; the solid plate provides strong absolute damping primarily through added mass but with lower efficiency; and the corrugated plate achieves balanced performance between viscous dissipation and inertia. The present analysis, however, did not include a parametric sensitivity study of corrugation geometry (ridge height, spacing, and wavelength) and its relationship with flow structures such as vorticity and turbulence intensity; further investigation of these effects would enhance understanding of geometry-induced damping mechanisms. From a design standpoint, shaping flow structures through perforation or corrugation proves more effective than merely increasing mass or surface area, providing valuable guidance for the development of lightweight yet highly efficient damping appendages for offshore platforms. These limitations define the numerical scope of the present study and form the basis for future methodological extensions discussed in the conclusions.

6. Conclusions

This study investigated the hydrodynamic behavior of a spar-type buoy fitted with solid, perforated, and corrugated plate appendages under wave excitation, with emphasis on the role of viscous damping in suppressing oscillatory motions. A hybrid numerical framework was established by coupling CFD-based Fluent free-decay simulations with potential-flow analysis in AQWA, thereby overcoming the common limitation of potential-flow solvers that neglect viscous effects. Validation against published experimental data confirmed the reliability of the extracted damping coefficients and RAO predictions.
The results showed that all appendages enhanced damping performance in both heave and pitch, though by different mechanisms. The perforated plate consistently achieved the most efficient damping through intensified vortex shedding and turbulence-driven energy dissipation. The corrugated plate, introduced here for the first time as a damping mechanism for spar buoys, delivered competitive performance, particularly in heave, by promoting distributed flow separation along ridge edges and sustaining wake turbulence without excessively increasing added mass. This highlights its potential as a tunable design that balances damping efficiency with hydrodynamic inertia. The solid plate, by contrast, produced strong absolute reductions but relied mainly on inertia, making it less efficient per unit mass. These findings underline that geometry-based flow manipulation can provide more effective damping than simply increasing structural mass or surface area, which is especially relevant for floating offshore wind platforms where weight minimization is a critical objective.
Incorporating CFD-derived viscous damping into the potential-flow model substantially reduced resonant RAO amplitudes by more than 50% for both heave and pitch across all appendage-equipped cases. The present analysis was limited to single-degree-of-freedom free-decay tests under regular wave forcing. Future work will extend the framework to six-degree-of-freedom (6-DOF) motion simulations, incorporate mooring dynamics, and evaluate irregular and extreme sea states to better represent real offshore conditions. Methodologically, adopting scale-resolving turbulence models (LES or DES) and formal uncertainty quantification will further improve the robustness of damping predictions. For the corrugated plate, parametric investigations of ridge height, wavelength, spacing, and slot dimensions, together with experimental validation in wave basins, are recommended to optimize viscous damping efficiency while minimizing added mass.
Author Contributions

Conceptualization, M.N.M. and D.B.B.; methodology, M.N.M.; software, M.N.M.; validation, M.N.M. and D.B.B.; formal analysis M.N.M.; investigation, M.N.M.; resources, D.B.B.; data curation, M.N.M.; writing—original draft preparation, M.N.M.; writing—review and editing, D.B.B.; visualization, M.N.M.; supervision, D.B.B. All authors have read and agreed to the published version of the manuscript.

Funding

This research received no external funding.

Institutional Review Board Statement

Not applicable.

Informed Consent Statement

Not applicable.

Data Availability Statement

The data presented in this study are available on request via email: nyako18@itu.edu.tr.

Acknowledgments

Computing resources used in this work were provided by the National Centre for High Performance Computing of Turkey (UHeM) under grant number 4020262024. The ANSYS Fluent software 2023 R1 version was used under an academic license provided and administered by Istanbul Technical University Turkey. This study is based on the thesis by M. Nyako Musa under the supervision of Deniz Bayraktar Bural.

Conflicts of Interest

The authors declare no conflicts of interest.

References

  1. Ciba, E. Heave Motion of a Vertical Cylinder with Heave Plates. Pol. Marit. Res. 2021, 28, 42–47. [Google Scholar] [CrossRef]
  2. Speight, J.G. Chapter 3—Offshore Platforms. In Subsea and Deepwater Oil and Gas Science and Technology; Speight, J.G., Ed.; Gulf Professional Publishing: Boston, MA, USA, 2015; pp. 71–106. ISBN 978-1-85617-558-6. [Google Scholar]
  3. Emerson, C.; Alex, B. GWEC’s Global Offshore Wind Report. Available online: https://www.gwec.net/reports/globaloffshorewindreport (accessed on 20 September 2025).
  4. Lee, I.; Kim, M.; Jin, C. Impact of hull flexibility on the global performance of a 15 MW concrete-spar floating offshore wind turbine. Mar. Struct. 2025, 100, 103724. [Google Scholar] [CrossRef]
  5. Hegde, P.; Nallayarasu, S. Hydrodynamic response of buoy form spar with heave plate near the free surface validated with experiments. Ocean Eng. 2023, 269, 113580. [Google Scholar] [CrossRef]
  6. Capobianco, R.; Rey, V.; Calvé, O.L. Experimental survey of the hydrodynamic performance of a small spar buoy. Appl. Ocean Res. 2002, 24, 309–320. [Google Scholar] [CrossRef]
  7. Zhu, L.; Lim, H.-C. Hydrodynamic characteristics of a separated heave plate mounted at a vertical circular cylinder. Ocean Eng. 2017, 131, 213–223. [Google Scholar] [CrossRef]
  8. Tao, L.; Dray, D. Hydrodynamic performance of solid and porous heave plates. Ocean Eng. 2008, 35, 1006–1014. [Google Scholar] [CrossRef]
  9. Bernal-Camacho, D.F.; Mendoza, E.; Fontes, J.V.H.; Echeverria, C.; Vakis, A.I. Experiments in an enclosed Wave–Wind Flume environment to study the dynamics of a small-scale Floating Offshore Wind Turbine. J. Ocean Eng. Mar. Energy 2024, 10, 917–939. [Google Scholar] [CrossRef]
  10. Ye, Z.; Su, S. Numerical study of water depth effects on the hydrodynamic performance of a shallow-water seismic survey ship’s Z-drive ducted propeller. Brodogradnja 2025, 76, 76401. [Google Scholar] [CrossRef]
  11. Holland, V.; Tezdogan, T.; Oguz, E. Full-scale CFD investigations of helical strakes as a means of reducing the vortex induced forces on a semi-submersible. Ocean Eng. 2017, 137, 338–351. [Google Scholar] [CrossRef]
  12. Nematbakhsh, A.; Olinger, D.J.; Tryggvason, G. Nonlinear simulation of a spar buoy floating wind turbine under extreme ocean conditions. J. Renew. Sustain. Energy 2014, 6, 033121. [Google Scholar] [CrossRef]
  13. Silva, L.S.P.; Cazzolato, B.; Sergiienko, N.Y.; Ding, B. Nonlinear dynamics of a floating offshore wind turbine platform via statistical quadratization—Mooring, wave and current interaction. Ocean Eng. 2021, 236, 109471. [Google Scholar] [CrossRef]
  14. Xue, W. Design, Numerical Modelling and Analysis of a Spar Floater Supporting the DTU 10MW Wind Turbine. Master Thesis, NTNU, Trondheim, Norway, 2016. [Google Scholar]
  15. Son, B.-H.; Jeong, S.-M. Numerical Study on the Improvement of the Motion Performance of a Light Buoy. J. Ocean Eng. Technol. 2020, 34, 66–76. [Google Scholar] [CrossRef]
  16. An, S.; Faltinsen, O.M. An experimental and numerical study of heave added mass and damping of horizontally submerged and perforated rectangular plates. J. Fluids Struct. 2013, 39, 87–101. [Google Scholar] [CrossRef]
  17. Yu, Y.-H.; Li, Y. Reynolds-Averaged Navier–Stokes simulation of the heave performance of a two-body floating-point absorber wave energy system. Comput. Fluids 2013, 73, 104–114. [Google Scholar] [CrossRef]
  18. Rao, M.J.; Nallayarasu, S.; Bhattacharyya, S.K. CFD approach to heave damping of spar with heave plates with experimental validation. Appl. Ocean Res. 2021, 108, 102517. [Google Scholar] [CrossRef]
  19. Srinivasamurthy, S.; Ishida, S.; Yoshida, S. Investigation into the Potential Use of Damping Plates in a Spar-Type Floating Offshore Wind Turbine. J. Mar. Sci. Eng. 2024, 12, 1071. [Google Scholar] [CrossRef]
  20. Colling, J.K.; Jafari Kang, S.; Dehdashti, E.; Husain, S.; Masoud, H.; Parker, G.G. Free-Decay Heave Motion of a Spherical Buoy. Fluids 2022, 7, 188. [Google Scholar] [CrossRef]
  21. Yang, H.-S.; Alkhabbaz, A.; Lee, Y.-H. Integrated CFD and hydrodynamic correction approach for load response analysis of floating offshore wind turbine. Ocean Eng. 2025, 328, 121007. [Google Scholar] [CrossRef]
  22. Bezunartea, A.; Ruano, S.; Maron, A.; Molinelli Fernández, E.; Moreno-Burón, F.; Oria-Escudero, J.; Riós-Tubio, J.; Soriano-Gomez, C.; Valea, Á.; Lopez-Pavon, C.; et al. Scale Effects on Heave Plates for Semi-Submersible Floating Offshore Wind Turbines: Case Study With a Solid Plain Plate. J. Offshore Mech. Arct. Eng. 2019, 142, 1–14. [Google Scholar] [CrossRef]
  23. Yu, H.; Hu, H.; Chen, W.-L.; Lu, Y.; Gao, D. Flow modulation mechanism in a cylinder with corrugated surfaces. Phys. Fluids 2024, 36, 015105. [Google Scholar] [CrossRef]
  24. Zhao, M. Numerical simulation of vortex-induced vibration of a circular cylinder in a spanwise shear flow. Phys. Fluids 2015, 27, 063101. [Google Scholar] [CrossRef]
  25. Koh, H.-J.; Cho, I.-H. Heave motion response of a circular cylinder with the dual damping plates. Ocean Eng. 2016, 125, 95–102. [Google Scholar] [CrossRef]
  26. Holmes, S.; Bhat, S.; Beynet, P.; Sablok, A.; Prislin, I. Heave Plate Design With Computational Fluid Dynamics. J. Offshore Mech. Arct. Eng. 2000, 123, 22–28. [Google Scholar] [CrossRef]
  27. Newman, J.N. Marine Hydrodynamics; MIT Press: Cambridge, MA, USA, 1977; ISBN 978-0-262-14026-3. [Google Scholar]
  28. Patankar, S. Numerical Heat Transfer and Fluid Flow; CRC Press: Boca Raton, FL, USA, 2018; ISBN 978-1-315-27513-0. [Google Scholar]
  29. Versteeg, H.K.; Malalasekera, W. An Introduction to Computational Fluid Dynamics: The Finite Volume Method; Pearson Education Limited: London, UK, 2007; ISBN 978-0-13-127498-3. [Google Scholar]
  30. ANSYS. Ansys Aqwa Theory Manual; ANSYS: Canonsburg, PA, USA, 2013. [Google Scholar]
  31. Journée, J.M.J.; Massie, W.W. Offshore Hydromechanics, 1st ed.; Delft University of Technology: Delft, The Netherlands, 2001. [Google Scholar]
  32. Rawson, K.J.; Tupper, E.C. Basic Ship Theory; Longman Scientific & Technical: Oxford, UK, 1994; ISBN 978-0-582-21922-9. [Google Scholar]
  33. Hirt, C.W.; Nichols, B.D. Volume of fluid (VOF) method for the dynamics of free boundaries. J. Comput. Phys. 1981, 39, 201–225. [Google Scholar] [CrossRef]
  34. ANSYS FLUENT 12.0 Theory Guide. Available online: https://www.afs.enea.it/project/neptunius/docs/fluent/html/th/main_pre.htm (accessed on 18 October 2025).
  35. Li, Y.; Lin, M. Regular and irregular wave impacts on floating body. Ocean Eng. 2012, 42, 93–101. [Google Scholar] [CrossRef]
  36. Palm, J.; Eskilsson, C.; Paredes, G.M.; Bergdahl, L. Coupled mooring analysis for floating wave energy converters using CFD: Formulation and validation. Int. J. Mar. Energy 2016, 16, 83–99. [Google Scholar] [CrossRef]
  37. Ruju, A.; Lara, J.L.; Losada, I.J. Radiation stress and low-frequency energy balance within the surf zone: A numerical approach. Coast. Eng. 2012, 68, 44–55. [Google Scholar] [CrossRef]
  38. Fluent Theory Guide. Available online: https://ansyshelp.ansys.com/public//Views/Secured/corp/v252/en/flu_th/flu_th.html (accessed on 19 October 2025).
  39. Celik, I.B.; Roache, P.J.; Ghia, U. Procedure for Estimation and Reporting of Uncertainty Due to Discretization in CFD Applications. J. Fluids Eng. 2008, 130, 078001. [Google Scholar] [CrossRef]
Figure 1. Representative applications of spar-type cylindrical hulls in offshore oil platforms and floating wind turbines.
Fluids 10 00281 g001
Figure 2. Geometric configuration of the spar hull with and without appendages (dimensions are in millimeters). (a) Conventional appendages: baseline, solid plate, and perforated plate. (b) Corrugated plate, representing the newly design concept.
Fluids 10 00281 g002
Figure 3. Overall numerical workflow for the hybrid methodology, combining CFD-based viscous damping estimation with potential-flow simulations for motion analysis.
Fluids 10 00281 g003
Figure 4. Representative heave free-decay curve from the baseline CFD simulation, used to illustrate the logarithmic decrement method for damping ratio calculation.
Fluids 10 00281 g004
Figure 5. Computational domain and applied boundary conditions for the free-decay simulations of the spar buoy configurations.
Fluids 10 00281 g005
Figure 6. Overset (chimera) grid system and near-wall mesh details used in the free-decay simulations. (a) Overview of the cross section of the overset (chimera) grid system used for the free decay simulations. The buoy moves within the fine component mesh, which overlaps with the coarse background domain. Flow variables are transferred in the region of interpolated cells. The SWL is refined to capture air–water free surface. (b) Close-up view of the Baseline overset component mesh, showing the detailed prism boundary layers wrapping the buoy’s bottom edge to resolve viscous flow and boundary layer. (c) Close-up mesh details of the Solid Plate configuration, highlighting the eight prism layers employed to accurately resolve the viscous boundary layer and associated damping.
Fluids 10 00281 g006
Figure 7. Validation of CFD simulations against verified experimental and numerical results from Palm et al. [36]. (a) Comparison of free-decay responses in heave for a reference spar buoy. (b) Comparison of pitch free-decay responses for a truncated spar buoy.
Fluids 10 00281 g007
Figure 8. Mesh convergence study of the pitch free-decay response, presenting displacement (°) versus time (s) for coarse, medium, and fine grids, compared against the experimental reference data of Palm et al. [36].
Fluids 10 00281 g008
Figure 9. Aqwa computational domain with the meshed appendages. The diffraction analysis utilized a constant-panel mesh with approximately 12,000–15,000 elements per configuration within a cubic domain of 50 m side length.
Fluids 10 00281 g009
Figure 10. Results of Free decay responses of the spar buoys for different appendage configurations in (a) heave and (b) pitch directions, obtained from CFD simulations.
Fluids 10 00281 g010
Figure 11. Flow-field visualizations of the (a) turbulent intensity and (b) vorticity contours during pitch decay for all appendage configurations. The left and right columns correspond to the 3rd and 4th oscillation peaks, respectively. Rows show (from top to bottom) the baseline, solid-plate, perforated-plate, and corrugated-plate configurations.
Fluids 10 00281 g011aFluids 10 00281 g011b
Figure 12. Heave Response Amplitude Operators (RAOs) of spar buoy configurations under regular wave forcing, comparing results with and without applied viscous damping coefficients. (a) RAOs without viscous damping (only radiation effects). (b) RAOs with viscous damping values derived from CFD-based free decay simulations.
Fluids 10 00281 g012
Figure 13. Pitch Response Amplitude Operators (RAOs) of spar buoy configurations, shown with and without the inclusion of viscous damping coefficients. (a) RAOs computed with no viscous damping; (b) RAOs computed using combined radiation and CFD-based viscous damping.
Fluids 10 00281 g013aFluids 10 00281 g013b
Table 1. Hydrostatic properties of the baseline spar and appendage-equipped configurations.
Appendage ConfigurationDiameter Cylinder
(m)
Diameter Plate
(m)
Mass
(kg)
Draft
(m)
CG
(From Base)
(m)
CB
(From Base)
(m)
Metacentric Height GM
(m)
Mass Moment of Inertia
(kg·m2)
Baseline0.5150.51535.830.1720.0750.0860.1071.264
Solid Plate0.5150.669537.350.1730.0720.0830.1031.340
Perforated Plate0.5150.669537.270.1730.0720.0830.1031.336
Corrugated Plate0.5150.669537.210.1730.0720.0830.1041.332
Table 2. The Grid Convergence Index (GCI) values indicate the numerical uncertainty in the fine-grid solutions, with the first Peak showing the best convergence characteristics (GCI = 0.72%) and the second Trough showing the highest uncertainty (GCI = 3.90%).
QuantityQuantity1st Trough1st Peak2nd Trough
Mesh counts
Fine1, Medium2 Coarse3
N1, N2, N3(410,000), (270,000), (130,000)(410,000), (270,000), (130,000)(410,000), (270,000), (130,000)
Grid refinement ratio21r211.14981.14981.1498
Grid refinement ratio32r321.27551.27551.2755
Variable of interest QOI1φ1−8.87.39−6.47
Variable of interest QOI2φ2−8.787.37−6.4 3
Variable of interest QOI3φ3−8.747.31−6.34
order of accuracyp0.682.761.30
Extrapolated value21 ϕ e x t 21 −9.007.428−6.672
Approximate relative error21 e a 21 (%)0.2270.2710.618
Extrapolated relative error e e x t 21 (%)2.250.5123.027
Grid Convergence Index G C I f i n e 21 (%)2.860.7233.895
Table 3. Summary of dimensionless damping ratios ζ, natural frequencies ω, and total damping coefficients B for heave and pitch free-decay responses of the baseline spar and appendage-equipped configurations.
HeavePitch
Appendage ConfigurationDimensionless
Damping
Ratio (ζ)
Natural
Frequency ωn
(rad/s)
Total
Damping
B
(kg/s)
Dimensionless Damping Ratio
ζ
Natural
Frequency ωn
(rad/s)
Total
Damping
B
(kg·m2/s)
Baseline0.0825.2759.950.0615.450.941
Solid Plate0.1444.32131.280.1164.642.252
Perforated Plate0.1604.35138.410.1174.732.202
Corrugated Plate0.1544.44136.310.1054.842.002
Table 4. Hydrodynamic coefficients for heave motion: added mass, effective mass, total damping B33 radiation damping r33, and viscous damping b33 for the baseline spar and appendage-equipped configurations.
Heave
Appendage ConfigurationAdded Mass
(kg)
Effective Mass (M + Ma)
kg
Total
Damping B33
(kg/s)
Radiation Damping r33
(kg/s)
Viscous
Damping b33
(kg/s)
Baseline28.6064.4359.9440.5519.40
Solid Plate62.1499.49131.2825.37105.91
Perforated Plate57.0194.27138.4127.20111.21
Corrugated Plate56.5593.75136.3127.58108.73
Table 5. Hydrodynamic coefficients for pitch motion: added inertia Ia, effective inertia I + Ia, total damping B55, radiation damping r55, and viscous damping coefficient b55 for the baseline spar and appendage-equipped configurations.
Pitch
Appendage
Configuration
Added Inertia Ia
(kg·m2/rad)
Effective inertia I + Ia
(kg·m2)
Total Damping B55
(kg·m2/s)
Radiation
Damping r55 (kg·m2/s)
Viscous Damping b55
(kg·m2/s)
Baseline0.3101.5740.9410.2860.66
Solid Plate1.1562.4962.2520.0062.25
Perforated Plate0.9932.3292.2020.0192.18
Corrugated Plate0.9952.3272.0020.0211.98
Table 6. Percentage change in heave RAOs at resonance frequency, comparing simulations without viscous damping (radiation-only) and with CFD-derived viscous damping for the baseline spar and appendage configurations.
Heave No Viscous DampingHeave with Viscous Damping
Appendage
Configuration
Resonant Freq ωr
(Hz)
RAO
(m/m)
Resonant Freq ωr
(Hz)
RAO
(m/m)
RAO Percent % Change at ωr
Baseline0.902.960.901.97−33.19
Solid Plate0.692.930.691.11−61.98
Perforated Plate0.702.530.701.07−57.62
Corrugated Plate0.702.430.701.09−55.03
Table 7. Percentage change in pitch RAOs at resonant frequency, comparing simulations without viscous damping (radiation-only) and with CFD-derived viscous damping for the baseline spar and appendage configurations.
Pitch No Viscous DampingPitch with Viscous Damping
Appendage
Configuration
Resonant
Freq (Hz)
RAO
(Deg/m)
Resonant Freq at ωr (Hz)RAO
(Deg/m)
RAO Percent % Change at ωr
Baseline0.76875.380.75631.04−27.91
Solid Plate0.59412.280.59166.80−59.54
Perforated Plate0.70239.040.70142.73−40.29
Corrugated Plate0.70291.110.70169.07−41.92
Table 8. Heave damping efficiency comparison. The corrugated plate shows high damping per unit mass, outperforming the solid plate and matching the perforated plate.
Appendage ConfigurationTotal Mass (kg)Total Heave Damping, B33 (kg/s)Damping per Mass (B33/Mass) (s−1)Heave Damping Efficiency (ΔB33/Mass) (s−1)
Baseline35.8359.941.67--
Solid Plate37.35131.283.511.91
Perforated Plate37.27138.413.712.1
Corrugated Plate37.21136.313.662.05
Table 9. Pitch damping efficiency comparison. While less efficient in pitch damping per unit mass, the corrugated plate remains effective in pitch motion suppression (see Table 6), demonstrating balanced performance.
Appendage ConfigurationTotal Mass (kg)Total Pitch Damping, B55 (kg·m2/s)Damping per Mass (B55/Mass) (m2/s)Pitch Damping Efficiency (ΔB55/Mass) (m2/s)
Baseline35.830.9410.0263--
Solid Plate37.352.2520.06030.0351
Perforated Plate37.272.2020.05910.0338
Corrugated Plate37.212.0020.05380.0285
Disclaimer/Publisher’s Note: The statements, opinions and data contained in all publications are solely those of the individual author(s) and contributor(s) and not of MDPI and/or the editor(s). MDPI and/or the editor(s) disclaim responsibility for any injury to people or property resulting from any ideas, methods, instructions or products referred to in the content.