Article

Pressure Drops for Turbulent Liquid Single-Phase and Gas–Liquid Two-Phase Flows in Komax Triple Action Static Mixer

1
Laboratory of Theoretical and Applied Fluid Mechanics (LMFTA), Faculty of Physics, University of Sciences and Technology Houari Boumediene (USTHB), BP 32 El Alia, Bab Ezzouar, Algiers 16111, Algeria
2
Faculty of Sciences, University of Algiers 1—Benyoucef Benkhedda, 02 Avenue Didouche Mourad, Algiers 16000, Algeria
3
Universitat Rovira i Virgili, Departament d’Enginyeria Mecànica, Av. Països Catalans 26, 43007 Tarragona, Spain
4
Nantes Université, ONIRIS, CNRS, GEPEA, UMR-6144, 37 Bd de l’Université, BP406, 44602 Saint-Nazaire, France
*
Author to whom correspondence should be addressed.
Fluids 2025, 10(10), 259; https://doi.org/10.3390/fluids10100259
Submission received: 28 August 2025 / Revised: 25 September 2025 / Accepted: 29 September 2025 / Published: 4 October 2025
(This article belongs to the Special Issue Pipe Flow: Research and Applications, 2nd Edition)

Abstract

Static mixers are commonly used for process intensification in a wide range of industrial applications. For the design and selection of a static mixer, an accurate prediction of the hydraulic performance, particularly the pressure drop, is essential. This experimental study examines the pressure drop for turbulent single-phase and gas–liquid two-phase flows through a Komax triple-action static mixer placed on a horizontal pipeline. New values of friction factor and z-factor are reported for fully turbulent liquid single-phase flow (11,700 ≤ ReL ≤ 18,700). For two-phase flow, the pressure drop for stratified and intermittent flows (0.07 m/s ≤ UL ≤ 0.28 m/s and 0.46 m/s ≤ UG ≤ 3.05 m/s) is modeled using the Lockhart–Martinelli approach, with a coefficient, C, correlated to the homogenous void fraction. Conversely, the analysis of power dissipation reveals a dependence on both liquid and gas superficial velocities. For conditions corresponding to intermittent flow upstream of the mixer, flow visualization revealed the emergence of a swirling flow in the Komax static mixer. It is interesting to note that an increase in slug frequency leads to an increase, followed by stabilization of the pressure drop. The results offer valuable insights for improving the design and optimization of Komax static mixers operating under single-phase and two-phase flow conditions. In particular, the reported correlations can serve as practical tools for predicting hydraulic losses during the design and scale-up. Moreover, the observed influence of the slug frequency on the pressure drop provides guidance for selecting operating conditions that minimize energy consumption while ensuring efficient mixing.

1. Introduction

Process intensification (PI) is defined as an innovative principle applied in chemical reaction engineering and process design in order to achieve benefits in terms of process efficiency, higher quality of products, lower capital and operating expenses, less waste, and improved process safety [1]. Mixing, which involves combining material flows to reduce the inhomogeneity of a system caused by the existence of a phase, concentration, viscosity, or temperature gradient [2,3,4], is one example of PI application [1]. Traditionally, mixing is performed using impinging jets, stirred tanks, or static mixers [5]. Despite its wide variety of applications and utilization, mixing is considered to be an art [6].
Static (or motionless) mixers (SMs) are devices equipped with a series of identical inserts or elements that divide and redistribute the flow streamlines sequentially, following radial and tangential directions to the main flow, promoting the mixing [4,7,8]. The static mixers are directly installed in pipes, channels, columns, or reactors. These devices have lower space requirements, residence time, and costs, in addition to the absence of moving parts, which reduces maintenance compared to stirred tanks [1,9,10,11]. These advantages explain their wide utilization in several industries such as flocculation [10], food processing, chemical production [12], biomass production from natural gas [13], water treatment [1], air foam systems [14], polymer processing, chemical reactions, food processing, paints, and pharmaceuticals [15]. The interested reader can find more details on the applications of SMs in the reviews presented by Gavrilescu and Tudose [16], Thakur et al. [7], Meijer et al. [17], Ghanem et al. [8], Valdés et al. [4], and Yu et al. [12].
Nowadays, a great number of SMs is currently available on the market (Kenics, SMV, Sulzer, SMX, SMXL, Komax, Koflo, Lightnin, LPD, LLPD, etc.). The choice of static mixer depends on two criteria: quality of mixing and energy consumption [18,19], which can be quantified with the coefficient of variation (CoV) downstream of the mixer and hydraulic performance, notably the pressure drop, through the SM, respectively [15,20,21,22]. The difficulty of deriving pressure drop models directly from physical conservation laws, mainly due to the complex, turbulent, and three-dimensional nature of the flow in static mixers, has led to the widespread use of empirical correlations. The vast majority of published correlations (summarized in [4,7,12,16,23]) were obtained by fitting laboratory-scale data for specific static mixer designs, pipe geometries, fluids, and operating conditions, with little or no validation against independent datasets. Consequently, many correlations exist, each applicable only to a narrow combination of mixer geometry, fluid type (e.g., Newtonian, non-Newtonian, or multiphase), and flow regime (laminar or turbulent). Note that, to facilitate scale-up, the pressure drop across a static mixer is commonly reported using either the dimensionless friction factor (f) or the pressure-drop ratio (z-factor).
The reliability of computational fluid dynamics (CFD) for accurately simulating single-phase and multiphase flows through static mixers is well established, as demonstrated by numerous studies. Detailed flow dynamics of both single-phase and multiphase flows were analyzed by means of particle tracking, the discrete element method (DEM), and Euler-Euler and volume of fluid (VOF) solvers [5,12,14,24,25,26,27,28,29,30,31,32]. CFD has a number of advantages, particularly for multiphase flows, where it is not always easy to make local measurements on the SM [33]. The great majority of CFD analysis of flow through SM were validated with experimental results or empirical correlations of pressure drop [5,11,21,28,31,33,34,35,36,37,38,39]. This statement highlights the importance of experimental measurement and predictive correlations of pressure drop.
Komax (Komax Systems Inc, Huntington Beach California, USA) is made from slotted sheet metal pieces with bent ends, forming triangular-shaped flow channels. There is also the Komax triple action mixer, which works in three stages: (i) two-by-two division, (ii) cross-current mixing, and (iii) counter-rotating vortices and back mixing [12,34]. This characteristic ensures a high level of efficiency [37]. Its geometric design (intersecting slotted plates) is well-suited for promoting turbulence and interfacial interaction, which are notably desirable for gas–liquid contact [23].
Komax also has the advantage of generating a lower pressure drop and a higher mixing quality than other commercial SM [19,21,24]. For instance, Qiao et al. [19] compared the mixing efficiency and energy consumption of four kinds of static mixers (Kenics, Komax, LPD and curved-sheet blade-folded (CBF)). A higher performance was obtained with Komax. The Komax performance was previously studied by Rakoczy et al. [40] and Revathi and Saravanan [41], while the values of friction factor and pressure drop factor of Komax for the case of laminar flow and non-Newtonian fluid was provided in Gavrilescu and Tudose [16]. Moghaddam [42] studied numerically the mixing quality and pressure drop for Komax in the presence of non-Newtonian shear thinning fluid. Meng et al. [37] pointed out that there is a lack of knowledge on the performance of Komax in a turbulent regime. These authors studied the hydrodynamic and heat transfer performance by carrying out experiments and CFD simulations of Komax placed in a vertical pipe. The results were compared with those obtained with Ross LPD. A larger magnitude of secondary flow intensity and swirl intensity was reported in Komax, which allowed us to enhance the heat transfer coefficient. By analyzing the frequency spectrum of pressure time series, the authors reported that the flow in Komax has a chaotic nature, which enhances the heat and mass transfer.
In multiphase flow, the static mixers are used for dispersion of immiscible phases [43,44,45], mixing crude oil and washing water [31], dispersing gas phase into liquid phase [25], dissolving O2 and O3 in liquid phase [30,46], and granular flow [24]. Compared to single-phase flow, there are few works carried out for the case of multiphase flow [26,47,48]. Pressure drop correlations for horizontal gas–liquid two-phase flow in static mixers have been developed for the Lightnin [43,49,50], Statiflo [49], CoRec [50], Kenics [22], and swirler [47]. As with single-phase flow, these models have not been validated using independent data.
Rabha et al. [25] performed experiments of helical static mixer in upward gas–liquid two-phase flow. The authors notably studied the effect of the number of elements on the bubble size distribution, gas holdup radial profile, specific interfacial area and the pressure drop. Meng et al. [51] experimentally characterized the statistical distribution of bubble mean diameters and Sauter mean diameter gas–liquid bubbly flow in a static mixer with three twisted leaves (TKSM) placed in a vertical pipe. A correlation predicting the Sauter mean diameter was proposed. Interestingly, reporting the experimental conditions in the flow map of Hewitt and Roberts [52] showed that they fall in the slug flow region. This finding explains the influence of SM on the flow transitions. This change in flow interfaces was also discussed in Xue et al. [53], Liu et al. [47], and Yu et al. [54].
More recently, Marrocos et al. [55] have experimentally and numerically investigated the pressure drop generated by NETmix flowing in a vertical gas–liquid downflow. The authors notably showed that the 2D simulations are reliable for predicting the gas–liquid behavior as well as the bubbles’ size and shape. For gas–liquid applications, it is recommended to use SMs with open geometry with blades [56]. This category notably regroups the Komax. There are very few works focused on Komax performance with the presence of gas–liquid two-phase flow. McCowan [57] studied a pilot-scale horizontal inline diffused aeration (HILDA) equipped with a Komax mixer, operating under air-water two-phase flow conditions.
On the other hand, the gas–liquid two-phase flow exhibits a multitude of interfacial shapes called flow regimes [58]. Each flow regime exhibits a specific hydrodynamic, as well as heat and mass transfer behavior. The intermittent flow is characterized by an elongated bubble flowing on a liquid film, and a liquid piston [59], as shown in Figure 1. This behavior gives this flow regime its intermittent feature [58,59]. The aeration level within liquid slug is more important in the region just behind the tail of the elongated bubble, promoting the aeration and mixing [59].
The low number of studies on Komax mixers under turbulent liquid single-phase and gas–liquid two-phase flow conditions constitutes the main motivation of the present work. This manuscript aims to present the results of the pressure drop obtained through experiments carried out with a Komax triple action placed in horizontal 40 mm ID. The presented data will be analyzed and correlated. In addition, special attention will be devoted to characterizing slug frequency, which is the number of liquid slugs passing through a point per unit of time, and to study its relation with the generated pressure drop.

2. Experimental Setup

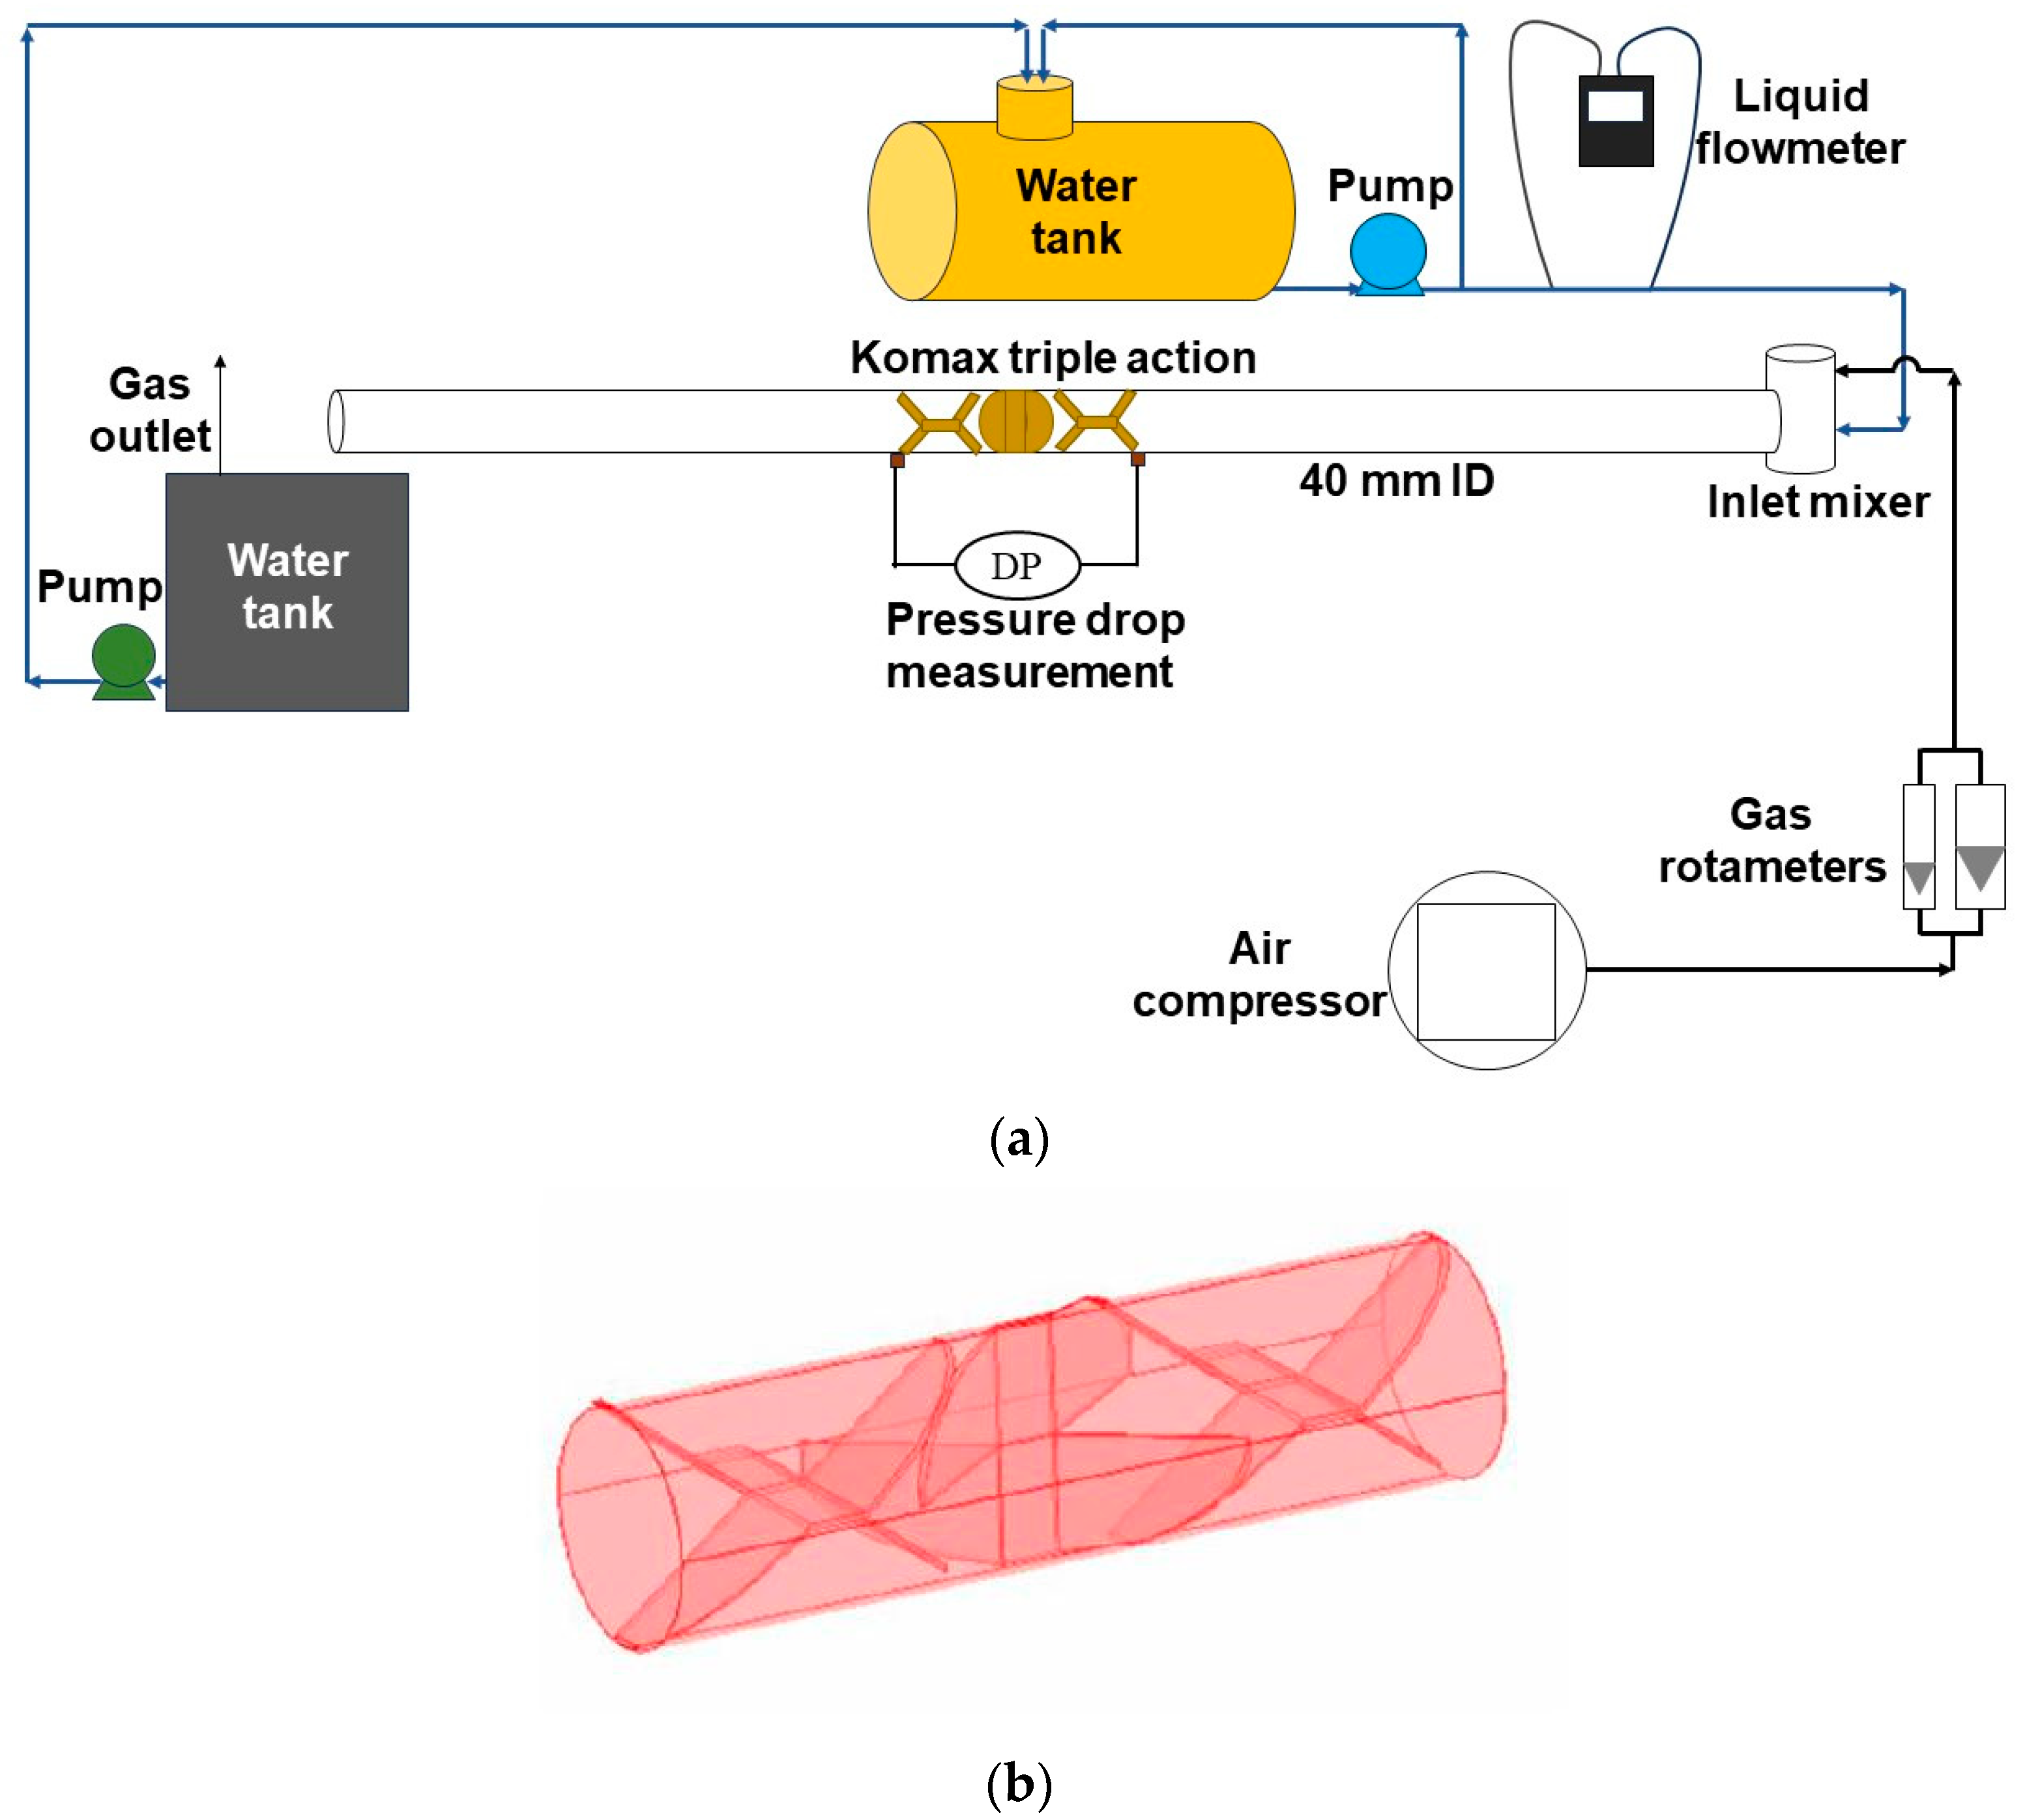
A schematic diagram of the experimental setup is shown in Figure 2a. The experiments were conducted in a horizontal pipe of 14 m length and 40 mm inner diameter using air and water. The liquid phase is injected into the test section using a centrifugal pump concurrent to the gas flow. The liquid flow rate was measured using a GE PT878 portable ultrasonic flow meter (GE Panametrics, Billerica, MA, USA), while two gas rotameters (Aalborg VMRP010092 and VMRP010083; Aalborg Instruments & Controls, Inc., Orangeburg, NY, USA), mounted in parallel, were used for gas flow rate measurement. The uncertainties in the gas and liquid flow rates are estimated to be ±7 L/min and ±0.66 L/min, respectively. Further details regarding these uncertainty estimations can be found in Arabi [60].
In order to enhance the initial stratification of the two-phase streams, the inlets are arranged so that each phase was introduced at a point governed by its relative density: air was fed from the top and water into the bottom of the two-phase inlet mixer.
A Komax Mixer triple action type (Komax Systems, Inc., Huntington Beach, CA, USA), shown in Figure 2b, was used in this study. It consists of crossed elliptical plates with a flat at the centerline. It is composed of 3 inserts with a 90° twist angle. The geometric characteristics of the employed static mixer are summarized in Table 1. It was placed at a distance of 145D from the mixer inlet.
The pressure measurements were carried out using the multitube manometer. However, the pressure fluctuations observed in the intermittent flow did not allow us to use this apparatus. Thus, a piezoresistive pressure transducer accoupled with an acquisition system was used to acquire the pressure drop time series. The Motorola MPX50DP sensor (Motorola, Inc., Schaumburg, IL, USA) was used to acquire the pressure drop time series. Its typical accuracy is ±0.25% of the full-scale span (VFSS). Note that in both cases, the pressure taps were placed at the locations of the inlet and outlet of the static mixer.
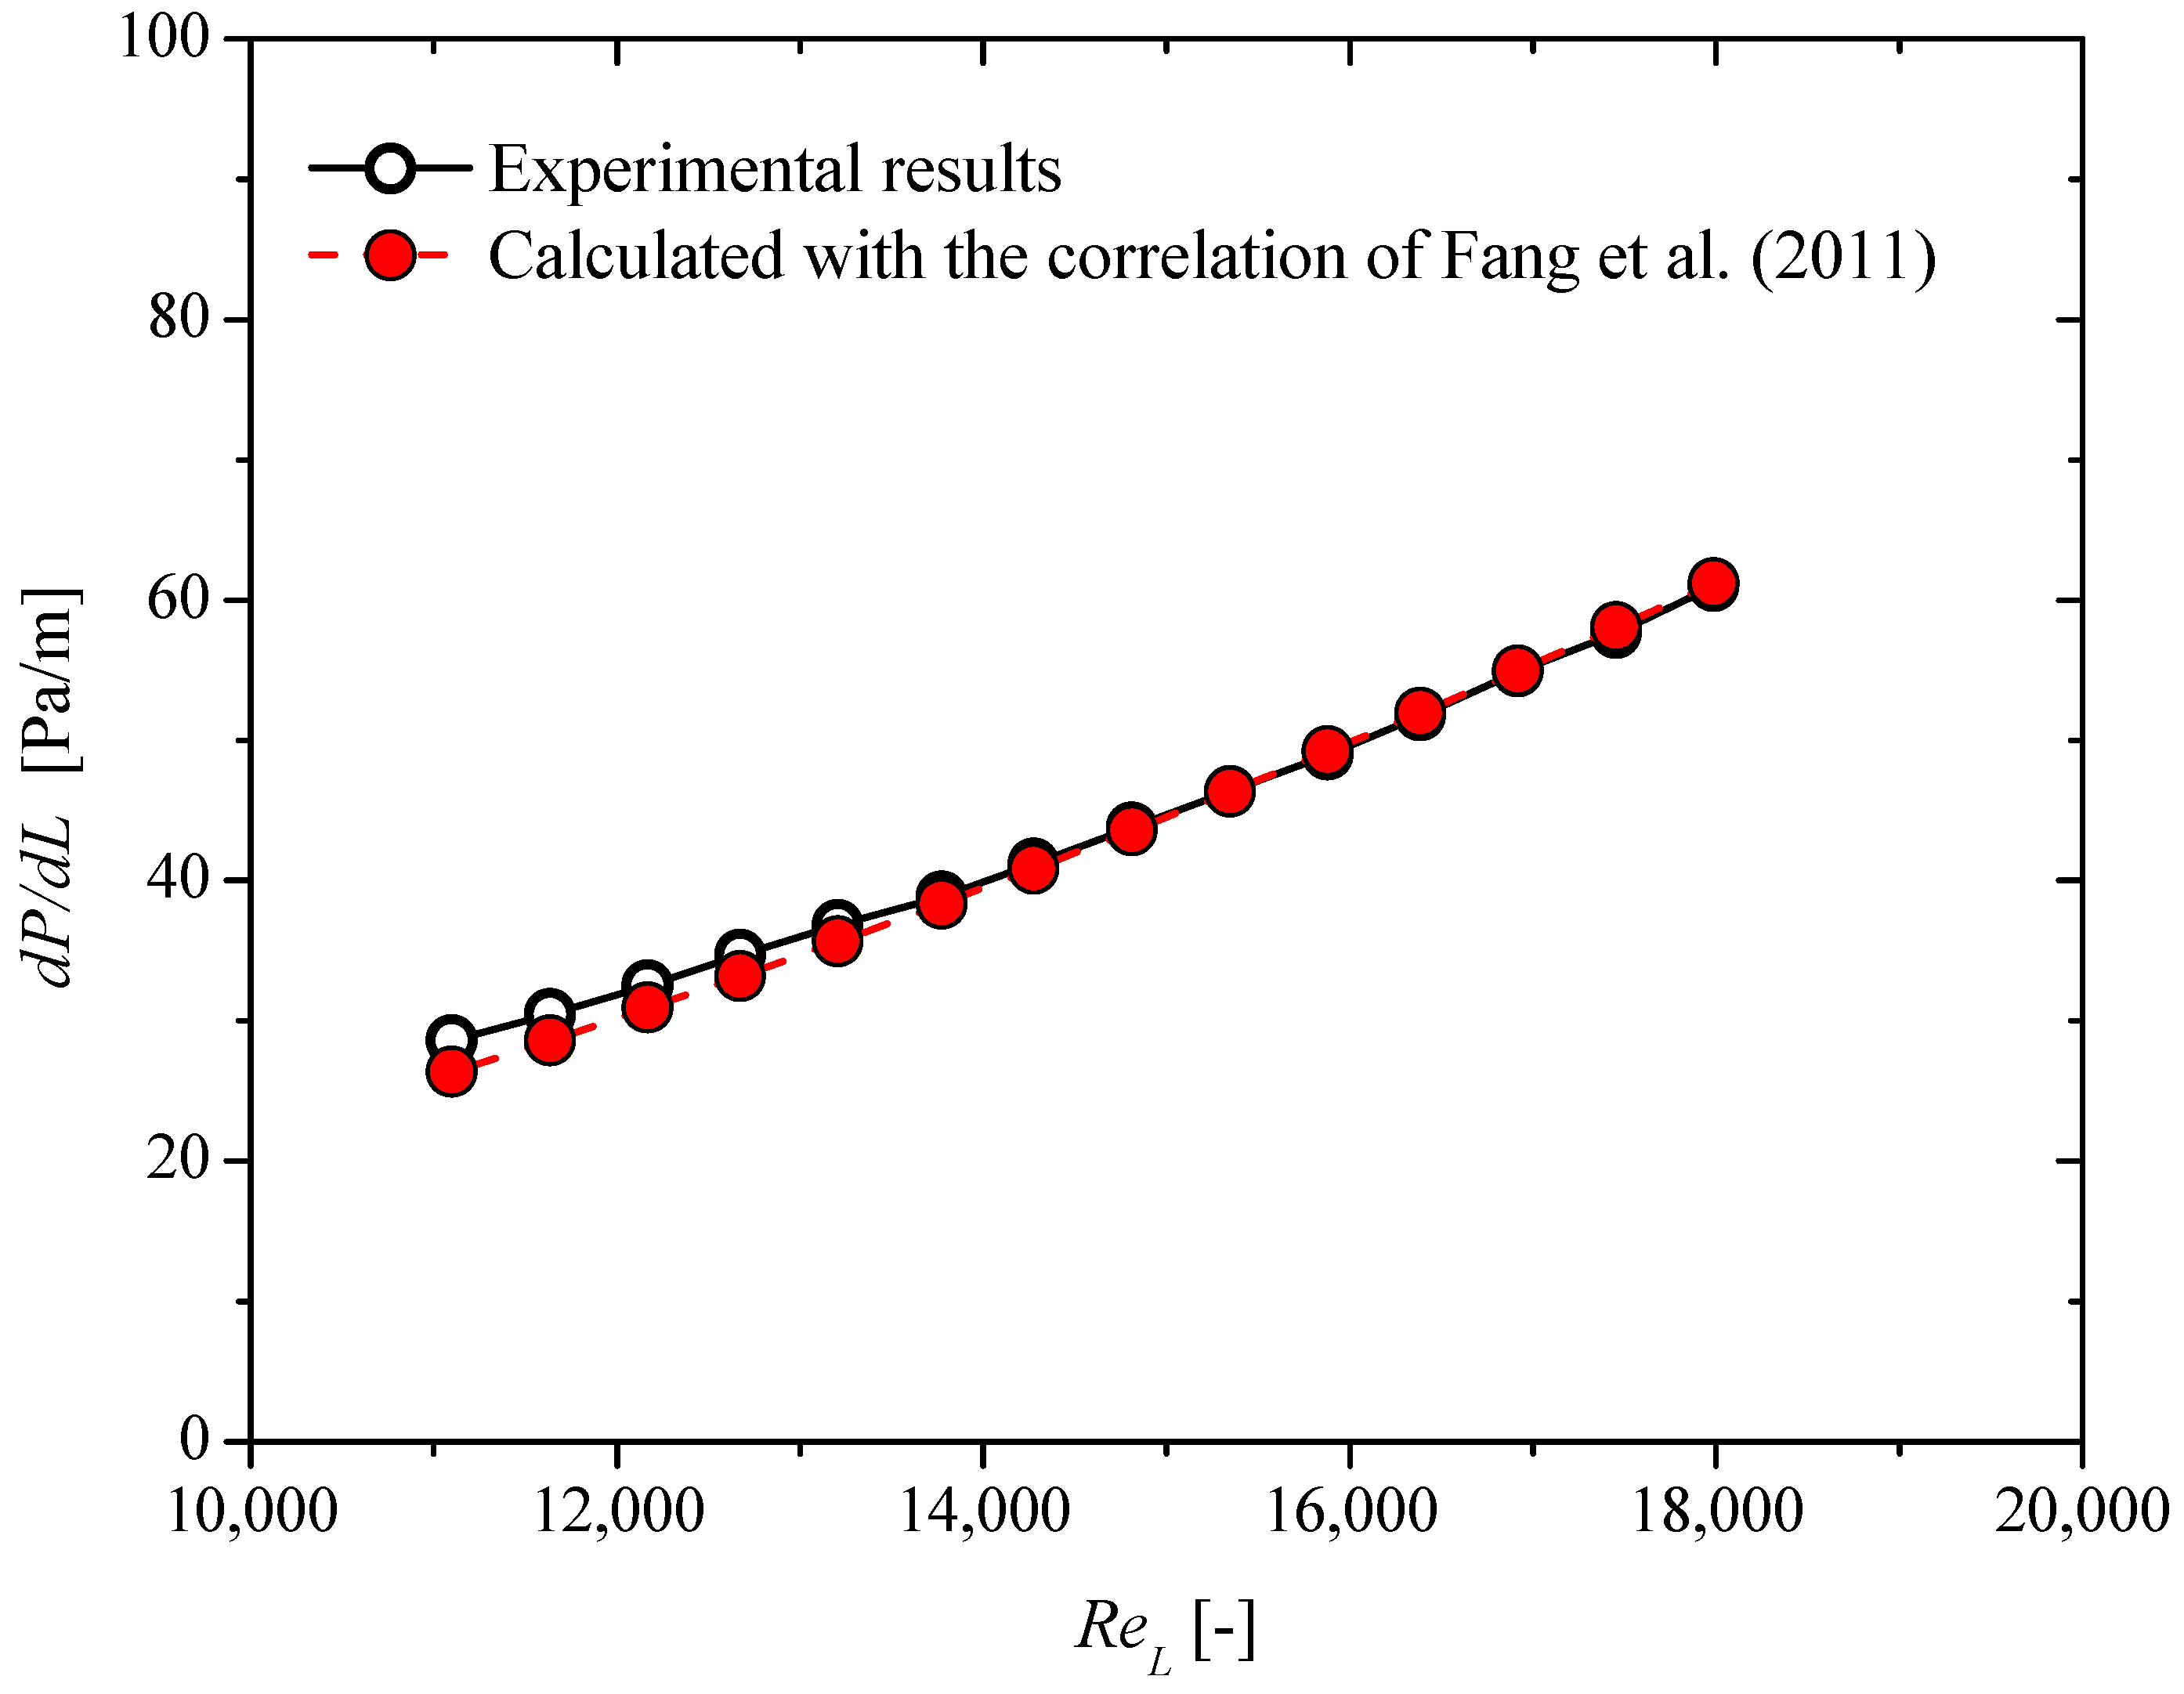
To validate the experimental setup and the measurement method, the pressure drop gradient (dP/dL) measured in the empty pipe (pipe without static mixer) was compared with the predictions obtained, using the friction factor correlation of Fang et al. [61] (Equation (1)).
f = 0.25 l o g 150.39 R e i 0.98865 152.66 R e i 2 ,
Figure 3 presents the comparison between the experimental results and the predictions as a function of the liquid Reynolds number (ReL) (Equation (2)), showing very good agreement. The mean relative error and the mean absolute relative error were 1.94% and 2.21%, respectively.
R e L = ρ L V L D µ L ,
where VL, ρL and μL are the liquid velocity, density and viscosity, respectively.

3. Results and Discussion

3.1. Liquid Single-Phase Flow

The pressure drop generated by a static mixer (ΔPm) is generally quantified by plotting friction factor (f), given by Equation (3), as a function of the liquid Reynolds number, which serves as a dimensionless parameter, capturing the balance between inertial and viscous forces [62,63].
f = 2 Δ P m D L ρ L V L 2 ,
The obtained results are plotted in this manner in Figure 4a. One can clearly observe that in turbulent flow conditions explored in this study (11,700 ≤ ReL ≤ 18,700), f reaches a constant value of 1.2 (Equation (4)).
f = 1.2 ,
Figure 4b presents the calculated f for the Komax Triple Action static mixer, compared to values reported in the literature for other mixer types, including Kenics [64], Koflo [64], Lightnin [43], and Komax [37]. The comparison clearly demonstrates that the Komax triple action design consistently results in the lowest pressure drop among the evaluated static mixers. On the other hand, the pressure drop can be estimated using the dimensionless factor z, defined as the ratio between the pressure gradient across the static mixer (ΔPm/L) and that in an equivalent empty pipe (dP/dL), as shown in Equation (5). The latter is calculated using the friction factor correlation proposed by Fang et al. [61].
z = Δ P m / L d P / d L ,
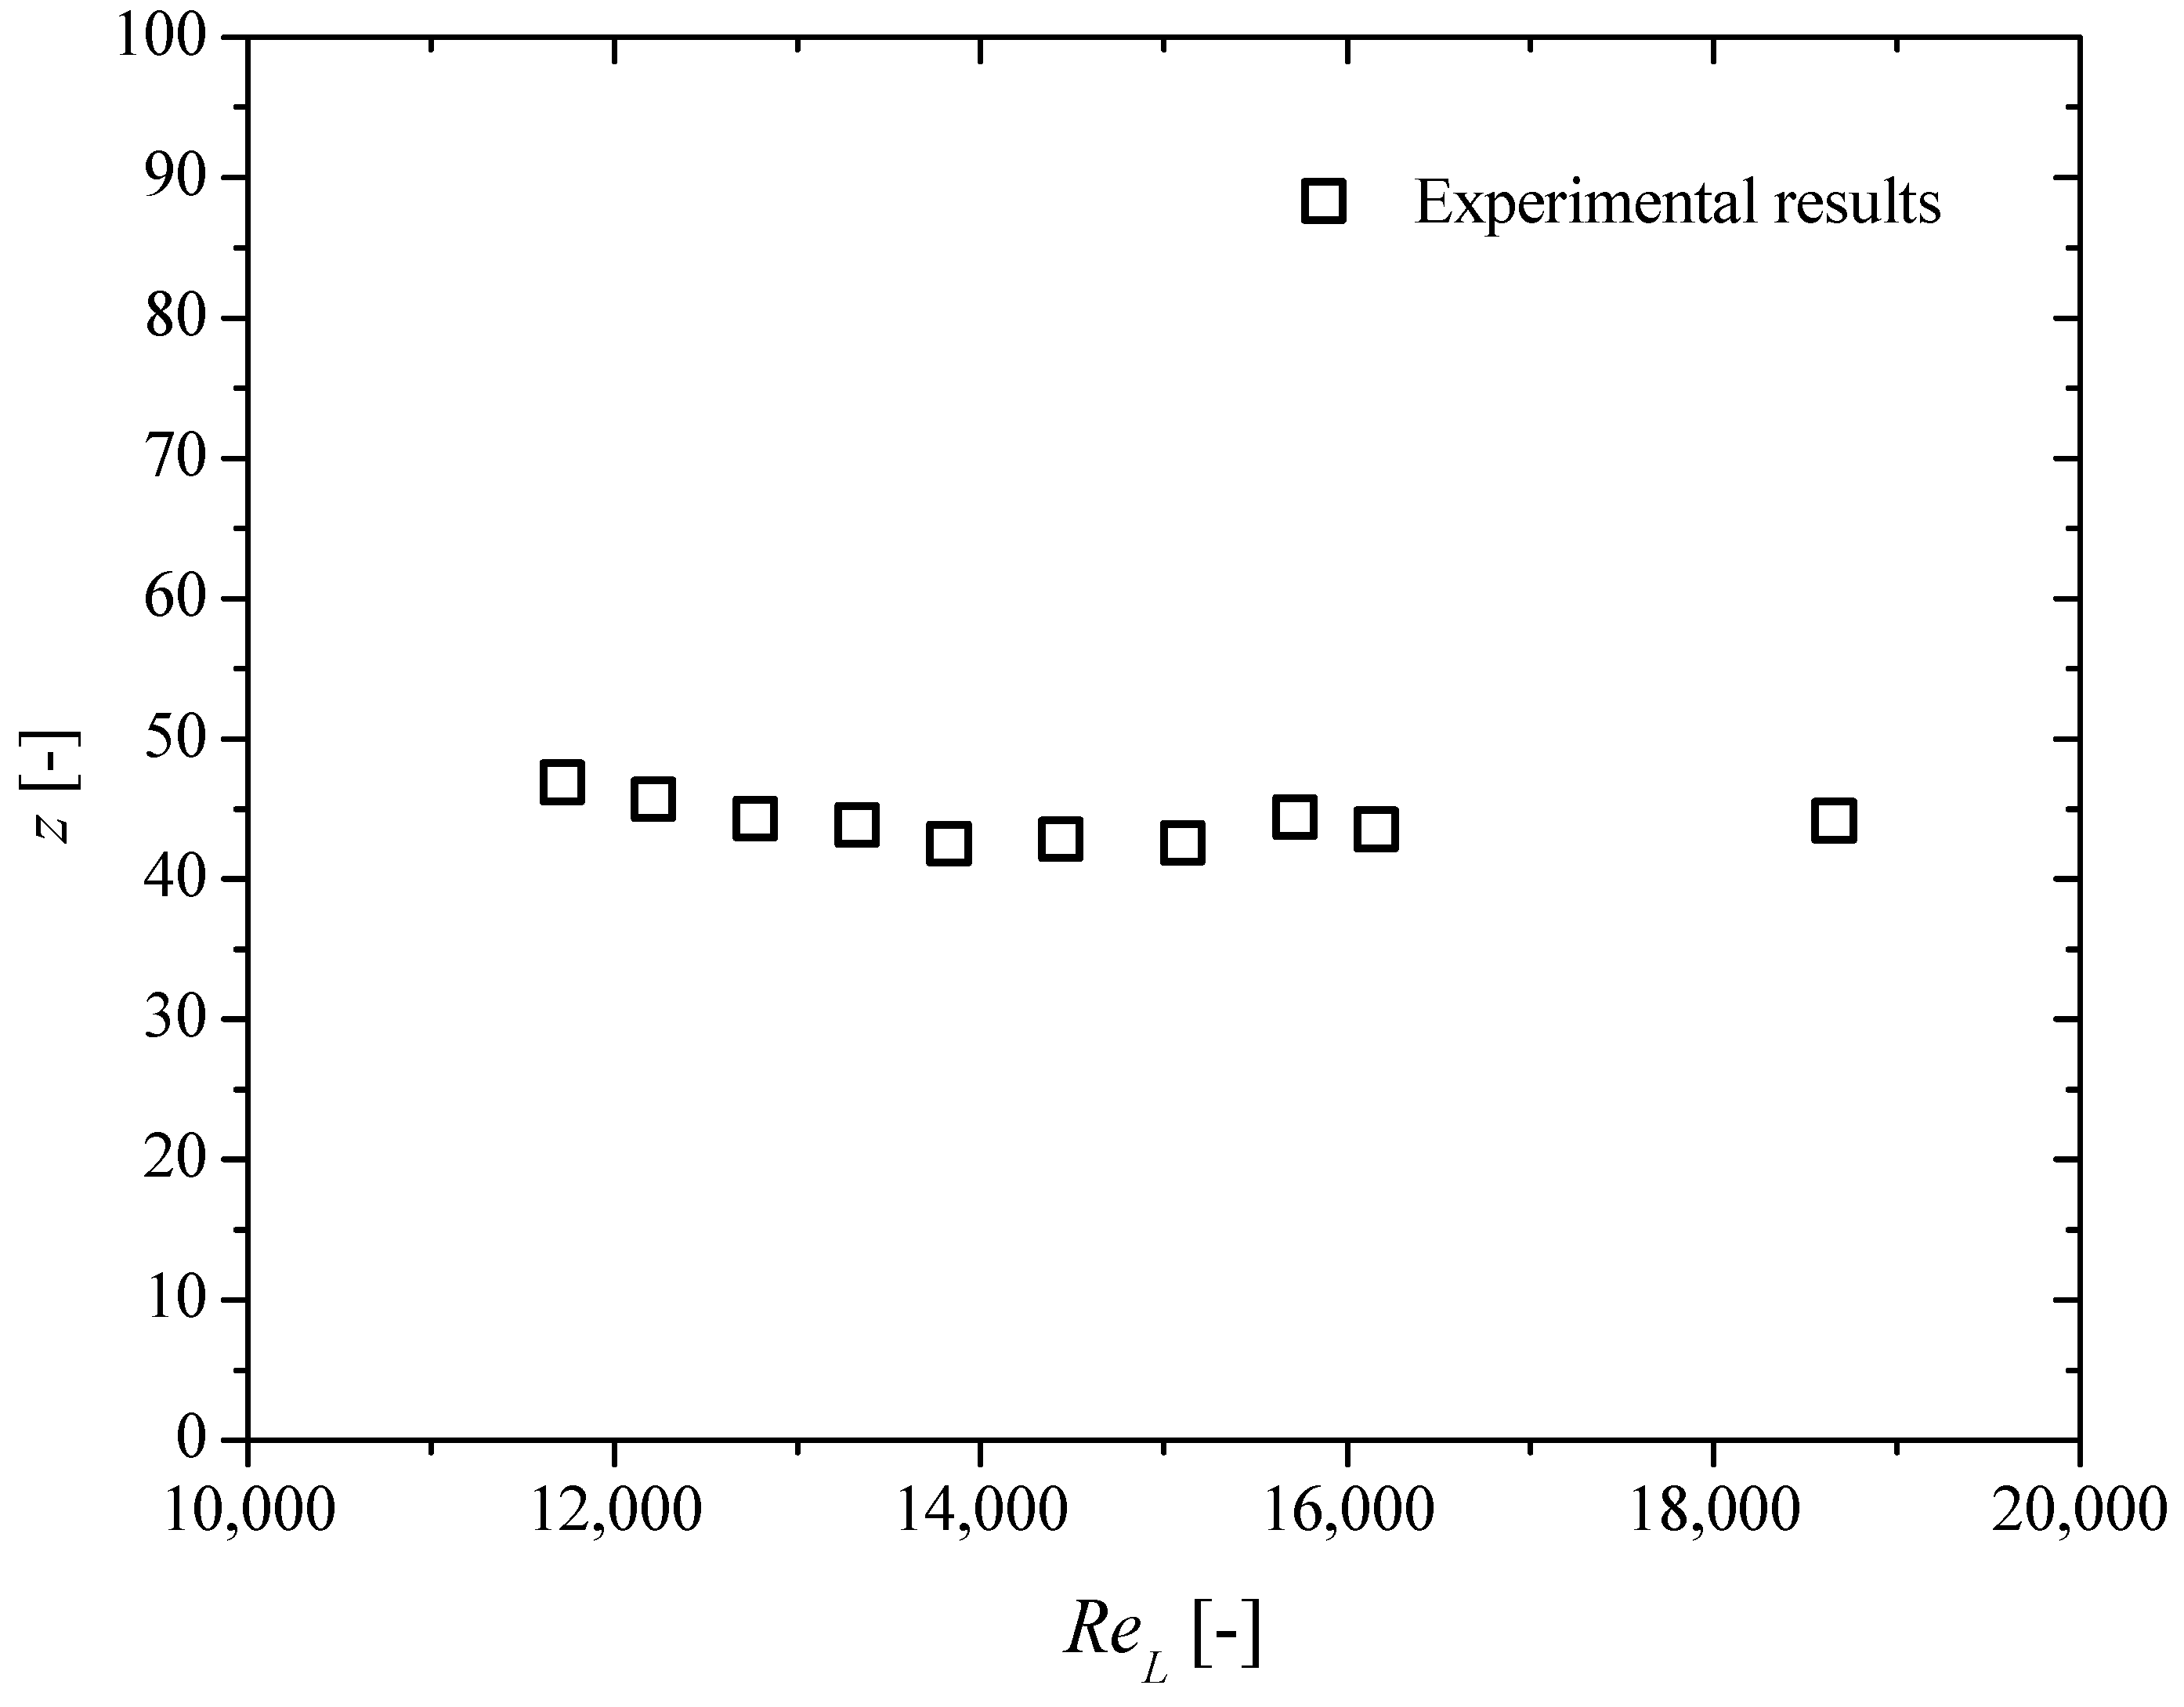
The z values are plotted as a function of the Reynolds number in Figure 5. Similarly to f, z approaches an asymptotic value in the turbulent flow regime (Equation (6)).
z = 44 ,

3.2. Gas–Liquid Two-Phase Flow Pressure Drop

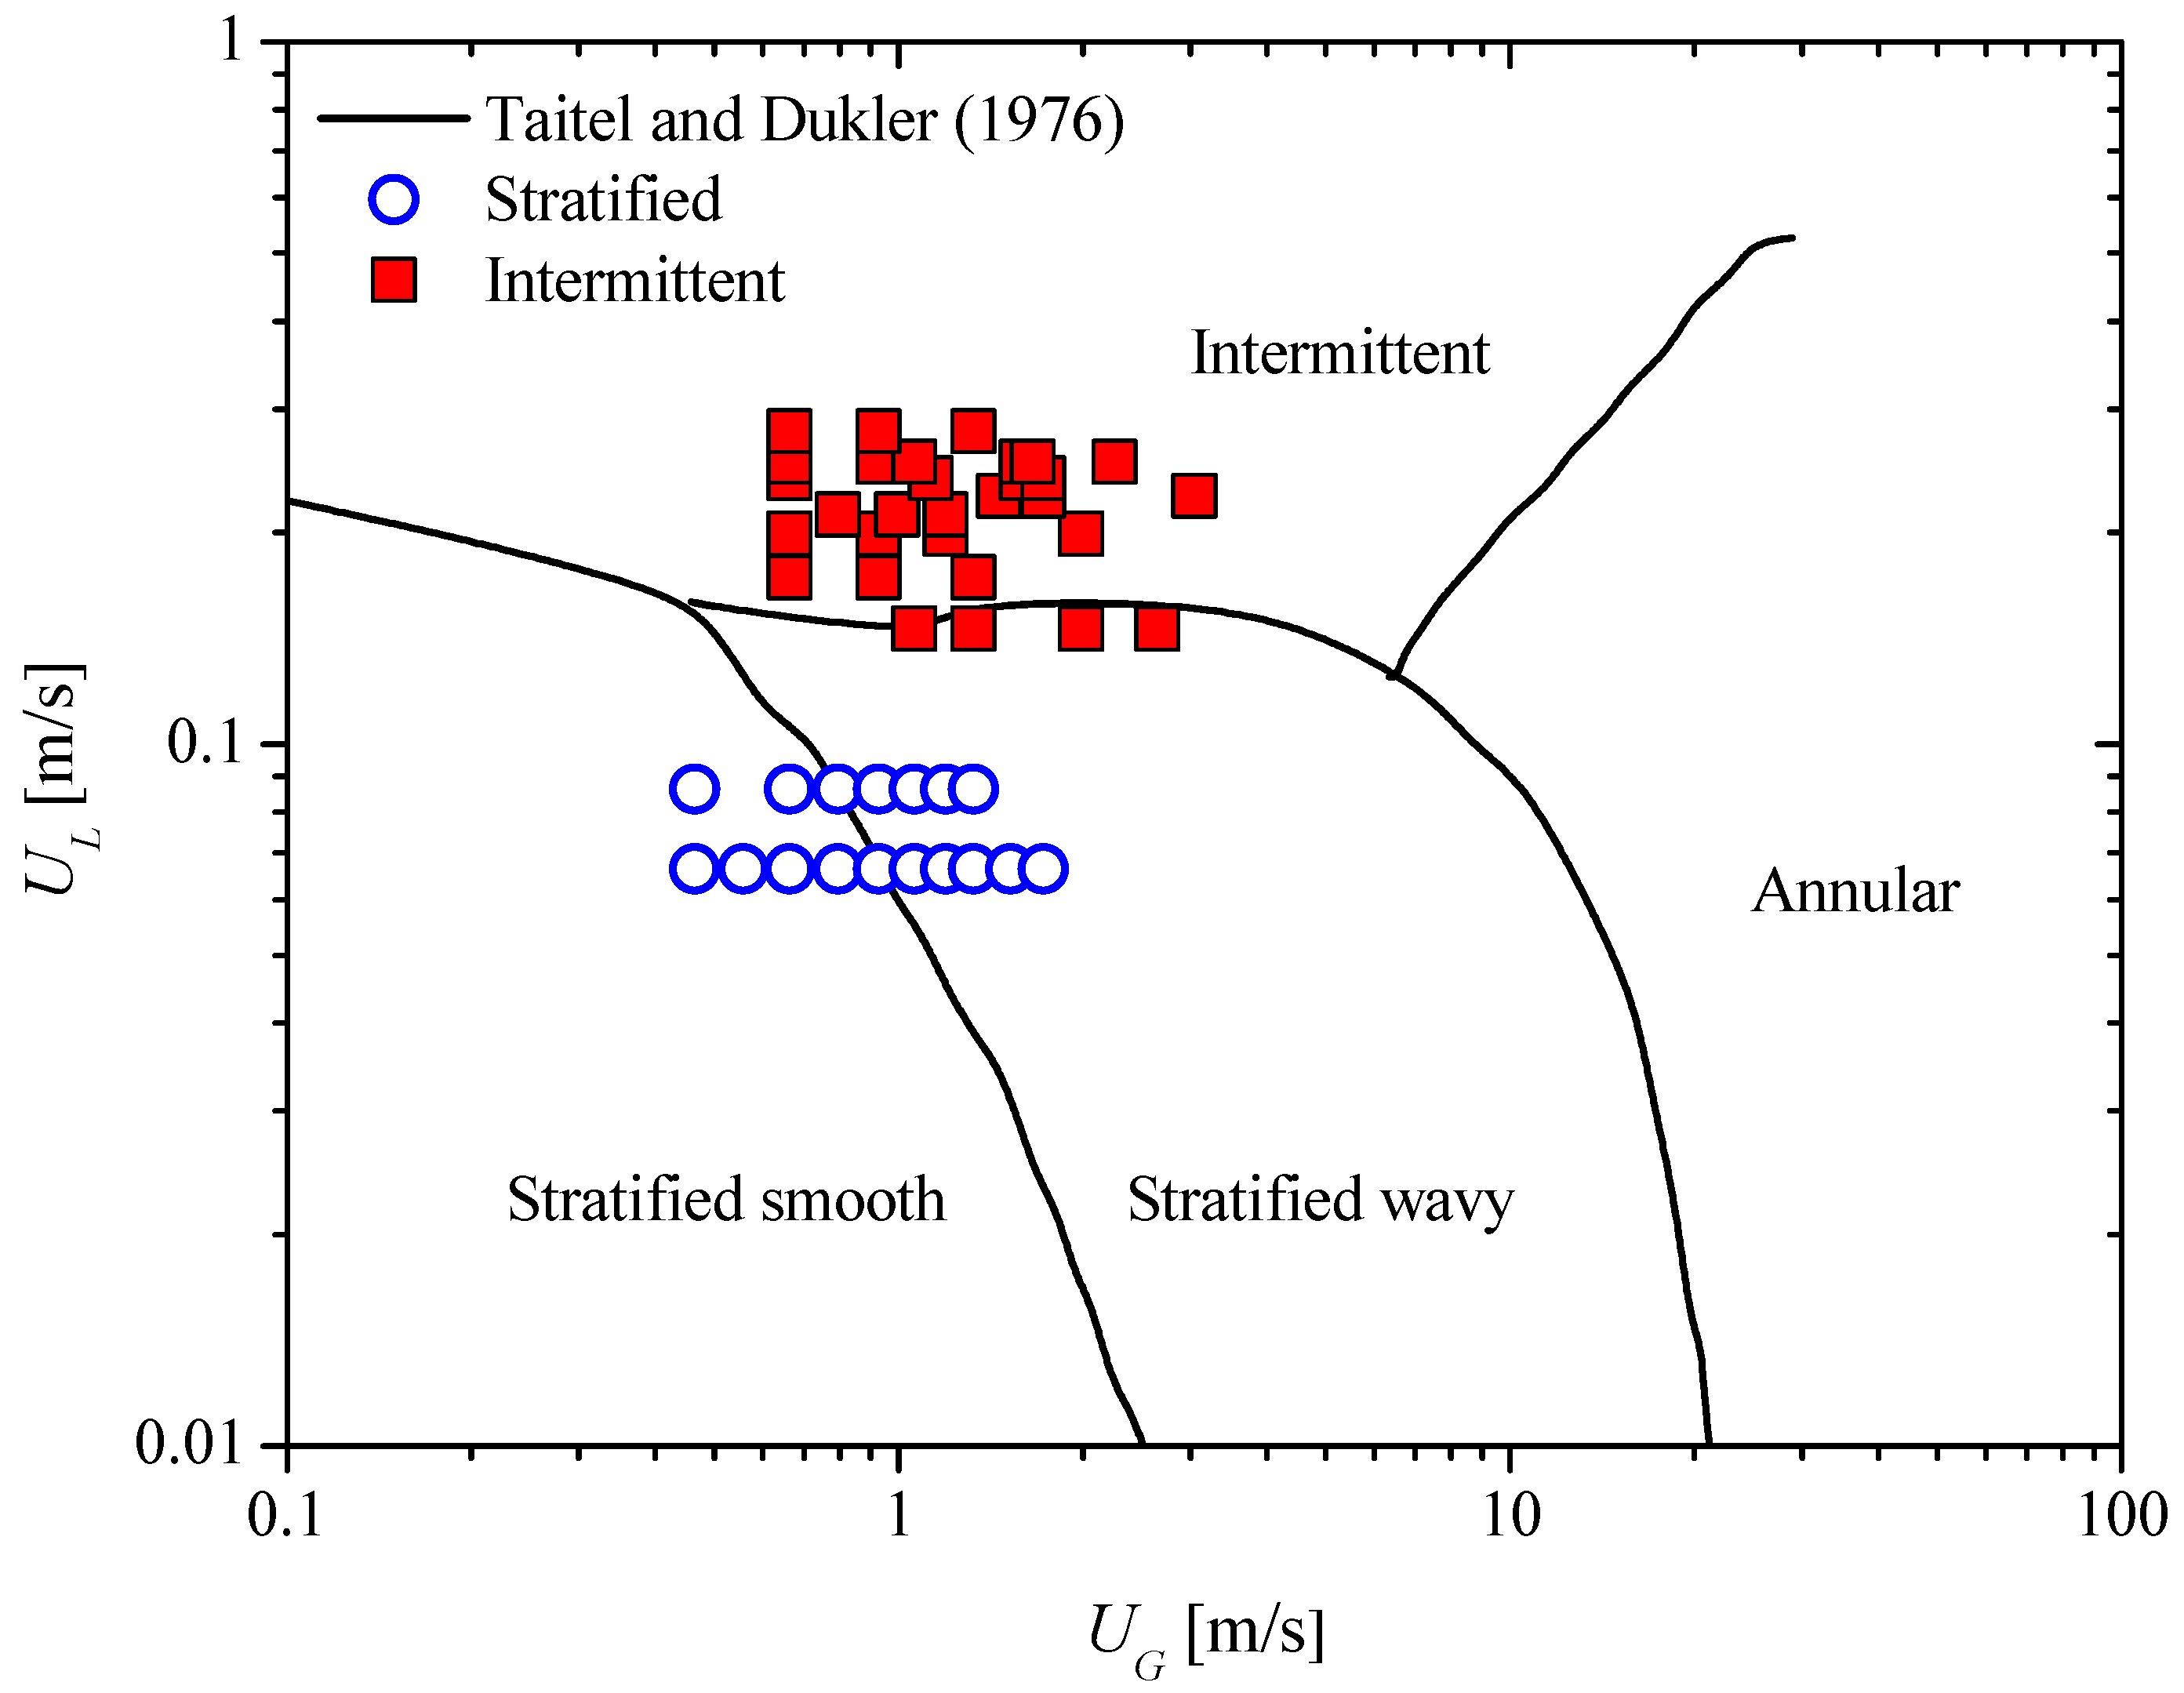
The structure of the present static mixer, which can be assimilated to a structured porous media [9], allows the flow of air–water mixtures without any blockage upstream. Under the experimental conditions investigated, two flow regimes were identified: stratified (smooth and wavy) and intermittent flows. The experimental conditions were plotted in Figure 6 in a flow chart, using the superficial velocities of gas (UG) and liquid (UL), as coordinates. The flow transitions calculated from the mechanistic model of Taitel and Dukler [65] for a 40 mm ID pipe are also depicted. As can be seen, some points of intermittent flow near the transition of stratified flow were predicted as stratified flow by the model of Taitel and Dukler [65].
The impact of gas superficial velocity on the measured pressure drop per unit length for various superficial liquid flow velocities is illustrated in Figure 7. Evidently, the two-phase pressure drop increases with the increment of both UG and UL. Meanwhile, the effect of UG is lower than that of UL, especially for intermittent flow. The fact that both phases impact the pressure drop explains the important values of pressure drop in a two-phase flow compared to a liquid single-phase flow. Figure 7 also notes that the pressure drops generated by intermittent flow are significantly greater than those measured with stratified flow.
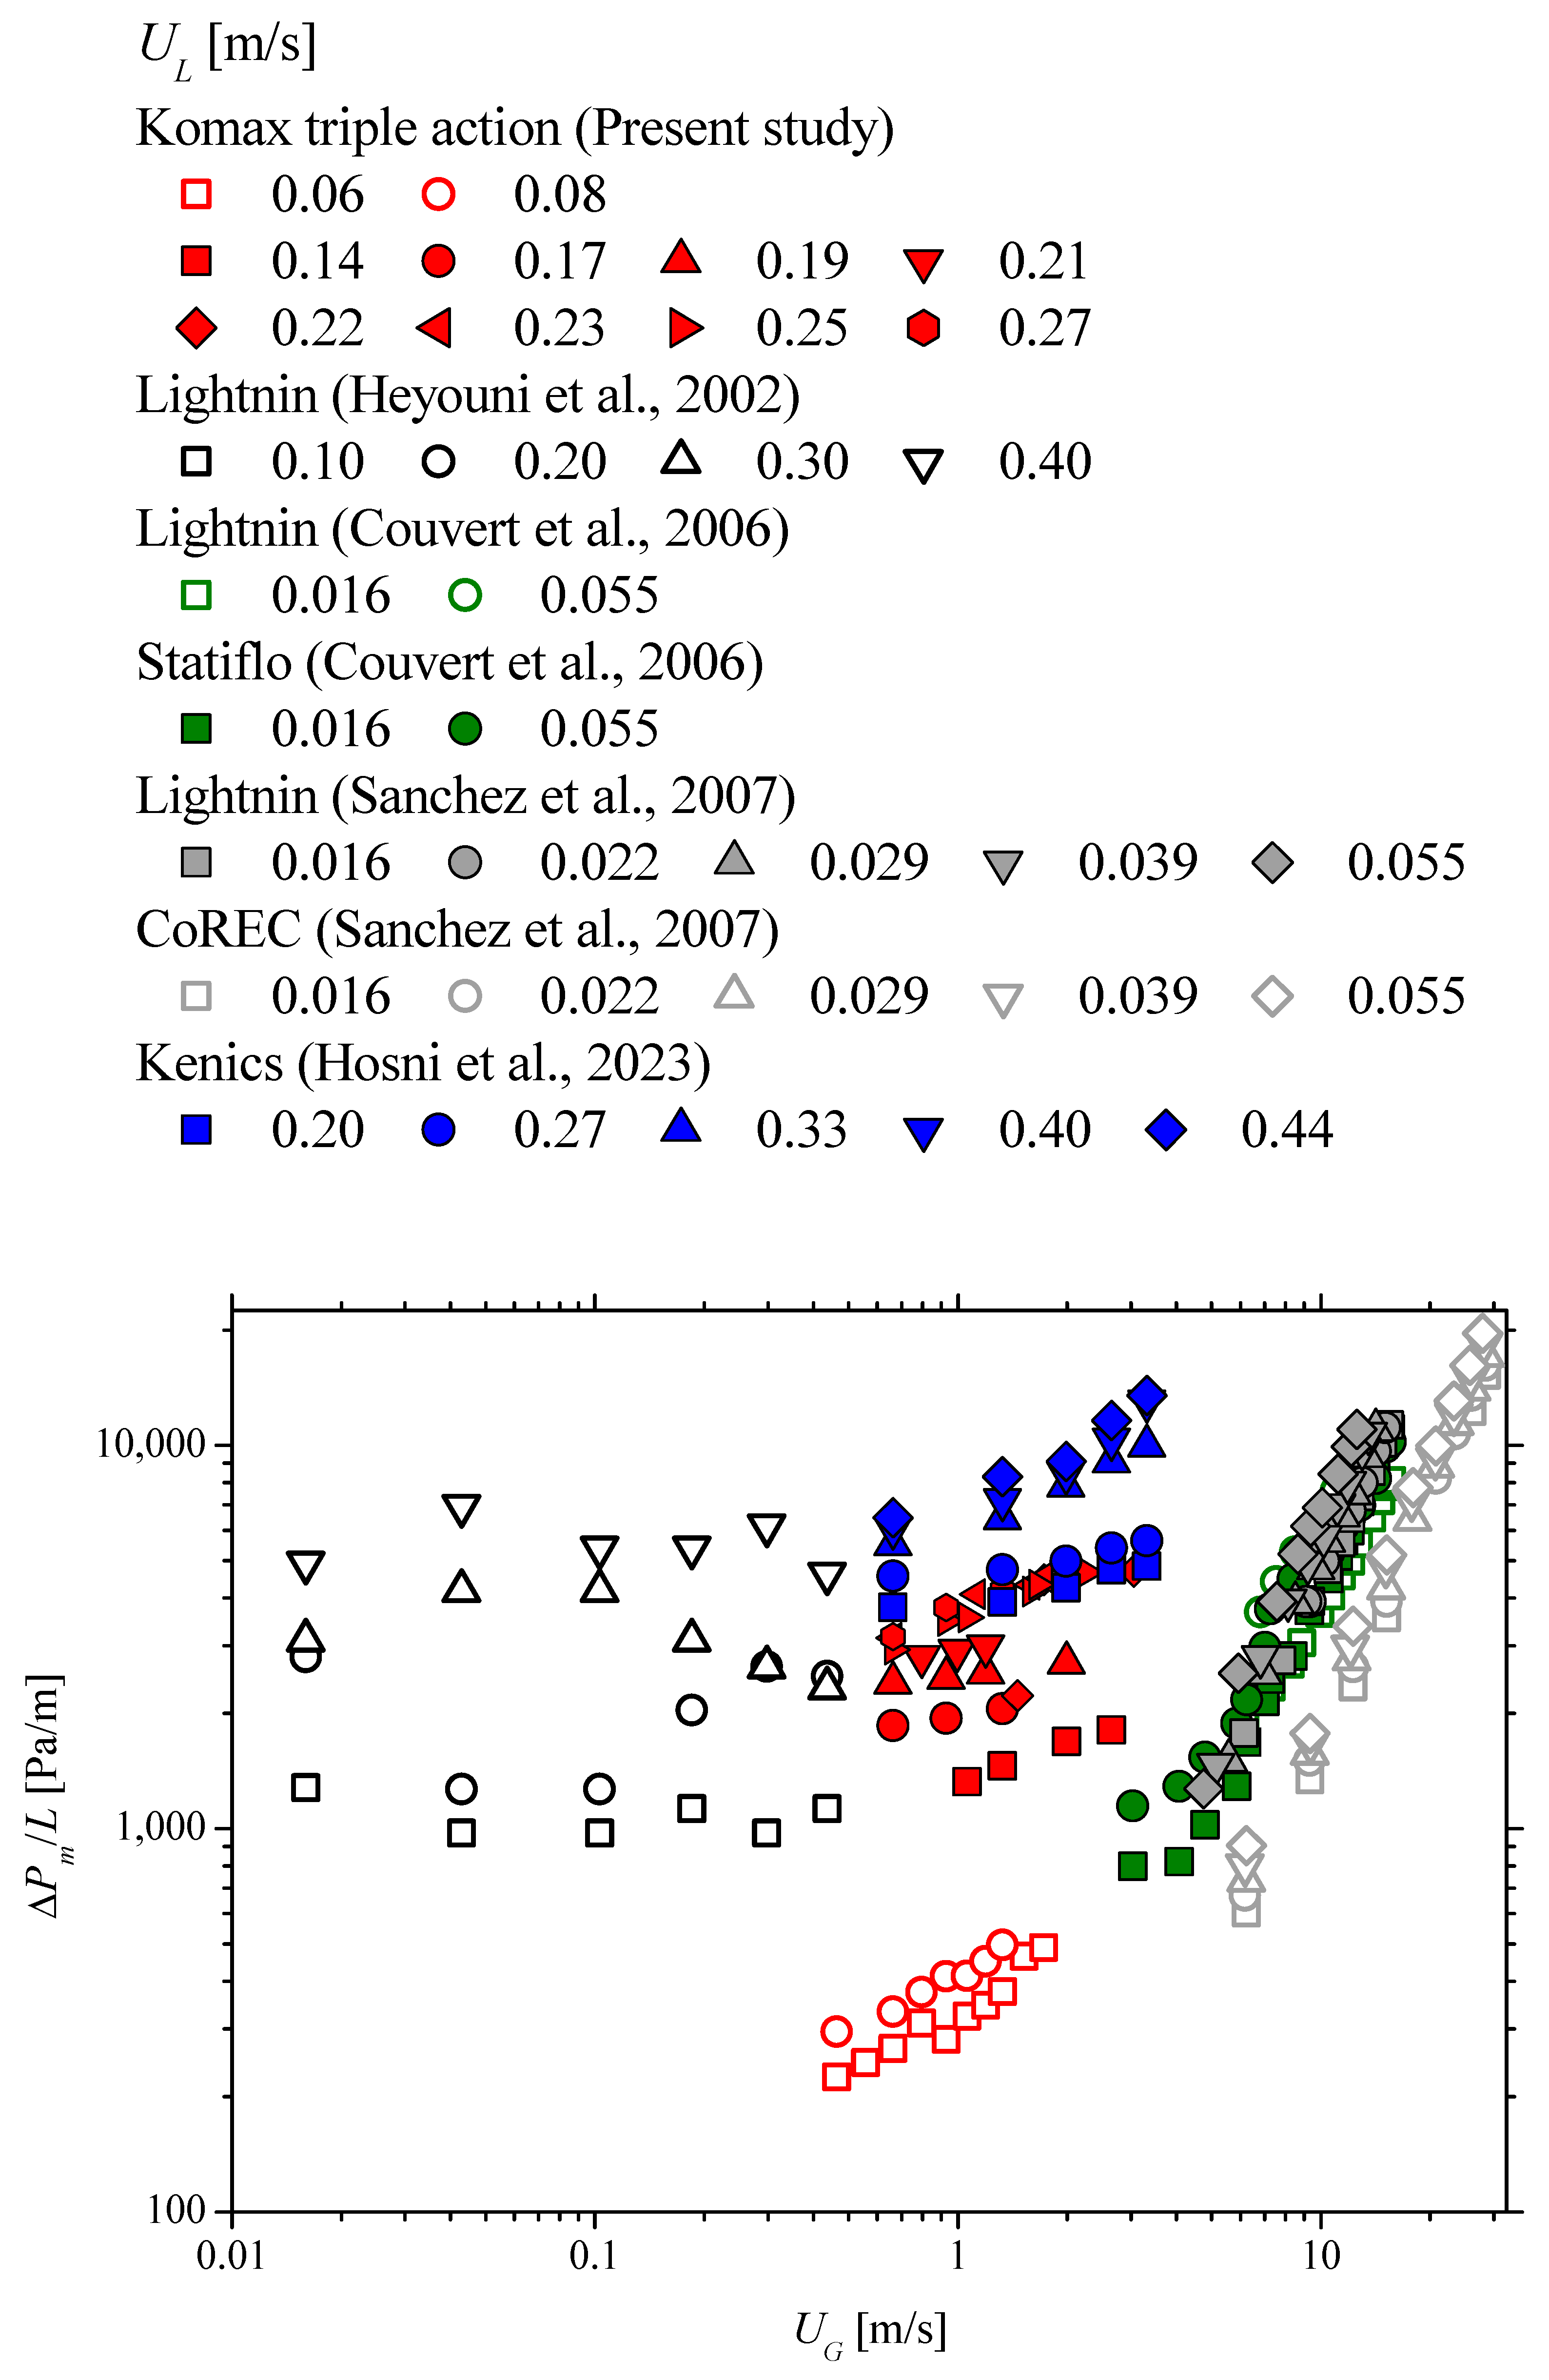
The two-phase flow pressure drop per unit length measurements obtained in this study, along with data from several authors for static mixers installed in horizontal pipes, are plotted in Figure 8 as a function of UG. To facilitate the comparison, the pressure drop is normalized per unit length of static mixer (L). The plot clearly shows that the Komax Triple Action mixer exhibits lower pressure drop gradients compared to other evaluated static mixers. Given the range of UG and UL tested, this reduced pressure drop is especially evident when compared with the Kenics mixer equipped with six elements, as reported by Hosni et al. [22]. As highlighted in the recent review by Yu et al. [12], Figure 8 supports the classification of static mixers in two-phase flow into categories, based on the dominant continuous phase: gas or liquid. In gas continuous mixers, such as Lightnin, Statiflo, and CoRec (studied by Couvert et al. [49] and Sanchez et al. [50]), the pressure drop is more sensitive to UG than to UL. Conversely, the Lightnin mixer used by Heyouni et al. [43] behaves as a liquid continuous phase mixer. The Kenics and Komax Triple Action mixers exhibit intermediate behavior. However, under the present experimental conditions, the Komax triple action demonstrates a greater sensitivity to UG than to UL in a stratified flow. Interestingly, in the presence of an intermittent flow, the studied mixer becomes more responsive to variations in UL, indicating a shift in phase interaction dynamics.
The two-phase flow pressure drop is commonly modeled using the separated approach when the two-phase flow is expressed with the two-phase multiplier ( Φ L 2 ), which is the ratio between the two-phase pressure drop and the calculated liquid single-phase flow pressure drop (ΔPL):
Φ L 2 = Δ P m / L d P d L L ,
This approach is notably used for straight pipes as well as the pipe fitted with singularities [66], including static mixers [22,47]. Following the pioneering work of Lockhart and Martinelli [67], the two-phase flow multiplier is commonly correlated as a function of the Lockhart–Martinelli parameter (X), given by the following:
X = d P d L L d P d L G ,
The pressure drops generated by liquid and gas single-phase flows are calculated using the following equation:
d P d L i = f i ρ i U i 2 2 D ,
where the subscript i stands for liquid phase (L) or gas phase (G).
The correlation of Fang et al. [61] was used for calculating the friction factor for turbulent flow. Several authors correlated the two-phase multiplier with the Lockhart–Martinelli parameter, using the following equation proposed by Chisholm [68]:
Φ L 2 = 1 + C X + 1 X 2 ,
where C is an empirical parameter called Chisholm parameter.
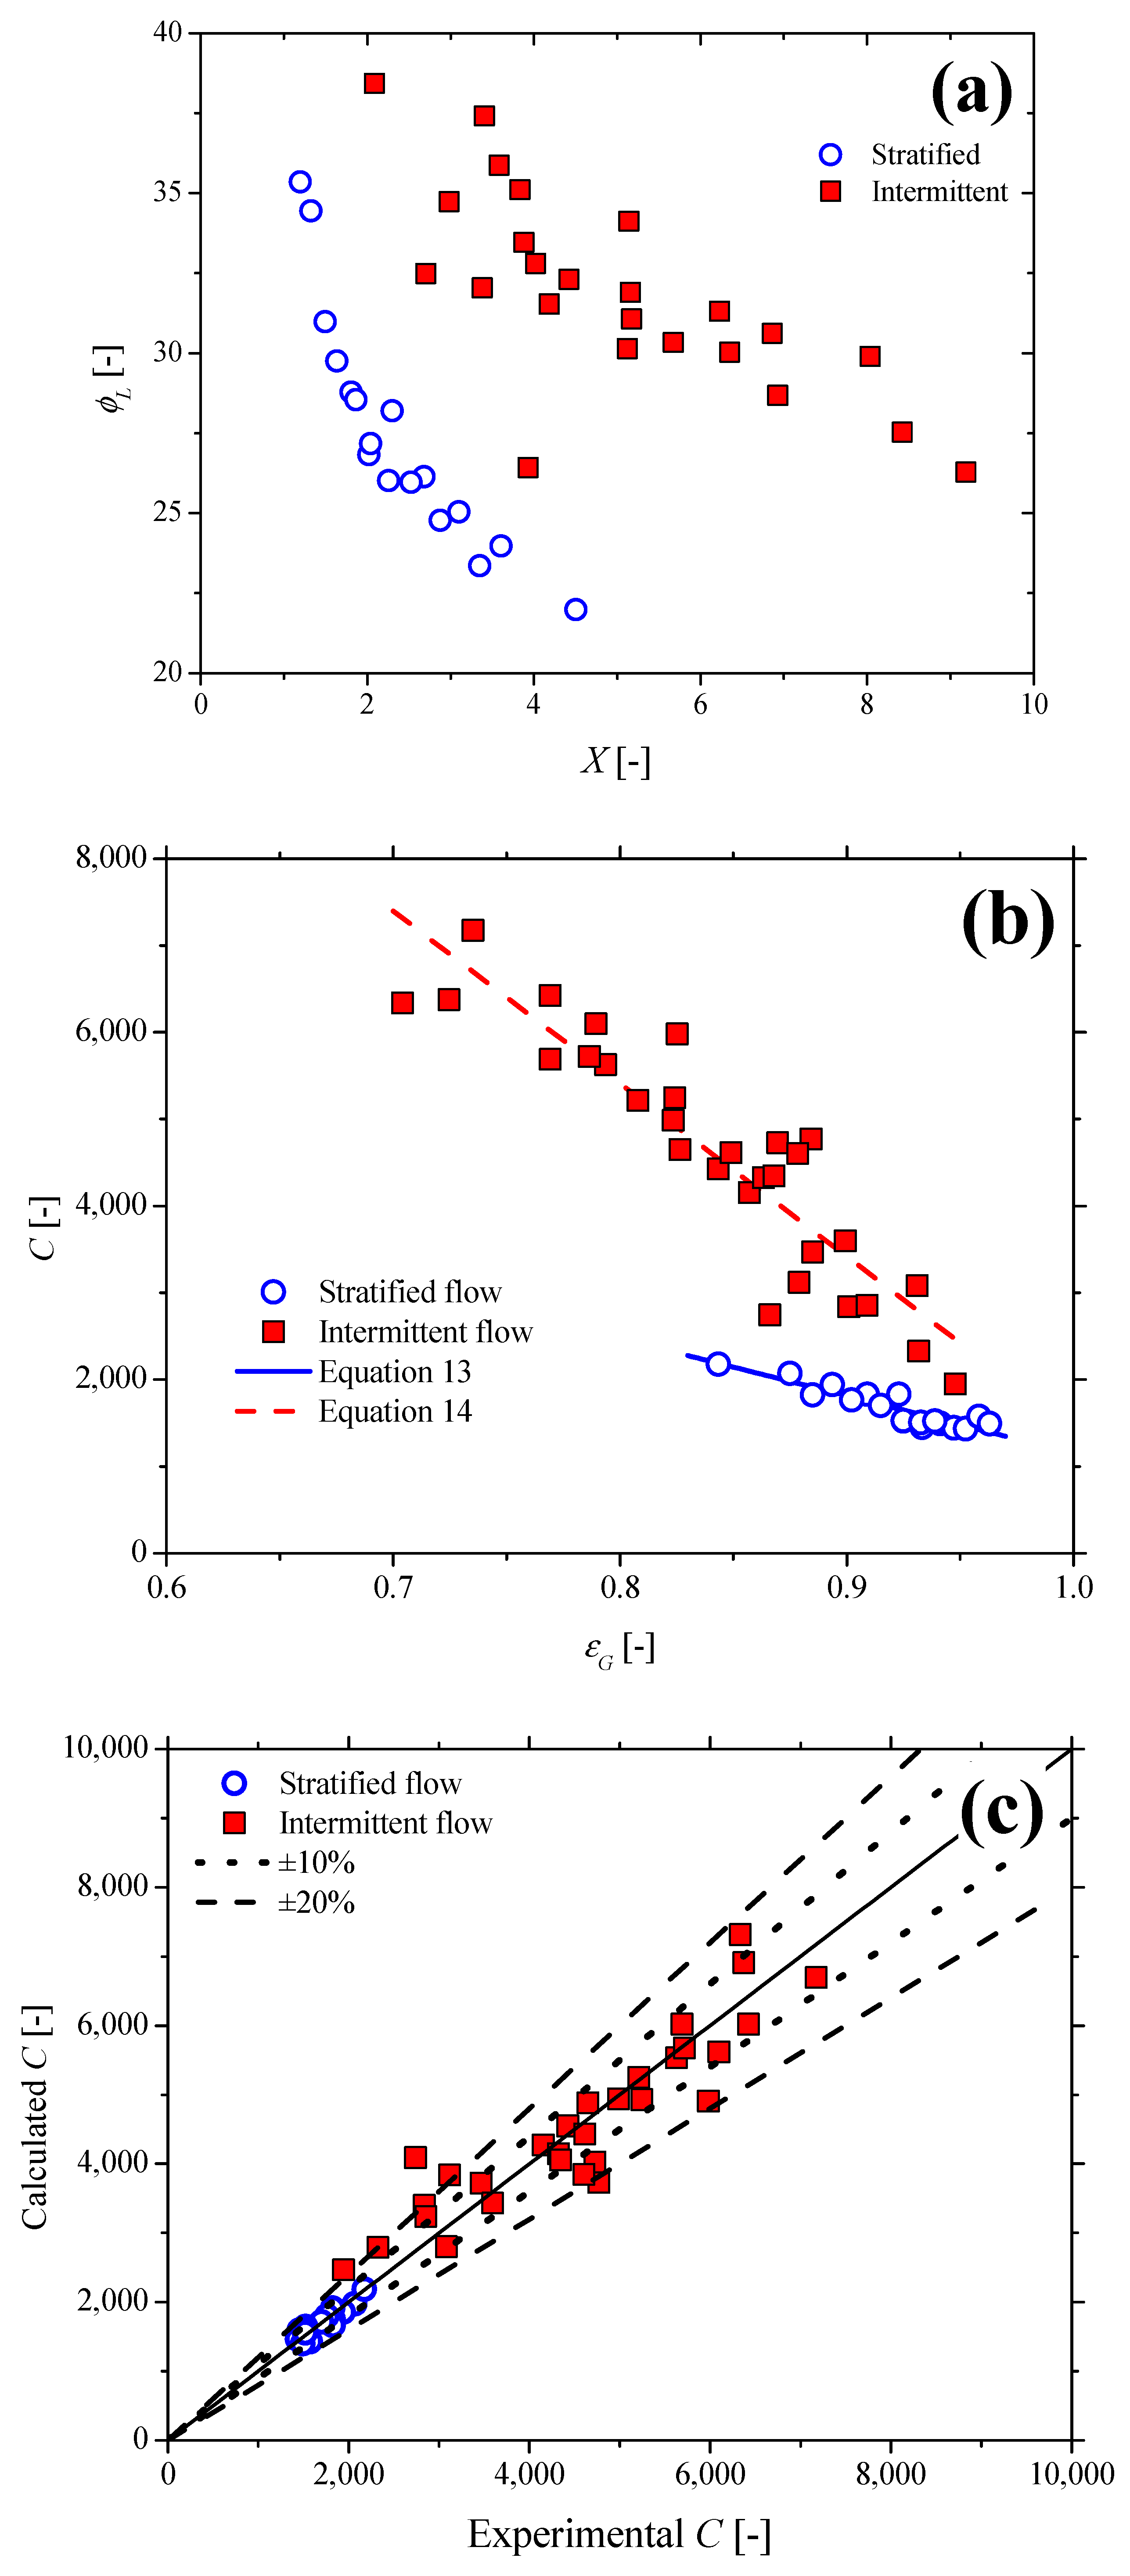
In Figure 9a, we plotted the obtained two-phase flow multiplier as a function of the Lockhart–Martinelli parameter. One can see that the points for each flow regime are dispersed, which complicates the associate one value of C for all data. This observation is more apparent with the intermittent flow data. This result can be explained by the complex interaction of the two phases during their passage through the static mixer, as we will discuss in Section 3.4. As analyzed by Marrocos et al. [55], the pressure drop is notably impacted by the gas void fraction (εG). According to Heyouni et al. [43], the liquid holdup is equal to the homogenous gas void fraction (or input gas fraction) (λG) when the flow passes through the static mixer. The input gas fraction is calculated as follows:
λ G = U G V M ,
where VM is the mixture velocity given as follows:
V M = U L + U G ,
In Figure 9b, we plot the calculated C as a function of the gas void fraction. One can see that for each flow regime investigated, a linear relation between the two parameters is reported. The relationships between C and εG for stratified and intermittent flows are given in Equations (14) and (15), respectively.
C = 7757.1 6606.5 ε G ,
C = 21327.4 19902 ε G ,
The cross-plot of the experimental and calculated C values (Figure 9c) shows that the great majority of the results of stratified and intermittent flows are predicted in the range of ±10% and ±20%, respectively. These results can be considered to be highly satisfactory for a two-phase flow pressure drop [69].
By replacing Equations (14) and (15) in Equation (11), one obtains the following correlations of the two-phase multiplier for stratified and intermittent flows:
Φ L 2 = 1 + 7757.1 6606.5 ε G X + 1 X 2 ,
Φ L 2 = 1 + 21327.4 19902 ε G X + 1 X 2 ,
Equations (15) and (16) were developed for the range 0.07 m/s ≤ UL ≤ 0.28 m/s and 0.46 m/s ≤ UG ≤ 3.05 m/s. It would be of interest to evaluate their performance under another range’s operating conditions.

3.3. Power Dissipation

For multiphase flow applications, the energetic performance of gas–static mixers and gas–liquid reactors are commonly evaluated in terms of the power dissipated per unit mass of liquid (P/M), expressed in W/kg [43]. The mean power dissipation is determined from the measured flow rate and the pressure drop induced by the static mixer, according to the following expression:
P M = V Δ P m ρ α S M L
where VSM is the volume of the pipe cylinder in which the static mixer is placed.
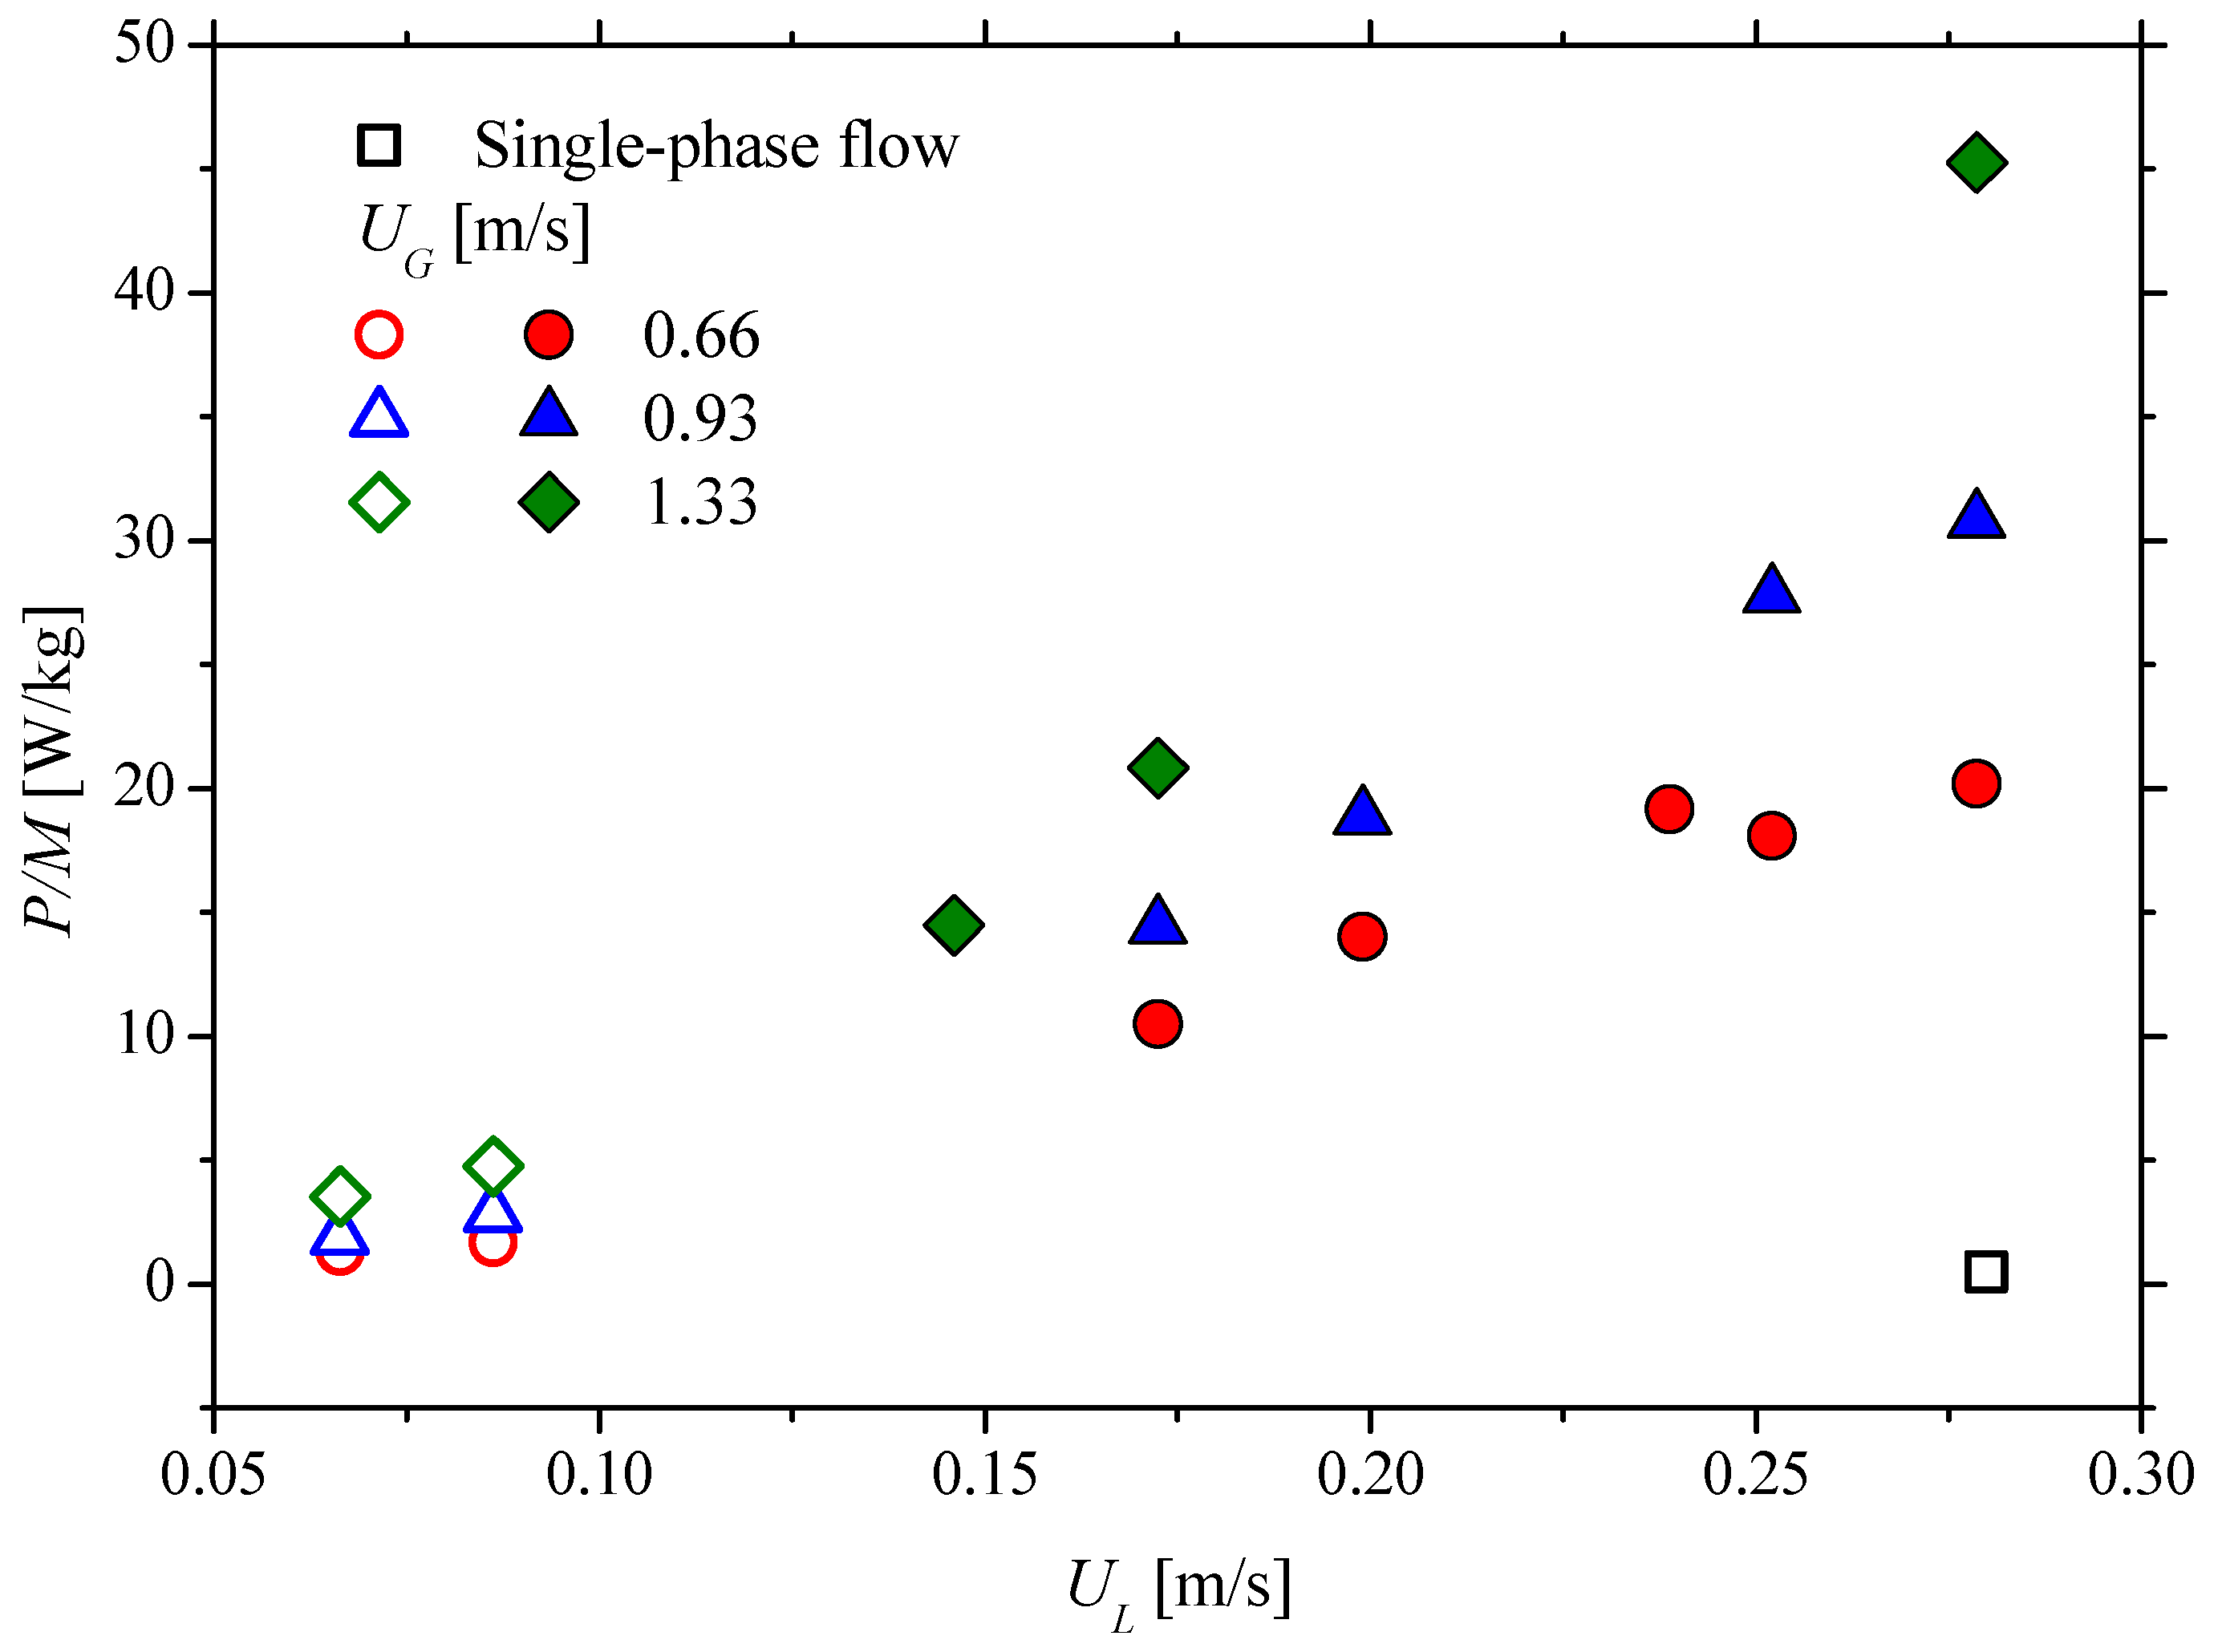
The calculated power dissipation values were plotted in Figure 10 as a function of UL for different UG. Comparison with single-phase flow conditions indicates that the introduction of a gas phase is accompanied by a substantial increase in power dissipation. This increase is more pronounced under intermittent flow regimes than under stratified flow. Furthermore, P/M increases with rising liquid and gas flow rates. Under the experimental conditions investigated in the present study, the power dissipation ranged from 0.81 to 104.00 W kg−1, which is considerably higher than the values reported in the literature for Lightnin and KSM mixers [12].

3.4. Characterization of Intermittent Flow Through Komax Triple Action

The presence of the static mixer within the horizontal pipe induced complex hydrodynamic phenomena. The Komax triple action’s geometry caused a partial obstruction of the pipe cross-section, which had the direct effect of increasing the fluids’ velocities. When intermittent flow was present upstream of the test section, it was observed to lose its typical structure when crossing the static mixer.
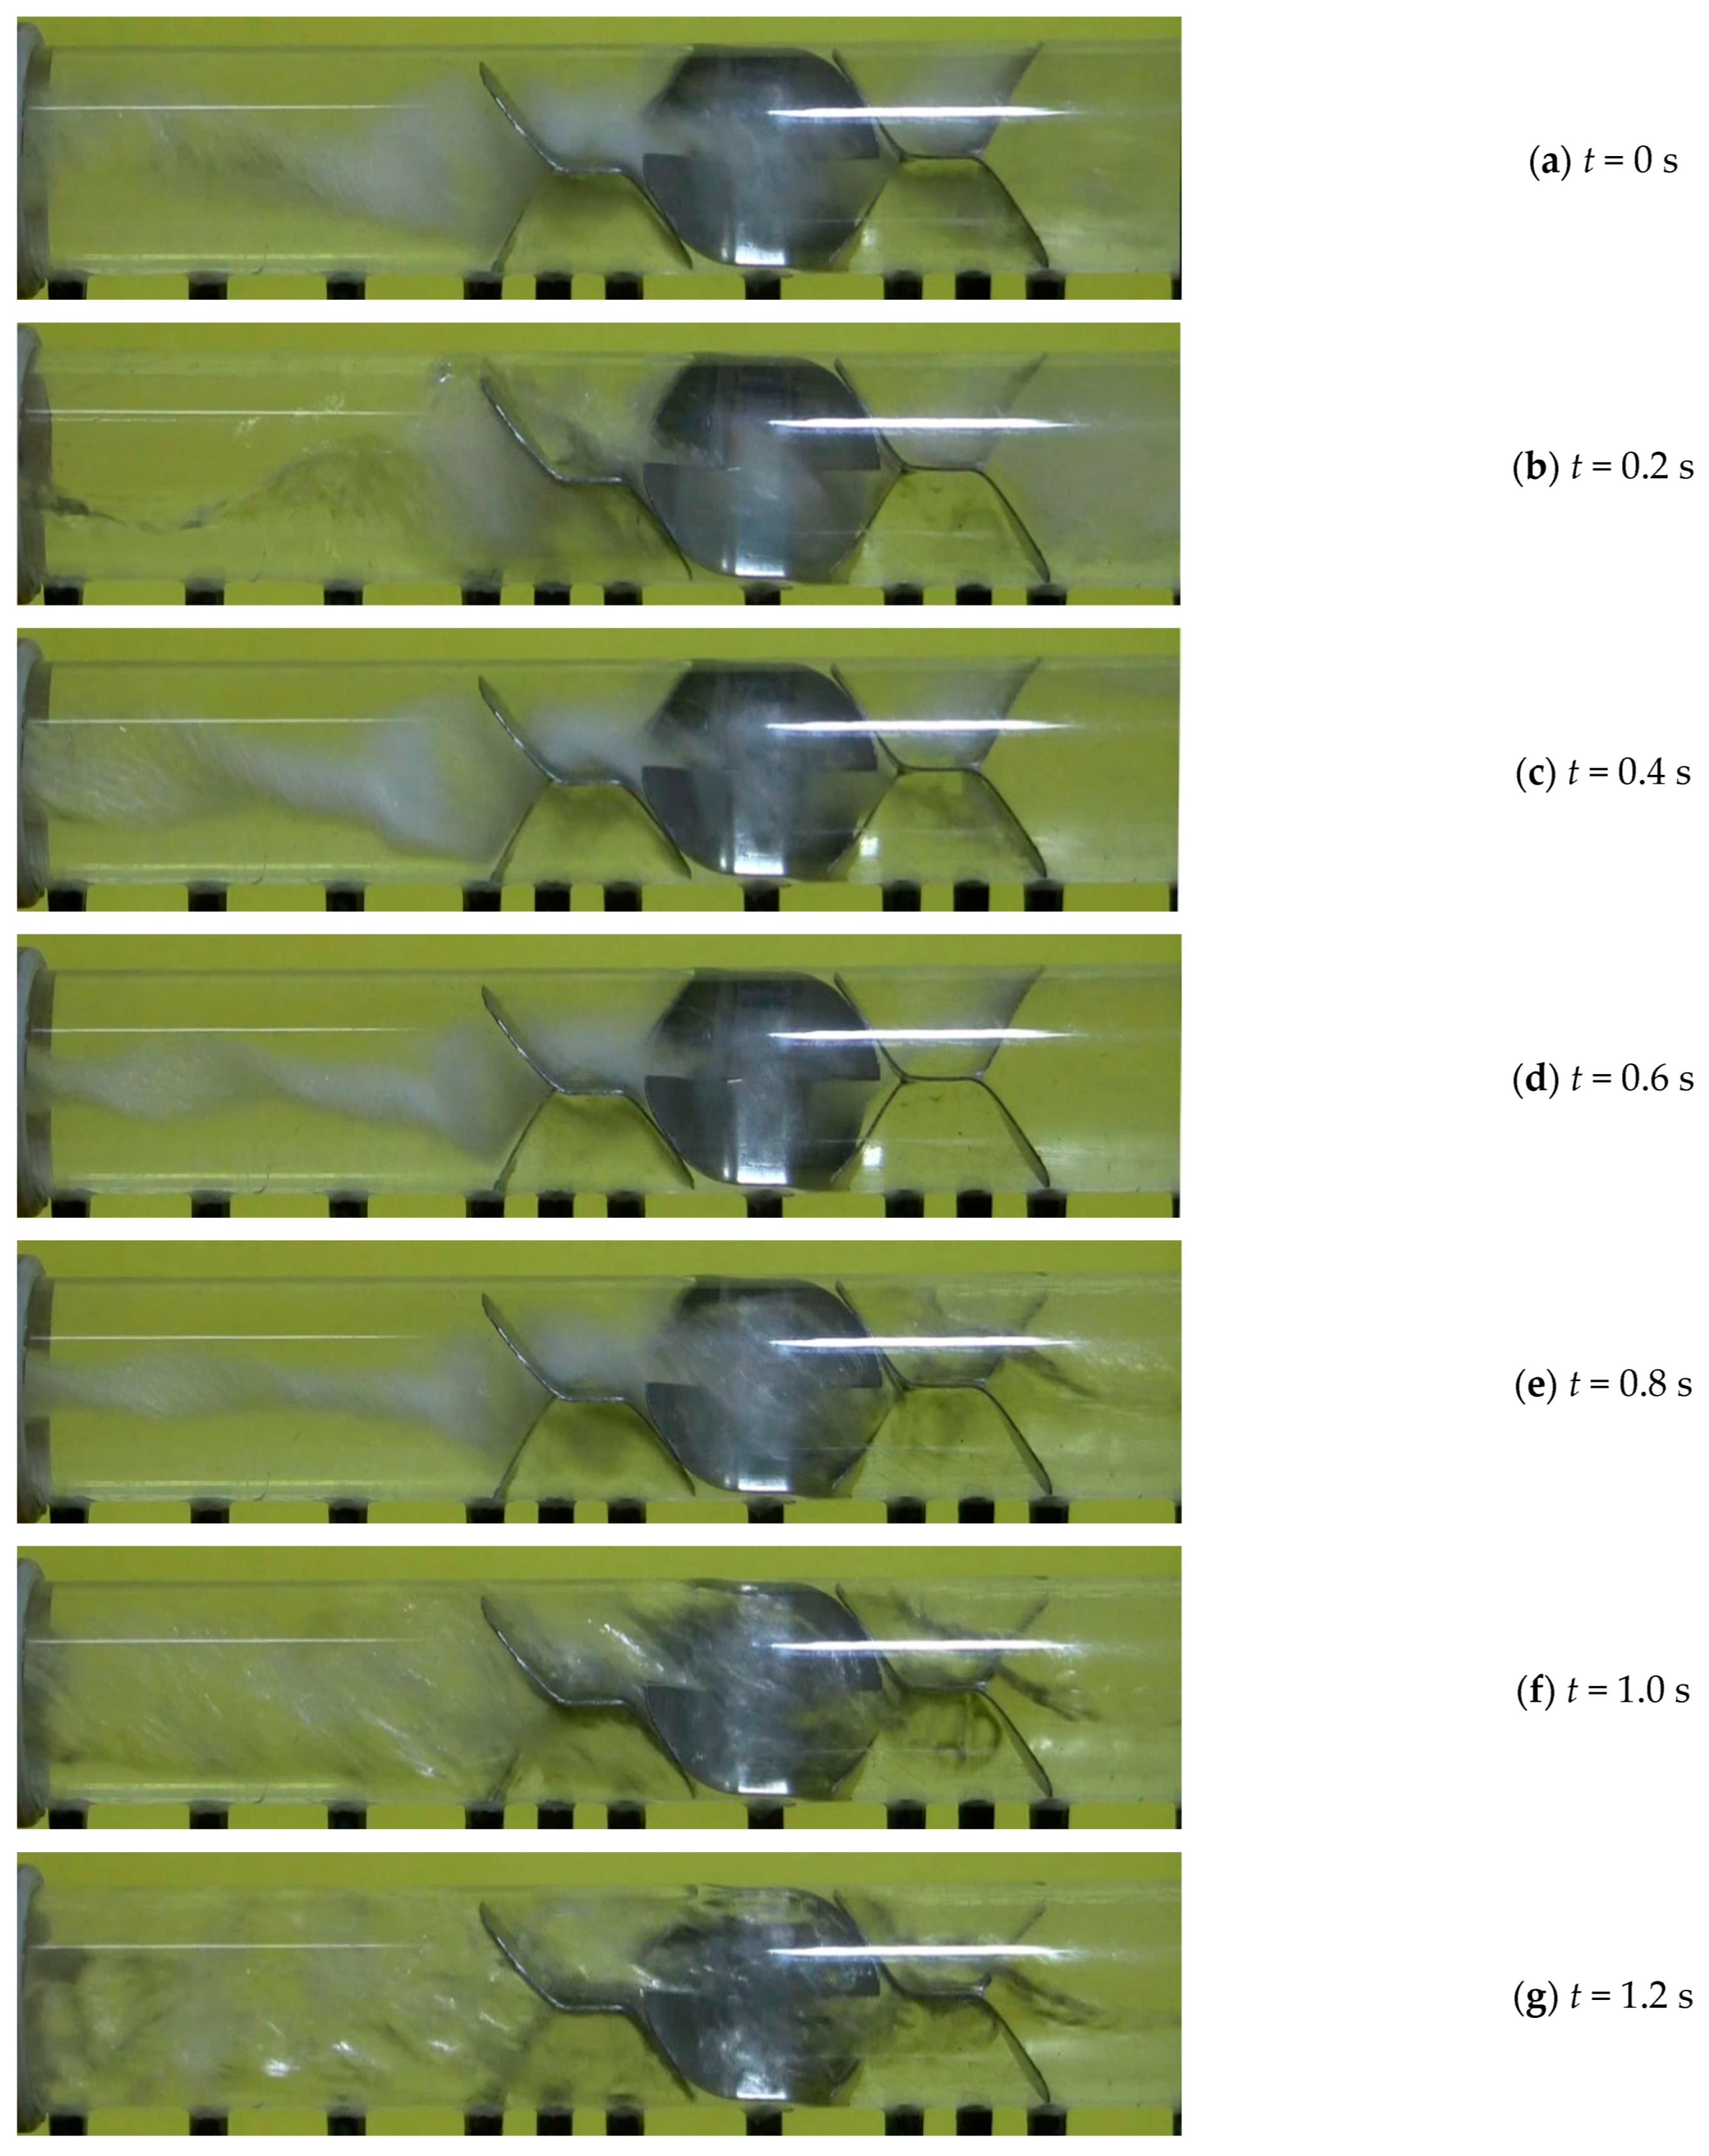
Figure 11 shows an image sequence of a slug unit composed of an elongated bubble flowing on a liquid film and a liquid slug crossing the studied static mixer. One can see clearly that the static mixer’s design generates a centrifugal force, resulting in a swirling flow, attributed to the splitting and rotation across the static mixer. The swirling flow subsequentially increases the mixing between the phases. It adds normal and tangential stresses to the pipe’s wall, and subsequentially increases the pressure drop, as reported in Figure 6. A deep analysis of the images captured shows that the swirl flow generated by the passage of elongated bubble (Figure 11a–e) has a different structure than that formed from a liquid slug (Figure 11f,g). Indeed, the second swirl structure is a continuous liquid flow with dispersed gas bubbles, while the static mixer geometry induces the formation of a highly aerated interface that moves in a swirling manner. Figure 11 also shows that the swirling flow starts to appear before the flow crosses the mixer. This observation is more visible when an elongated bubble is crossing the mixer, as captured between 0 s and 0.8 s. Finally, downstream of the mixer, the swirling motion gradually dissipates a few pipe diameters after leaving the static mixer.
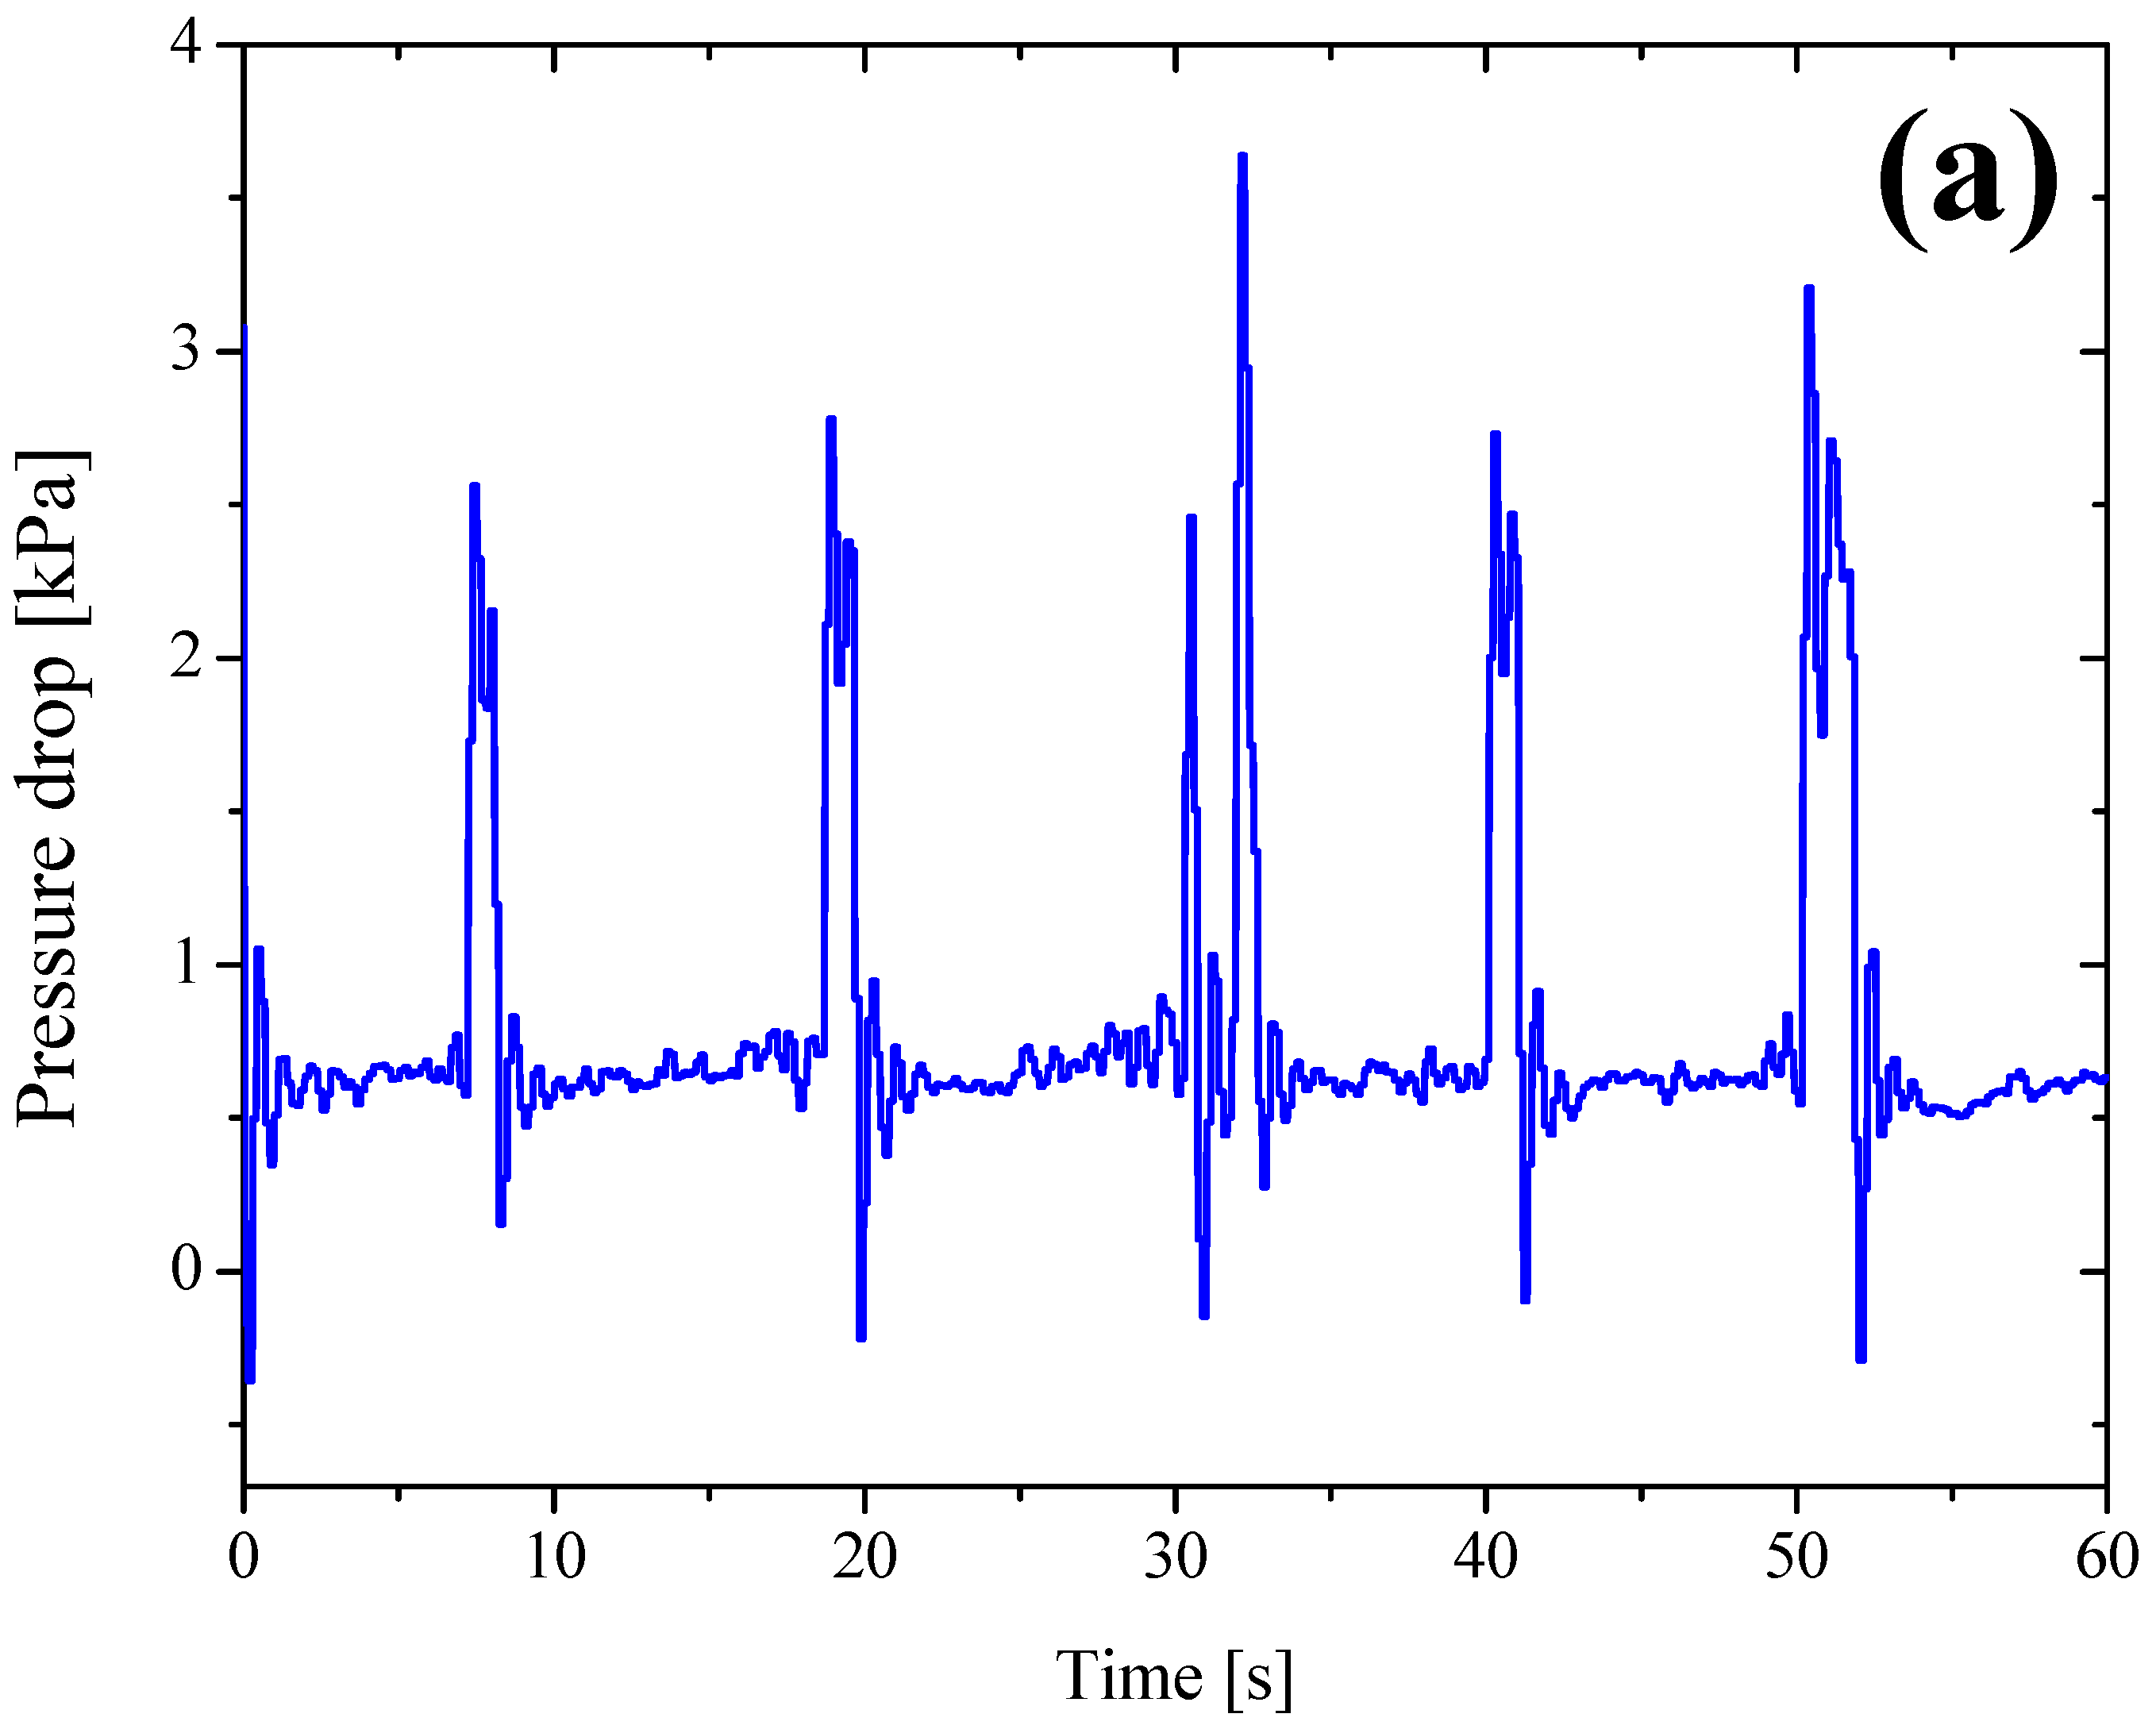
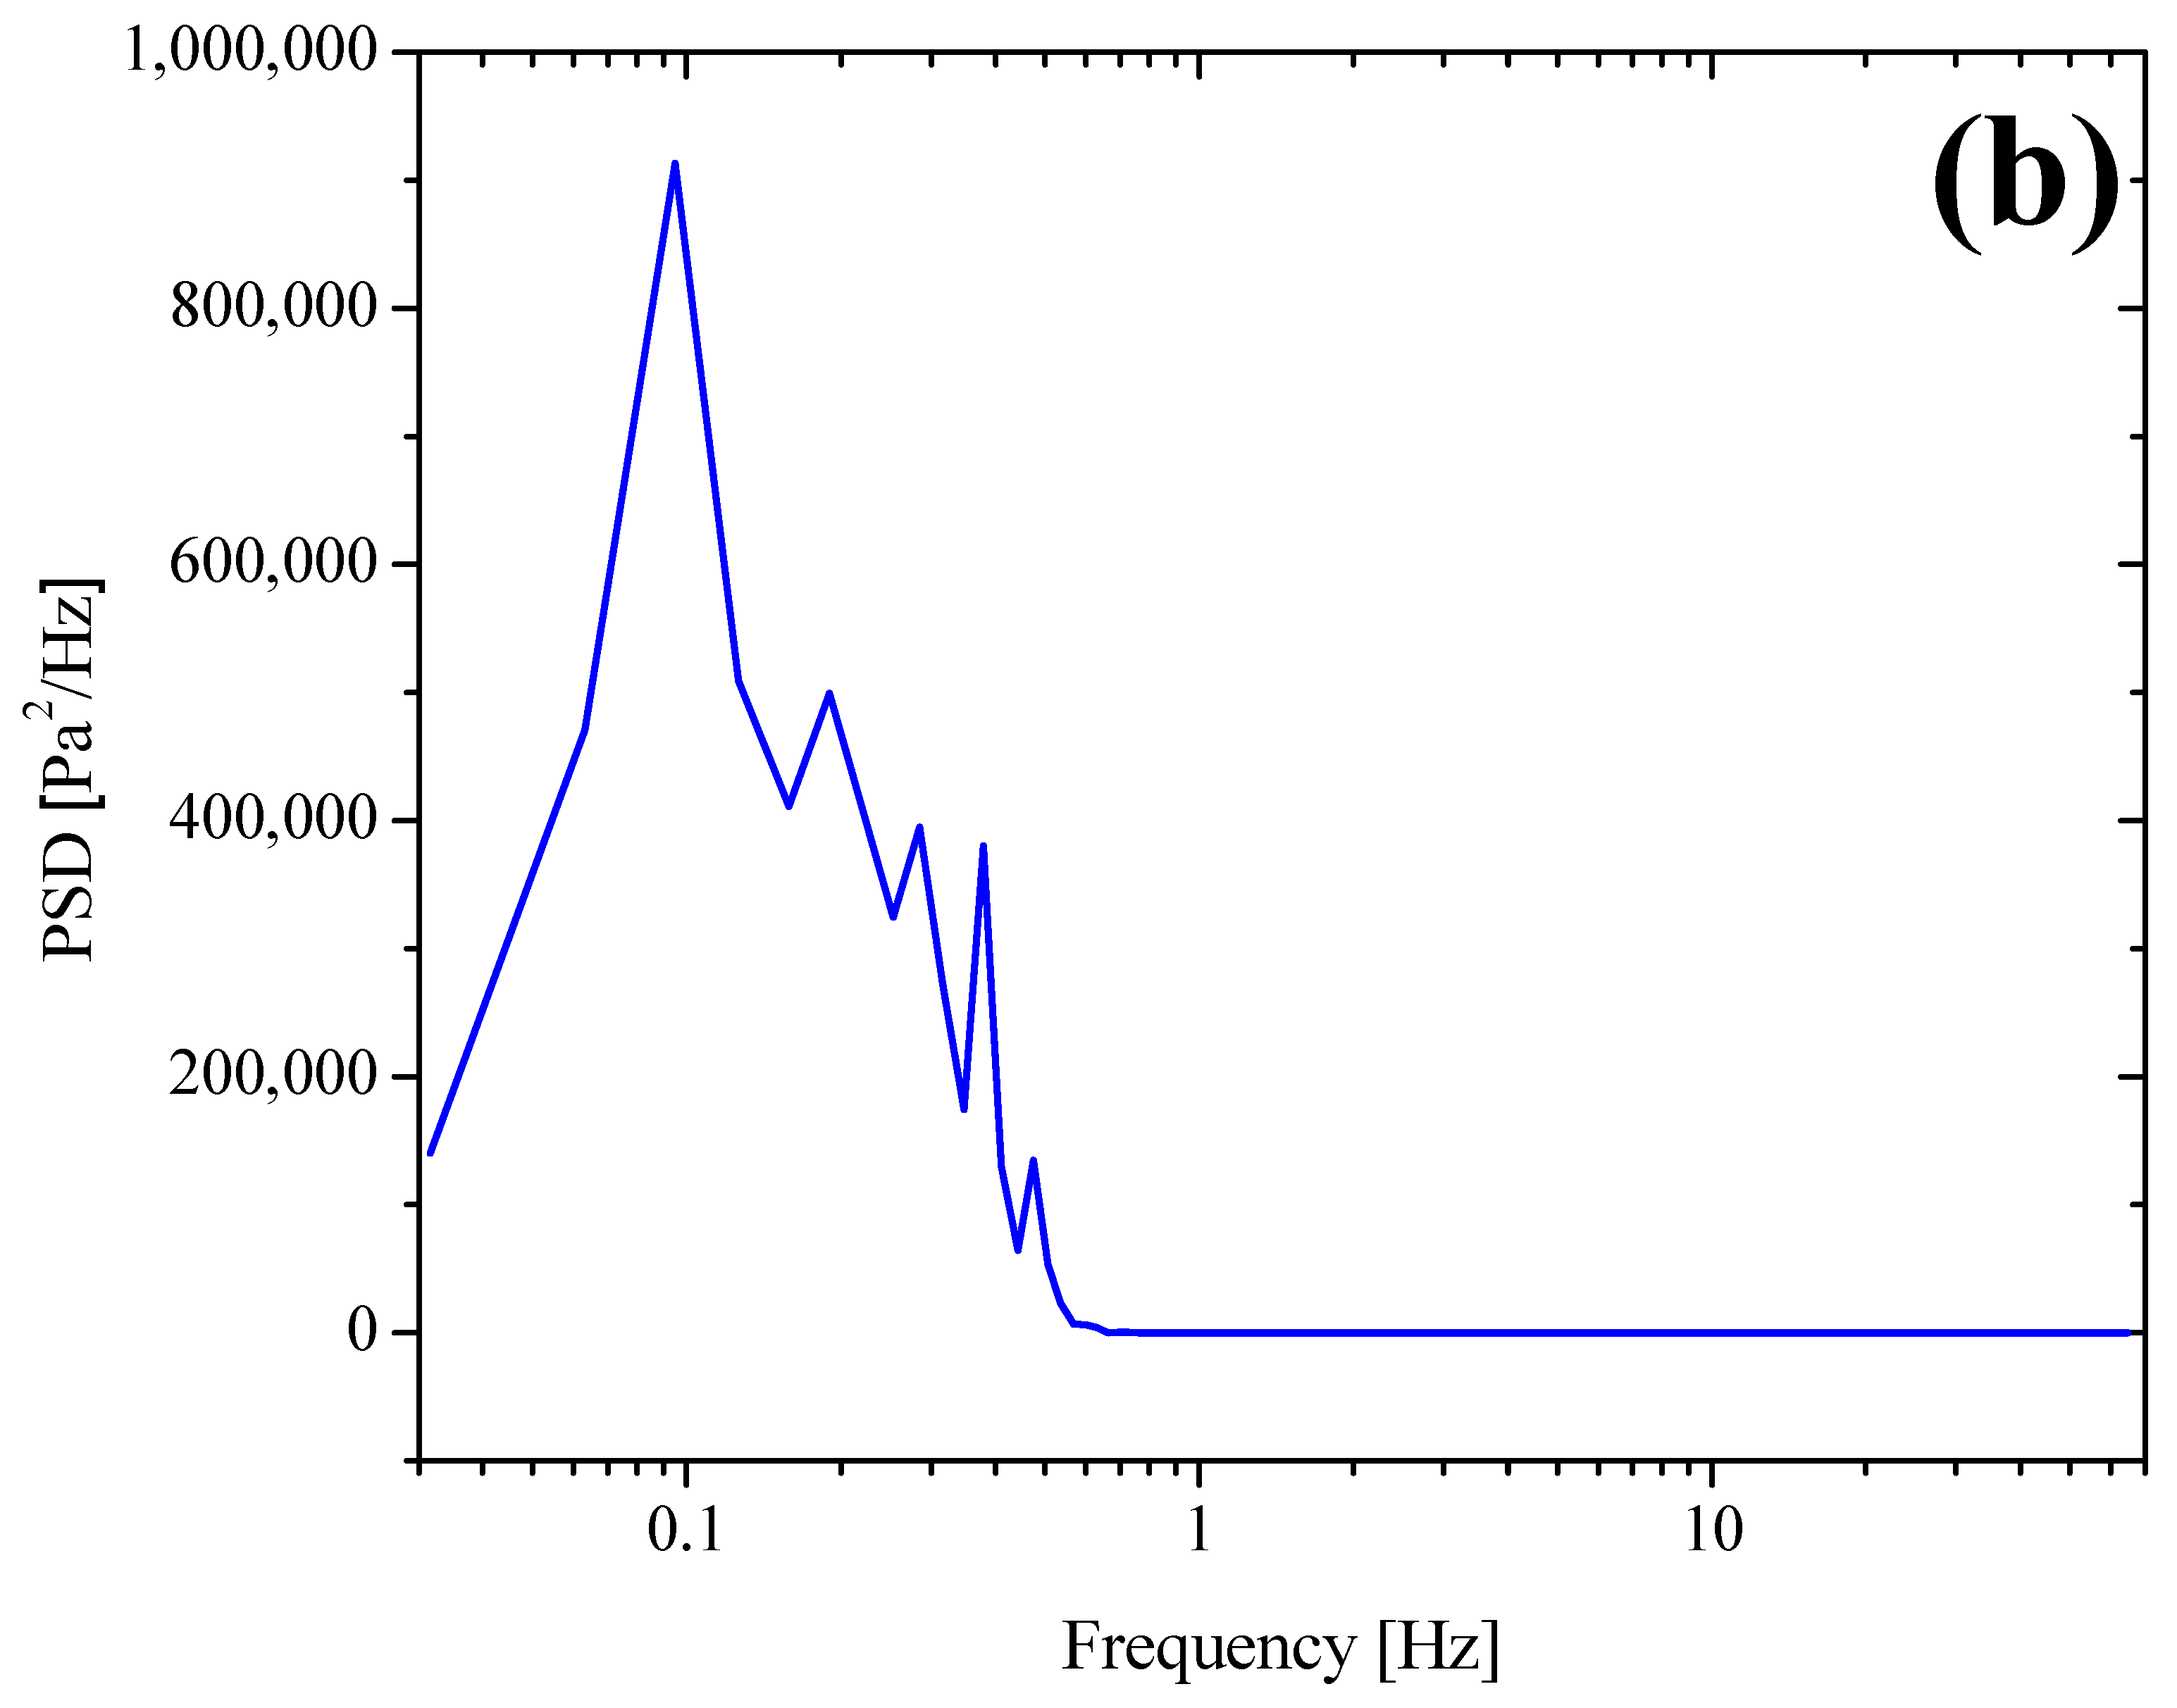
The hydrodynamic behavior of intermittent flow through the static mixer can be qualitatively and quantitatively analyzed with the time series of pressure drop fluctuations measured between the static mixer inlet and outlet. An example of the obtained time series is shown in Figure 12a. The pressure drop signal is composed of peaks separated by zones composed of low and relatively constant pressure drops. The pressure pulses reveal the passage of liquid slugs, while the region of low-pressure drops is due to the passage of elongated bubbles. A look at the time series shows that the time between two consecutive pulses is not constant, revealing the inherent statistic nature of the slug length and frequency. This behavior is analogous to that observed for the empty pipe [70]. Figure 12b shows an example of PSD obtained from the pressure drop time series. Note that the PSD was calculated in the present study by employing the Welch method. Indeed, the spectrum is composed of several peaks representing the different frequencies present in the pressure drop signals. The dominant frequency, or the frequency associated with the largest peak [71], is generally considered to be the slug frequency (fs) [71].
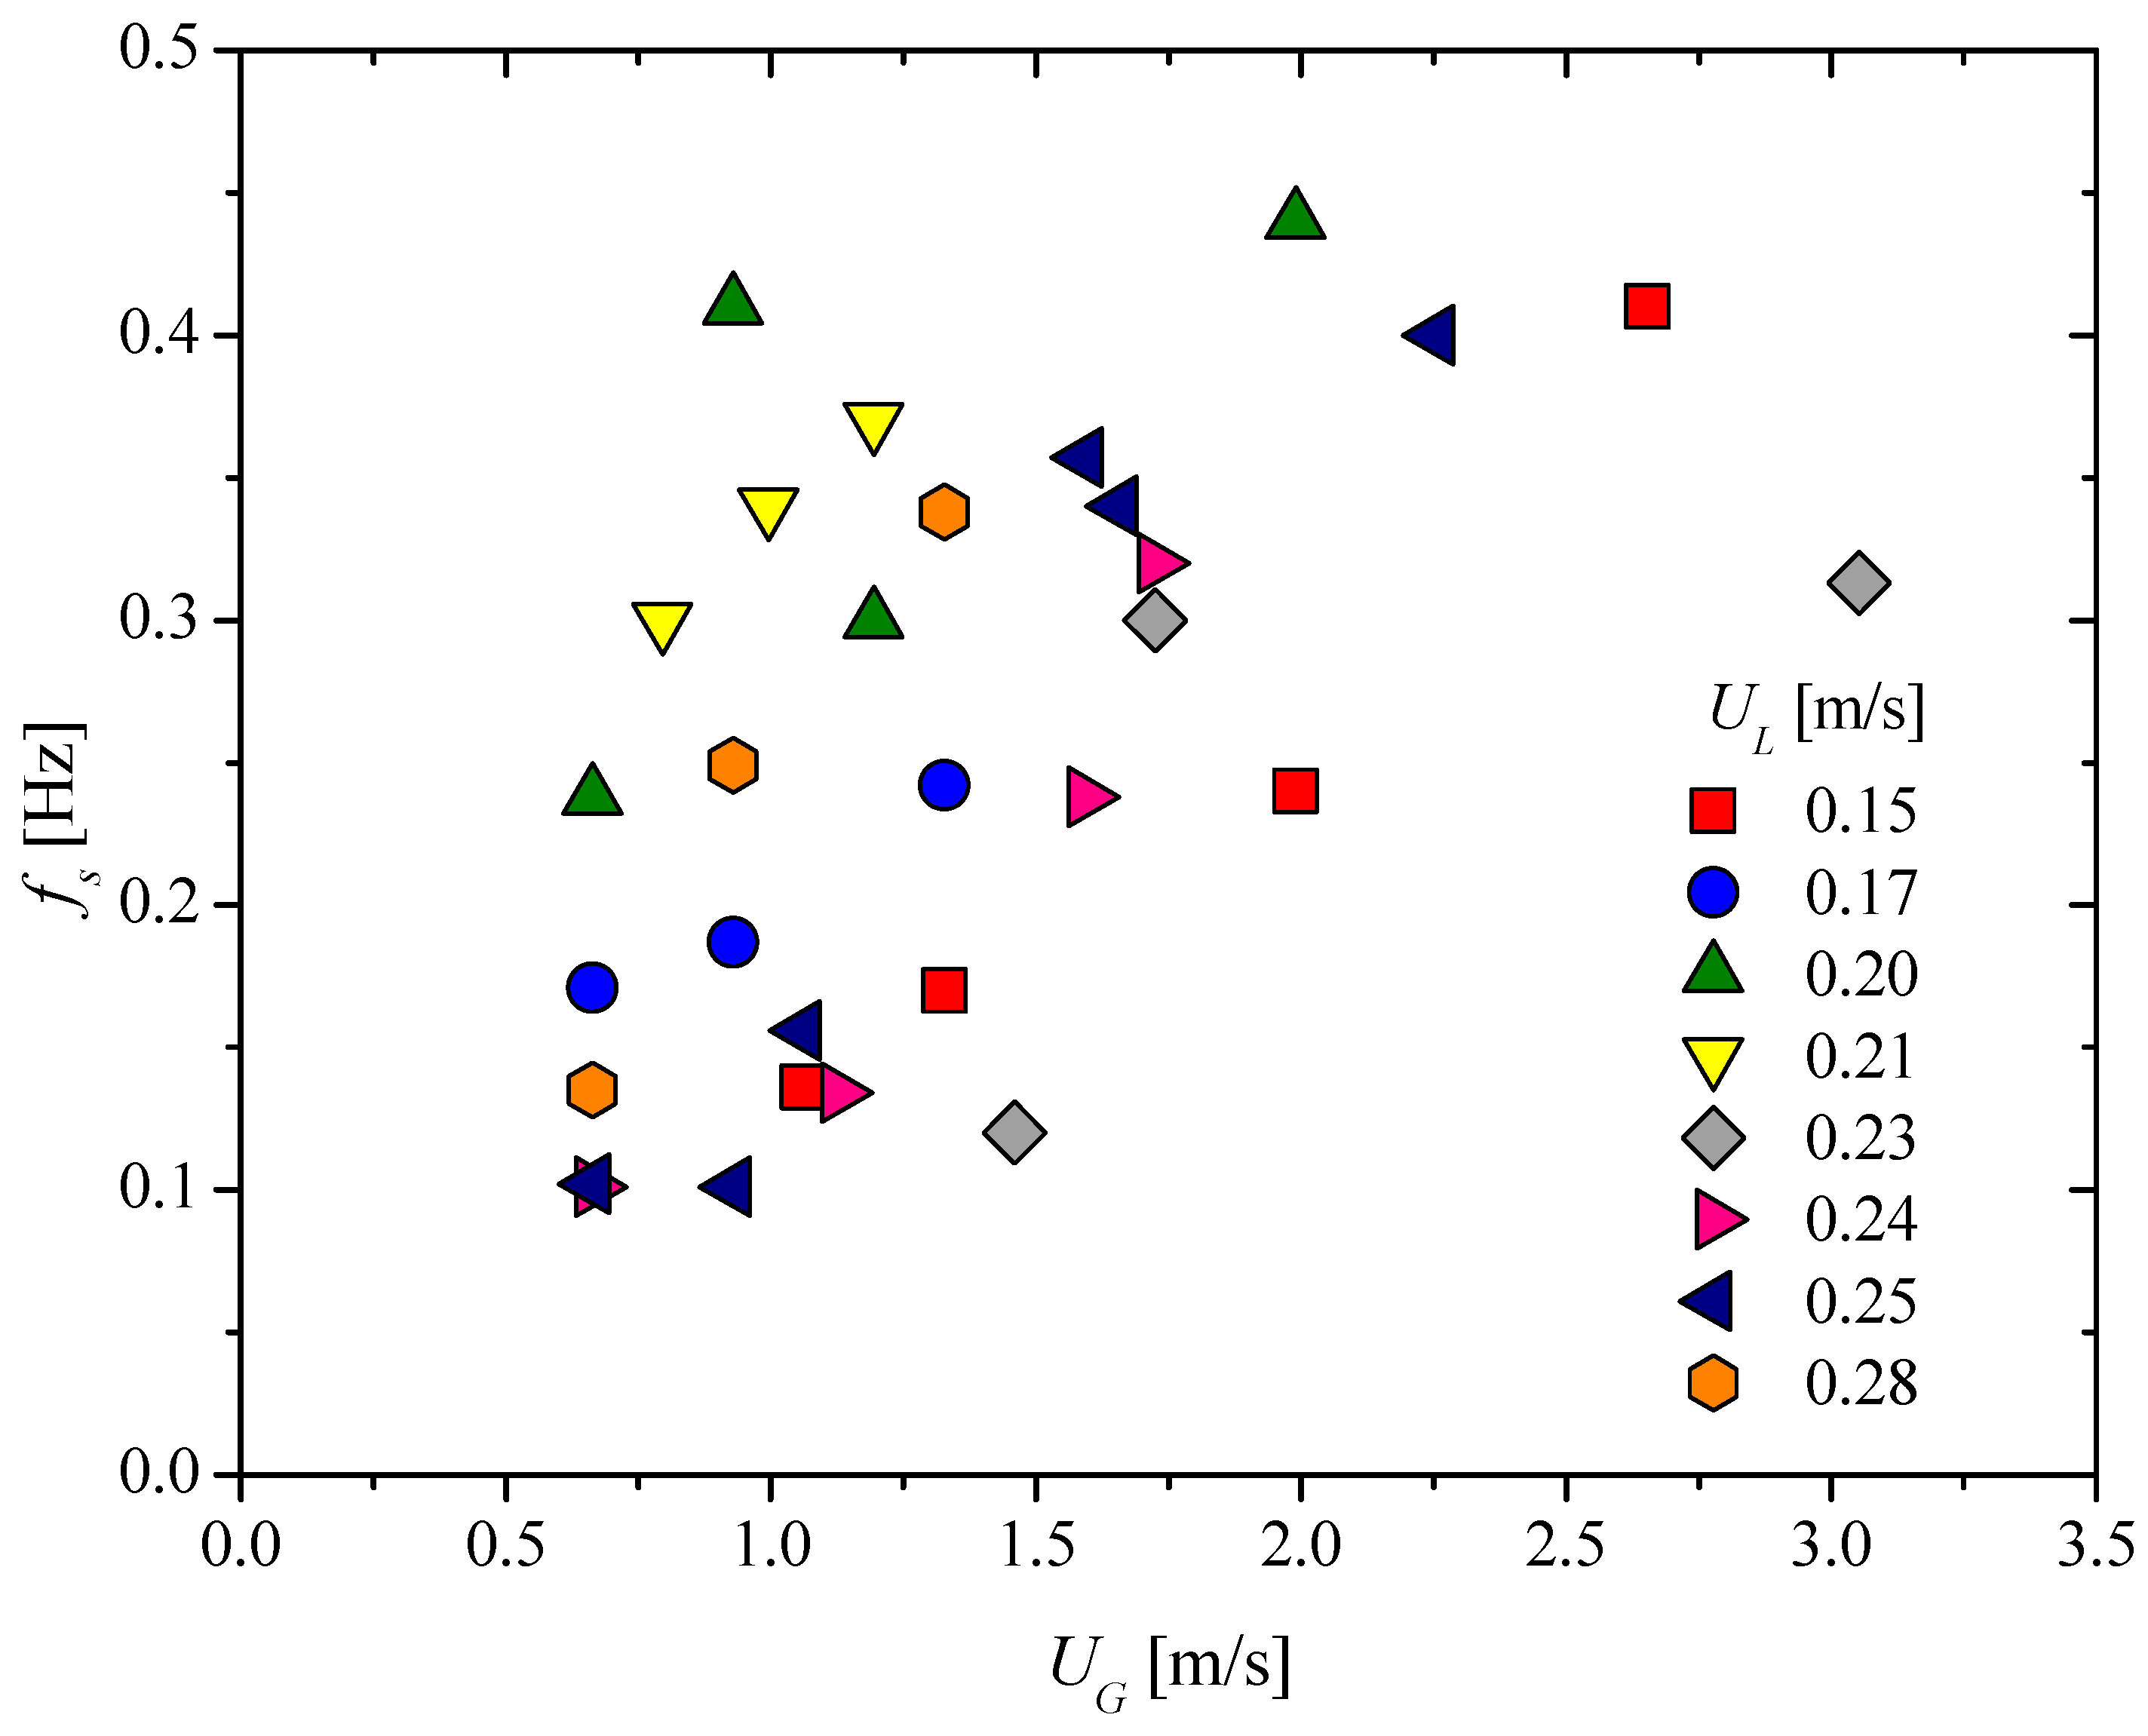
For mixing systems working with intermittent flow, it is important to characterize the slug frequency. Indeed, the heat transfer coefficient, as well as the phenomena related to the pipe-induced vibration (FIV), is directly related to this parameter [72]. For mixing performance, the observations obtained from the visual observations (depicted in Figure 11) allows us to understand the influence of the slug frequency in mixing phenomena. In addition, Yu et al. [54] showed the relationship between pressure fluctuations, which depend directly on slug frequency [72], and mixing performance. In Figure 13, we plot the slugging frequency estimate, obtained from power spectral analysis as a function of UG for different UL. It can be observed that slug frequency increases with increasing both superficial gas and liquid velocities. The positive dependence of slug frequency on UL can be explained by the fact that an increase in liquid superficial velocity raises the liquid level in the pipe, which promotes the formation of liquid slugs and consequently increases the slug frequency. Concerning the effect of UG, it is related to the slug formation mechanisms and, thus, to the range of liquid and gas superficial velocities as discussed in refs. [73,74].
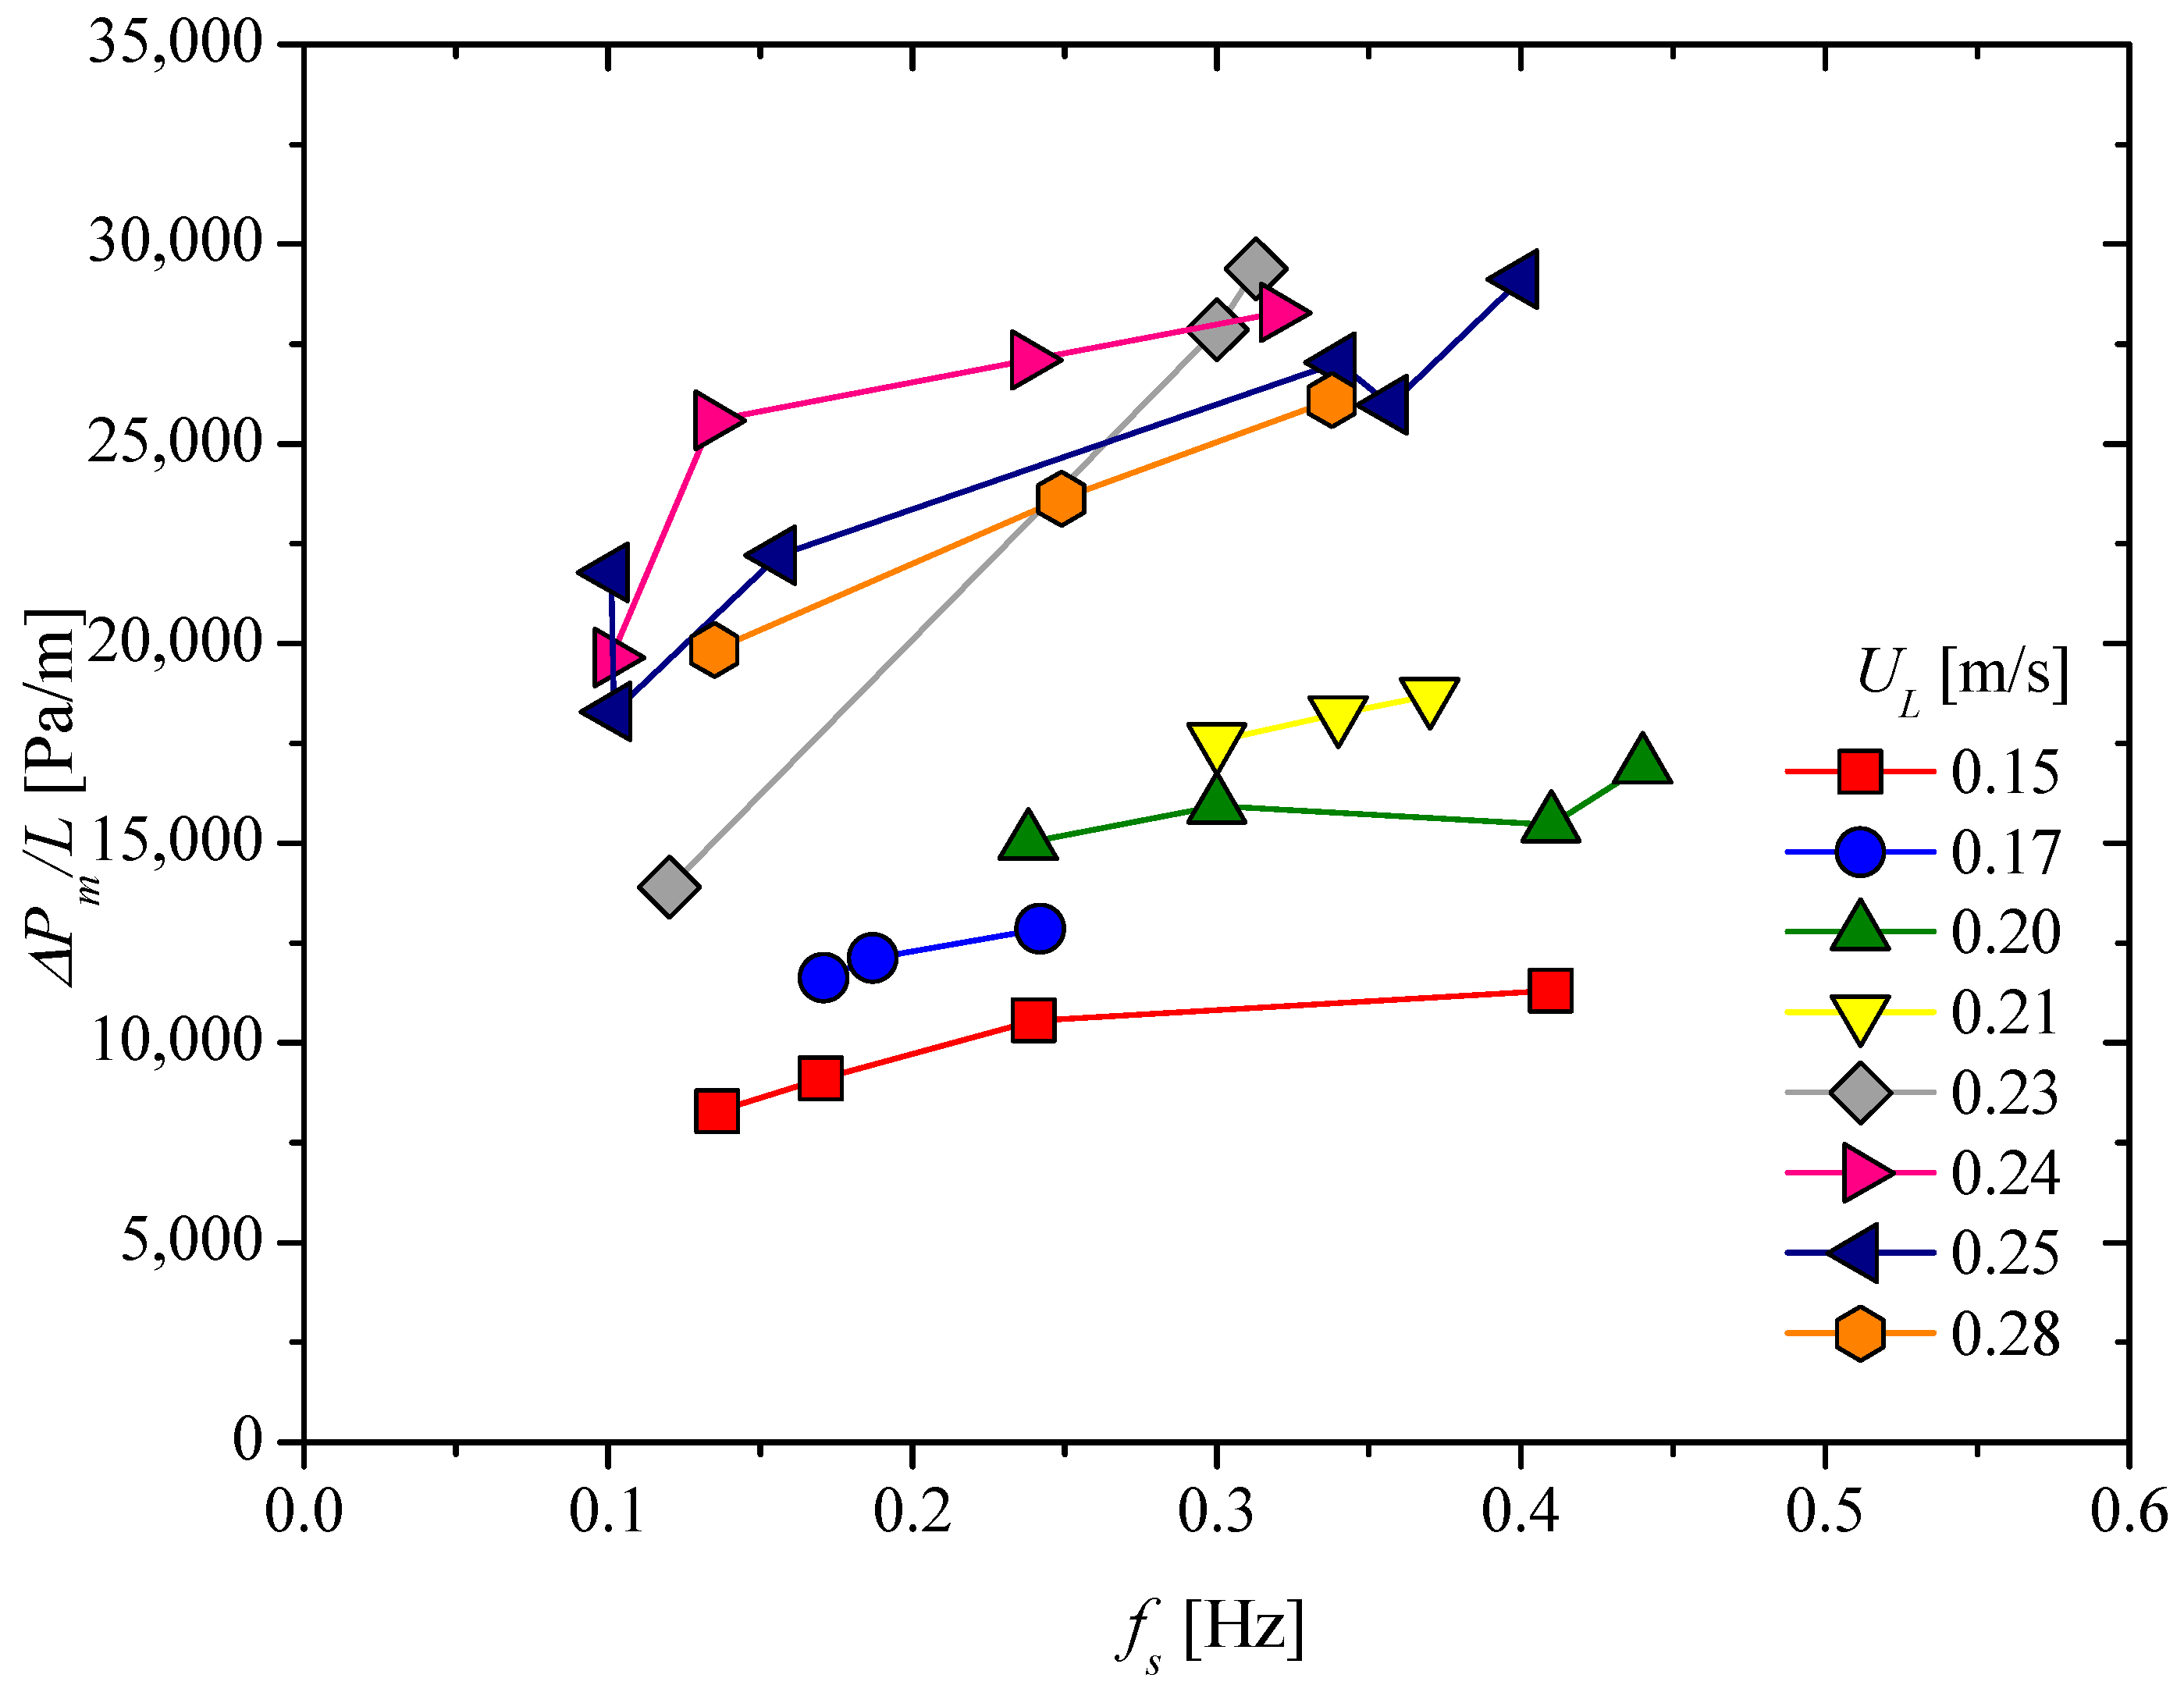
Finally, the measured pressure drops per unit length are depicted in Figure 14 as a function of slug frequency for different UL. Interestingly, the plot shows that an increase in slug frequency induces an increase before a stabilization of the pressure drop. The pressure drop stabilizes at a critical frequency of fs~0.25 Hz. This means that from a certain slug frequency value, an increase in slug frequency, which promotes the mixing, does not generate additional energy losses. Further investigation using CFD can allow us to better understand this behavior.

4. Conclusions

In this paper, pressure drops generated by a Komax triple action mixer placed in horizontal pipe of 40 mm ID were measured and correlated. The experiments were carried out for liquid single-phase and gas–liquid two-phase flow, using water and air. The following conclusions can be drawn:
  • For turbulent single-phase flow, the friction factor and z-factor are independent of the Reynolds number. The comparison of the presented results with available datasets shows that the Komax triple action generates lower pressure drops.
  • The pressure drop per unit length in the case of two-phase flow is dependent on both liquid and gas superficial velocities. Meanwhile, the effect of liquid superficial velocity becomes more important when the static mixer is crossed by the intermittent flow.
  • Application of the Lockhart–Martinelli approach for modeling the two-phase flow pressure drop gives interesting results. By considering the nature of flow regimes, the Chisholm parameter was linearly correlated with the homogenous liquid fraction.
  • The study of power dissipation shows that it depends on both the liquid and gas’ superficial velocities.
  • The visual observation of images collected shows that the Komax triple action induces the formation of swirling flow when the intermittent flow is observed upstream of the mixer.
  • The measurements of slug frequency showed that it depends on both liquid and gas superficial velocities. Interestingly, an increase in slug frequency induces an increase before a pressure drop stabilization.
As a perspective for future work, it would be valuable to assess the developed models under a broader range of operating conditions, as well as for different working fluids, pipe diameter, and flow regimes. Furthermore, conducting a CFD analysis is recommended to gain deeper insight into the two-phase flow behavior within the Komax Triple Action static mixer. The experimentally obtained pressure drop results presented in this study may serve as a reference for validating such CFD simulations.

Author Contributions

Conceptualization, Y.Z. and A.A.; methodology, Y.Z. and M.H.; validation, Y.Z.; formal analysis, Y.Z.; investigation, Y.Z.; data curation, Y.Z.; writing—original draft preparation, Y.Z. and A.A.; writing—review and editing, M.H., J.L. and E.-K.S.-A.; visualization, Y.Z. and A.A.; project administration, E.-K.S.-A.; funding acquisition, E.-K.S.-A. All authors have read and agreed to the published version of the manuscript.

Funding

A.A. has received funding from the Beatriu de Pinós postdoctoral fellowships programme (2021 BP 00052), funded by the Secretary of Universities and Research (Government of Catalonia) and by the Horizon 2020 Programme of Research and Innovation of the European Union under the Marie Skłodowska-Curie grant agreement No. 801370.

Institutional Review Board Statement

Not applicable.

Informed Consent Statement

Not applicable.

Data Availability Statement

The data presented in this study are available on request from the lead author (Y.Z.).

Conflicts of Interest

The authors declare no conflicts of interest.

Abbreviations

The following abbreviations are used in this manuscript:
CBMCurved-sheet blade-folded
CFDComputational fluid dynamics
DEMDiscrete element method
HILDA
PIProcess intensification
PSDPower spectral density
SMStatic mixer
TKSMStatic mixer with three twisted leaves
VOFVolume of fluid
Nomenclature
CChisholm parameter[-]
CoVCoefficient of variation[-]
DPipe diameter[m]
d P d L G Gas pressure drop gradient[Pa.m−1]
d P d L L Liquid pressure drop gradient[Pa.m−1]
fFriction factor[-]
fsSlug frequency[s−1]
HLLiquid holdup[-]
LLength of static mixer[m]
MMass[kg]
PPower dissipated[W]
ReLLiquid Reynolds number[-]
VMMixture velocity[m.s−1]
VLLiquid velocity[m.s−1]
VSMVolume of static mixer[m3]
UGGas superficial velocity[m.s−1]
ULLiquid superficial velocity[m.s−1]
XLockhart–Martinelli parameter[-]
zPressure drop ratio[-]
Greek letters
αSMPorosity of static mixer[-]
ΔP0Pressure drop measured in a straight pipe[Pa]
ΔPLLiquid Pressure drop[Pa]
ΔPmPressure drop generated by static mixer[Pa]
εGVoid fraction[-]
λGInput gas holdup[-]
µLLiquid viscosity[Pa.s]
ρLLiquid density[kg.m−3]
Φ L 2 Two-phase multiplier[-]

References

  1. Haase, S.; Tolvanen, P.; Russo, V. Process intensification in chemical reaction engineering. Processes 2022, 10, 99. [Google Scholar] [CrossRef]
  2. Paul, E.L.; Atiemo-Obeng, V.A.; Kresta, S.M. Introduction. In Handbook of Industrial Mixing—Science and Practice; John Wiley & Sons: Hoboken, NJ, USA, 2004; Chapter 1; pp. xxxiii–lx. ISBN 0-471-26919-0. [Google Scholar]
  3. Bowler, A.L.; Bakalis, S.; Watson, N.J. A review of in-line and on-line measurement techniques to monitor industrial mixing processes. Chem. Eng. Res. Des. 2020, 153, 463–495. [Google Scholar] [CrossRef]
  4. Valdés, J.P.; Kahouadji, L.; Matar, O.K. Current advances in liquid–liquid mixing in static mixers: A review. Chem. Eng. Res. Des. 2022, 177, 694–731. [Google Scholar] [CrossRef]
  5. Hildner, M.; Lorenz, J.; Zhu, B.; Shih, A. Pressure drop reduction of the impeller spiral static mixer design enabled by additive manufacturing. Chem. Eng. Process.-Process Intensif. 2023, 191, 109486. [Google Scholar] [CrossRef]
  6. Crittenden, J.C.; Howe, K.J.; Hand, D.W.; Tchobanoglous, G.; Trussell, R.R. Water Treatment: Principles and Design, 2nd ed.; Wiley: Hoboken, NJ, USA, 2005. [Google Scholar]
  7. Thakur, R.K.; Vial, C.; Nigam, K.D.P.; Nauman, E.B.; Djelveh, G. Static mixers in the process industries—A review. Chem. Eng. Res. Des. 2003, 81, 787–826. [Google Scholar] [CrossRef]
  8. Ghanem, A.; Lemenand, T.; Della Valle, D.; Peerhossaini, H. Static mixers: Mechanisms, applications, and characterization methods–A review. Chem. Eng. Res. Des. 2014, 92, 205–228. [Google Scholar] [CrossRef]
  9. Hammoudi, M.; Legrand, J.; Si-Ahmed, E.K.; Salem, A. Flow analysis by pulsed ultrasonic velocimetry technique in Sulzer SMX static mixer. Chem. Eng. J. 2008, 139, 562–574. [Google Scholar] [CrossRef]
  10. Demoz, A. Scaling inline static mixers for flocculation of oil sand mature fine tailings. AIChE J. 2015, 61, 4402–4411. [Google Scholar] [CrossRef]
  11. Chakleh, R.; Azizi, F. Performance comparison between novel and commercial static mixers under turbulent conditions. Chem. Eng. Process.-Process Intensif. 2023, 193, 109559. [Google Scholar] [CrossRef]
  12. Yu, Y.; Xiang, K.; Meng, H.; Li, W.; Li, D.; Xia, R.; Han, Z. A comprehensive review of gas–liquid two-phase flow in static mixers. Chem. Eng. Process.-Process Intensif. 2025, 216, 110434. [Google Scholar] [CrossRef]
  13. Aghamiri, Z.S.; Mehrnia, M.R.; Fatemi, S.; Shojaosadati, S.A.; Yazdian, F. Mathematical modeling of a horizontal tubular loop bioreactor for biomass production from natural gas. Process Biochem. 2010, 45, 1393–1400. [Google Scholar] [CrossRef]
  14. Li, H.; Yu, X.; Song, Y.; Li, Q.; Lu, S. Experimental and numerical investigation on optimization of foaming performance of the kenics static mixer in compressed air foam system. Eng. Appl. Comput. Fluid Mech. 2023, 17, 2183260. [Google Scholar] [CrossRef]
  15. Hosseini, S.M.; Razzaghi, K.; Shahraki, F. Design and characterization of a Low-pressure-drop static mixer. AIChE J. 2019, 65, 1126–1133. [Google Scholar] [CrossRef]
  16. Gavrilescu, M.; Tudose, R.Z. Intensification of transfer processes in biotechnology and chemical engineering using static mixers. Acta Biotechnol. 1995, 15, 3–26. [Google Scholar] [CrossRef]
  17. Meijer, H.E.; Singh, M.K.; Anderson, P.D. On the performance of static mixers: A quantitative comparison. Prog. Polym. Sci. 2012, 37, 1333–1349. [Google Scholar] [CrossRef]
  18. Al-Atabi, M. Design and assessment of a novel static mixer. Can. J. Chem. Eng. 2011, 89, 550–554. [Google Scholar] [CrossRef]
  19. Qiao, Y.; Zheng, L.; Guo, K.; Liu, H.; Zhang, B.; Li, W.; Guo, X.; Liu, C. Numerical study of flow field and mixing performance of a new curved-sheet blade-folded static mixer. Ind. Eng. Chem. Res. 2024, 63, 7836–7852. [Google Scholar] [CrossRef]
  20. Kresta, S.M.; Krebs, R.; Martin, T. The future of mixing research. Chem. Eng. Technol. Ind. Chem.-Plant Equip.-Process Eng. Biotechnol. 2004, 27, 208–214. [Google Scholar] [CrossRef]
  21. Haddadi, M.M.; Hosseini, S.H.; Rashtchian, D.; Olazar, M. Comparative analysis of different static mixers performance by CFD technique: An innovative mixer. Chin. J. Chem. Eng. 2020, 28, 672–684. [Google Scholar] [CrossRef]
  22. Hosni, M.; Hammoudi, M.H.; Si-Ahmed, E.K.; Legrand, J.; Douib, L. Single and two-phase flows in a horizontal pipe with a K enics static mixer: Effect of pressure drop on mixing. Can. J. Chem. Eng. 2023, 101, 828–844. [Google Scholar] [CrossRef]
  23. Pahl, M.H.; Muschelknautz, E. Statische mischer und ihre anwendung. Chem. Ing. Tech. 1980, 52, 285–291. [Google Scholar] [CrossRef]
  24. Jovanović, A.; Pezo, M.; Pezo, L.; Lević, L. DEM/CFD analysis of granular flow in static mixers. Powder Technol. 2014, 266, 240–248. [Google Scholar] [CrossRef]
  25. Rabha, S.; Schubert, M.; Grugel, F.; Banowski, M.; Hampel, U. Visualization and quantitative analysis of dispersive mixing by a helical static mixer in upward co-current gas–liquid flow. Chem. Eng. J. 2015, 262, 527–540. [Google Scholar] [CrossRef]
  26. Jiang, X.; Yang, N.; Wang, R. Effect of aspect ratio on the mixing performance in the Kenics static mixer. Processes 2021, 9, 464. [Google Scholar] [CrossRef]
  27. Pezo, L.L.; Pezo, M.; Terzić, A.; Jovanović, A.P.; Lončar, B.; Govedarica, D.; Kojić, P. Experimental and discrete element model investigation of limestone aggregate blending process in vertical static and/or conveyor mixer for application in the concrete mixture. Processes 2021, 9, 1991. [Google Scholar] [CrossRef]
  28. Li, H.; Yu, X.; Qiu, K.; Yu, X.; Lu, S. Enhanced fire-fighting performance of aqueous film-forming foam (AFFF) by tuning bubble size and expansion ratio with kenics static mixers. Fire Saf. J. 2024, 144, 104117. [Google Scholar] [CrossRef]
  29. Yao, Z.; Alberini, F.; Montante, G.; Paglianti, A. In-line monitoring of mixing performance for smart processes in tubular reactors. Chem. Eng. Res. Des. 2023, 194, 678–692. [Google Scholar] [CrossRef]
  30. Maluta, F.; Paglianti, A.; Montante, G. A PBM-Based Procedure for the CFD Simulation of Gas–Liquid Mixing with Compact Inline Static Mixers in Pipelines. Processes 2023, 11, 198. [Google Scholar] [CrossRef]
  31. Liu, Y.; Gao, M.; Huang, Z.; Wang, H.; Yuan, P.; Xu, X.; Yang, J. Numerical Simulation of the Mixing and Salt Washing Effects of a Static Mixer in an Electric Desalination Process. Processes 2024, 12, 883. [Google Scholar] [CrossRef]
  32. Wang, L.; Peng, Y.; Yang, X.; Qian, Y.; Wang, H.; Xu, Y.; Xu, Y. Bubble evolution and gas-liquid mixing mechanism in a static-mixer-based plug-flow reactor: A numerical analysis. Chem. Eng. J. 2024, 485, 149899. [Google Scholar] [CrossRef]
  33. Fonte, C.M.; Leblebici, M.E.; Dias, M.M.; Lopes, J.C.B. The NETmix reactor: Pressure drop measurements and 3D CFD modeling. Chem. Eng. Res. Des. 2013, 91, 2250–2258. [Google Scholar] [CrossRef]
  34. Jegatheeswaran, S. Using Electrical Resistance Tomography (ERT) and Computational Fluid Dynamics (CFD) to Study the Mixing of Yield-Pseudoplastic Fluids in the SMX Static Mixer. Doctoral Dissertation, Toronto Metropolitan University, Toronto, ON, Canada, 2016. [Google Scholar]
  35. Nyande, B.W.; Mathew Thomas, K.; Lakerveld, R. CFD analysis of a Kenics static mixer with a low pressure drop under laminar flow conditions. Ind. Eng. Chem. Res. 2021, 60, 5264–5277. [Google Scholar] [CrossRef]
  36. Wang, C.; Liu, H.; Yang, X.; Wang, R. Research for a non-standard kenics static mixer with an eccentricity factor. Processes 2021, 9, 1353. [Google Scholar] [CrossRef]
  37. Meng, H.; Meng, T.; Yu, Y.; Wang, Z.; Wu, J. Experimental and numerical investigation of turbulent flow and heat transfer characteristics in the Komax static mixer. Int. J. Heat Mass Transf. 2022, 194, 123006. [Google Scholar] [CrossRef]
  38. Valdes, J.P.; Kahouadji, L.; Liang, F.; Shin, S.; Chergui, J.; Juric, D.; Matar, O.K. Direct numerical simulations of liquid–liquid dispersions in a SMX mixer under different inlet conditions. Chem. Eng. J. 2023, 462, 142248. [Google Scholar] [CrossRef]
  39. Patil, P.R.; Dastane, G.G.; Pandit, A.B. Numerical investigation of turbulent flow and heat transfer characteristics in the improved Kenics static mixer. Heat Transf. 2024, 53, 44–72. [Google Scholar] [CrossRef]
  40. Rakoczy, R.; Masiuk, S.; Kordas, M.; Grądzik, P. The effects of power characteristics on the heat transfer process in various types of motionless mixing devices. Chem. Eng. Process. Process Intensif. 2011, 50, 959–969. [Google Scholar] [CrossRef]
  41. Revathi, D.; Saravanan, K. Experimental studies on hydrodynamic aspects for mixing of non-Newtonian fluids in a Komax static mixer. Chem. Ind. Chem. Eng. Q. 2020, 26, 329–335. [Google Scholar] [CrossRef]
  42. Moghaddam, S. Effect of non-Newtonian fluid on mixing quality and pressure drop in several static mixers: A numerical study. Iran. J. Sci. Technol. Trans. Mech. Eng. 2023, 47, 1585–1597. [Google Scholar] [CrossRef]
  43. Heyouni, A.; Roustan, M.; Do-Quang, Z. Hydrodynamics and mass transfer in gas–liquid flow through static mixers. Chem. Eng. Sci. 2002, 57, 3325–3333. [Google Scholar] [CrossRef]
  44. Li, G.; Miles, N.J.; Hall, P.; Wang, Z.; Gao, J.; Shen, Y. Dispersion of immiscible liquids in a static mixer without inserted elements: A CFD-PBM study on droplet size reduction and distribution. Powder Technol. 2025, 452, 120547. [Google Scholar] [CrossRef]
  45. Hammoudi, M.; Si-Ahmed, E.K.; Legrand, J. Dispersed two-phase flow analysis by pulsed ultrasonic velocimetry in SMX static mixer. Chem. Eng. J. 2012, 191, 463–474. [Google Scholar] [CrossRef]
  46. Martin, N.; Galey, C. Use of static mixer for oxidation and disinfection by ozone. Ozone Sci. Eng. 1994, 16, 455–473. [Google Scholar] [CrossRef]
  47. Liu, W.; Lv, X.; Jiang, S.; Li, H.; Zhou, H.; Dou, X. Gas–liquid two-phase flow patterns and pressure drop of decaying swirling flow inside a horizontal pipe. Chem. Eng. Sci. 2023, 266, 118281. [Google Scholar] [CrossRef]
  48. Keshav, T.R.; Somaraju, P.; Kalyan, K.; Saroha, A.K.; Nigam, K.D.P. Liquid phase residence time distribution for gas–liquid flow in Kenics static mixer. Chem. Eng. Process. Process Intensif. 2008, 47, 2275–2280. [Google Scholar] [CrossRef]
  49. Couvert, A.; Sanchez, C.; Charron, I.; Laplanche, A.; Renner, C. Static mixers with a gas continuous phase. Chem. Eng. Sci. 2006, 61, 3429–3434. [Google Scholar] [CrossRef]
  50. Sanchez, C.; Couvert, A.; Laplanche, A.; Renner, C. Hydrodynamic and mass transfer in a new co-current two-phase flow gas–liquid contactor. Chem. Eng. J. 2007, 131, 49–58. [Google Scholar] [CrossRef]
  51. Meng, H.; Hao, Y.; Yu, Y.; Li, Z.; Song, S.; Wu, J. Experimental study of gas-liquid two-phase bubbly flow characteristics in a static mixer with three twisted leaves. Korean J. Chem. Eng. 2020, 37, 1859–1866. [Google Scholar] [CrossRef]
  52. Hewitt, G.F.; Roberts, D.N. Studies of Two-Phase Flow Patterns by Simultaneous X-Ray And Flast Photography (No. AERE-M-2159); Atomic Energy Research Establishment: Harwell, UK, 1969. [Google Scholar]
  53. Xu, Y.; Wang, L.; Wang, Y.; Qian, Y.; Wang, H.; Xu, Y.; Yang, X. Gas-liquid flow pattern identification and bubble characteristics analysis in a static mixer based HiPOxTM reactor. Chem. Eng. Sci. 2023, 267, 118269. [Google Scholar] [CrossRef]
  54. Yu, Y.; Li, B.; Meng, H.; Zhang, J.; Xiang, K.; Yang, P. Multiscale Turbulence Characteristics of Gas–Liquid Pressure Fluctuations in an Industrial Quatro Static Mixer. Ind. Eng. Chem. Res. 2024, 63, 3727–3743. [Google Scholar] [CrossRef]
  55. Marrocos, P.H.; Fernandes, I.S.; Pituco, M.M.; Lopes, J.C.; Dias, M.M.; Santos, R.J.; Vilar, V.J. CFD and lower order mechanistic models for gas-liquid flow in NETmix: Pressure drop and gas hold-up. Chem. Eng. Sci. 2024, 284, 119478. [Google Scholar] [CrossRef]
  56. Scala, M.; Gamet, L.; Malbec, L.M.; Li, H.Z. Hydrodynamics of gas-liquid dispersion in transparent Sulzer static mixers SMXTM. Chem. Eng. Sci. 2020, 213, 115398. [Google Scholar] [CrossRef]
  57. McCowan, M. Developing a Horizontal In-Line Diffused Aeration System for Removing Trihalomethanes from Water Distribution Mains. Master’s Thesis, University of New Hampshire, Durham, NH, USA, 2015. [Google Scholar]
  58. Ogunsesan, O.A.; Hossain, M.; Droubi, M.G. Computational fluid dynamics modelling of multiphase flows in double elbow geometries. Proc. Inst. Mech. Eng. Part E J. Process Mech. Eng. 2021, 235, 1835–1846. [Google Scholar] [CrossRef]
  59. Holagh, S.G.; Ahmed, W.H. Critical review of vertical gas-liquid slug flow: An insight to better understand flow hydrodynamics’ effect on heat and mass transfer characteristics. Int. J. Heat Mass Transf. 2024, 225, 125422. [Google Scholar] [CrossRef]
  60. Arabi, A. Contribution à l’étude du Comportement d’un Ecoulement Diphasique Dans une Conduite en Présence d’une Singularité. Ph.D. Thesis, USTHB, Algiers, Algeria, 2019. [Google Scholar]
  61. Fang, X.; Xu, Y.; Zhou, Z. New correlations of single-phase friction factor for turbulent pipe flow and evaluation of existing single-phase friction factor correlations. Nucl. Eng. Des. 2011, 241, 897–902. [Google Scholar] [CrossRef]
  62. Saldana, M.; Gallegos, S.; Gálvez, E.; Castillo, J.; Salinas-Rodríguez, E.; Cerecedo-Sáenz, E.; Hernández-Ávila, J.; Navarra, A.; Toro, N. The Reynolds number: A journey from its origin to modern applications. Fluids 2024, 9, 299. [Google Scholar] [CrossRef]
  63. Almenas, K.; Gasiūnas, S.; Šeporaitis, M.; Pabarčius, R. Shear Number as a Practical Tool for Flow Regime Evaluation and Education. Fluids 2025, 10, 76. [Google Scholar] [CrossRef]
  64. Stec, M.; Synowiec, P.M. Study of fluid dynamic conditions in the selected static mixers part I-research of pressure drop. Can. J. Chem. Eng. 2017, 95, 2156–2167. [Google Scholar] [CrossRef]
  65. Taitel, Y.; Dukler, A.E. A model for predicting flow regime transitions in horizontal and near horizontal gas-liquid flow. AIChE J. 1976, 22, 47–55. [Google Scholar] [CrossRef]
  66. Arabi, A.; Abdul-Majeed, G.H.; Boukrouche, H.B.; Larbi, Z. Pressure recovery model for gas–liquid two-phase flow across sudden expansions. Exp. Comput. Multiph. Flow 2024, 6, 14–27. [Google Scholar] [CrossRef]
  67. Lockhart, W.R. Proposed correlation of data for isothermal two-phase, two-component flow in pipes. Chem. Eng. Prog. 1949, 45, 39–48. [Google Scholar]
  68. Chisholm, D. A theoretical basis for the Lockhart-Martinelli correlation for two-phase flow. Int. J. Heat Mass Transf. 1967, 10, 1767–1778. [Google Scholar] [CrossRef]
  69. Cai, Q.; D’Auria, F.; Umminger, K.; Bestion, D.; Shan, J. Prioritizing pressure drop research in nuclear thermal hydraulics. Prog. Nucl. Energy 2022, 153, 104358. [Google Scholar] [CrossRef]
  70. Arabi, A.; Salhi, Y.; Zenati, Y.; Si-Ahmed, E.K.; Legrand, J. Identifying the intermittent flow sub-regimes using pressure drop time series fluctuations. Exp. Comput. Multiph. Flow 2024, 6, 28–40. [Google Scholar] [CrossRef]
  71. Höhn, R.L.; Arabi, A.; Stiriba, Y.; Pallares, J. A review of the measurement of the multiphase slug frequency. Processes 2024, 12, 2500. [Google Scholar] [CrossRef]
  72. Arabi, A.; Höhn, R.L.; Pallares, J.; Stiriba, Y. Practical aspects of multiphase slug frequency: An overview. Can. J. Chem. Eng. 2025, 103, 2880–2894. [Google Scholar] [CrossRef]
  73. Woods, B.D.; Hanratty, T.J. Influence of Froude number on physical processes determining frequency of slugging in horizontal gas–liquid flows. Int. J. Multiph. Flow 1999, 25, 1195–1223. [Google Scholar] [CrossRef]
  74. Dinaryanto, O.; Prayitno, Y.A.K.; Majid, A.I.; Hudaya, A.Z.; Nusirwan, Y.A.; Widyaparaga, A. Experimental investigation on the initiation and flow development of gas-liquid slug two-phase flow in a horizontal pipe. Exp. Therm. Fluid Sci. 2017, 81, 93–108. [Google Scholar] [CrossRef]
Figure 1. Sketch of horizontal intermittent flow. Flow direction: from right to left.
Fluids 10 00259 g001
Figure 2. (a) Schematic diagram of experimental setup used in the present investigation, and (b) sketch of Komax triple action.
Fluids 10 00259 g002
Figure 3. Validation of pressure drop gradient measurements with those calculated with the correlation of Fang et al. (2011) [61].
Fluids 10 00259 g003
Figure 4. Friction factor versus liquid Reynolds number (a) present measurement and fittings and (b) comparison with experimental measurements obtained in the literature [37,43,64].
Fluids 10 00259 g004
Figure 5. z-factor versus liquid Reynolds number.
Fluids 10 00259 g005
Figure 6. Plot of the observed flow regimes in the flow maps of Taitel and Dukler (1976) [65], calculated for a pipe of 40 mm ID.
Fluids 10 00259 g006
Figure 7. Evolution of measured pressure drop per unit length as a function of UG for different UL. The open and closed symbols refer to stratified and intermittent flows, respectively.
Fluids 10 00259 g007
Figure 8. Evolution of measured pressure drop per unit length as function of UG for different UL obtained in the present study and previous studies. For the present study, the open and closed symbol refer to stratified and intermittent flows, respectively [22,43,49,50].
Fluids 10 00259 g008
Figure 9. (a) Two phase flow multiplier versus Lockhart–Martinelli parameter, (b) evolution of Chisholm parameter versus void fraction, and (c) cross-plot of experimental and calculated Chisholm parameter.
Fluids 10 00259 g009
Figure 10. P/M as function of UL for different UG. Open and closed symbols refer to stratified and intermittent flows, respectively.
Fluids 10 00259 g010
Figure 11. Sequential images capturing intermittent flow passage through the Komax triple-action mixer (UL = 0.21 m/s and UG = 1.45 m/s). Flow direction: from right to left.
Fluids 10 00259 g011
Figure 12. (a) Example of pressure drop time series and (b) calculated power spectral density (UL = 0.17 m/s and UG = 0.93 m/s).
Fluids 10 00259 g012aFluids 10 00259 g012b
Figure 13. Slug frequency as function of UG for different UL.
Fluids 10 00259 g013
Figure 14. Pressure drop per unit length versus slug frequency.
Fluids 10 00259 g014
Table 1. Geometrical characteristic of Komax triple action static mixer used in the present investigation.
Diameter (D)40 mm
Length of static mixer (L)160 mm
Porosity (αSM)92.8%
Disclaimer/Publisher’s Note: The statements, opinions and data contained in all publications are solely those of the individual author(s) and contributor(s) and not of MDPI and/or the editor(s). MDPI and/or the editor(s) disclaim responsibility for any injury to people or property resulting from any ideas, methods, instructions or products referred to in the content.