
Article

Mechanical Regimes in Gelatin and Gellan Gum Bigels: Structure–Function Relationships and Dual Delivery of Carob Fruit Extracts

Institute of Food Science, Technology and Nutrition (ICTAN-CSIC), C/José Antonio Novais 6, 28040 Madrid, Spain
*
Authors to whom correspondence should be addressed.
Gels 2026, 12(7), 602; https://doi.org/10.3390/gels12070602
Submission received: 10 June 2026 / Revised: 30 June 2026 / Accepted: 4 July 2026 / Published: 7 July 2026
(This article belongs to the Special Issue Food Gels: Structure and Function (2nd Edition))

Abstract

Bigels (BGs) were formulated using gelatin (GA) or gellan gum (GG) hydrogels (HGs) combined with beeswax-structured oleogels (OGs). Carob fruit extracts—an inositol-rich fraction (I-CFE) and a polyphenol-rich fraction (P-CFE)—were incorporated into the HG and OG phases, respectively, to enable dual delivery. The effects of composition on rheological, textural, thermal, color, and stability properties were evaluated at HG/OG ratios of 70/30, 60/40, and 50/50. GG-based BGs formed rigid, coherent, and crystal-reinforced networks, exhibiting the highest oscillatory stiffness and complex viscosity. GA-based BGs developed softer, more deformable, and viscous structures, with mechanical behavior strongly governed by damping and water content. Increasing OG content reinforced GG BGs through beeswax–crystal integration, whereas in GA it increased oscillatory stiffness but weakened the cohesive, viscous, and recoverable characteristics of the protein network. Categorical principal component analysis (CATPCA) revealed two mechanical domains: a GA-associated regime dominated by viscosity, penetration resistance, and loss factor (tan δ), and a GG-associated regime governed by elastic stiffness. Correlations confirmed tan δmax as a marker of structural fragility in GA, while stiffness parameters dominated GG behavior. Melting points remained within 53–54 °C, and all BGs showed excellent physical stability. Overall, GA and GG provide complementary design spaces, offering a mechanistic basis for the rational design of BGs with controlled structural and functional properties.

1. Introduction

Bigels (BGs) are biphasic soft materials composed of a hydrophilic hydrogel (HG) and a lipophilic oleogel (OG), each forming its own three-dimensional network [1]. Their dual-phase architecture enables the simultaneous encapsulation of hydrophilic and lipophilic compounds, offering advantages over emulsions and single-phase gels, such as improved stability, tunable mechanical properties, and surfactant-free structuring [1,2]. Initially developed for pharmaceutical and cosmetic applications, BGs are now gaining relevance in food science as fat replacers and delivery systems aligned with healthier and more sustainable formulations [3,4].
BG structure depends strongly on phase composition, the hydrogel-to-oleogel ratio (HG/OG), and processing conditions. These factors determine whether BGs adopt O/W, W/O, or bicontinuous architectures [5], and these architectures govern their mechanical strength, viscoelasticity, and thermal stability. HG-rich systems typically form O/W structures [6,7], whereas higher OG contents may induce phase inversion or interpenetrating networks [8,9].
Gelatin (GA) is widely used in food-grade BGs due to its thermoreversible gelation, elasticity, and water-binding capacity, often producing uniform droplet distributions [6]. GA-based BGs have been explored in 3D printing and hybrid matrices with ethyl cellulose or gellan gum (GG), where the HG/OG ratio and emulsifier selection modulate mechanical and physicochemical properties [4,10,11,12]. Additional biopolymers, such as κ-carrageenan, CMC, or konjac glucomannan, can further modify HG networks through electrostatic or viscosity-driven interactions [13,14,15].
OGs structured with natural waxes (e.g., beeswax (BW), rice bran wax, and candelilla wax) provide crystalline networks that reinforce the lipid phase and contribute to thermal transitions between 40–80 °C [16,17]. BW-based OGs are particularly compatible with GA and widely used in food BGs [18,19,20,21]. Increasing OG content often enhances rigidity and viscoelastic moduli [7,22], whereas HG-rich systems tend to be softer and more deformable [6,9]. However, structural transitions in GA–wax BGs at intermediate ratios remain insufficiently understood. In this context, GA and GG were selected as HG-forming agents because they represent two widely used and mechanistically distinct food-grade gelling systems (protein-based and polysaccharide-based), while BW was chosen as the oleogelator due to its strong ability to form crystalline lipid networks at relatively low concentrations and its broad use in food OGs. This combination enables the design of hybrid BG matrices that are technologically relevant and compatible with the incorporation of carob fruit extracts.
Beyond their technological interest, BGs are promising carriers for bioactive compounds, enabling sequential release and improved stability of hydrophilic and lipophilic molecules, such as carotenoids, phenolics, and saponins [12,23,24,25]. Their biphasic nature enhances protection during digestion and modulates release kinetics [15,25].
Carob fruit extracts (CFEs) are emerging functional ingredients relevant to diabesity management [9]. The carob pod contains an inositol-rich fraction (I-CFE), dominated by pinitol, and a polyphenol-rich fraction (P-CFE), rich in proanthocyanidins with antioxidant and gut-protective effects. Antagonistic absorption pathways and phenolic instability [26,27] limit their incorporation into foods. Embedding I-CFE in the HG and P-CFE in the OG of BGs enables sequential release [9], reduces unwanted interactions, and improves oxidative and sensory stability. Carob fruit (Ceratonia siliqua L.) contains several functional ingredients of technological and nutritional relevance. The pod is naturally rich in inositols, mainly D-pinitol and myo-inositol, which can reach concentrations of 145–155 g/kg in concentrated extracts, as well as polyphenols (condensed tannins and gallic acid derivatives) and dietary fiber composed of cellulose, hemicellulose, and pectins. The seed (kernel) contains high levels of galactomannans (locust bean gum), together with proteins and structural polysaccharides. These polymeric species contribute to the viscosity, water-binding capacity, and antioxidant potential of carob-derived ingredients.
Given these gaps, this work developed and characterized food-grade BGs formulated with GA- and GG-based HGs and BW-based OGs at HG/OG ratios of 70/30, 60/40, and 50/50. This work builds upon our previous study [9] on alginate-based carob extract BGs by introducing a comparative analysis of two mechanistically distinct HG-forming agents (GA and GG) and by examining how their contrasting gelation pathways give rise to different mechanical regimes, structural organization, and dual-phase delivery behavior across intermediate HG/OG ratios. GA and GG were selected because they represent two widely used and mechanistically distinct food-grade gelling systems, which were expected to generate contrasting structural responses. I-CFE was incorporated into the HG and P-CFE into the OG to enable controlled sequential release during in vitro digestion. These ratios were selected to cover the transition from HG-dominated structures to more balanced biphasic networks. We hypothesized that GA- and GG-based BGs would exhibit distinct mechanical regimes driven by their different gelation mechanisms, and that the HG/OG ratio would modulate these regimes and the dual-phase delivery performance of carob fruit extracts.

2. Results and Discussion

2.1. SAOS Measurements of BGs

2.1.1. Stress Sweep Tests

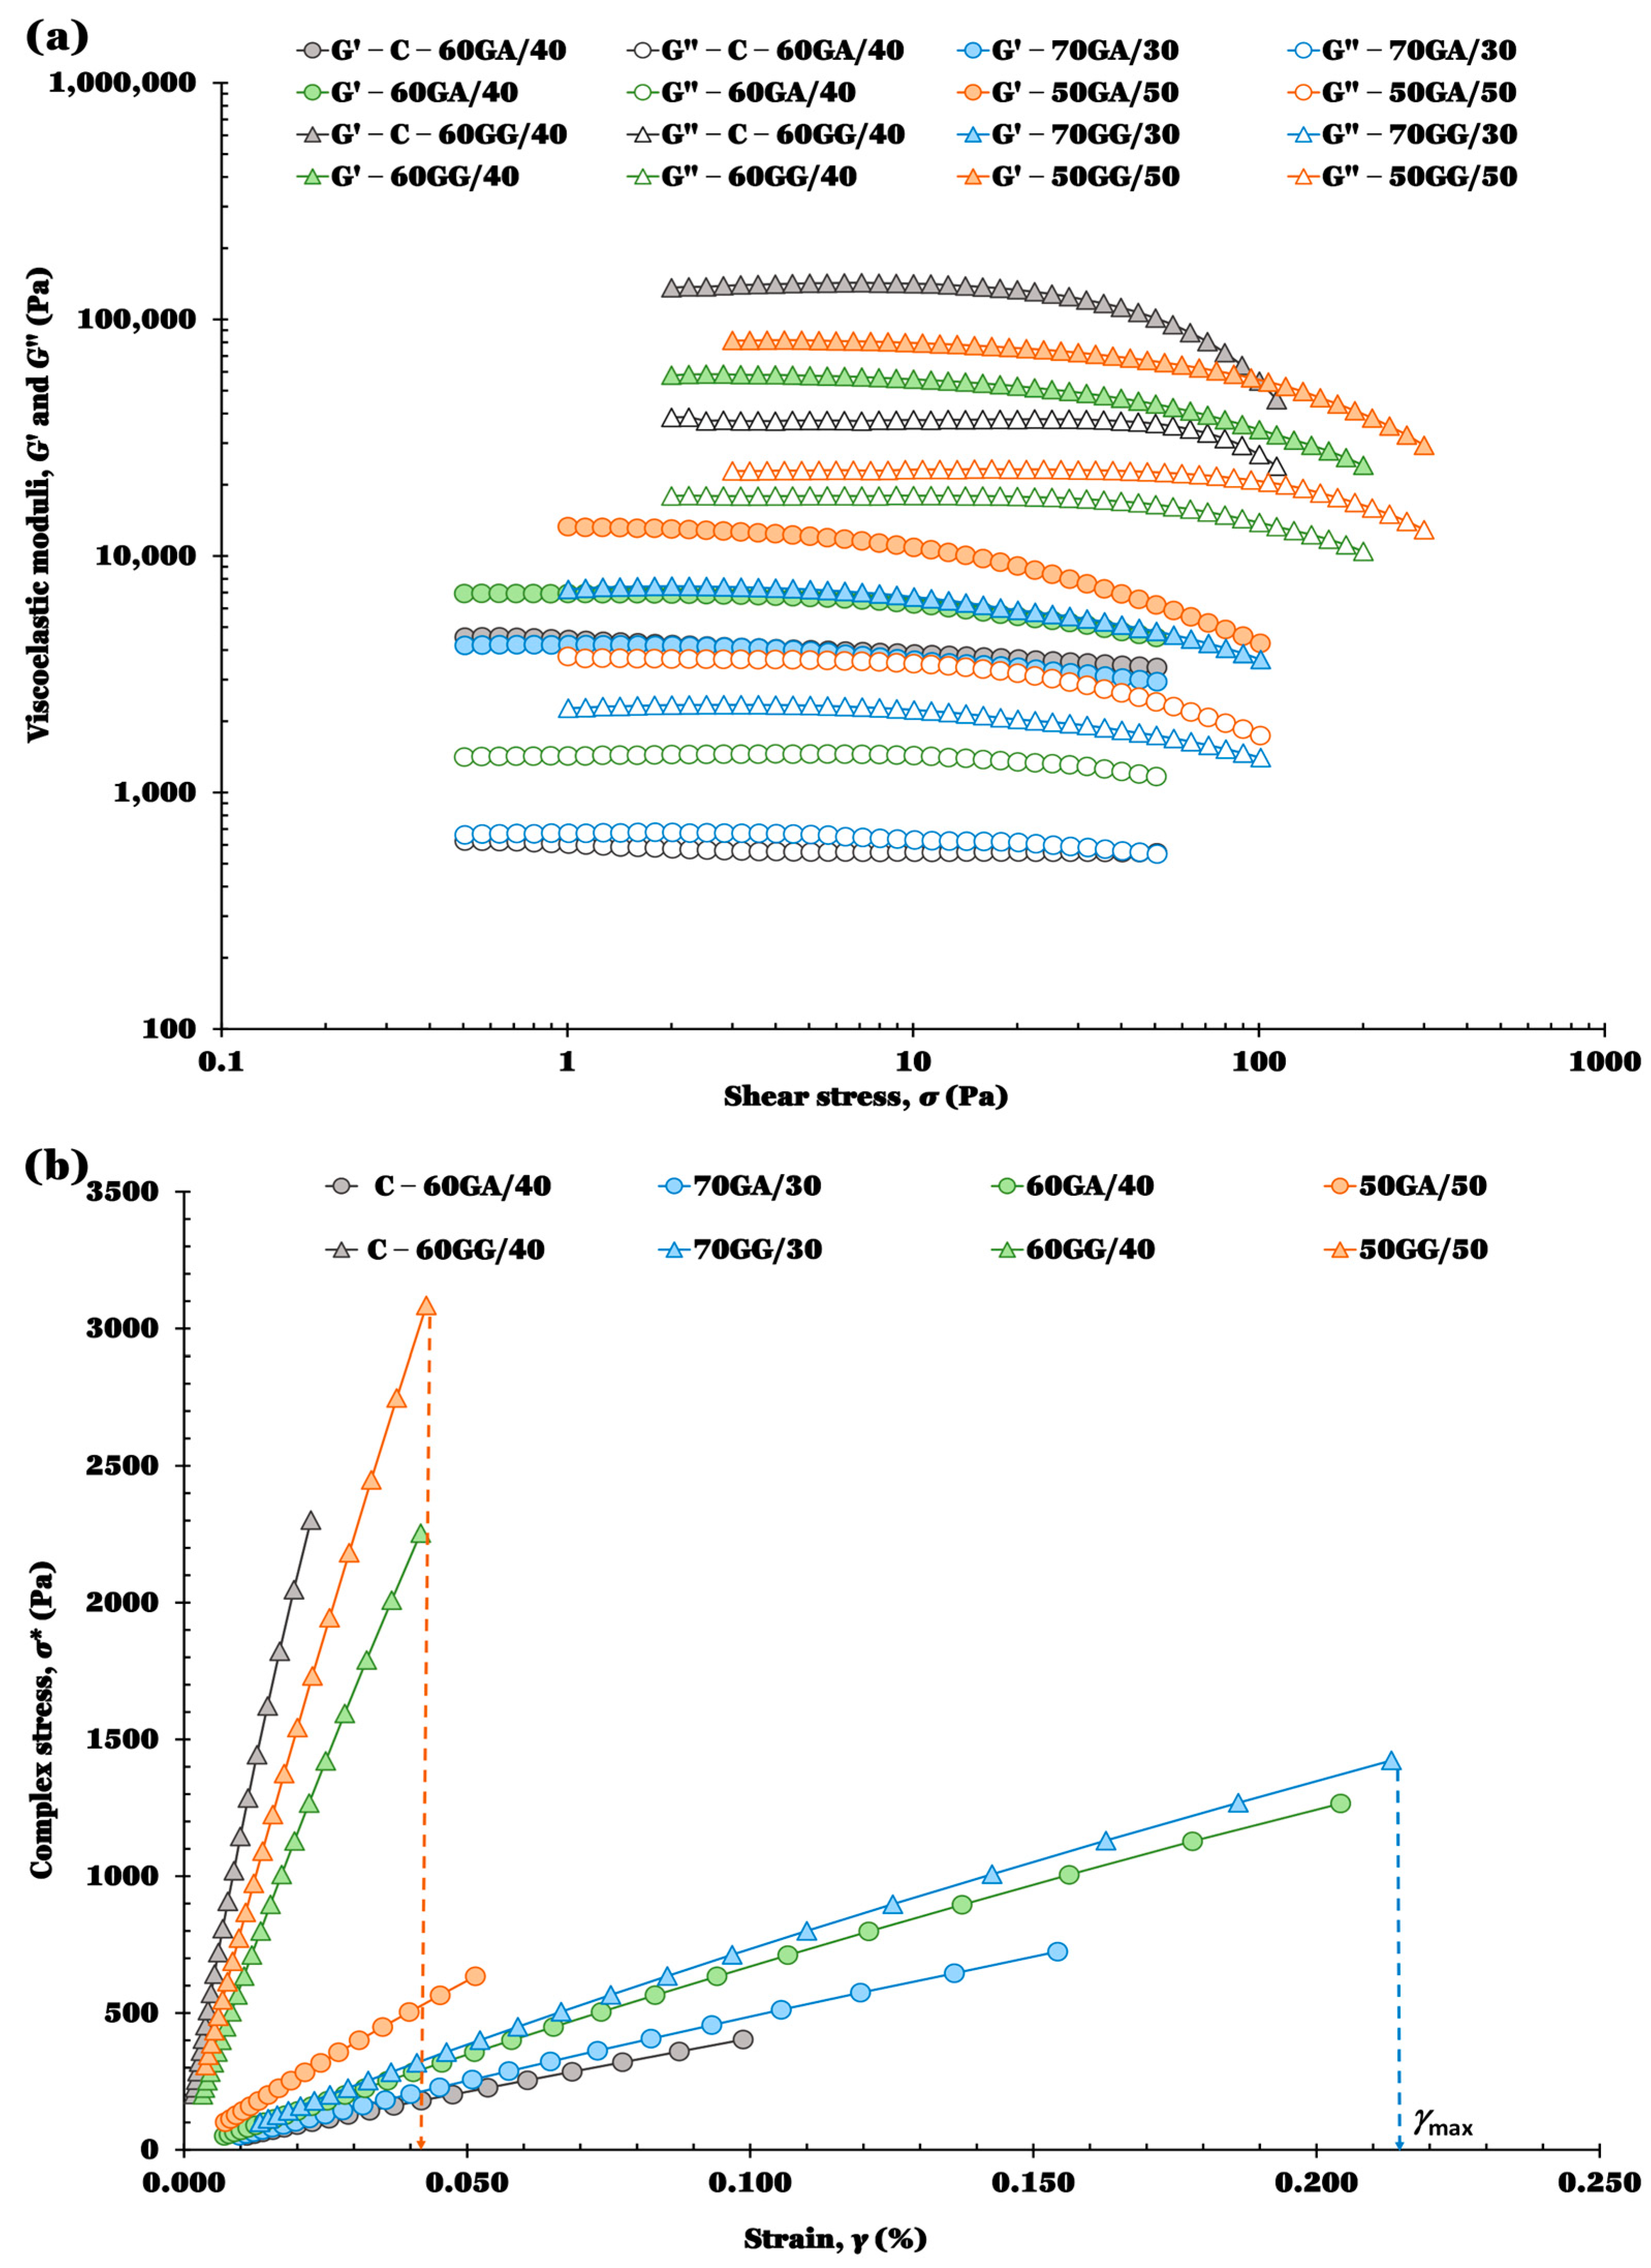
The viscoelastic properties of the BGs were first assessed through stress sweep tests (Figure 1) to determine the linear viscoelastic region (LVR) limits. All formulations showed a predominant solid-like behavior within this region (G′ > G″, tan δ < 1), confirming their classification as weak gels [14]. BGs containing GG exhibited substantially higher G′ and G″ values than those formulated with GA, reflecting the formation of a more rigid and cohesive polysaccharide-based network [4,6,12]. This difference reflects the combined influence of polymer type and the concentrations typically required for effective gelation of GA and GG systems. This response is characteristic of gellan systems, where the ionic double-helix aggregation, a structural mechanism widely reported for GG systems [12], and crystalline domains from BW or other oleogelators contribute to stiff, brittle structures [8,21], as supported by the BW crystals observed under polarized light microscopy in this study.
For both hydrogelifiers, G′ and G″ values decreased as the HG fraction increased (70/30) compared to the 60/40 and 50/50 ratios (Figure 1a). These differences arise from the combined effects of hydrogelifier type and HG/OG ratio, which modulate the internal architecture of the BGs. Similar ratio-dependent transitions have been reported in GG–BW systems, where increasing the OG fraction reinforces the network through progressive crystal integration [4,28]. Overall, viscoelastic moduli increased as the water and hydrogelifier contents decreased in the HG phase, while the OPO, BW, and lecithin contents increased in the OG phase, as described in Section 4.2, consistent with the contribution of crystalline OG networks to BG rigidity [16,17,18]. In general, GG-based BGs behaved as stronger but more brittle systems, whereas GA-based BGs were softer and more deformable, reflecting the contrast between rigid ionic polysaccharide networks and more dissipative protein-based gels [13,29].
The I-CFE and P-CFE contents were fixed at 30% in the HG and 1% in the OG, respectively, as detailed in Section 4.2. Thus, for a given HG/OG ratio, BGs formulated with GA or GG shared the same OG composition, and the rheological differences arose solely from the water content and the type and concentration of polymer in the HG. For instance, although the 50GA/50 BG contained less water (16.43%) and more polymer (3.57% GA) than the 50GG/50 BG (19.50% water, 0.50% GG), the latter exhibited much higher viscoelastic moduli, highlighting the superior gel-forming capacity and stiffness of GG-based HGs [13,15,29]. Similar behavior has been widely reported in gellan systems, where even low GG concentrations generate dense, highly elastic networks that surpass protein-based HGs in rigidity [4,25].
At the 60/40 ratio (Figure 1), extract-free BGs (control formulations) showed contrasting behaviors depending on the hydrogelifier. In GA systems, the control 60GA/40 exhibited lower viscoelastic moduli than the extract-loaded BG, suggesting that I-CFE and P-CFE reinforced the network, likely through additional polymer–polymer or polymer–solute interactions. This strengthening effect aligns with reports describing phenolic-induced enhancement of protein gels [13,29]. Conversely, in GG systems, the control 60GG/40 displayed higher moduli than the extract-loaded BG and even exceeded the 50GG/50 formulation, indicating that the extracts did not reinforce the GG network. Instead, they may have interfered with OG crystallinity or with GG ionic crosslinking, yielding slightly weaker structures—an effect previously observed when solutes disrupt crystal packing or ionic associations in GG-based BGs [21,25].
Table 1 summarizes the critical rheological parameters defining the LVR of the BGs. Control formulations at the 60/40 ratio (without extracts) are included only as reference values and were not considered in the statistical analysis. They provide baseline mechanical profiles for GA- and GG-based systems. The maximum stress (σmax) and strain (γmax) indicate the mechanical limits before structural failure, while tan δmax reflects the elastic–viscous balance at the end of the LVR.
In GA systems, σmax values increased significantly from 50GA/50 to 60GA/40 (p < 0.05), indicating that a moderate rise in the HG fraction strengthened the network, but decreased again at 70GA/30 (p < 0.05), where the higher aqueous phase weakened the structure. γmax values followed the same significant pattern (p < 0.05), with 60GA/40 showing the highest deformation tolerance. Conversely, tan δmax values decreased significantly with increasing HG content (p < 0.05), reflecting a more elastic response. In GG systems, σmax values increased significantly from 70GG/30 to 50GG/50 (p < 0.05), confirming that higher OG content consistently reinforced the network. γmax values remained low for 50GG/50 and 60GG/40 (no significant difference between them), indicating brittle behavior, whereas 70GG/30 showed a higher γmax value due to its greater water content and lower OG crystallinity. tan δmax values did not differ significantly among GG formulations, suggesting that the HG/OG ratio had little influence on the elastic–viscous balance in these systems.
For each HG/OG ratio, GG-based BGs showed significantly higher σmax values than GA-based ones (p < 0.05), confirming the greater rigidity of GG networks. By contrast, γmax values were consistently higher in GA systems (p < 0.05)—especially at 60/40—reflecting their greater deformability. Regarding tan δmax, values were significantly higher in GG formulations at 70/30 and 60/40 (p < 0.05), whereas no significant difference was observed at 50/50. Overall, these trends reinforce the contrast between the softer, more viscous GA networks and the stiffer, more brittle GG structures.
To further characterize the transition from linear to nonlinear behavior, the evolution of complex shear stress (σ*) with strain (γ) was examined (Figure 1b). The initial linear region of each σγ curve was fitted with Equation (1) to obtain parameters a and b, which describe the resistance at very small deformations. From Figure 1b, 70GG/30, 60GA/40, and 70GA/30 showed the greatest conformational flexibility (>0.150%), whereas 50GG/50 and 60GG/40 behaved as the most rigid systems.
GG-based BGs exhibited markedly higher a and b values than GA-based ones (p < 0.05), confirming their stronger resistance to deformation (Table 1). Within GG systems, both parameters increased with OG content, reflecting progressive network reinforcement. By contrast, the energy parameter E followed a different pattern: its highest value occurred in 70GG/30 due to its larger γmax value, indicating greater toughness and energy absorption before failure. A similar trend was observed in GA BGs. Although a values increased with OG proportion, E values did not; instead, 60GA/40 showed the highest E value, combining moderate stiffness with high deformation tolerance. This behavior aligns with reports showing that intermediate HG/OG ratios maximize toughness by balancing rigidity and flexibility. Conversely, 50GA/50 exhibited the highest a value but the lowest E value, indicating a rigid but brittle structure, while 70GA/30 was softer and more flexible, yielding intermediate E values.
Overall, these results indicate that 70GG/30, 60GA/40, and 70GA/30 do not behave as purely stiffness-driven systems but instead achieve a balance between rigidity and deformability that enhances their capacity to absorb mechanical energy.

2.1.2. Frequency Sweep Tests

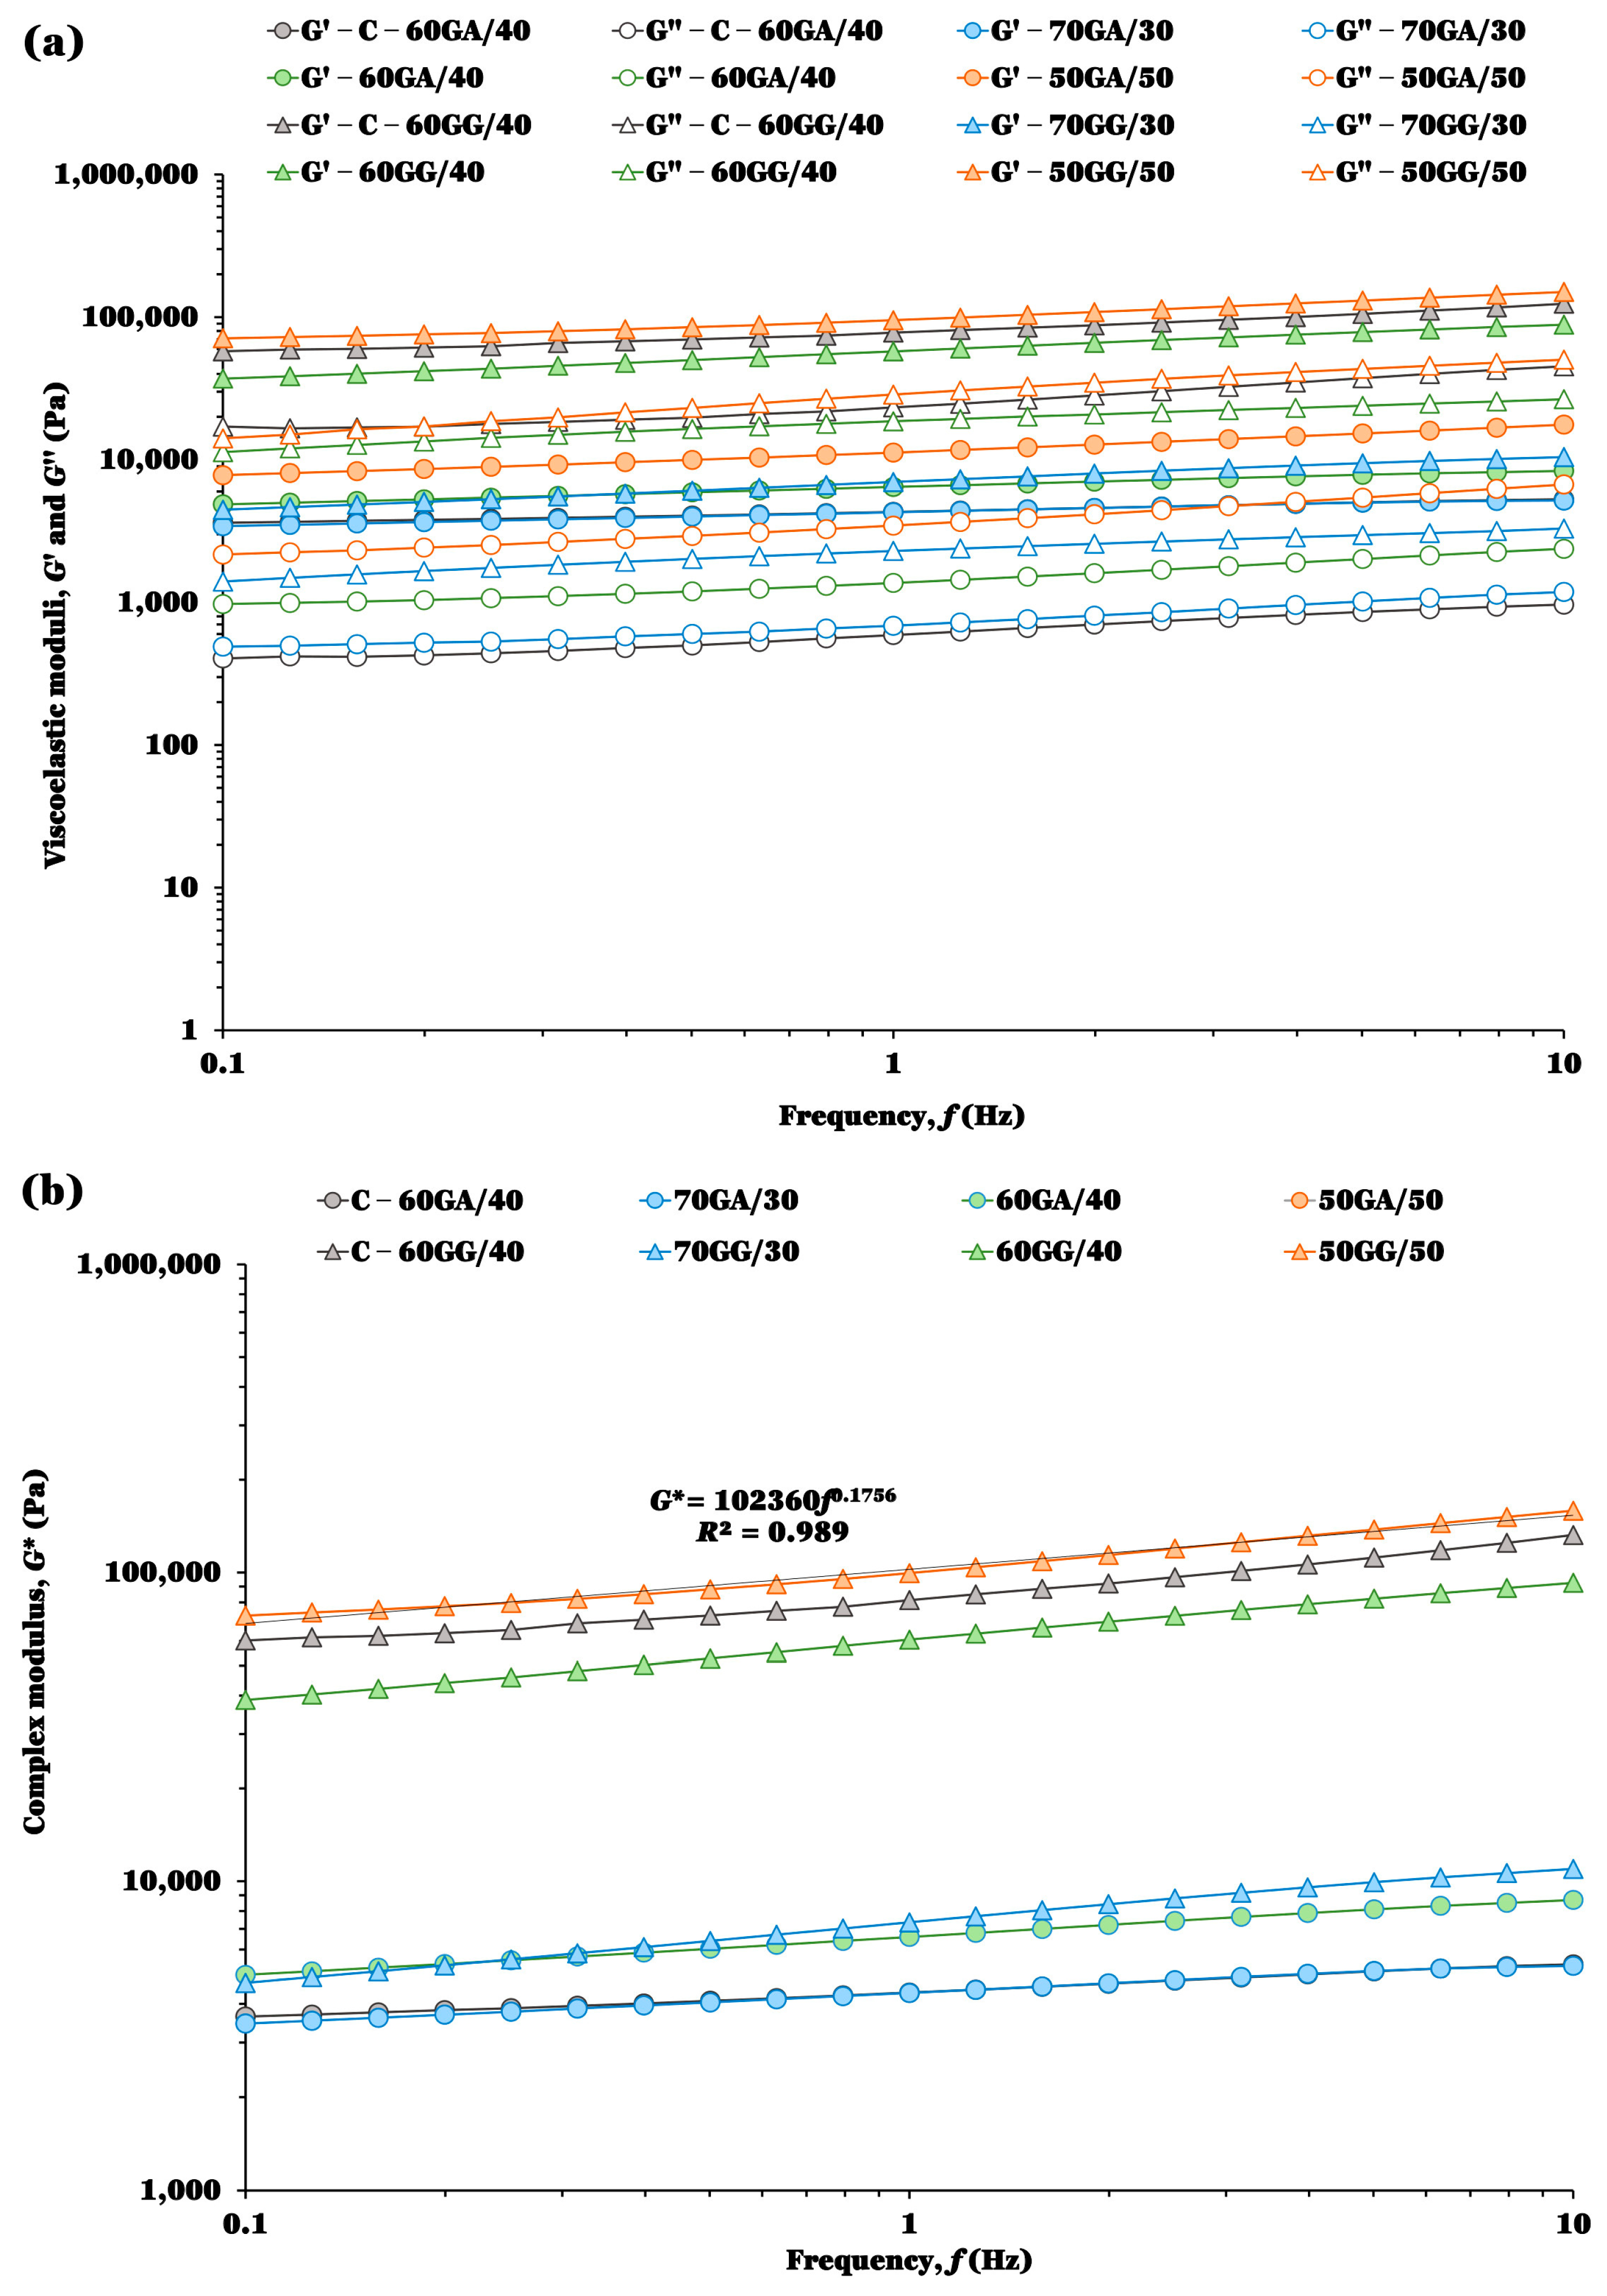
Frequency sweep measurements provided further insight into the viscoelastic behavior of the BGs (Figure 2). In all formulations, G′ values exceeded G″ values across the tested range, confirming their gel-like nature. GG-based BGs showed only minor changes in the G′/G″ ratio, reflecting a frequency-insensitive, strongly elastic network typical of gellan systems reinforced by double-helix junction zones and crystalline OG domains [4,12]. By contrast, GA-based BGs exhibited a progressive widening of the G′–G″ gap as the HG fraction increased, indicating a shift toward more elastic behavior, consistent with protein-based composite gels [13].
Table 2 summarizes the mechanical spectra at 1 Hz and the weak-gel model parameters. As in the stress sweeps, the 60/40 controls (without extracts) are included only as reference values. Their behavior paralleled previous observations: the control 60GA/40 was softer than its extract-loaded counterpart, whereas the control 60GG/40 was markedly stronger—exceeding even 50GG/50 in several parameters. These opposite effects indicate that the extracts reinforce GA networks but slightly weaken GG ones, consistent with reports showing that phenolic compounds strengthen protein-based gels but may interfere with crystallinity or ionic crosslinking in GG systems [21].
Increasing the OG fraction reinforced both systems, but with distinct patterns. In GA BGs, G′, G″ and η* values increased significantly with OG content (p < 0.05), while tan δ values also rose significantly (p < 0.05), indicating that stiffness gains were accompanied by higher viscous dissipation. This trend mirrors the stress-sweep results, where 50GA/50 behaved as a stiff but less elastic formulation, whereas 60GA/40 maintained a more balanced profile [4]. In GG BGs, G′ and G″ values increased significantly from 70GG/30 to 50GG/50 (p < 0.05), but tan δ values remained nearly constant (no significant differences), confirming the inherently stable and elastic nature of GG networks [30]. η* values followed the same significant trend (p < 0.05), particularly in 50GG/50, which formed the most cohesive structure.
The mechanical spectra of all BGs were accurately fitted to the weak-gel model (Figure 2b). The linear log G*–log f dependence confirmed that their viscoelastic response was governed by interacting flow units, a characteristic of partially interpenetrated biphasic gels [31,32]. High R2 values (≥0.984) validated the applicability of the model, in agreement with previous reports on GG–BW bigels [4].
In GA-based BGs (Table 2), the interaction strength A increased significantly with OG content (p < 0.05), whereas z values decreased significantly (p < 0.05). Since the frequency exponent is 1/z, lower z values indicate stronger frequency dependence and mechanically stiffer but less extended networks. Thus, the significant decrease in z value from 70GA/30 to 50GA/50 reflects a transition toward fewer cooperative flow units and a more compact, rigid structure, consistent with GA composite gels where reduced aqueous structuring enhances stiffness [13]. In GG-based BGs, A values also increased significantly with OG proportion (p < 0.05), but z values remained low and nearly constant (no significant differences), confirming that GG networks maintain a similar degree of structural extension regardless of composition. This invariance is typical of GG systems, where the ionic double-helix network remains structurally dominant even when the OG phase increases [6,21].
At equivalent HG/OG ratios, GG-based BGs exhibited significantly higher G′, G″, η*, and A values than GA-based ones (p < 0.05), confirming that GG forms a more cohesive and mechanically robust network even at lower polymer concentration. By contrast, GA formulations—particularly 70GA/30 and 60GA/40—showed significantly higher 1/z values (p < 0.05), reflecting more deformable and structurally dynamic networks with a larger number of interacting flow units. These differences highlight the dominant role of the hydrogelator in defining the mechanical identity of the BGs, consistent with comparative studies of protein- and polysaccharide-based hydrogels [13,29].
Taken together, the combined analysis of frequency sweeps and weak-gel modeling reinforces the structural trends identified in the LVR. GG-based BGs form strong, densely connected networks with low frequency dependence, whereas GA-based BGs exhibit weaker but more flexible architectures. Notably, formulations such as 70GG/30, 60GA/40, and 70GA/30 also stood out in the stress sweep tests due to their higher energy storage capacity (E). This convergence indicates that these BGs achieve a distinct balance between rigidity and deformability, combining elastic dominance with enhanced structural adaptability. Such balanced architectures have been associated with improved performance in sequential release of hydrophilic and lipophilic compounds [15,25].

2.2. Flow and Thixotropic Behavior of BGs

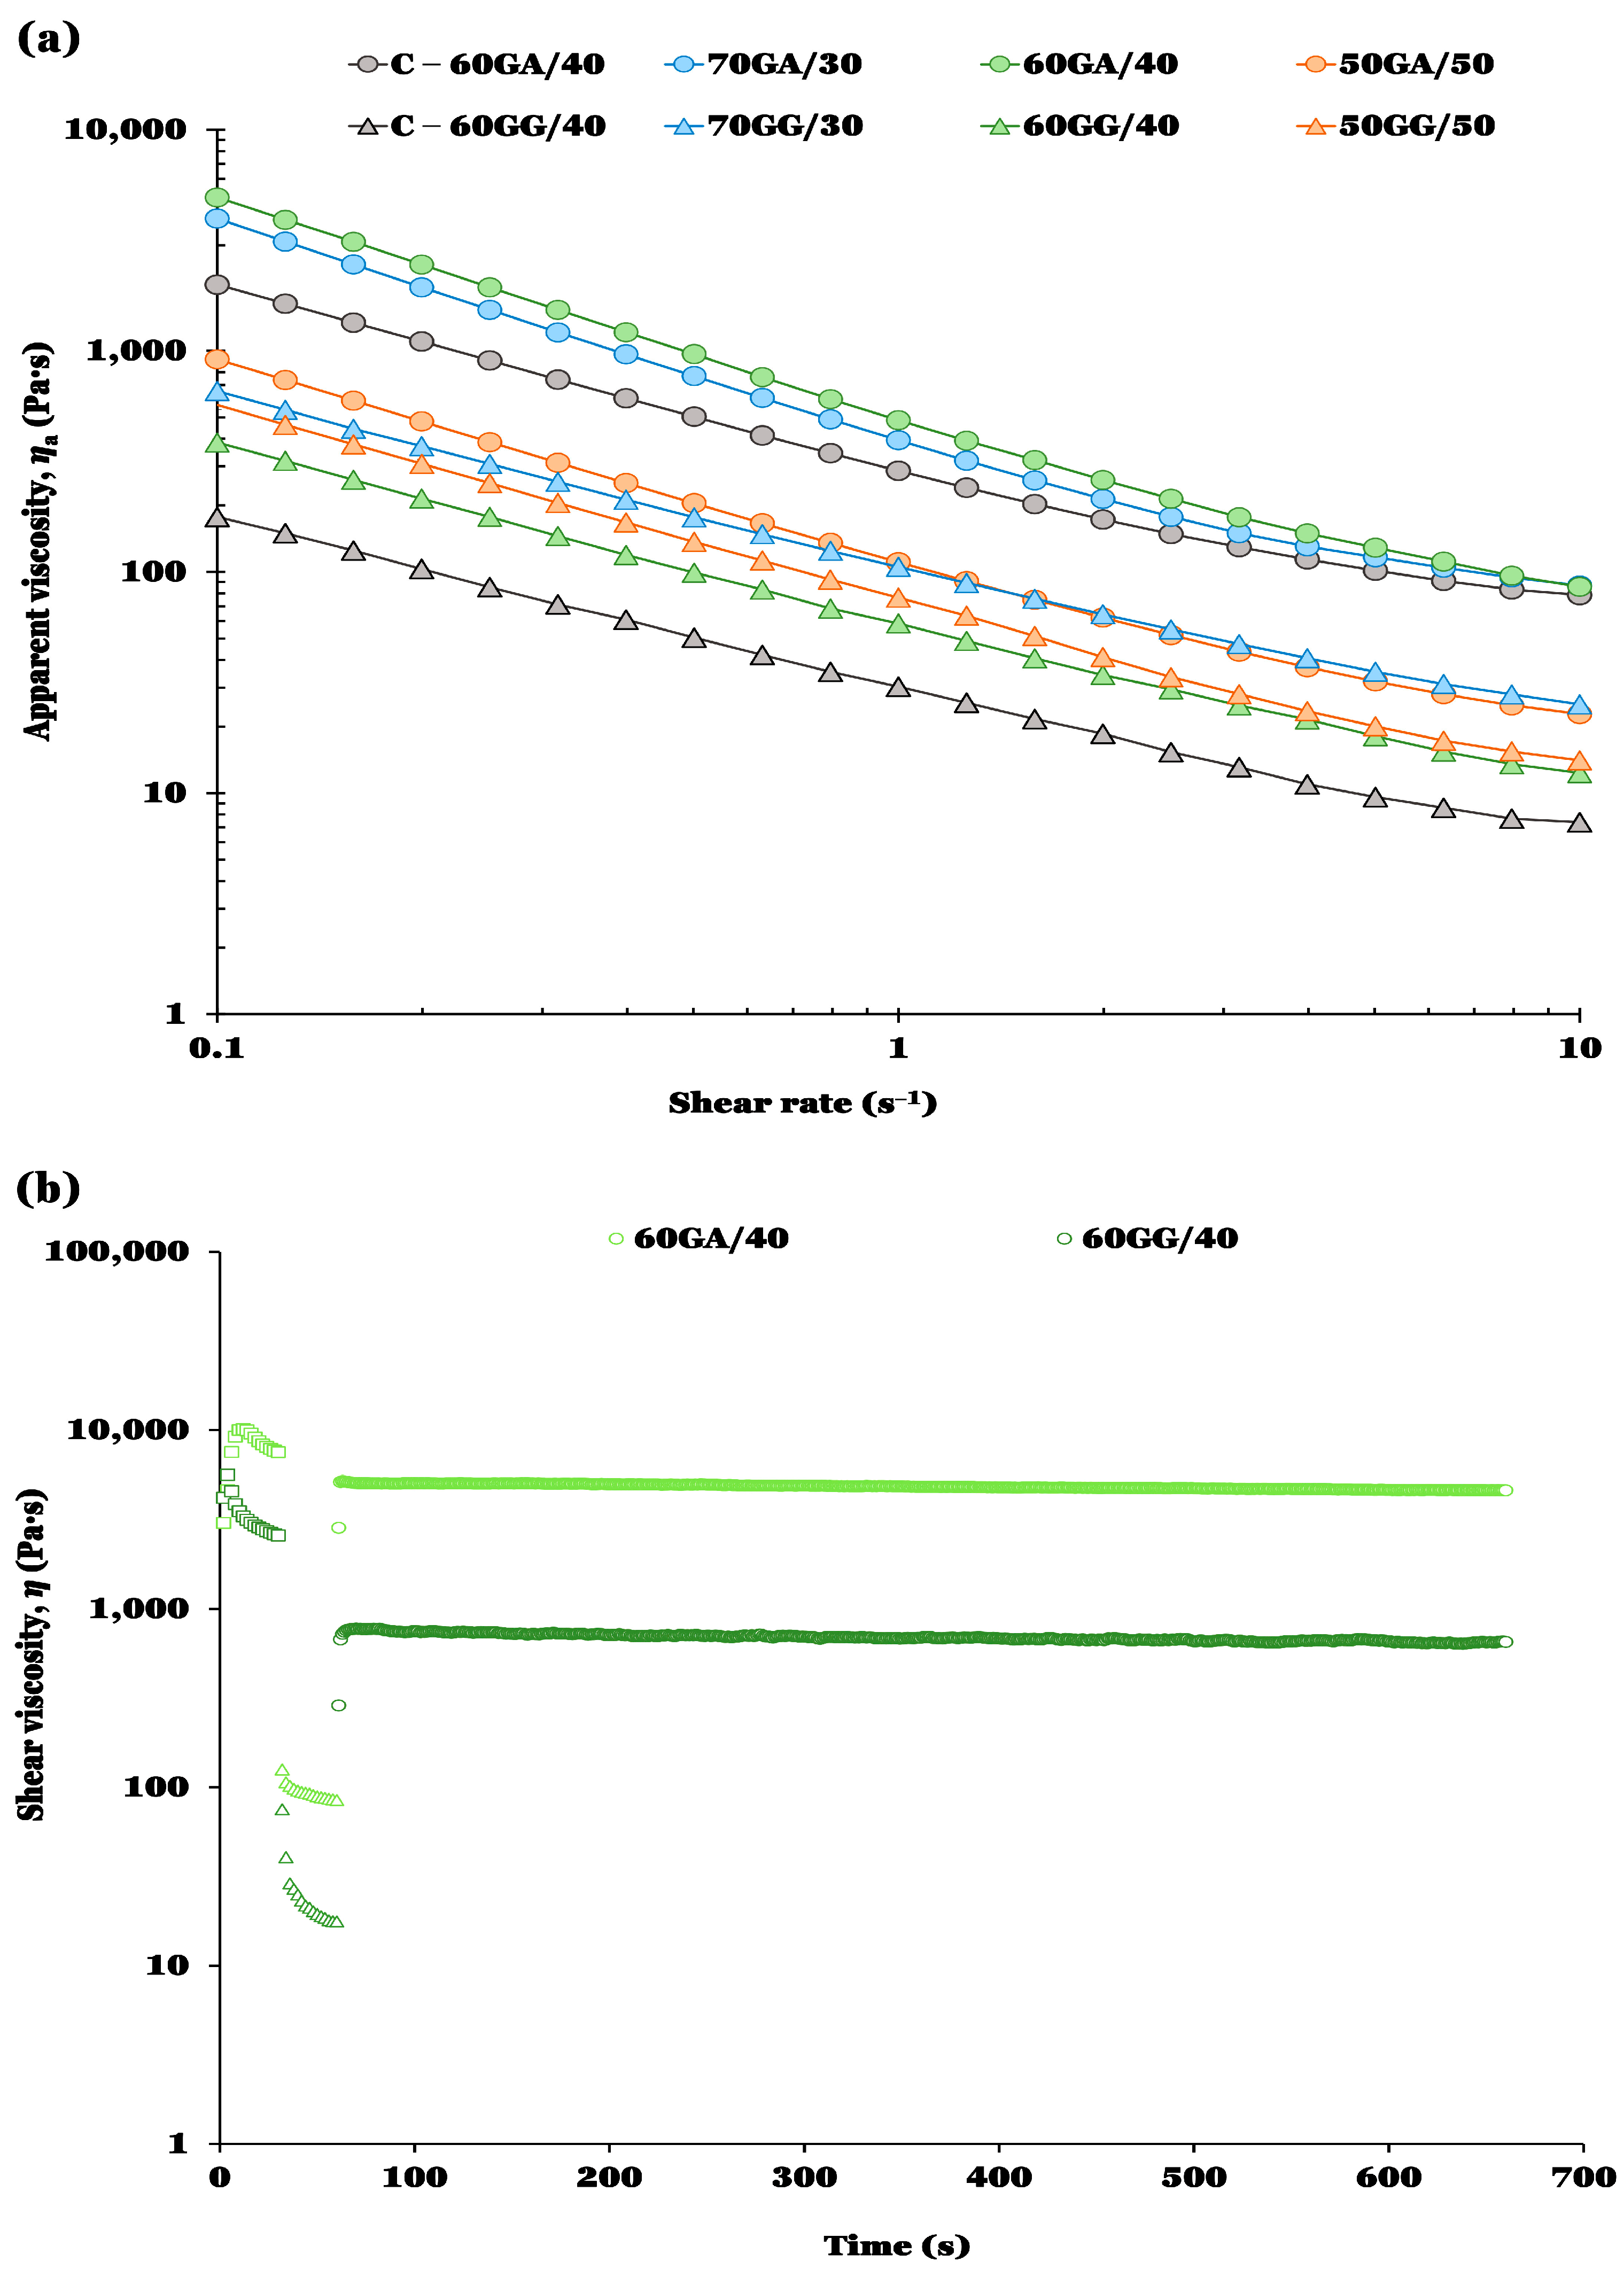
The flow behavior of the BGs was strongly influenced by both the hydrogelator and the HG/OG ratio. All formulations exhibited shear-thinning behavior (Figure 3a), consistent with the progressive disruption and alignment of biphasic networks under flow [16]. Across the entire shear-rate range, GA-based BGs showed substantially higher apparent viscosities than GG-based ones, reflecting the denser and more hydrated nature of GA networks [29].
Table 3 summarizes the steady-shear parameters. The 60/40 controls (without extracts) displayed lower viscosities than their extract-loaded counterparts, particularly in GG, indicating that the extracts enhanced flow resistance in both systems, with a stronger structuring effect in GG BGs [21]. Within the GA group, viscosity and the consistency index K followed the order 60GA/40 > 70GA/30 ≫ 50GA/50, confirming that the intermediate ratio produced the most viscous system. η0.1 and K values were significantly higher in 60GA/40 and 70GA/30 than in 50GA/50 (p < 0.05). The flow index n remained low in all GA formulations, with 60GA/40 showing the strongest pseudoplasticity; n values differed significantly among GA ratios (p < 0.05). The sharp decrease in viscosity and K values in 50GA/50 reflects the sensitivity of gelatin networks to water availability: reduced aqueous phase limits triple-helix formation and weakens the network [13].
GG-based BGs showed a different pattern. 70GG/30 exhibited the highest viscosities, consistent with its larger HG fraction, whereas 60GG/40 showed the lowest values due to dilution of the GG network. η0.1 and η10 values were significantly higher in 70GG/30 than in 60GG/40 and 50GG/50 (p < 0.05), while no significant difference was observed between 60GG/40 and 50GG/50. The 50GG/50 formulation displayed intermediate viscosity but the lowest n value; the n value was significantly lower in 50GG/50 compared to 70GG/30 and 60GG/40 (p < 0.05). These trends align with reports showing that increasing OG can reduce viscosity by diluting the HG network and increasing droplet mobility [33]. Conceptually, these results highlight a key distinction between hydrogelators: GG forms rigid, crystal-reinforced networks that dominate oscillatory behavior, whereas GA networks—more hydrated and deformable—generate higher viscous resistance under steady shear.
Figure 3b illustrates the thixotropic behavior of the BGs using the 60/40 formulations as representative examples. All samples showed a pronounced viscosity drop under high shear followed by rapid recovery once the shear rate returned to 0.1 s−1, indicating largely reversible structural breakdown. Recovery values (Table 3) further highlight the influence of formulation variables. In GA BGs, recovery followed the order 60GA/40 ≈ 70GA/30 ≫ 50GA/50; recovery was significantly lower in 50GA/50 than in 60GA/40 and 70GA/30 (p < 0.05). In GG BGs, recovery followed the order 70GG/30 > 50GG/50 > 60GG/40; recovery was significantly lower in 60GG/40 than in 70GG/30 and 50GG/50 (p < 0.05). The lowest recovery in 60GG/40 suggests that this intermediate ratio produces the least resilient structure, likely because neither phase dominates the network sufficiently to sustain integrity after deformation. Overall, GG systems showed more moderate and composition-independent recovery, consistent with their rigid, crystal-reinforced networks, which resist deformation but reorganize slowly [4].
When comparing hydrogelators within each ratio, GA BGs exhibited significantly higher viscosities, higher K values and higher recovery percentages than GG BGs (p < 0.05), except at 50/50, where GG showed slightly higher recovery (no significant difference). This general superiority of GA in structural rebuildability reflects its ability to form highly hydrated and flexible networks capable of rapid re-association after deformation [13]. The exceptional recovery of 60GA/40—the highest among all formulations—highlights the presence of an optimally balanced biphasic structure in which the GA network remains dominant while the OG phase contributes mechanical reinforcement without excessively hindering reorganization.
Collectively, these findings reinforce that network flexibility, hydration level, and HG dominance are key determinants of recoverability in biphasic gel systems, in agreement with recent studies on GG- and BW-based BGs [21,25].

2.3. Textural Properties of BGs, HGs, and OGs

Penetration tests were performed on BGs, HGs, and OGs at 5 °C to evaluate their large-deformation mechanical behavior. Hardness (F10), work of penetration (W10), breaking force (FB), and breaking slope (SB) were obtained, providing complementary information on resistance, cohesiveness, and fracture behavior. In both GA and GG matrices, the 60/40 controls showed lower hardness and work than their extract-loaded counterparts, indicating that the extracts reinforced the mechanical structure of BGs, HGs, and OGs, consistent with the strengthening effect of phenolic compounds in protein- and polysaccharide-based gels [13].
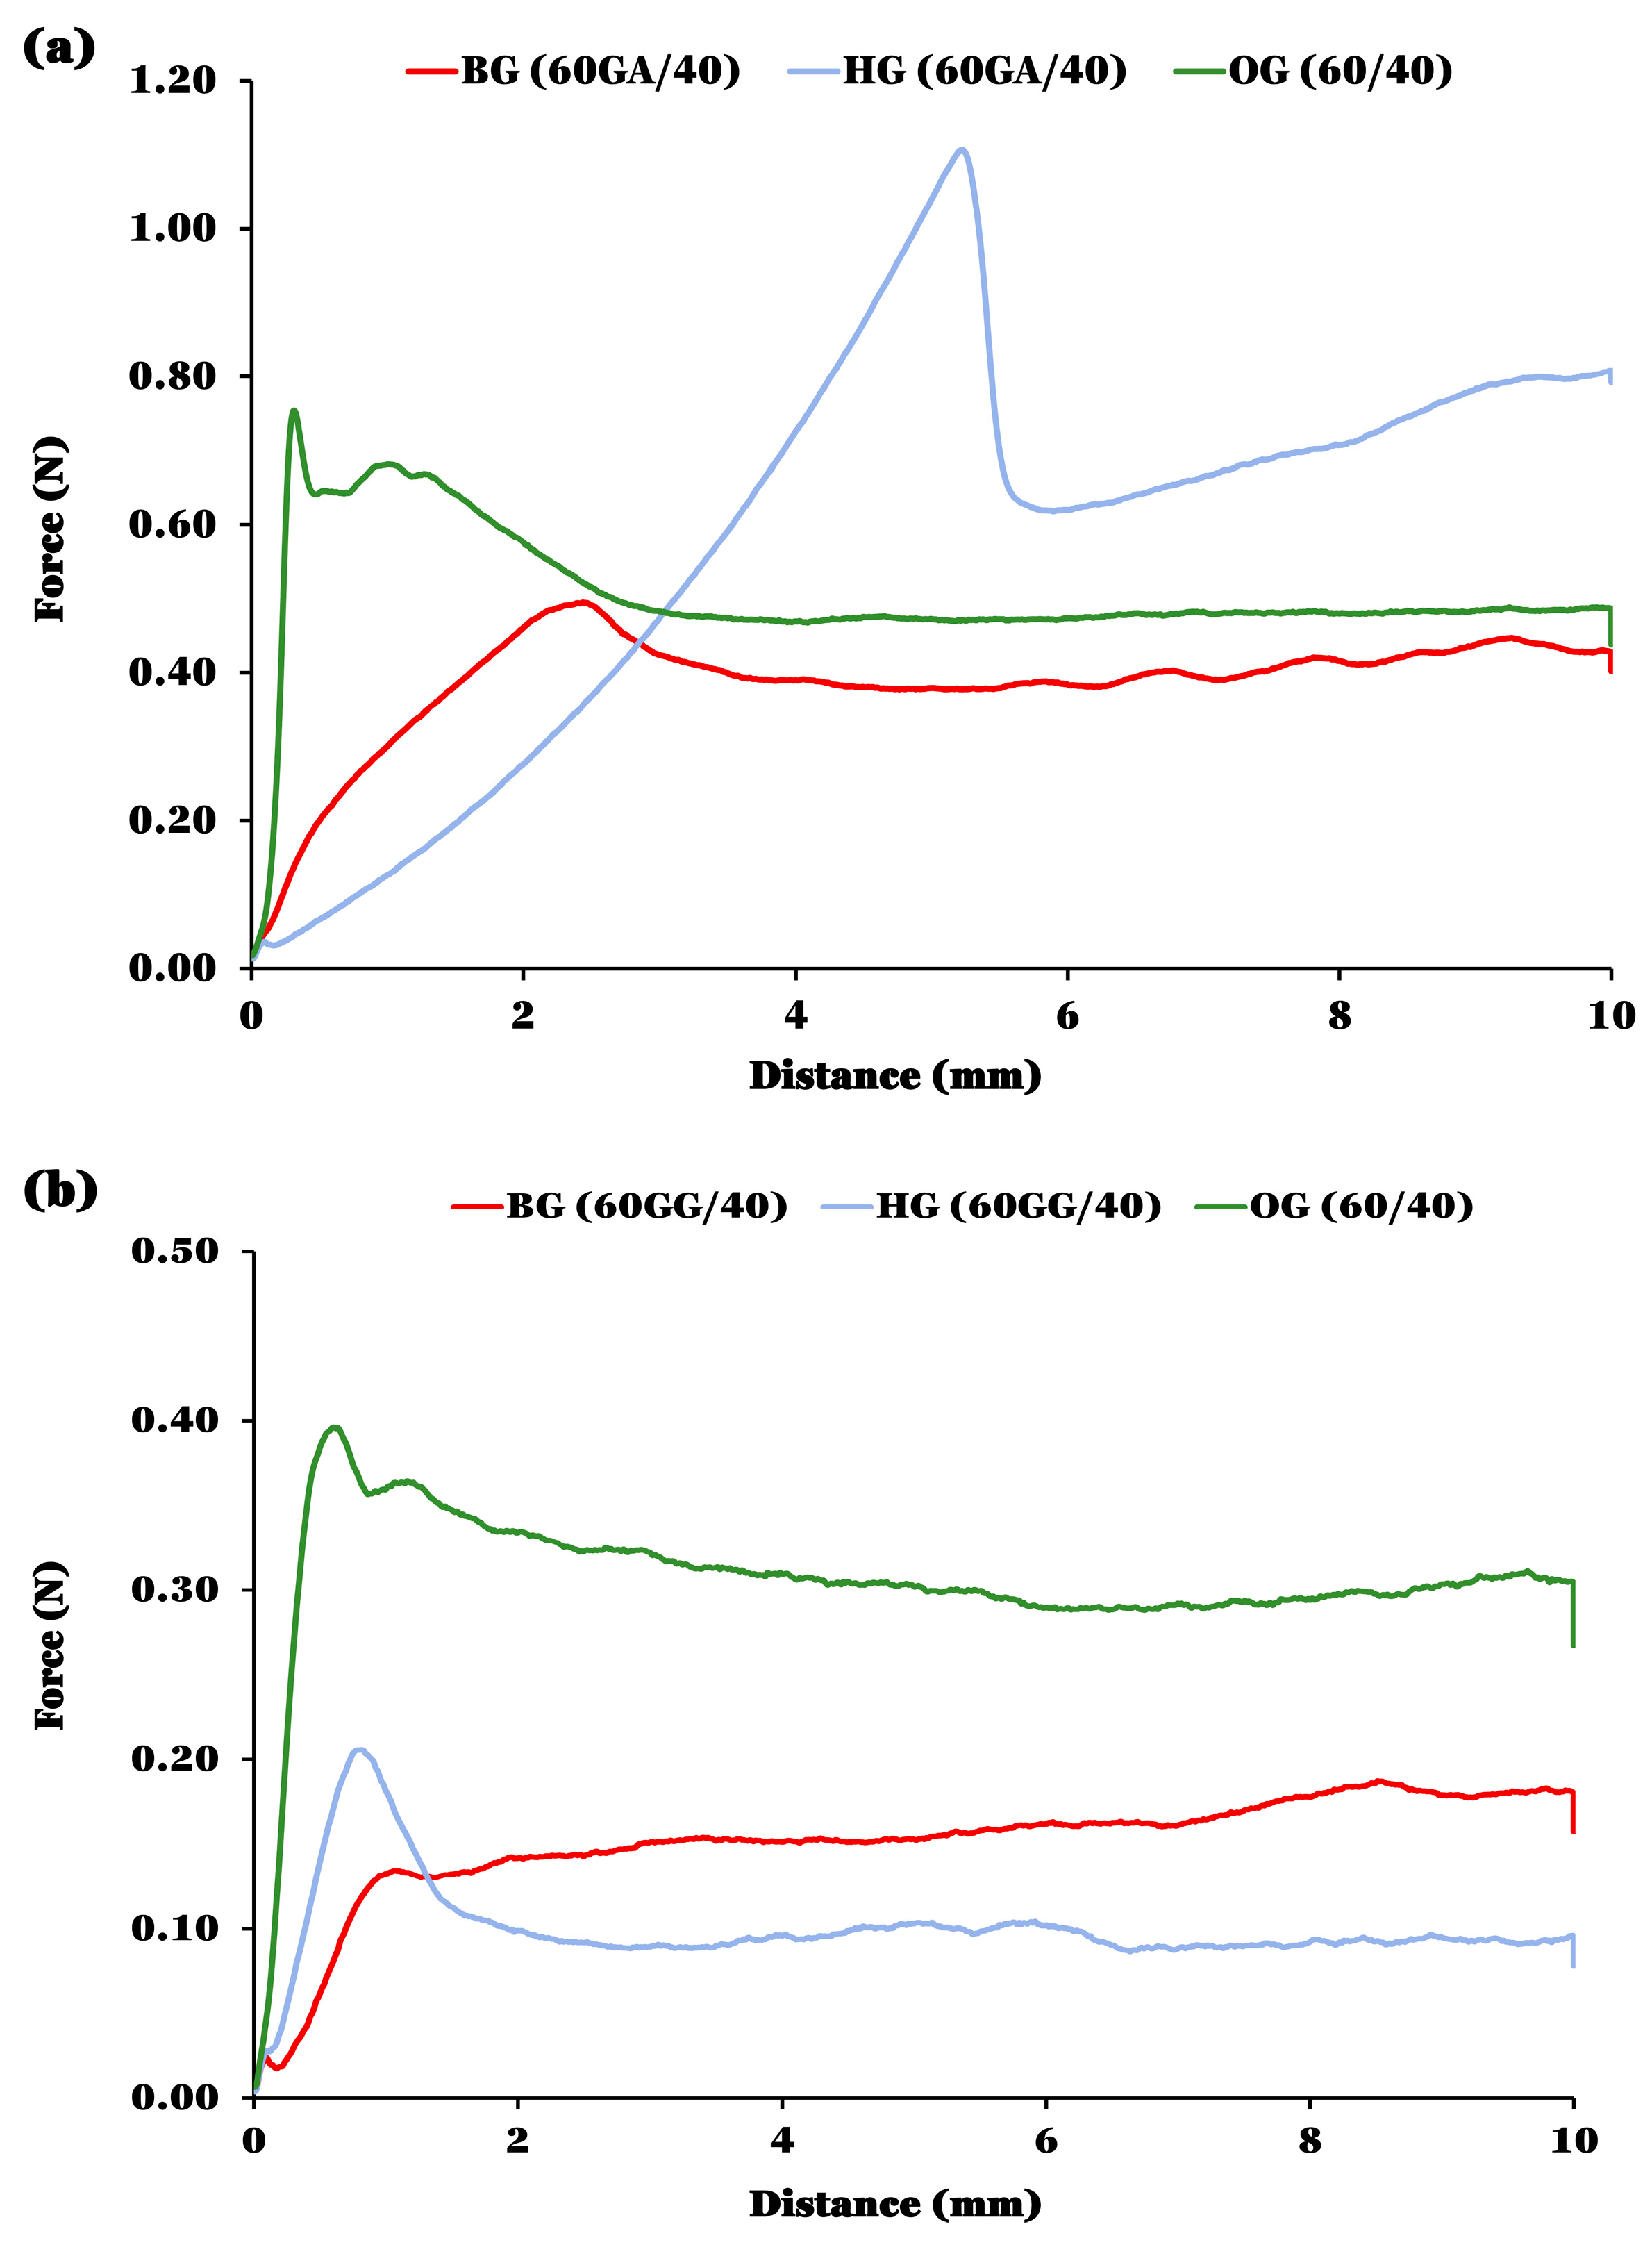
Figure 4 illustrates representative force–distance curves for the 60/40 systems. In GA matrices, the HG showed the highest forces and a smooth, continuous profile, whereas the OG exhibited the steepest initial slope due to BW crystals, and the BG displayed intermediate behavior. In GG matrices, the HG was much softer, the OG again showed the steepest slope, and the BG closely resembled the GG HG. These qualitative differences anticipate the quantitative trends and reflect the higher cohesiveness of GA networks compared with the softer, more brittle GG structures [4].
Table 4 summarizes the textural parameters for all systems. In GA-based BGs, all textural parameters (F10, W10, FB, and SB) decreased from 70GA/30 to 50GA/50, with significant differences between 50GA/50 and the two higher-HG formulations (p < 0.05), reflecting the weakening of the GA network as water and gelatin contents decreased. The OG phase did not compensate for this loss, as BW crystals form a discontinuous dispersed phase within GA matrices [18]. This hydration-dependent weakening is characteristic of GA systems, where reduced water availability limits triple-helix formation and decreases mechanical resistance [13]. By contrast, GG-based BGs showed a clear reinforcement effect with increasing OG fraction: 70GG/30 was the weakest, whereas 50GG/50 exhibited the highest hardness and stiffness. All textural parameters differed significantly across GG ratios (p < 0.05), reflecting the increasing continuity of the BW crystal network and its strong interaction with the GG matrix [9].
At all ratios, GA BGs exhibited significantly higher hardness, work of penetration, and breaking force than GG BGs (p < 0.05), reflecting the cohesive and hydrated nature of the GA network (Table 4). GG BGs transitioned from weak and brittle at high HG contents to rigid and crystal-reinforced at high OG contents. At the 50/50 ratio, both systems reached similar hardness values, with no significant difference between hydrogelators at this ratio, but through opposite mechanisms: GA BGs weakened due to HG disruption, whereas GG BGs strengthened due to OG continuity and crystal packing [29].
The behavior of the HGs reflected the intrinsic mechanical differences between GA and GG. GA HGs showed substantially higher F10, W10, and FB values than GG HGs, with significant differences between hydrogelators at 70/30 and 60/40 (p < 0.05). Reducing water content to 50/50 caused a marked decrease in all parameters, significantly lower than the values at 70/30 and 60/40 (p < 0.05), consistent with hydration-dependent weakening [14]. GG HGs were initially very soft at high water contents (70/30), but their mechanical resistance increased sharply as the HG fraction decreased; F10, W10, and FB values were significantly higher in HG50GG/50 than in HG70GG/30 and HG60GG/40 (p < 0.05), reflecting compaction of the ionically cross-linked GG network [34].
OGs exhibited the highest stiffness values among all phases, confirming the formation of a dense crystalline network typical of BW-structured lipid systems [18]. Variations in stiffness reflected differences in crystal packing and deformation modes, with significant differences among OG ratios (p < 0.05), consistent with the rigid, needle-like BW crystal networks described in previous studies [21].
Across all matrices, the extracts exerted a reinforcing effect, although the underlying mechanisms differed. In GA systems, the extracts increased SB significantly (p < 0.05) by enhancing network cohesiveness and energy dissipation, whereas in GG systems the increase reflected greater stiffness and fracture resistance due to the more rigid polysaccharide–crystal structure. This dual behavior aligns with reports showing that phenolic compounds strengthen protein networks through additional interactions, while in polysaccharide-based systems they may promote crystal packing or modify interfacial structuring [13].

2.4. Multivariate Analysis (CATPCA) of Rheological and Textural Behavior in GA and GG Systems

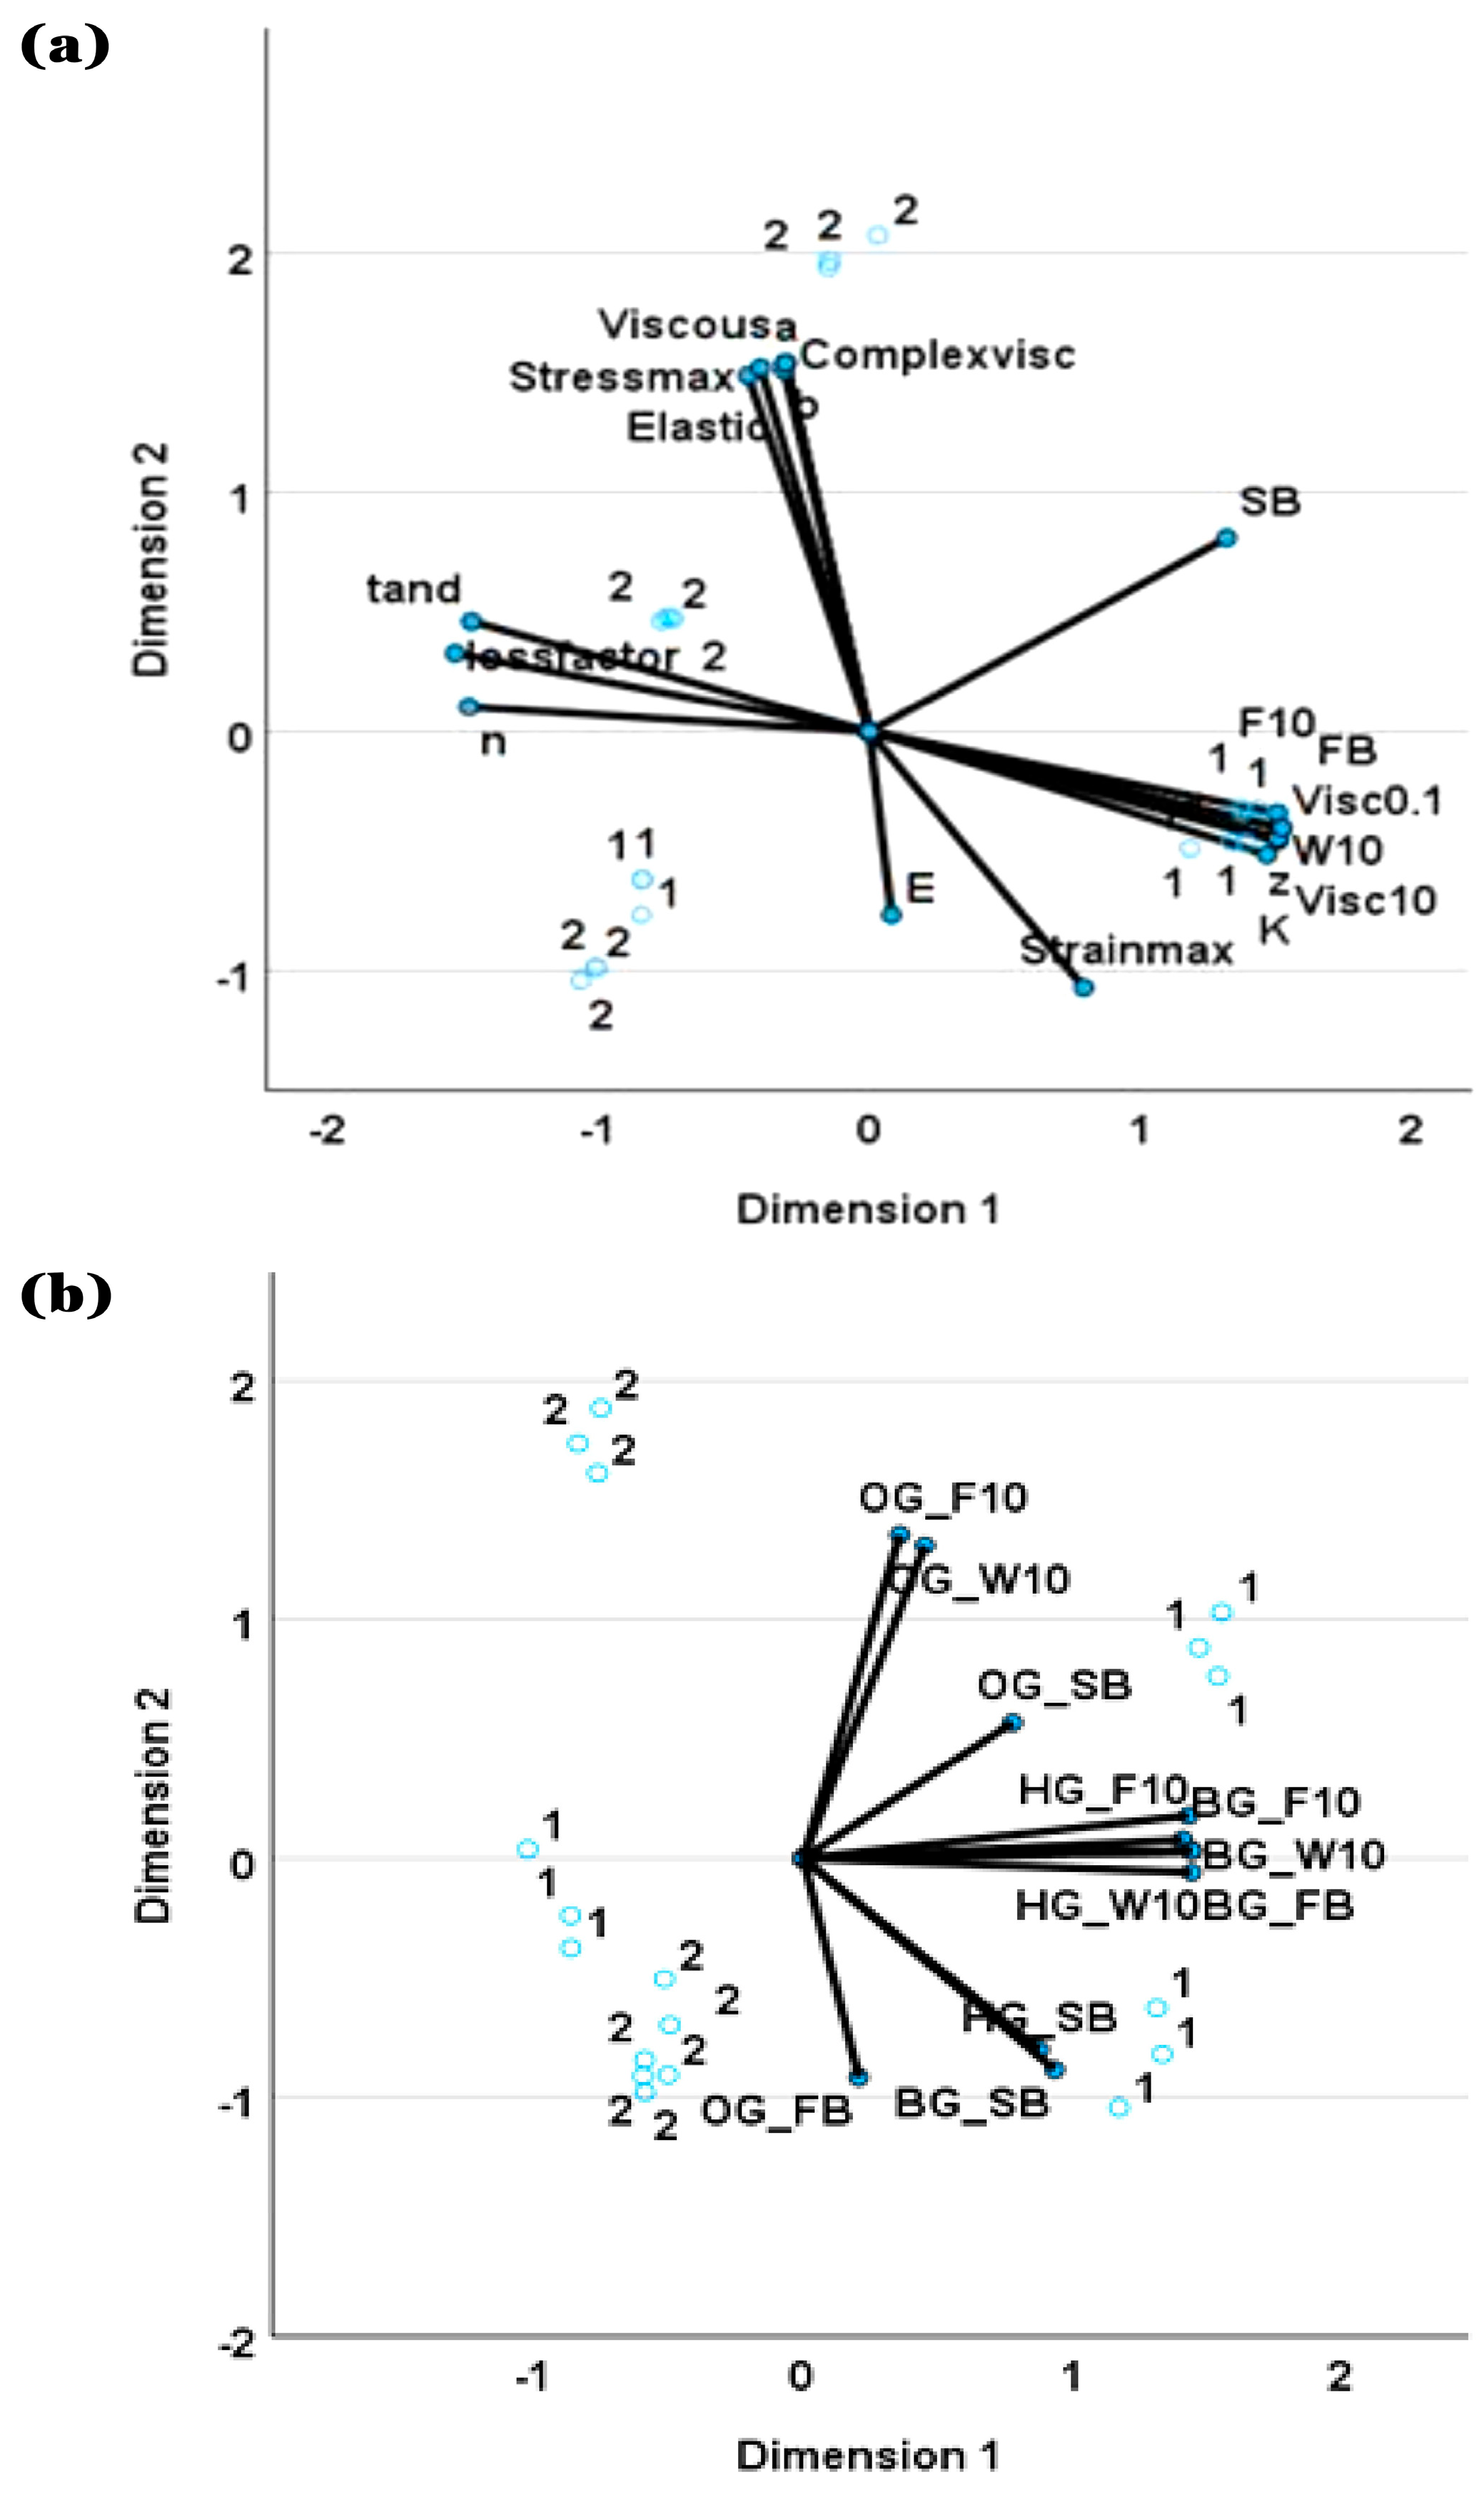
Figure 5a shows the CATPCA performed on all rheological and textural parameters of the extract-containing BGs (controls excluded to avoid compositional bias). The analysis revealed a clear separation between GA-based (GA = 1) and GG-based (GG = 2) BGs, with the first two dimensions explaining 92.8% of the variance (66.9% and 26.0%, respectively) and excellent internal consistency (Cronbach’s α = 0.996). This strong segregation aligns with previous reports describing the fundamentally different mechanical regimes of GA- and GG-structured bigels [13,29].
Dimension 1 represented a coupled penetration–viscosity–flow–recovery axis, with high positive loadings for penetration forces (F10, W10, FB, and SB), steady-shear viscosities (η10 and η0.1), K, recovery, and z, and negative loadings for n and tan δ. GA The 70GA/30 and 60GA/40 BGs scored positively, reflecting their higher viscosity, penetration resistance, and damping-dominated behavior, whereas 50GA/50 scored negatively, consistent with the hydration-dependent weakening of GA networks [14,29].
Dimension 2 captured oscillatory stiffness and elastic coherence, driven by σmax, parameters a and b, G′, G″, η*, and A. The 50GG/50 and 60GG/40 BGs scored positively, indicating more cohesive and rigid elastic architectures, while 70GG/30 scored negatively, consistent with its lower viscoelastic moduli. This pattern reflects the strong, frequency-insensitive elastic networks characteristic of GG and BW-based OGs [4,12].
Overall, the CATPCA demonstrates that GA and GG BGs occupy two distinct mechanical regimes: GA systems are dominated by viscous dissipation, localized deformation resistance, and flow-related responses, whereas GG systems are defined by elastic stiffness, structural coherence, and oscillatory resilience. This multivariate separation reinforces the dual mechanical behavior identified in the univariate rheological and textural analyses and is consistent with the contrasting architectures of protein-based vs. polysaccharide-crystal networks [8,25].
Figure 5b shows the CATPCA of textural attributes from BGs, HGs, and OGs. Dimension 1 was associated with penetration forces and work of BGs and HGs, defining a localized deformation axis. Dimension 2 was driven by OG-specific variables, reflecting the crystalline structuring of OGs [18,21]. GA BGs spanned both sides of Dimension 1, with 50GA/50 being the softest and 60GA/40–70GA/30 being the firmest. GG BGs aligned mainly with Dimension 2: 50GG/50 and 60GG/40 clustered negatively due to higher OG rupture forces, whereas 70GG/30 shifted positively, co-locating with OG textural variables, consistent with the increasing contribution of OG crystal packing as the OG fraction rises [6,8].

2.5. Correlation Analysis Within GA and GG Mechanical Regimes

Because CATPCA revealed two clearly differentiated mechanical regimes, correlation analyses were performed separately for GA and GG BGs to avoid masking system-specific structure–function relationships. The resulting patterns confirmed that GA and GG exhibit fundamentally distinct mechanical architectures linking oscillatory, steady-shear and penetration responses. GA BGs (Table S1) showed an exceptionally coherent architecture in which critical amplitude parameters (σmax, γmax, a, b, and tan δmax) correlated almost perfectly with linear viscoelastic moduli and complex viscosity (G′, G″, and η*). This indicates that the linear network strongly governs nonlinear deformation. tan δmax emerged as a sensitive marker of structural weakening, displaying strong negative correlations with steady-shear viscosity (η10 and η0.1), consistency (K), recovery, the structural parameter z, and penetration resistance (F10, FB, SB, and W10). Thus, GA BGs with higher damping—particularly 50GA/50—exhibited lower viscosity and reduced textural strength. This tight coupling between damping, viscosity and failure is characteristic of protein-based gels, where viscous dissipation drives mechanical fragility [13,29].
GG BGs (Table S2) displayed a rigid, stiffness-dominated architecture. Stress-sweep parameters and linear viscoelastic moduli were nearly collinear (r ≈ 0.95–1.00), reflecting a monolithic network governed by elastic rigidity rather than damping. Unlike GA, tan δmax showed weak or moderate correlations with viscoelastic, flow and textural variables, indicating that damping plays a minor role in GG. Penetration resistance correlated strongly with oscillatory stiffness (σmax, a, b, G′, G″, and η*) and with steady-shear viscosities and consistency (η10, η0.1, and K), while the flow index n correlated negatively with penetration forces. This behavior is typical of GG-based systems, where ionic double-helix junction zones and crystalline fillers dominate mechanical performance [4,12].
Taken together, these results show that GA and GG represent two distinct mechanical regimes. GA exhibits a flexible but coherent architecture in which damping-related weakening tightly controls flow behavior and mechanical failure. By contrast, GG displays a stiffness-driven regime in which elastic rigidity governs both oscillatory and textural responses. This mechanistic divergence aligns with previous comparisons between protein-based and polysaccharide-based bigels [25,29].
Correlations between BG, HG, and OG penetration parameters (Tables S3 and S4) further support this dichotomy. Because OGs share the same formulation across all BGs, their internal variability is limited, and OG–OG correlations remain weak. This contrasts with the highly coherent responses of BGs and HGs, both of which rely on continuous HG networks. The heterogeneous crystalline structure of BW OGs contributes additional variability [17,18].
In GA systems (Table S3), BG penetration parameters correlated almost perfectly with HG parameters (r = 0.90–0.99), confirming that the HG phase is the primary determinant of BG texture. Significant BG–OG correlations were limited to SB and W10, indicating a modest secondary contribution of the OG consistent with the discontinuous distribution of BW crystals within GA matrices [6].
In GG systems (Table S4), BG–HG correlations were also extremely high (r = 0.91–0.99), reflecting a rigid architecture dominated by the GG network. However, all OG parameters showed significant negative correlations with BG texture (r = −0.806 to −0.877), demonstrating that the OG does not reinforce the structure and may even counteract the HG response. This antagonistic effect is consistent with reports that excessive OG disrupts the continuity of GG networks [4,28].
As a whole, the OG exerts a modest reinforcing effect in GA, whereas in GG it shows a consistently negative influence, reinforcing the structural divergence between protein-based and polysaccharide-based BGs [21,25].

2.6. Melting Points of BGs, OGs and BW

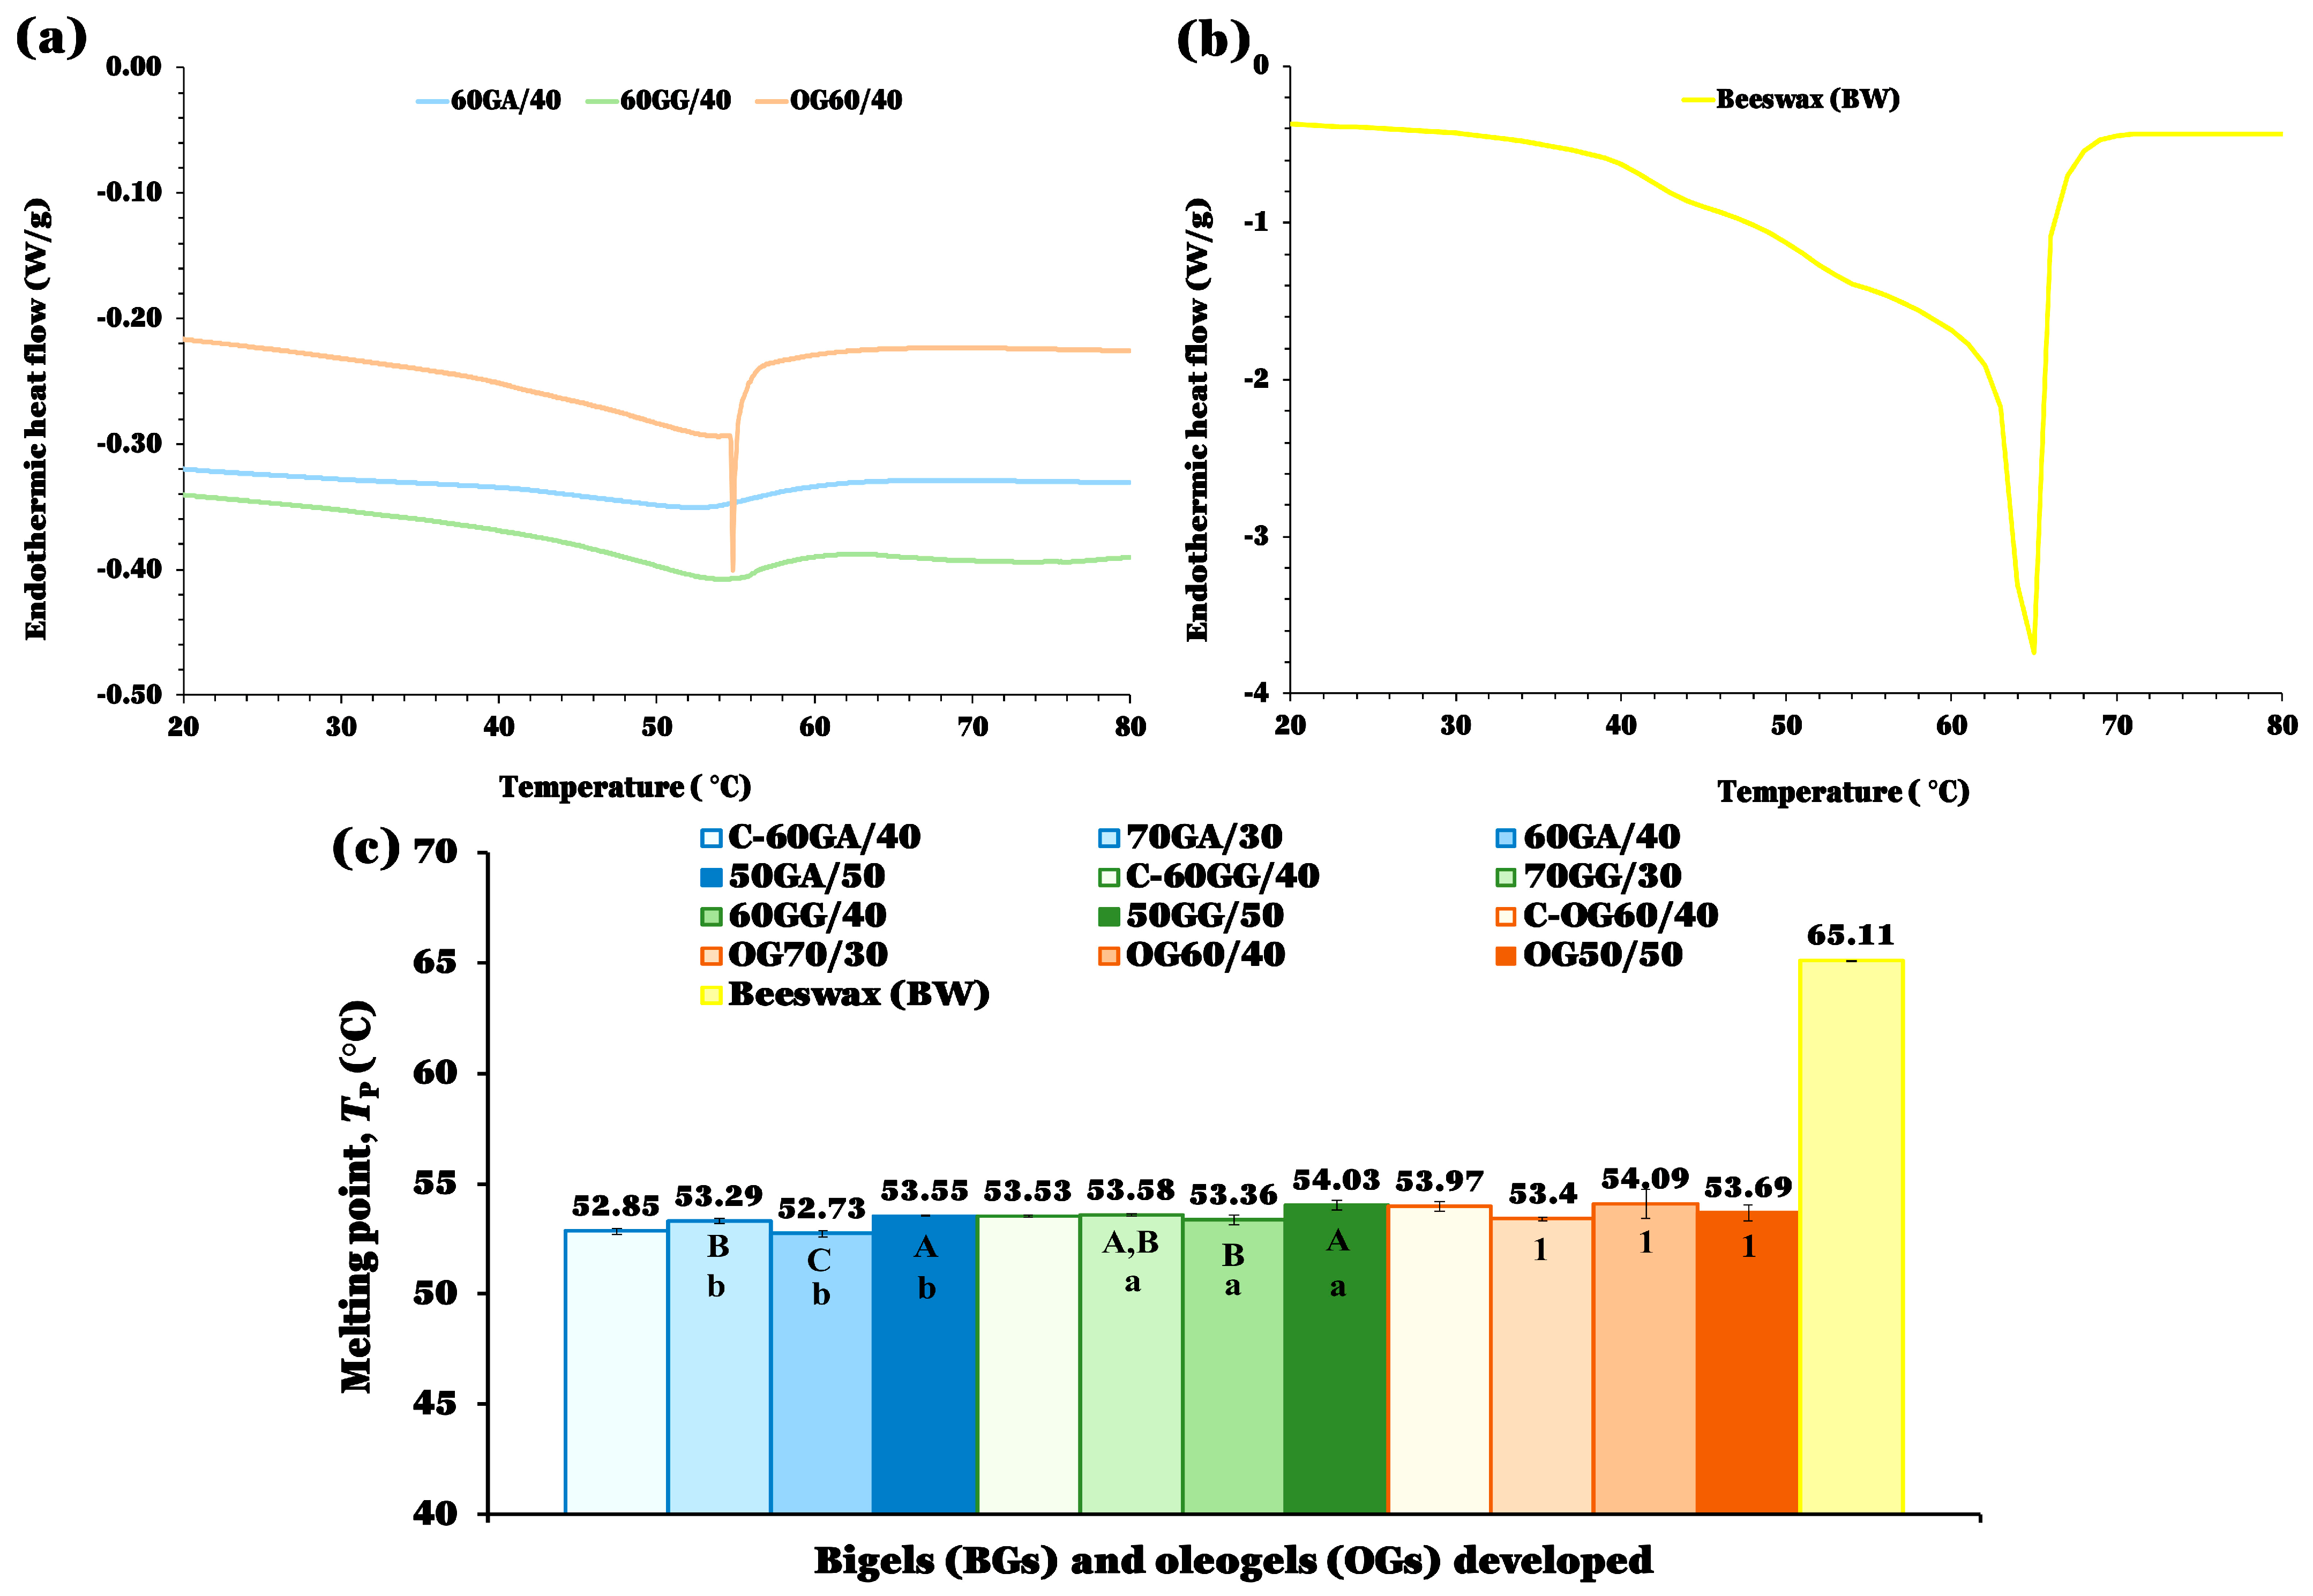
Melting profiles of GA- and GG-based BGs at the intermediate HG/OG ratio (60/40), together with the corresponding OGs, are shown in Figure 6a, while the melting profile of pure BW is presented in Figure 6b. Similar thermal patterns were obtained for BGs and OGs at 70/30 and 50/50 ratios, as well as for the control samples. BW exhibited a single major endothermic transition at 65.11 °C, which was also detected in the individual OG phases and in BGs containing 5% BW. By contrast, this characteristic wax-associated peak was not observed in BGs due to the presence of the HG phase. Individual HGs showed no thermal transitions within the studied temperature range, confirming that all observed endothermic events originate from BW. These thermal transitions confirm the presence of BW crystalline domains prior to melting. These results agree with previous reports describing BW melting between 61 and 63 °C and, in some cases, two transitions associated with hydrocarbons (~53 °C) and wax esters (~63 °C) [17,35,36].
Melting points (TP) of BGs, OGs, and BW are summarized in Figure 6c. For BGs and OGs, TP values ranged from 52.73 to 54.09 °C. Within each hydrogelifying agent, the 50GA/50 and 50GG/50 BGs exhibited significantly higher TP values (p < 0.05) than their 60/40 and 70/30 counterparts, reflecting their higher BW content (6.25%, as described in Section 4.2). No significant differences were observed among OGs at different ratios. Across all formulations, GA-containing BGs consistently showed slightly lower TP values than GG-based BGs. This difference likely arises from the more flexible and less rigid GA network, which allows greater mobility of dispersed BW droplets and facilitates earlier melting. Conversely, the stiffer GG network restricts droplet mobility and delays melting, resulting in marginally higher TP values.

2.7. Color of BGs, HGs, and OGs

The color parameters of BGs, HGs, and OGs were significantly affected by the HG/OG ratio and, in the case of BGs and HGs, by the HG-forming agent (Table 5; Figure 7). As previously reported [9], the intrinsic color of I-CFE and P-CFE dominated the chromatic attributes of all extract-containing samples, a trend also observed here.
In GA-based BGs, increasing the OG fraction (from 70/30 to 50/50) significantly increased L* values (p < 0.05) and significantly decreased both a* and b* values (p < 0.05), reflecting the dilution of the darker extract and the greater contribution of the lighter OG phase. GG-based BGs showed the same pattern, although with consistently lower L*, a*, and b* values than GA BGs. These differences between hydrogelators were significant at 70/30 and 60/40 (p < 0.05), but not at 50/50, where both systems showed similar chromatic behavior. This difference arises from the naturally yellowish hue of GG, which masks part of the extract’s red and blue tones, whereas GA is more neutral and allows the extract color to appear more intensely.
The color of the control BGs further supports this interpretation: both exhibited slightly negative a* values due to the transparency of the HGs, which lack pigments capable of shifting the signal toward the red axis. Analysis of the HGs revealed significant effects of the ratio (p < 0.05). In GA HGs, L* and a* values increased significantly as the OG proportion in the corresponding BGs increased (p < 0.05), while b* values remained negative but shifted toward less green values. These changes indicate that the chromatic response of GA HGs depends not only on the extract but also on the matrix structure and its interaction with the overall BG formulation. In GG HGs, L* values also increased significantly with the ratio (p < 0.05), whereas a* values decreased significantly (p < 0.05) and b* values shifted from slightly positive to negative values, confirming that GG does not contribute intrinsic yellowness and that color is governed primarily by extract concentration.
The HG-forming agent influenced HG color mainly through the b* coordinate: GA HGs consistently showed more negative b* values than GG HGs, with significant differences at 70/30 and 60/40 (p < 0.05), indicating a greener tone. Differences in a* values were less consistent, and L* values remained similar between GA and GG across ratios (no significant differences). Since OG composition was identical in GA and GG systems, no differences related to the hydrogel-forming agent were expected. As anticipated, OG color parameters corresponded to the mean values of both batches. However, the HG/OG ratio produced significant changes (p < 0.05): L*, a* and b* values increased progressively from OG (70/30) to OG (50/50), consistent with the higher proportion of yellowish components (P-CFE, OPO, and BW) at higher OG levels. As noted previously [9], OG color is primarily governed by P-CFE and lipid components, explaining the uniform trend observed.

2.8. Stability and Total Loss of BGs

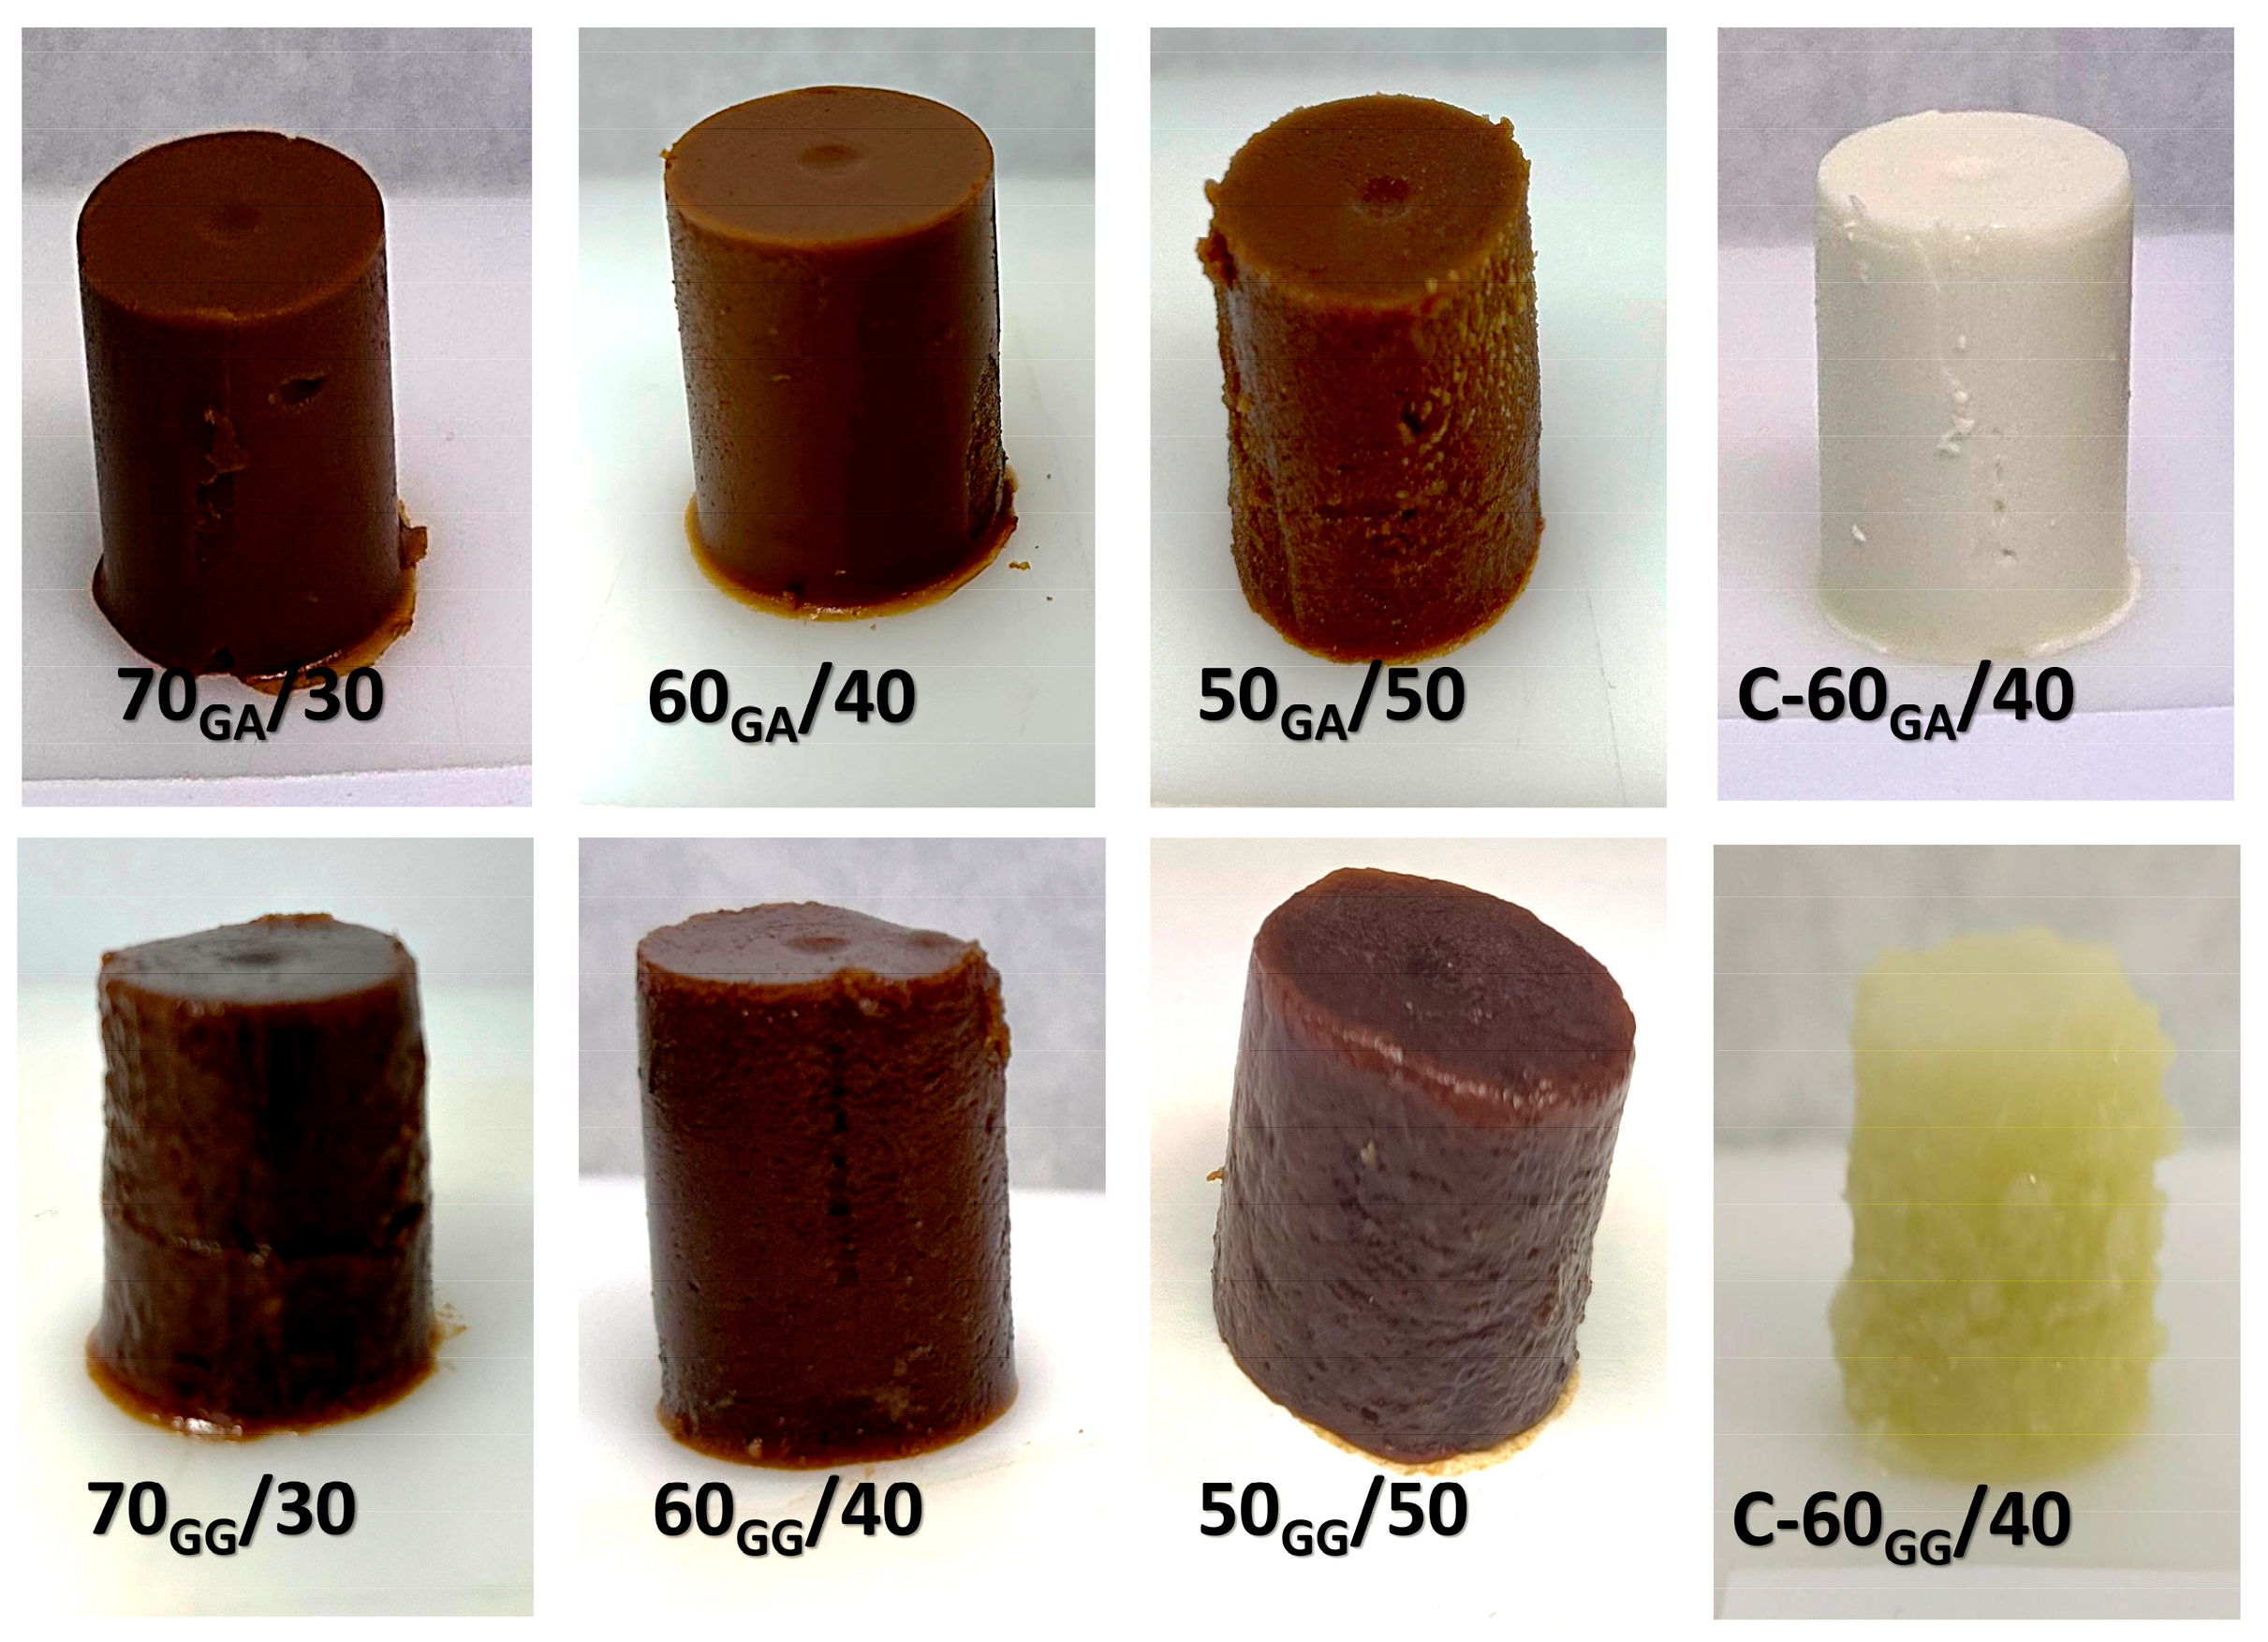
The visual appearance of the BGs (Figure 7) reflected the combined influence of the HG-forming agent and the HG/OG ratio, in agreement with instrumental color measurements. GA-based BGs appeared slightly lighter than GG-based ones at the same ratio, although both displayed the characteristic brown tones imparted by the extracts. The control BGs further highlighted the intrinsic contribution of the gelling agents: the 60GG/40 control showed a more yellowish hue than the 60GA/40 control, consistent with the naturally yellowish appearance of GG and the more neutral tone of GA.
Importantly, the extract-containing BGs showed a marked visual deviation from their respective controls, appearing darker, more opaque, and more intensely colored. This difference is clearly visible in Figure 7 and arises from the strong chromatic contribution of P-CFE [9], which dominates the appearance of the biphasic structure. Such a change in visual identity may influence product applicability and consumer acceptance, depending on the intended use. In food matrices such as pâtés—where these BGs are intended to be incorporated as fat replacers—the darker and more opaque appearance may be advantageous, as pâtés typically exhibit naturally brownish or reddish tones. Conversely, in lighter emulsified products, extract concentration may require adjustment to maintain the expected visual profile. Thus, the observed chromatic deviations are not only technologically meaningful but also important for future product development.
The extract concentration used in both the HG and OG phases was selected based on preliminary formulation trials and previous reports indicating that 5–6% BW and 0.5% P-CFE provide adequate structuring, antioxidant functionality and visual uniformity without compromising gel formation. Higher extract loads led to phase separation or excessive darkening, whereas lower concentrations reduced functional performance. Thus, the chosen levels represent a balance between technological feasibility, structural integrity, and functional dose considerations.
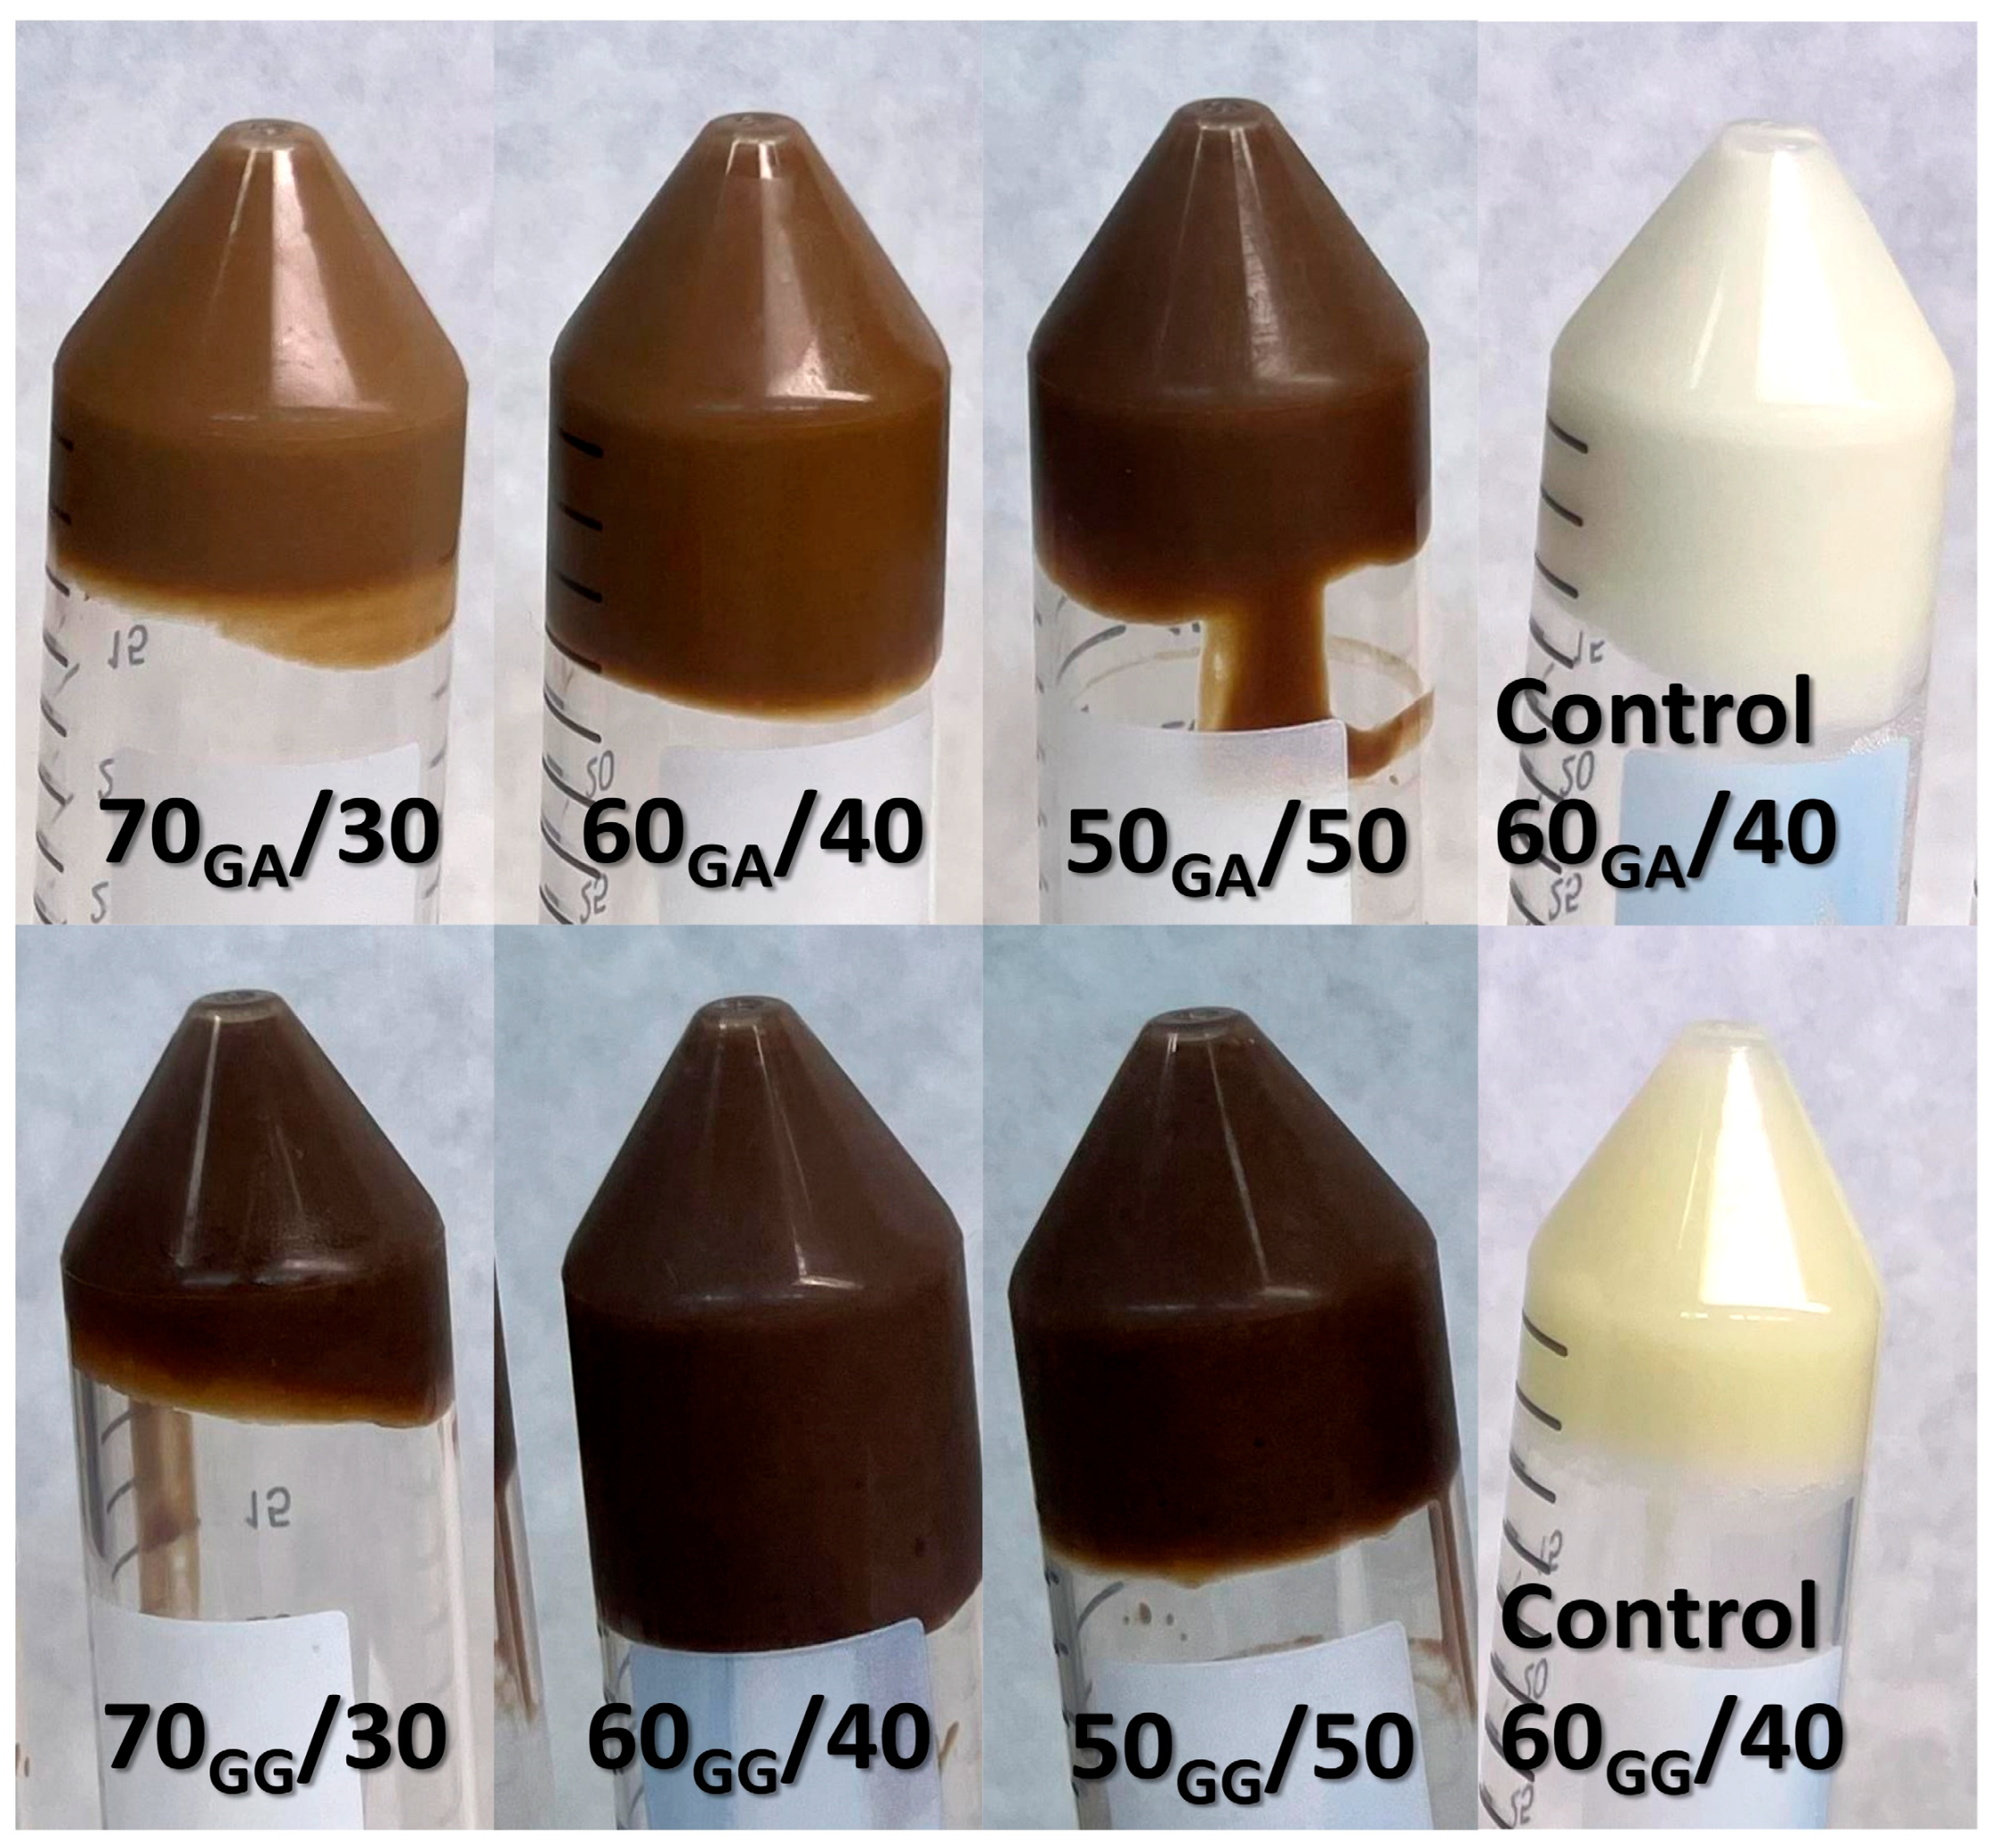
Physical stability was evaluated after 3 days and again after 1 month of storage. In contrast to the behavior previously reported by Álvarez et al. [9] for BGs formulated with alginate as the HG-forming agent, none of the eight formulations showed structural disruption, phase separation, or loss of self-standing ability at either time point. All bigels remained cohesive and non-flowing during the inverted vial test, demonstrating their capacity to withstand gravitational stress throughout storage. No detectable losses of aqueous or lipid phases were observed, confirming full retention within the BG network. Given that the visual appearance of the samples did not change over time, Figure 8 presents only the inverted vial test images obtained on day 3, which are representative of the behavior observed after 1 month.
In summary, the results demonstrate excellent physical stability across all formulations, regardless of the hydrogel-forming agent or HG/OG ratio.

2.9. Microstructure of BGs

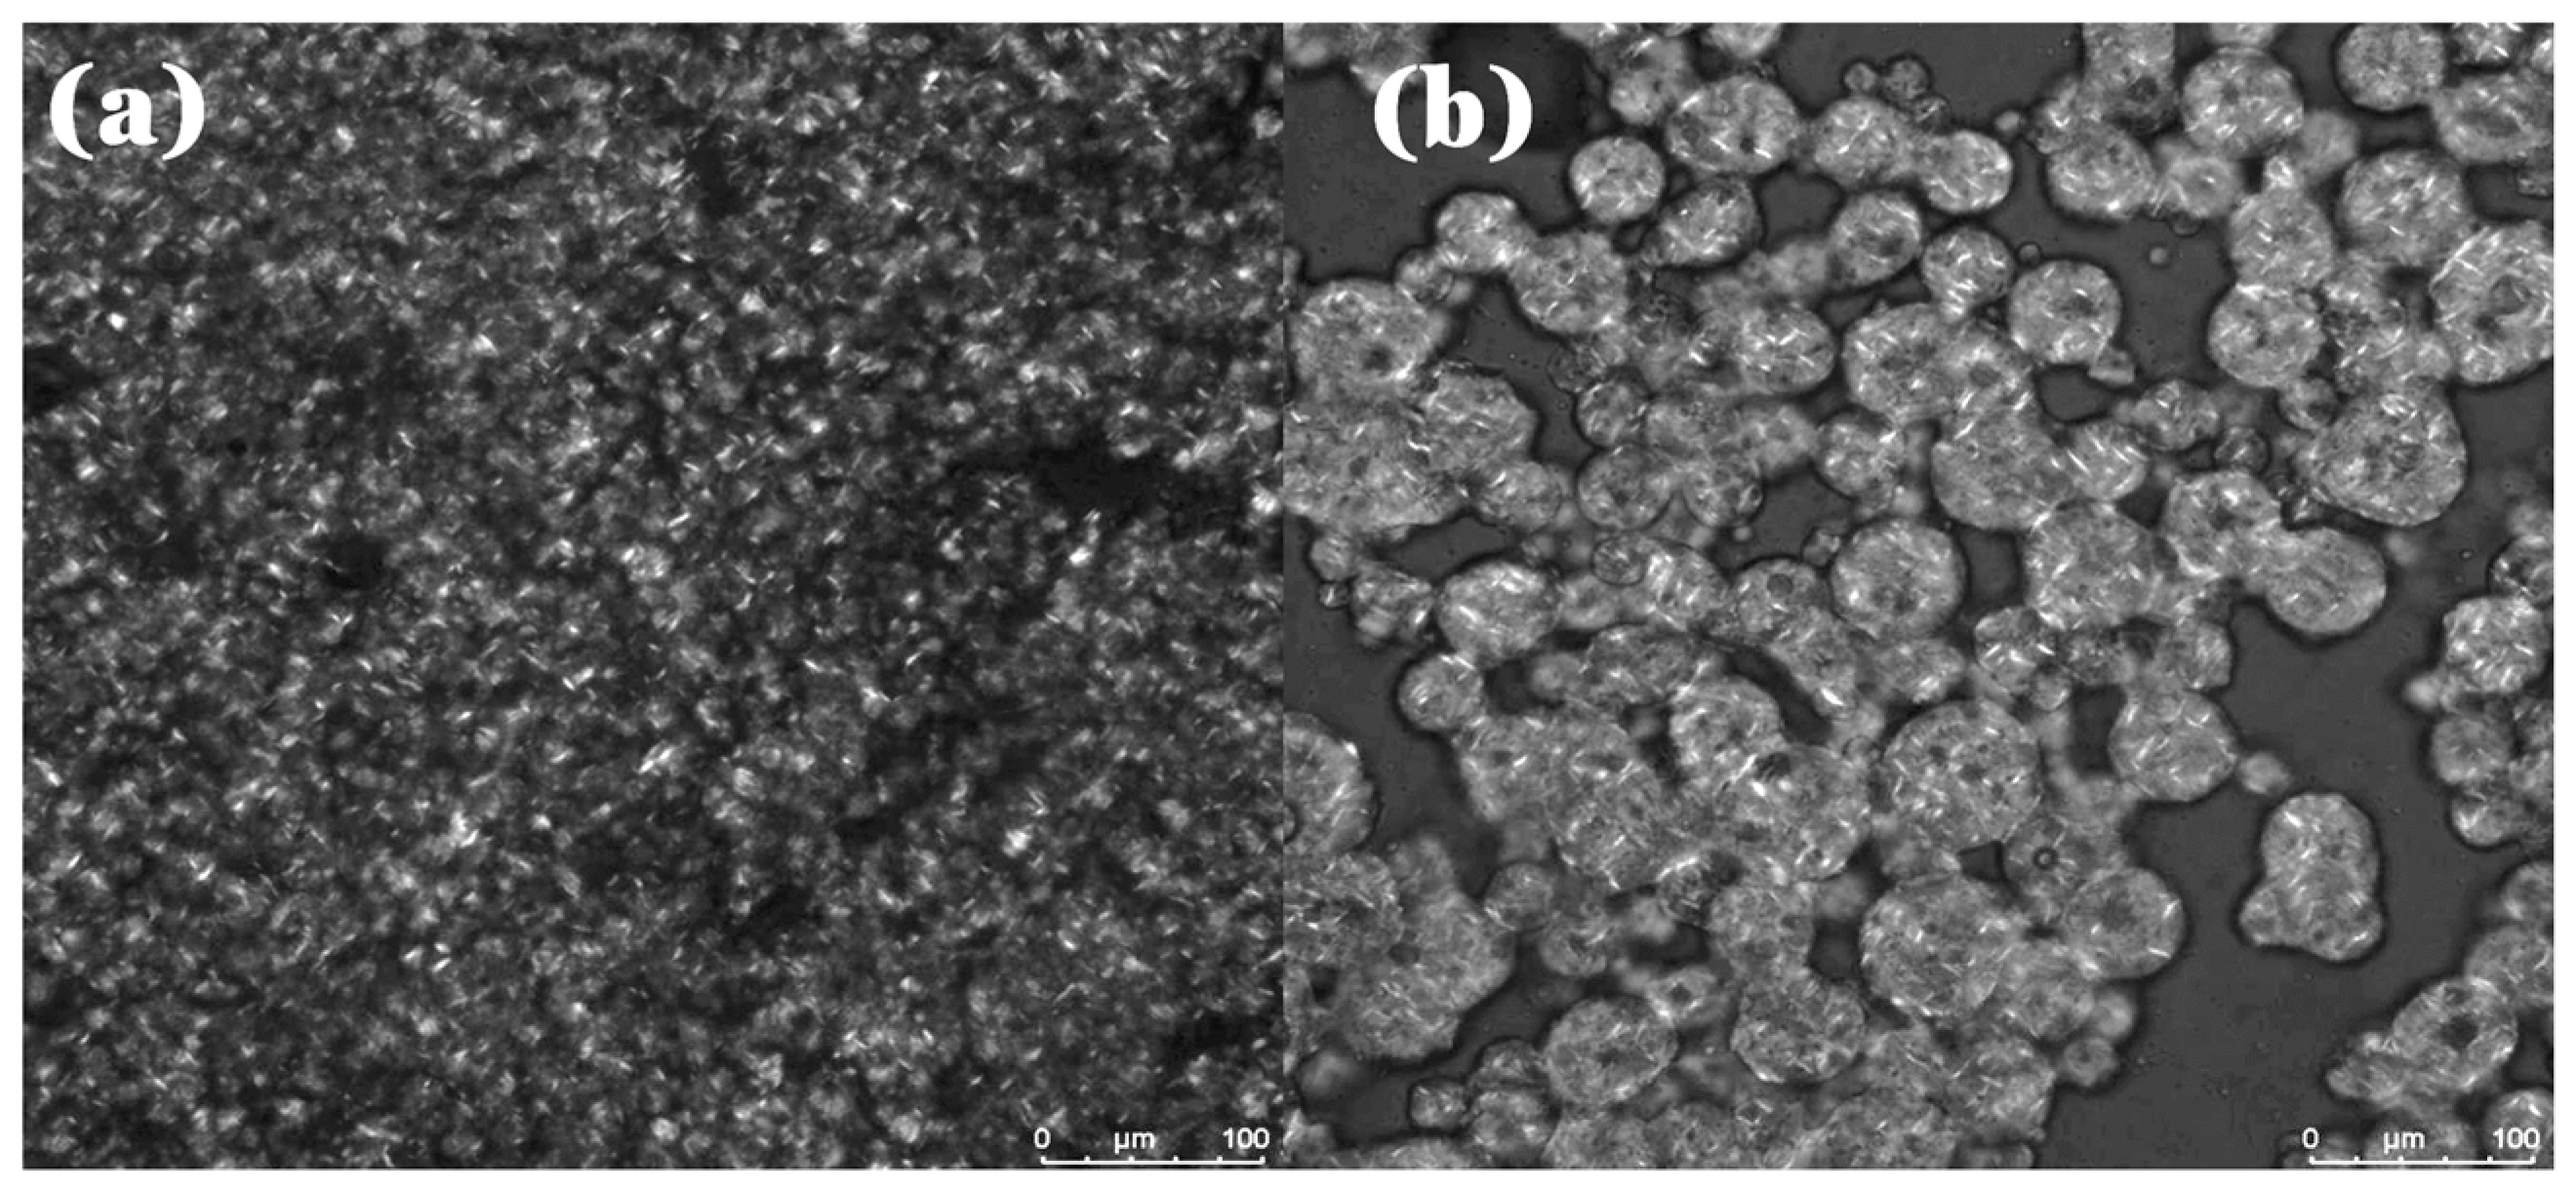
Representative micrographs of BGs formulated at a 60/40 HG/OG ratio are shown (Figure 9), as the microstructures observed at 50/50 and 70/30 were highly similar within each hydrogel-forming agent (GA or GG) and did not provide additional structural distinctions. In all cases, the HG constitutes the continuous phase, while the OG appears as dispersed domains in which beeswax crystals can be identified.
The 60GA/40 BG (Figure 9a) exhibited a fine, homogeneous, and densely packed microstructure, with small and uniformly distributed OG domains embedded within the continuous gelatin network. By contrast, the 60GG/40 BG (Figure 9b) displayed larger, irregular, and more sharply delineated OG domains, consistent with the formation of a rigid and crystal-reinforced matrix. Beeswax crystals were visible in both systems, although their integration into the network appeared more pronounced in GG.
These structural features align with the rheological behavior of the systems: the finer and more deformable microstructure of GA corresponds to its viscosity- and damping-dominated regime, whereas the larger, crystal-reinforced domains in GG are consistent with its stiffness-driven mechanical response.

3. Conclusions

This study demonstrates that GA- and GG-based BGs operate under two distinct mechanical regimes determined by the hydrogel-forming agent, the HG/OG ratio, and the distribution of carob fruit extracts. GA bigels formed soft, deformable, and viscous networks governed by hydration and energy dissipation, whereas GG BGs developed rigid, crystal-reinforced structures dominated by oscillatory stiffness. The HG/OG ratio modulated these behaviors in opposite ways: reducing water weakened GA networks, while increasing OG content strengthened GG matrices through beeswax-crystal integration.
Analyses of individual phases confirmed that HGs largely determine BG texture, with OGs providing moderate reinforcement in GA and a neutral or antagonistic effect in GG. Extract incorporation enhanced both phases, particularly GA, through protein–polyphenol interactions. Thermal and stability assessments showed narrow melting ranges (≈53–54 °C) and one-month structural stability across all formulations.
In summary, GA and GG offer complementary design spaces: GA enables soft and processable BGs suited for deformation-driven applications, while GG provides rigid and stable matrices for structures requiring high mechanical strength. These insights support the rational design of extract-loaded dual-phase BGs for functional food applications, including their future use as fat replacers in pâtés and related emulsified products. Future work will address the oxidative stability of these systems, including the evaluation of lipid oxidation markers during storage.

4. Materials and Methods

4.1. Materials

Inositol-rich carob fruit (I-CFE) and polyphenol-rich carob fruit (P-CFE) extracts were kindly provided by PlanTech BioTechnology Spain S.L. (Valencia, Spain) under the brand NOW® (Nutrition Optimised Within). I-CFE is a concentrated carob syrup obtained exclusively with water as solvent. According to the technical data sheet, it contains 150 g/kg of total inositols (D-pinitol + myo-inositol), 6 g/100 g of sugars, 22.1 g/100 g of polyols, 5.1 g/100 g of dietary fiber, and 3.8 g/100 g of protein, with typical physicochemical parameters of concentrated carob pod matrices (°Brix 65–68; pH ≈ 4). P-CFE is a powdered carob extract characterized by ≥30 g/100 g of condensed tannins, ≥70 g/100 g of total dietary fiber (mostly insoluble), and low levels of polyols (1.4 g/100 g) and sugars (3 g/100 g). The extract is water-insoluble, highly astringent, and derived from carob pod material naturally enriched in polymeric tannins.
Food-grade crushed gelatin (GA) with a Bloom strength of 200/220 was supplied by Manuel Riesgo S.A. (Madrid, Spain). Gellan gum (GG), E418 food-grade, low-acyl, was purchased from Sosa Ingredients S.L. (Barcelona, Spain). Yellow beeswax (BW) pearls were provided by Iberceras Specialties Slu (Madrid, Spain). Soy lecithin (Verolec Non-GMO IP) was obtained from Lasenor Emul S.L. (Barcelona, Spain).
Refined olive pomace oil (OPO), produced in Spain, was donated by Interprofesional del Aceite de Orujo de Oliva (ORIVA, Sevilla, Spain) and refined by ACESUR S.A. (Sevilla, Spain). As established in EU Regulation No. 1308/2013 [37], refined OPO is a regulated commercial category with defined quality specifications. Its composition has been extensively characterized in Álvarez et al. [32], where it is reported to contain a fatty acid profile dominated by oleic acid (~73%), followed by palmitic (~11%) and linoleic (~10%) acids, and a triacylglycerol (TAG) distribution rich in triolein (OOO), palmitoyl-diolein (POO), and linoleoyl-diolein (LOO). These features confer high oxidative stability and technological suitability for OG structuring.

4.2. Preparation of I-CFE-Loaded HGs, P-CFE-Loaded OGs and BGs

HGs, OGs, and BGs were prepared at a total mass of 100 g following the compositions detailed in Table 6. I-CFE was incorporated into the HG phase and P-CFE into the OG phase in fixed amounts across all formulations. BGs were produced at HG/OG ratios of 70/30, 60/40, and 50/50 using GA- or GG-based HGs. These ratios were selected to cover the transition from HG-dominated systems (70/30) to more structurally balanced matrices (60/40) and OG-reinforced networks (50/50), while maintaining food-relevant textures and workable biphasic structures. Control formulations were prepared only at the 60/40 ratio, as preliminary trials showed that this proportion provides the most representative balance between phases for isolating the specific effect of the carob fruit extracts.
HG preparation: GA-based HGs were prepared by dispersing the required amounts of GA and water (Table 6) and heating to ~60 °C until complete dissolution. GG-based HGs were prepared similarly but heated to ~90 °C. Once the gelling agent was fully dissolved, I-CFE was added, and the HG was maintained in a water bath for ~12 min to ensure temperature equilibration before mixing. In GG systems, I-CFE was incorporated only after the dissolution step and subsequent temperature equilibration, minimizing exposure of the extract to elevated thermal loads.
OG preparation: OGs were prepared by heating OPO, BW, and P-CFE (Table 1) to 70 °C under magnetic stirring (400 rpm) until complete melting. Soy lecithin was then added, and the mixture was homogenized with an Ultra-Turrax at 9000 rpm for 1 min before equilibrating its temperature with that of the HG. This temperature ensured complete melting of the lipid structurant while avoiding exposure of P-CFE to the higher thermal loads required for HG dissolution.
BG preparation: Once both phases reached similar temperatures, the HG was homogenized for 1 min at 9000 rpm. The OG was then added over the HG while homogenizing for 2 min, followed by a final 1-min homogenization to obtain the BG structure. BGs were transferred into sterile containers and stored at 4 °C for 72 h to allow complete gel setting before analysis.

4.3. Rheological Measurements of BGs

Rheological measurements were performed using a Kinexus Pro controlled-stress rheometer (NETZSCH-Gerätebau GmbH, Wittelsbacherstr., Selb, Germany) at 25 °C. A sandblasted parallel-plate geometry was used, consisting of an upper PU20 L5272 plate (20 mm diameter) and a 1.5 mm gap, as described previously [9]. Disc-shaped BG samples were placed on the sandblasted lower plate and allowed to rest for 5 min prior to testing to ensure thermal and mechanical equilibration. A plastic solvent trap was used throughout the measurements to minimize evaporation. Temperature was controlled to within ±0.1 °C using an environmental cartridge. All measurements were performed in triplicate for each BG formulation.

4.3.1. Small Amplitude Oscillatory Shear (SAOS) Measurements

Stress Sweep Tests
The linear viscoelastic region (LVR) of each BG sample was determined through stress sweep tests performed at a constant frequency of 1 Hz. When GA was used as the gelling agent, the applied shear stress (σ) ranged from 1 to 100 Pa for the 50/50 ratio and from 0.5 to 50 Pa for the 60/40 and 70/30 ratios. When GG was used, σ ranged from 1 to 100 Pa for the 70/30 ratio, from 2 to 200 Pa for the 60/40 ratio, and from 3 to 300 Pa for the 50/50 ratio. For the control samples prepared at a 60/40 ratio and without extracts in the individual phases, σ ranged from 0.5 to 50 Pa for GA and from 2 to 200 Pa for GG. A total of 41 data points were collected. Variations in storage modulus (G′), loss modulus (G″), loss factor (tan δ = G″/G′), and complex modulus ( G * =   G 2 + G 2 ) were monitored. Critical stress amplitude (σmax), strain amplitude (γmax), and loss factor (tan δmax) values were determined based on the G* trend, considering a ±10% tolerance range [9,38].
Additionally, differences in the LVR were assessed by fitting a linear regression between experimental σ* and shear strain (γ) for the G* values, from initial σ0 to σmax and γ0 to γmax (Equation (1)), to obtain coefficients “a” and “b”.
σ* = a·γ + b
The slope a (Pa) reflects the overall resistance to deformation (including elastic and viscous contributions) and is considered equivalent to gel strength [39,40] (Borderías et al., 2020; Montero et al., 2024). The intercept b (Pa) represents the initial stress (σ0 at γ0). Both parameters were subsequently used to calculate the energy term E (Equation (2)), which quantifies the total energy or toughness involved in the linear deformation of the BG network [38,41].
E = γ 0 γ m a x a · γ + b · d γ
Frequency Sweep Tests
BGs were also subjected to harmonic strain oscillations at varying frequencies, using a fixed shear stress amplitude (σ) to ensure that the strain remained within the LVR. When GA was used as the gelling agent, σ was set to 1 Pa for the 70/30 ratio and to 5 Pa for the 50/50 and 60/40 ratios. When GG was used, σ was set to 5 Pa for the 70/30 ratio and to 10 Pa for the 60/40 and 50/50 ratios. For the control samples without extracts at the 60/40 ratio, σ was 1 Pa for GA and 10 Pa for GG. Frequency sweep tests were conducted from 10 to 0.1 Hz, and G′, G″, tan δ, and complex viscosity (η* = G*/ω; where ω is the angular frequency in rad·s−1) were determined as functions of frequency. In addition, G* was fitted to the power-law relationship known as the weak gel model, as described by Gabriele et al. [31] (Equation (3)):
G*(f) = Af1/z
where G* is the complex modulus (Pa); f is the frequency (Hz); A (Pa·s1/z) is the proportionality constant representing the strength of the interactions (G* at 1 Hz); and z (dimensionless) is the coordination number or network connectivity [32], which can be considered as indicator of structural organization.

4.3.2. Steady Shear Measurements

Flow Behavior
For each BG sample, the flow curve was obtained as a function of shear rate, ranging from 10 to 0.1 s−1, with 10 measurement points per decade. The influence of shear rate on apparent viscosity was described using the power-law model (Equation (4)):
η γ ˙ = K γ ˙ n 1
where η is the apparent viscosity (Pa s); γ ˙ is the shear rate (s−1); K is the consistency index (Pa·sn), which correspond to the apparent viscosity at 1 s−1; and n is the flow behavior index (dimensionless), indicating the degree of deviation from Newtonian behavior. Apparent viscosities (Pa·s) at fixed shear rates of 10 s−1—representative of oral shear conditions [42]—and 0.1 s−1—representative of low-shear processes—were also evaluated for the BGs.
Three-Step Shear Rate Tests
For viscometric rebuild analysis, samples were first subjected to a shear rate of 0.1 s−1 for 30 s. In the second stage, the shear rate was increased to 10 s−1 and applied for 30 s to simulate structural breakdown. Finally, in the third stage, the shear rate was reduced again to 0.1 s−1, and viscosity recovery was monitored for 600 s. The percentage of viscosity recovery at the end of the test was calculated by comparing the final viscosity values after the two low shear rate steps [29].

4.4. Texture Measurements of BGs, HGs and OGs

Penetration tests were performed using a Texture Analyzer (TA.HDPlus, Stable Micro Systems Ltd., Godalming, UK) equipped with a 5 kg load cell and operated via Texture Exponent software (version 6,2,6,0). Measurements were conducted at 5 ± 1 °C using a 2 mm cylindrical flat stainless-steel probe (P/2; Stable Micro Systems Ltd., Godalming, UK). The probe penetrated the sample to a depth of 10 mm at a constant speed of 3 mm s−1, as described previously [43]. From the resulting force–distance curves, the following parameters were obtained: force at 10 mm (F10, N); total work up to 10 mm (W10, mJ); and, at the first rupture peak, the breaking force (FB, N) and breaking slope (SB, N mm−1). These four parameters are commonly interpreted as related indices of hardness (F10), work of penetration (W10), penetration or breaking force (FB), and cohesiveness or structural integrity (SB), respectively. All measurements were performed at least in triplicate.

4.5. Thermal Behavior of BGs, HGs and OGs

A TA Q1000 differential scanning calorimeter (TA Instruments, New Castle, DE, USA) was used to evaluate the thermal characteristics of the different systems. A 15–20 mg amount of each sample was placed in an aluminum pan and hermetically sealed. An empty pan was used as a reference. For heating thermograms, the samples were heated from 0 to 100 °C with a constant heating rate of 5 °C/min, as described previously [9]. The peak maximum temperature (TP, °C) or melting point was recorded for all major melting peaks of the BGs and the individual OG phases, attributed to the BW portions of the OGs, using Universal Analysis 2000. Samples were always evaluated in triplicate.

4.6. Color of BGs, HGs, and OGs

Color characterization of the BGs, HG, and OGs was conducted using a Konica Minolta CM-3500D spectrophotometer (Konica Minolta Business Technologies, Tokyo, Japan). The instrument was calibrated before each measurement session using the standard white calibration tile provided by the manufacturer. The spectrophotometer was positioned on a glass plate and operated with a D65 illuminant and a 10° standard observer. The recorded parameters included lightness (L*), redness/greenness (±a*), and yellowness/blueness (±b*). Each sample was analyzed in ten independent readings.

4.7. Microstructural Analysis of BGs

The microstructure of the bigels was examined via polarized light microscopy (PLM), following the general procedure described by Álvarez et al. [9], with minor adaptations. Approximately 15 mg of each refrigerated BG sample were placed on a glass slide, covered with a coverslip and stored at 4 °C for 72 h to promote cooling and beeswax recrystallization prior to imaging. Micrographs were acquired using a Leica AF6000 LX microscope (Mannheim, Germany), equipped with a Hamamatsu C9100-02 digital camera (Hamamatsu, Japan) and maintained within a temperature-controlled chamber at 37 °C. Observations were performed using 10×/0.30 NA and 40×/0.75 NA objectives, with an additional 1.6× magnification and illumination provided by an Hg-arc lamp. Images were recorded at 1000 × 1000 px resolution using LAS X software (v.5.3.1, Leica Microsystems).

4.8. Statistical Analysis

All statistical analyses were performed using SPSS Statistics v.30 (IBM Corp., Armonk, NY, USA). A two-factor ANOVA was first applied to evaluate the effects of (i) the HG/OG ratio (70/30, 60/40, 50/50) and (ii) the hydrogelifying agent (GA or GG) on all rheological (SAOS and steady shear), textural, thermal, and color parameters. Because significant interactions were observed for all variables (p < 0.05), data were subsequently analyzed using one-way ANOVAs to isolate simple effects. Specifically, for each hydrogelifying agent, a one-way ANOVA assessed the influence of the HG/OG ratio, whereas for each ratio, a one-way ANOVA evaluated the effect of the gelling agent (GA vs. GG). Tukey’s HSD test was applied when significant differences were detected (p < 0.05).
To explore multivariate patterns and identify dominant mechanical domains, two categorical principal components analyses (CATPCA) were performed. CATPCA is an extension of principal component analysis that incorporates optimal scaling to jointly analyze numerical and categorical variables. The first included all rheological and textural parameters of the BGs, while the second incorporated the textural attributes of BGs, HGs, and OGs. Model suitability was assessed through total variance explained and Cronbach’s α.
Pearson correlation analyses were conducted separately for GA and GG systems to examine internal mechanical architecture. Correlations were computed for oscillatory, steady-shear, and textural variables of BGs. Additional matrices evaluated relationships among BG, HG, and OG textural parameters within each gelling system. Statistical significance was set at p < 0.05.

Supplementary Materials

The following supporting information can be downloaded at: https://www.mdpi.com/article/10.3390/gels12070602/s1, Table S1: Cross-test correlations obtained from bigels (BGs) formulated with gelatin (GA) (n = 9) between rheological and mechanical properties and parameters derived from SAOS, steady-state, and penetration measurements; Table S2: Cross-test correlations obtained from bigels (BGs) formulated with gellan gum (GG) (n = 9) between rheological and mechanical properties and parameters derived from SAOS, steady-state, and penetration measurements; Table S3: Correlations obtained between penetration measurements of bigels (BGs) and hydrogels (HGs) formulated with gelatin (GA) and beeswax-based oleogels (OGs) (n = 9); Table S4: Correlations obtained between penetration measurements of bigels (BGs) and hydrogels (HGs) formulated with gelatin (GG) and beeswax-based oleogels (OGs) (n = 9).

Author Contributions

Conceptualization, M.D.Á., A.S. and S.C.; methodology, M.D.Á., A.G., A.S. and S.C.; software, M.D.Á.; validation, A.G., A.S. and S.C.; formal analysis, M.D.Á. and S.C.; investigation, M.D.Á., A.G., A.S. and S.C.; resources, M.D.Á., A.G., A.S. and S.C.; data curation, M.D.Á., A.G. and A.S.; writing—original draft preparation, M.D.Á.; writing—review and editing, M.D.Á., A.G., A.S. and S.C.; visualization, M.D.Á., A.G., A.S. and S.C.; supervision, M.D.Á., A.G., A.S. and S.C.; project administration, S.C.; funding acquisition, S.C. All authors have read and agreed to the published version of the manuscript.

Funding

This work was funded by the Community of Madrid, TEC-2024/BIO-307 BICAROBESITY-CM (ORDER 5696/2024, B.O.C.M. Nº. 307 12/26/2024) and Project PID2024-155166OB-I00 supported by MICIU/AEI/10.13039/501100011033 and by FEDER, EU.

Institutional Review Board Statement

Not applicable.

Informed Consent Statement

Not applicable.

Data Availability Statement

All the raw data for this article, used in the generation of tables and figures, are available at the public repository digital.csic.es of the Spanish Research Council (CSIC) at https://doi.org/10.20350/digitalCSIC/18342.

Acknowledgments

We are grateful to the Analysis Service Unit facilities of ICTAN-CSIC for the determination of thermal properties. We thank the Interprofesional del Aceite de Orujo de Oliva (ORIVA) for kindly donating the olive pomace oil (OPO) and the brand NOW® of PlanTech BioTechnology Spain S.L. for kindly providing the I-CFE and P-CFE extracts used in this study. The authors used AI-assisted tools solely for text editing and language refinement during manuscript preparation. All scientific content, analyses, and interpretations were developed entirely by the authors.

Conflicts of Interest

The authors declare no conflicts of interest.

References

  1. Shakeel, A.; Lupi, F.R.; Gabriele, D.; Baldino, N.; De Cindio, B. Bigels: A unique class of materials for drug delivery applications. Soft Mater. 2018, 16, 77–93. [Google Scholar] [CrossRef]
  2. Martín-Illana, A.; Notario-Pérez, F.; Cazorla-Luna, R.; Ruiz-Caro, R.; Bonferoni, M.C.; Tamayo, A.; Veiga, M.D. Bigels as drug delivery systems: From their components to their applications. Drug Discov. Today 2022, 27, 1008–1026. [Google Scholar] [CrossRef] [PubMed]
  3. Shakouri, S.; Mazaheri Tehrani, M.; Koocheki, A.; Farhoosh, R.; Abdolshahi, A. The development and characterization of edible bigel: A hydrogel/oleogel structure based on guar gum, walnut oil and rice bran wax for using as fat replacer. J. Polym. Environ. 2025, 33, 2058–2071. [Google Scholar] [CrossRef]
  4. Wang, X.; Li, H.; Liu, Y.; Ding, S.; Jiang, L.; Wang, R. A novel edible solid fat substitute: Preparation of biphasic stabilized bigels based on glyceryl monolaurate and gellan gum. Int. J. Biol. Macromol. 2024, 263, 130081. [Google Scholar] [CrossRef] [PubMed]
  5. Samui, T.; Goldenisky, D.; Rosen Kligvasser, J.; Davidovich Pinhas, M. The development and characterization of novel in situ bigel formulation. Food Hydrocoll. 2021, 113, 106416. [Google Scholar] [CrossRef]
  6. Zampouni, K.; Mouzakitis, C.K.; Lazaridou, A.; Moschakis, T.; Katsanidis, E. Physicochemical properties and microstructure of bigels formed with gelatin and κ-carrageenan hydrogels and monoglycerides in olive oil oleogels. Food Hydrocoll. 2023, 140, 108636. [Google Scholar] [CrossRef]
  7. Saffold, A.C.; Acevedo, N.C. Development of novel rice bran wax/gelatin based biphasic edible gels and characterization of their microstructural, thermal, and mechanical properties. Food Bioprocess Technol. 2021, 14, 2219–2230. [Google Scholar] [CrossRef]
  8. Guo, Z.; Chen, Z.; Meng, Z. Bigels constructed from hybrid gelator systems: Bulk phase–interface stability and 3D printing. Food Funct. 2023, 14, 5078–5089. [Google Scholar] [CrossRef] [PubMed]
  9. Álvarez, M.D.; Saiz, A.; Cofrades, S. Impact of hydrogel to oleogel ratio and presence of carob fruit extracts on formulated bigels: Rheological, thermal, physicochemical and microstructural properties. Foods 2025, 14, 3753. [Google Scholar] [CrossRef] [PubMed]
  10. Wen, S.; Chen, W.; Huang, Q.; Lu, X. Modulating physicochemical properties of 3D printed gelatin ethyl cellulose bigel by oleogel/hydrogel ratios and emulsifiers. Food Chem. 2026, 498, 147237. [Google Scholar] [CrossRef] [PubMed]
  11. Xie, D.; Hu, H.; Huang, Q.; Lu, X. Development and characterization of food grade bigel system for 3D printing applications: Role of oleogel/hydrogel ratios and emulsifiers. Food Hydrocoll. 2023, 139, 108565. [Google Scholar] [CrossRef]
  12. Zhu, Q.; Gao, J.; Han, L.; Han, K.; Wei, W.; Wu, T.; Li, J.; Zhang, M. Development and characterization of novel bigels based on monoglyceride beeswax oleogel and high acyl gellan gum hydrogel for lycopene delivery. Food Chem. 2021, 365, 130419. [Google Scholar] [CrossRef] [PubMed]
  13. Cheng, Z.; Zhang, B.; Qiao, D.; Yan, X.; Zhao, S.; Jia, C.; Niu, M.; Xu, Y. Addition of κ-carrageenan increases the strength and chewiness of gelatin-based composite gel. Food Hydrocoll. 2022, 128, 107565. [Google Scholar] [CrossRef]
  14. Shakouri, S.; Arabshahi, S.; Madanchi, H.; Mohammadifar, M.A.; Abdolshahi, A. Effect of carboxymethyl cellulose incorporation to gelatin sunflower oil bigel on the physicochemical and structural properties. Polym. Adv. Technol. 2024, 35, e6567. [Google Scholar] [CrossRef]
  15. Liu, L.; Abdullah; Tian, W.; Chen, M.; Huang, Y.; Xiao, J. Oral sensation and gastrointestinal digestive profiles of bigels tuned by the mass ratio of konjac glucomannan to gelatin in the binary hydrogel matrix. Carbohydr. Polym. 2023, 312, 120765. [Google Scholar] [CrossRef] [PubMed]
  16. Lupi, F.R.; Shakeel, A.; Greco, V.; Oliviero Rossi, C.; Baldino, N.; Gabriele, D. A rheological and microstructural characterisation of bigels for cosmetic and pharmaceutical uses. Mater. Sci. Eng. C 2016, 69, 358–365. [Google Scholar] [CrossRef] [PubMed]
  17. Dimakopoulou Papazoglou, D.; Giannakaki, F.; Katsanidis, E. Structural and physical characteristics of mixed component oleogels: Natural wax and monoglyceride interactions in different edible oils. Gels 2023, 9, 627. [Google Scholar] [CrossRef] [PubMed]
  18. Pang, M.; Shi, Z.; Lei, Z.; Ge, Y.; Jiang, S.; Cao, L. Structure and thermal properties of beeswax-based oleogels with different types of vegetable oil. Grasas Aceites 2020, 71, e380. [Google Scholar] [CrossRef]
  19. Pang, M.; Xu, L.; Ge, Y.; Cheng, J.; Zhang, Z.; Cao, L. Fabrication of beeswax/plant sterol ester gelatin/whey protein isolate bigels with dual gelation effects as substitutes for traditional solid fats. Food Hydrocoll. 2024, 157, 110458. [Google Scholar] [CrossRef]
  20. Zhou, M.; Li, B.; Wu, A.; Li, J.; Tang, J.; Wang, Y.; Hu, Z. Gelatin wax based bigel system: Innovative research on a low calorie fat substitute. LWT 2025, 224, 117836. [Google Scholar] [CrossRef]
  21. Hua, X.; Zhang, X.; Niu, M.; Xia, C.; Dong, W.; Li, C.; Li, K. Construction of a beeswax-based olive oil bigels system encapsulation of β-carotene by xanthan gum/gellan gum/inulin and evaluation of extrusion spreading performance using finite element Abaqus simulations. Food Chem. 2025, 479, 143798. [Google Scholar] [CrossRef] [PubMed]
  22. Singh, V.K.; Banerjee, I.; Agarwal, T.; Pramanik, K.; Bhattacharya, M.K.; Pal, K. Guar gum and sesame oil based novel bigels for controlled drug delivery. Colloids Surf. B Biointerfaces 2014, 123, 582–592. [Google Scholar] [CrossRef] [PubMed]
  23. Neves, B.V.; Fernandes, A.S.; Nass, P.; Jacob Lopes, E.; Zepka, L.Q.; Mazzol, T.M.; Longo, E.; Braga, A.R.C.; de Rosso, V.V. Exploring different food grade bigel systems for delivering bioactive carotenoids: Part 1—Evaluation of color parameters. Food Hydrocoll. 2025, 169, 111625. [Google Scholar] [CrossRef]
  24. Neves, B.V.; Fernandes, A.S.; Bonsanto, F.P.; Capriles, V.D.; Braga, A.R.C.; de Rosso, V.V. Exploring different food grade bigel systems for delivering bioactive carotenoids: Part 2—Potential for extrusion based 3D printing. Food Hydrocoll. 2025, 167, 111428. [Google Scholar] [CrossRef]
  25. Luo, Y.; Xiong, G.; Gong, X.; Xu, C.; Tian, Y.; Li, G. Fabrication, characterization, and in vitro digestion behavior of bigel loaded with notoginsenoside Rb1. Gels 2025, 11, 624. [Google Scholar] [CrossRef] [PubMed]
  26. Macho González, A.; López Oliva, M.E.; Garcimartín, A.; Sánchez Muniz, F.J.; Benedí, J. Carob fruit extract enriched meat improves pancreatic beta cell dysfunction, hepatic insulin signaling and lipogenesis in a late stage type 2 diabetes mellitus model. J. Nutr. Biochem. 2020, 84, 108461. [Google Scholar] [CrossRef] [PubMed]
  27. Azab, A. D-Pinitol—Active natural product from carob with notable insulin regulation. Nutrients 2022, 14, 1453. [Google Scholar] [CrossRef] [PubMed]
  28. Guo, Z.; Li, Y.; Song, X.; Meng, Z. Stabilization models of foams prepared from whippable bigels: Crystal absorption and droplet stability. Food Hydrocoll. 2024, 147, 109383. [Google Scholar] [CrossRef]
  29. Barroso, L.A.; Bovi Karatay, G.G.; Cerqueira e Silva, K.F.; Hubinger, M.D. Rheological comparison of gelatin and potato starch as gelation agents in the aqueous phase of bigels. Int. J. Biol. Macromol. 2025, 320, 145962. [Google Scholar] [CrossRef] [PubMed]
  30. Bellini, D.; Cencetti, C.; Meraner, J.; Stoppoloni, D.; Scotto D’Abusco, A.; Matricardi, P. An in situ gelling system for bone regeneration of osteochondral defects. Eur. Polym. J. 2015, 72, 642–650. [Google Scholar] [CrossRef]
  31. Gabriele, D.; De Cindio, B.; D’Antona, P. A weak gel model for foods. Rheol. Acta 2001, 40, 120–127. [Google Scholar] [CrossRef]
  32. Álvarez, M.D.; Saiz, A.; Herranz, B.; Cofrades, S. Olive pomace oil structuring for the development of healthy puff pastry laminating fats: The effect of chilling storage on the quality of baked products. Foods 2024, 13, 603. [Google Scholar] [CrossRef] [PubMed]
  33. Fasolin, L.H.; Martins, A.J.; Cerqueira, M.A.; Vicente, A.A. Modulating process parameters to change physical properties of bigels for food applications. Food Struct. 2021, 28, 100173. [Google Scholar] [CrossRef]
  34. Li, B.; Zhou, M.; Qin, H.; Wu, A.; Li, J.; Wang, Y.; Hu, Z. Impact of gelatin/κ-carrageenan ratio in the properties of bigels for food applications. Food Bioprod. Process. 2025, 153, 315–321. [Google Scholar] [CrossRef]
  35. Winkler-Moser, J.K.; Anderson, J.; Felker, F.C.; Hwang, H.-S. Physical properties of beeswax, sunflower wax, and candelilla wax mixtures and oleogels. J. Am. Oil Chem. Soc. 2019, 96, 1125–1142. [Google Scholar] [CrossRef]
  36. Jana, S.; Martini, S. Phase behavior of binary blends of four different waxes. J. Am. Oil Chem. Soc. 2016, 93, 543–554. [Google Scholar] [CrossRef]
  37. EU. Regulation (EU) No 1308/2013 of the European Parliament and of the Council of 17 December 2013 establishing a common organisation of the markets in agricultural products. Off. J. Eur. Union 2013, L347, 671–854. [Google Scholar]
  38. Herranz, B.; Chamorro, S.; Almendro-Vedia, V.G.; Álvarez, M.D. Egg white matters: Studying the role of genetic line and egg chilling storage on the rheology of thick egg white supporting meringue texture. J. Texture Stud. 2025, 56, e70010. [Google Scholar] [CrossRef] [PubMed]
  39. Borderías, A.J.; Tovar, C.A.; Domínguez Timón, F.; Díaz, M.T.; Pedrosa, M.M.; Moreno, H.M. Characterization of Healthier Mixed Surimi Gels Obtained through Partial Substitution of Myofibrillar Proteins by Pea Protein Isolates. Food Hydrocoll. 2020, 107, 105976. [Google Scholar] [CrossRef]
  40. Montero, M.P.; Tovar, C.A.; Alemán, A.; Gómez-Guillén, M.C. Characterisation of Desolvation-Produced High-Molecular-Weight Gelatin Fractions and Their Use for Nanoparticles Synthesis. J. Food Eng. 2024, 370, 111965. [Google Scholar] [CrossRef]
  41. Fiszman, S.; Tovar, C.A. Revisiting the physical concept of gel strength with particular reference to surimi gels. Food Hydrocoll. 2026, 172, 111949. [Google Scholar] [CrossRef]
  42. Eisinaitė, V.; Jasutienė, I.; Vinauskienė, R.; Leskauskaitė, D. Development of bigel-based dysphagia-oriented products structured with collagen and carnauba wax: Characterisation and rheological behaviour. Int. J. Food Sci. Technol. 2023, 58, 145–153. [Google Scholar] [CrossRef]
  43. Cofrades, S.; Saiz, A.; Álvarez, M.D. Biopolymeric emulsions with added silicon as pork fat substitutes in the reformulation of healthy pâtés: Effect on technological, nutritional and sensory properties and on lipid digestibility after in vitro gastrointestinal digestion. LWT 2024, 210, 116865. [Google Scholar] [CrossRef]
Figure 1. (a) Stress-sweep curves of bigels (BGs) formulated with gelatin (GA) and gellan gum (GG) at different HG/OG ratios (50/50, 60/40, 70/30). Storage modulus (G′, filled symbols) and loss modulus (G″, open symbols) are plotted as a function of applied shear stress (σ) to identify the linear viscoelastic region (LVR) of each formulation. (b) Complex shear stress (σ*) as a function of strain (γ) of BGs formulated with GA and GG at 50/50, 60/40, and 70/30 ratios.
Gels 12 00602 g001
Figure 2. (a) Mechanical spectra of bigels (BGs) formulated with gelatin (GA) and gellan gum (GG) at different HG/OG ratios (50/50, 60/40, 70/30). Storage modulus (G′, filled symbols) and loss modulus (G″, open symbols) are plotted as a function of applied frequency (f). (b) Complex modulus (G*) vs. frequency for fits to weak-gel model of BGs formulated with GA and GG at 50/50, 60/40, and 70/30 ratios.
Gels 12 00602 g002
Figure 3. (a) Apparent viscosity of bigels (BGs) formulated with gelatin (GA) and gellan gum (GG) at different HG/OG ratios (50/50, 60/40, 70/30). (b) Viscosity as a function of time from a three-step shear test of BGs formulated with GA and GG at 50/50, 60/40, and 70/30 ratios. Squares and triangles correspond to the first and second shear steps (0.1 s−1 for 30 s and 10 s−1 for 30 s, respectively), while circles represent the third step (0.1 s−1 for 600 s) during viscosity recovery.
Gels 12 00602 g003
Figure 4. (a) Typical force–distance curves obtained from penetration tests for the BGs, HGs, and OGs at the 60/40 ratio using GA as hydrogelator. (b) Typical force–distance curves obtained from penetration tests for the BGs, HGs, and OGs at the 60/40 ratio using GG as hydrogelator.
Gels 12 00602 g004
Figure 5. (a) Biplot-CATPCA indicating the observed cases (blue dots: BGs formulated with GA (1) and BGs formulated with GG (2)) and component loadings of the rheological and textural properties and parameters analyzed in BGs (black lines). The variable names displayed in the plot correspond to the labels used for each parameter in the CATPCA analysis: Stressmax = σmax (critical shear stress), Strainmax = γmax (critical shear strain), tand = tan δ (loss factor within the LVR), a = gel strength, b = σ0 (initial stress), E = area under the σmaxγmax line; Elastic = G′ (storage modulus), Viscous = G″ (loss modulus), loss factor = tan δ (loss factor), Complexvisc = η* (complex viscosity), Amod = A (interaction strength), z = network extension; Visc0.1 = η0.1 and Visc10 = η10 (apparent viscosities at 0.1 and 10 s−1); K = consistency index, n = flow behavior index; F10 = force at 10 mm, W10 = total work up to 10 mm, FB = breaking force at the first rupture peak, and SB = slope at the first rupture peak. (b) Biplot-CATPCA showing the observed cases and the component loadings of the textural parameters evaluated in BGs, HGs, and OGs (F10, W10, FB, and SB for each gel type).
Gels 12 00602 g005
Figure 6. Melting profiles and peak maximum temperatures (TP) obtained by DSC: (a) For bigels (BGs) and individual oleogel (OG) formulated at 60/40 ratio; (b) For beeswax (BW); (c) For BGs and individual OGs formulated at 70/30, 60/40, and 50/50 ratios. A–C Effect of HG/OG ratio; for the same system (BG or HG), and for the same hydrogel-forming agent, different letters in the same column indicate significant differences (p < 0.05). a,b Effect of hydrogel-forming agent; for the same system (BG or HG), and for the same HG/OG ratio, different letters in the same column indicate significant differences (p < 0.05). 1 Effect of HG/OG ratio in OG; different numbers in the same column indicate significant differences (p < 0.05).
Gels 12 00602 g006
Figure 7. Appearance of bigels (BGs) formulated with gelatin (GA) and gellan gum (GG) as hydrogel-forming agents at 70/30, 60/40, and 50/50 HG/OG ratios (sample diameter = 25 mm; height = 35 mm).
Gels 12 00602 g007
Figure 8. Inverted vial test images of bigels (BGs) formulated with gelatin (GA) and gellan gum (GG) as hydrogel-forming agents at 70/30, 60/40, and 50/50 HG/OG ratios on day 3 (samples placed in standard 50 mL Falcon tubes; tube diameter = 30 mm).
Gels 12 00602 g008
Figure 9. Polarized light micrographs of bigels formulated at a 60/40 HG/OG ratio: (a) 60GA/40 and (b) 60GG/40. Scale bar: 100 µm.
Gels 12 00602 g009
Table 1. Critical rheological parameters defining the linear viscoelastic region (LVR) at 25 °C for formulated bigels (BGs).
BGσmax (Pa)γmax (%)tan δmax (−)a (Pa)b (Pa)R2 (Equation (1))E (J/m3)
C-60GA/404.02 ± 0.0040.099 ± 0.0080.139 ± 0.0014028 ± 122.59.49 ± 1.261.0096.73 ± 2.18
70GA/307.14 ± 0.015 Bb0.154 ± 0.032 Bb0.176 ± 0.005 Cb4832 ± 43.05 Cb11.44 ± 1.07Cb0.999267.71 ± 23.81 Bb
60GA/4012.66 ± 0.010 Ab0.217 ± 0.012 Aa0.229 ± 0.004 Bb5977 ± 33.40 Bb24.70 ± 1.64 Ab0.997650.57 ± 15.89 Aa
50GA/506.33 ± 0.000 Cb0.051 ± 0.001 Ca0.305 ± 0.008 Aa12,165 ± 196.52 Ab18.32 ± 0.212 Bb0.99978.36 ± 1.43 Cb
C-60GG/4022.45 ± 0.0000.022 ± 0.0020.301 ± 0.011108,865 ± 915761.55 ± 7.000.997121.3± 3.29
70GG/3014.23 ± 0.005 Ca0.213 ± 0.011 Aa0.340 ± 0.008 Aa6743 ± 217.3 Ca35.45 ± 0.628 Ca0.998725.0 ± 34.26 Aa
60GG/4022.46 ± 0.000 Ba0.042 ± 0.002 Bb0.347 ± 0.018 Aa54,377 ± 4308 Ba48.99 ± 1.57 Ba0.999226.6 ± 3.72 Cb
50GG/5030.02 ± 0.010 Aa0.043 ± 0.002 Bb0.323 ± 0.014 Aa75,781 ± 861.5 Aa67.74 ± 6.33 Aa0.999317.6 ± 20.57 Ba
Mean value (n = 3) ± standard deviation. σmax, critical value of shear stress; γmax, critical value of shear strain; tan δ, critical value of the loss factor (tan δ = G″/G′); a, gel strength or total resistance (elastic and viscous) to deformation; b, stress at the initial state (σ0); R2, determination coefficient of linear regression fit of stress (σ) versus strain (γ) for the complex modulus (G*); E, area under straight line of σmax versus γmax from Equation (2). A–C Effect of HG/OG ratio; for the same hydrogel-forming agent, different letters in the same column indicate significant differences (p < 0.05). a,b Effect of hydrogel-forming agent; for the same HG/OG ratio, different letters in the same column indicate significant differences (p < 0.05).
Table 2. Mechanical spectra data at 1 Hz and at 25 °C, and weak gel model parameters for formulated bigels (BGs).
BGG′ (Pa)G″ (Pa)tan δ (−)η* (Pa·s)A (Pa·s1/z)z (−)R2 (Equation (3))
C-60GA/404310 ± 222.0590.0 ± 34.520.137 ± 0.001692.2 ± 35.724385 ± 214.511.95 ± 0.9530.994
70GA/304284 ± 257.7 Cb686.3 ± 46.98 Cb0.160 ± 0.001 Cb690.4 ± 41.65 Cb4332 ± 242.1 Cb10.48 ± 0.364 Aa0.996
60GA/406445 ± 302.6 Bb1370 ± 57.46 Bb0.213 ± 0.002 Bb1049 ± 48.85 Bb6593 ± 222.3 Bb8.04 ± 0.528 Ba0.997
50GA/5011,230 ± 113.6 Ab3453 ± 130.1 Ab0.307 ± 0.011 Aa1870 ± 20.79 Ab11,978 ± 115.7 Ab5.45 ± 0.340 Ca0.996
C-60GG/4080,337 ± 534123,243 ± 313.70.290 ± 0.01913,313 ± 819.985,939 ± 48055.90 ± 0.1940.984
70GG/306983 ± 248.0 Ca2295 ± 23.03 Ca0.329 ± 0.009 Aa1170 ± 38.74 Ca7286 ± 236.2 Ca5.26 ± 0.025 Bb0.998
60GG/4057,590 ± 2160 Ba18,633 ± 96.09 Ba0.324 ± 0.013 Aa9634 ± 324.1 Ba60,212 ± 1793 Ba5.19 ± 0.048 Bb1.00
50GG/5095,247 ± 4359 Aa28,677 ± 223.68 Aa0.302 ± 0.016 Aa15,830 ± 656.0 Aa102,323 ± 4168 Aa5.69 ± 0.046 Aa0.989
Mean value (n = 3) ± standard deviation. G′, storage modulus; G″, loss modulus; tan δ, loss factor; η*, complex viscosity; A, interaction strength; z, network extension; R2, determination coefficient for Equation (3). A–C Effect of HG/OG ratio; for the same hydrogel-forming agent, different letters in the same column indicate significant differences (p < 0.05). a,b Effect of hydrogel-forming agent; for the same HG/OG ratio, different letters in the same column indicate significant differences (p < 0.05).
Table 3. Steady-shear rheological properties at 25 °C for formulated bigels (BGs).
BGη0.1 (Pa·s)η10(Pa·s)K (Pa·sn)n (−)R2 (Equation (4))Viscosity Recovery (%)
C-60GA/401993 ± 22.0078.70 ± 1.61321.8 ± 1.710.272 ± 0.0010.99433.69 ± 0.552
70GA/303963 ± 71.00 Ba86.88 ± 3.06 Aa451.6 ± 36.74 Ba0.146 ± 0.016 Bb0.99153.58 ± 3.45 Aa
60GA/404949 ± 81.50 Aa85.65 ± 2.60 Aa540.5 ± 39.09 Aa0.097 ± 0.004 Cb0.99655.37 ± 4.92 Aa
50GA/50915.5 ± 64.45 Ca22.79 ± 1.90 Ba120.9 ± 9.11 Ca0.173 ± 0.002 Aa0.99722.97 ± 1.11 Bb
C-60GG/40177.3 ± 4.007.38 ± 0.41431.50 ± 2.170.285 ± 0.0160.99732.26 ± 1.98
70GG/30657.6 ± 37.45 Ab25.17 ± 1.70 Ab112.5 ± 1.59 Ab0.280 ± 0.001 Aa0.99637.99 ± 2.04 Ab
60GG/40384.9 ± 2.50 Cb12.33 ± 0.545 Bb61.14 ± 1.79 Cb0.240 ± 0.027 Aa0.99725.26 ± 0.410 Cb
50GG/50569.0 ± 26.50 Bb14.05 ± 0.200 Bb78.46 ± 2.09 Bb0.168 ± 0.008 Ba0.99531.42 ± 1.62 Ba
Mean value (n = 3) ± standard deviation. η0.1 and η10, apparent viscosities measured at fixed shear rates of 0.1 and 10 s−1, respectively; K, consistency index; n, flow behavior index; R2, determination coefficient for Equation (4). A–C Effect of HG/OG ratio; for the same hydrogel-forming agent, different letters in the same column indicate significant differences (p < 0.05). a,b Effect of hydrogel-forming agent; for the same HG/OG ratio, different letters in the same column indicate significant differences (p < 0.05).
Table 4. Penetration parameters at 5 °C for formulated bigels (BGs), hydrogels (HGs), and oleogels (OGs).
BGF10 (N)W10 (mJ)FB (N)SB (N mm−1)
C-60GA/400.420 ± 0.0083.20 ± 0.0480.285 ± 0.0080.151 ± 0.005
70GA/300.501 ± 0.039 Aa4.04 ± 0.061 Aa0.546 ± 0.006 Aa0.216 ± 0.009 Aa
60GA/400.459 ± 0.026 Aa3.84 ± 0.022 Ba0.492 ± 0.001 Ba0.199 ± 0.003 Aa
50GA/500.346 ± 0.007 Ba2.75 ± 0.055 Ca0.278 ± 0.006 Ca0.140 ± 0.005 Bb
C-60GG/400.134 ± 0.0051.30 ± 0.0590.097 ± 0.0040.113 ± 0.019
70GG/300.084 ± 0.002 Cb0.736 ± 0.008 Cb0.082 ± 0.002 Cb0.113 ± 0.003 Cb
60GG/400.181 ± 0.003 Bb1.53 ± 0.055 Bb0.140 ± 0.004 Bb0.149 ± 0.004 Bb
50GG/500.327 ± 0.012 Aa2.58 ± 0.107 Aa0.230 ± 0.010 Ab0.219 ± 0.006 Aa
C-HG60GA/400.418 ± 0.0133.50 ± 0.0280.598 ± 0.0210.147 ± 0.002
HG70GA/300.739 ± 0.034 Aa6.20 ± 0.110 Aa1.47 ± 0.006 Aa0.237 ± 0.003 Aa
HG60GA/400.765 ± 0.039 Aa5.60 ± 0.148 Ba1.09 ± 0.029 Ba0.207 ± 0.002 Bb
HG50GA/500.387 ± 0.013 Ba2.41 ± 0.140 Ca0.305 ± 0.013 Ca0.084 ± 0.004 Cb
C-HG60GG/400.016 ± 0.0010.137 ± 0.0100.031 ± 0.0000.222 ± 0.007
HG70GG/300.049 ± 0.003 Bb0.479 ± 0.007 Cb0.073 ± 0.003 Cb0.068 ± 0.002 Cb
HG60GG/400.089 ± 0.006 Bb0.983 ± 0.012 Bb0.210 ± 0.010 Bb0.256 ± 0.008 Ba
HG50GG/500.240 ± 0.041 Ab1.48 ± 0.211 Ab0.333 ± 0.007 Aa0.340 ± 0.007 Aa
C-OG60/400.306 ± 0.0102.40 ± 0.0660.318 ± 0.0231.41 ± 0.057
OG70/300.704 ± 0.023 15.85 ± 0.217 10.578 ± 0.048 21.53 ± 0.089 2
OG60/400.547 ± 0.030 25.29 ± 0.179 1,20.722 ± 0.027 11.97 ± 0.115 1
OG50/500.581 ± 0.027 24.90 ± 0.279 20.599 ± 0.012 20.821 ± 0.044 3
Mean value (n = 3) ± standard deviation. F10, force at 10 mm; W10, total work up to 10 mm; FB and SB, breaking force and slope at the first rupture peak, respectively. A–C Effect of HG/OG ratio; for the same system (BG or HG), and for the same hydrogel-forming agent, different letters in the same column indicate significant differences (p < 0.05). a,b Effect of hydrogel-forming agent; for the same system (BG or HG), and for the same HG/OG ratio, different letters in the same column indicate significant differences (p < 0.05). 1−3 Effect of HG/OG ratio in OG; different numbers in the same column indicate significant differences (p < 0.05).
Table 5. Color parameters for formulated bigels (BGs), hydrogels (HGs), and oleogels (OGs).
BGL*a*b*
C-60GA/4086.13 ± 0.552−3.76 ± 0.09612.07 ± 0.266
70GA/3032.77 ± 0.217 Ba9.81 ± 0.081 Aa6.40 ± 0.101 Aa
60GA/4030.42 ± 0.220 Ca8.85 ± 0.152 Ba3.30 ± 0.108 Ba
50GA/5035.08 ± 0.994 Aa9.73 ± 0.305 Aa0.514 ± 0.088 Cb
C-60GG/4062.82 ± 0.281−4.40 ± 0.10211.06 ± 0.260
70GG/3027.65 ± 0.160 Cb7.05 ± 0.091 Bb3.79 ± 0.068 Ab
60GG/4029.59 ± 0.651 Bb7.80 ± 0.204 Ab3.41 ± 0.197 Ba
50GG/5031.72 ± 0.494 Ab6.83 ± 0.230 Cb2.90 ± 0.270 Ca
C-HG60GA/4070.61 ± 0.3760.593 ± 0.0170.867 ± 0.049
HG70GA/3024.50 ± 0.729 Bb3.19 ± 0.174 Cb−3.25 ± 0.120 Bb
HG60GA/4025.38 ± 1.19 Ba3.77 ± 0.284 Ba−3.58 ± 0.242 Cb
HG50GA/5028.21 ± 0.936 Aa4.21 ± 0.296 Aa−2.97 ± 0.179 Ab
C-HG60GG/4073.60 ± 0.9071.34 ± 0.021−3.27 ± 0.097
HG70GG/3025.34 ± 0.617 Ca4.15 ± 0.294 Aa0.176 ± 0.016 Aa
HG60GG/4026.41 ± 1.17 Ba3.97 ± 0.307 Aa−1.71 ± 0.152 Ca
HG50GG/5027.39 ± 0.647 Ab3.13 ± 0.116 Bb−1.29 ± 0.083 Ba
C-OG60/4050.14 ± 0.416−4.21 ± 0.09810.22 ± 0.159
OG70/3033.37 ± 0.208 35.29 ± 0.082 23.83 ± 0.095 3
OG60/4036.48 ± 0.450 23.90 ± 0.380 34.57 ± 0.891 2
OG50/5040.04 ± 0.249 17.08 ± 0.230 15.93 ± 0.242 1
Mean value (n = 10) ± standard deviation. L*, a*, b*, CIELab color parameters corresponding to lightness, redness/greenness and yellowness/blueness, respectively. A–C Effect of HG/OG ratio; for the same system (BG or HG), and for the same hydrogel-forming agent, different letters in the same column indicate significant differences (p < 0.05). a,b Effect of hydrogel-forming agent; for the same system (BG or HG), and for the same HG/OG ratio, different letters in the same column indicate significant differences (p < 0.05). 1−3 Effect of HG/OG ratio in OG; different numbers in the same column indicate significant differences (p < 0.05).
Table 6. Percentages of the different ingredients in 100 g of BG, depending on the HG-forming agent and the formulated HG/OG ratio.
HG PhaseOG Phase
BGI-CFEWaterGelatin (GA)Gellan Gum (GG)P-CFEOPOBWSoy Lecithin
70GA/3030.0035.005.00-1.0025.203.750.075
60GA/4030.0025.714.29-1.0033.905.000.100
50GA/5030.0016.433.57-1.0042.626.250.125
70GG/3030.0039.30-0.701.0025.203.750.075
60GG/4030.0029.40-0.601.0033.905.000.100
50GG/5030.0019.50-0.501.0042.626.250.125
C-60GA/40-55.714.29--34.905.000.100
C-60GG/40-59.40-0.60-34.905.000.100
HG, hydrogel; OG, oleogel; BG, bigel; I-CFE, inositol-rich carob fruit extract; P-CFE, phenolic compound-rich carob fruit extract; OPO, olive pomace oil; BW, beeswax.
Disclaimer/Publisher’s Note: The statements, opinions and data contained in all publications are solely those of the individual author(s) and contributor(s) and not of MDPI and/or the editor(s). MDPI and/or the editor(s) disclaim responsibility for any injury to people or property resulting from any ideas, methods, instructions or products referred to in the content.