
Effect of Cassia Gum on the Gel Properties of Wheat Flour–Tapioca Starch-Based Batter and the Oil Absorption Capacity of Fried Small Yellow Croaker

Abstract

1. Introduction
2. Results and Discussion
2.1. Batter Pick-Up and Viscosity
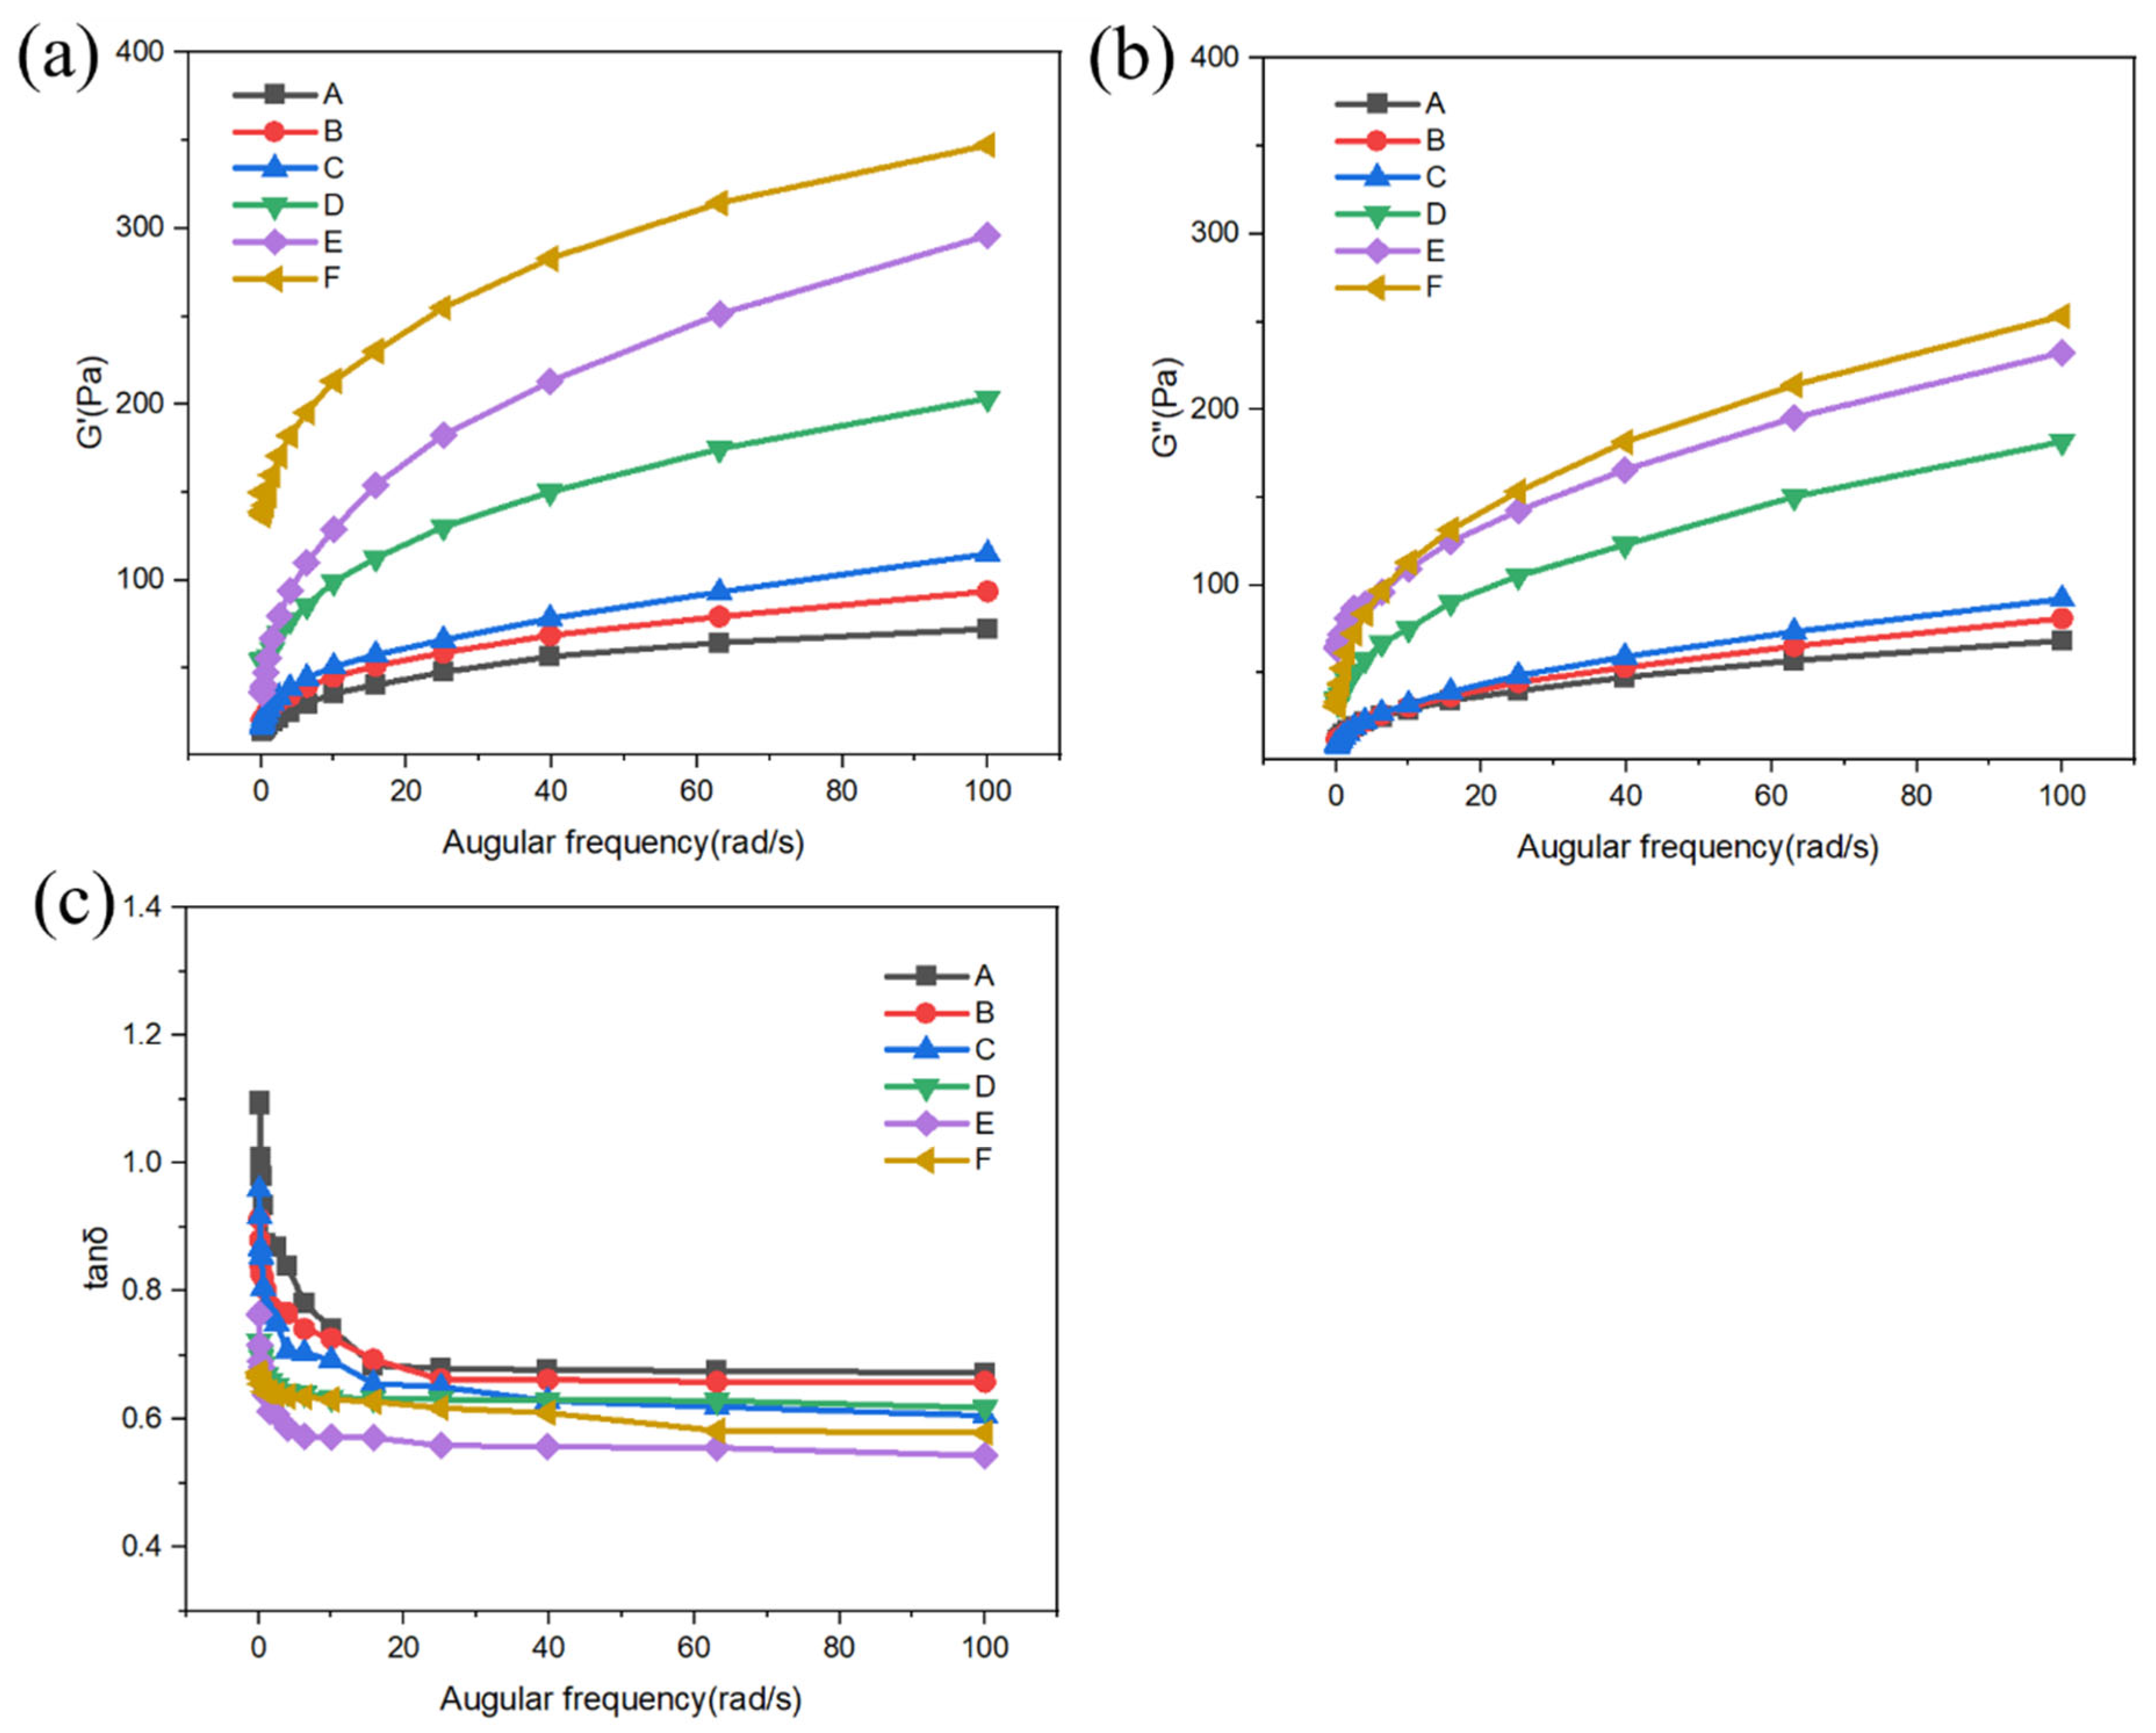
2.2. Dynamic Rheological Analysis
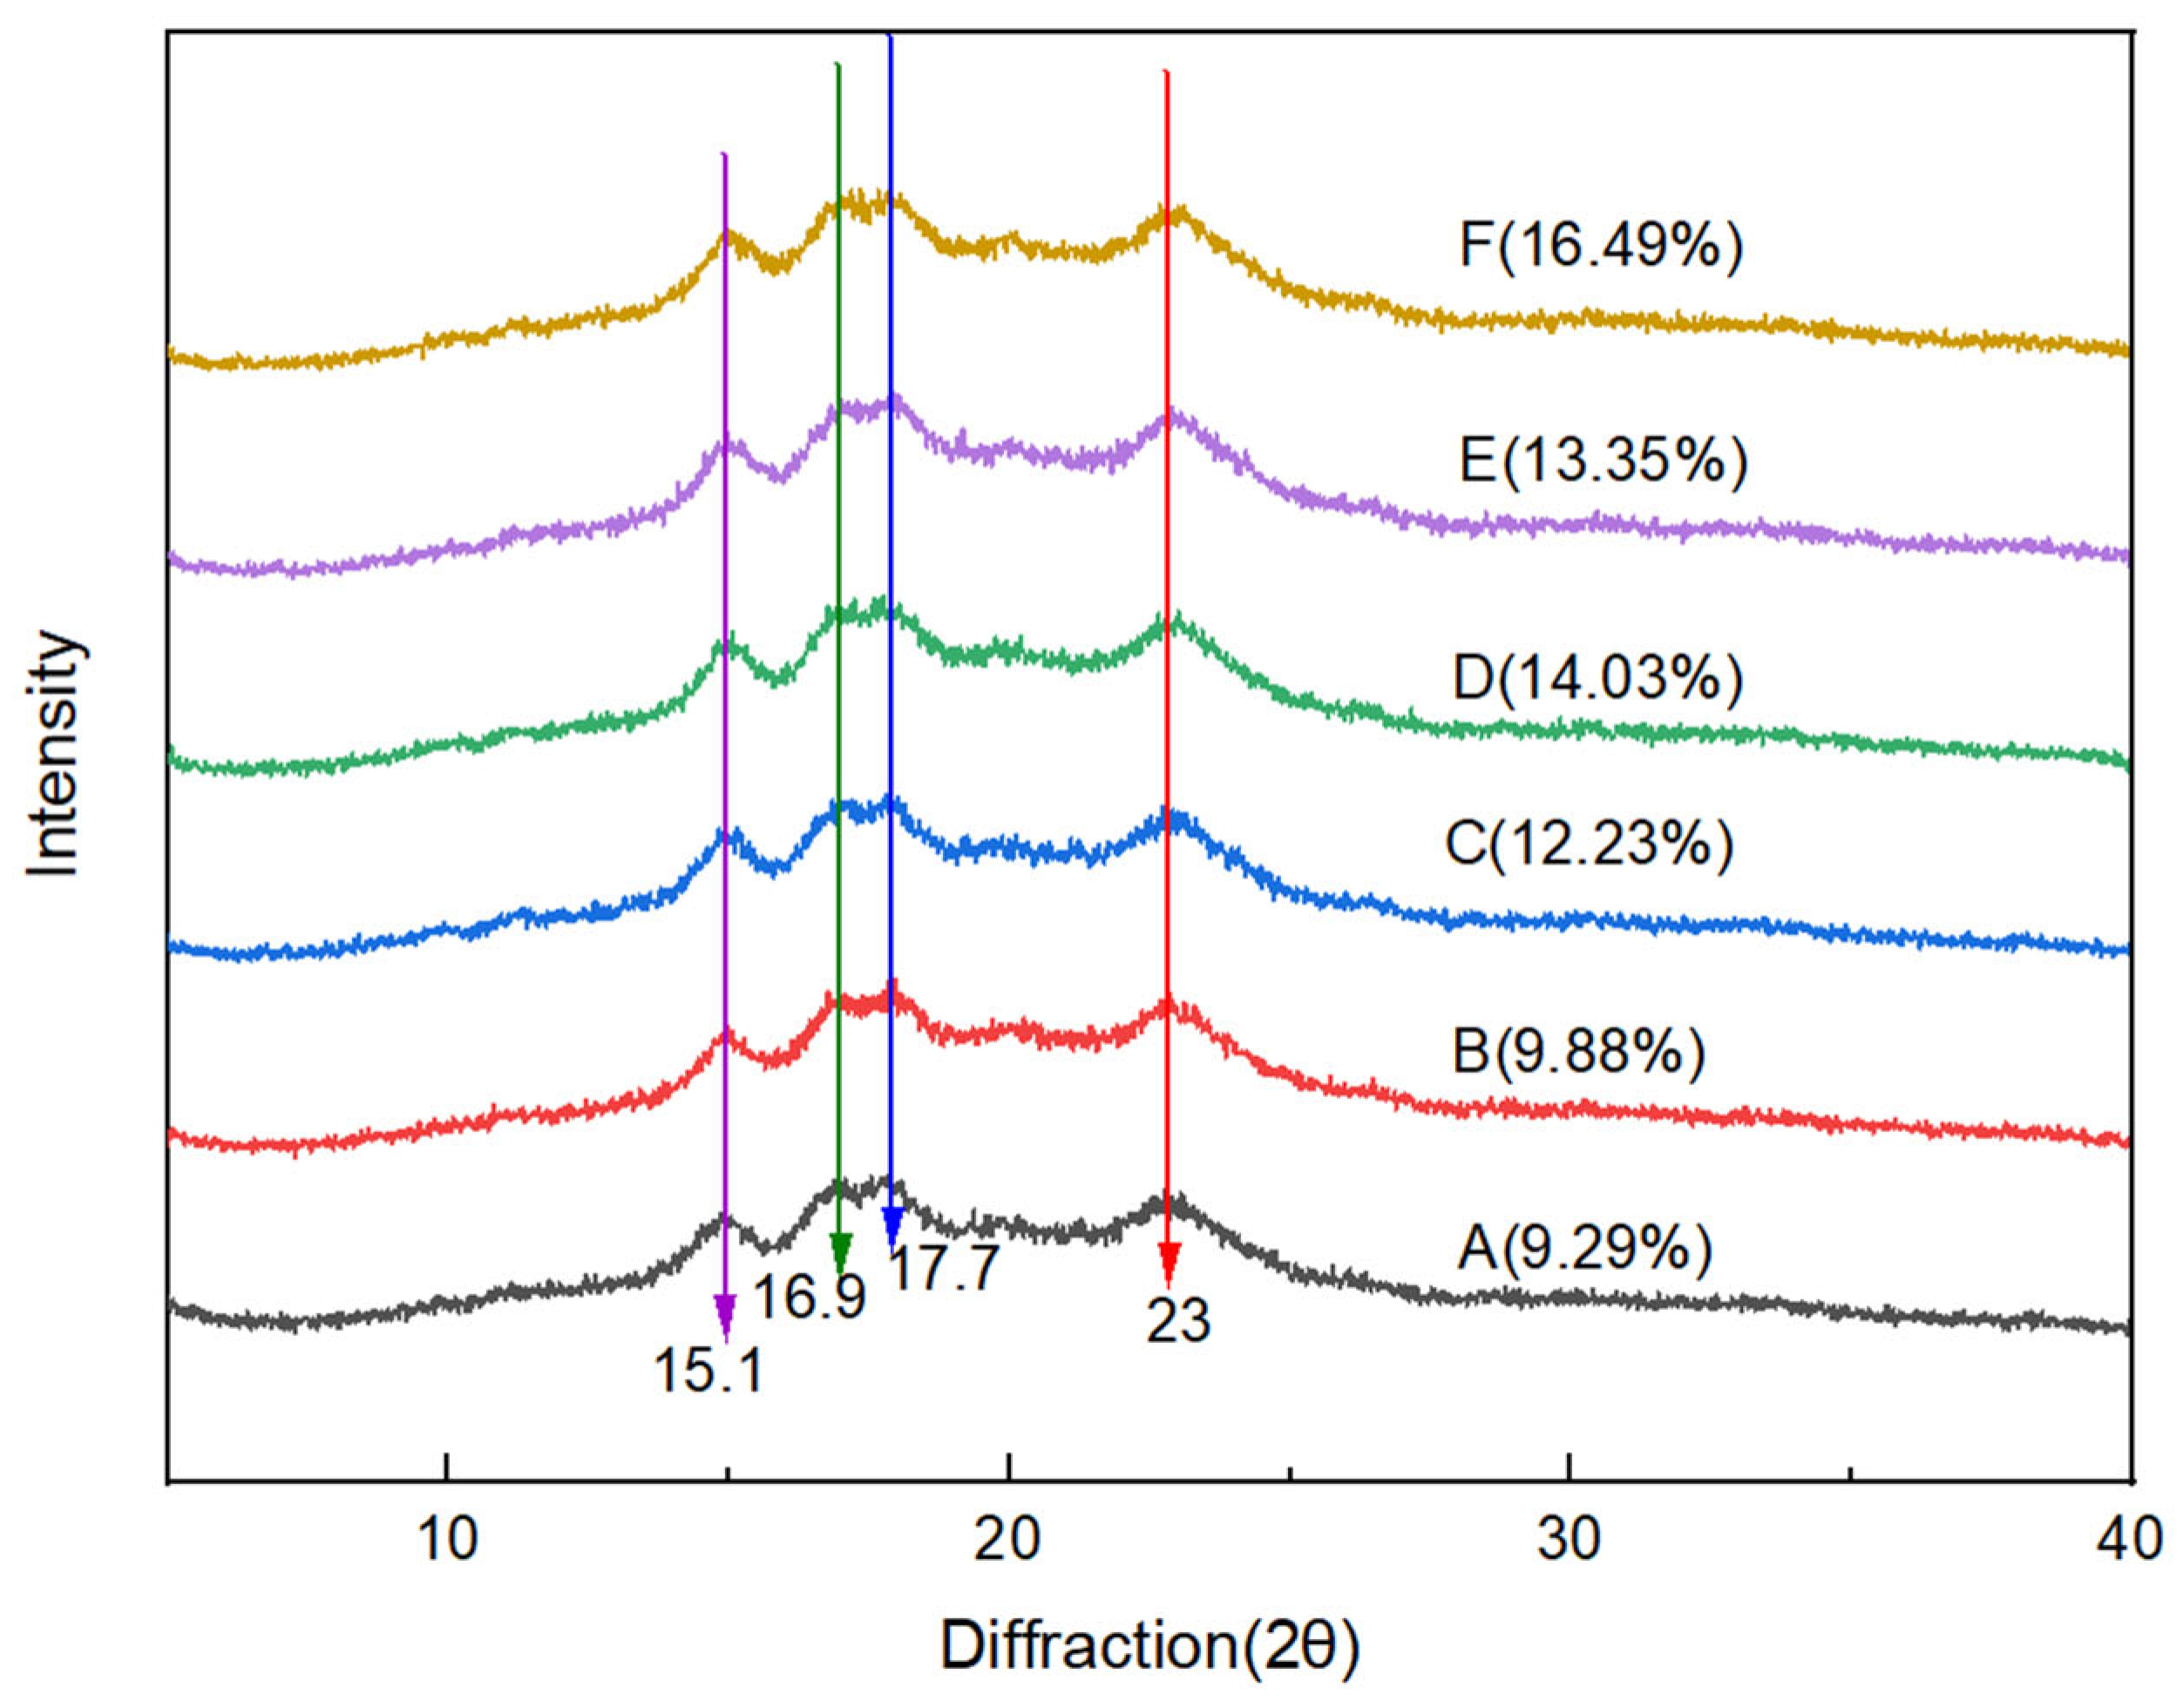
2.3. X-Ray Diffraction
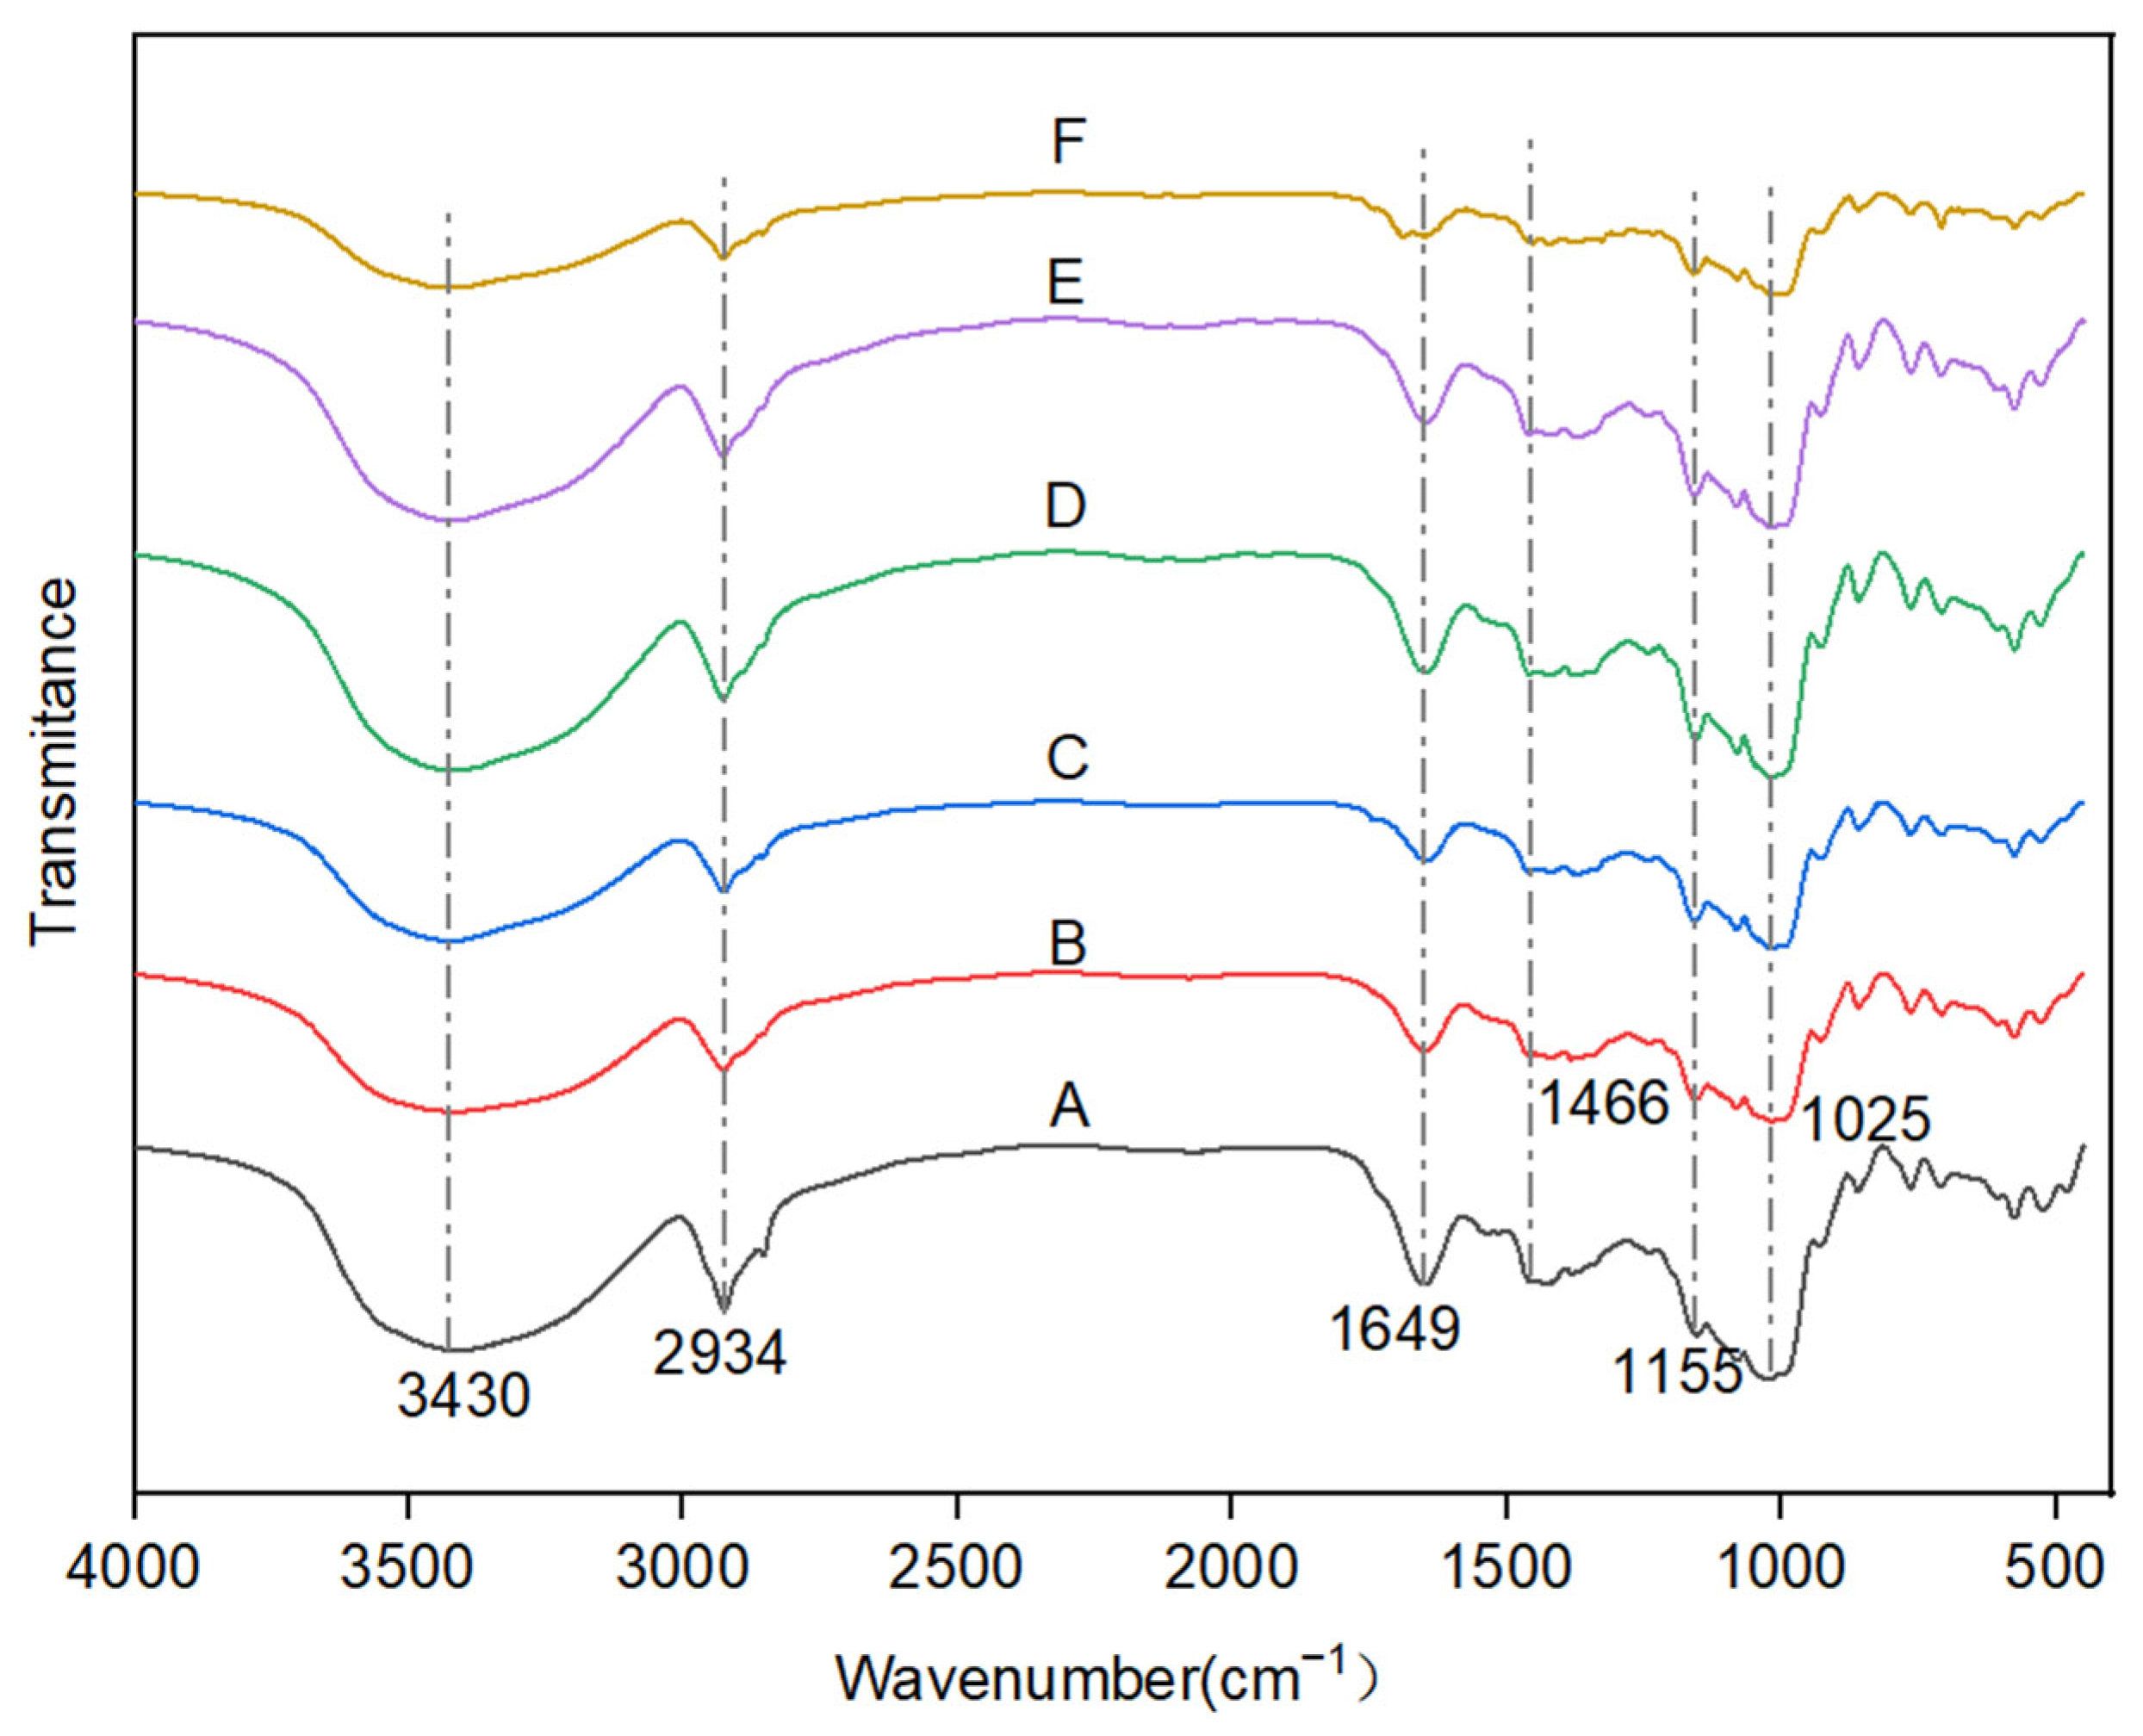
2.4. FTIR
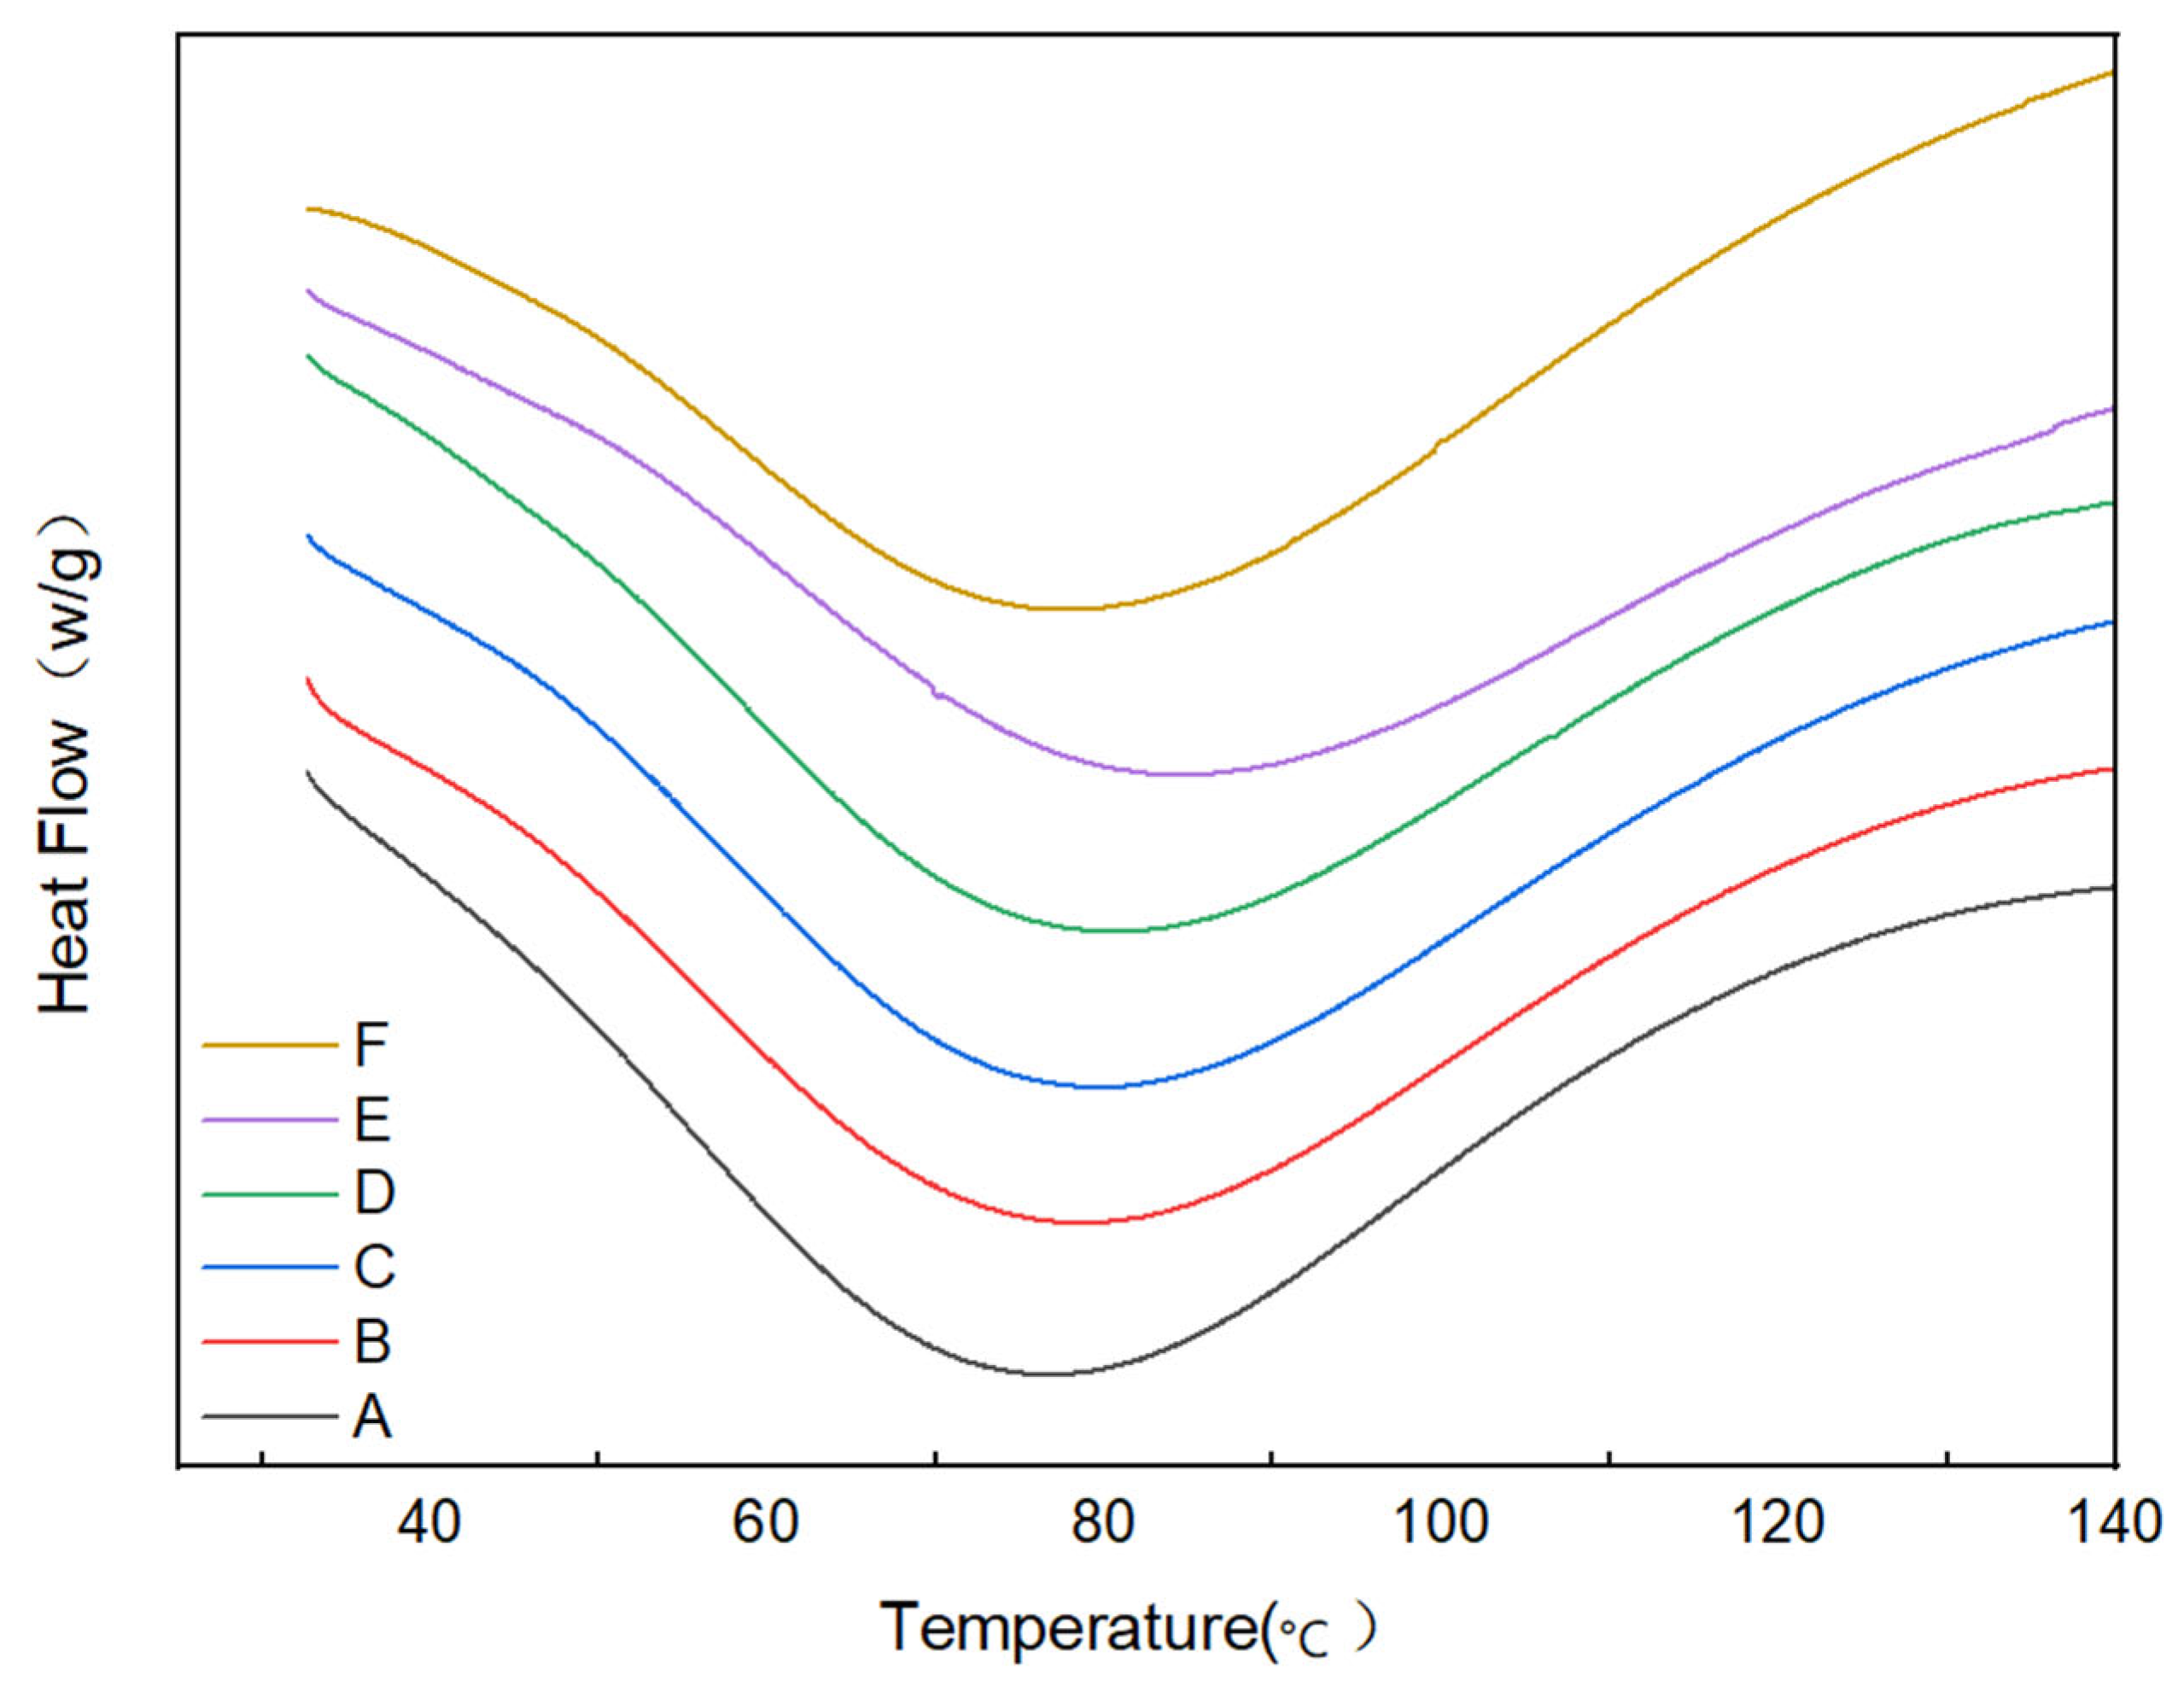
2.5. DSC
2.6. TGA
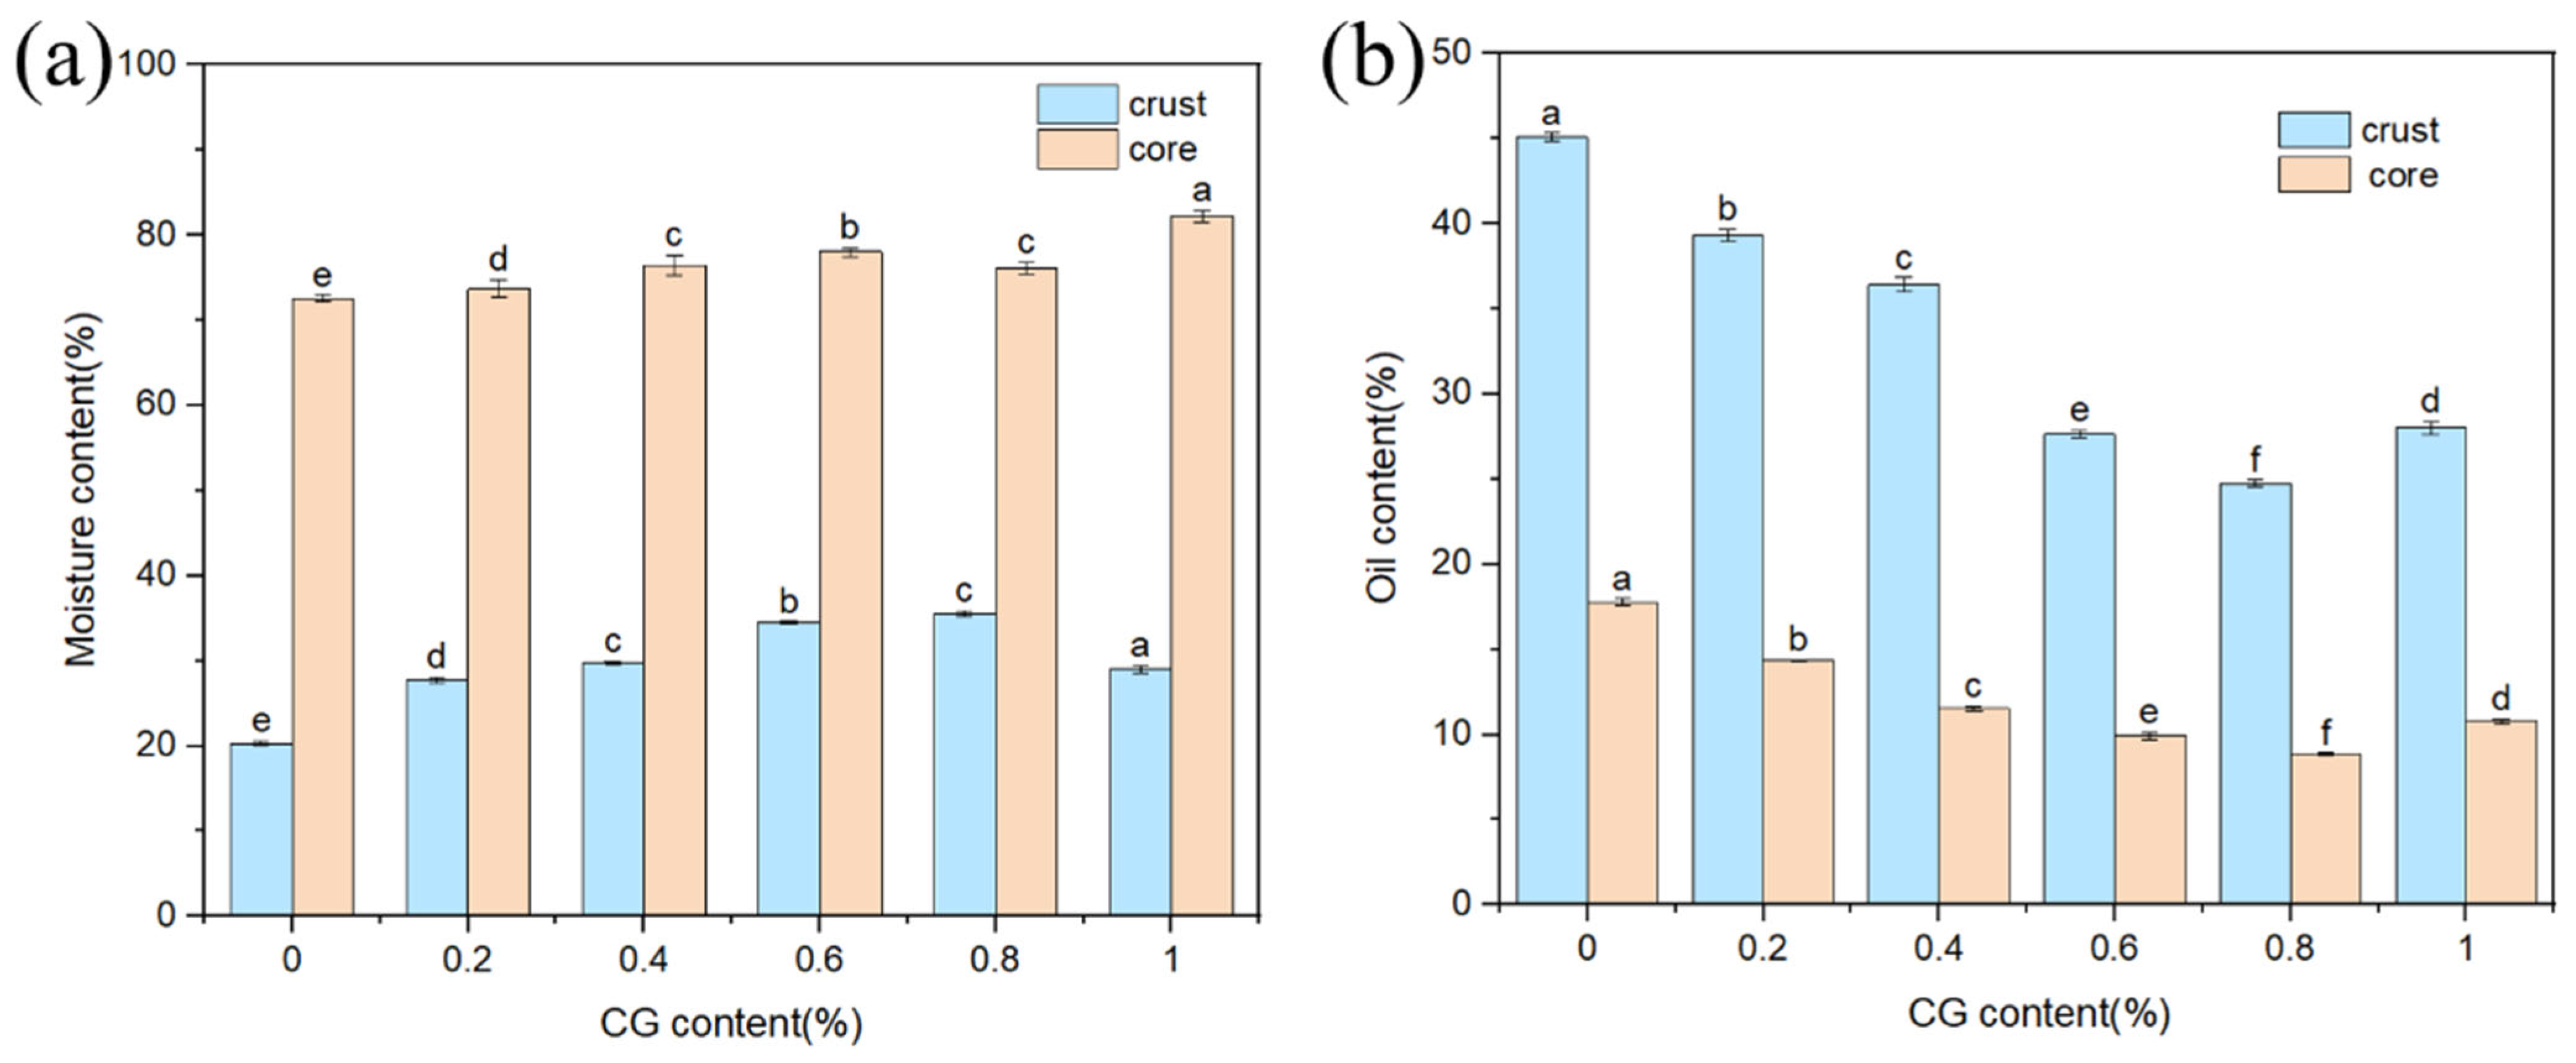
2.7. Moisture Content and Fat Content
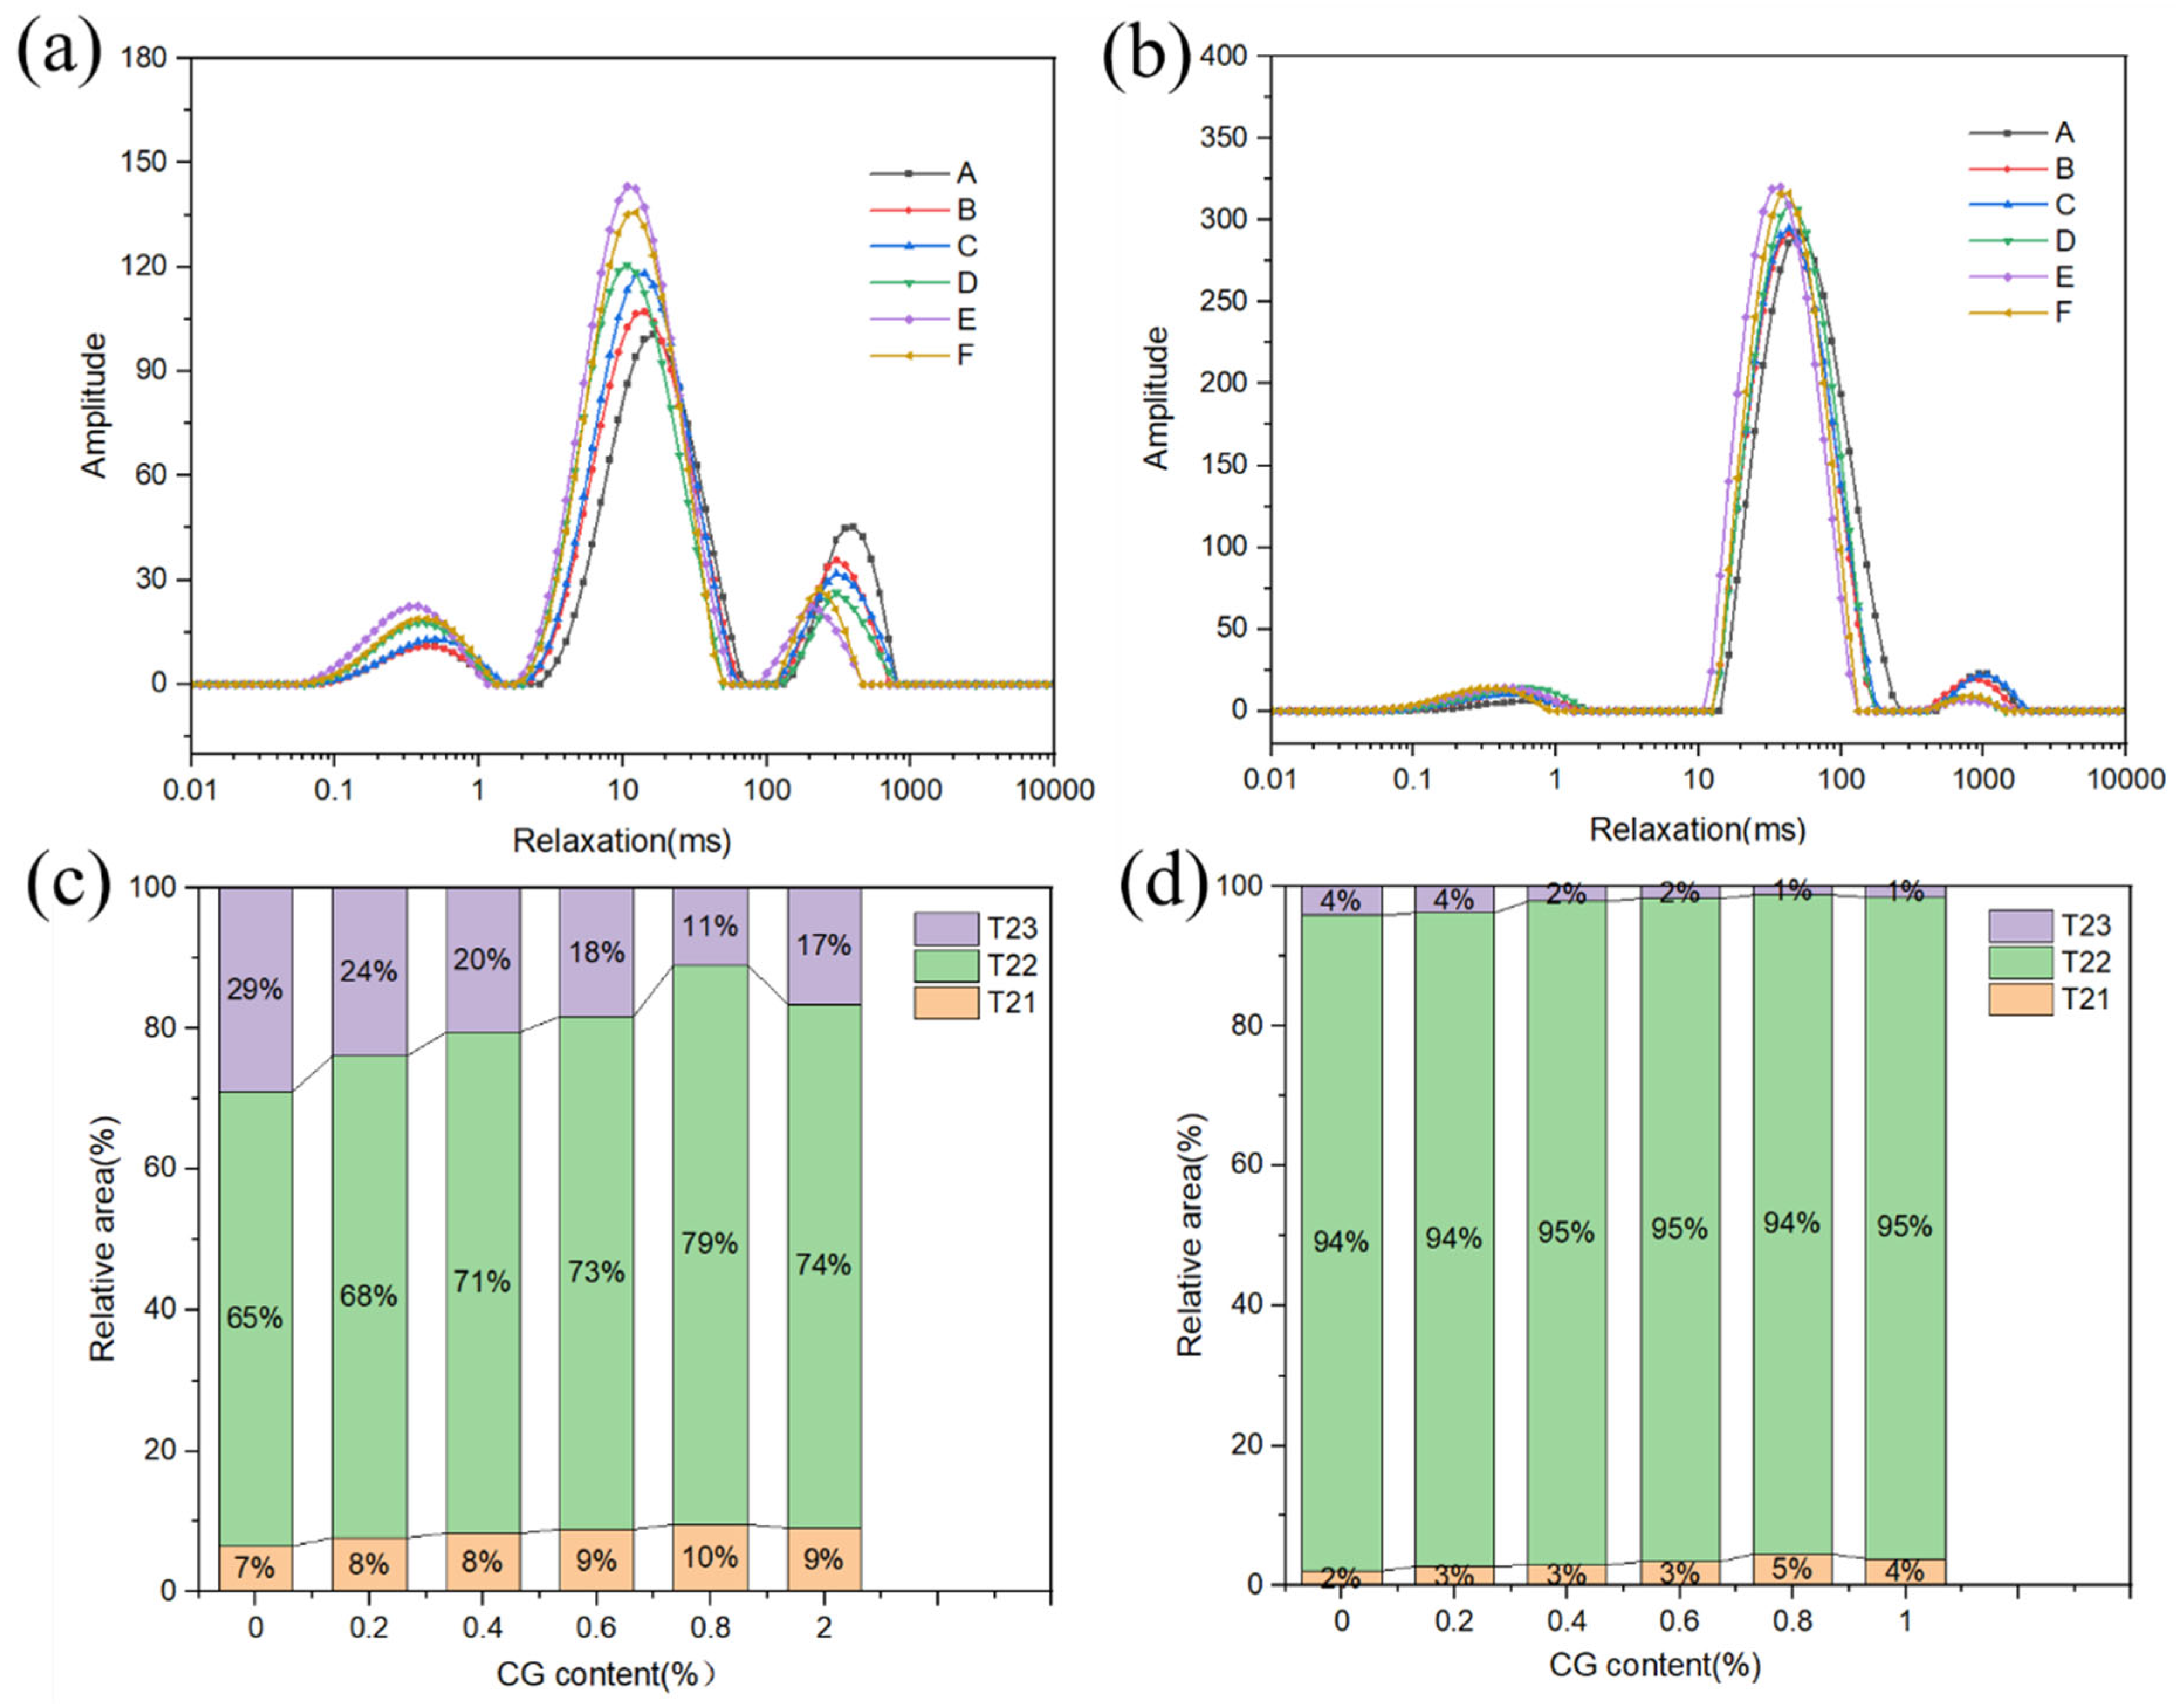
2.8. Moisture Status
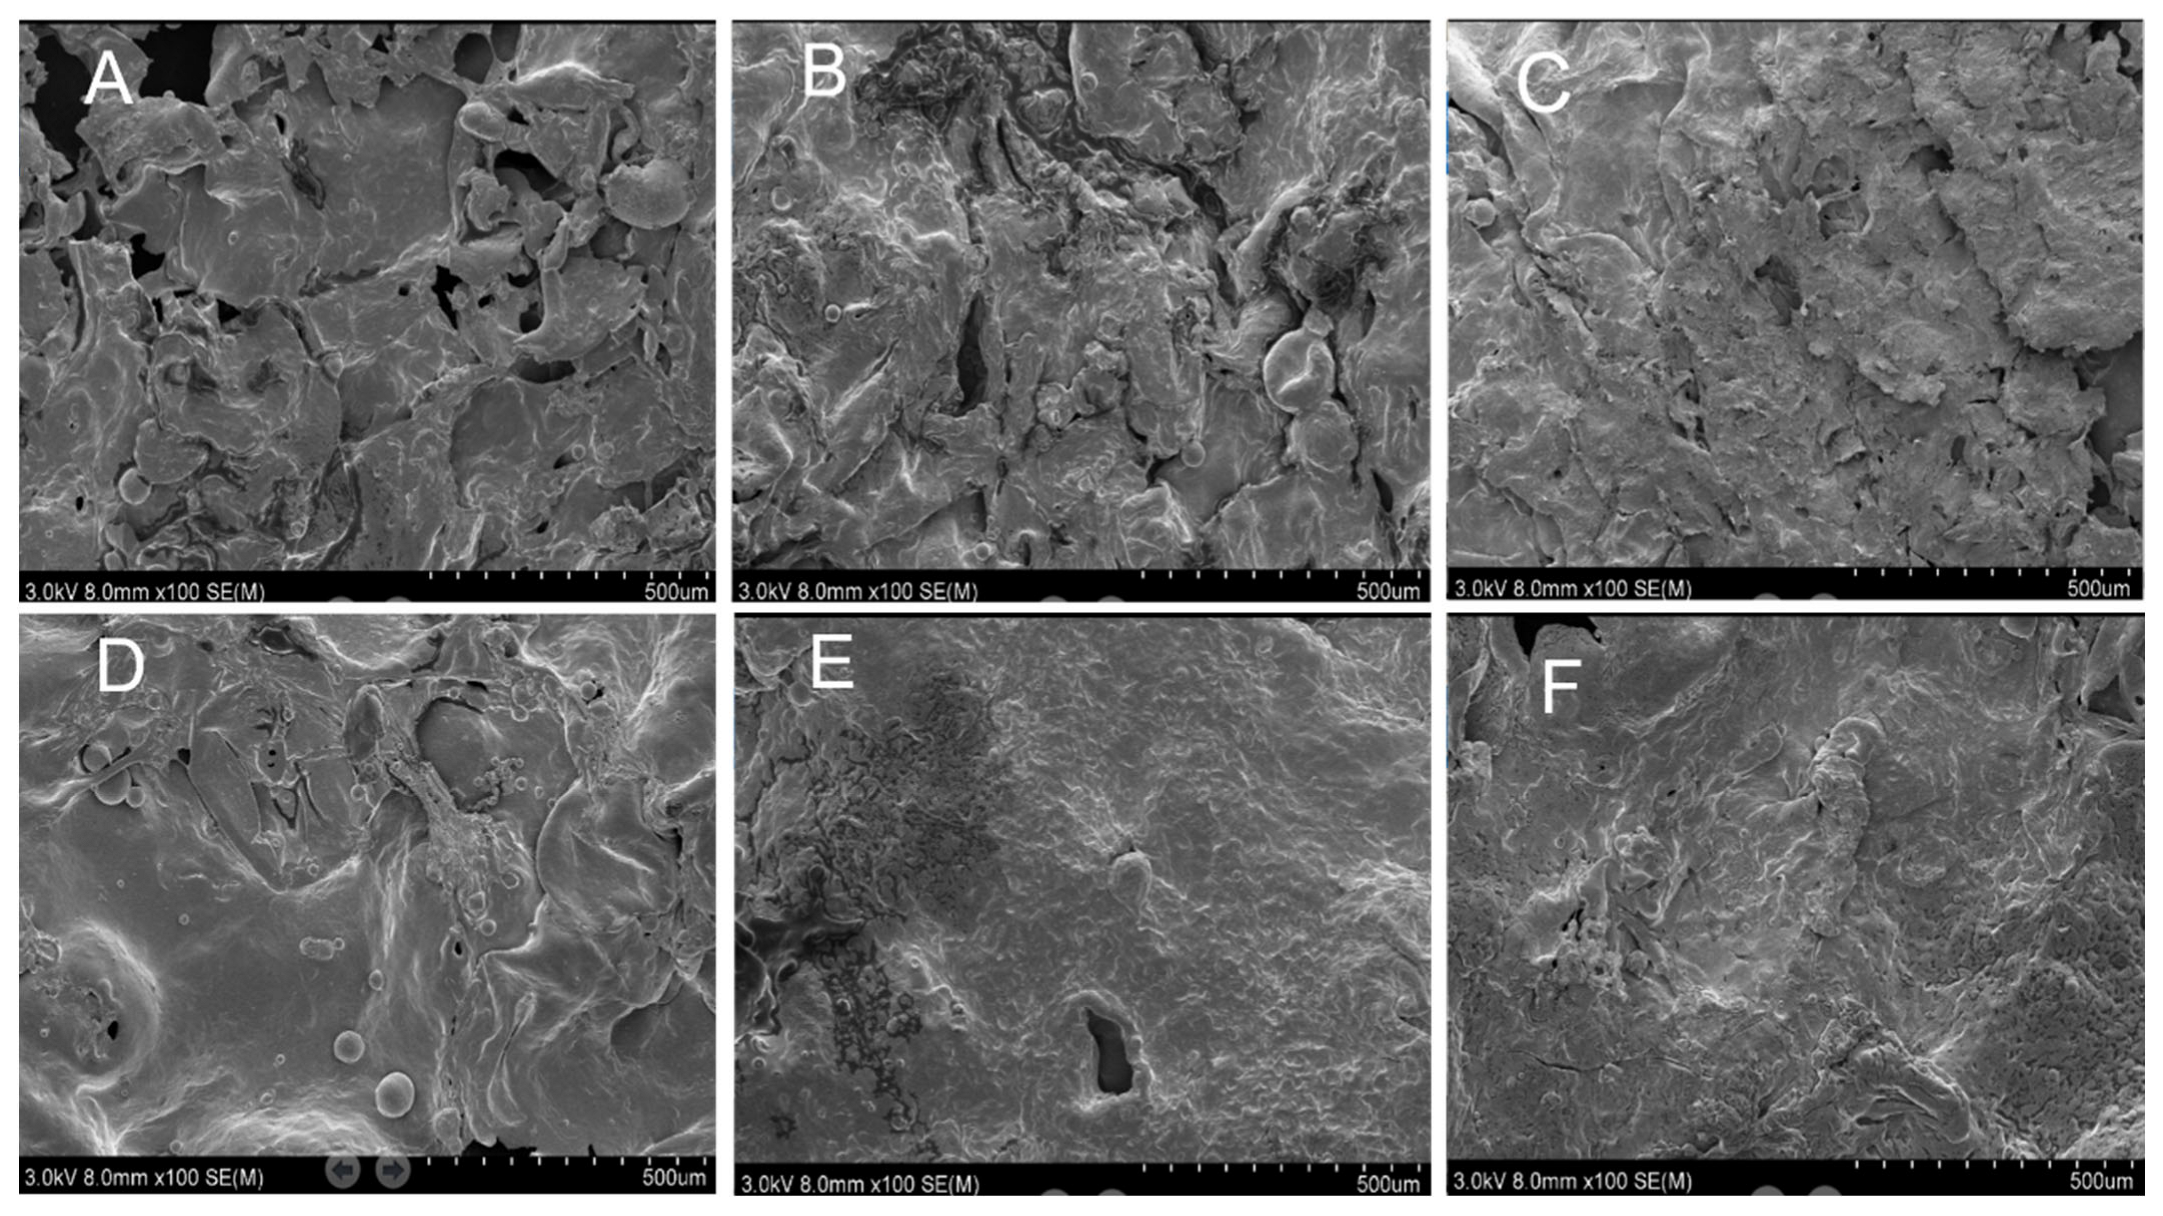
2.9. Scanning Electron Microscopy (SEM)
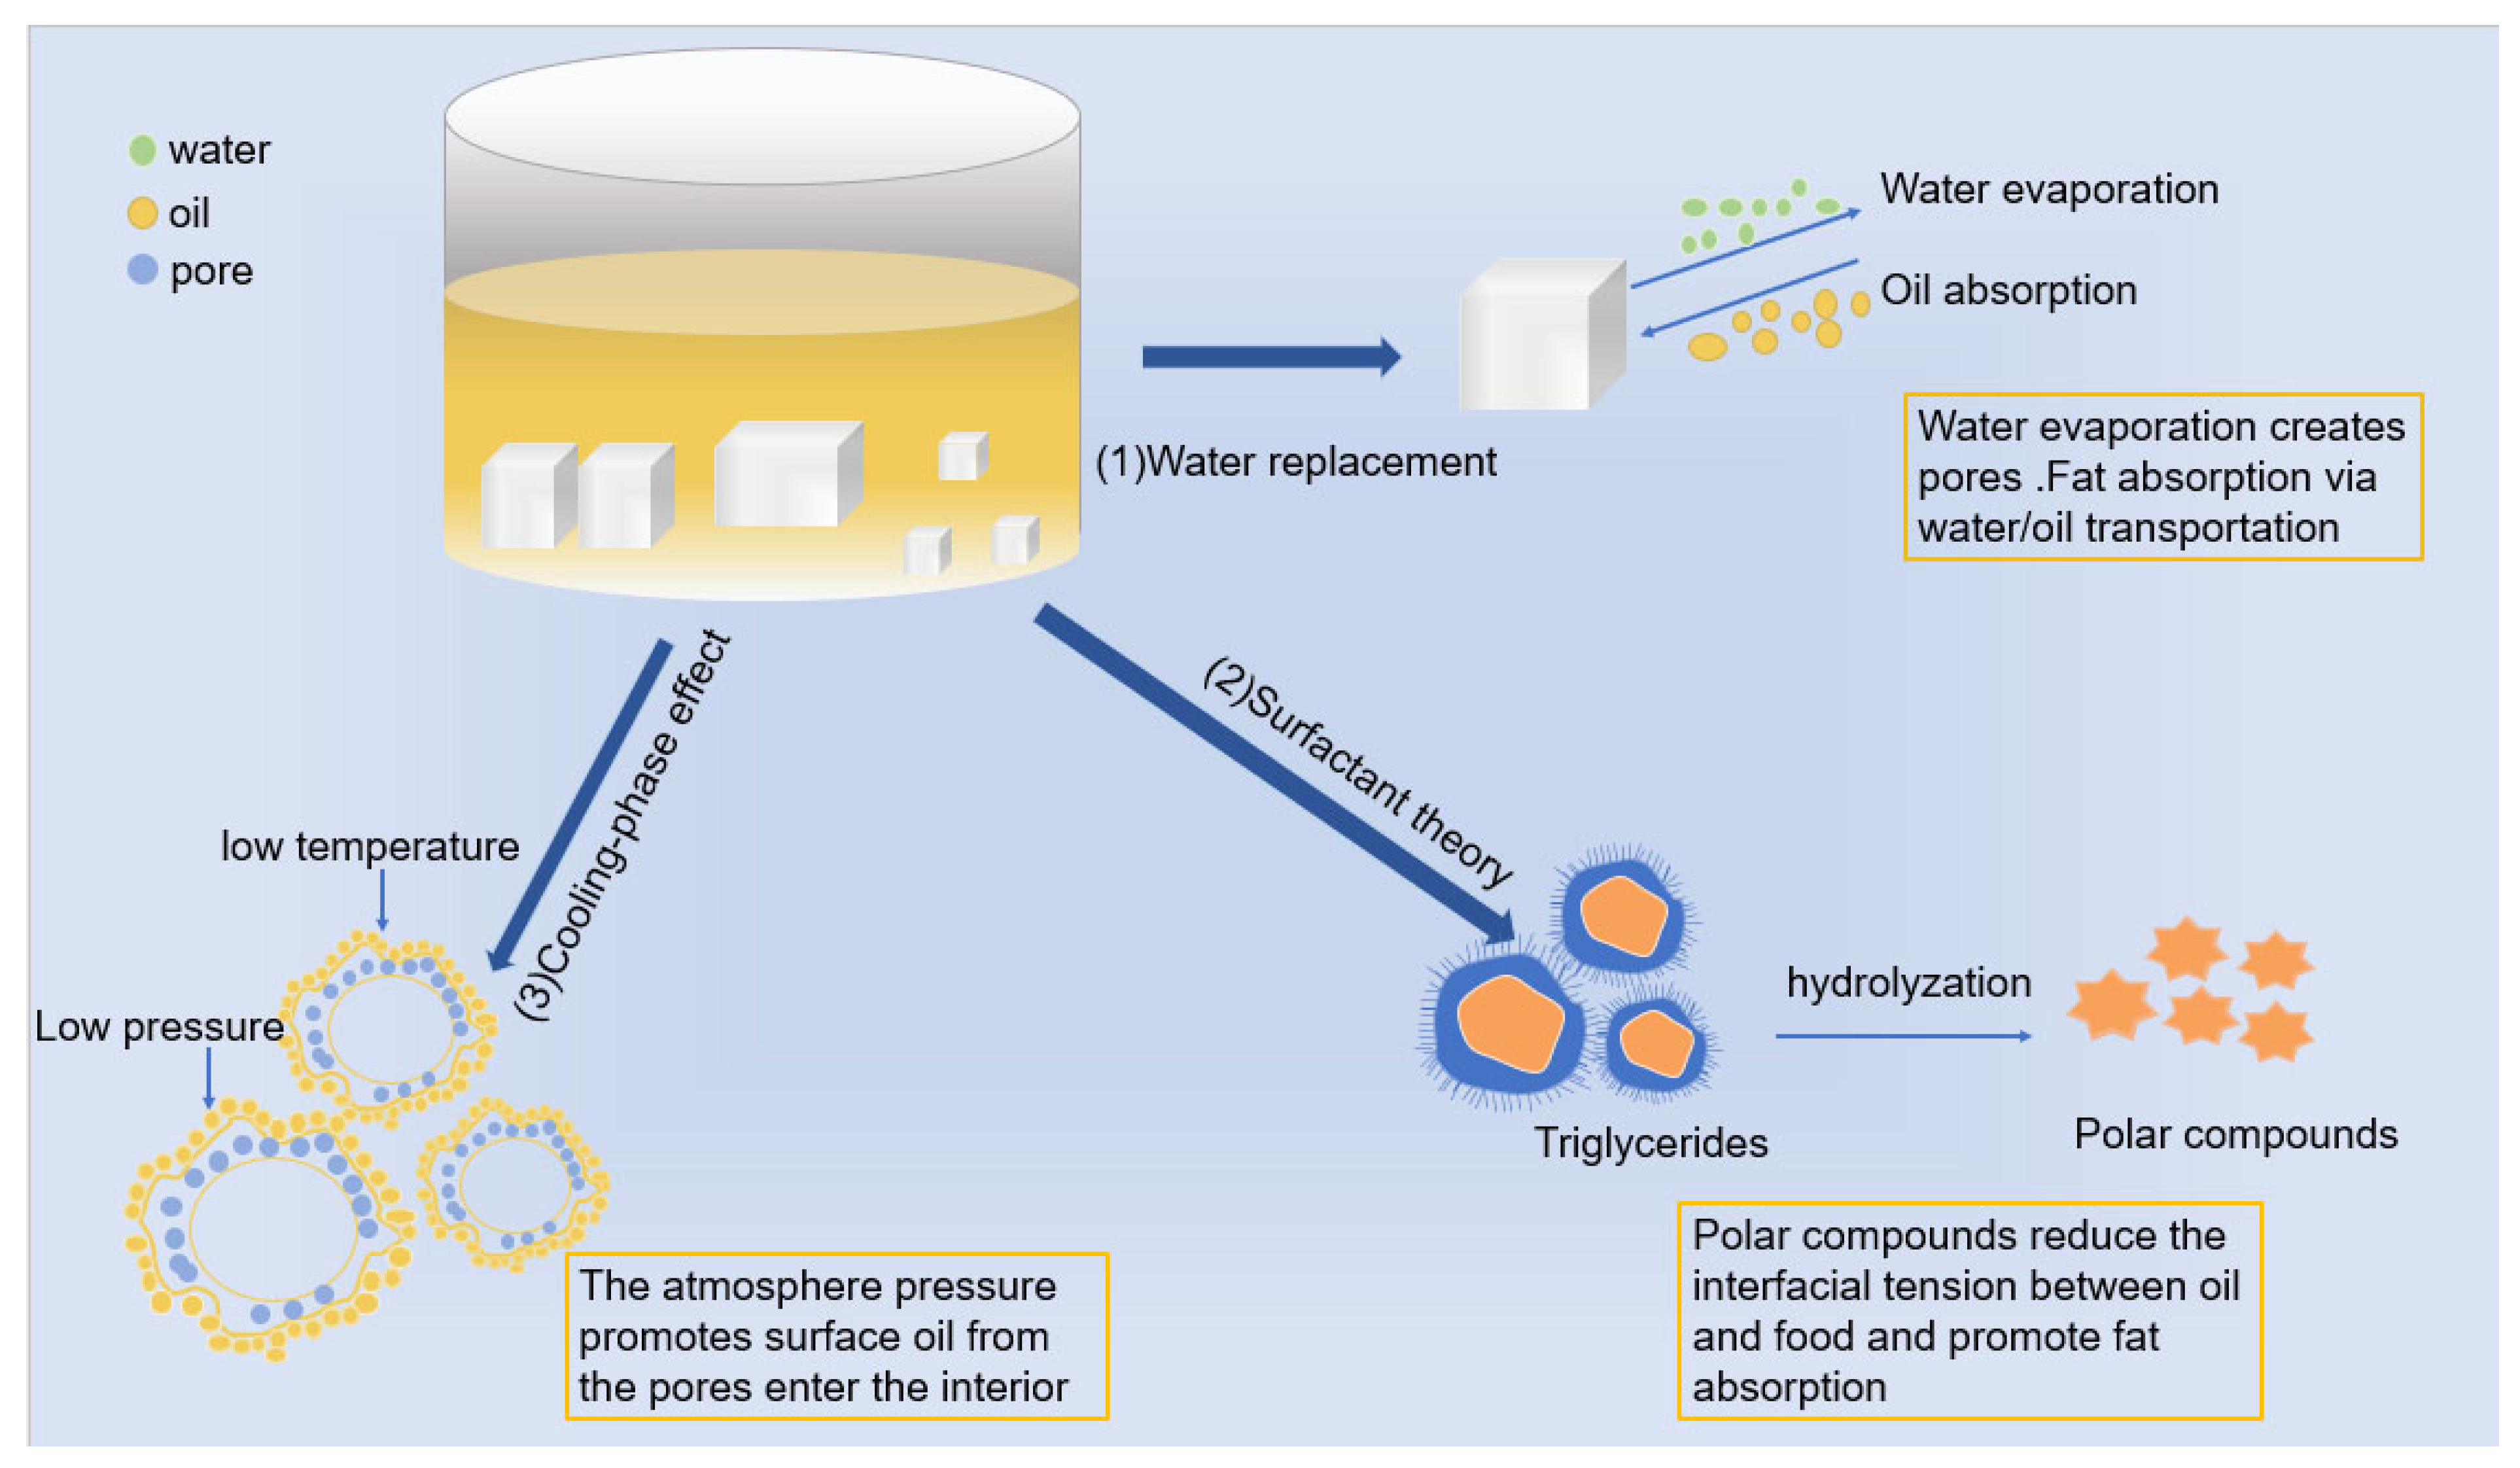
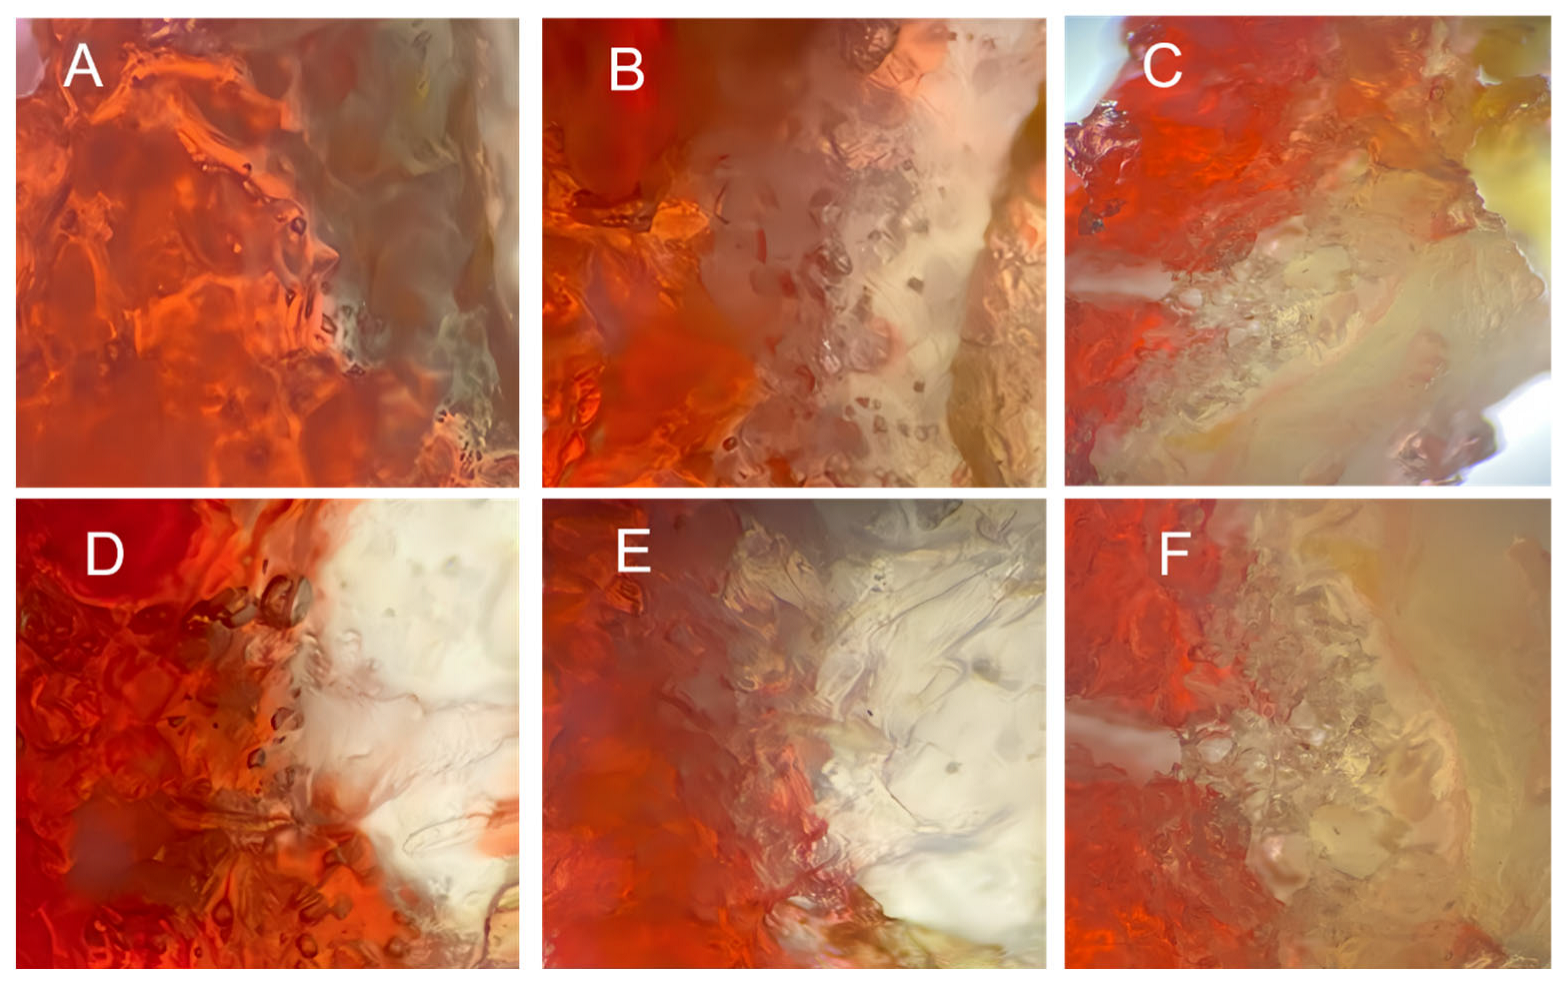
2.10. Grease Penetration
3. Conclusions
4. Materials and Methods
4.1. Materials
4.2. Batter Preparation
4.3. Preparation of Fried Battered Small Yellow Croaker (BFYC)
4.4. Batter Pick-Up
4.5. Viscosity
4.6. Dynamic Rheological Properties
4.7. X-Ray Diffraction Analysis
4.8. Fourier Transform Infrared Spectroscopy (FTIR)
4.9. Differential Scanning Calorimeter (DSC)
4.10. Thermogravimetric Analysis (TGA)
4.11. Moisture Content
4.12. Fat Content
4.13. Moisture Status Determination
4.14. Scanning Electron Microscope (SEM) Observation
4.15. Sudan Red Staining
4.16. Statistical Analysis
Author Contributions
Funding
Informed Consent Statement
Data Availability Statement
Acknowledgments
Conflicts of Interest
References
- Kurek, M.; Ščetar, M.; Galić, K. Edible Coatings Minimize Fat Uptake in Deep Fat Fried Products: A Review. Food Hydrocoll. 2017, 71, 225–235. [Google Scholar] [CrossRef]
- Yang, D.; Wu, G.; Li, P.; Qi, X.; Zhang, H.; Wang, X.; Jin, Q. Effect of Microwave Heating and Vacuum Oven Drying of Potato Strips on Oil Uptake during Deep-Fat Frying. Food Res. Int. 2020, 137, 109338. [Google Scholar] [CrossRef]
- Huang, X.; Zhang, Y.; Karrar, E.; Zhang, H.; Jin, Q.; Wu, G.; Wang, X. Effect of Moderate Electric Field on the Quality, Microstructure and Oil Absorption Behavior of Potato Strips during Deep-Fat Frying. J. Food Eng. 2022, 313, 110751. [Google Scholar] [CrossRef]
- Ching, L.W.; Zulkipli, N.‘A.M.; Muhamad, I.I.; Marsin, A.M.; Khair, Z.; Anis, S.N.S. Dietary Management for Healthier Batter Formulations. Trends Food Sci Technol. 2021, 113, 411–422. [Google Scholar] [CrossRef]
- Qi, J.; Wang, X.; Wang, X.; Akoh, C.C.; Jin, Q. Effect of Oil Type and Emulsifier on Oil Absorption of Steam-and-Fried Instant Noodles. J. Oleo Sci. 2019, 68, 559–566. [Google Scholar] [CrossRef] [PubMed]
- Zhai, J.; Chen, J.; Chen, C.; Peng, L.; Zhang, P. Understanding Changes in Moisture State, Wheat Gluten Structure and Oil Penetration of Breaded Fish Nuggets during Frying. LWT 2024, 198, 115967. [Google Scholar] [CrossRef]
- Ananey-Obiri, D.; Matthews, L.; Azahrani, M.H.; Ibrahim, S.A.; Galanakis, C.M.; Tahergorabi, R. Application of Protein-Based Edible Coatings for Fat Uptake Reduction in Deep-Fat Fried Foods with an Emphasis on Muscle Food Proteins. Trends Food Sci. Technol. 2018, 80, 167–174. [Google Scholar] [CrossRef]
- Cui, L.; Chen, J.; Zhai, J.; Peng, L.; Xiong, Y.L. Hydrocolloids-Aided Control of Oil Penetration and Distribution in Deep-Fried Breaded Fish Nuggets. Food Hydrocoll. 2023, 145, 109028. [Google Scholar] [CrossRef]
- Feng, J.; Chen, J.; Chen, C.; Yuan, Z.; Liao, E.; Xia, W.; Hayes, D.G. Batter Characteristics and Oil Penetration of Deep-Fried Breaded Fish Nuggets: Effect of Wheat Starch—Gluten Interaction. J. Food Qual. 2022, 2022, 2810432. [Google Scholar] [CrossRef]
- Mahmood, K.; Kamilah, H.; Shang, P.L.; Sulaiman, S.; Ariffin, F.; Alias, A.K. A Review: Interaction of Starch/Non-Starch Hydrocolloid Blending and the Recent Food Applications. Food Biosci. 2017, 19, 110–120. [Google Scholar] [CrossRef]
- Padalino, L.; Mastromatteo, M.; Sepielli, G.; Nobile, M.A.D. Formulation Optimization of Gluten-Free Functional Spaghetti Based on Maize Flour and Oat Bran Enriched in β-Glucans. Materials 2011, 4, 2119–2135. [Google Scholar] [CrossRef] [PubMed]
- Zhou, S.; Hong, Y.; Gu, Z.; Cheng, L.; Li, Z.; Li, C. Effect of Heat-Moisture Treatment on the in Vitro Digestibility and Physicochemical Properties of Starch-Hydrocolloid Complexes. Food Hydrocoll. 2020, 104, 105736. [Google Scholar] [CrossRef]
- Zhao, P.; Yan, X.; Cheng, M.; Wang, Y.; Wang, Y.; Wang, K.; Wang, X.; Wang, J. Effect of Pickering Emulsion on the Physical Properties, Microstructure and Bioactivity of Corn Starch/Cassia Gum Composite Films. Food Hydrocoll. 2023, 141, 108713. [Google Scholar] [CrossRef]
- Sharma, D.; Sharma, P. Synergistic Studies of Cassia tora Gum with Xanthan and Guar Gum: Carboxymethyl Synthesis of Cassia Gum-Xanthan Synergistic Blend and Characterization. Carbohyd. Polym. 2023, 523, 108723. [Google Scholar] [CrossRef]
- Gałkowska, D.; Pycia, K.; Juszczak, L.; Pająk, P. Influence of Cassia Gum on Rheological and Textural Properties of Native Potato and Corn Starch. Starch-Starke 2014, 66, 1060–1070. [Google Scholar] [CrossRef]
- Cao, L.; Ge, T.; Meng, F.; Xu, S.; Li, J.; Wang, L. An Edible Oil Packaging Film with Improved Barrier Properties and Heat Sealability from Cassia Gum Incorporating Carboxylated Cellulose Nano Crystal Whisker. Food Hydrocoll. 2020, 98, 105251. [Google Scholar] [CrossRef]
- Shan, J.; Chen, J.; Xie, D.; Xia, W.; Xu, W.; Xiong, Y.L. Effect of Xanthan Gum/Soybean Fiber Ratio in the Batter on Oil Absorption and Quality Attributes of Fried Breaded Fish Nuggets. J. Food Sci. 2018, 83, 1832–1838. [Google Scholar] [CrossRef]
- Han, X.; Liang, Q.; Rashid, A.; Qayum, A.; Rehman, A.; Zhong, M.; Sun, Y.; Liu, Y.; Ma, H.; Miao, S.; et al. The Effects of Different Hydrocolloids on Lotus Root Starch Gelatinization and Gels Properties. Int. J. Biol. Macromol. 2024, 257, 128562. [Google Scholar] [CrossRef] [PubMed]
- Li, J.; Zhu, Y.; Yadav, M.P.; Li, J. Effect of Various Hydrocolloids on the Physical and Fermentation Properties of Dough. Food Chem. 2019, 271, 165–173. [Google Scholar] [CrossRef]
- Zeng, F.; Yang, Y.; Liu, Q.; Yang, J.; Jin, Z.; Jiao, A. Effect of Fermentation Methods on Properties of Dough and Whole Wheat Bread. J. Sci. Food Agric. 2023, 103, 4876–4886. [Google Scholar] [CrossRef]
- Zhu, X.-J.; Guo, X.-N.; Zhu, K.-X. Effect of Sorbitol on the in Vitro Starch Digestibility in Semi-Dried Black Highland Barley Noodles. Int. J. Biol. Macromol. 2023, 236, 123959. [Google Scholar] [CrossRef]
- Xue, H.; Gao, H.; Fang, S.; Hao, Z.; Liao, X.; Tan, J. Understanding the Role of Radix Paeoniae Alba Polysaccharide for Corn Starch Gel Amelioration: Physicochemical, Structural, and Digestive Properties. Int. J. Biol. Macromol. 2025, 295, 139564. [Google Scholar] [CrossRef] [PubMed]
- Kong, J.; Mo, S.; Hu, J.; Shen, M.; Yu, Q.; Chen, Y.; Xie, J. Effects of Ficus pumila Linn. Polysaccharide on Physicochemical and Digestive Properties of Corn Starch. Food Biosci. 2024, 58, 103811. [Google Scholar] [CrossRef]
- von Borries-Medrano, E.; Jaime-Fonseca, M.R.; Aguilar-Méndez, M.A. Starch–Guar Gum Extrudates: Microstructure, Physicochemical Properties and in-Vitro Digestion. Food Chem. 2016, 194, 891–899. [Google Scholar] [CrossRef]
- Ren, Y.; Rong, L.; Shen, M.; Liu, W.; Xiao, W.; Luo, Y.; Xie, J. Interaction between Rice Starch and Mesona chinensis Benth Polysaccharide Gels: Pasting and Gelling Properties. Carbohyd. Polym. 2020, 240, 116316. [Google Scholar] [CrossRef] [PubMed]
- Zhang, C. Morphology, Pasting, and Structural Characteristics of Potato Starch/Xanthan Gum Blend by Critical Melting and Freeze-Thawing Treatment. Food Hydrocoll. 2021, 121, 107035. [Google Scholar] [CrossRef]
- Xue, Z.; Chen, Y.; Jia, Y.; Wang, Y.; Lu, Y.; Chen, H.; Zhang, M. Structure, Thermal and Rheological Properties of Different Soluble Dietary Fiber Fractions from Mushroom Lentinula edodes (Berk.) Pegler Residues. Food Hydrocoll. 2019, 95, 10–18. [Google Scholar] [CrossRef]
- Liu, Y.; Yang, L.; Ma, C.; Zhang, Y. Thermal Behavior of Sweet Potato Starch by Non-Isothermal Thermogravimetric Analysis. Materials 2019, 12, 699. [Google Scholar] [CrossRef]
- Chen, H.; Li, H.; Chen, K.; Wang, Z.; Fu, M.; Kan, J. Effect of Oleic Acid-Rich Rapeseed Oil on the Physicochemical, Rheological, and Structural Characteristics of Wheat Dough. Food Chem. 2024, 458, 140227. [Google Scholar] [CrossRef]
- Yao, F.; Wu, Q.; Lei, Y.; Guo, W.; Xu, Y. Thermal Decomposition Kinetics of Natural Fibers: Activation Energy with Dynamic Thermogravimetric Analysis. Polym. Degrad. Stab. 2008, 93, 90–98. [Google Scholar] [CrossRef]
- Sin, L.T.; Rahman, W.A.W.A.; Rahmat, A.R.; Mokhtar, M. Determination of Thermal Stability and Activation Energy of Polyvinyl Alcohol–Cassava Starch Blends. Carbohydr. Polym. 2011, 83, 303–305. [Google Scholar] [CrossRef]
- Ribotta, P.D.; Ausar, S.F.; Beltramo, D.M.; León, A.E. Interactions of Hydrocolloids and Sonicated-Gluten Proteins. Food Hydrocoll. 2005, 19, 93–99. [Google Scholar] [CrossRef]
- Ghanbarzadeh, B.; Almasi, H.; Entezami, A.A. Physical Properties of Edible Modified Starch/Carboxymethyl Cellulose Films. Innov. Food Sci. Emerg. Technol. 2010, 11, 697–702. [Google Scholar] [CrossRef]
- Ganjloo, A.; Bimakr, M.; Nazari, P. Process Optimization for Low--fat Deep--fried Zucchini Slices Preparation: Effect of Aloe Vera Gel Coating Concentration, Frying Temperature, and Frying Time. J. Food Process. Preserv. 2022, 46, e17158. [Google Scholar] [CrossRef]
- Feng, J.; Chen, J.; Zhai, J.; Zhang, P.; Peng, L. Reduced Fat Content of Fried Batter-Breaded Fish Nuggets by Adding Dietary Fibers: Insight into Wheat Starch and Gluten Conformations, Fiber Properties and Anti-Fat Absorption Capacities. Food Chem. 2025, 463, 141251. [Google Scholar] [CrossRef] [PubMed]
- Chen, Y.; Li, M.; Dharmasiri, T.S.K.; Song, X.; Liu, F.; Wang, X. Novel Ultrasonic-Assisted Vacuum Drying Technique for Dehydrating Garlic Slices and Predicting the Quality Properties by Low Field Nuclear Magnetic Resonance. Food Chem. 2020, 306, 125625. [Google Scholar] [CrossRef]
- Wang, C.; Su, G.; Wang, X.; Nie, S. Rapid Assessment of Deep Frying Oil Quality as Well as Water and Fat Contents in French Fries by Low-Field Nuclear Magnetic Resonance. J. Agric. Food Chem. 2019, 67, 2361–2368. [Google Scholar] [CrossRef]
- Jiang, Y.; Zhao, Y.; Zhu, Y.; Qin, S.; Deng, Y.; Zhao, Y. Effect of Dietary Fiber-Rich Fractions on Texture, Thermal, Water Distribution, and Gluten Properties of Frozen Dough during Storage. Food Chem. 2019, 297, 124902. [Google Scholar] [CrossRef]
- Du, Y.; Zhang, M.; Chen, H. Effect of Whey Protein on the 3D Printing Performance of Konjac Hybrid Gel. LWT 2021, 140, 110716. [Google Scholar] [CrossRef]
- Li, Z.; Wang, Q.; Zhang, Y.; Li, M.; Xiao, J.; Liu, Y.; Li, X. The Impact of Flaxseed Gum Addition on Oil Absorption of Deep-Fried Dough Sticks and Its Underlying Mechanism. Food Chem. 2025, 465, 141966. [Google Scholar] [CrossRef]
- Kim, J.; Choi, I.; Shin, W.-K.; Kim, Y. Effects of HPMC (Hydroxypropyl Methylcellulose) on Oil Uptake and Texture of Gluten-Free Soy Donut. LWT 2015, 62, 620–627. [Google Scholar] [CrossRef]
- Sharma, R.; Oberoi, D.P.S.; Sogi, D.S.; Gill, B.S. Effect of sugar and gums on the pasting properties of cassava starch. J. Food Process. Preserv. 2009, 33, 401–414. [Google Scholar] [CrossRef]
- Primo-Martín, C.; Sanz, T.; Steringa, D.W.; Salvador, A.; Fiszman, S.M.; van Vliet, T. Performance of Cellulose Derivatives in Deep-Fried Battered Snacks: Oil Barrier and Crispy Properties. Food Hydrocoll. 2010, 24, 702–708. [Google Scholar] [CrossRef]
- Brannan, R.G.; Mah, E.; Schott, M.; Yuan, S.; Casher, K.L.; Myers, A.; Herrick, C. Influence of Ingredients That Reduce Oil Absorption during Immersion Frying of Battered and Breaded Foods. Eur. J. Lipid Sci. Technol. 2014, 116, 240–254. [Google Scholar] [CrossRef]
- Lalam, S.; Sandhu, J.S.; Takhar, P.S.; Thompson, L.D.; Alvarado, C. Experimental Study on Transport Mechanisms during Deep Fat Frying of Chicken Nuggets. LWT 2013, 50, 110–119. [Google Scholar] [CrossRef]
- Salvador, A.; Sanz, T.; Fiszman, S.M. Effect of the Addition of Different Ingredients on the Characteristics of a Batter Coating for Fried Seafood Prepared without a Pre-Frying Step. Food Hydrocoll. 2005, 19, 703–708. [Google Scholar] [CrossRef]
- Sun, Y.; Zhang, M.; Fan, D. Effect of Ultrasonic on Deterioration of Oil in Microwave Vacuum Frying and Prediction of Frying Oil Quality Based on Low Field Nuclear Magnetic Resonance (LF-NMR). Ultrason. Sonochem. 2019, 51, 77–89. [Google Scholar] [CrossRef] [PubMed]
- Zou, Q.; Liu, Y.; Luo, L.; Chen, Y.; Zheng, Y.; Ran, G.; Liu, D. Screening of Optimal Konjac Glucomannan–Protein Composite Gel Formulations to Mimic the Texture and Appearance of Tripe. Gels 2024, 10, 528. [Google Scholar] [CrossRef] [PubMed]
- Zhang, J.; Tao, L.; Tang, J.; Xiong, B.; Zhao, Y.; Ma, T.; Yu, L. Effects of Starch Hydration Properties on the Batter Properties and Oil Absorption of Fried Crust and Battered Ham Sausages. Int. J. Biol. Macromol. 2024, 258, 128915. [Google Scholar] [CrossRef]
- Zhang, J.; Yang, S.; Liu, H.; Tao, L.; Lan, W.; Liu, B.; Yu, L.; Wang, L. Starch Hydration Properties in Relation to Kinetic Modelling of Mass Transfer and Properties of Deep-Frying Batter. Food Res. Int. 2024, 196, 115015. [Google Scholar] [CrossRef]
- Zhang, J.-G.; Zhang, Y.; Zhang, W.-W.; Thakur, K.; Hu, F.; Ni, Z.-J.; Wei, Z.-J. Mechanistic Evaluation of Carboxymethyl Cellulose Physicochemical and Functional Activity of Breadcrumbs after Frying. LWT 2024, 201, 116232. [Google Scholar] [CrossRef]
- Zhang, J.; Tao, L.; Zhang, X.; Sui, X.; Song, S.; Wei, Y.; Yu, L. Carboxymethylation Enhances the Low Oil Absorption of Freeze-Thawed Tapioca Starch in Fried Ham Sausage Batter. LWT 2023, 184, 115050. [Google Scholar] [CrossRef]


| CG Content (%) | Viscosity (cP) | Batter Pick-Up (%) |
|---|---|---|
| 0 | 2131.45 ± 45.68 f | 38.68 ± 0.46 e |
| 0.2 | 3224.93 ± 94.73 e | 39.85 ± 0.59 e |
| 0.4 | 5150.50 ± 137.46 d | 42.89 ± 0.62 d |
| 0.6 | 8103.49 ± 19.55 c | 52.35 ± 0.53 c |
| 0.8 | 11,882.19 ± 171.38 b | 70.48 ± 1.18 b |
| 1 | 15,567.00 ± 166.47 a | 84.81 ± 1.61 a |
| CG Content (%) | Tp (°C) | ΔH (J/g) |
|---|---|---|
| 0 | 78.23 ± 0.84 c | 17.329 ± 0.12 e |
| 0.2 | 78.93 ± 0.34 bc | 17.97 ± 0.17 e |
| 0.4 | 80.84 ± 1.05 abc | 19.96 ± 0.35 d |
| 0.6 | 81.81 ± 1.24 ab | 21.14 ± 0.29 c |
| 0.8 | 82.08 ± 1.09 a | 23.35 ± 0.25 a |
| 1 | 80.31 ± 0.34 abc | 22.15 ± 0.30 b |
Disclaimer/Publisher’s Note: The statements, opinions and data contained in all publications are solely those of the individual author(s) and contributor(s) and not of MDPI and/or the editor(s). MDPI and/or the editor(s) disclaim responsibility for any injury to people or property resulting from any ideas, methods, instructions or products referred to in the content. |
© 2025 by the authors. Licensee MDPI, Basel, Switzerland. This article is an open access article distributed under the terms and conditions of the Creative Commons Attribution (CC BY) license (https://creativecommons.org/licenses/by/4.0/).
Share and Cite
Ran, G.; Zhang, Q.; Liao, Y.; Xu, L.; Zou, Q. Effect of Cassia Gum on the Gel Properties of Wheat Flour–Tapioca Starch-Based Batter and the Oil Absorption Capacity of Fried Small Yellow Croaker. Gels 2025, 11, 469. https://doi.org/10.3390/gels11060469
Ran G, Zhang Q, Liao Y, Xu L, Zou Q. Effect of Cassia Gum on the Gel Properties of Wheat Flour–Tapioca Starch-Based Batter and the Oil Absorption Capacity of Fried Small Yellow Croaker. Gels. 2025; 11(6):469. https://doi.org/10.3390/gels11060469
Chicago/Turabian StyleRan, Guilian, Qiang Zhang, Yiping Liao, Liufang Xu, and Qiang Zou. 2025. "Effect of Cassia Gum on the Gel Properties of Wheat Flour–Tapioca Starch-Based Batter and the Oil Absorption Capacity of Fried Small Yellow Croaker" Gels 11, no. 6: 469. https://doi.org/10.3390/gels11060469
APA StyleRan, G., Zhang, Q., Liao, Y., Xu, L., & Zou, Q. (2025). Effect of Cassia Gum on the Gel Properties of Wheat Flour–Tapioca Starch-Based Batter and the Oil Absorption Capacity of Fried Small Yellow Croaker. Gels, 11(6), 469. https://doi.org/10.3390/gels11060469