
Bio-Gel Formation Through Enzyme-Induced Carbonate Precipitation for Dust Control in Yellow River Silt

 , ,
, ,
Abstract
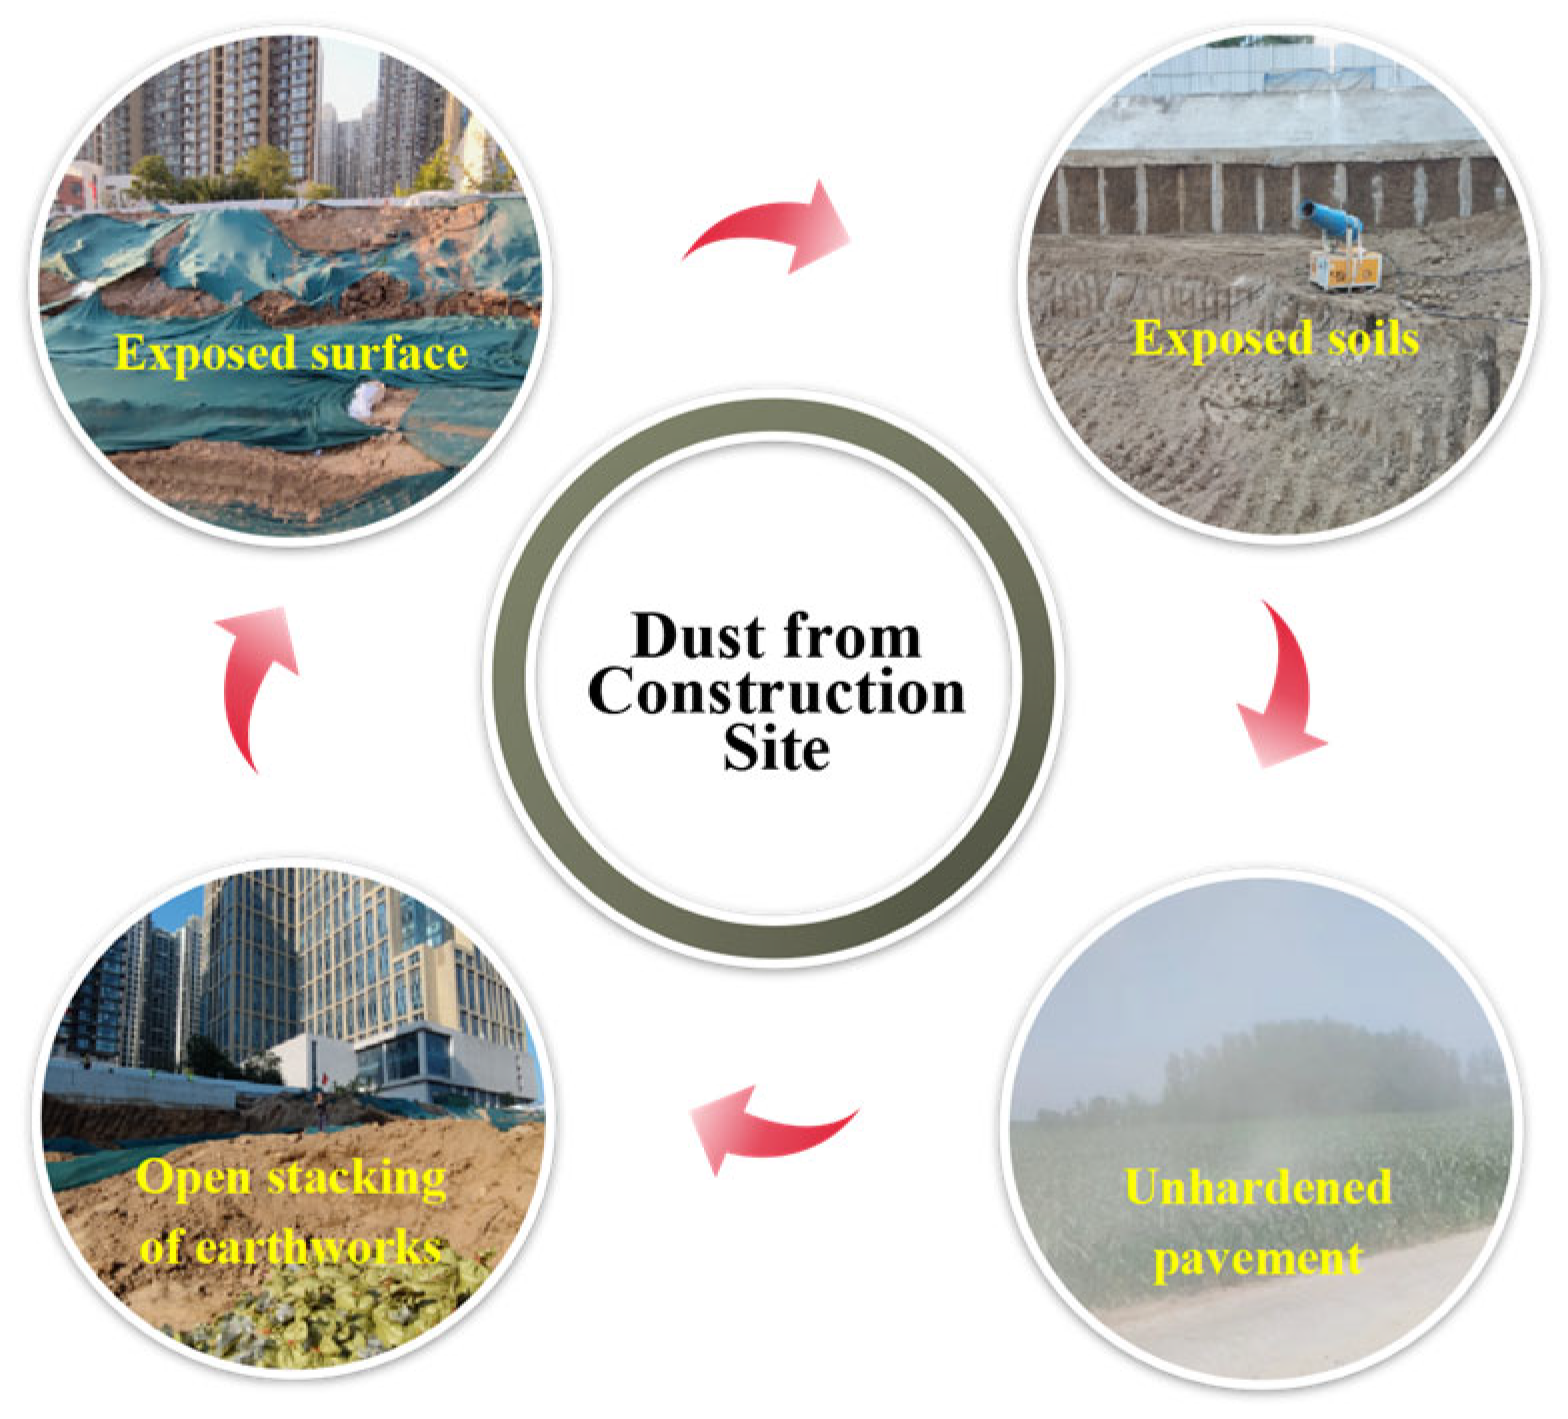
1. Introduction
2. Results and Discussion
2.1. Optimization of EICP Solution
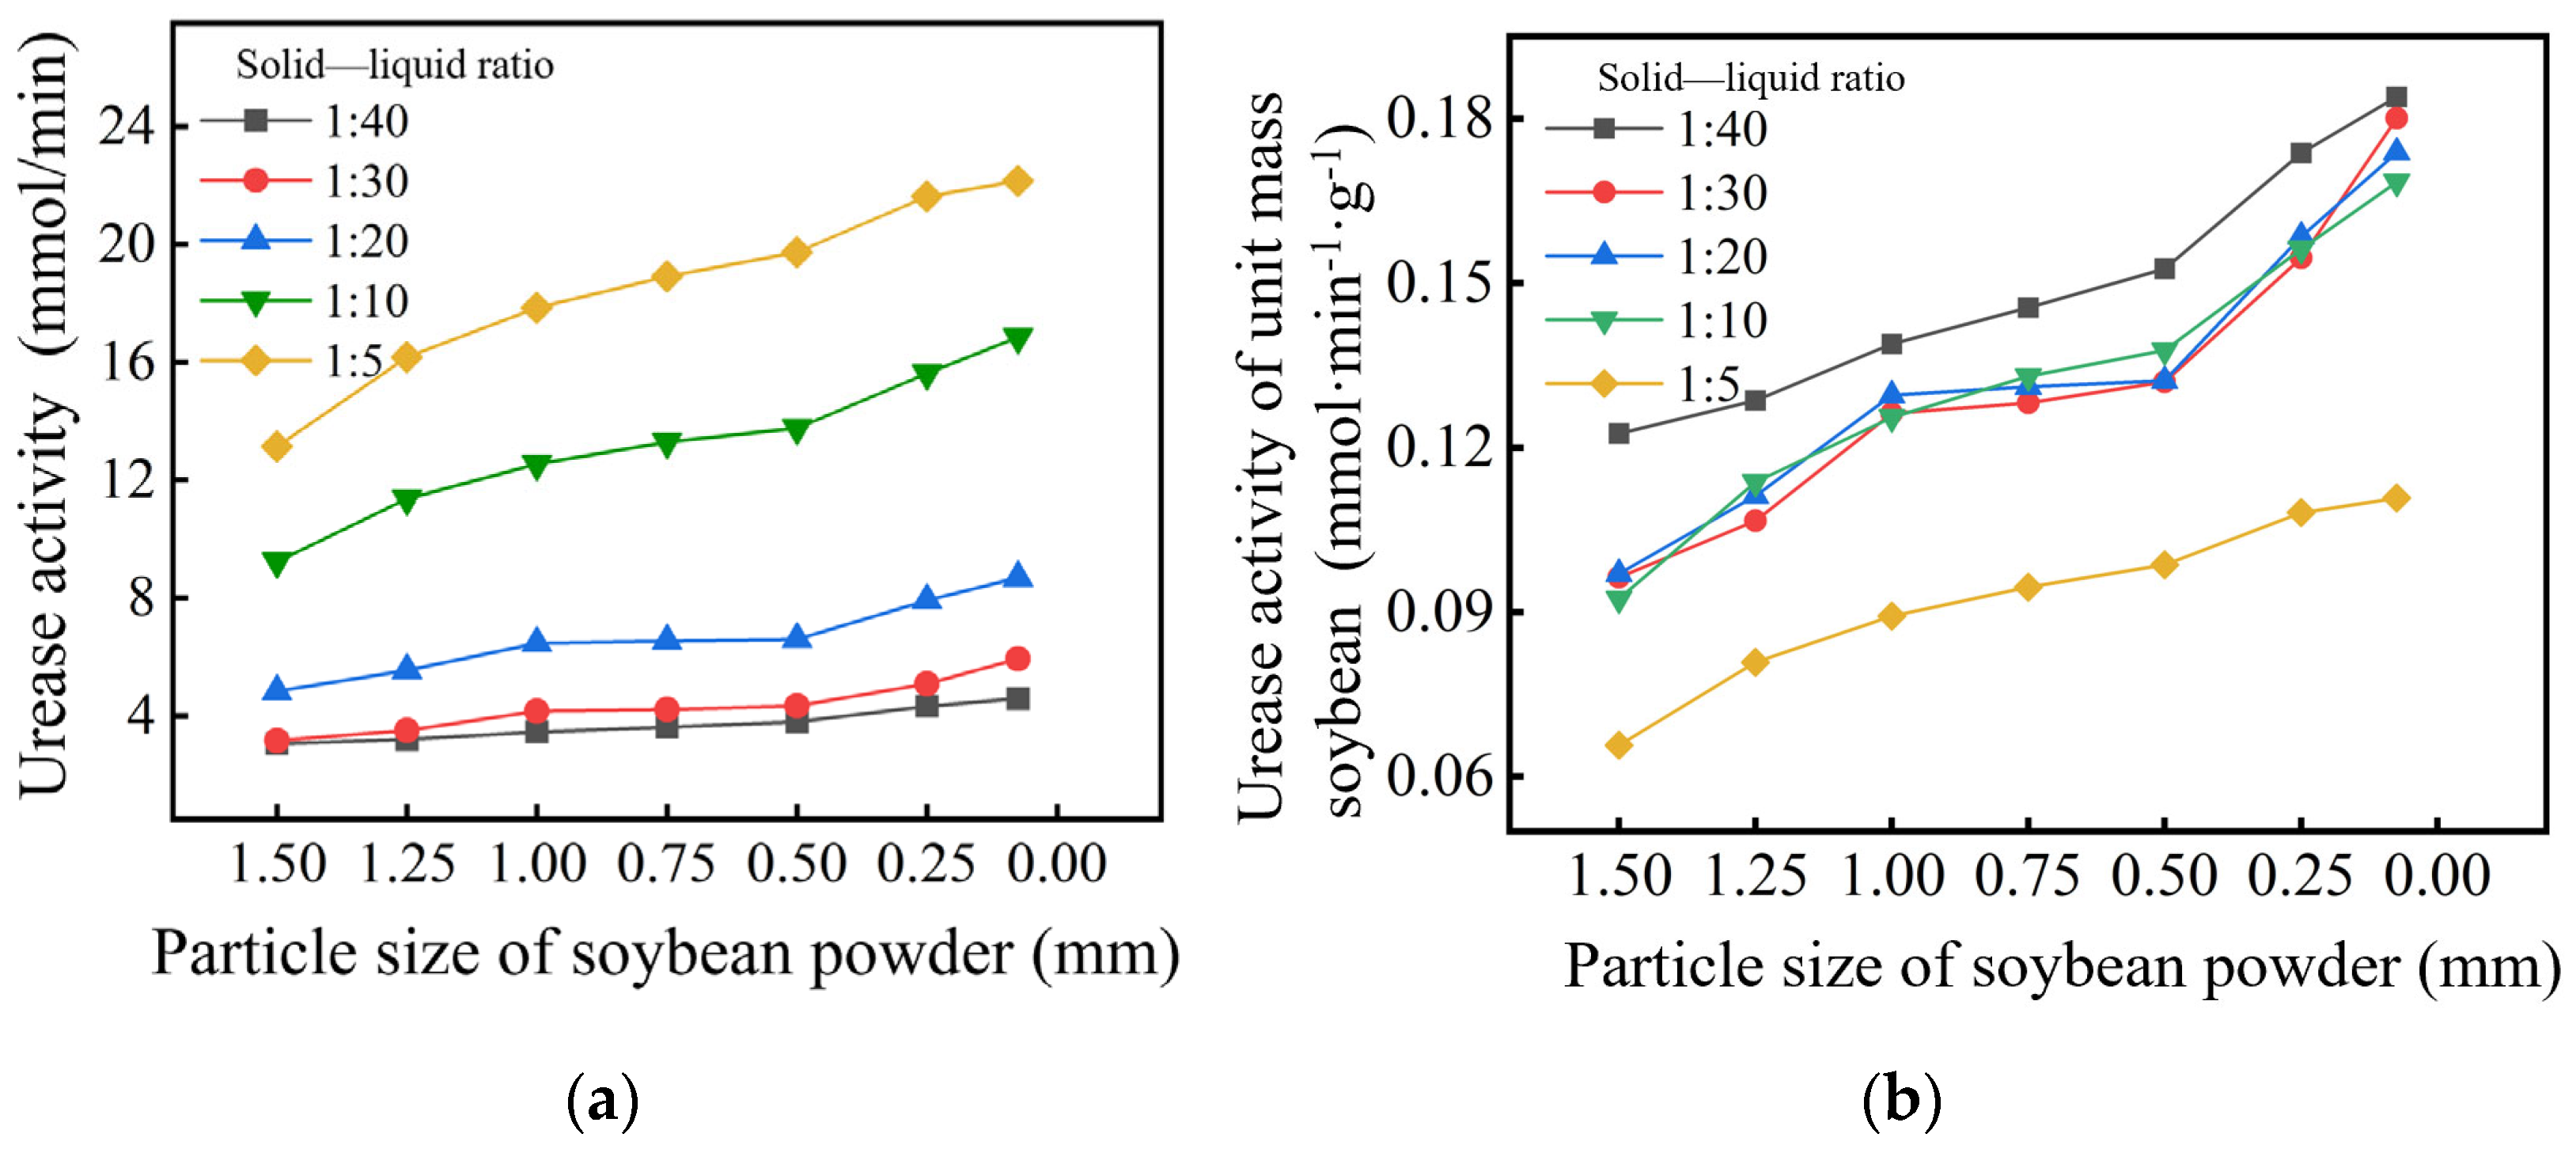
2.1.1. Particle Size and Solid–Liquid Mass Ratio
2.1.2. pH Value
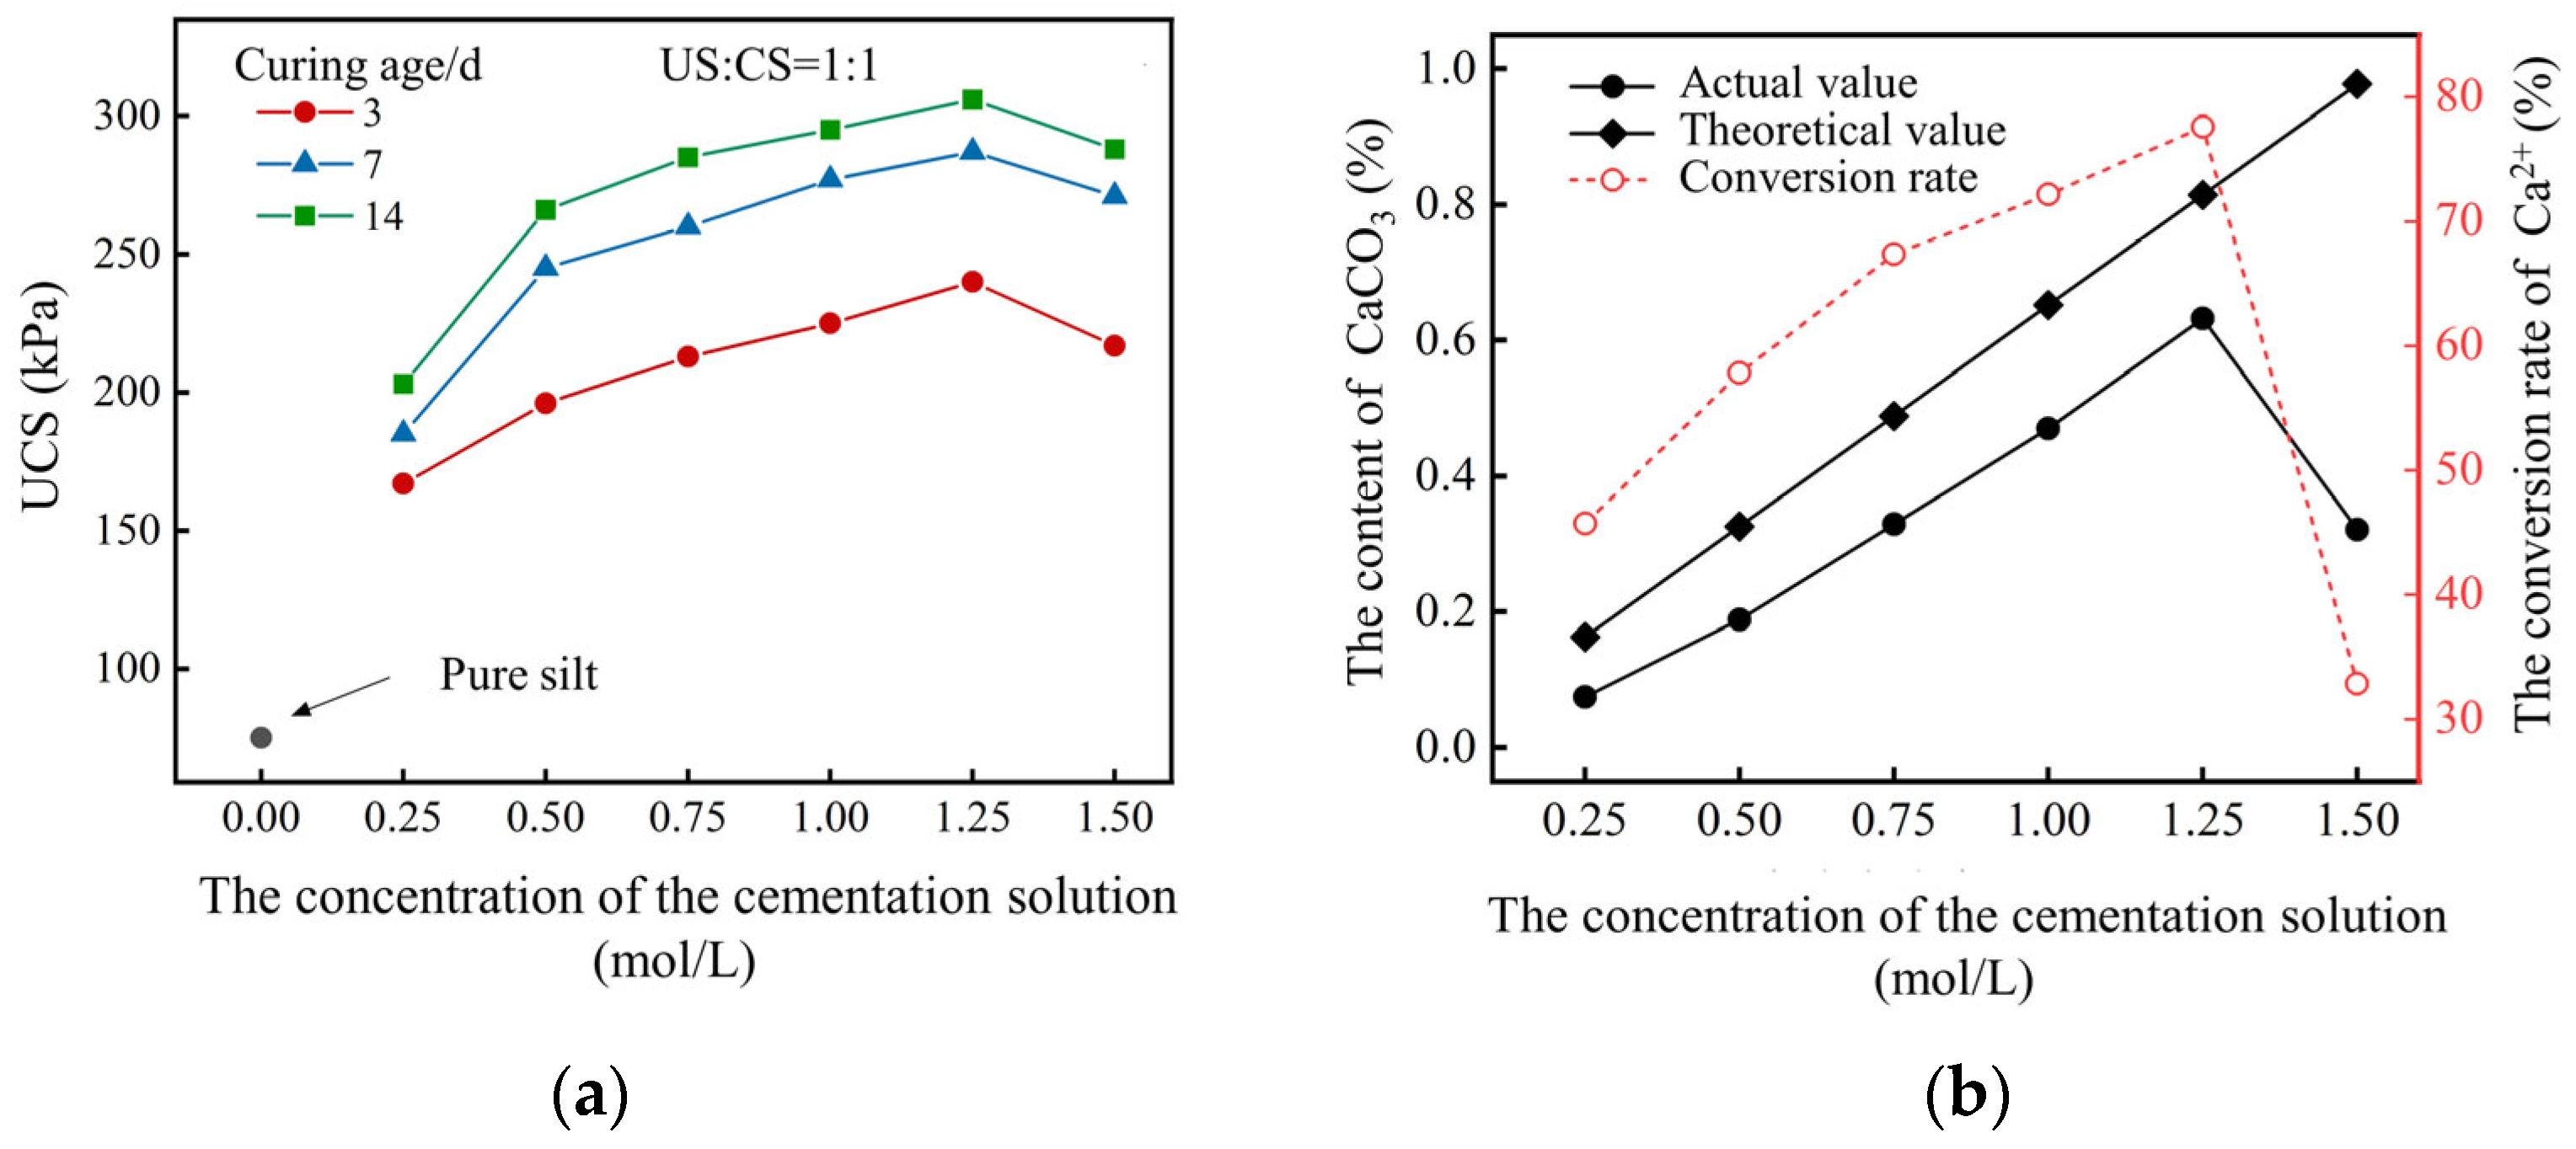
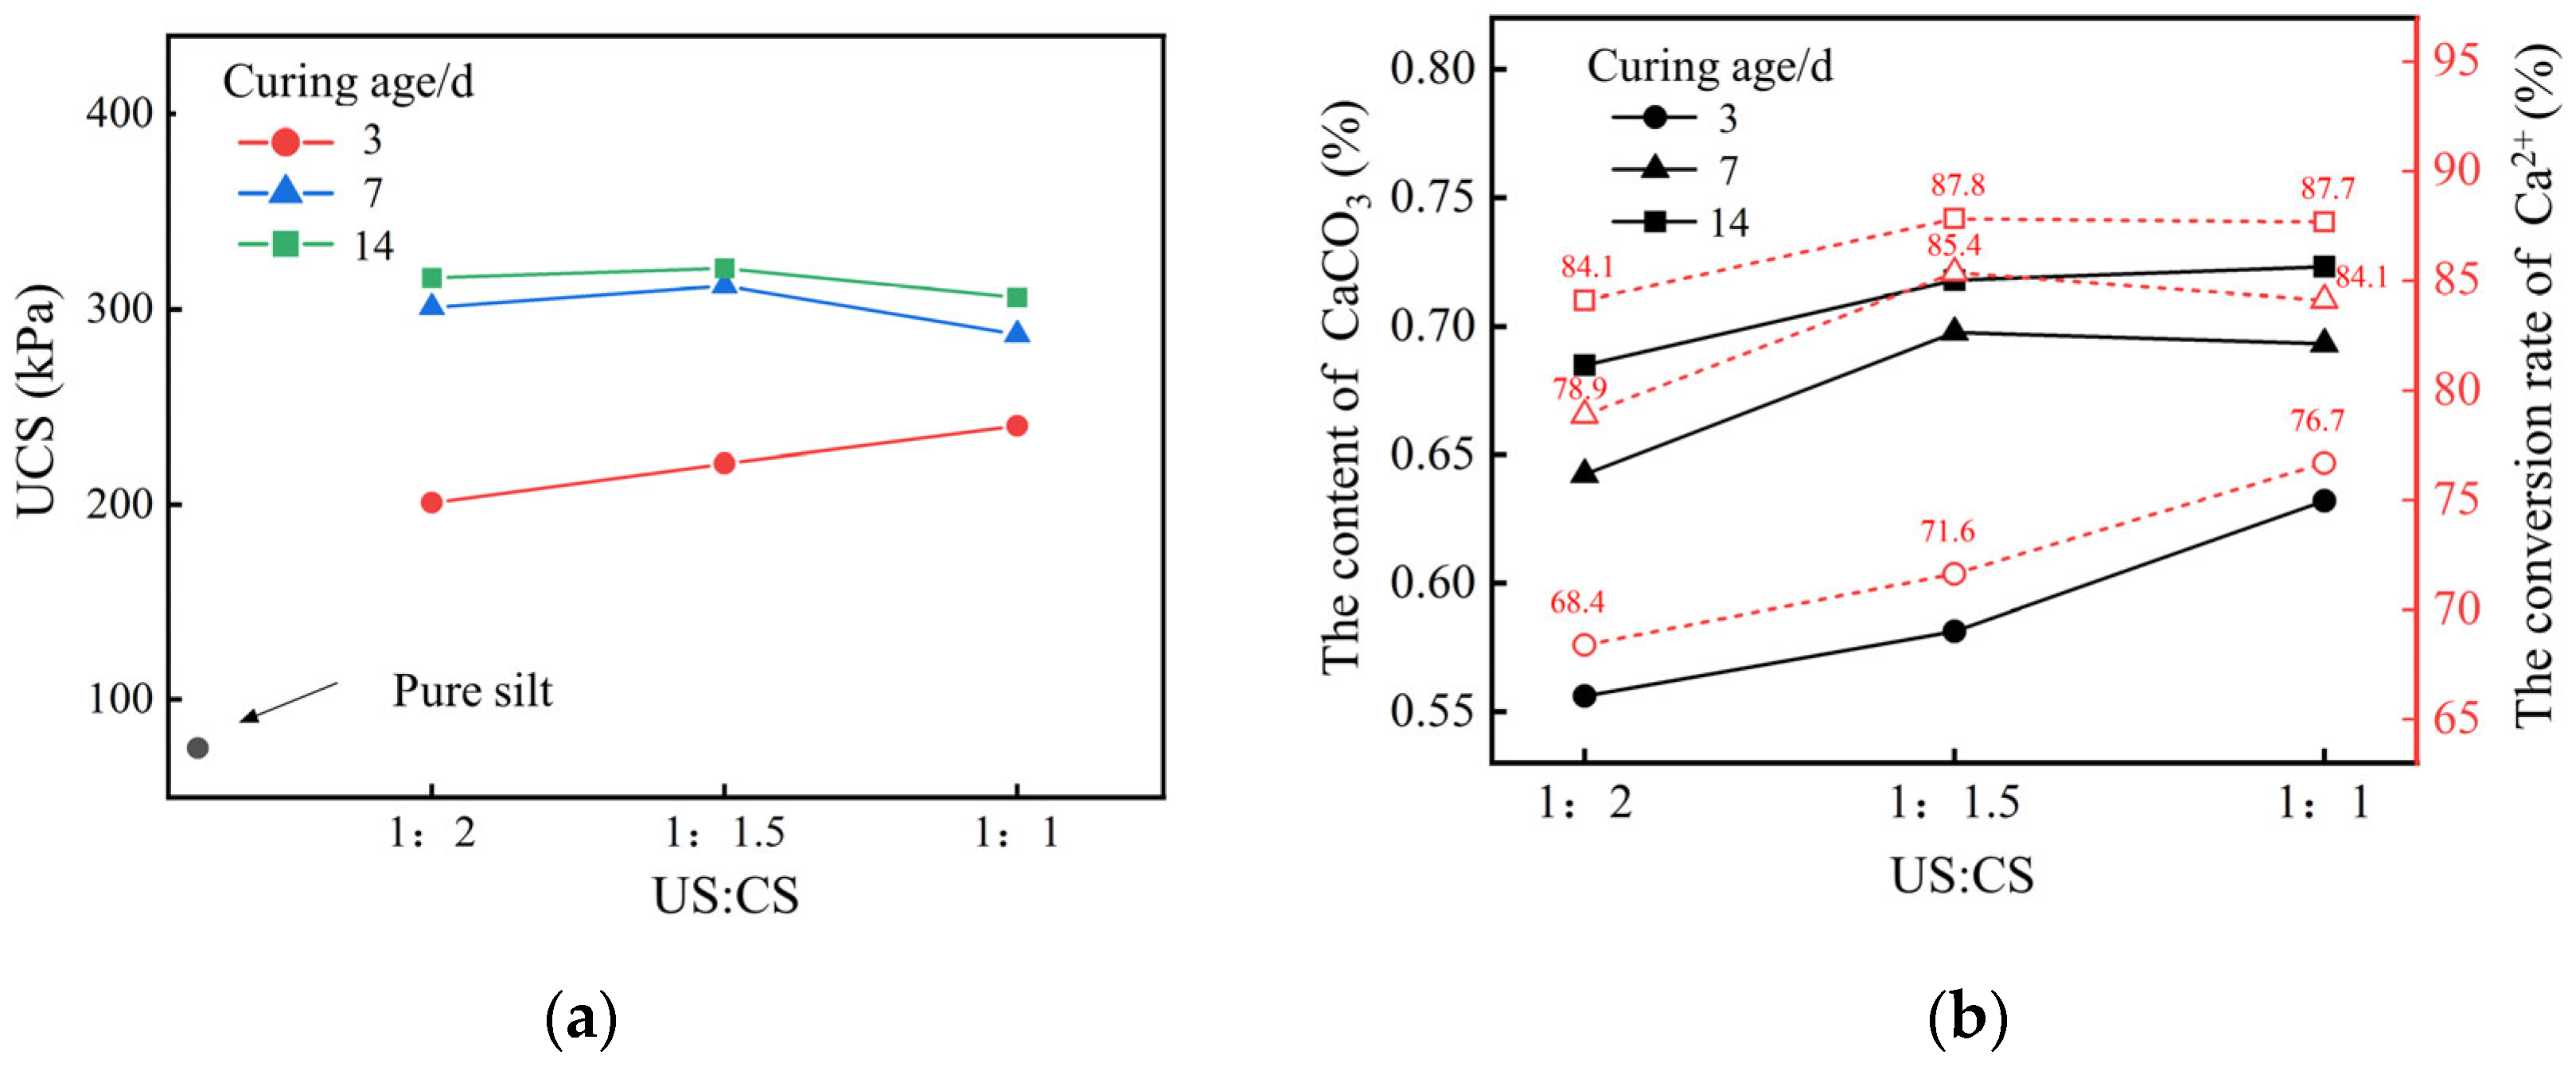
2.1.3. Concentration and Volume Ratio of Reaction Solution
2.2. Construction Technology
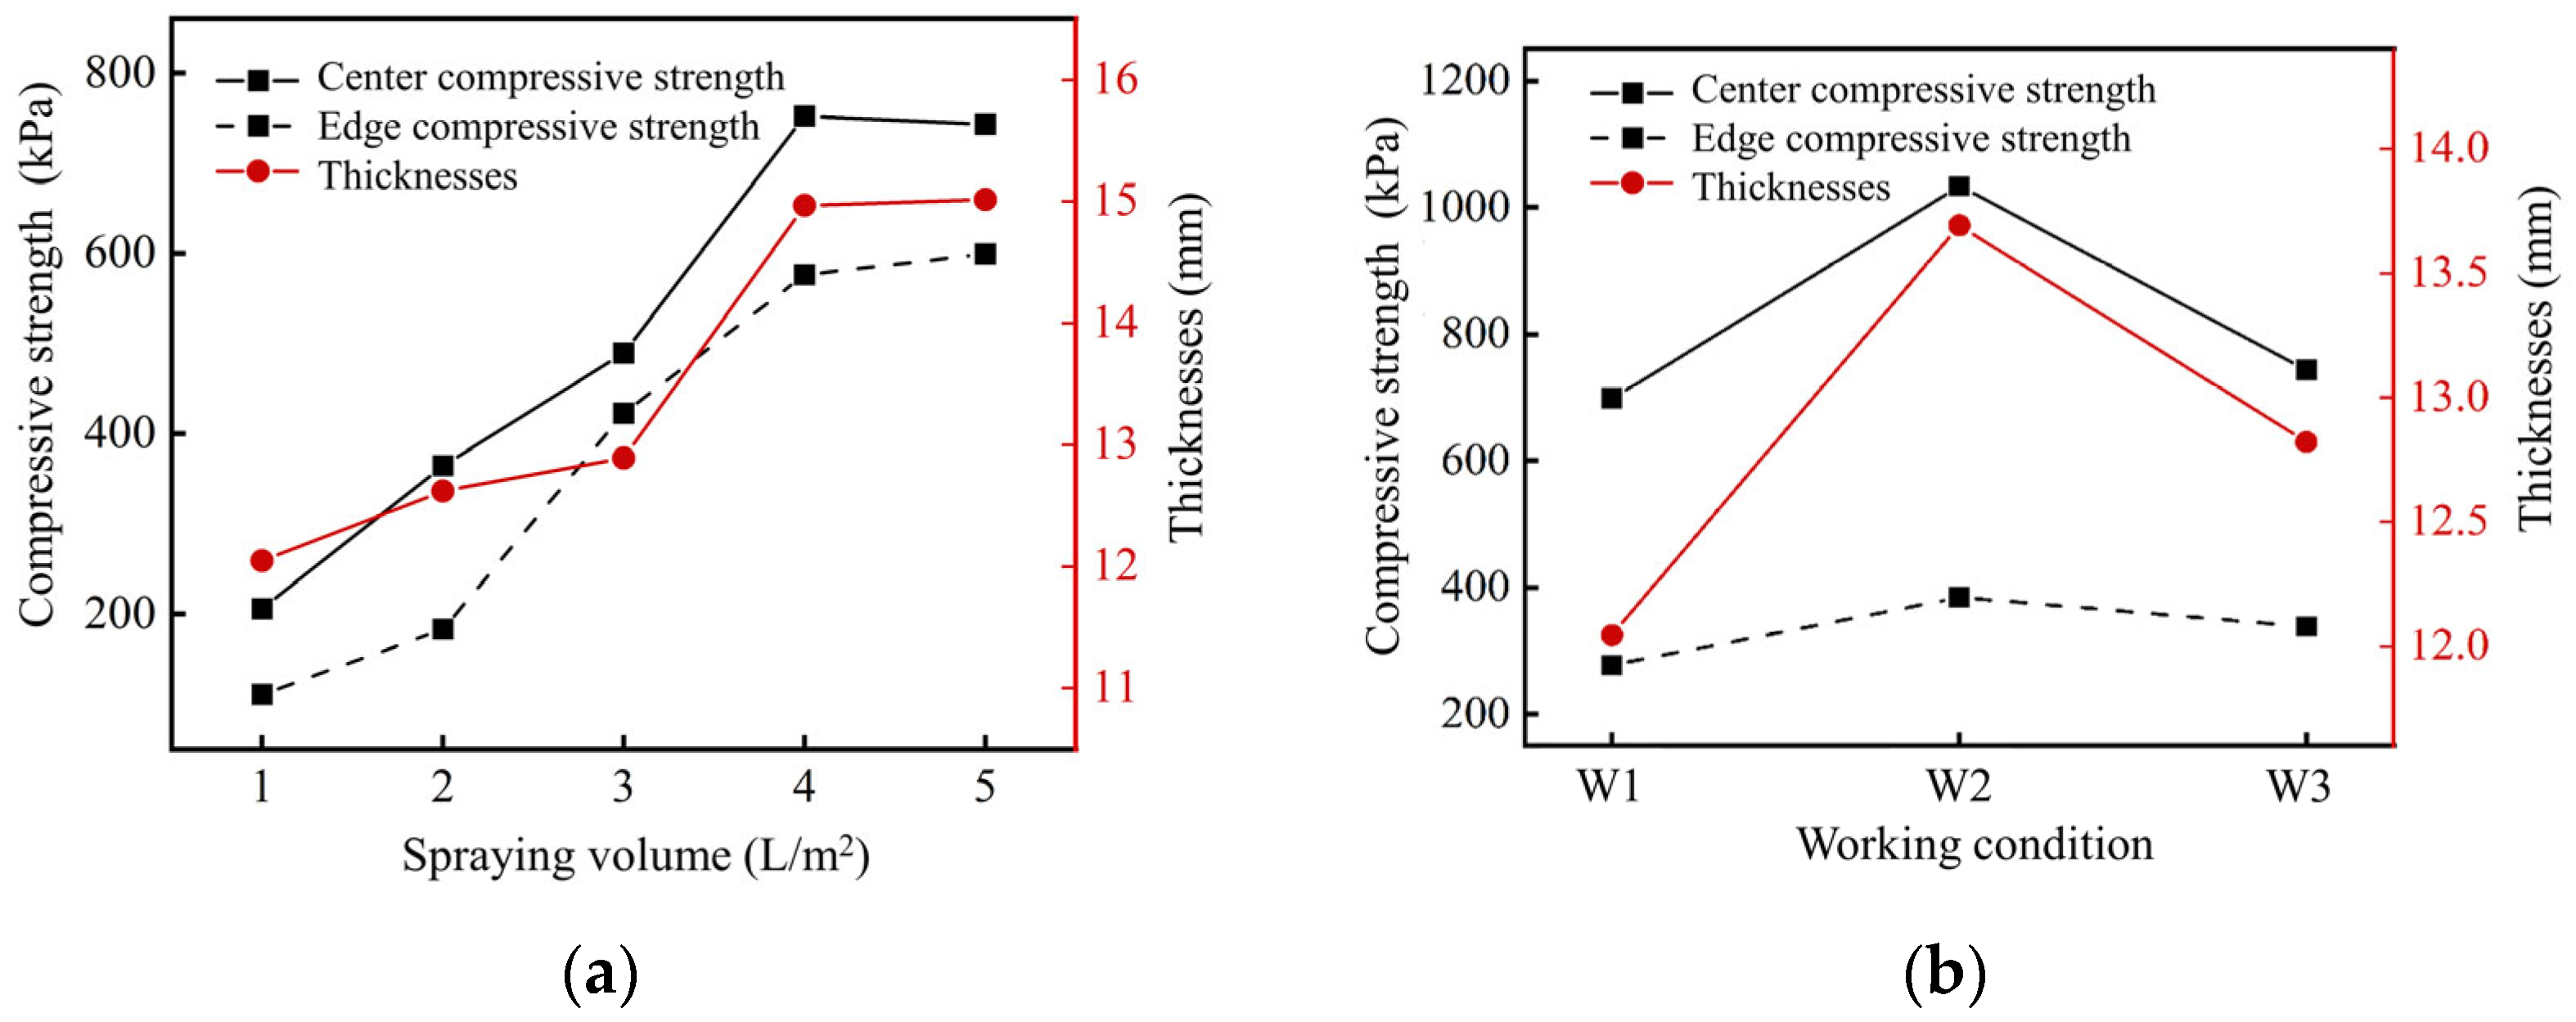
2.2.1. Influence of Spraying Scheme on Solidification Effect
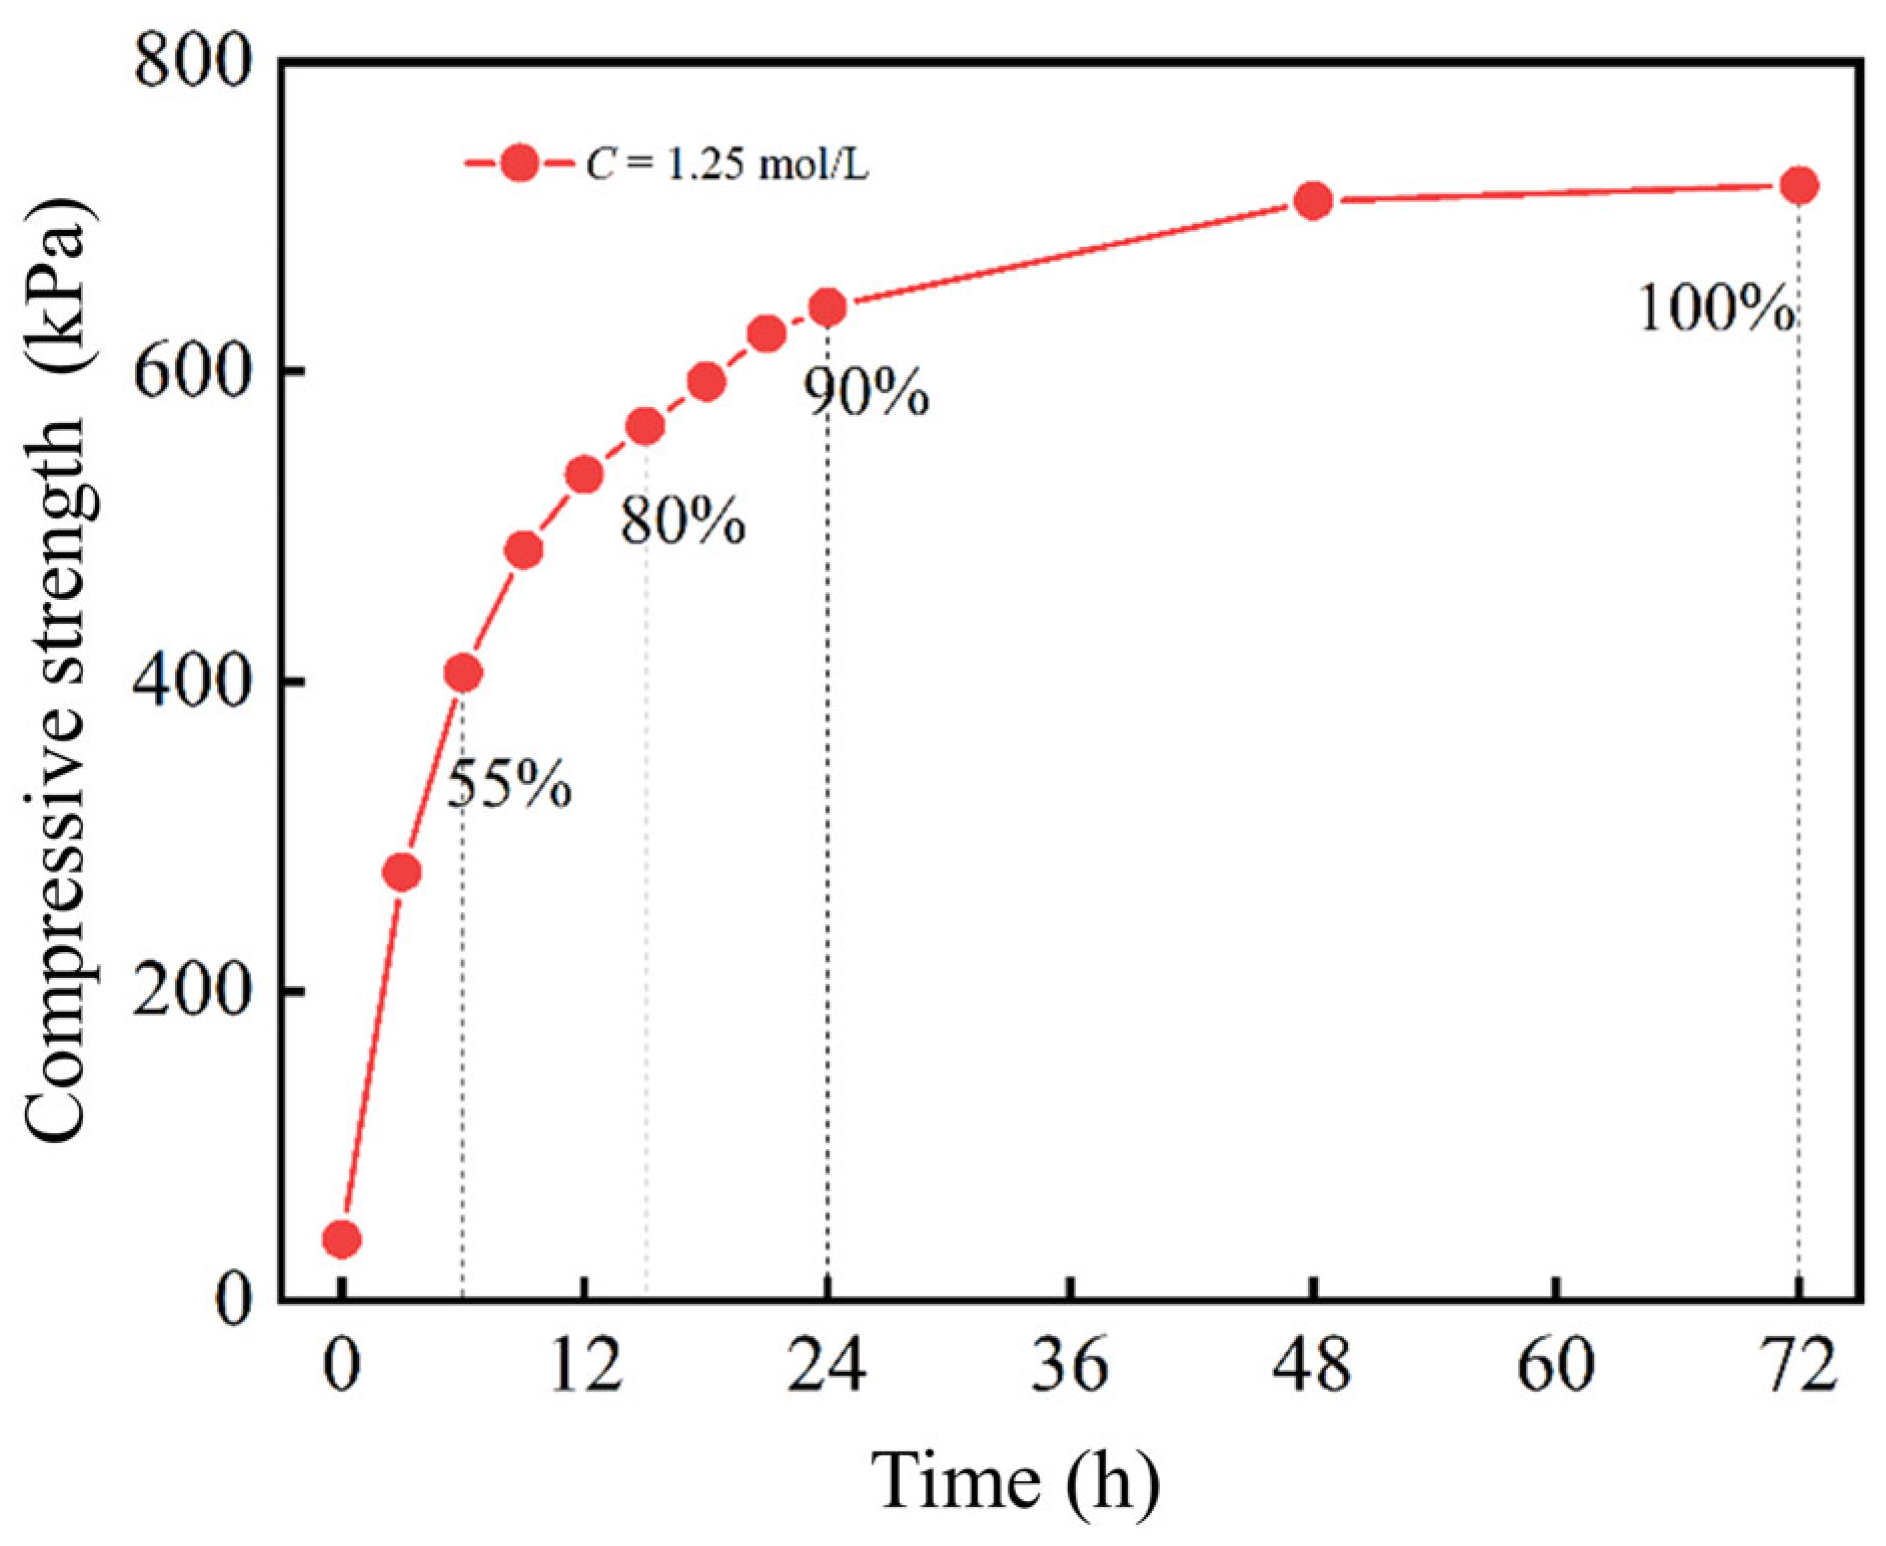
2.2.2. Reaction Time
2.3. Curing Effect
2.3.1. Macro Appearance
2.3.2. Micro Analysis
- SEM
- 2.
- XRD
2.4. Dust Control Effect
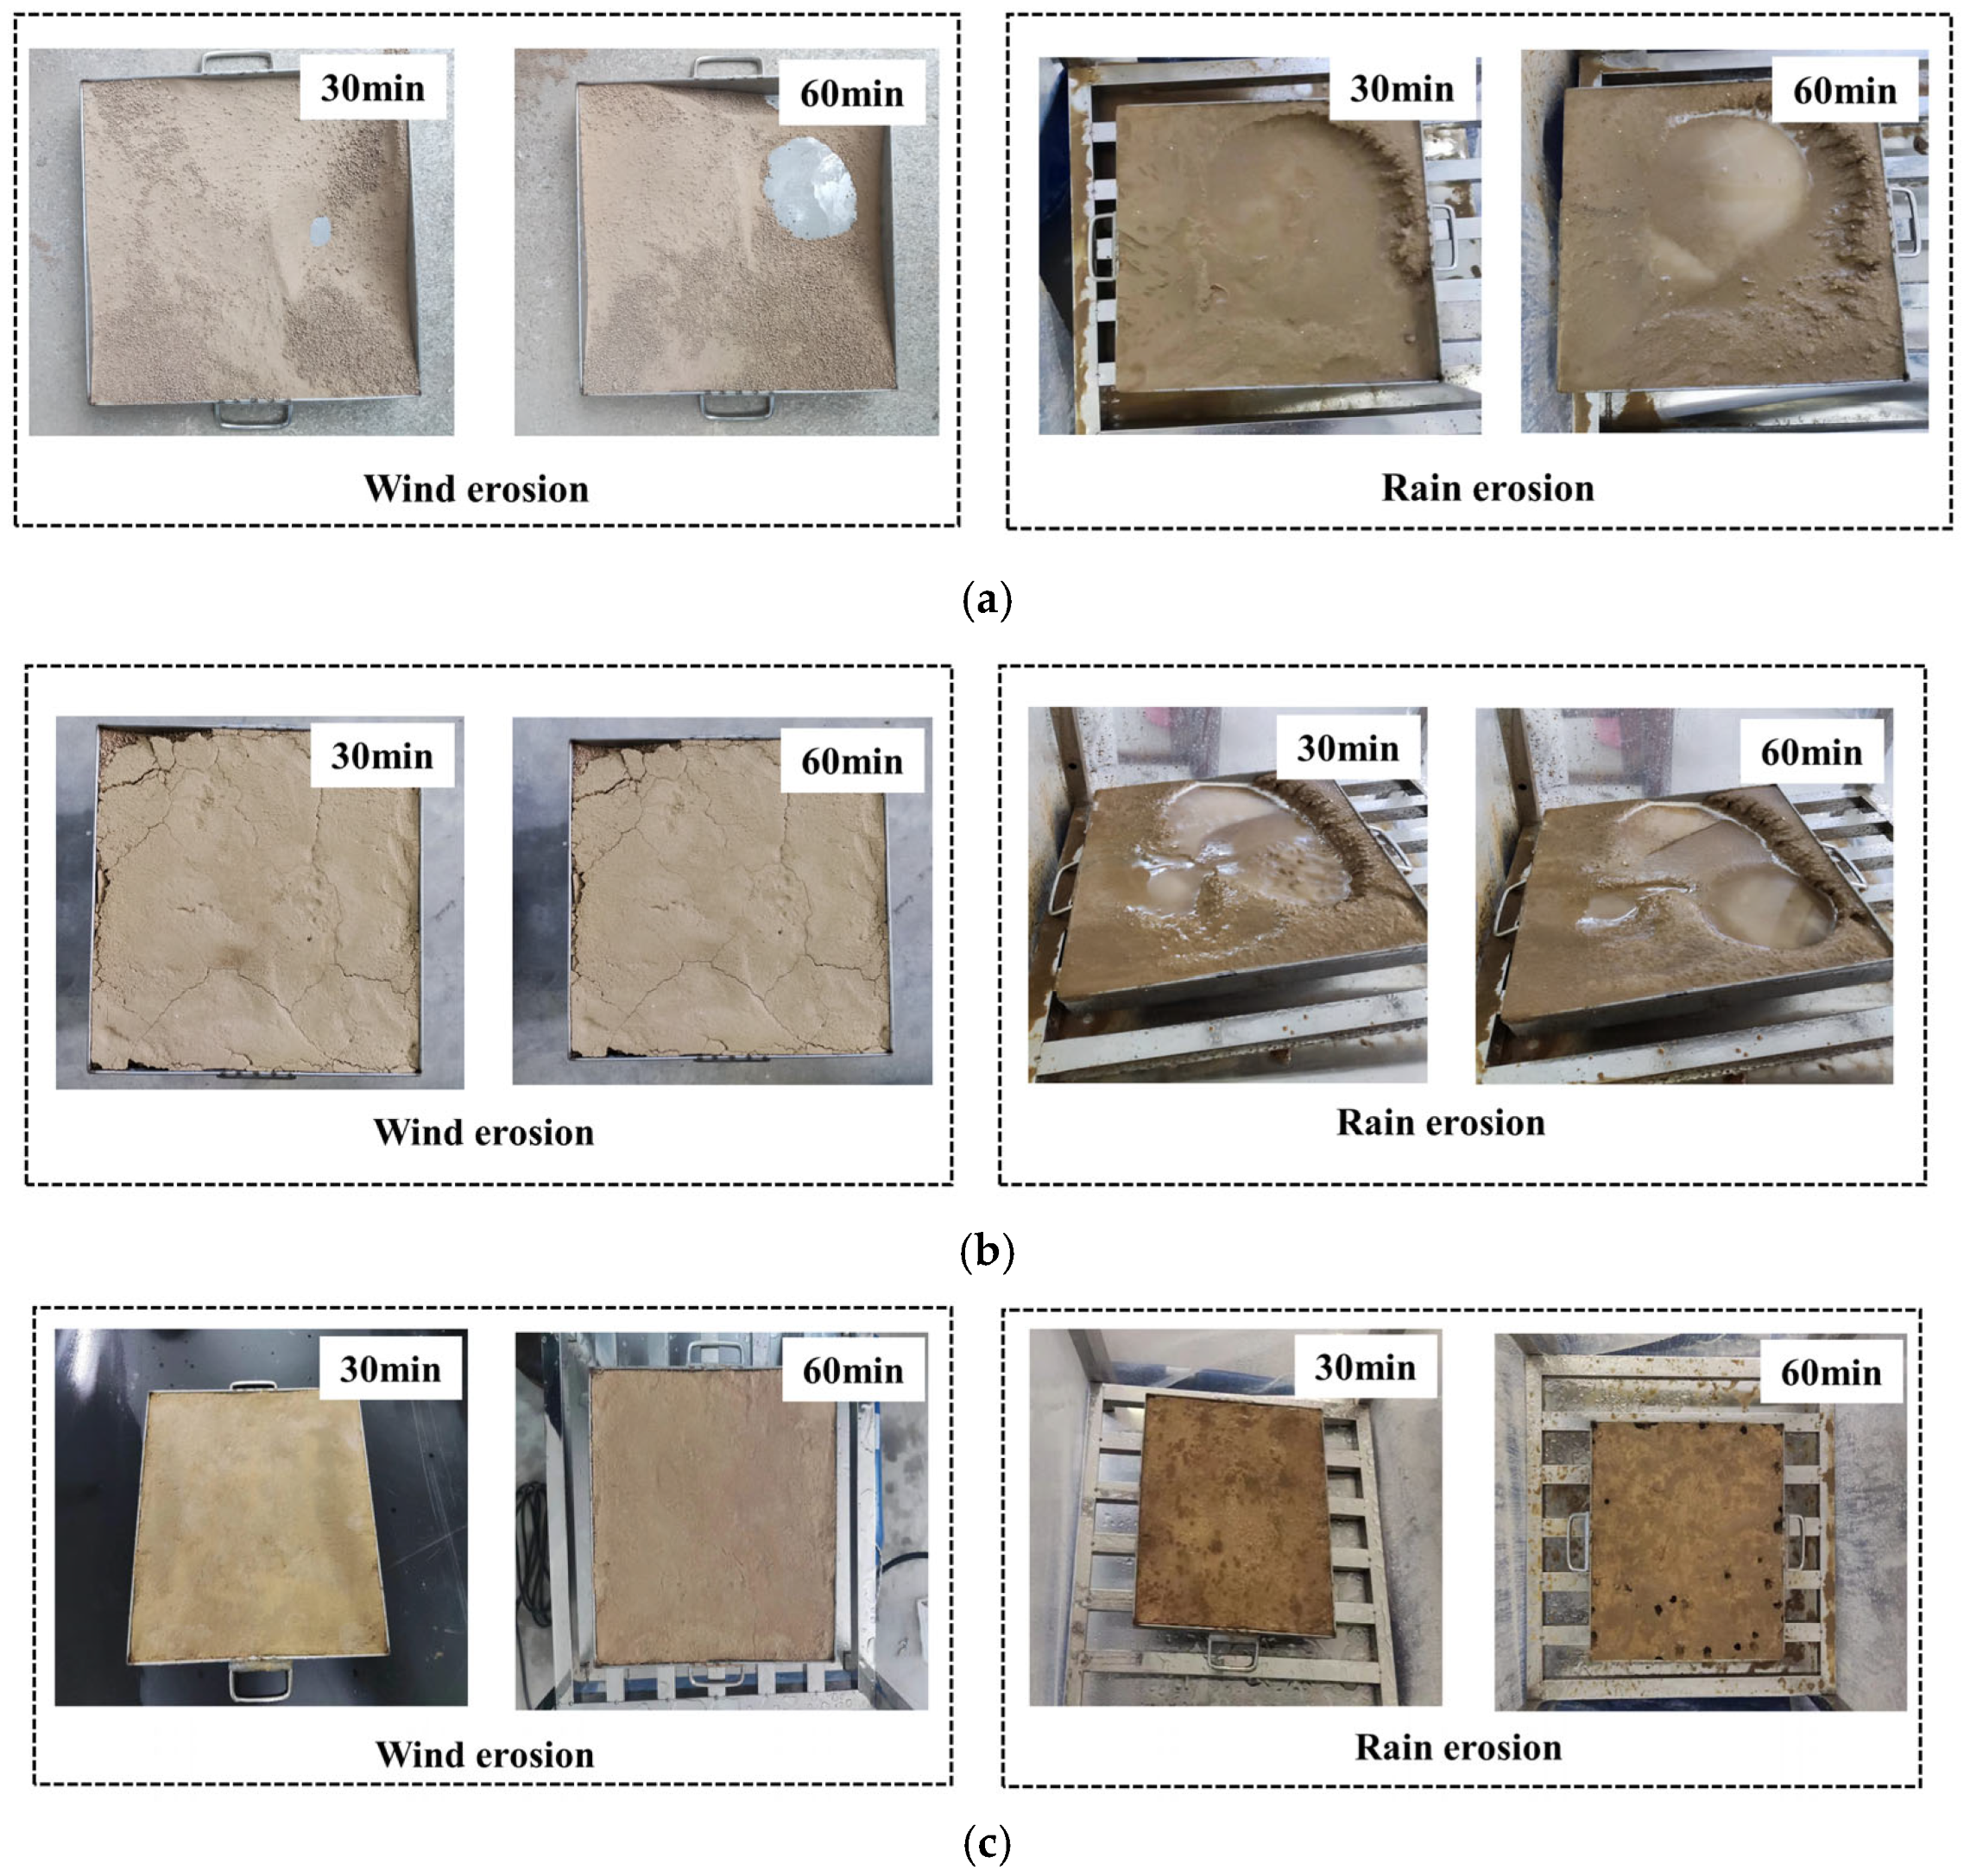
2.4.1. Wind–Rain Resistance
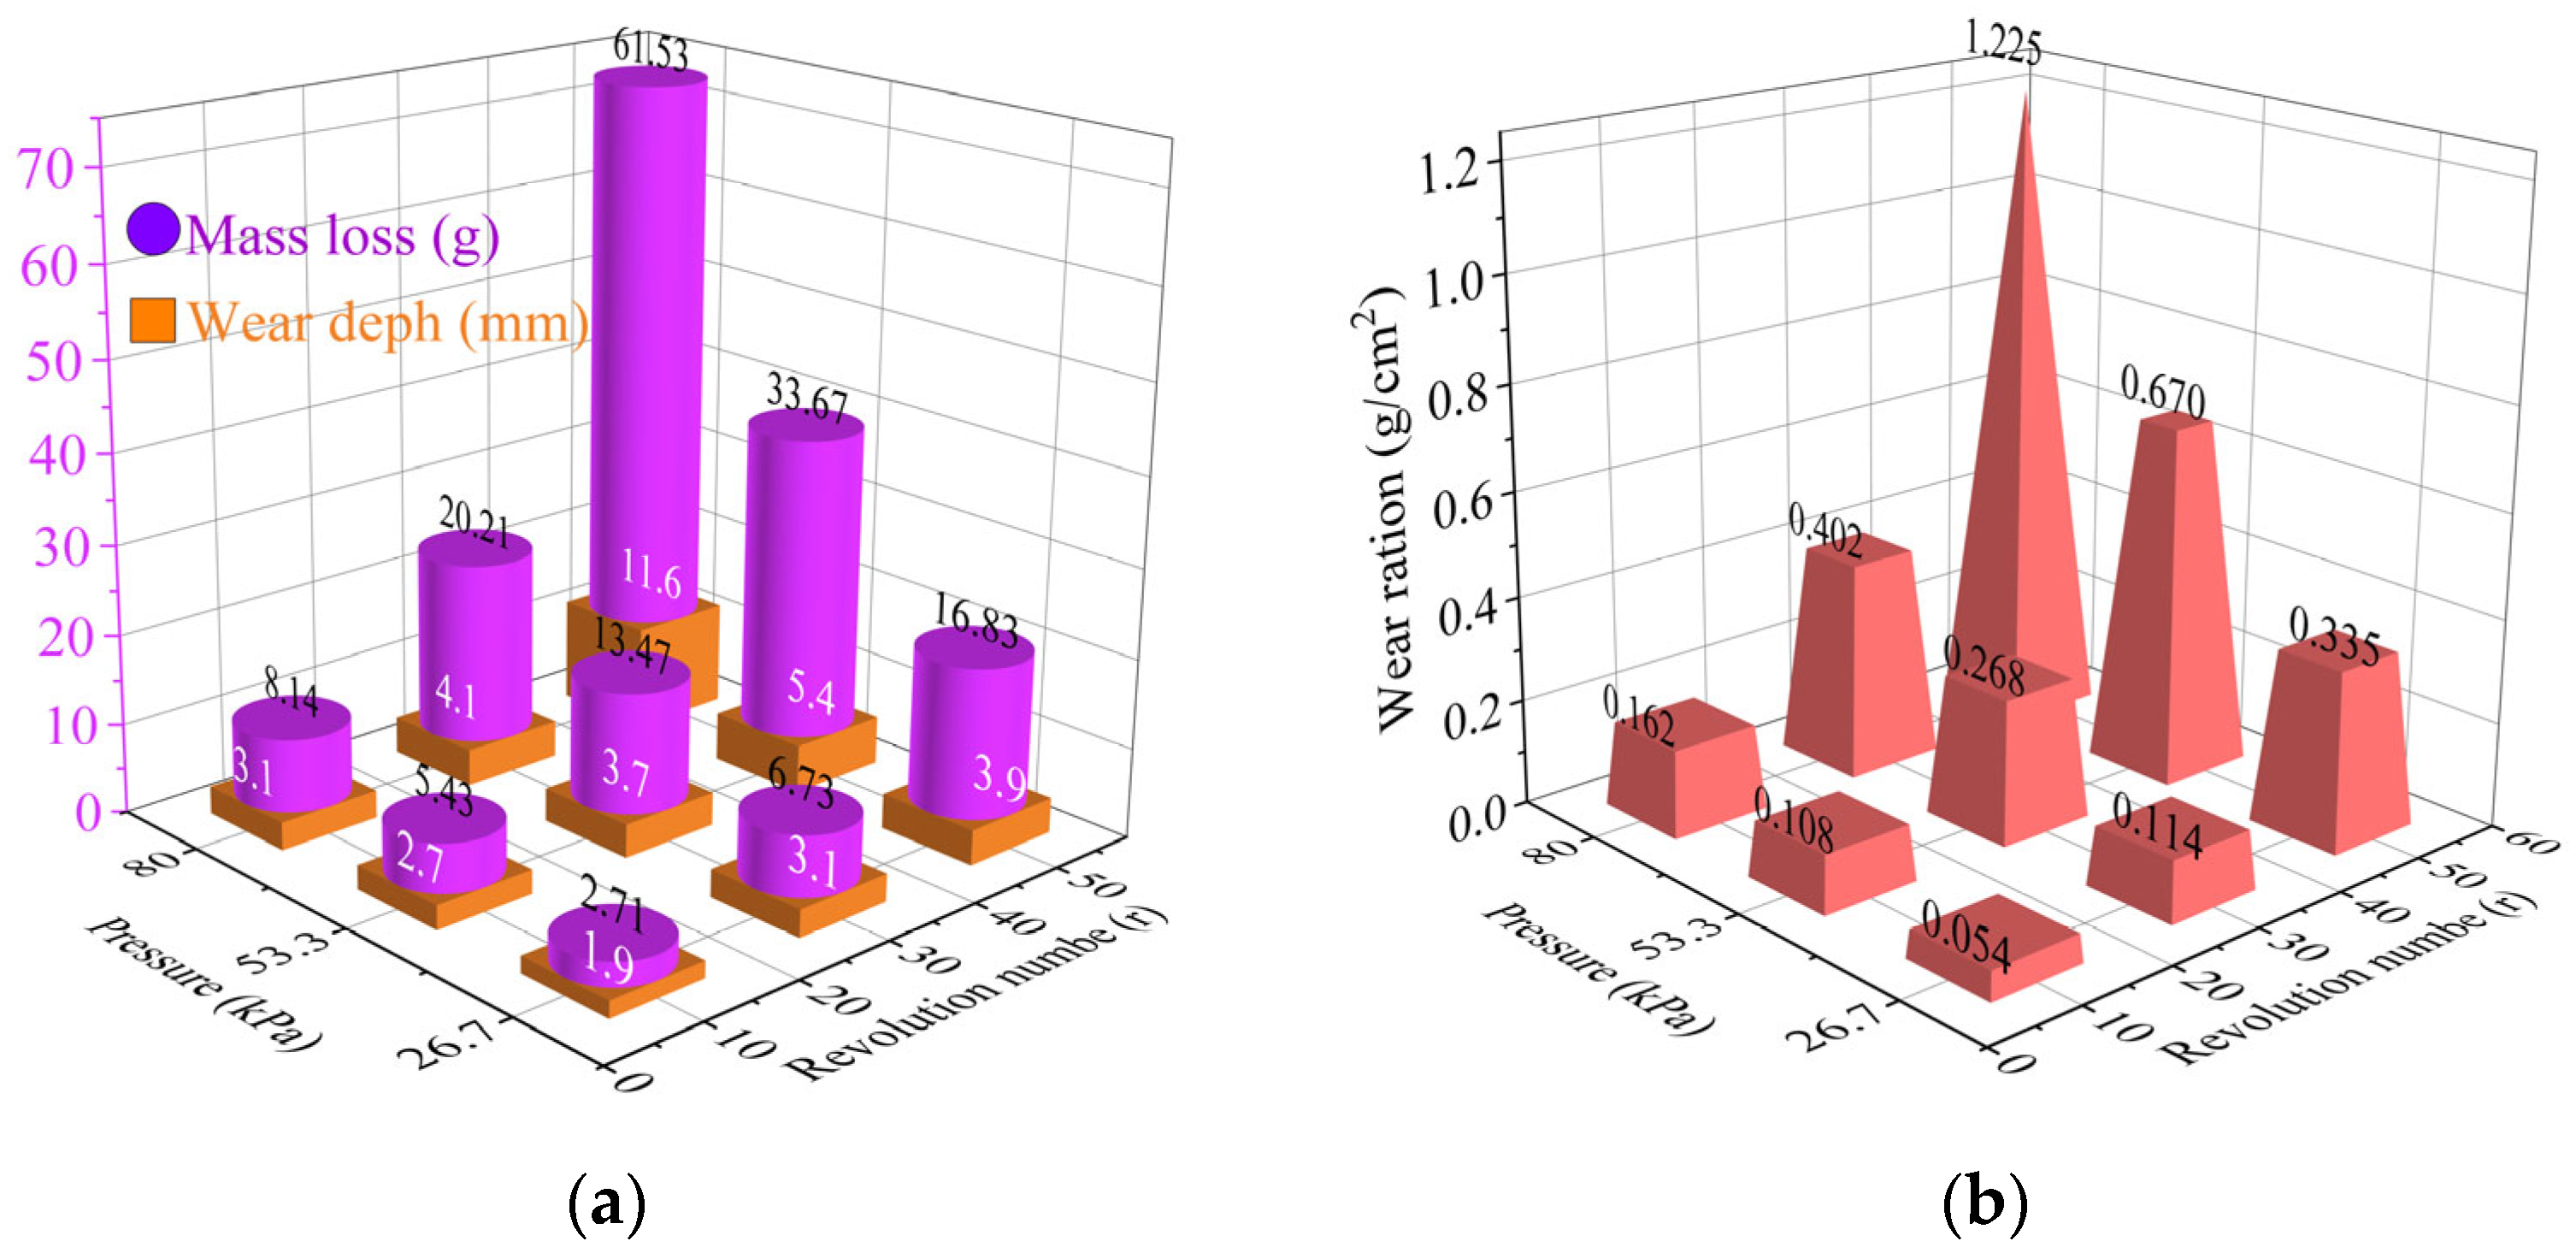
2.4.2. Wear Resistance
3. Conclusions
- (1)
- The optimal cementation solution, consisting of equal concentrations of urea and CaCl2 (1.25 mol/L) applied at 4 L/m2, enabled controlled gelation through sequential spraying (first urea-CaCl2 solution, then urease).
- (2)
- This protocol produced a 14.9 mm thick bio-cemented gel layer with compressive strength exceeding 752 kPa, where CaCO3 crystallization created a self-reinforcing gel architecture.
- (3)
- The gel-stabilized crust maintained integrity under Beaufort scale 7 winds (51–61 km/h), resisted 40 mm/h rainfall erosion, and endured 30 cycles of fully loaded truck abrasion.
- (1)
- Our tests focused on short-term performance; long-term durability under freeze–thaw cycles and microbial degradation needs validation.
- (2)
- Field-scale cost analysis (USD 0.32/m2 for lab trials) should be conducted to assess economic viability.
- (3)
- Combining EICP with biopolymers may further improve erosion resistance in high-shear environments.
4. Materials and Methods
4.1. Materials
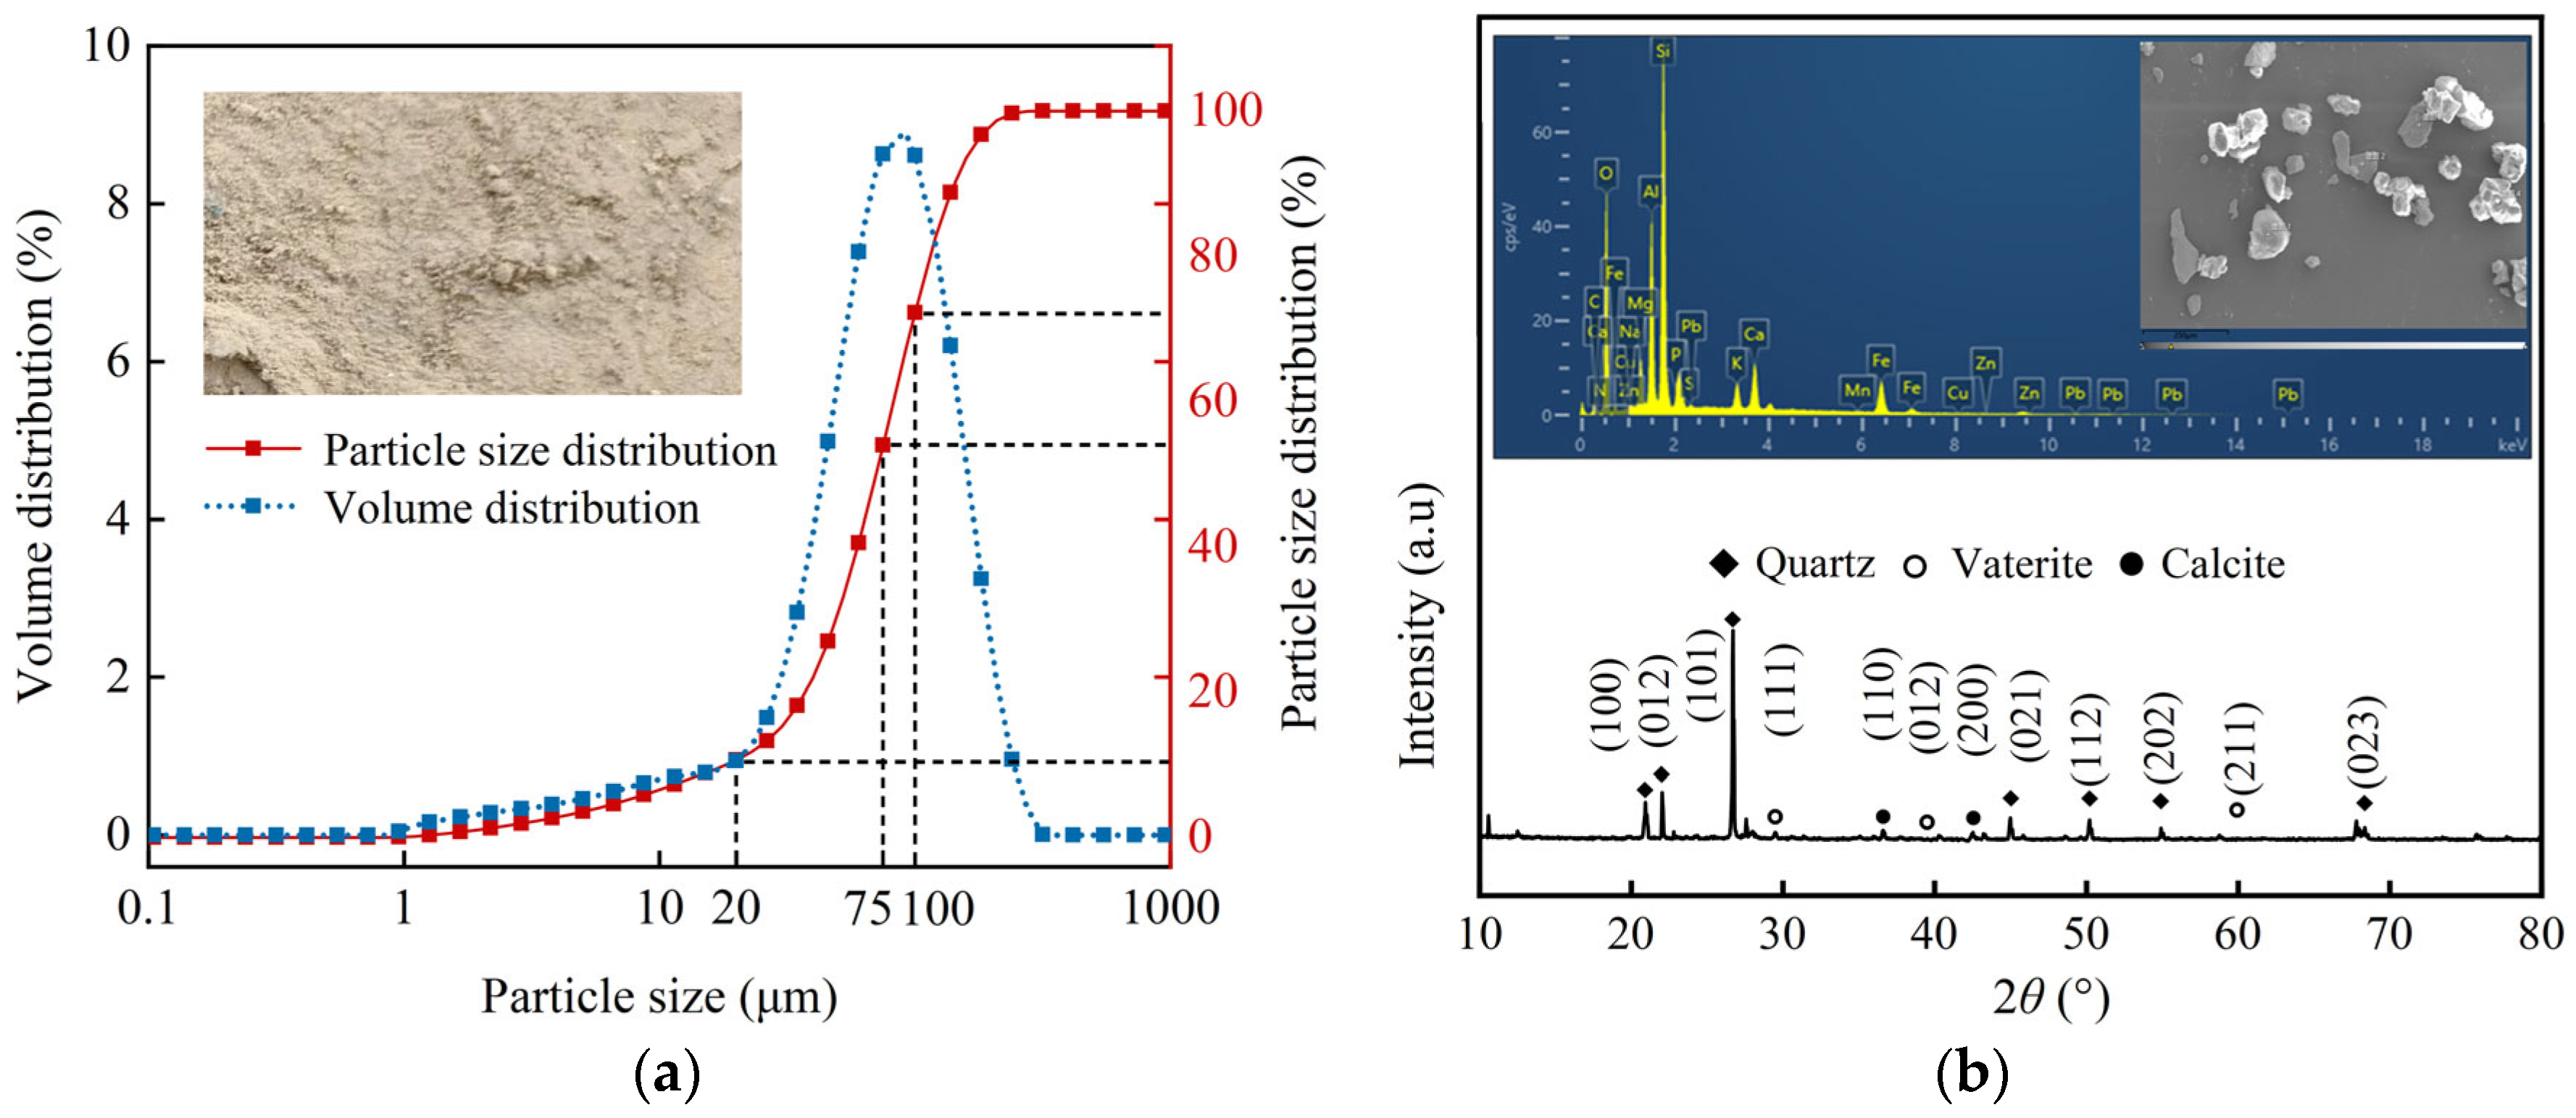
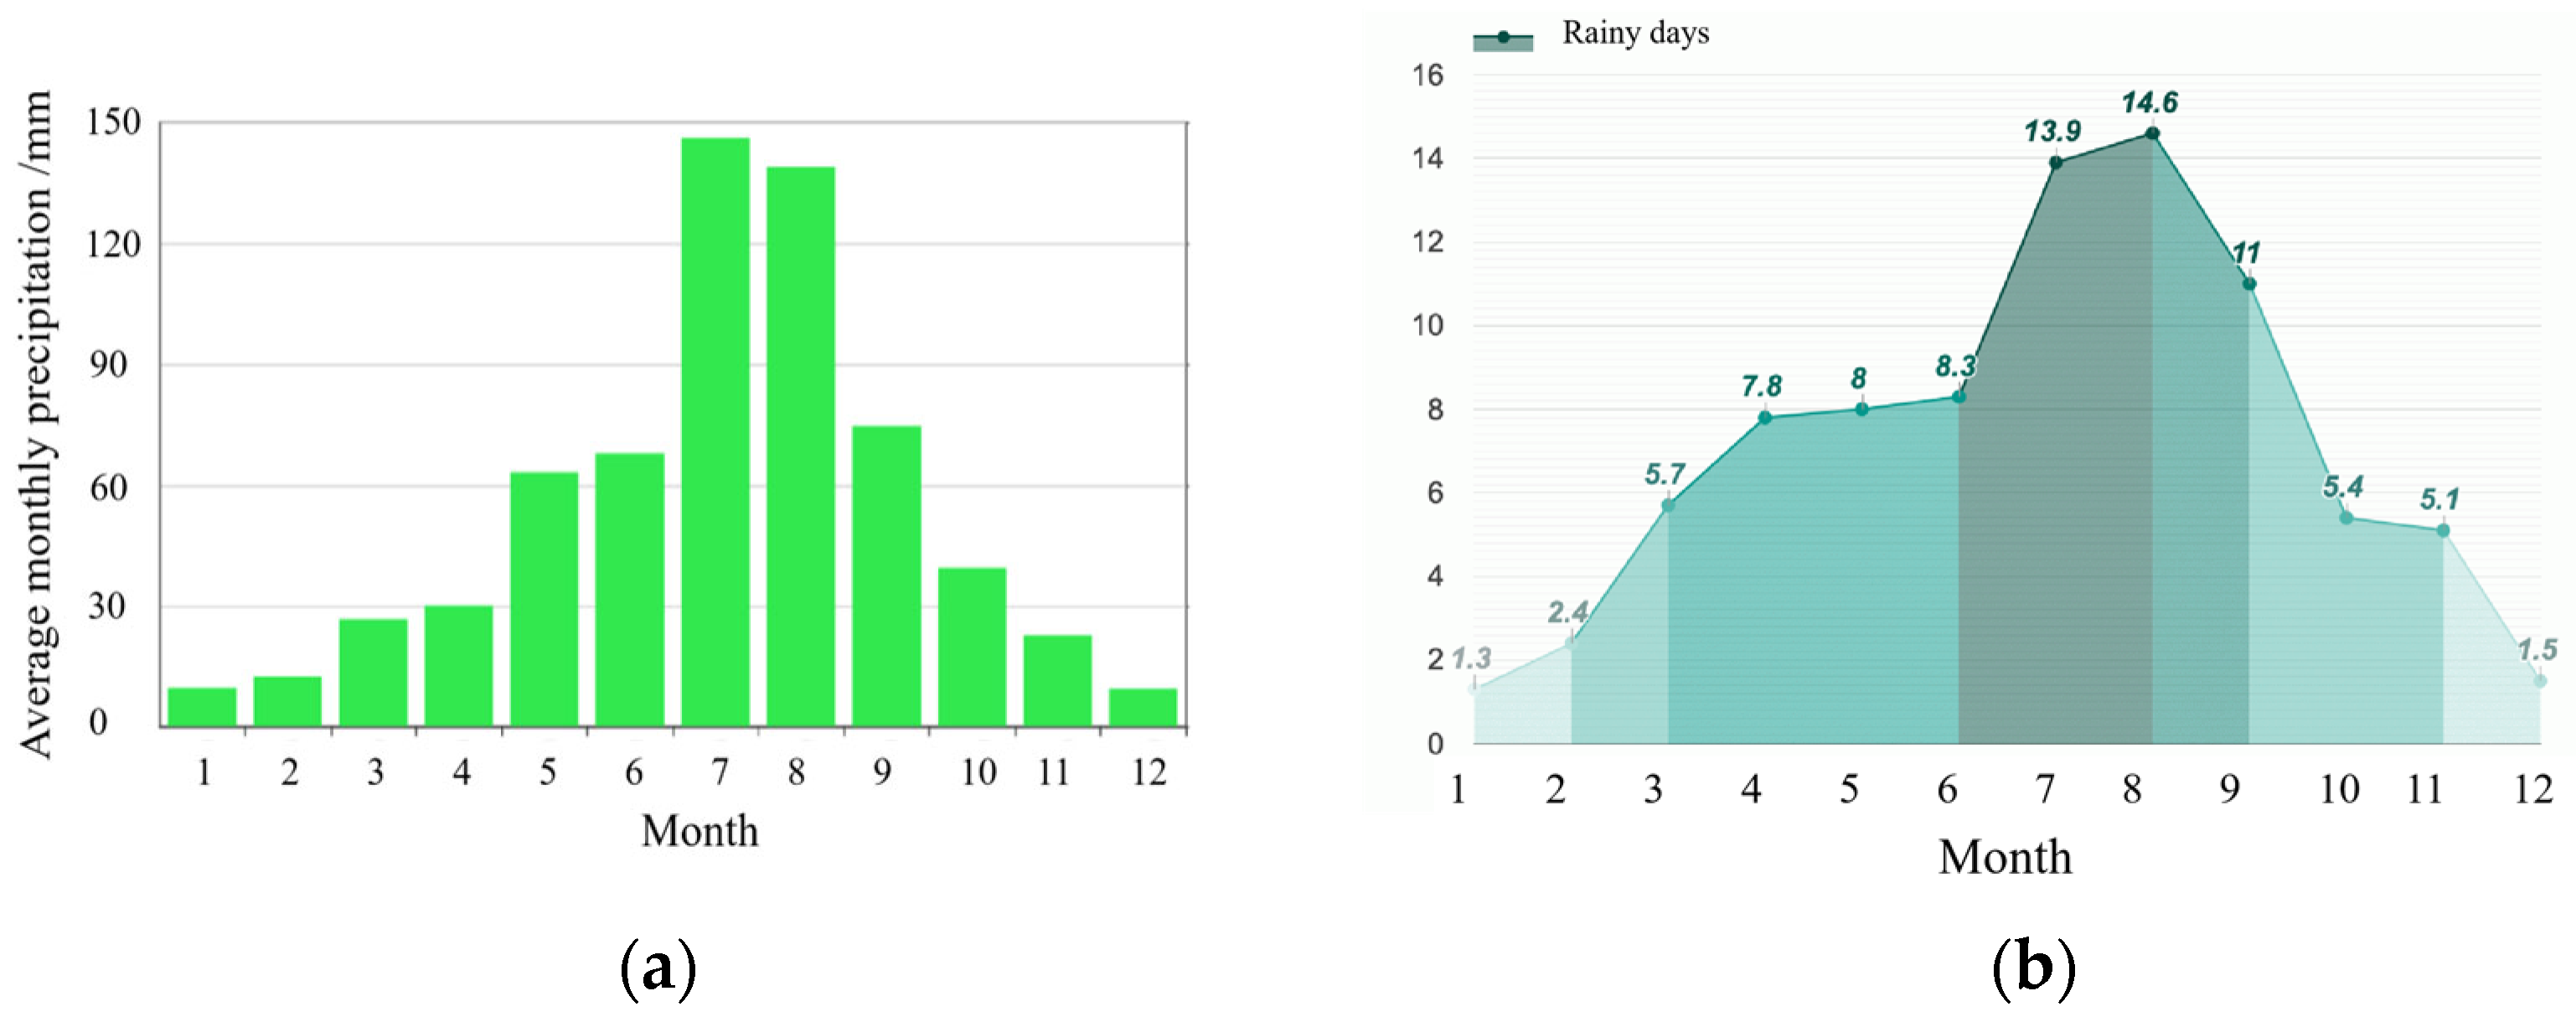
4.1.1. Yellow River Silt
4.1.2. EICP Solution
4.1.3. Specimens
4.2. Test Methods
4.2.1. Urease Activity Measurement
4.2.2. CaCO3 Content and Conversion Rate Measurement
4.2.3. Spraying Scheme
- ①
- Urease solution and urea solution first, followed by calcium chloride solution (W1);
- ②
- Calcium chloride solution and urea solution first, followed by urease solution (W2);
- ③
- Direct mixing and spraying (W3).
4.2.4. Performance Tests
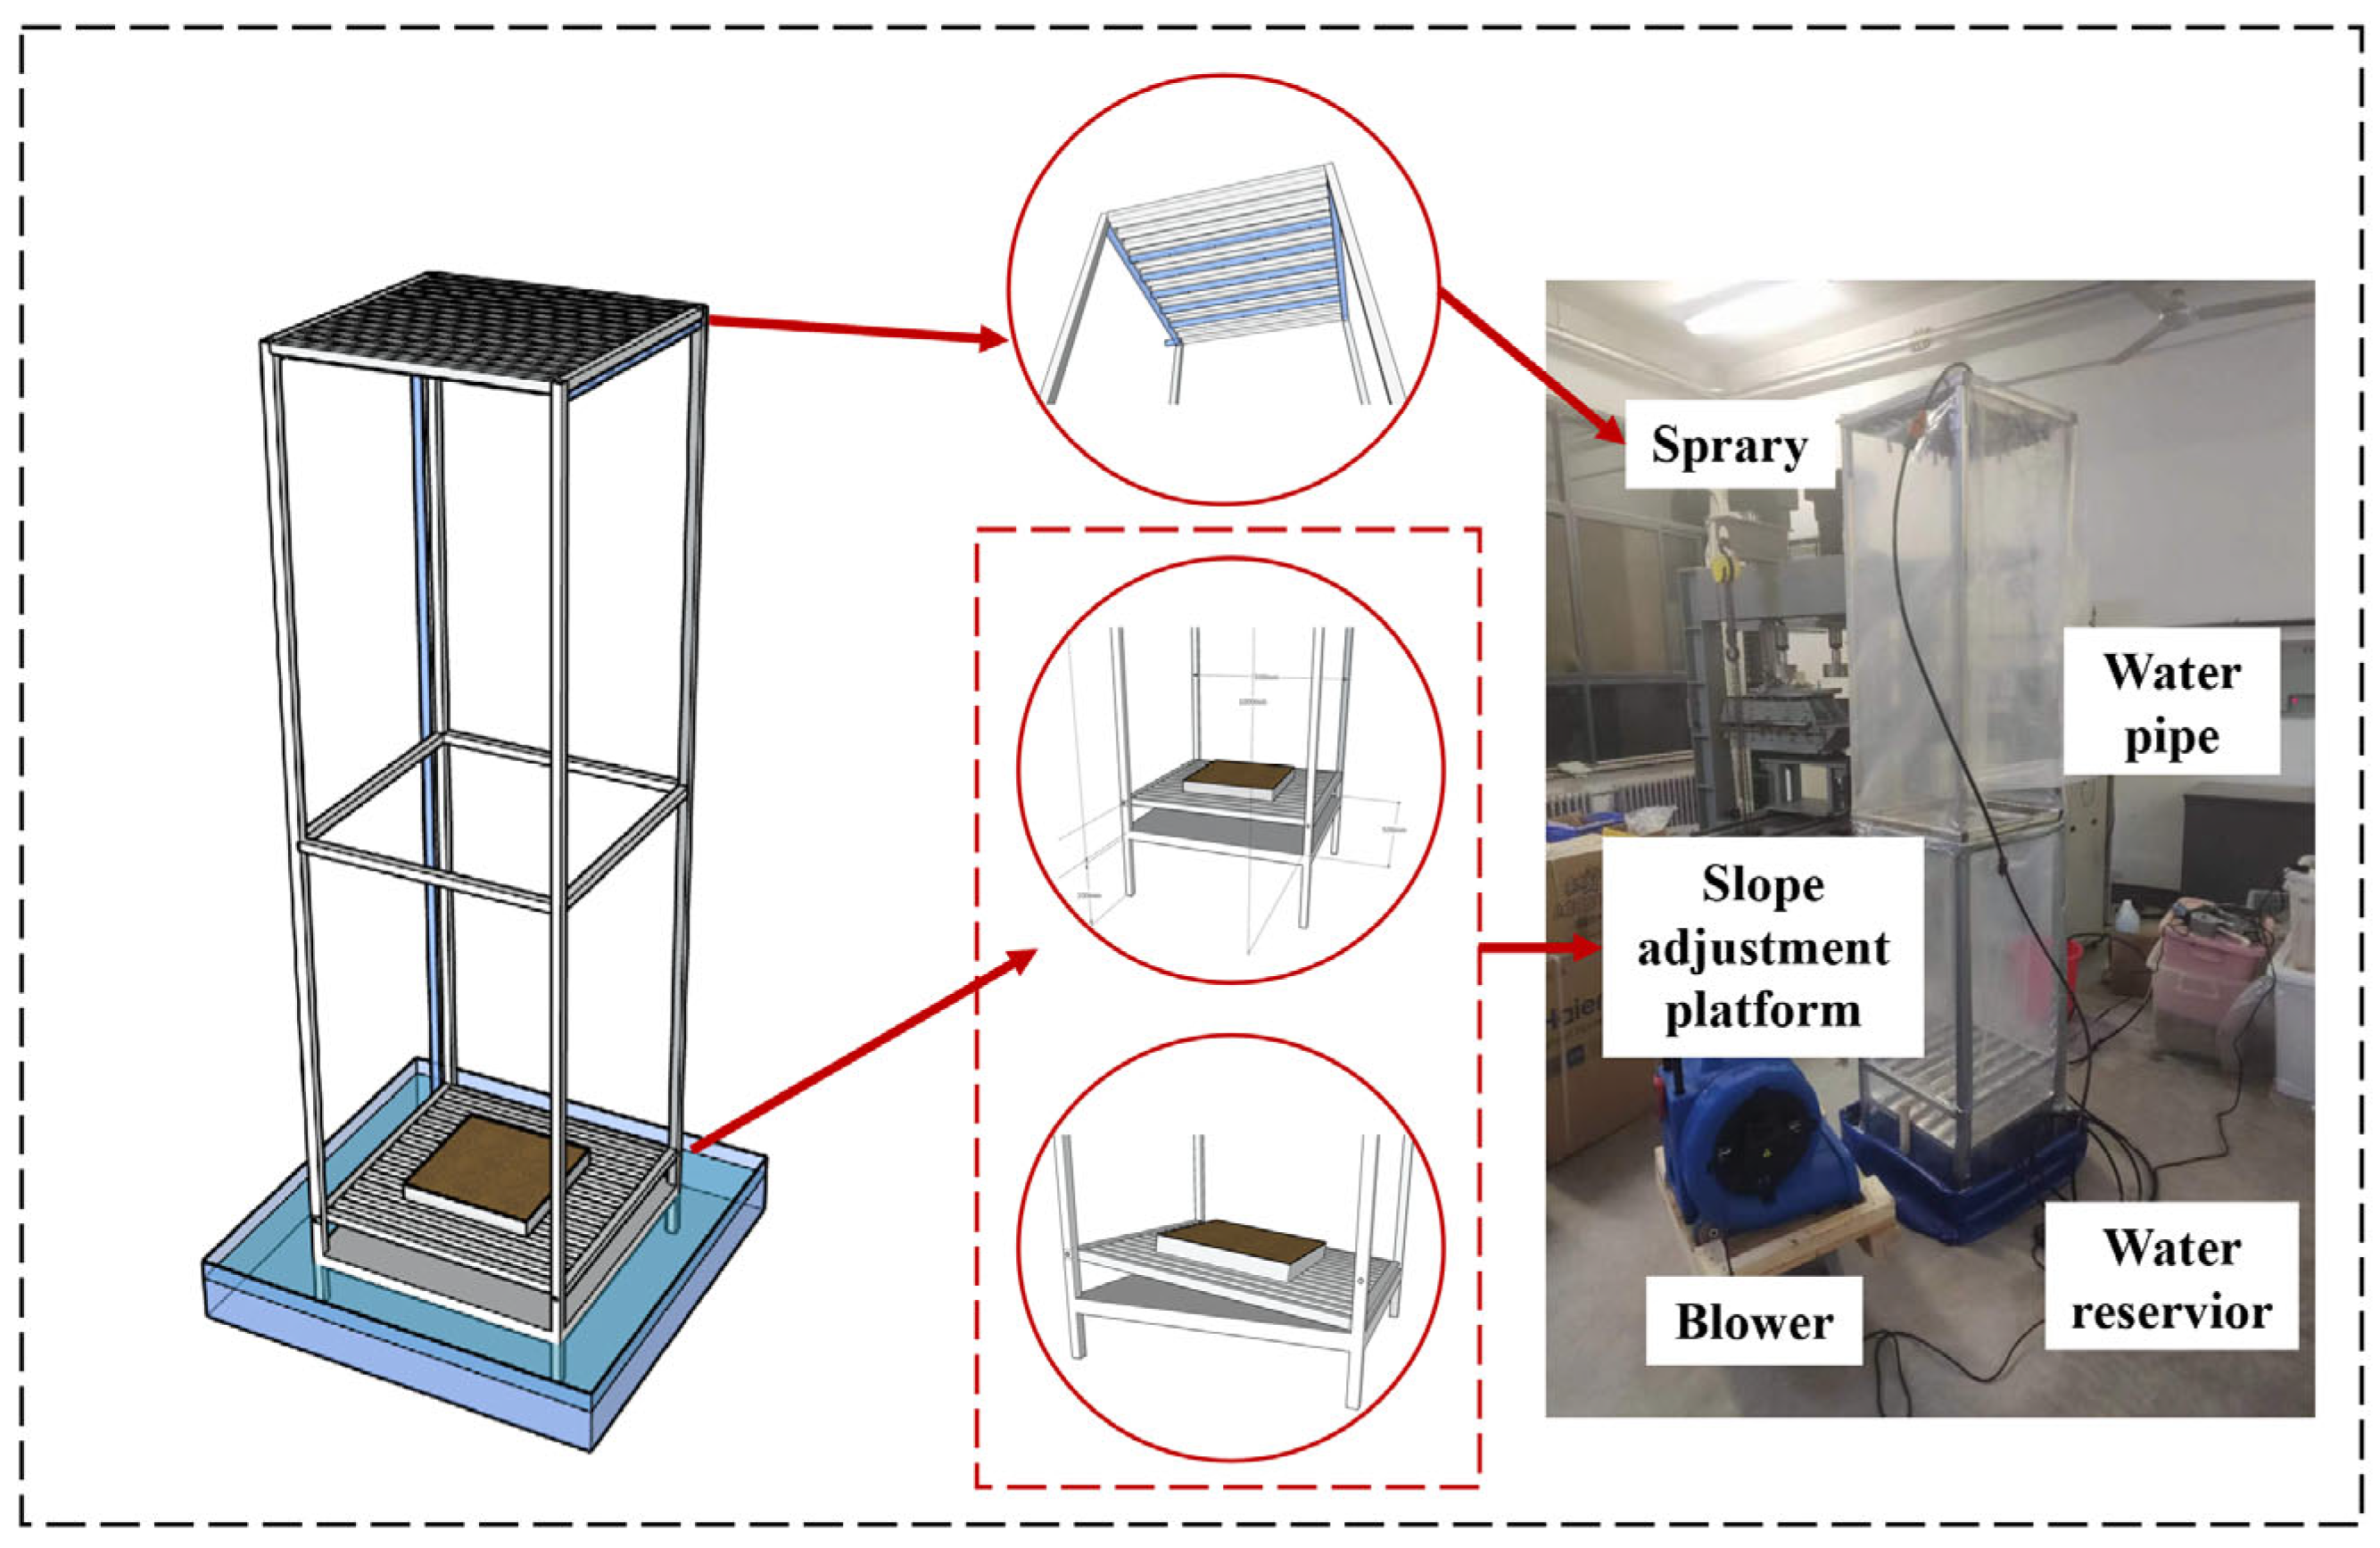
- Wind–rain resistance test
- 2.
- Friction test
4.3. Microscopic Evaluation
Author Contributions
Funding
Institutional Review Board Statement
Informed Consent Statement
Data Availability Statement
Acknowledgments
Conflicts of Interest
References
- Middleton, N.; Kang, U. Sand and dust storms: Impact mitigation. Sustainability 2017, 9, 1053. [Google Scholar] [CrossRef]
- Wang, P.F.; Tan, X.H.; Zhang, L.Y.; Li, Y.J.; Liu, R.H. Influence of particle diameter on the wettability of coal dust and the dust suppression efficiency via spraying. Process Saf. Environ. Prot. 2019, 132, 189–199. [Google Scholar] [CrossRef]
- Paul, S.; Chang, J.; Mukhopadhyay, S. Development of Coursework on Studying Fugitive Dust From Construction Site Using Optical-Type Dust Sensor. IEEE Sens. J. 2021, 21, 17318–17326. [Google Scholar]
- Amato, F.; Querol, X.; Johansson, C.; Nagl, C.; Alastuey, A. A review on the effectiveness of street sweeping, washing and dust suppressants as urban PM control methods. Sci. Total Environ. 2010, 408, 3070–3084. [Google Scholar] [CrossRef]
- Wang, H.X.; Sun, X.H.; Miao, L.C.; Zhang, J.Z.; Yin, W.H.; Wu, L.Y. Sand and dust storms control for sustainable anti-desertification: Large-scale eicp-pvac treatment field demonstration and insights. Acta Geotech. 2025, 20, 2201–2219. [Google Scholar] [CrossRef]
- Miao, L.C.; Wang, H.X.; Sun, X.H.; Wu, L.Y. Biomineralization for Reducing and Controlling Sand-Dust Storms. Adv. Sci. 2024, 11, e2403961. [Google Scholar] [CrossRef]
- Sun, X.H.; Miao, L.C.; Tong, T.Z.; Wang, C.C. Experimental study of solidifying sand using microbial-induced calcium carbonate precipitation. Rock Soil Mech. 2017, 38, 3225–3230, 3239. [Google Scholar] [CrossRef]
- Khodadadi, T.H.; Kavazanjian, E.; Paassen, L.V.; Dejong, J. Bio-grout materials: A review. Grouting 2017, 1–12. [Google Scholar] [CrossRef]
- Li, C.; Li, S.; Xing, J.; Yao, D. On-site test of fixed mobile sand dunes using combined technology of sand plants and EICP in the Ulanbuh Desert, China. Acta Geotech. 2025, 20, 1921–1934. [Google Scholar] [CrossRef]
- Cui, M.J.; Lai, H.J.; Hoang, T.; Chu, J. One-phase-low-pH enzyme induced carbonate precipitation (EICP) method for soil improvement. Acta Geotech. 2021, 16, 481–489. [Google Scholar] [CrossRef]
- Sun, X.H.; Miao, L.C.; Yuan, J.H.; Wang, X.H.; Wu, L.Y. Application of enzymatic calcification for dust control and rainfall erosion resistance improvement. Sci. Total Environ. 2020, 759, 143468. [Google Scholar] [CrossRef] [PubMed]
- Almajed, A.; Tirkolaei, H.K.; Kavazanjian, E.; Hamdan, N. Enzyme induced carbonate precipitation (EICP) for soil improvement: A review of material production methods. J. Rock Mech. Geotech. Eng. 2018, 10, 1131–1145. [Google Scholar] [CrossRef]
- Arab, M.G.; Rohy, H.; Zeiada, W.; Almajed, A.; Omar, M. One-phase EICP biotreatment of sand exposed to various environmental conditions. J. Mater. Civ. Eng. 2021, 33, 04020489. [Google Scholar] [CrossRef]
- Almajed, A. Enzyme Induced Carbonate Precipitation (EICP) for Soil Improvement; Arizona State University: Tempe, Arizona, 2017; p. 149. [Google Scholar]
- Nam, I.H.; Chon, C.M.; Jung, K.Y.; Choi, S.G.; Choi, H.; Park, S.S. Calcite precipitation by ureolytic plant (Canavalia ensiformis) extracts as effective biomaterials. KSCE J. Civ. Eng. 2015, 19, 1620–1625. [Google Scholar] [CrossRef]
- Park, S.S.; Choi, S.G.; Nam, I.H. Effect of plant-induced calcite precipitation on the strength of sand. J. Mater. Civ. Eng. 2014, 26, 06014017. [Google Scholar] [CrossRef]
- Dilrukshi, R.A.N.; Nakashima, K.; Kawasaki, S. Soil improvement using plant-derived urease-induced calcium carbonate precipitation. Soils Found. 2018, 58, 894–910. [Google Scholar] [CrossRef]
- Gao, Y.; He, J.; Tang, X.; Chu, J. Calcium carbonate precipitation catalyzed by soybean urease as an improvement method for fine-grained soil. Soils Found. 2019, 59, 1631–1637. [Google Scholar] [CrossRef]
- Lee, S.; Kim, J. An experimental study on enzymatic-induced carbonate precipitation using yellow soybeans for soil stabilization. KSCE J. Civ. Eng. 2020, 24, 2026–2037. [Google Scholar] [CrossRef]
- Liu, L.X.; Gao, Y.; Meng, H.; Pan, Q.W.; Wang, Z.B.; Zhou, Y.D.; Liu, B.; Cao, X.W. Pore-scale, mechanical, and hydraulic properties of EICP-treated sand using crude legume ureases with different protein contents. Acta Geotech. 2024, 19, 4747–4763. [Google Scholar] [CrossRef]
- Jiang, N.J.; Wang, Y.J.; Chu, J. Bio-mediated soil improvement: An introspection into processes, materials, characterization and applications. Soil Use Manag. 2022, 38, 68–93. [Google Scholar] [CrossRef]
- Phillips, A.J.; Gerlach, R.; Lauchnor, E.; Mitchell, A.C.; Cunningham, A.B.; Spangler, L. Engineered applications of ureolytic biomineralization: A review. Biofouling 2013, 29, 715–733. [Google Scholar] [CrossRef] [PubMed]
- Cheng, L.; Shahin, M.A.; Mujah, D. Influence of key environmental conditions on microbially induced cementation for soil stabilization. Geotech. Geoenviron. Eng. 2017, 143, 04016083. [Google Scholar] [CrossRef]
- Choi, S.G.; Park, S.S.; Wu, S.; Chu, J. Methods for calcium carbonate content measurement of biocemented soils. J. Mater. Civ. Eng. 2017, 29, 06017015. [Google Scholar] [CrossRef]
- Gomez, M.G. Field Scale Bio-Cementation for the Improvement of Loose Sands; University of California, Davis: Davis, CA, USA, 2013. [Google Scholar]
- Sun, X.H.; Miao, L.C.; Wu, L.Y. Applicability and theoretical calculation of enzymatic calcium carbonate precipitation for sand improvement. Geomicrobiol. J. 2020, 37, 389–399. [Google Scholar] [CrossRef]
- Tang, C.S.; Yin, L.Y.; Jiang, N.J.; Zhu, C.; Zeng, H.; Li, H.; Shi, B. Factors affecting the performance of microbial-induced carbonate precipitation (MICP) treated soil: A review. Environ. Earth Sci. 2020, 79, 94. [Google Scholar] [CrossRef]
- Xiao, Y.; He, X.; Stuedlein, A.W.; Chu, J.; Evans, T.M.; Van Paassen, L.A. Crystal growth of MICP through microfluidic chip tests. Geotech. Geoenviron. Eng. 2022, 148, 06022002. [Google Scholar] [CrossRef]
- Almajed, A.; Khodadadi, H.; Kavazanjian, E. Sisal Fiber Reinforcement of Eicp-Treated Soil; American Society of Civil Engineers: Reston, VA, USA, 2018; pp. 29–36. [Google Scholar] [CrossRef]
- Yuan, H.; Liu, K.; Zhang, C.; Zhao, Z. Experimental study on compressive strength of EICP technology solidifying silt in the Yellow River flooding area. J. Henan Univ. 2022, 52, 727–733. [Google Scholar] [CrossRef]
- Carmona, J.P.S.F.; Venda Oliveira, P.J.; Lemos, L.J.L.; Pedro, A.M.G. Improvement of a sandy soil by enzymatic calcium carbonate precipitation. Proc. Inst. Civ. Eng. Geotech. Eng. 2018, 171, 3–15. [Google Scholar] [CrossRef]
- Wen, K.; Li, Y.; Amini, F.; Li, L. Impact of bacteria and urease concentration on precipitation kinetics and crystal morphology of calcium carbonate. Acta Geotech. 2020, 15, 17–27. [Google Scholar] [CrossRef]
- Whiffin, V.S.; van Paassen, L.A.; Harkes, M.P. Microbial carbonate precipitation as a soil improvement technique. Geomicrobiol. J. 2007, 24, 417–423. [Google Scholar] [CrossRef]
- ISO6058:1984; ISO (1984) Water Quality: Determination of Calcium Content: EDTA Titrimetric Method. ISO: Geneva, Switzerland, 1984.


| Working Conditions | Spray Bottle I | Spray Bottle II | ||||
|---|---|---|---|---|---|---|
| Urea Volume/mL | Calcium Chloride Volume/mL | Urease Volume/mL | Urea Volume/mL | Calcium Chloride Volume/mL | Urease Volume/mL | |
| W1 | 30 | 0 | 60 | 0 | 30 | 0 |
| W2 | 30 | 30 | 0 | 0 | 0 | 60 |
| W3 | 30 | 30 | 60 | 0 | 0 | 0 |
| Density ρ/g·cm−3 | Water Content Wop/% | Void Ratio e | Maximum Dry Density ρ/g·cm−3 | Specific Gravitys Gs/g·cm−3 | Permeability Coefficient KT/cm·s−1 |
|---|---|---|---|---|---|
| 1.39 | 10.34 | 1.14 | 1.26 | 2.7 | 2.5 × 10⁻⁴ |
| Working Conditions | Rotation 1 | Rotation 2 | Rotation 3 | |||
|---|---|---|---|---|---|---|
| Wind Speed V1/m·s−1 | Time t1/min | Rainfall R2/mm·h−1 | Time t2/min | Wind Speed V3/m·s−1 | Time t3/min | |
| WR1 | 5 | 60 | 7 | 60 | 15 | 60 |
| WR2 | 10 | 60 | 15 | 60 | 15 | 60 |
| WR3 | 15 | 60 | 40 | 60 | 15 | 60 |
| Working Conditions | Load (N) | Pressure (kPa) | Revolution (r) |
|---|---|---|---|
| L5–r10 | 5 | 26.7 | 10 |
| L5–r30 | 5 | 26.7 | 30 |
| L5–r50 | 5 | 26.7 | 50 |
| L10–r10 | 10 | 53.3 | 10 |
| L10–r30 | 10 | 53.3 | 30 |
| L10–r50 | 10 | 53.3 | 50 |
| L15–r10 | 15 | 80 | 10 |
| L15–r30 | 15 | 80 | 30 |
| L15–r50 | 15 | 80 | 50 |
Disclaimer/Publisher’s Note: The statements, opinions and data contained in all publications are solely those of the individual author(s) and contributor(s) and not of MDPI and/or the editor(s). MDPI and/or the editor(s) disclaim responsibility for any injury to people or property resulting from any ideas, methods, instructions or products referred to in the content. |
© 2025 by the authors. Licensee MDPI, Basel, Switzerland. This article is an open access article distributed under the terms and conditions of the Creative Commons Attribution (CC BY) license (https://creativecommons.org/licenses/by/4.0/).
Share and Cite
Zhang, J.; Jia, H.; Li, J.; Chen, X.; Wang, L.; Wang, S.; Liu, L. Bio-Gel Formation Through Enzyme-Induced Carbonate Precipitation for Dust Control in Yellow River Silt. Gels 2025, 11, 452. https://doi.org/10.3390/gels11060452
Zhang J, Jia H, Li J, Chen X, Wang L, Wang S, Liu L. Bio-Gel Formation Through Enzyme-Induced Carbonate Precipitation for Dust Control in Yellow River Silt. Gels. 2025; 11(6):452. https://doi.org/10.3390/gels11060452
Chicago/Turabian StyleZhang, Jingwei, Hualing Jia, Jia Li, Xuanyu Chen, Lei Wang, Shilong Wang, and Lin Liu. 2025. "Bio-Gel Formation Through Enzyme-Induced Carbonate Precipitation for Dust Control in Yellow River Silt" Gels 11, no. 6: 452. https://doi.org/10.3390/gels11060452
APA StyleZhang, J., Jia, H., Li, J., Chen, X., Wang, L., Wang, S., & Liu, L. (2025). Bio-Gel Formation Through Enzyme-Induced Carbonate Precipitation for Dust Control in Yellow River Silt. Gels, 11(6), 452. https://doi.org/10.3390/gels11060452