1. Introduction
The color of foods of both plant and animal origin derives from pigments that can be distinguished according to their polarity in lipophilic (chlorophyll: green; carotenoids: yellow, orange, red) or hydrophilic (flavonoids: yellow; anthocyanins: red, blue; betalaine: red, violet) [
1]. In vegetables and fruits, pigments and dyes change qualitatively and quantitatively during the different stages of maturation [
2]. Therefore, the colorimetric characteristics of foods are connected to information about their state of maturation, conservation, and possible alteration. Hence, color is an important indicator of the shelf-life of the products and of their eventual biological and technological alteration (inappropriate use of additives/dyes, incorrect heat treatments) [
3,
4]. Consequently, color is an important indicator of the quality of the food product, both from the point of view of the producer, who often uses it as a process parameter, and for the consumer who chooses food mainly in relation to aesthetic and chromatic characteristics [
5]. These aspects are the first qualitative input that the consumer perceives and evaluates to realize the freshness and state of ripeness, creating organoleptic and sensory expectations that the consumers will find at the time of consumption.
The main factors affecting meat stability during processing and subsequent storage are lipid oxidation and deterioration due to microorganism growth [
6]. The oxidative degradation of lipids and proteins causes significant loss of nutritional composition and results in protein fragmentation, amino acid crosslinking, peptide side-chain modification, and consequently, offensive odors and changing colors. Different methods to prolong meat shelf-life have been proposed by researchers, including active packaging [
7,
8]. The principle of active packaging consists of including active agents in the packaging which interact with meat and/or its environment by releasing antioxidant compounds in order to delay degradation due to lipid, protein, and pigment oxidation, thus extending the period that products are sensory acceptable. In particular, the use of essential oils as additive active coating for meat treatment has been proposed for their antioxidant and antimicrobial activity [
7]. Several studies have reported the use of edible active packaging as an emerging technology to extend shelf-life of meat products [
9,
10,
11]. Edible films represent an active packaging formulation typically prepared by using natural polysaccharides and enriched with antioxidant and/or antimicrobial substances, such as essential oils, or extracts from agro-industrial by-products. Indeed, Grimaldi et al. [
9] already reported the preparation of active edible films based on sodium alginate enriched with different extracts obtained from agro-industrial by-products (such as artichoke, red onions, thistles) able to extend the shelf-life of meat [
9]. These innovative materials prolong the shelf-life by releasing active compounds, and can be even cooked and eaten together with the food product [
9].
In this context, it is important to check the quality of meat and its state of decay. The use of color as an indicator of food quality is a quick and easy parameter to measure, well related to other physico-chemical properties of the product [
2,
12,
13]. Historically, the investigation of food colors is part of sensory analysis, which over the years has been replaced by instrumental measurements capable of performing an evaluation of food in real time and objectively [
5,
14]. In the RGB model, the chromatic scale is obtained from the sum, to varying degrees, of the additive primary colors: red, green and blue
https://it.wikipedia.org/wiki/Blu, accessed on 2 April 2025 [
12]. The sum of the three colors in equal parts constitutes white while their total absence is black; other notable colors of this type of model are yellow (red + green), magenta (red + blue) and cyan (green + blue) [
12,
15]. Due to its characteristics, it is a particularly suitable model in the representation and display of images in electronic devices [
16]. Indeed, most devices normally use combinations of red, green, and blue to display the pixels of an image. However, this also means that it is particularly dependent on the device itself: the same image may be displayed differently when seen on two different devices, as the materials used to make the screens vary by manufacturer [
16]. In addition, differences can be noted over time even in the same device, due to the natural deterioration of the product. An image can be decomposed through filters or other techniques in the basic colors that allow evaluation of the visible spectral region [
17]. One of the most used spaces today is the CIELAB 1976 space [
14], derived from the XYZ space, characterized by the coordinates L*, a* and b*. The parameter L* represents the brightness (i.e., the position on the vertical axis from black L* = 0 to white L* = 100), while the values of a* and b* define the chromaticity of the color [
18]. The great advantage of the CIELAB system consists in the possible correlation of the distances between two points of space with the chromatic differences perceptible by the human eye. In this case, the distance (∆E) between two points is defined as the geometric distance between two points in space. For ∆E = 1, the difference between two colors is difficult to perceive by the human eyes; for ∆E = 2, the difference between two colors is clearly perceptible; for ∆E > 5 the difference is evident even without direct comparison.
As already demonstrated, the storage of food products in active packaging represents a sustainable alternative to the use of plastics, ensuring the improvement of products’ shelf-life by enhancing their oxidative stability [
9,
10,
11]. In literature, several studies have shown that the color monitoring of food over time by measuring coordinates variation (∆E) in the CIELab color space can be considered a crucial parameter related to food quality. For instance, the typical red coloration of meat is mainly subjected to changes during storage. Indeed, oxidation phenomena lead to a significant color transition from bright red (oxymyoglobin) to brown (metmyoglobin), a process that results in a degradation of the food and reduction of the food’s appeal to consumers [
19]. This transition is associated with the oxidation of myoglobin, where the formation of metmyoglobin is a key indicator of quality loss [
4]. In this context, color variation (∆E) in the CIELab color space has been identified as a key parameter to evaluate color changes of food products. According to Hernández Salueña et al. [
4], ∆E measurement provides a robust measure of perceptible color differences promoted by oxidation, capturing the cumulative effect of variations of the L*, a*, and b* coordinates. It has been demonstrated that a significant increase in ∆E correlates with an increased proportion of metmyoglobin, reflecting the deterioration of meat quality and the consequent reduction in consumer acceptances [
4]. Moreover, during meat oxidation, the color variation generally provided a progressive increase as oxidation advanced, particularly when met-myoglobin content exceeded 20%, which is generally associated with consumer rejection [
4,
20]. This variation is crucial for accurately assessing meat freshness and determining the point at which the product becomes visually unappealing. Furthermore, ∆E has shown to be more sensitive to changes in redox states than individual color coordinates, emphasizing its significance as a comprehensive indicator of meat quality [
20].
In this work, color analysis was used for the first time to monitor the shelf-life of meat treated with an active gel enriched with basil extract. In detail, an antioxidant gel formulation based on polysaccharides and antioxidant components contained in basil extract is proposed as an active solution capable of prolonging meat shelf-life during storage. The oxidative stability of the spray was first evaluated using Oxitest reactor measurements. Different colorimetry methods were also tested to record color coordinates and monitor color variations in both treated and untreated meat samples. This approach not only enhances monitoring accuracy but also offers an effective system to determine the performance of innovative packaging solutions in preserving meat freshness and visual appeal.
3. Conclusions
This research directs attention to the possible use of a very rapid analytical method based on a colorimetric assay to monitor meat storage and to its application to evaluate the effects of natural antioxidants proposed to preserve products from deterioration, thus extending shelf-life. The proposed techniques, such as colorimetry and Oxitest, allow estimation of the antioxidant effect on a system represented by a whole product instead of one usually measured by chemical analyses after complex extraction procedures. The main advantage of these analytical techniques is that the samples are analyzed without pretreatments.
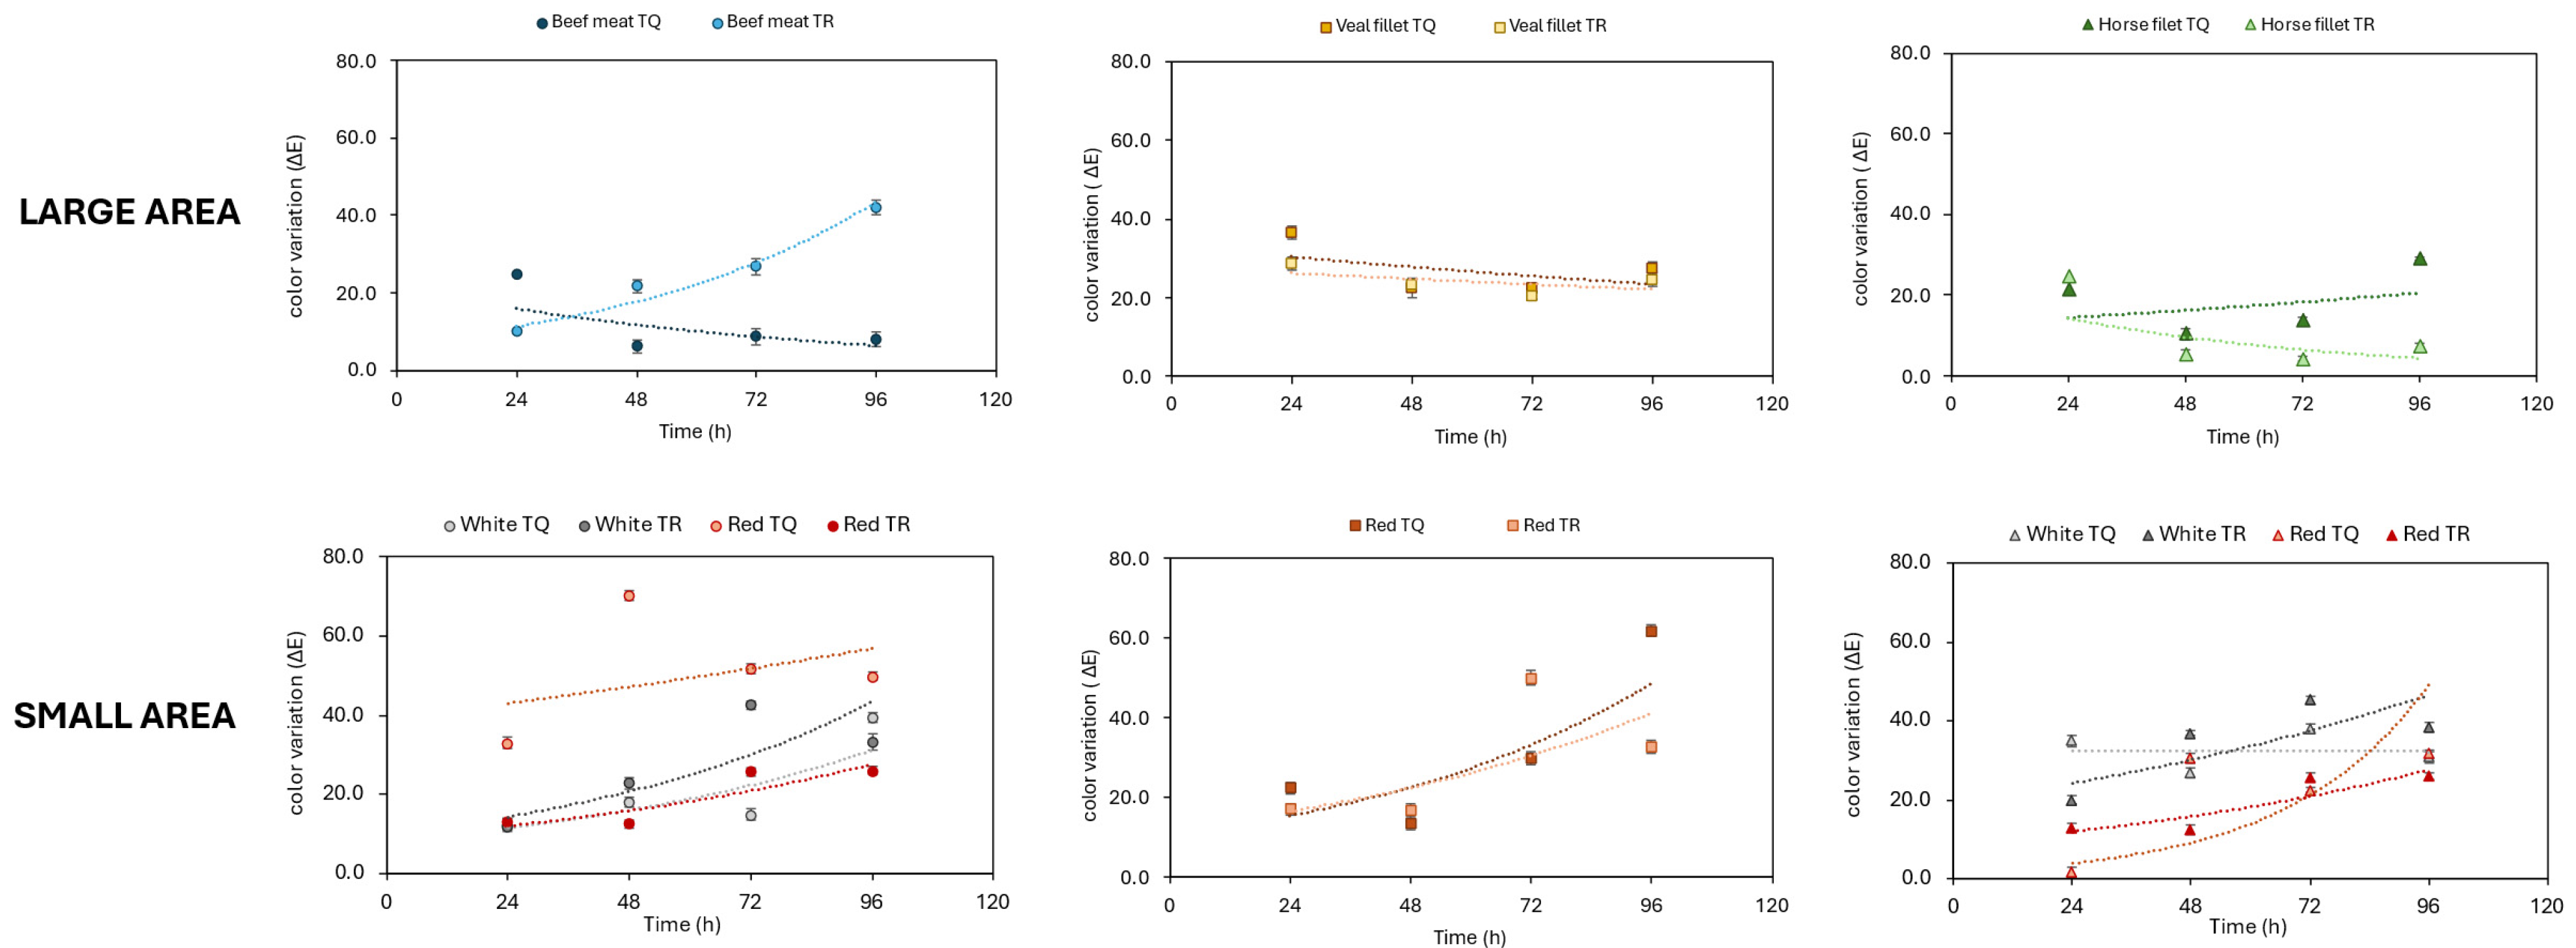
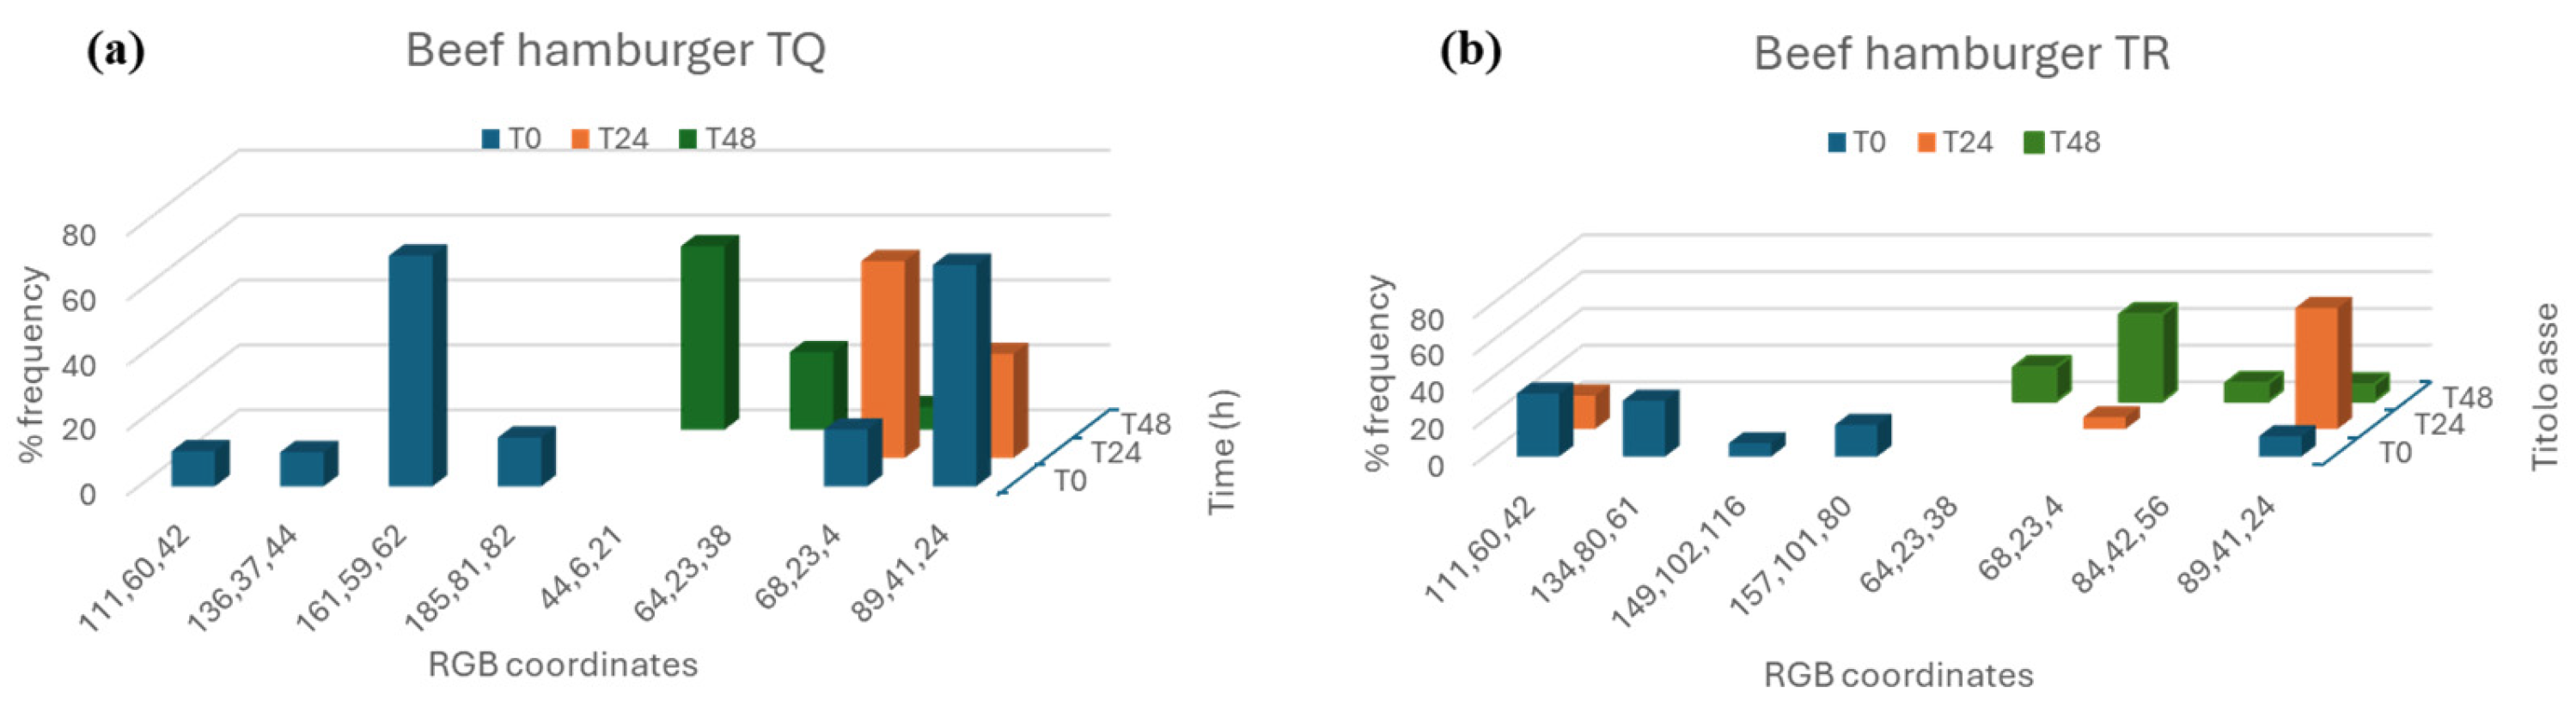
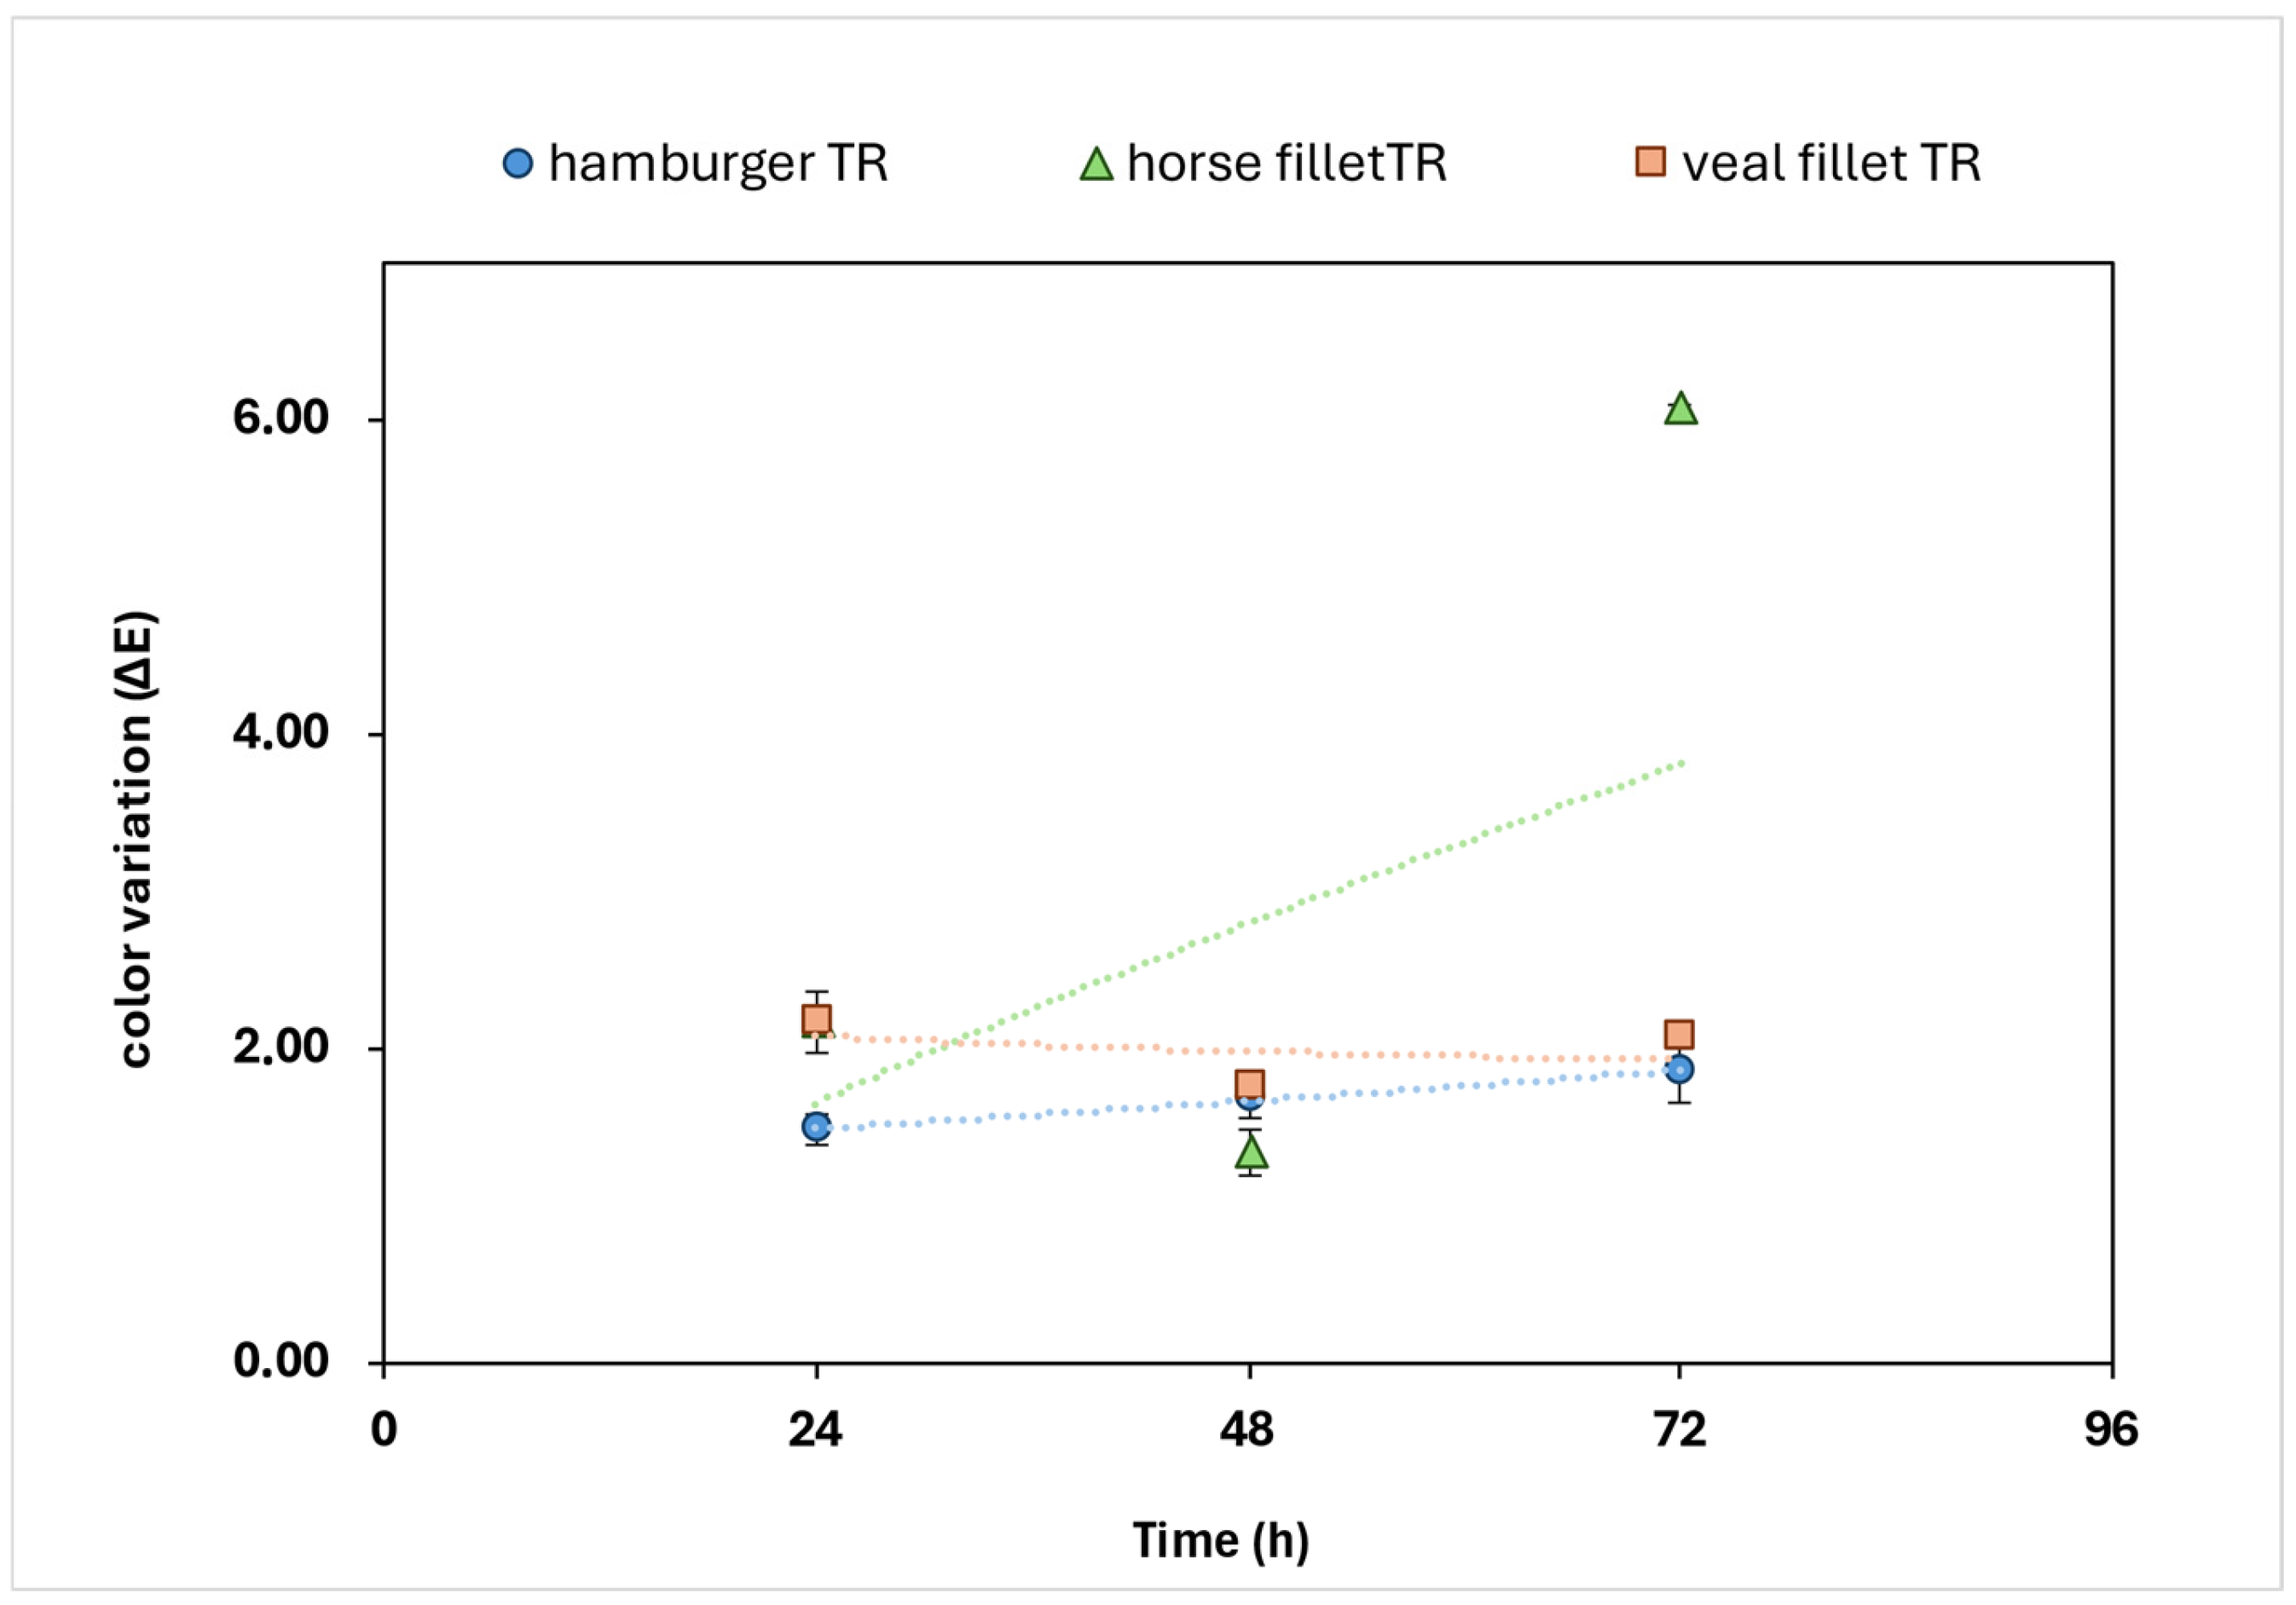
The goal of the present work as only a preliminary approach was to compare two different acquisition methods for image analysis and to estimate the efficiency of both procedures to check the effect of the preservative formulation. The results of Method A showed that the color of the control samples was definitely affected over a few days, whereas treated samples kept a more stable color, except for horse fillet. The use of the tool “Color inspector 3D” of the software Image J 2 (Method B) suggests a potential deeper investigation since the measure of frequency through a 3D color scan allows the presence of some colors to be proposed as markers, thus opening new possibilities of development for future prospects. For this reason, Method B is recommended for the analysis of acquired images.
Of course, for a complete evaluation it is mandatory to complete the study by considering microbiological tests in order to check the state of the meat from a hygienic point of view and to explore a possible correlation between color indexes and microbial contamination.
4. Materials and Methods
4.1. Chemicals and Samples
Water (MilliQ), sodium carbonate, sodium alginate, calcium carbonate, glycerol, and d-(+)-gluconic acid-σ-lactone (GDL) were purchased from Sigma Aldrich (Steinheim, Germany).
The aroma and meat samples (beef hamburger, veal fillet, horse fillet, beef fillet) were commercially available and provided, and they were stored at a refrigerating temperature of 4 °C by Greci Industria Alimentare spa (Ravadese, Parma, Itay).
4.2. Gel Preparation
Gel formulations were prepared following a previously set up protocol [
9]. Briefly, a 1%
w/
v solution of sodium alginate was prepared in 1 L distilled water at 70 °C under vigorous stirring. Glycerol was added at an amount of 0.3 g/g of sodium alginate. In a different beaker, a suspension of CaCO
3 (0.04 g/g of alginate) and GDL (5.4 g/g of CaCO
3) was prepared in 100 mL of distilled water (pH around 5.0). The suspension was then added to the alginate solution under vigorous stirring and kept at 40 °C for 30 min. A hydro-soluble aroma based on basil extract was provided by the company Greci Industria Alimentare spa (Ravadese, Parma, Itay), was added (2.5%
w/
v) to the mixture, and gently stirred at room temperature for 15 min. The formulation was packaged in suitable bottles to produce a spray solution.
4.3. DPPH Assay on Active Gel
The antioxidant activity of the gel was monitored for 6 months, assessing the DPPH assay every 2 months (T0 = day of preparation, T1 = 2nd month, T2 = 4th month, T3 = 6th month, T4 = 1 year).
The DPPH assay was based on the molecular scavenger activity of the radical DPPH•. Each class of molecules occurs in different mechanisms of oxidation, such as scavenging reactive oxygen species, converting hydroperoxides to non-radical species, absorbing UV radiation, deactivating singlet oxygen or, in some cases, binding of metal ions.
The protocol followed for DPPH assay was reported by Pasqualone et al. [
25] with some modifications. An amount of 1.5 mL of freshly prepared DPPH solution in 60 μM methanol was added to 500 μL of the active spray. After 30 min under vigorous stirring, the mixture was filtered through a 0.45 µm PTFE filter, and the absorbance of the solution was measured at 515 nm through UV–VIS spectrophotometry (Thermo Scientific
TM Evolution
TM 201/220, Milan, Italy). Methanol was used as a blank. The absorbance of the DPPH solution was recorded at the same wavelength but at t = 0 min. The antioxidant activity was expressed as percentage of scavenging capacity of the DPPH radical and calculated as follows:
where A
r is the absorbance of DPPH solution at t = 0 min, and A
s is the absorbance of the sample.
4.4. Oxitest
The antioxidant activity of hydro-soluble aroma and of minced meat was tested by means of the Oxitest reactor (Velp Scientifica, Usmate MB, Italy).
This device is composed of two reactors and permits acceleration of the samples oxidation process through temperature and oxygen pressure increase. The analysis measures the consumption of oxygen which reacts with fat over time. The longer the IP, the higher the stability against oxidation over time. In detail, 30 g of meat dough, was placed directly inside the three titanium sample holders, in each reaction chamber, using a spatula. The same procedure was followed for the sample containing the hydro-soluble aroma (5% w/w). Oxygen pressure was set at 6 bars, and temperature at 90 °C, according to the analytical conditions set by Velp Scientifica during the validation studies performed on different food products (IQ/OQ Oxitest Manual, Velp Scientifica). The system measures the absolute pressure change inside the chambers and monitors the oxygen uptake by the reactive components occurring in the sample. An Induction Period (IP), expressed in minutes, corresponds to the time at which a sudden change in the rate of oxidation is detected. At the end of the oxidation tests, the IP of every run is calculated by the software OXISoftTM. The analysis was also performed on the minced meat dough stored at 4 °C, after addition of the hydro-soluble aroma at 24 and 96 h.
4.5. Sample Treatment
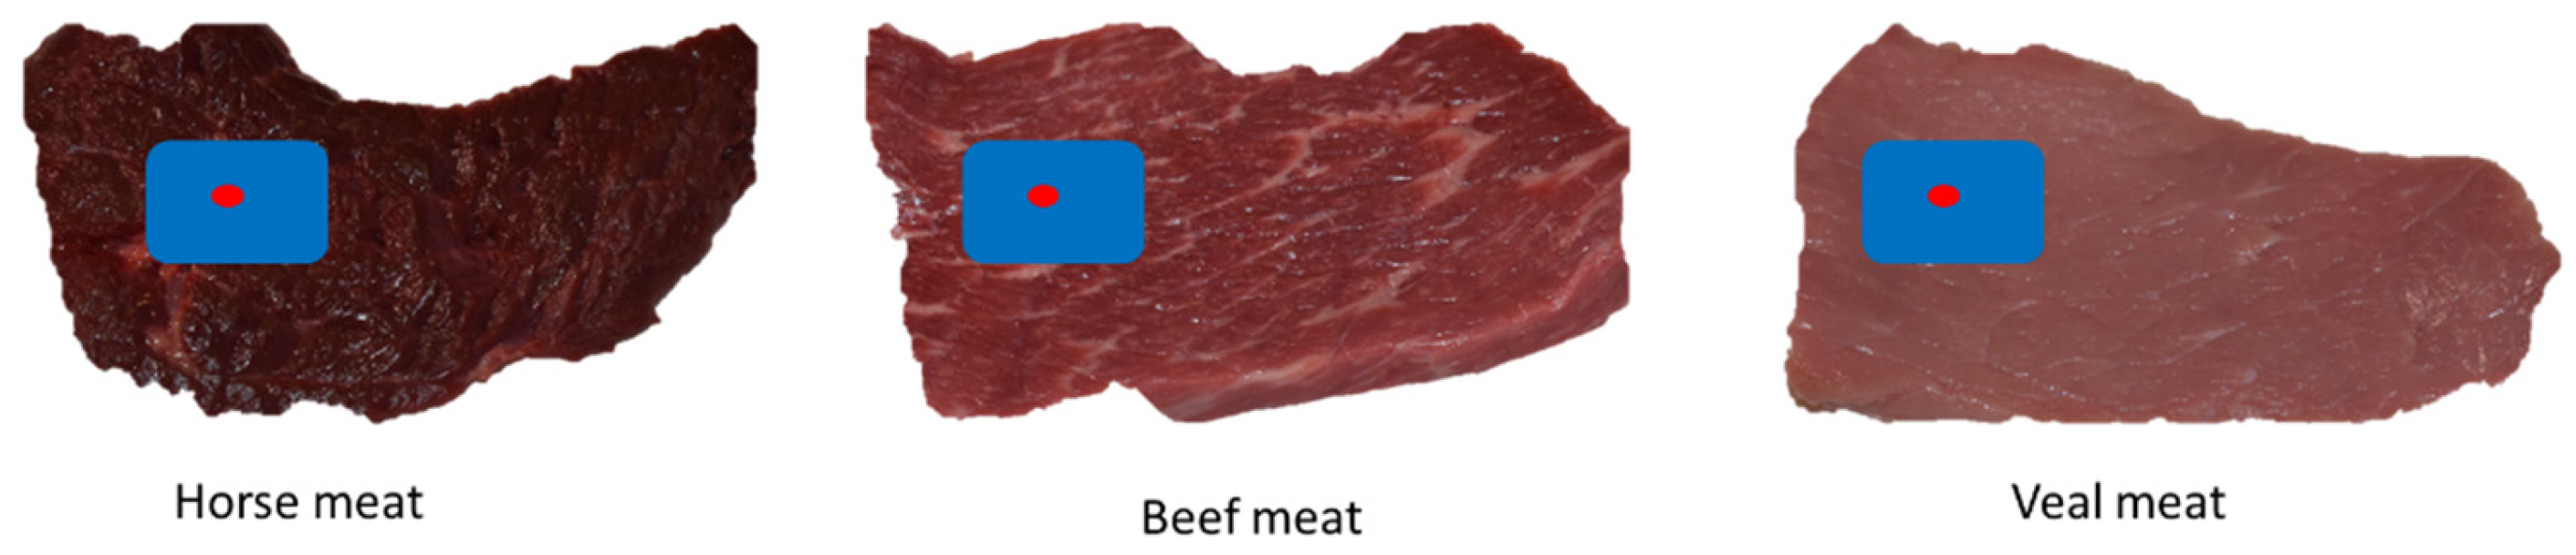
Each slice (about 15 × 6.5 × 1.5 cm3, l × l × h) and each hamburger (15 × 1.5 cm2, l × h) was treated with 10 sprays per side, corresponding to about 0.02 mL /cm2. The samples were dispensed at a 5 cm distance between bottle spray and samples at room temperature. Shelf-life of meat, stored at a temperature of 4 °C covered with an aluminum foil, was checked from T0 to T96h, performing analyses every 24 h. One control sample for each meat type was stored under the same conditions.
4.6. Image Acquisition
Images were acquired using a Nikon D5600 camera (Nikon, Torino, Italy) with the following settings: sensibility ISO-100; focal distance of 48 mm; color filter type RGB; Flash ON, resolution 300 dpi. The samples were photographed immediately after preparation and from T0 to T96 every 24 h.
4.7. Image Analysis
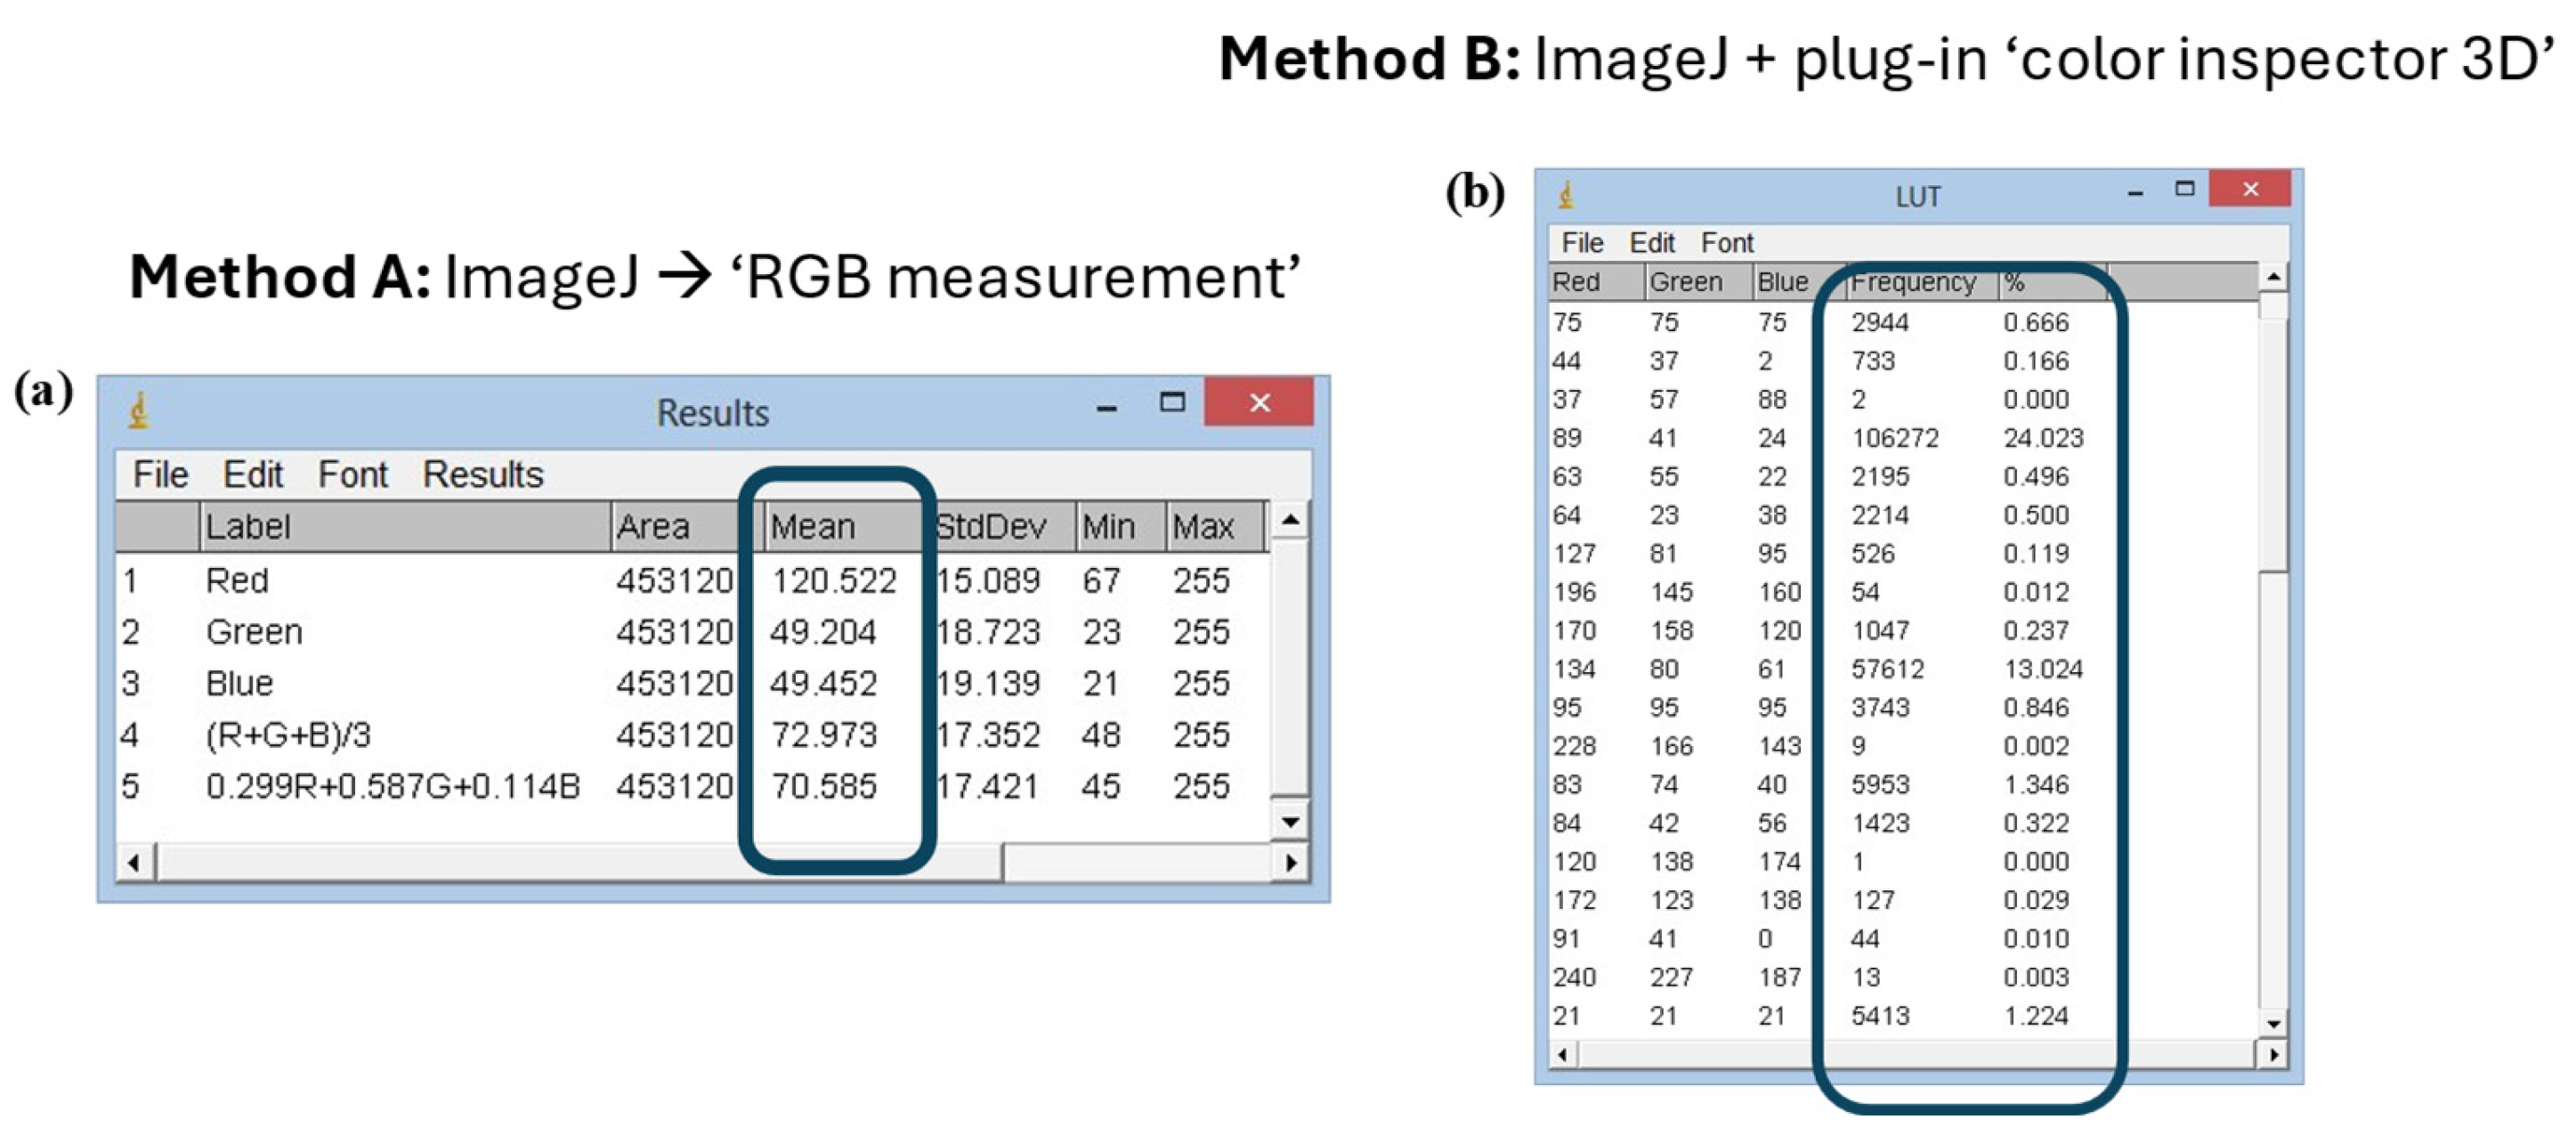
Two different methods were used to analyze pictures of meat samples. Both of them use the ImageJ software, but Method B involves the use of the additional tool “Color inspector 3D” that performs analysis on restricted areas of the pictures, whereas Method A allows the image analysis of the widest area of the pictures. Method A was used to analyze the color of the treated and untreated samples from T0 to T96 every 24 h. Method B was used to analyze the color of the treated and untreated beef hamburgers from T0 to T48h every 24 h (
Figure 6).
In Method A, the color analysis was carried out using the “RGB Measure” command of the ImageJ software which allows obtaining the colorimetric information in the RGB field of the image under analysis (
Figure 6a). The pictures acquired by the camera could be analyzed completely or in a portion of them. The color variations occurring in the considered time intervals were evaluated using the Euclidean distance between each three coordinates (red, green and blue). The evaluation of the colorimetric coordinates was then carried out by analyzing the data in Microsoft Excel.
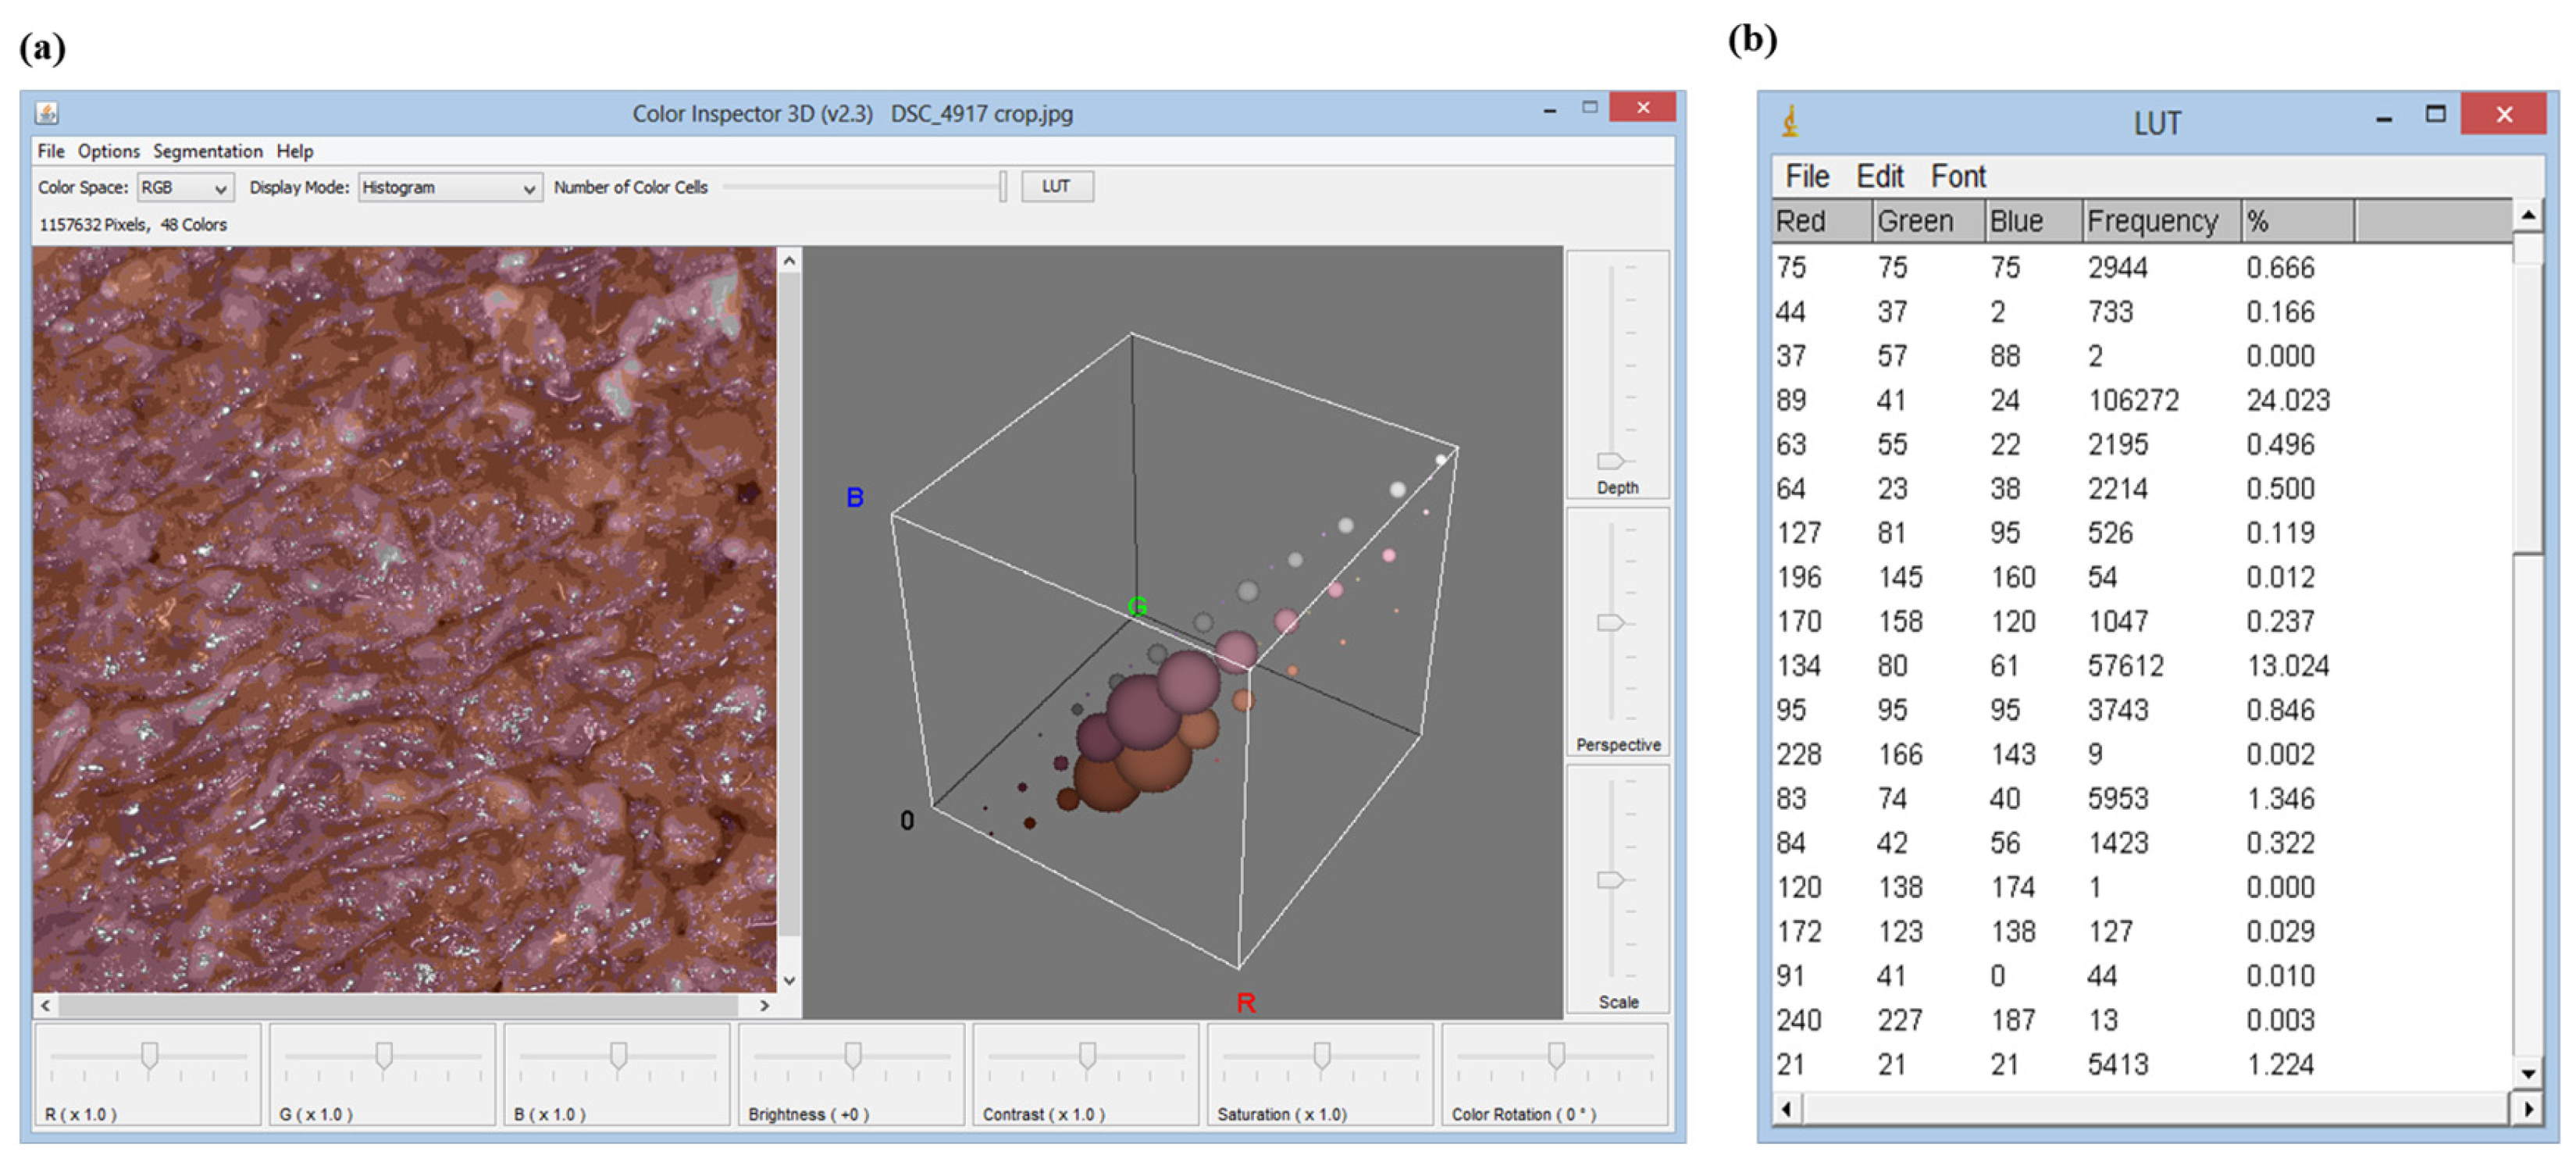
Method B involved the re-processing of images through “Color inspector 3D”, an additional tool of ImageJ software. It allows transporting the information present in the RGB image in the different colorimetric systems and extracting quantitative information about the percentage of each color in the selected area (
Figure 6b). Method B, therefore, obtains information about the most frequent color coordinates (frequency %) present in the analyzed system.
4.8. Colorimetric Analysis
Color was evaluated on treated and untreated horse meat, beef meat and beef hamburgers. Color was measured using a colorimeter that works in CIE L*a*b* color space (TECHKON Spectrodens, Königstein, Germany). The instrument is equipped with a LED light source. The measurement aperture was 3 mm, and two optical configurations were adopted (0° and 45°). The spectral range used was 400–700 nm in 10 nm steps, with a spectral resolution of 10 nm and the pixel distance sensor < 3 nm. Before the measurement, the colorimeter was calibrated using a white reflectance standard supplied by the manufacturer. A customized perforated jig was used to record the color coordinates in the same points allowing repeatable positioning. Three measurements of color coordinates were recorded, and the software adopted was TECHKON Spectro Connect 2.5.
Color variation (∆E) in CIE L*a*b* color space was calculated as:
where (
L2 −
L1), (
a2 −
a1), (
b2 −
b1) are the difference in terms of lightness, green–red and blue–yellow coordinates, respectively.
4.9. Statistical Analysis
For statistical analysis, normal distribution and variance homogeneity were previously tested (Shapiro–Wilk test). Analysis of variance (ANOVA) and pair-wise comparisons were performed by means of Microsoft Office Excel. Results are expressed as mean ± standard error of the mean (SEM).


 ,
, 
