
Modelling the Gut Fungal-Community in TIM-2 with a Microbiota from Healthy Individuals


Abstract
1. Introduction
2. Materials and Methods
2.1. Test Products
2.2. TIM-2 Model
2.3. Fecal Samples
2.4. Test Design
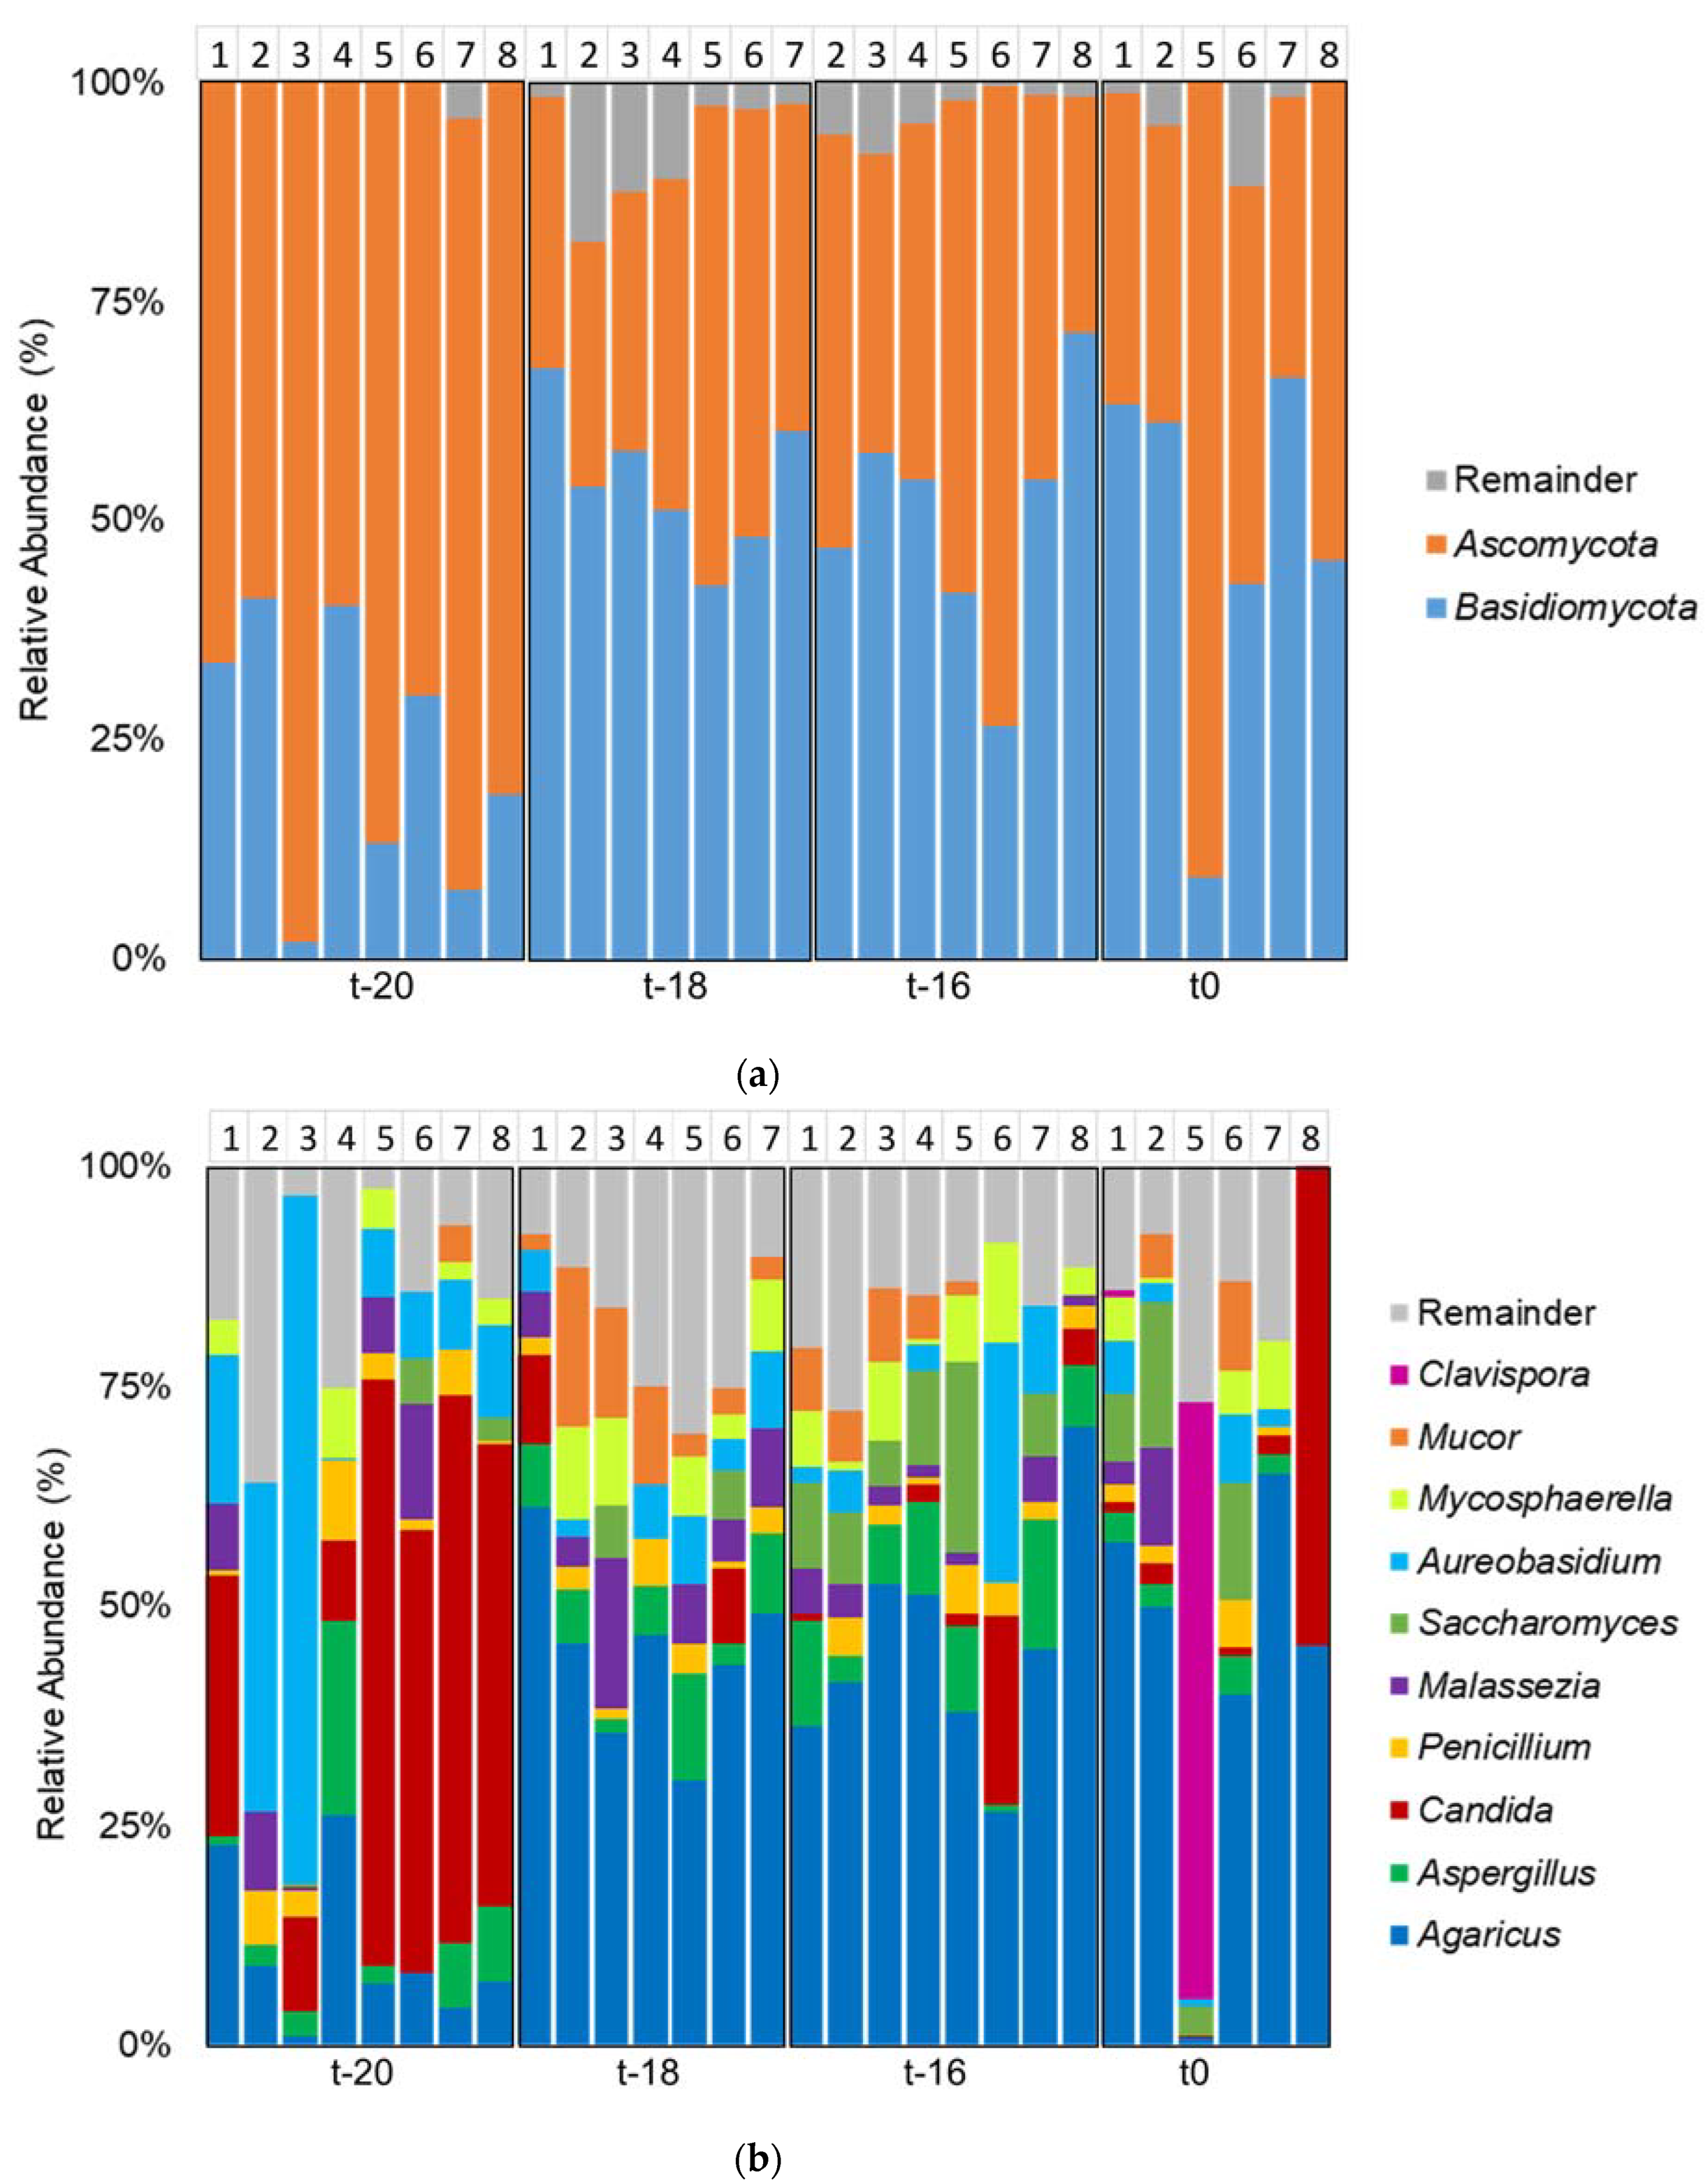
2.5. Gut-Mycobiota Composition
2.6. Gut-Microbiota Composition
2.7. Statistical Analysis
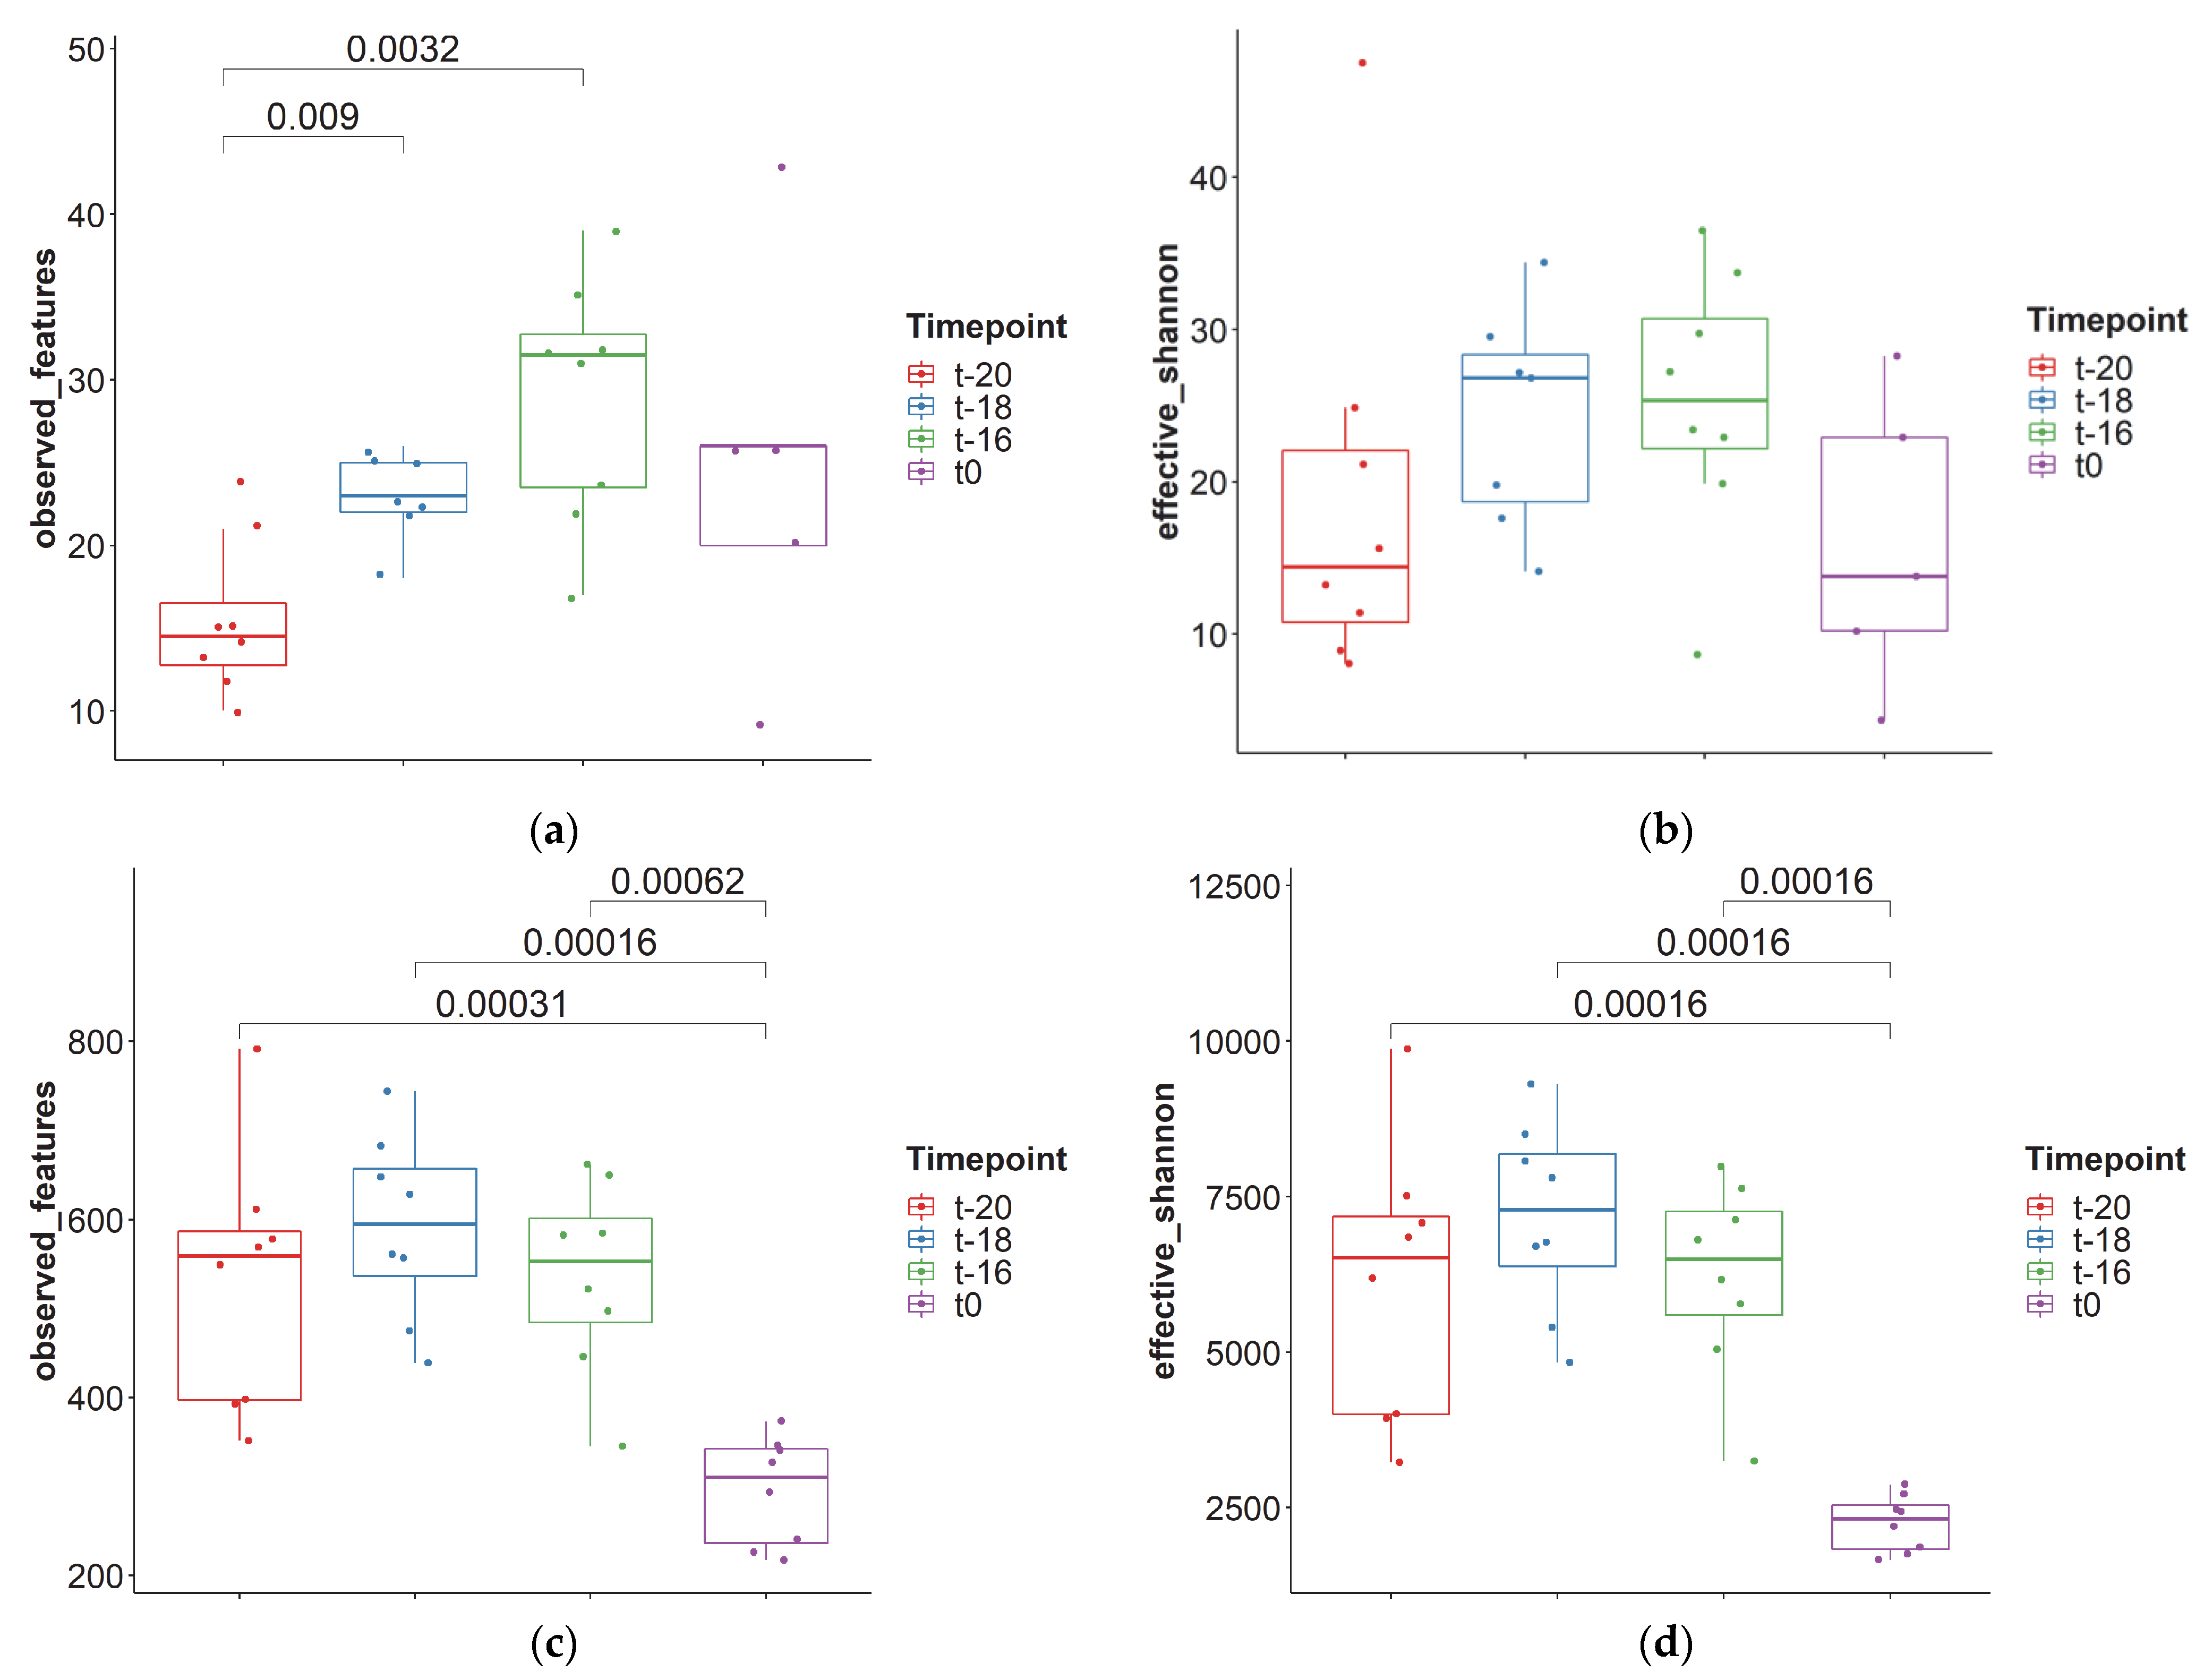
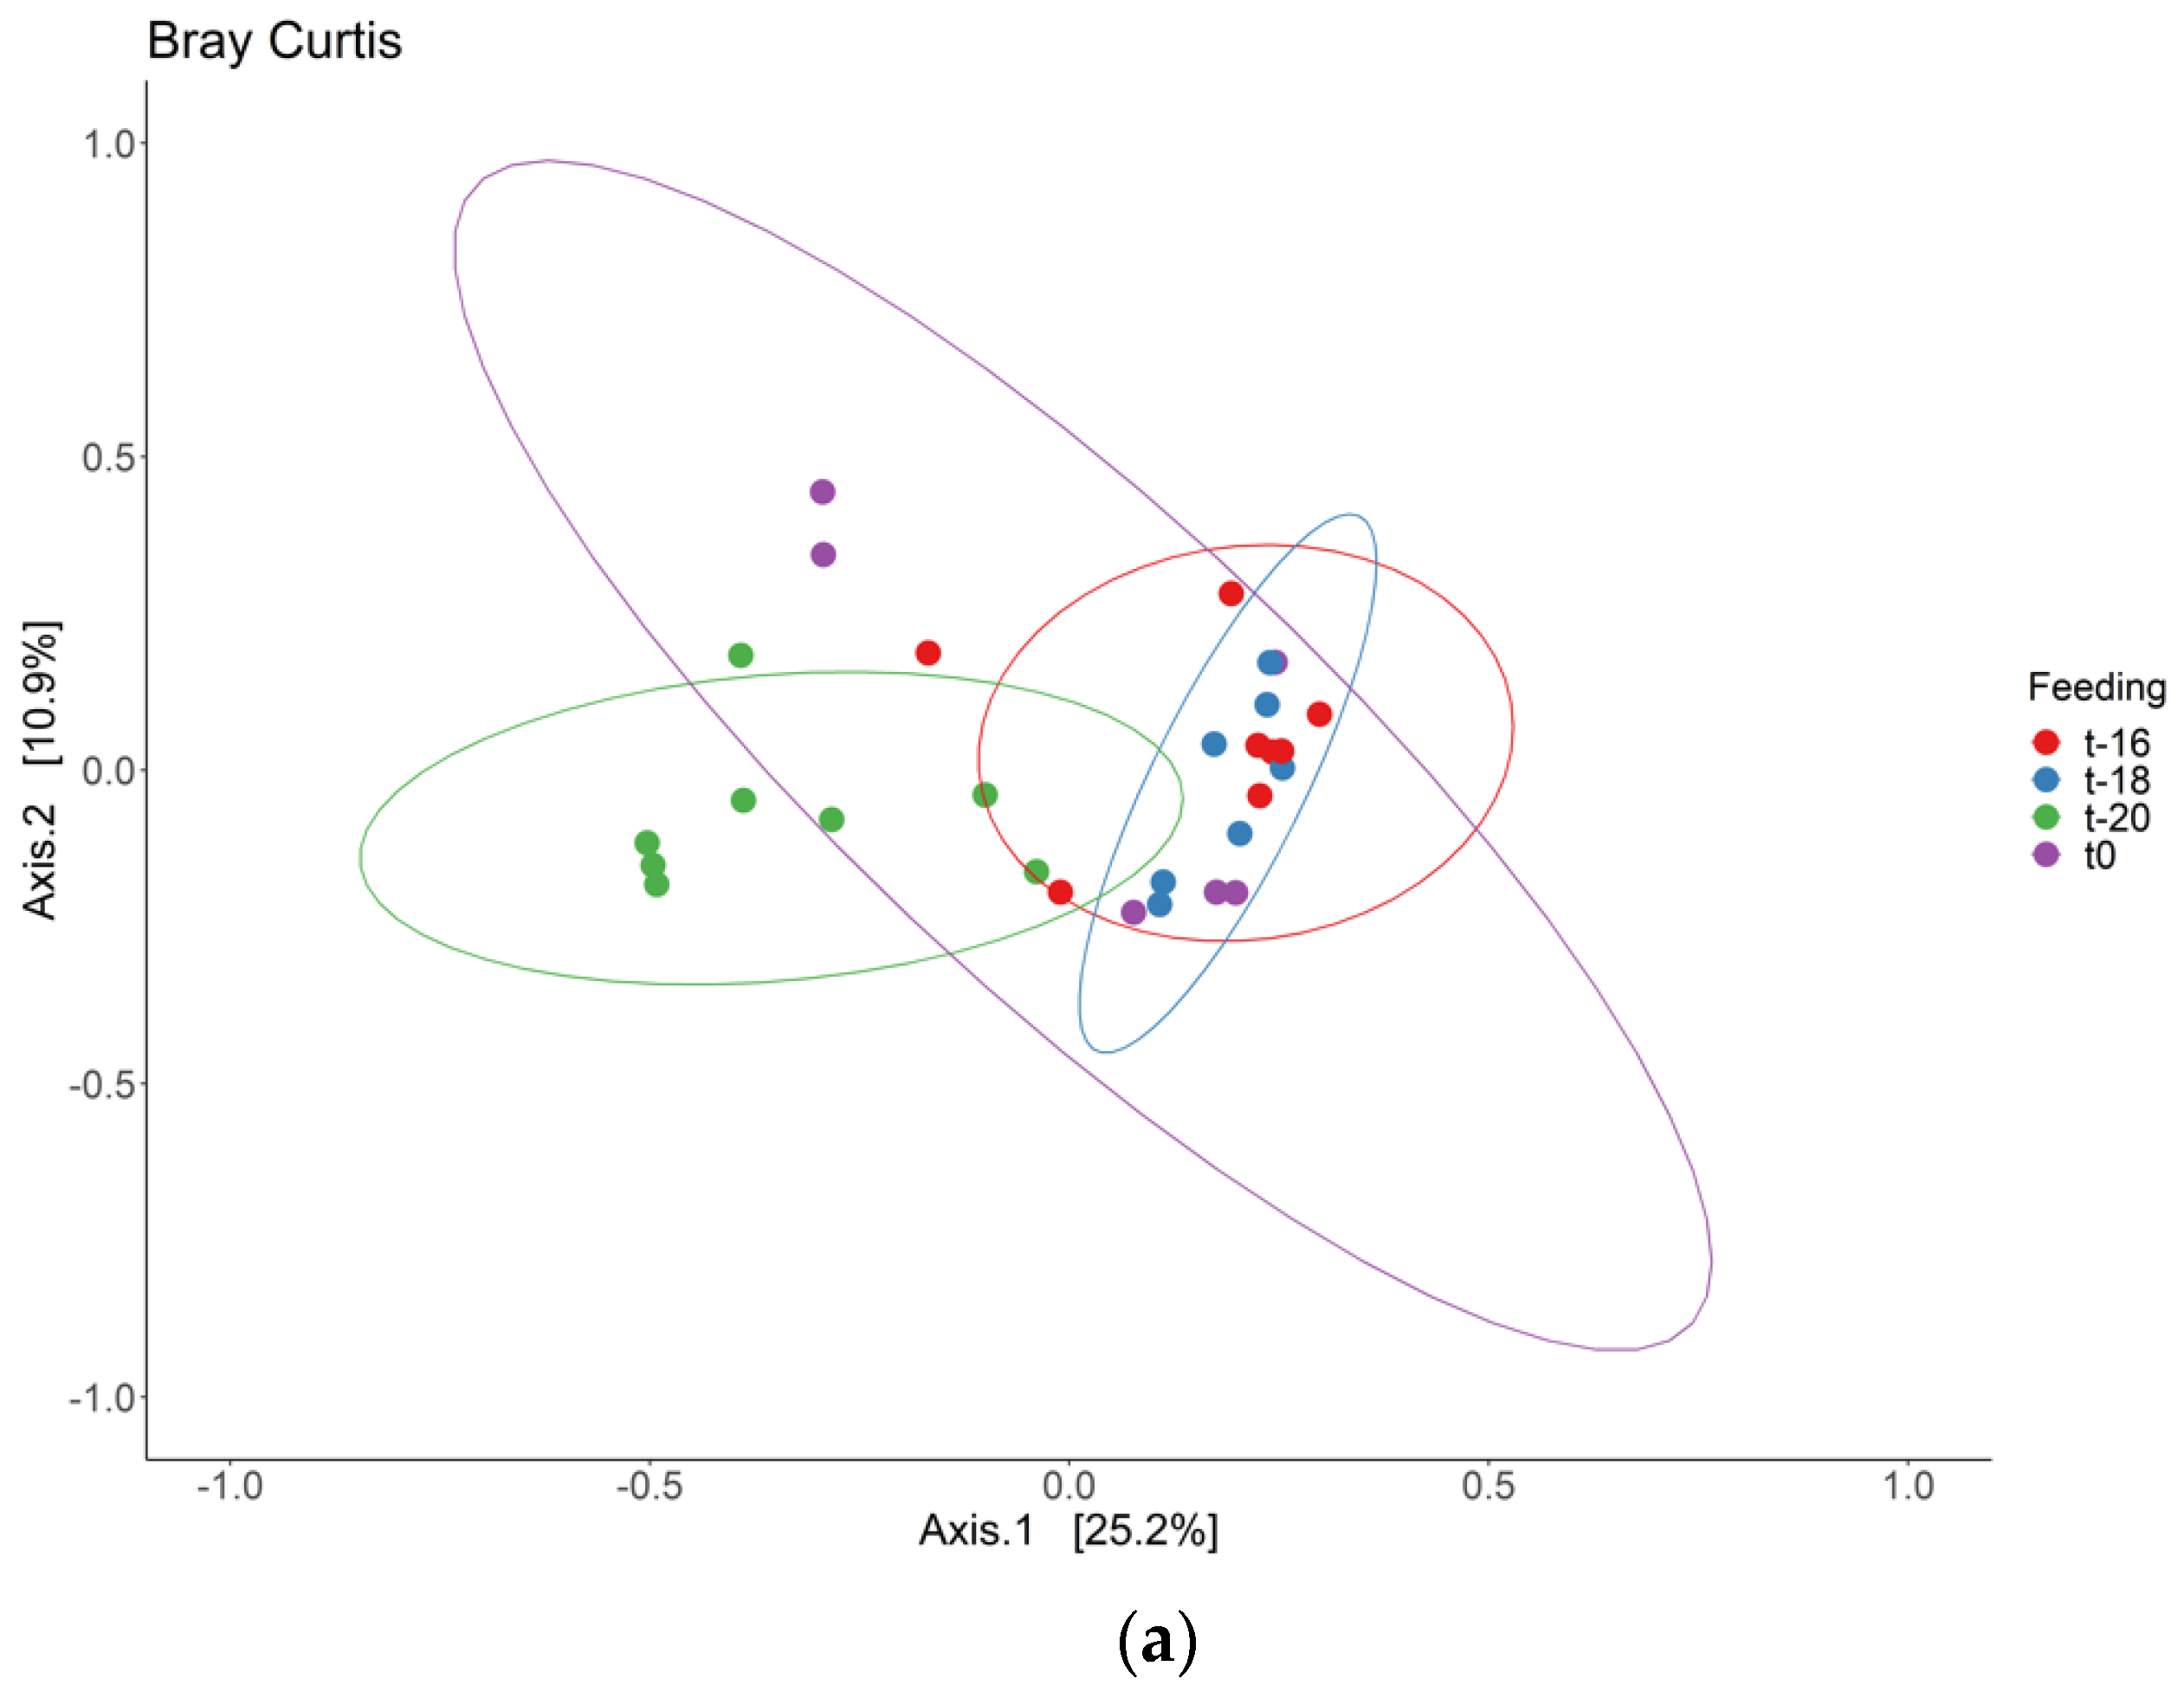
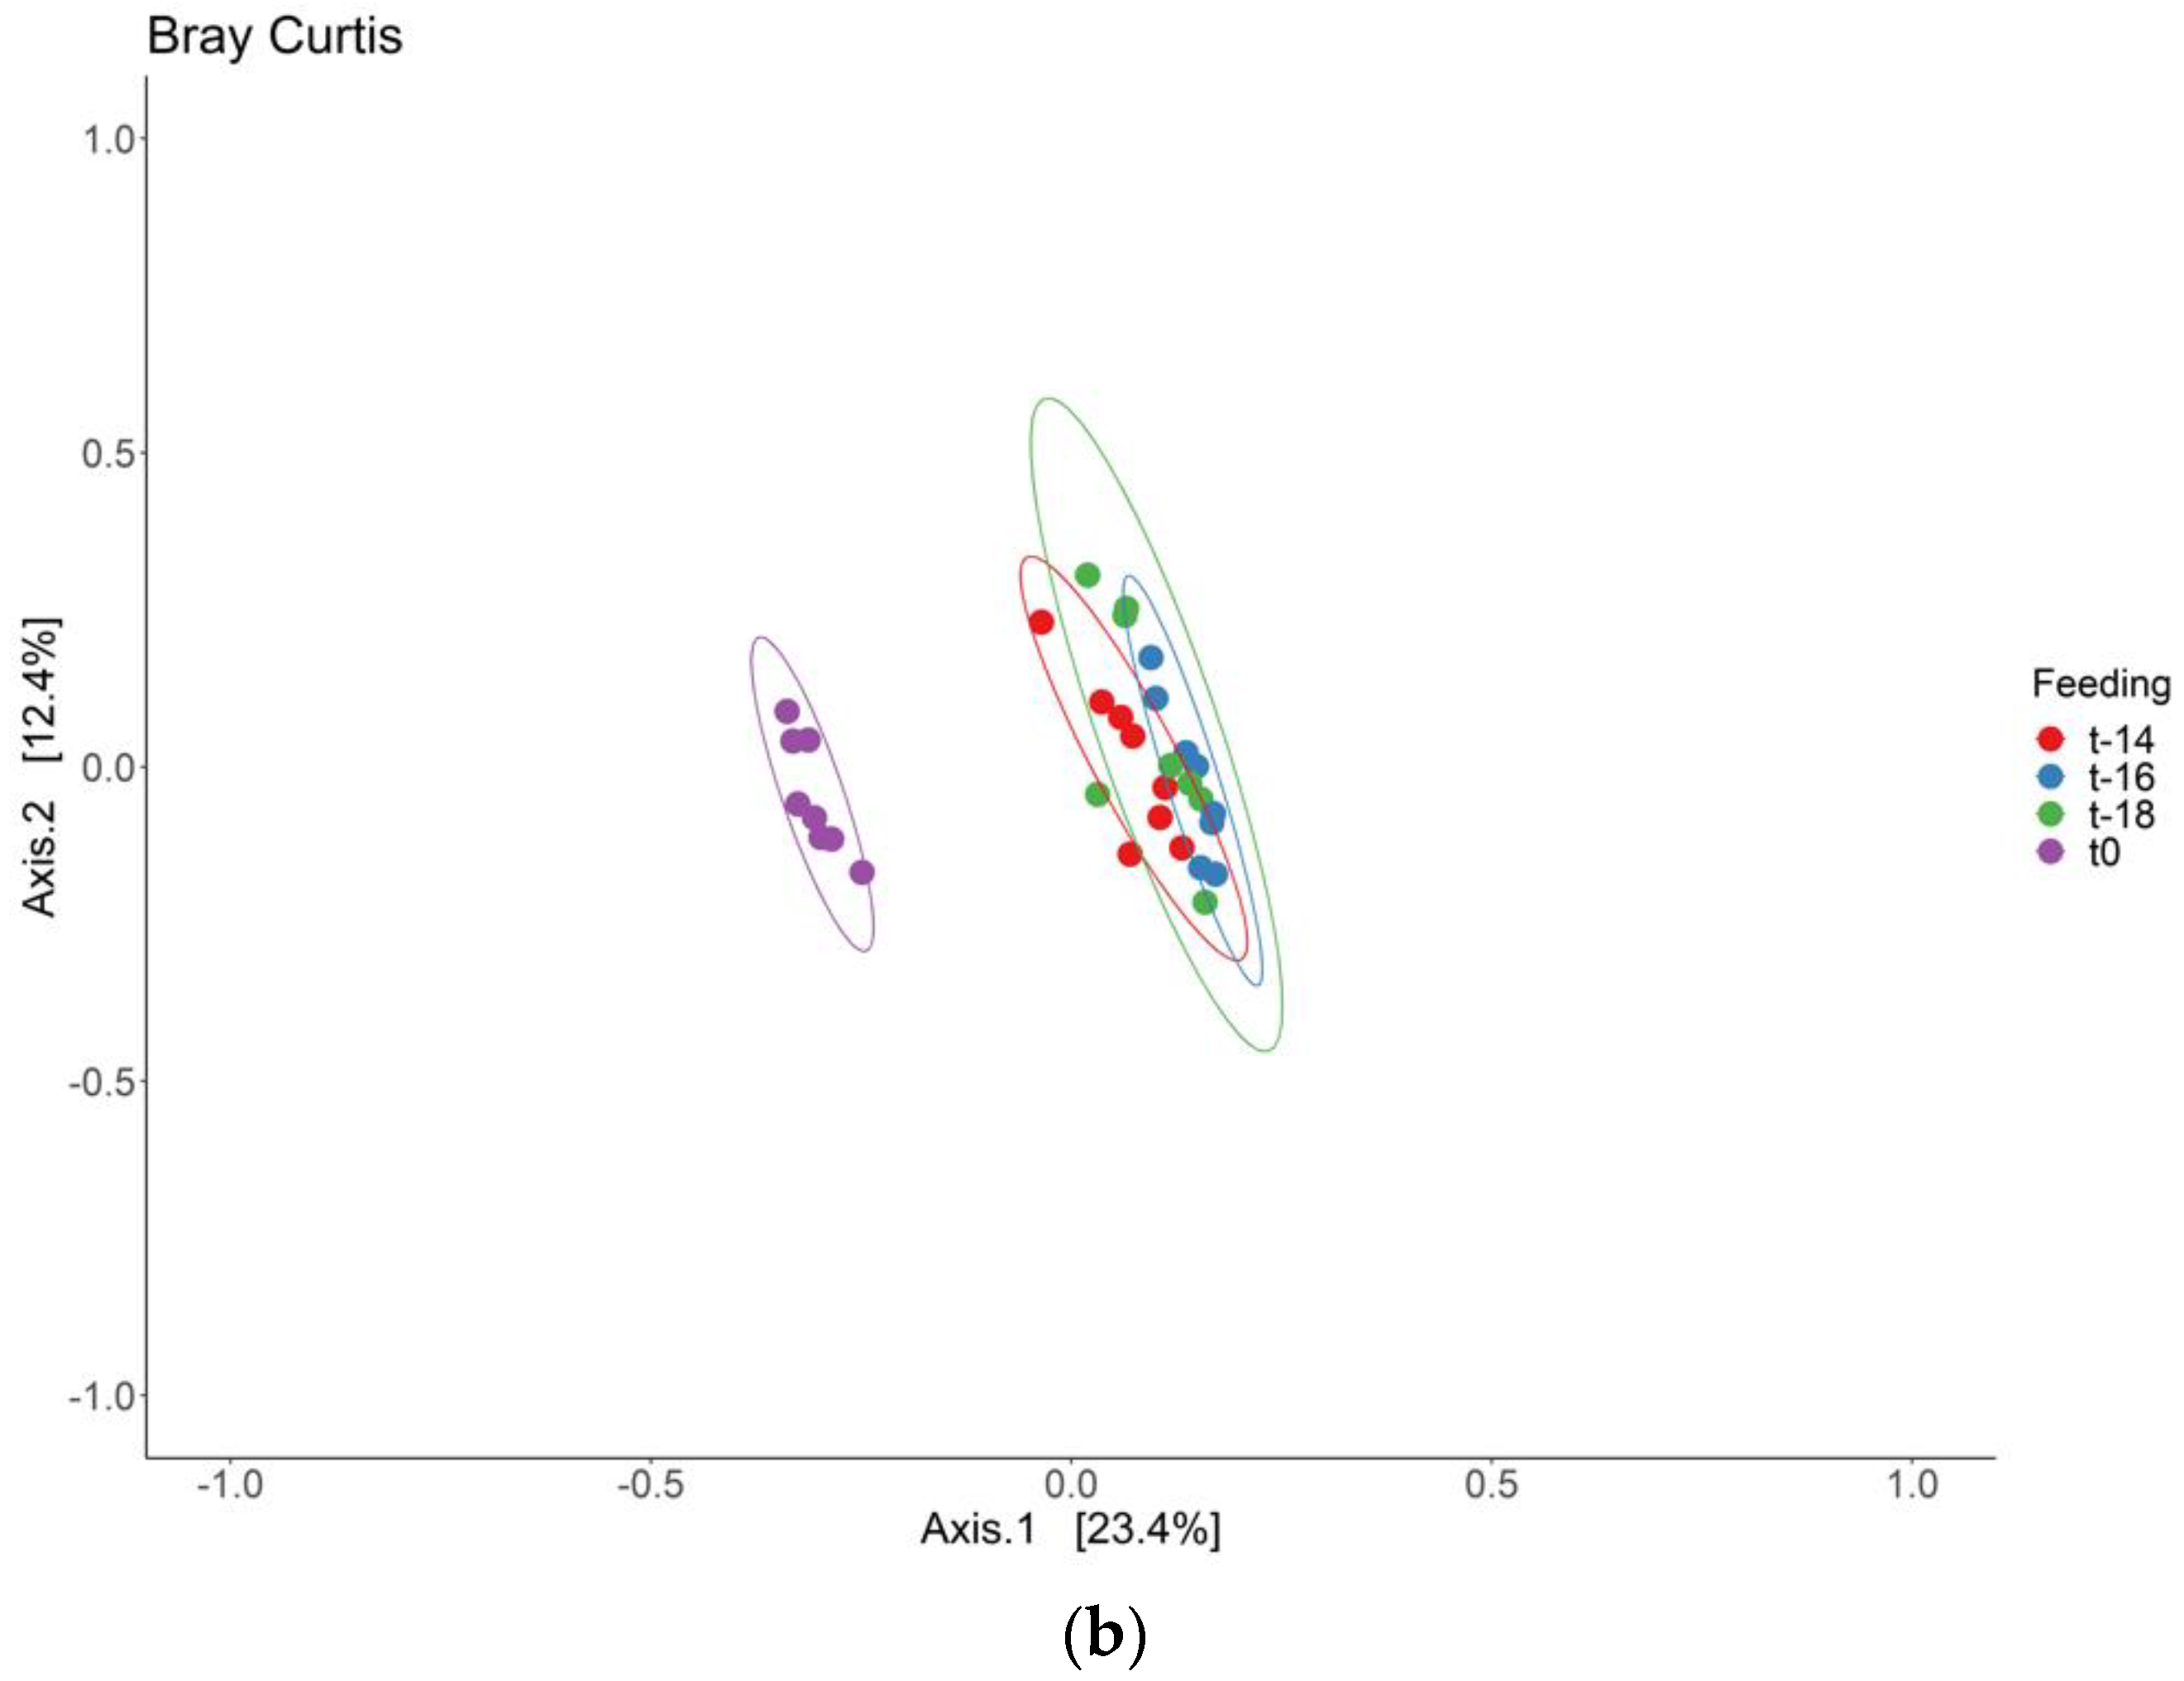
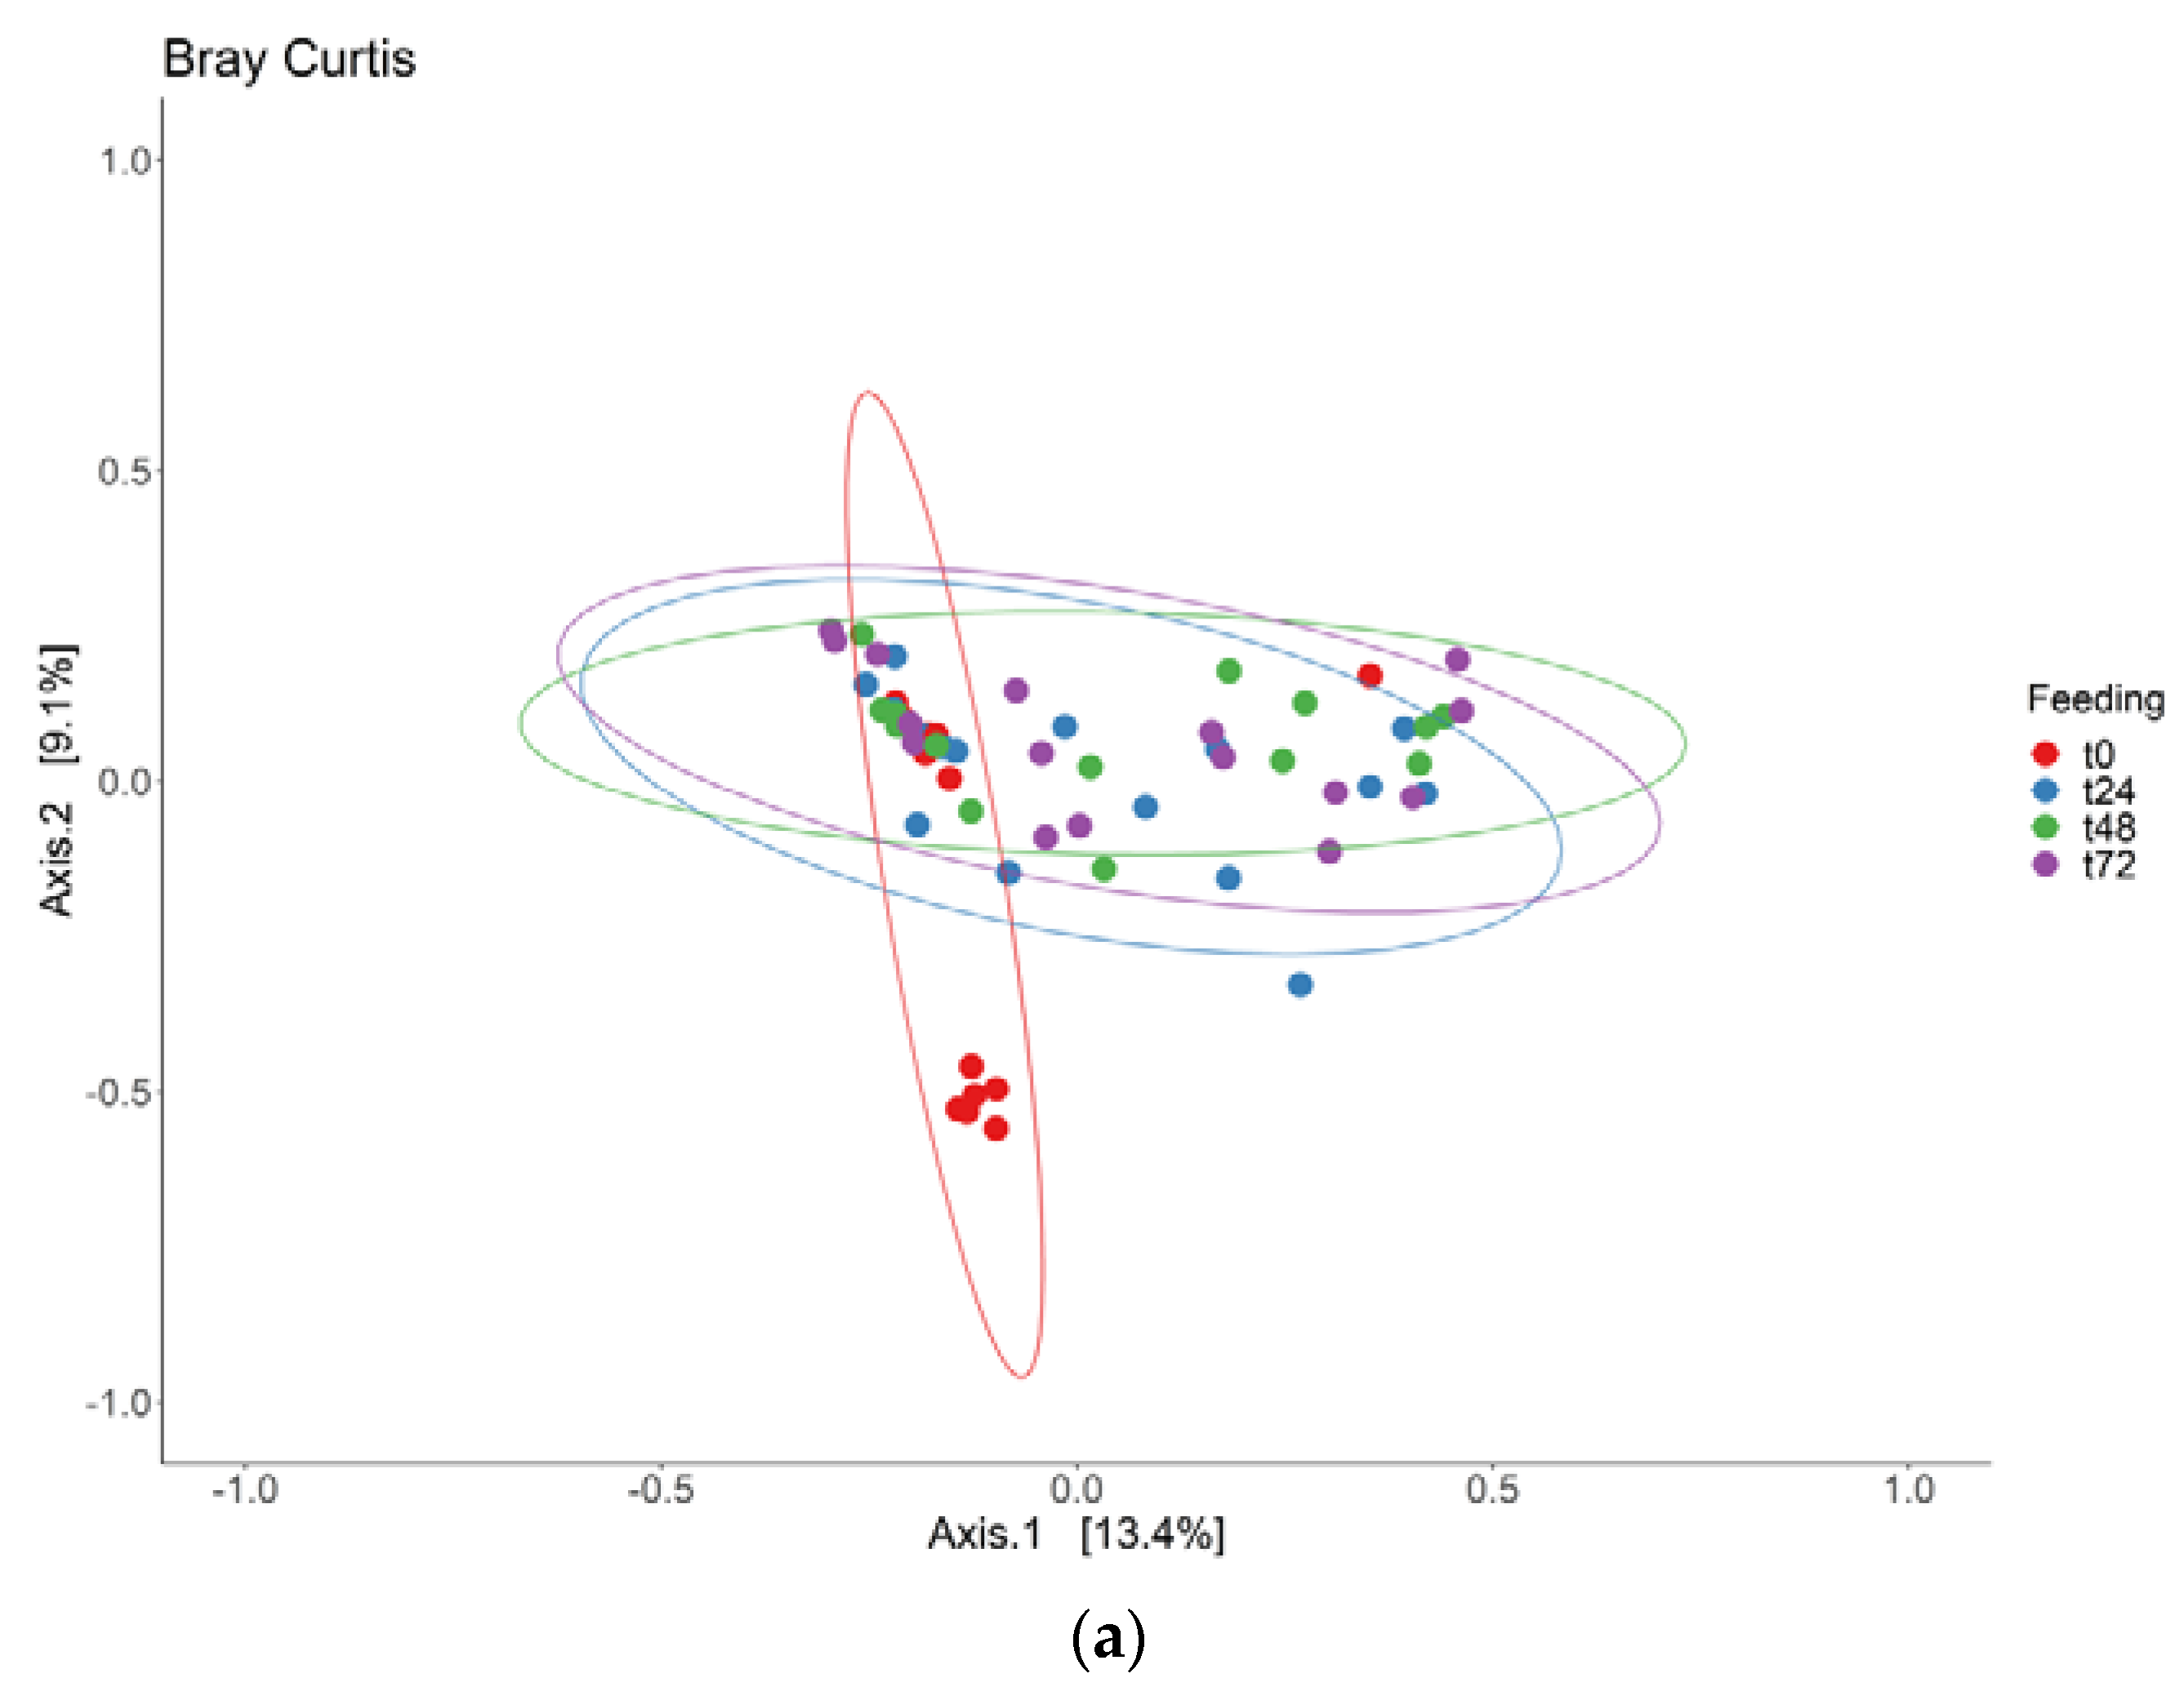
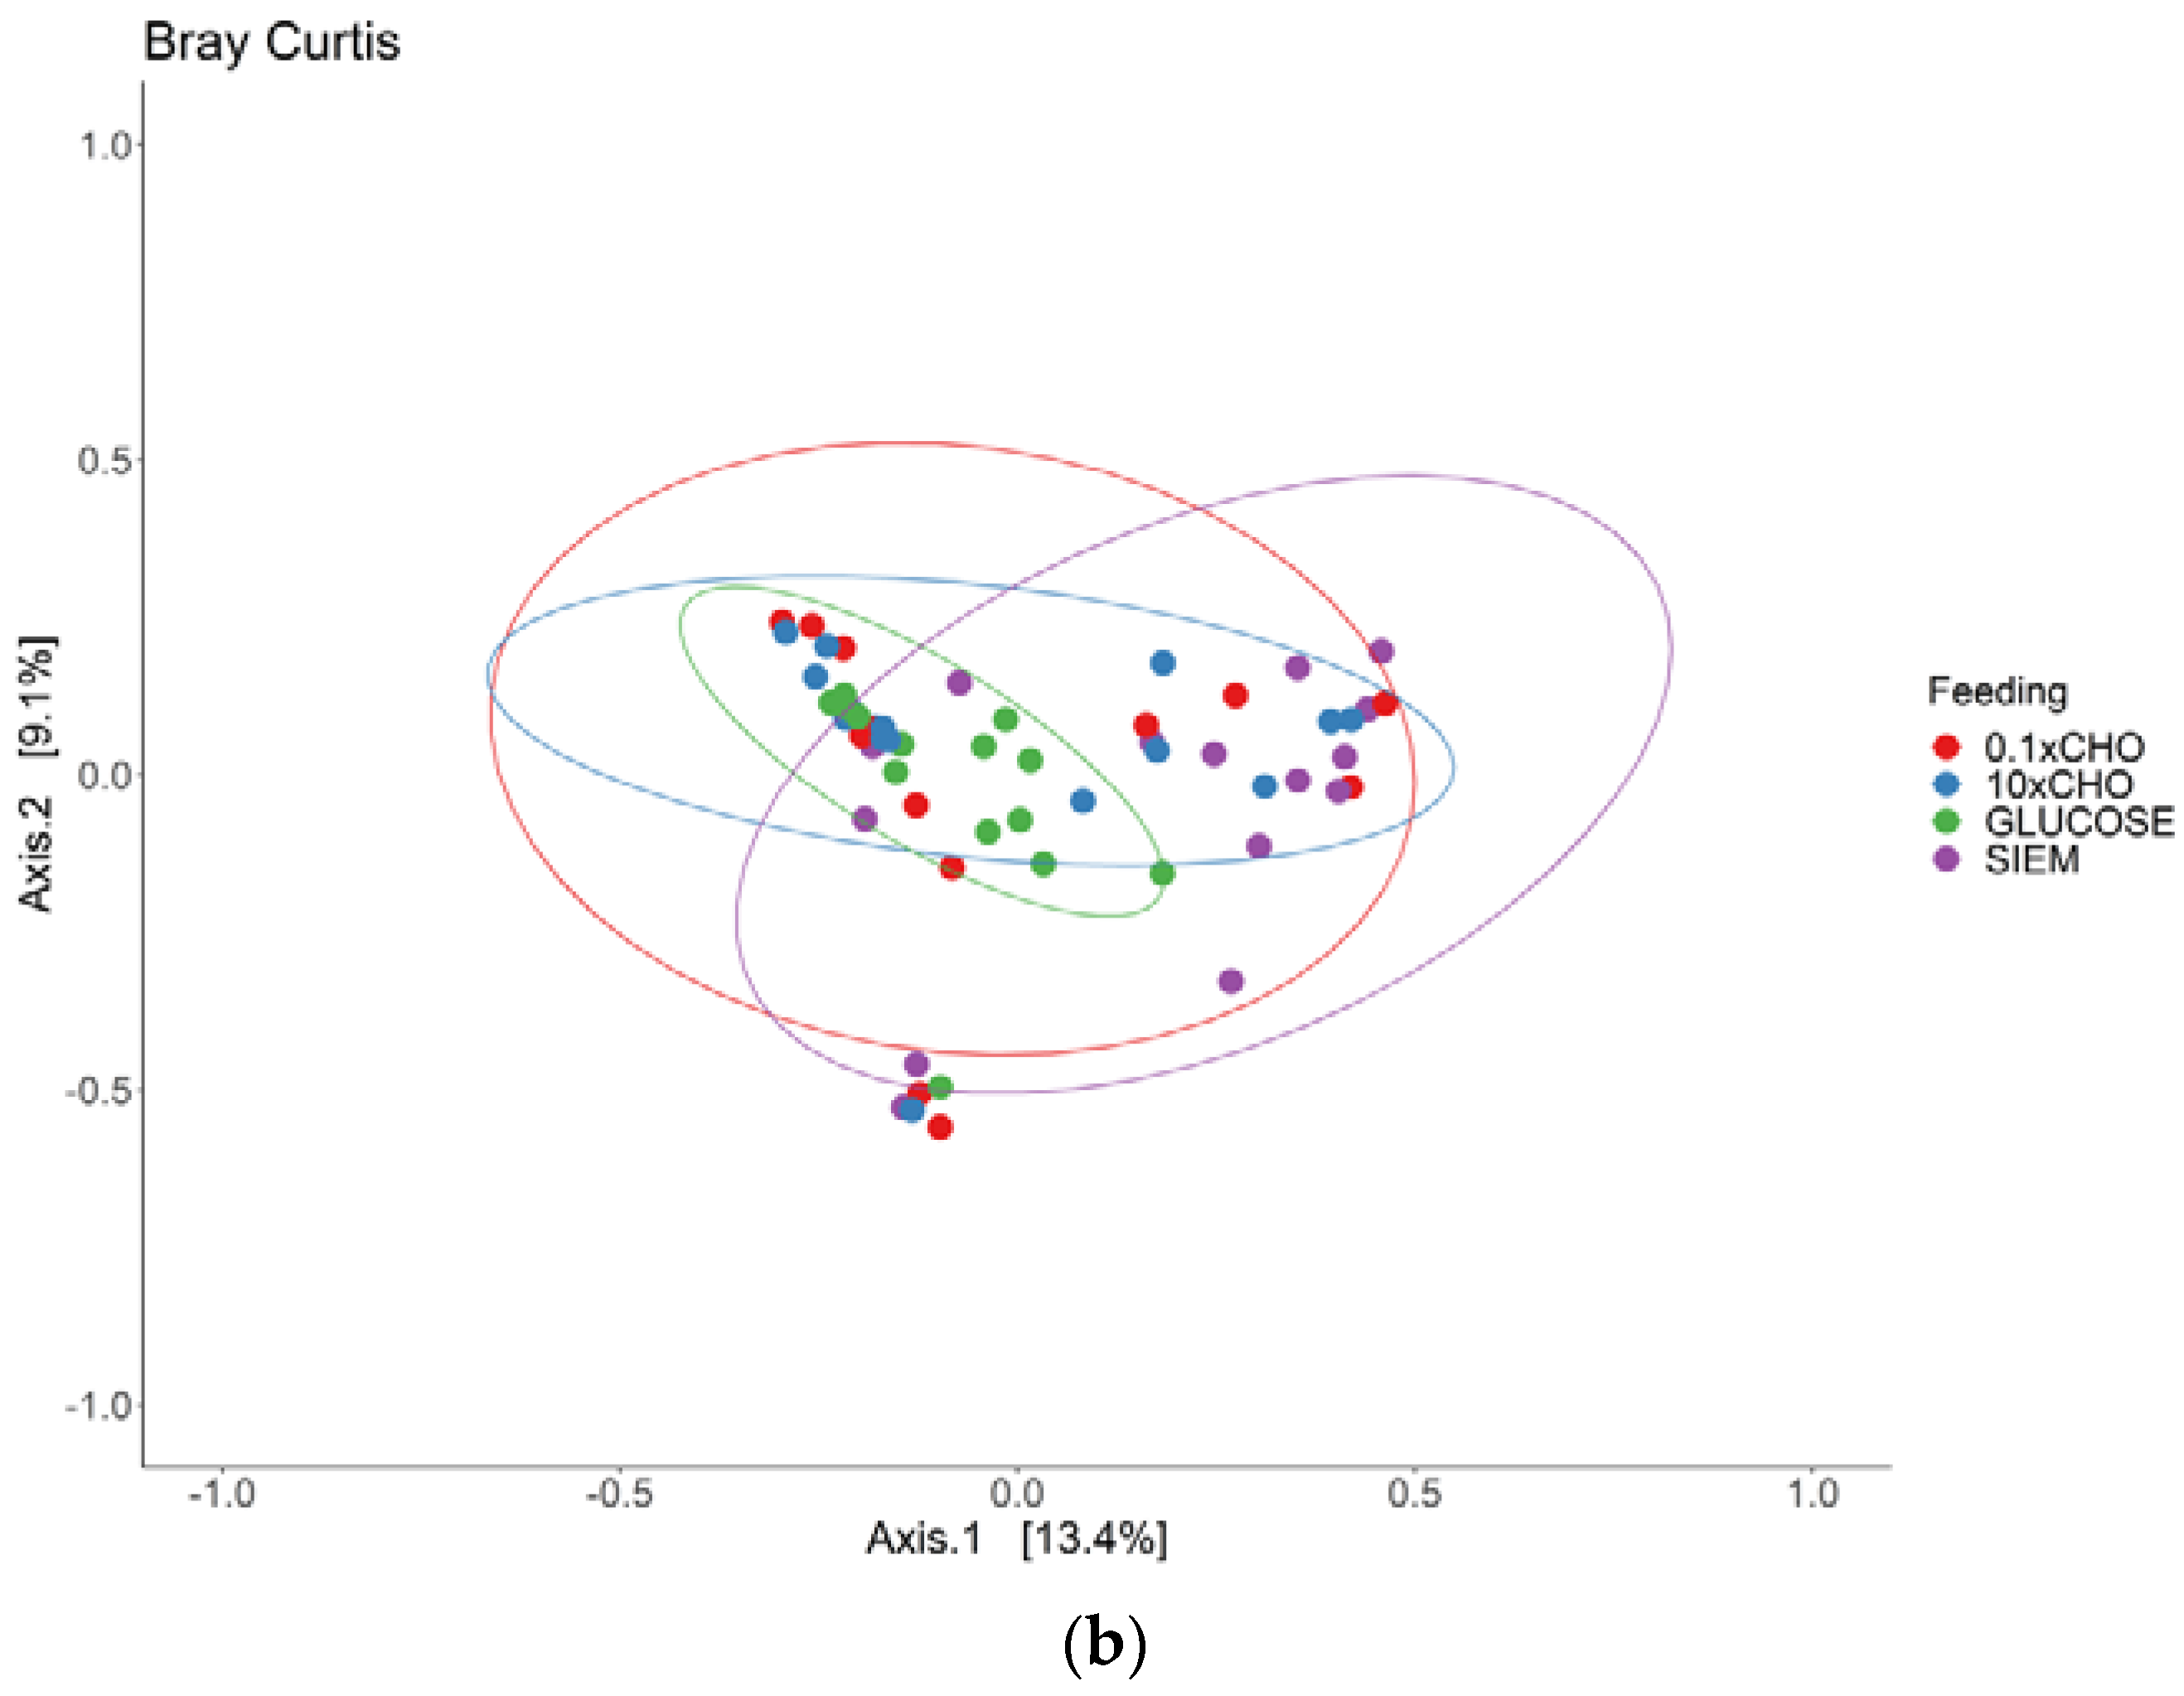
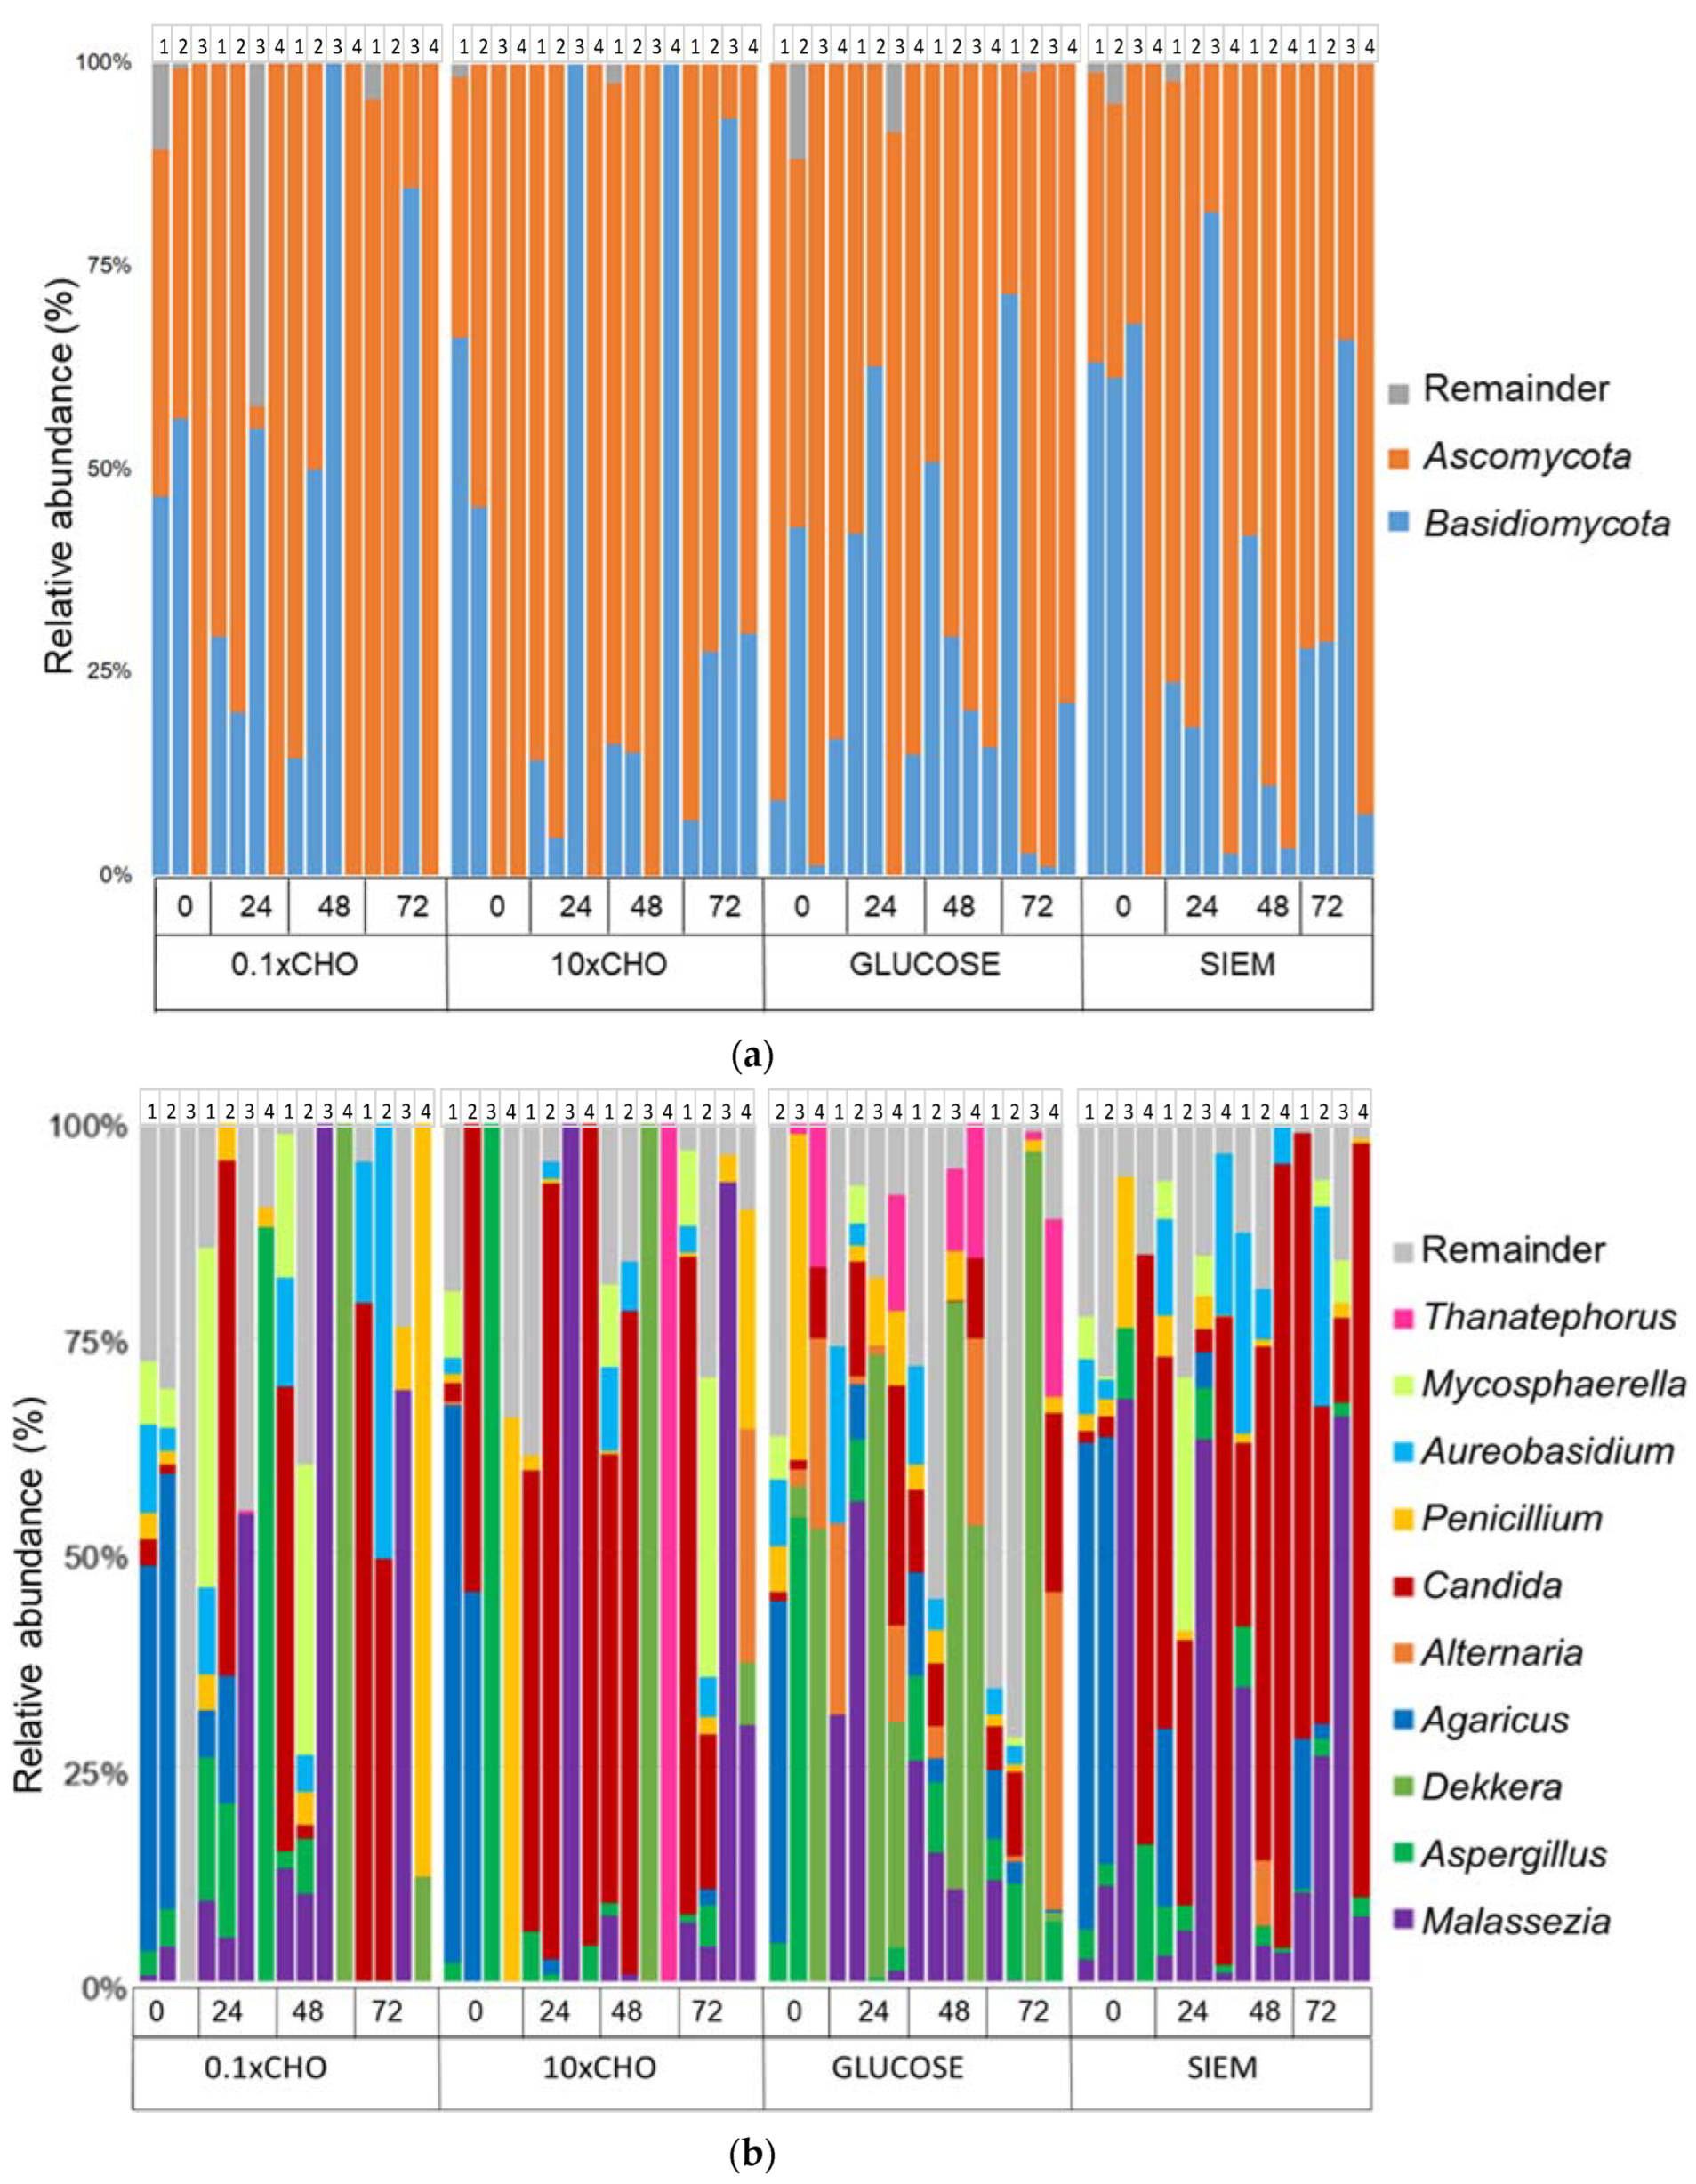
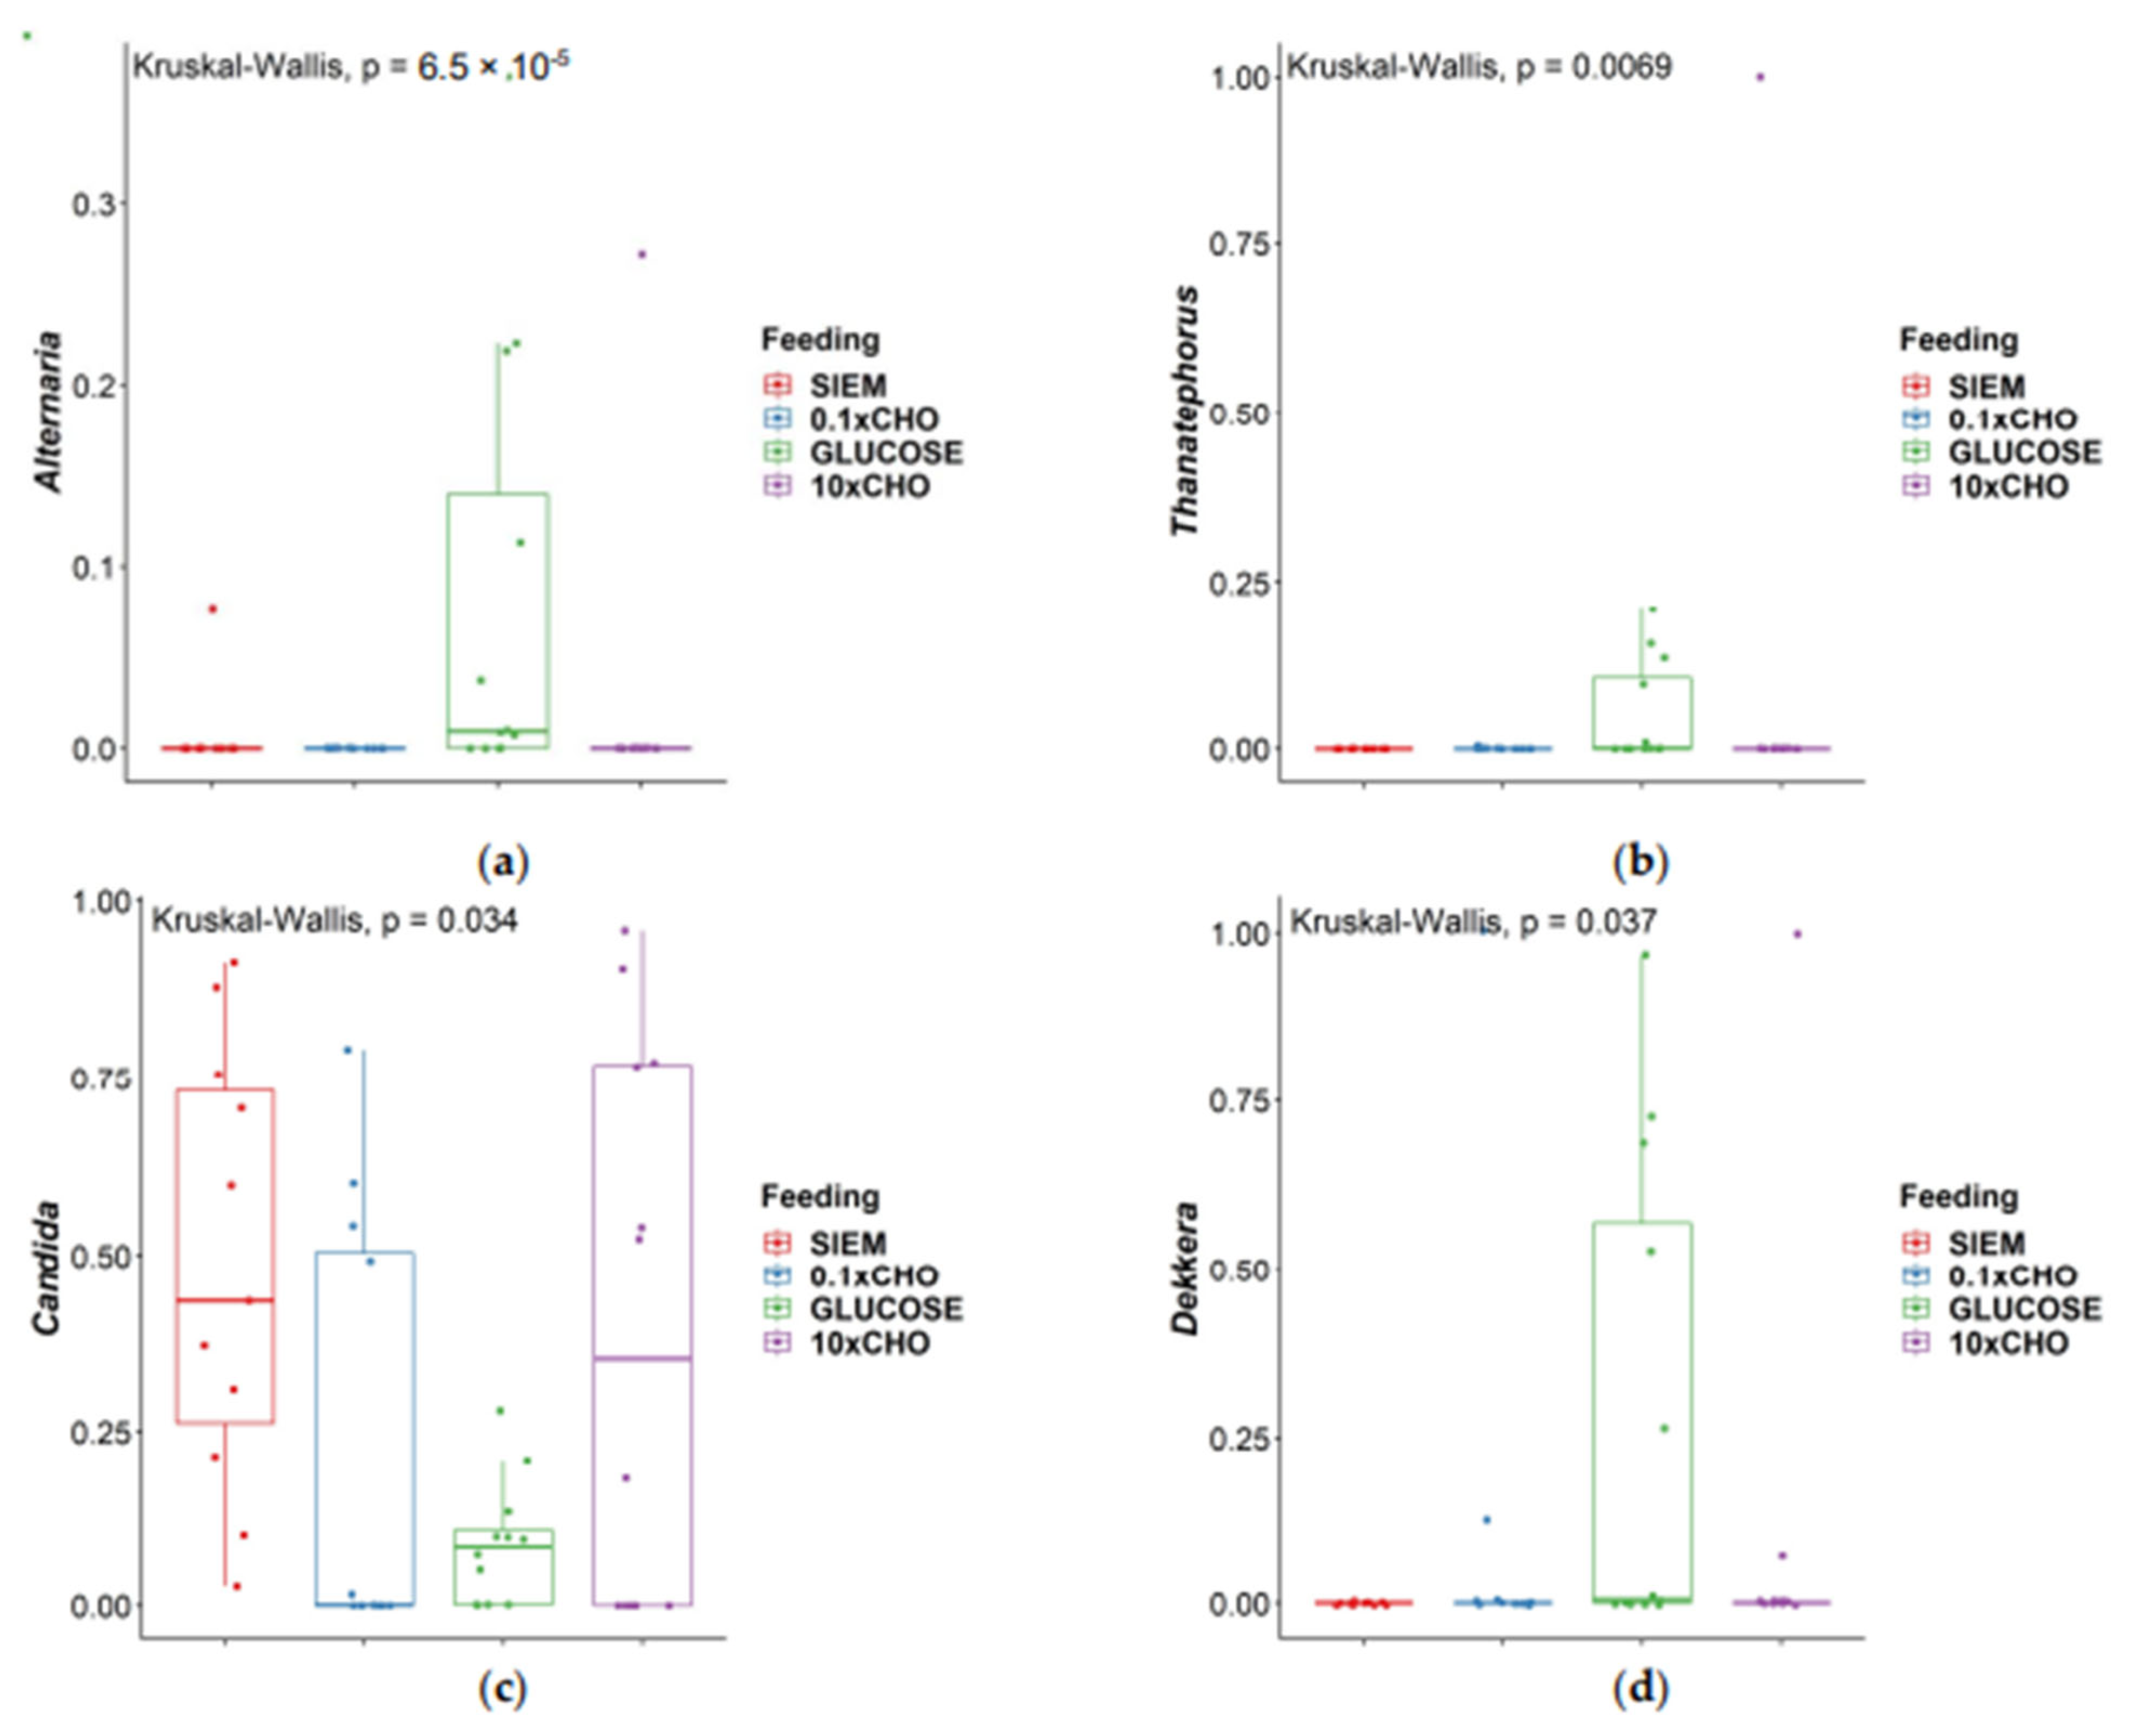
3. Results and Discussion
3.1. Adaptation Period
3.2. Intervention Period
4. Conclusions
Supplementary Materials
Author Contributions
Funding
Institutional Review Board Statement
Informed Consent Statement
Data Availability Statement
Acknowledgments
Conflicts of Interest
References
- Qin, J.; Li, R.; Raes, J.; Arumugam, M.; Burgdorf, K.S.; Manichanh, C.; Nielsen, T.; Pons, N.; Levenez, F.; Yamada, T.; et al. A human gut microbial gene catalogue established by metagenomic sequencing. Nature 2010, 464, 59–65. [Google Scholar] [CrossRef] [PubMed]
- Beheshti-Maal, A.; Shahrokh, S.; Ansari, S.; Mirsamadi, E.S.; Yadegar, A.; Mirjalali, H.; Zali, M.R. Gut mycobiome: The probable determinative role of fungi in IBD patients. Mycoses 2021, 64, 468–476. [Google Scholar] [CrossRef] [PubMed]
- Salamon, D.; Sroka-Oleksiak, A.; Gurgul, A.; Arent, Z.; Szopa, M.; Bulanda, M.; Małecki, M.T.; Gosiewski, T. Analysis of the Gut Mycobiome in Adult Patients with Type 1 and Type 2 Diabetes Using Next-Generation Sequencing (NGS) with Increased Sensitivity—Pilot Study. Nutrients 2021, 13, 1066. [Google Scholar] [CrossRef] [PubMed]
- Nagpal, R.; Neth, B.J.; Wang, S.; Mishra, S.P.; Craft, S.; Yadav, H. Gut mycobiome and its interaction with diet, gut bacteria and alzheimer’s disease markers in subjects with mild cognitive impairment: A pilot study. EBioMedicine 2020, 59, 102950. [Google Scholar] [CrossRef] [PubMed]
- de Oliveira, R.B.; Atobe, J.H.; Souza, S.A.; de Castro Lima Santos, D.W. Epidemiology of invasive fungal infections in patients with acquired immunodeficiency syndrome at a reference hospital for infectious diseases in Brazil. Mycopathologia 2014, 178, 71–78. [Google Scholar] [CrossRef]
- Kennedy, M.J.; Volz, P.A. Effect of various antibiotics on gastrointestinal colonization and dissemination by Candida albicans. Sabouraudia J. Med. Vet. Mycol. 1985, 23, 265–273. [Google Scholar] [CrossRef]
- Shirtliff, M.E.; Peters, B.M.; Jabra-Rizk, M.A. Cross-kingdom interactions: Candida albicans and bacteria. FEMS Microbiol. Lett. 2009, 299, 1–8. [Google Scholar] [CrossRef]
- Fiers, W.D.; Leonardi, I.; Iliev, I.D. From birth and throughout life: Fungal microbiota in nutrition and metabolic health. Annu. Rev. Nutr. 2020, 40, 323–343. [Google Scholar] [CrossRef]
- Belvoncikova, P.; Splichalova, P.; Videnska, P.; Gardlik, R. The human mycobiome: Colonization, composition and the role in health and disease. J. Fungi 2022, 8, 1046. [Google Scholar] [CrossRef]
- Heisel, T.; Montassier, E.; Johnson, A.; Al-Ghalith, G.; Lin, Y.-W.; Wei, L.-N.; Knights, D.; Gale, C.A. High-fat diet changes fungal microbiomes and interkingdom relationships in the murine gut. Msphere 2017, 2, e00351-17. [Google Scholar] [CrossRef]
- Hoffmann, C.; Dollive, S.; Grunberg, S.; Chen, J.; Li, H.; Wu, G.D.; Lewis, J.D.; Bushman, F.D. Archaea and fungi of the human gut microbiome: Correlations with diet and bacterial residents. PLoS ONE 2013, 8, e66019. [Google Scholar] [CrossRef] [PubMed]
- Venema, K. The TNO In Vitro Model of the Colon (TIM-2). In The Impact of Food Bioactives on Health: In Vitro and Ex Vivo Models; Verhoeckx, K., Cotter, P., López-Expósito, I., Kleiveland, C., Lea, T., Mackie, A., Requena, T., Swiatecka, D., Wichers, H., Eds.; Springer International Publishing: Cham, Swizterland, 2015; pp. 293–304. [Google Scholar] [CrossRef]
- Aguirre, M.; Eck, A.; Koenen, M.E.; Savelkoul, P.H.; Budding, A.E.; Venema, K. Diet drives quick changes in the metabolic activity and composition of human gut microbiota in a validated in vitro gut model. Res. Microbiol. 2016, 167, 114–125. [Google Scholar] [CrossRef] [PubMed]
- Rehman, A.; Heinsen, F.-A.; Koenen, M.E.; Venema, K.; Knecht, H.; Hellmig, S.; Schreiber, S.; Ott, S.J. Effects of probiotics and antibiotics on the intestinal homeostasis in a computer controlled model of the large intestine. BMC Microbiol. 2012, 12, 47. [Google Scholar] [CrossRef] [PubMed]
- Míguez, B.; Vila, C.; Venema, K.; Parajó, J.C.; Alonso, J.L. Prebiotic effects of pectooligosaccharides obtained from lemon peel on the microbiota from elderly donors using an in vitro continuous colon model (TIM-2). Food Funct. 2020, 11, 9984–9999. [Google Scholar] [CrossRef] [PubMed]
- Martina, A.; Felis, G.; Corradi, M.; Maffeis, C.; Torriani, S.; Venema, K. Effects of functional pasta ingredients on different gut microbiota as revealed by TIM-2 in vitro model of the proximal colon. Benef. Microbes 2019, 10, 301–313. [Google Scholar] [CrossRef]
- Cuevas-Tena, M.; Alegria, A.; Lagarda, M.J.; Venema, K. Impact of plant sterols enrichment dose on gut microbiota from lean and obese subjects using TIM-2 in vitro fermentation model. J. Funct. Foods 2019, 54, 164–174. [Google Scholar] [CrossRef]
- Aguirre, M.; Ramiro-Garcia, J.; Koenen, M.E.; Venema, K. To pool or not to pool? Impact of the use of individual and pooled fecal samples for in vitro fermentation studies. J. Microbiol. Methods 2014, 107, 1–7. [Google Scholar] [CrossRef]
- Huseyin, C.E.; Rubio, R.C.; O’Sullivan, O.; Cotter, P.D.; Scanlan, P.D. The Fungal Frontier: A Comparative Analysis of Methods Used in the Study of the Human Gut Mycobiome. Front. Microbiol. 2017, 8, 1432. [Google Scholar] [CrossRef]
- Schoch, C.L.; Seifert, K.A.; Huhndorf, S.; Robert, V.; Spouge, J.L.; Levesque, C.A.; Chen, W.; Fungal Barcoding, C.; Fungal Barcoding Consortium Author, L. Nuclear ribosomal internal transcribed spacer (ITS) region as a universal DNA barcode marker for Fungi. Proc. Natl. Acad. Sci. USA 2012, 109, 6241–6246. [Google Scholar] [CrossRef]
- Maathuis, A.; Hoffman, A.; Evans, A.; Sanders, L.; Venema, K. The effect of the undigested fraction of maize products on the activity and composition of the microbiota determined in a dynamic in vitro model of the human proximal large intestine. J. Am. Coll. Nutr. 2009, 28, 657–666. [Google Scholar] [CrossRef]
- Knudsen, B.E.; Bergmark, L.; Munk, P.; Lukjancenko, O.; Priemé, A.; Aarestrup, F.M.; Pamp, S.J.; Jansson, J.K. Impact of Sample Type and DNA Isolation Procedure on Genomic Inference of Microbiome Composition. mSystems 2016, 1, e00095-16. [Google Scholar] [CrossRef]
- Op De Beeck, M.; Lievens, B.; Busschaert, P.; Declerck, S.; Vangronsveld, J.; Colpaert, J.V. Comparison and validation of some ITS primer pairs useful for fungal metabarcoding studies. PLoS ONE 2014, 9, e97629. [Google Scholar] [CrossRef]
- Caporaso, J.G.; Kuczynski, J.; Stombaugh, J.; Bittinger, K.; Bushman, F.D.; Costello, E.K.; Fierer, N.; Peña, A.G.; Goodrich, J.K.; Gordon, J.I. QIIME allows analysis of high-throughput community sequencing data. Nat. Methods 2010, 7, 335–336. [Google Scholar] [CrossRef]
- Estaki, M.; Jiang, L.; Bokulich, N.A.; McDonald, D.; González, A.; Kosciolek, T.; Martino, C.; Zhu, Q.; Birmingham, A.; Vázquez-Baeza, Y.; et al. QIIME 2 Enables Comprehensive End-to-End Analysis of Diverse Microbiome Data and Comparative Studies with Publicly Available Data. Curr. Protoc. Bioinform. 2020, 70, e100. [Google Scholar] [CrossRef]
- Rivers, A.R.; Weber, K.C.; Gardner, T.G.; Liu, S.; Armstrong, S.D. ITSxpress: Software to rapidly trim internally transcribed spacer sequences with quality scores for marker gene analysis. F1000Research 2018, 7, 1418. [Google Scholar] [CrossRef]
- Callahan, B.J.; McMurdie, P.J.; Rosen, M.J.; Han, A.W.; Johnson, A.J.A.; Holmes, S.P. DADA2: High-resolution sample inference from Illumina amplicon data. Nat. Methods 2016, 13, 581–583. [Google Scholar] [CrossRef]
- Nash, A.K.; Auchtung, T.A.; Wong, M.C.; Smith, D.P.; Gesell, J.R.; Ross, M.C.; Stewart, C.J.; Metcalf, G.A.; Muzny, D.M.; Gibbs, R.A.; et al. The gut mycobiome of the Human Microbiome Project healthy cohort. Microbiome 2017, 5, 153. [Google Scholar] [CrossRef]
- Hallen-Adams; Suhr, M.J. Fungi in the healthy human gastrointestinal tract. Virulence 2017, 8, 352–358. [Google Scholar] [CrossRef]
- García-Gamboa, R.; Kirchmayr, M.R.; Gradilla-Hernández, M.S.; Pérez-Brocal, V.; Moya, A.; González-Avila, M. The intestinal mycobiota and its relationship with overweight, obesity and nutritional aspects. J. Hum. Nutr. Diet. 2021, 34, 645–655. [Google Scholar] [CrossRef]
- Suhr, M.J.; Banjara, N.; Hallen-Adams, H.E. Sequence-based methods for detecting and evaluating the human gut mycobiome. Lett. Appl. Microbiol. 2016, 62, 209–215. [Google Scholar] [CrossRef]


| Standard diet (SIEM) | SIEM [21] |
| High-carbohydrate diet (10× CHO) | SIEM with 10:1 CHO:TBCO [13] |
| High-protein diet (0.1× CHO) | SIEM with 1:10 CHO:TBCO [13] |
| Glucose as carbohydrate source (Glucose) | SIEM-CHO + Glucose |
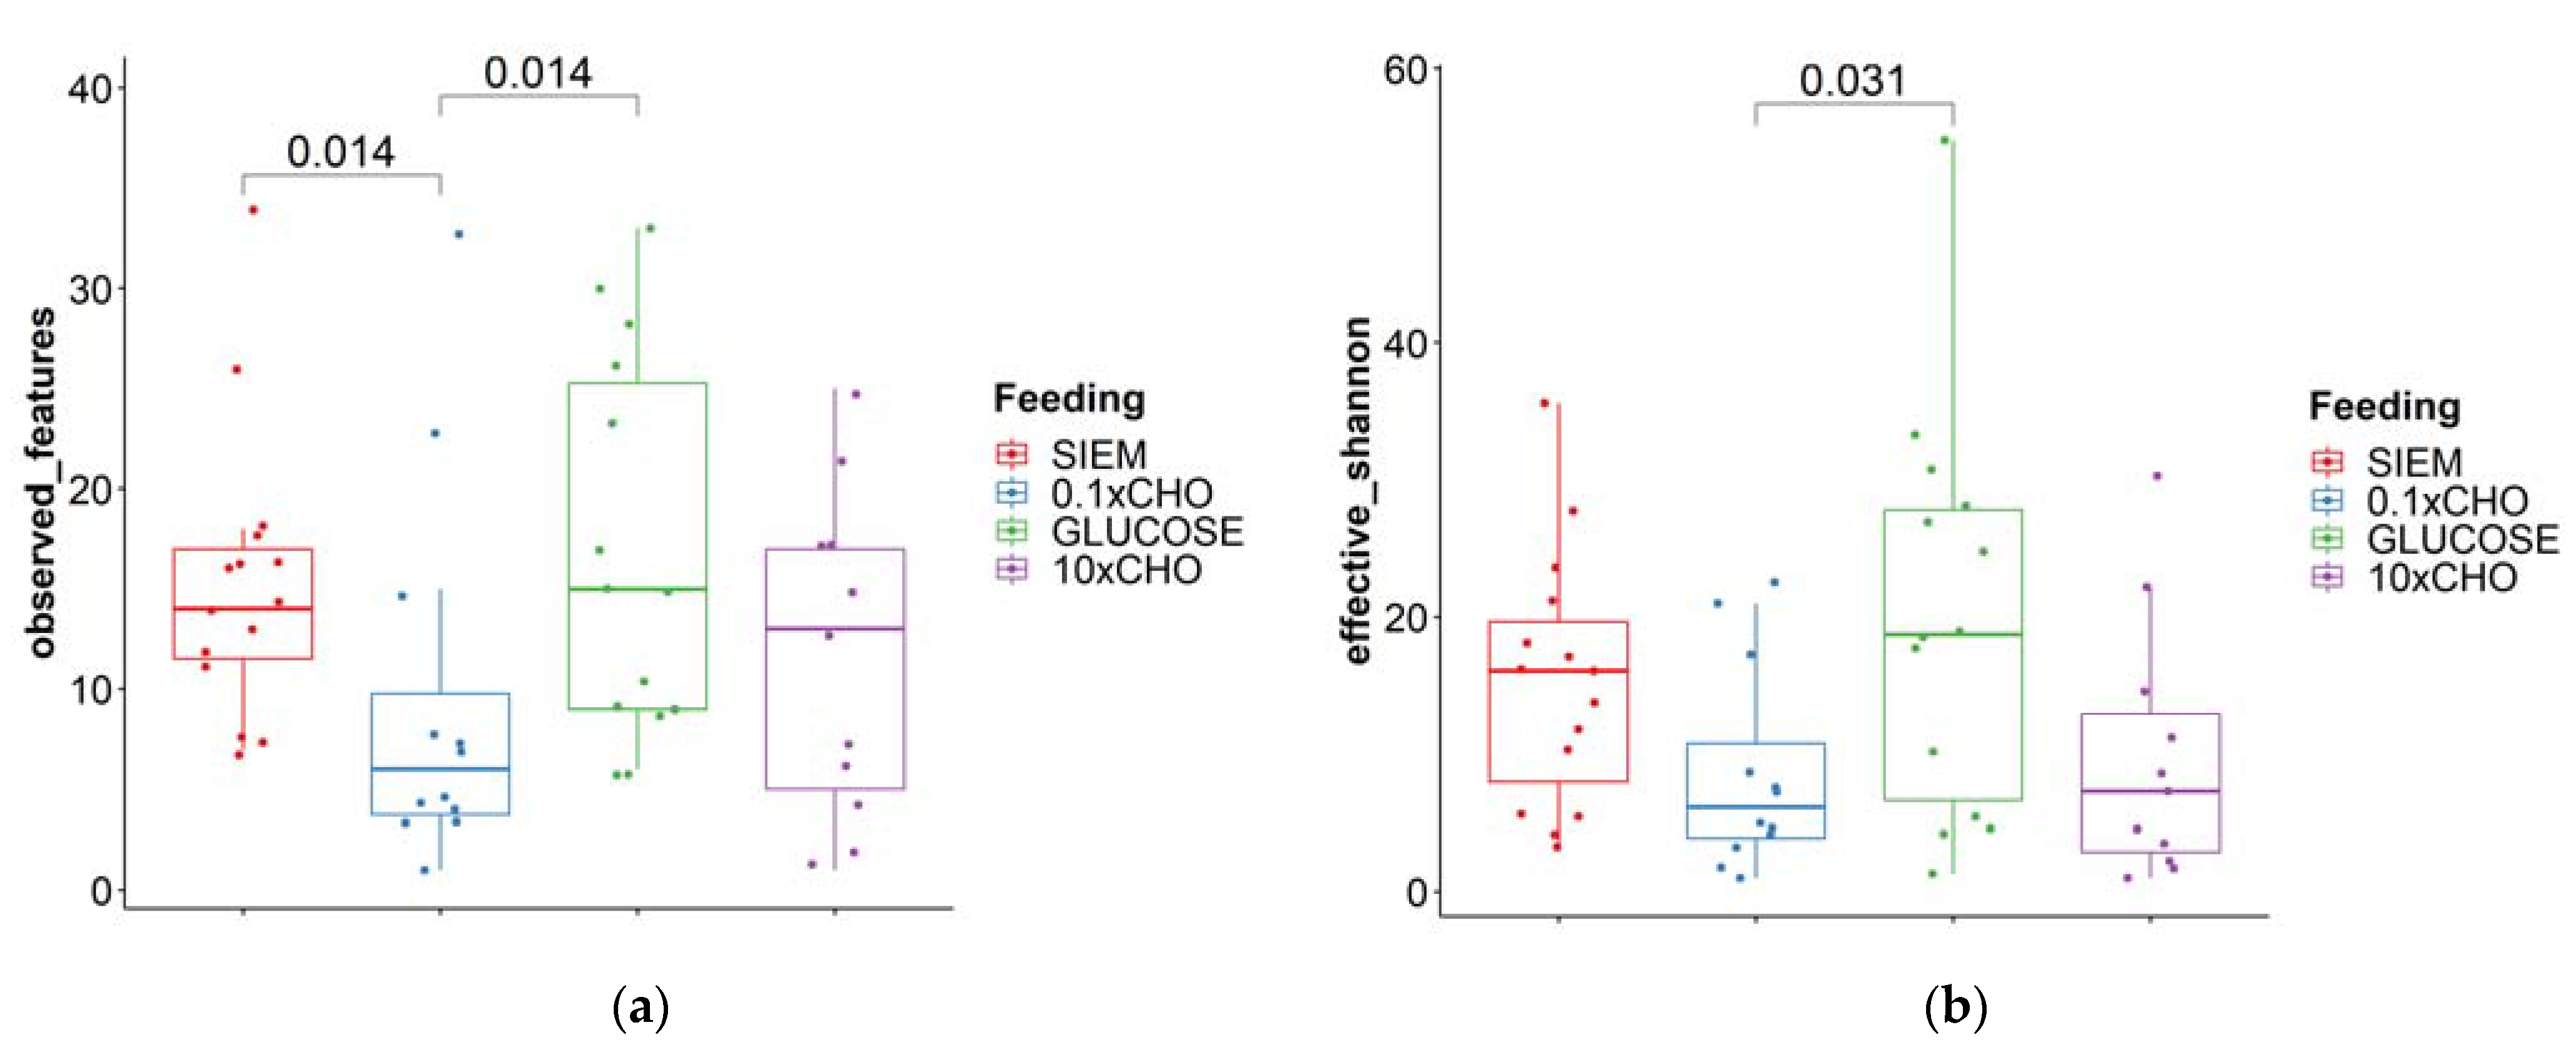
| Fungi | Bacteria | |||
|---|---|---|---|---|
| Observed Features | Effective Shannon Diversity | Observed Features | Effective Shannon Diversity | |
| Median | 22.5 | 22.0 | 510 | 5973 |
| Minimum | 9 | 4.34 | 217 | 1654 |
| Maximum | 43 | 47.5 | 791 | 9311 |
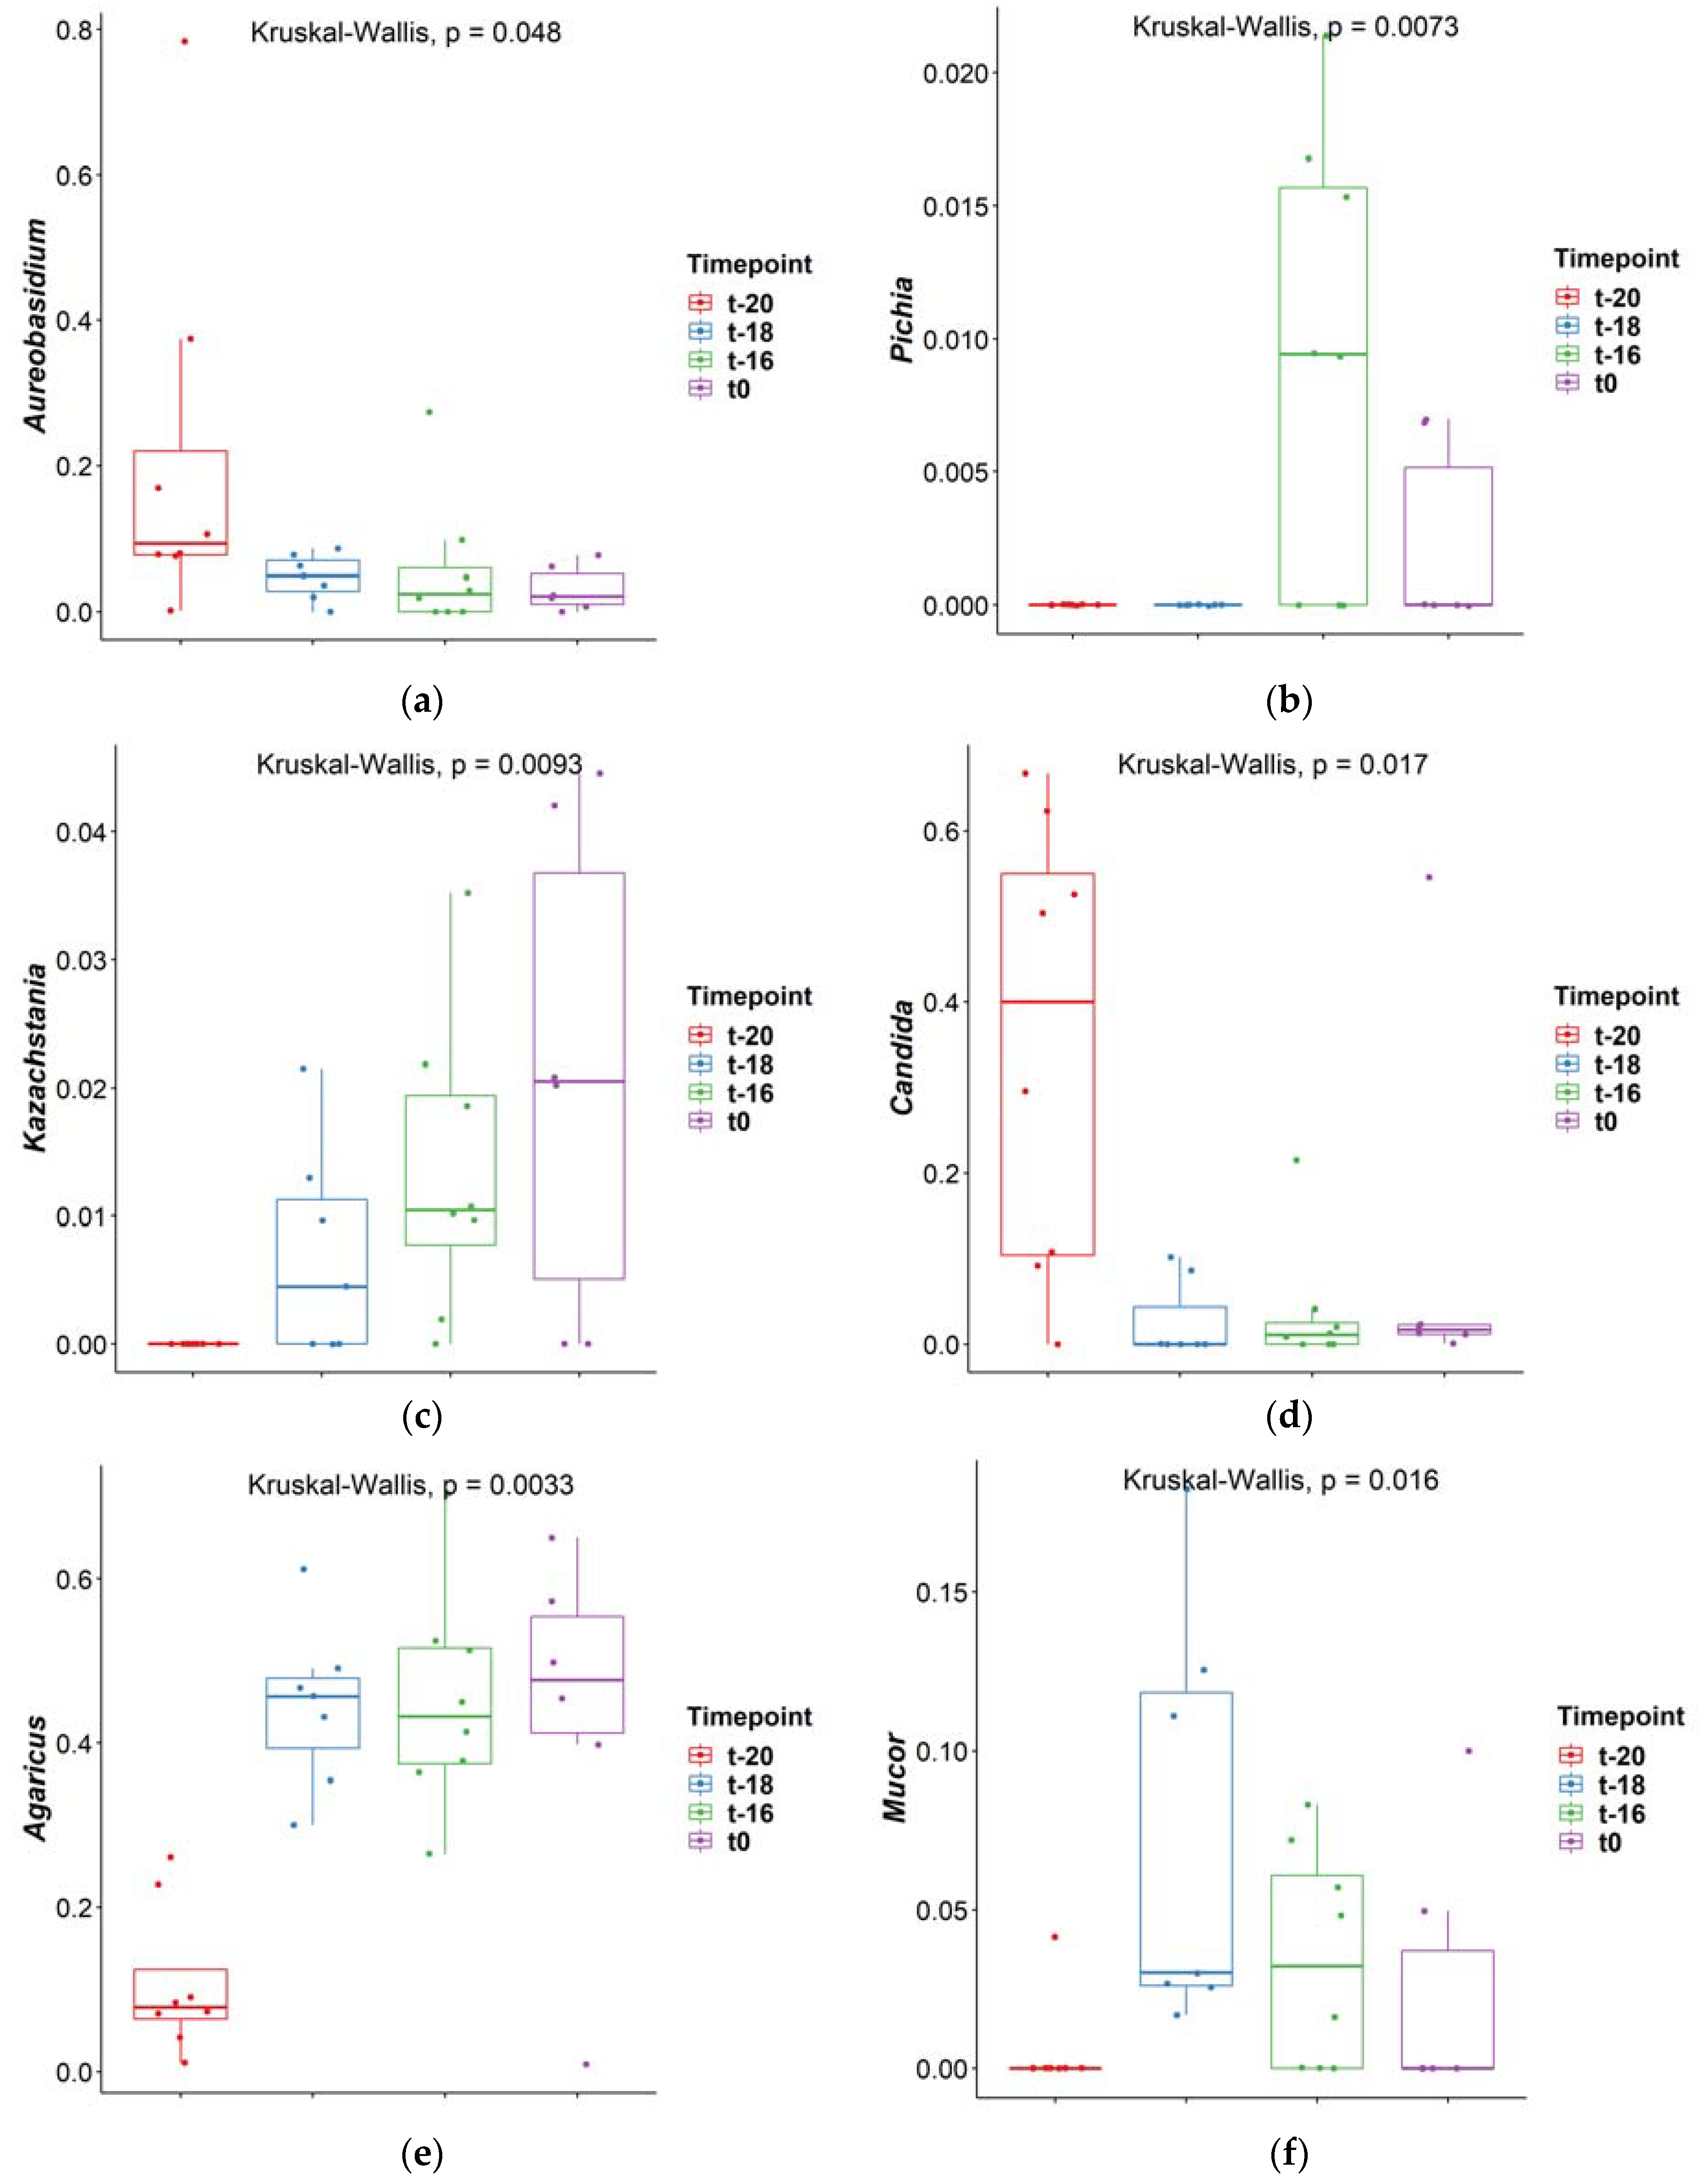
| Comparison | Aureobasidium | Pichia | Kazachstania | Candida | Agaricus | Mucor |
|---|---|---|---|---|---|---|
| t-16–t-18 | 0.561 | 0.003 | 0.246 | 0.607 | 0.990 | 0.171 |
| t-16–t-20 | 0.019 | 0.002 | 0.003 | 0.013 | 0.002 | 0.071 |
| t-18–t-20 | 0.090 | 1.000 | 0.092 | 0.003 | 0.003 | 0.002 |
| t-16–t0 | 0.792 | 0.100 | 0.904 | 0.377 | 0.993 | 0.445 |
| t-18–t0 | 0.426 | 0.261 | 0.232 | 0.182 | 0.984 | 0.044 |
| t-20–t0 | 0.015 | 0.247 | 0.004 | 0.155 | 0.004 | 0.364 |
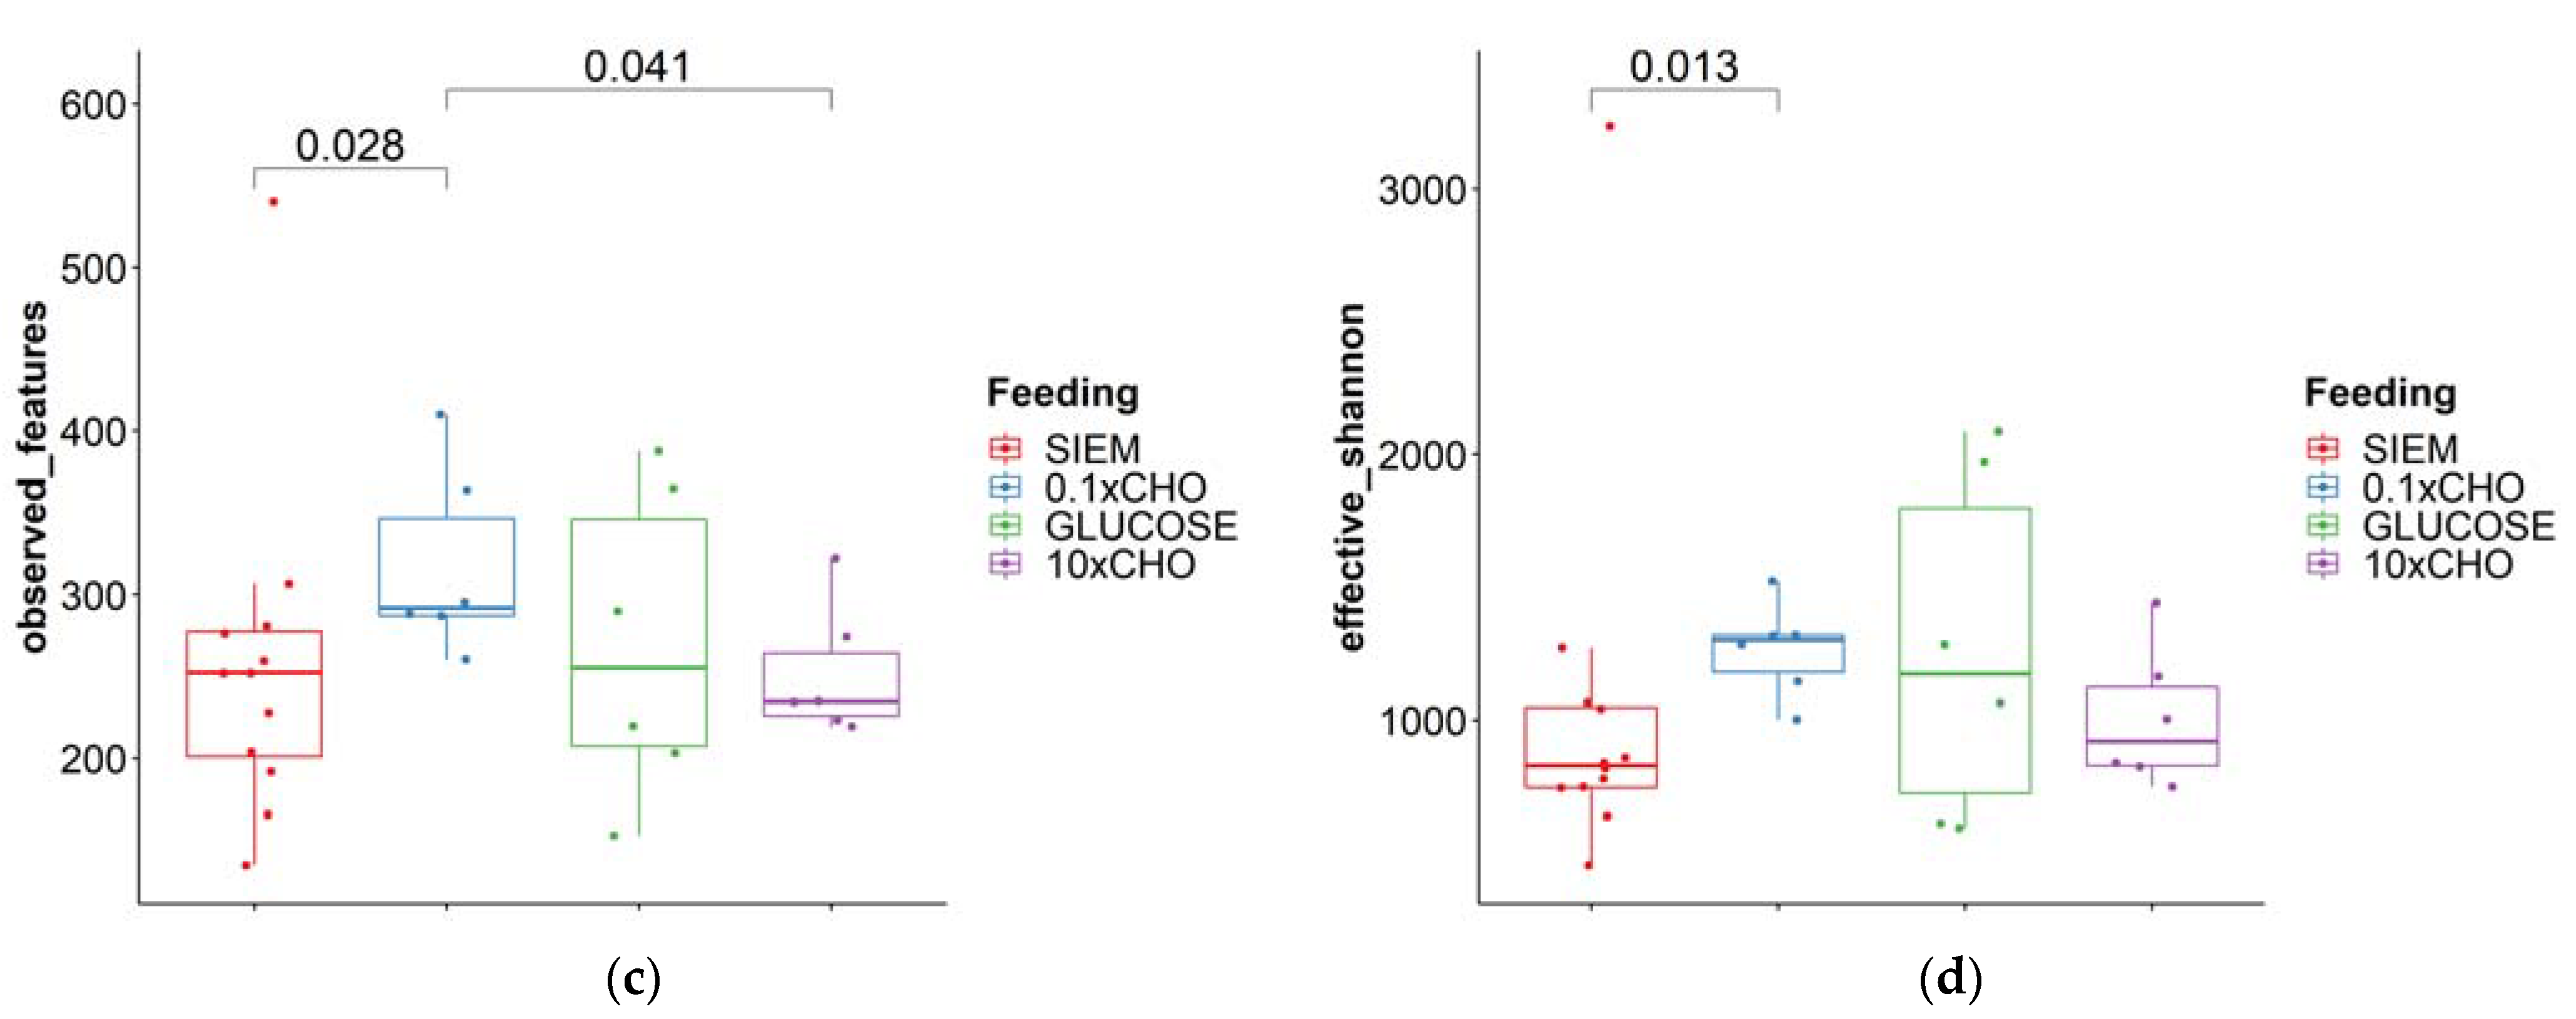
| Fungi | Bacteria | |||
|---|---|---|---|---|
| Observed Features | Effective Shannon Diversity | Observed Features | Effective Shannon Diversity | |
| Median | 13 | 10.8 | 260 | 1021 |
| Minimum | 1 | 1.0 | 135 | 453.6 |
| Maximum | 34 | 54.8 | 540 | 3236 |
| Comparison | Alternaria | Thanatephorus | Candida | Dekkera |
|---|---|---|---|---|
| 0.1 × CHO–10 × CHO | 0.581 | 0.891 | 0.208 | 0.983 |
| 0.1 × CHO–Glucose | 0.00003 | 0.007 | 0.686 | 0.060 |
| 10 × CHO–Glucose | 0.0003 | 0.010 | 0.393 | 0.057 |
| 0.1 × CHO–SIEM | 0.615 | 0.641 | 0.006 | 0.324 |
| 10 × CHO–SIEM | 0.971 | 0.548 | 0.133 | 0.334 |
| Glucose–SIEM | 0.0004 | 0.002 | 0.019 | 0.005 |
Disclaimer/Publisher’s Note: The statements, opinions and data contained in all publications are solely those of the individual author(s) and contributor(s) and not of MDPI and/or the editor(s). MDPI and/or the editor(s) disclaim responsibility for any injury to people or property resulting from any ideas, methods, instructions or products referred to in the content. |
© 2023 by the authors. Licensee MDPI, Basel, Switzerland. This article is an open access article distributed under the terms and conditions of the Creative Commons Attribution (CC BY) license (https://creativecommons.org/licenses/by/4.0/).
Share and Cite
Maas, E.; Penders, J.; Venema, K. Modelling the Gut Fungal-Community in TIM-2 with a Microbiota from Healthy Individuals. J. Fungi 2023, 9, 104. https://doi.org/10.3390/jof9010104
Maas E, Penders J, Venema K. Modelling the Gut Fungal-Community in TIM-2 with a Microbiota from Healthy Individuals. Journal of Fungi. 2023; 9(1):104. https://doi.org/10.3390/jof9010104
Chicago/Turabian StyleMaas, Evy, John Penders, and Koen Venema. 2023. "Modelling the Gut Fungal-Community in TIM-2 with a Microbiota from Healthy Individuals" Journal of Fungi 9, no. 1: 104. https://doi.org/10.3390/jof9010104
APA StyleMaas, E., Penders, J., & Venema, K. (2023). Modelling the Gut Fungal-Community in TIM-2 with a Microbiota from Healthy Individuals. Journal of Fungi, 9(1), 104. https://doi.org/10.3390/jof9010104