
Effect of Vitamin-D-Enriched Edible Mushrooms on Vitamin D Status, Bone Health and Expression of CYP2R1, CYP27B1 and VDR Gene in Wistar Rats

 , ,
, ,  ,
,  and
and 
Abstract
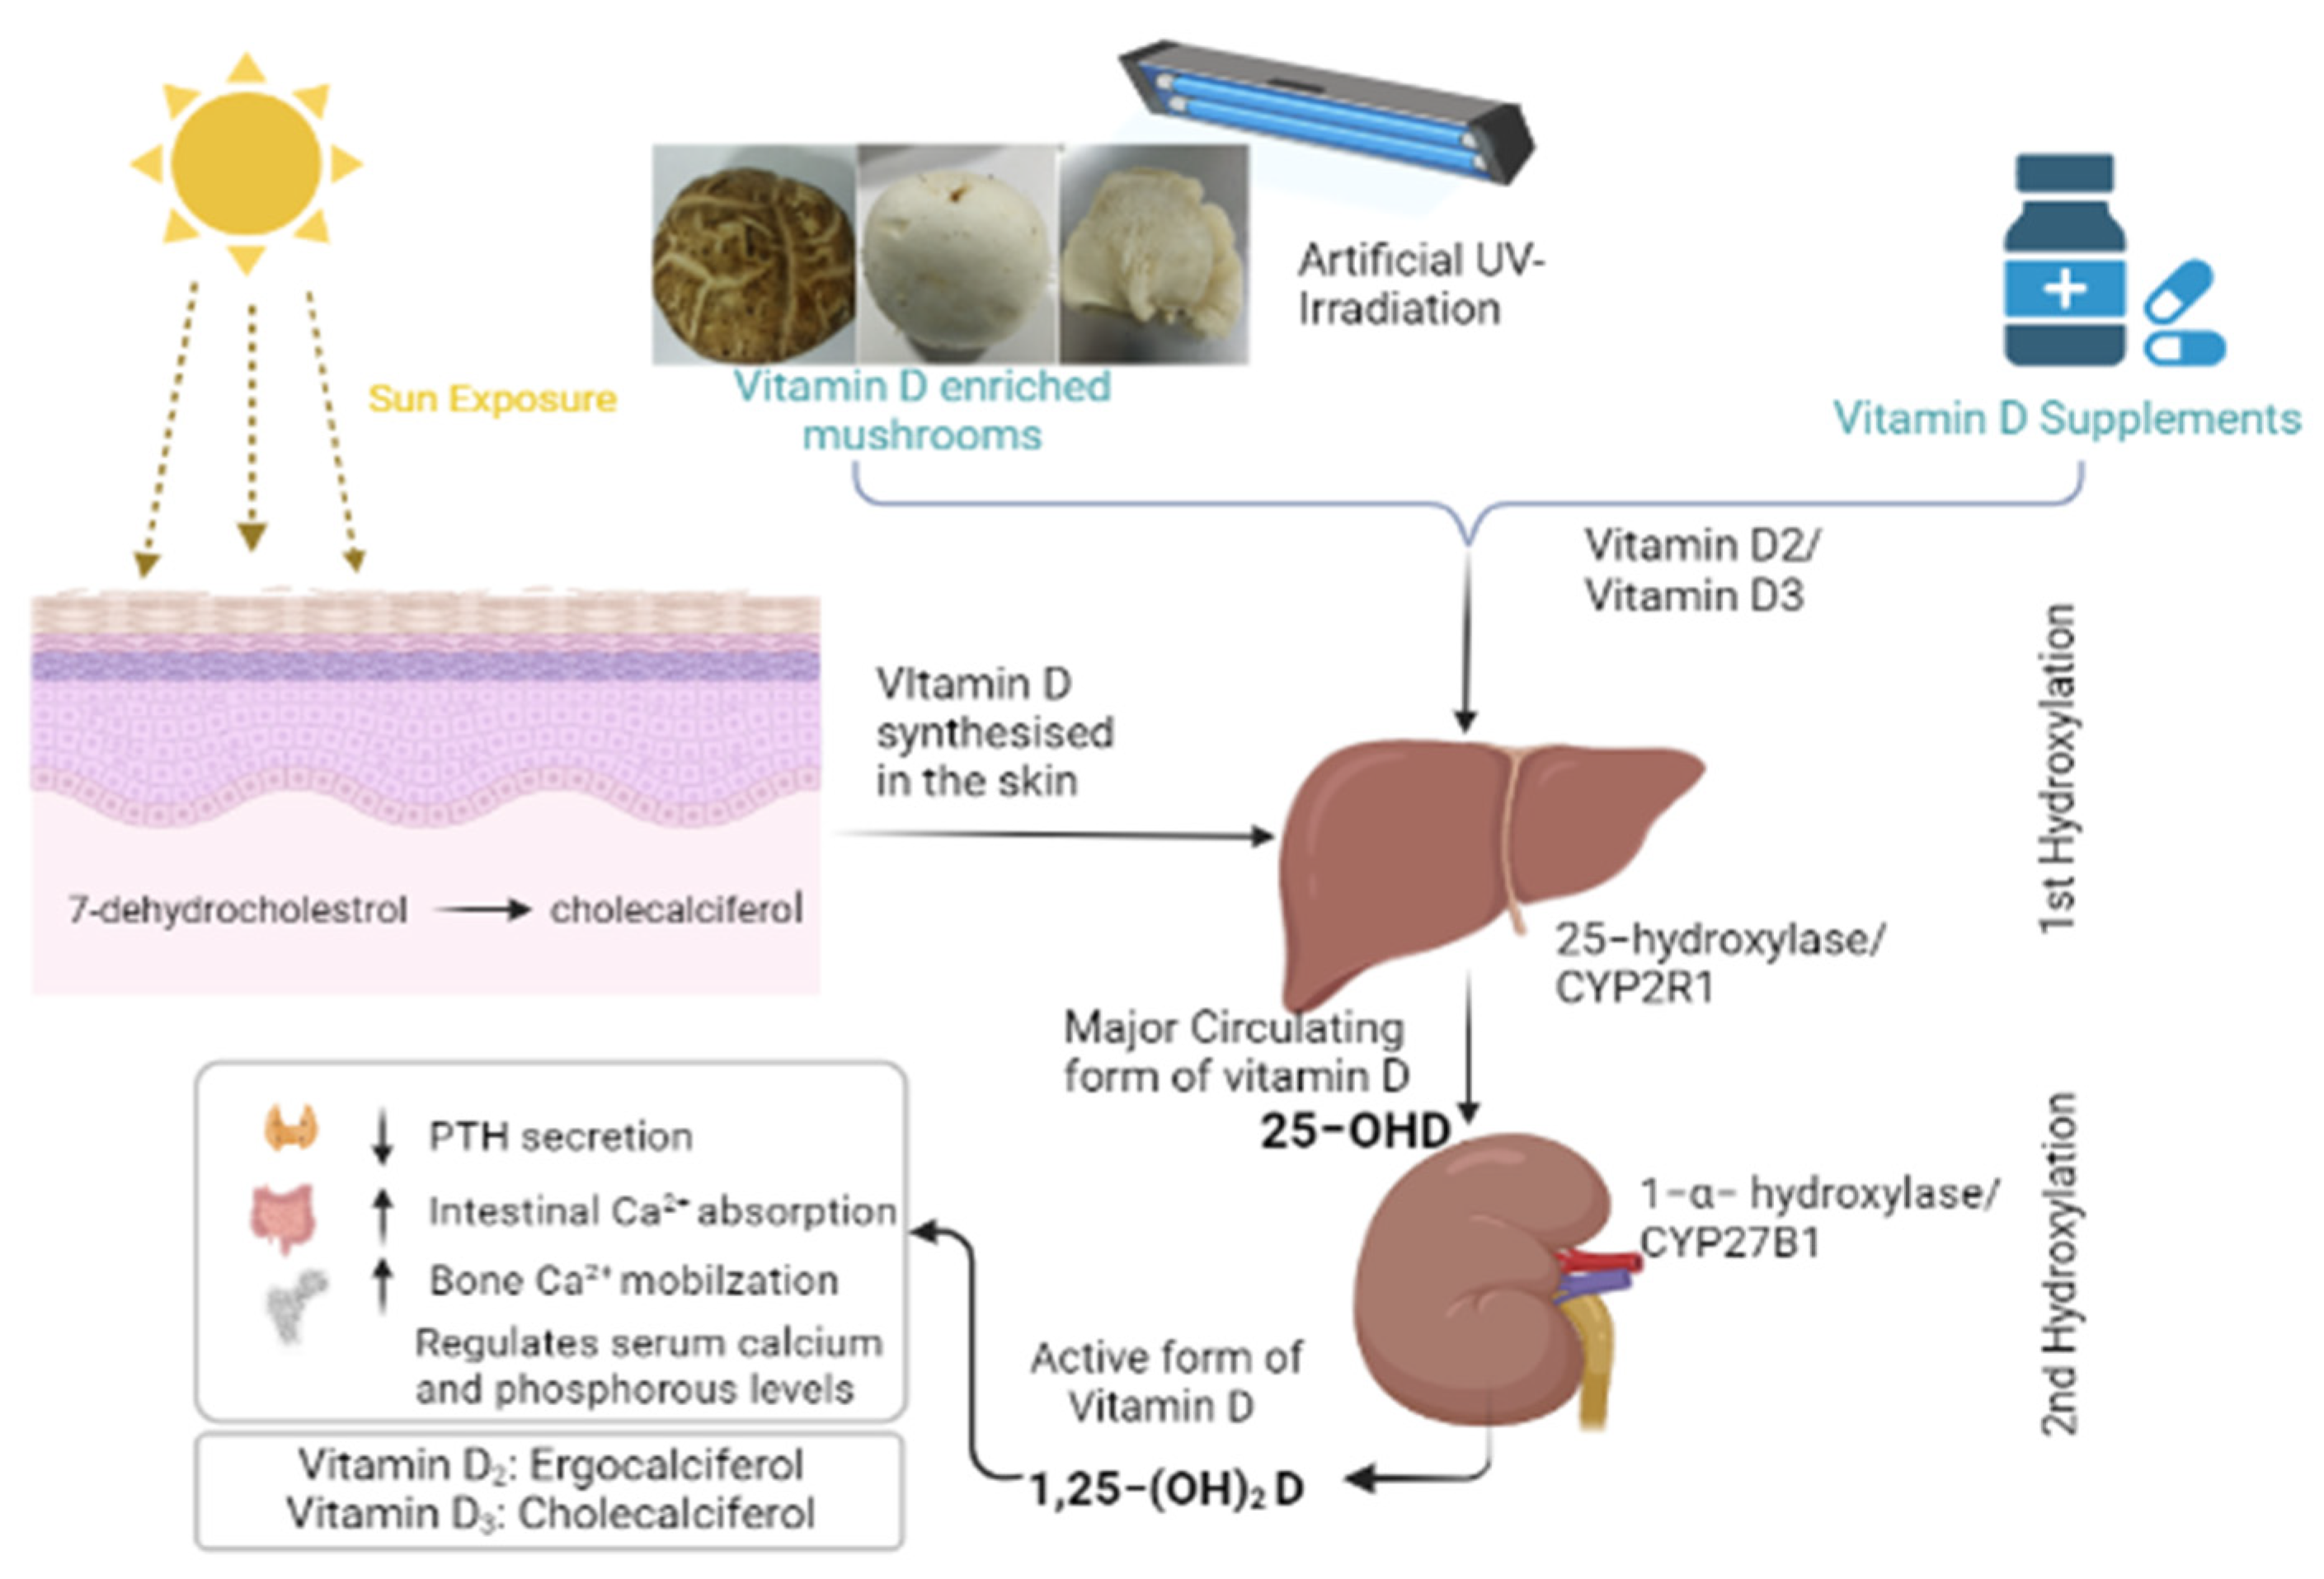
1. Introduction
2. Materials and Methods
2.1. Mushrooms and Vitamin D Supplements
2.2. Irradiation of Mushrooms and Vitamin D2 Analysis
2.3. Animals
- GP-1: Fed on a VDDD.
- GP-2: Fed on a VDDD + vitamin D2 enriched shiitake mushroom.
- GP-3: Fed on a VDDD + vitamin D2 enriched button mushroom.
- GP-4: Fed on a VDDD + vitamin D2 enriched oyster mushroom.
- GP-5: Fed on a VDDD + vitamin D2 supplement.
- GP-6: Fed on a VDDD + vitamin D3 supplement.
2.4. Blood Sampling
2.5. Analysis of Biochemical Parameters
- (a).
- Serum 25-hydroxy vitamin D: For the estimation of total vitamin D, the Advia Centaur (Siemens Healthcare Diagnostics Inc., Tarrytown, NY, USA) assay that utilizes a releasing reagent and a monoclonal antibody to detect both 25-OH vitamin D2 and D3 was used, following standard protocol [24].
- (b).
- Parathyroid hormone levels: For PTH measurement, Advia Centaur (Siemens Healthcare Diagnostics Inc., Tarrytown, NY, USA) intact PTH assay (monoclonal antibodies assay) was used by following a standard protocol [25].
- (c).
- Serum calcium, phosphorous and alkaline phosphatase: The estimation was performed by semi-auto-analyzer Erba Chem-5 (Erba Diagnostics, Manheim, Germany) using commercially available kits by following the manufacturer’s protocol [26].
2.6. Histology of Femur Samples of Treated and Non-Treated Rats
2.7. RNA Isolation and Real-Time Quantitative PCR (qPCR) Gene Expression
2.8. Statistical Analysis
3. Results
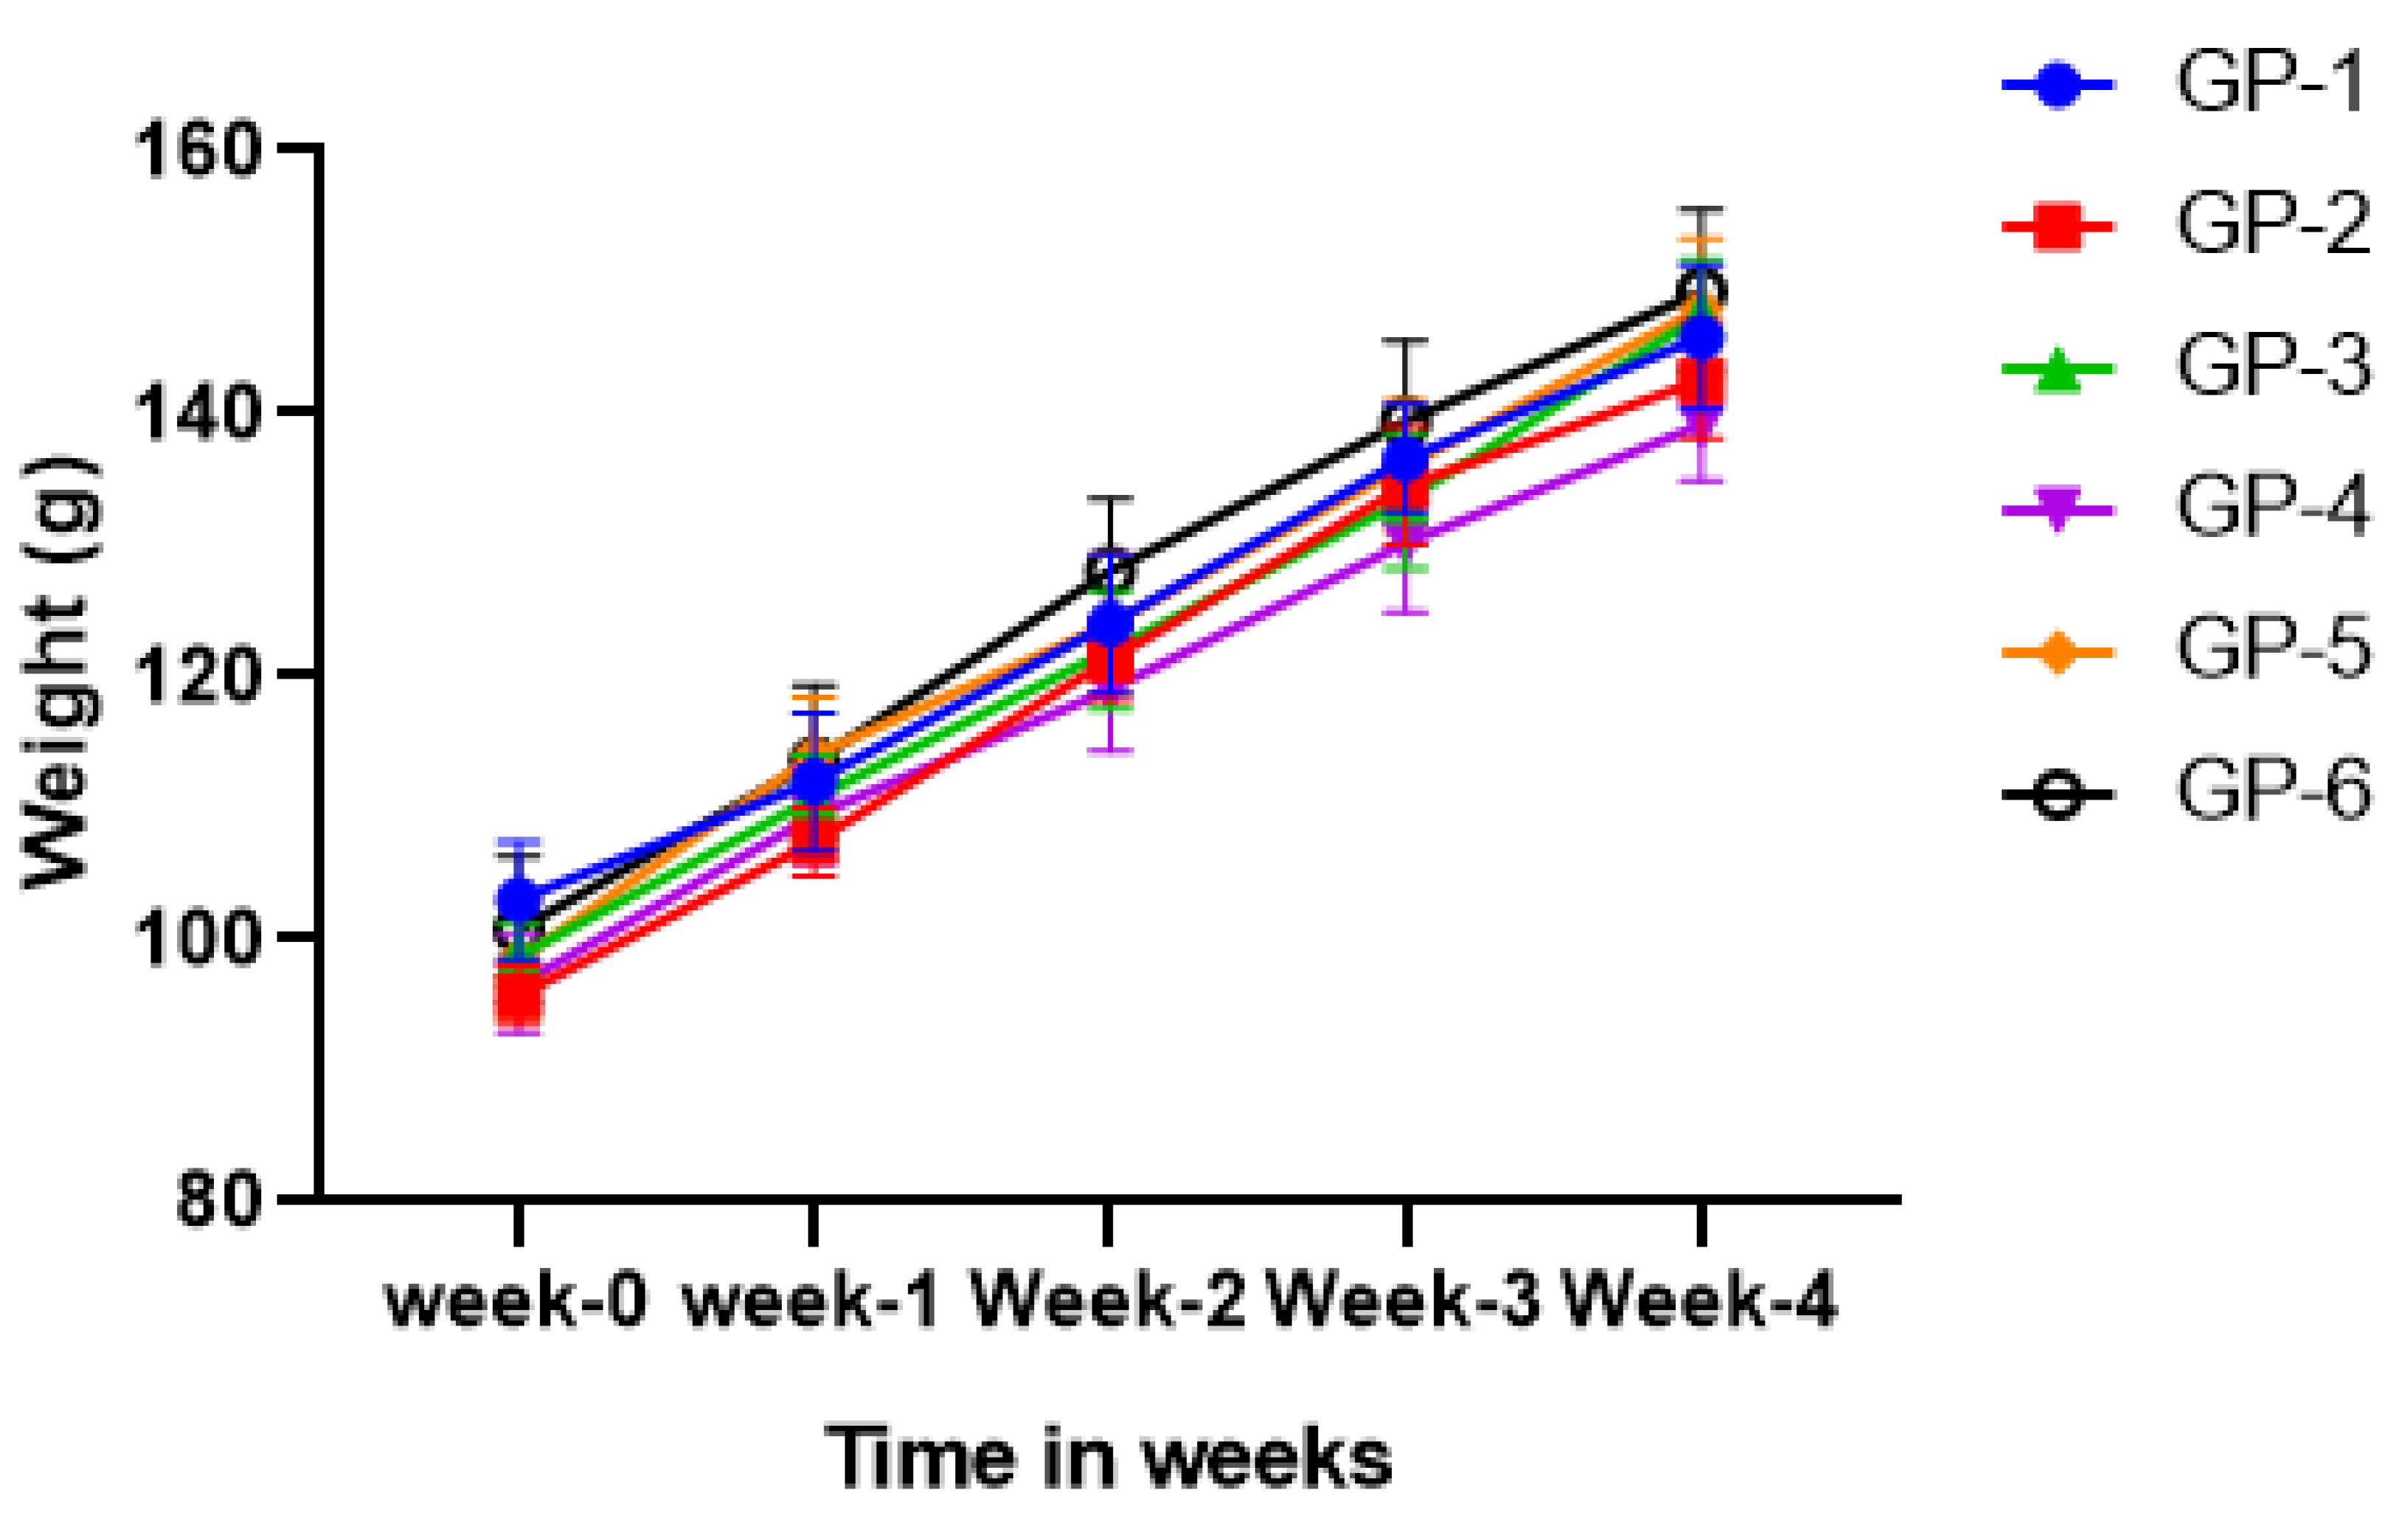
3.1. Body Weight
3.2. Changes in Serum 25-Hydroxyvitamin D Levels
3.3. Changes in Parathyroid Hormone, Calcium and Phosphorous Levels and Alkaline Phosphatase Activity among All Groups
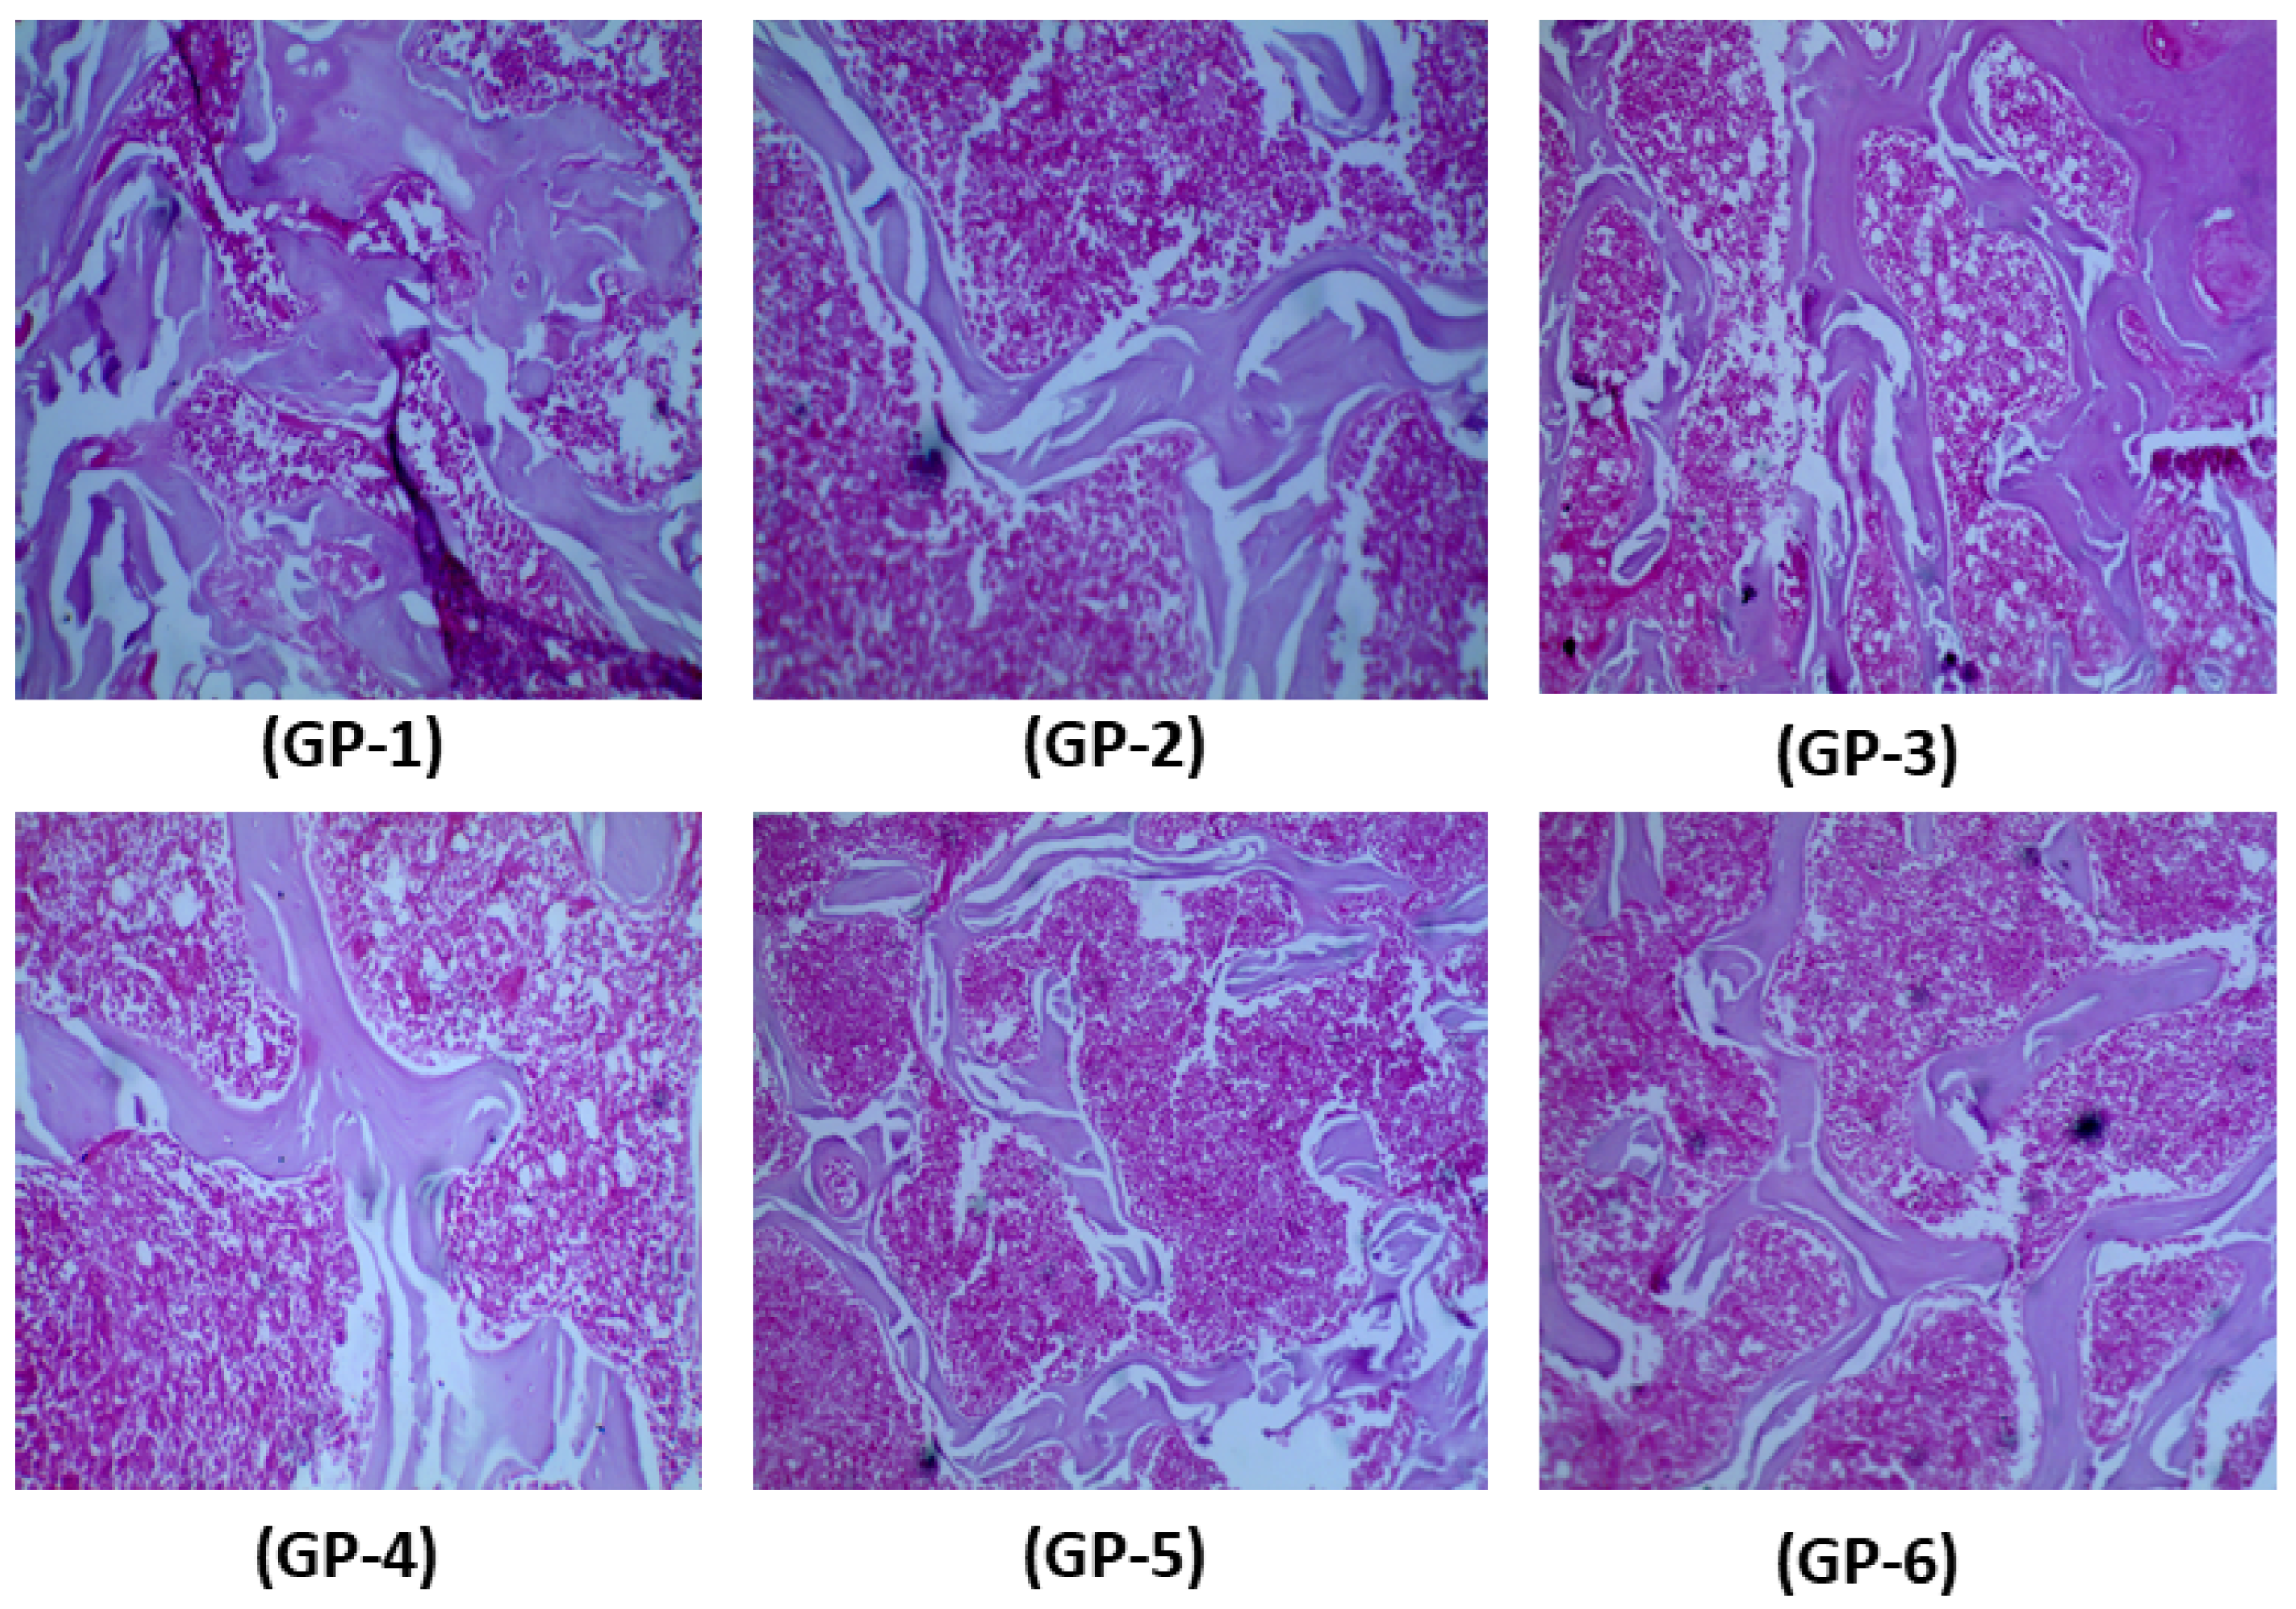
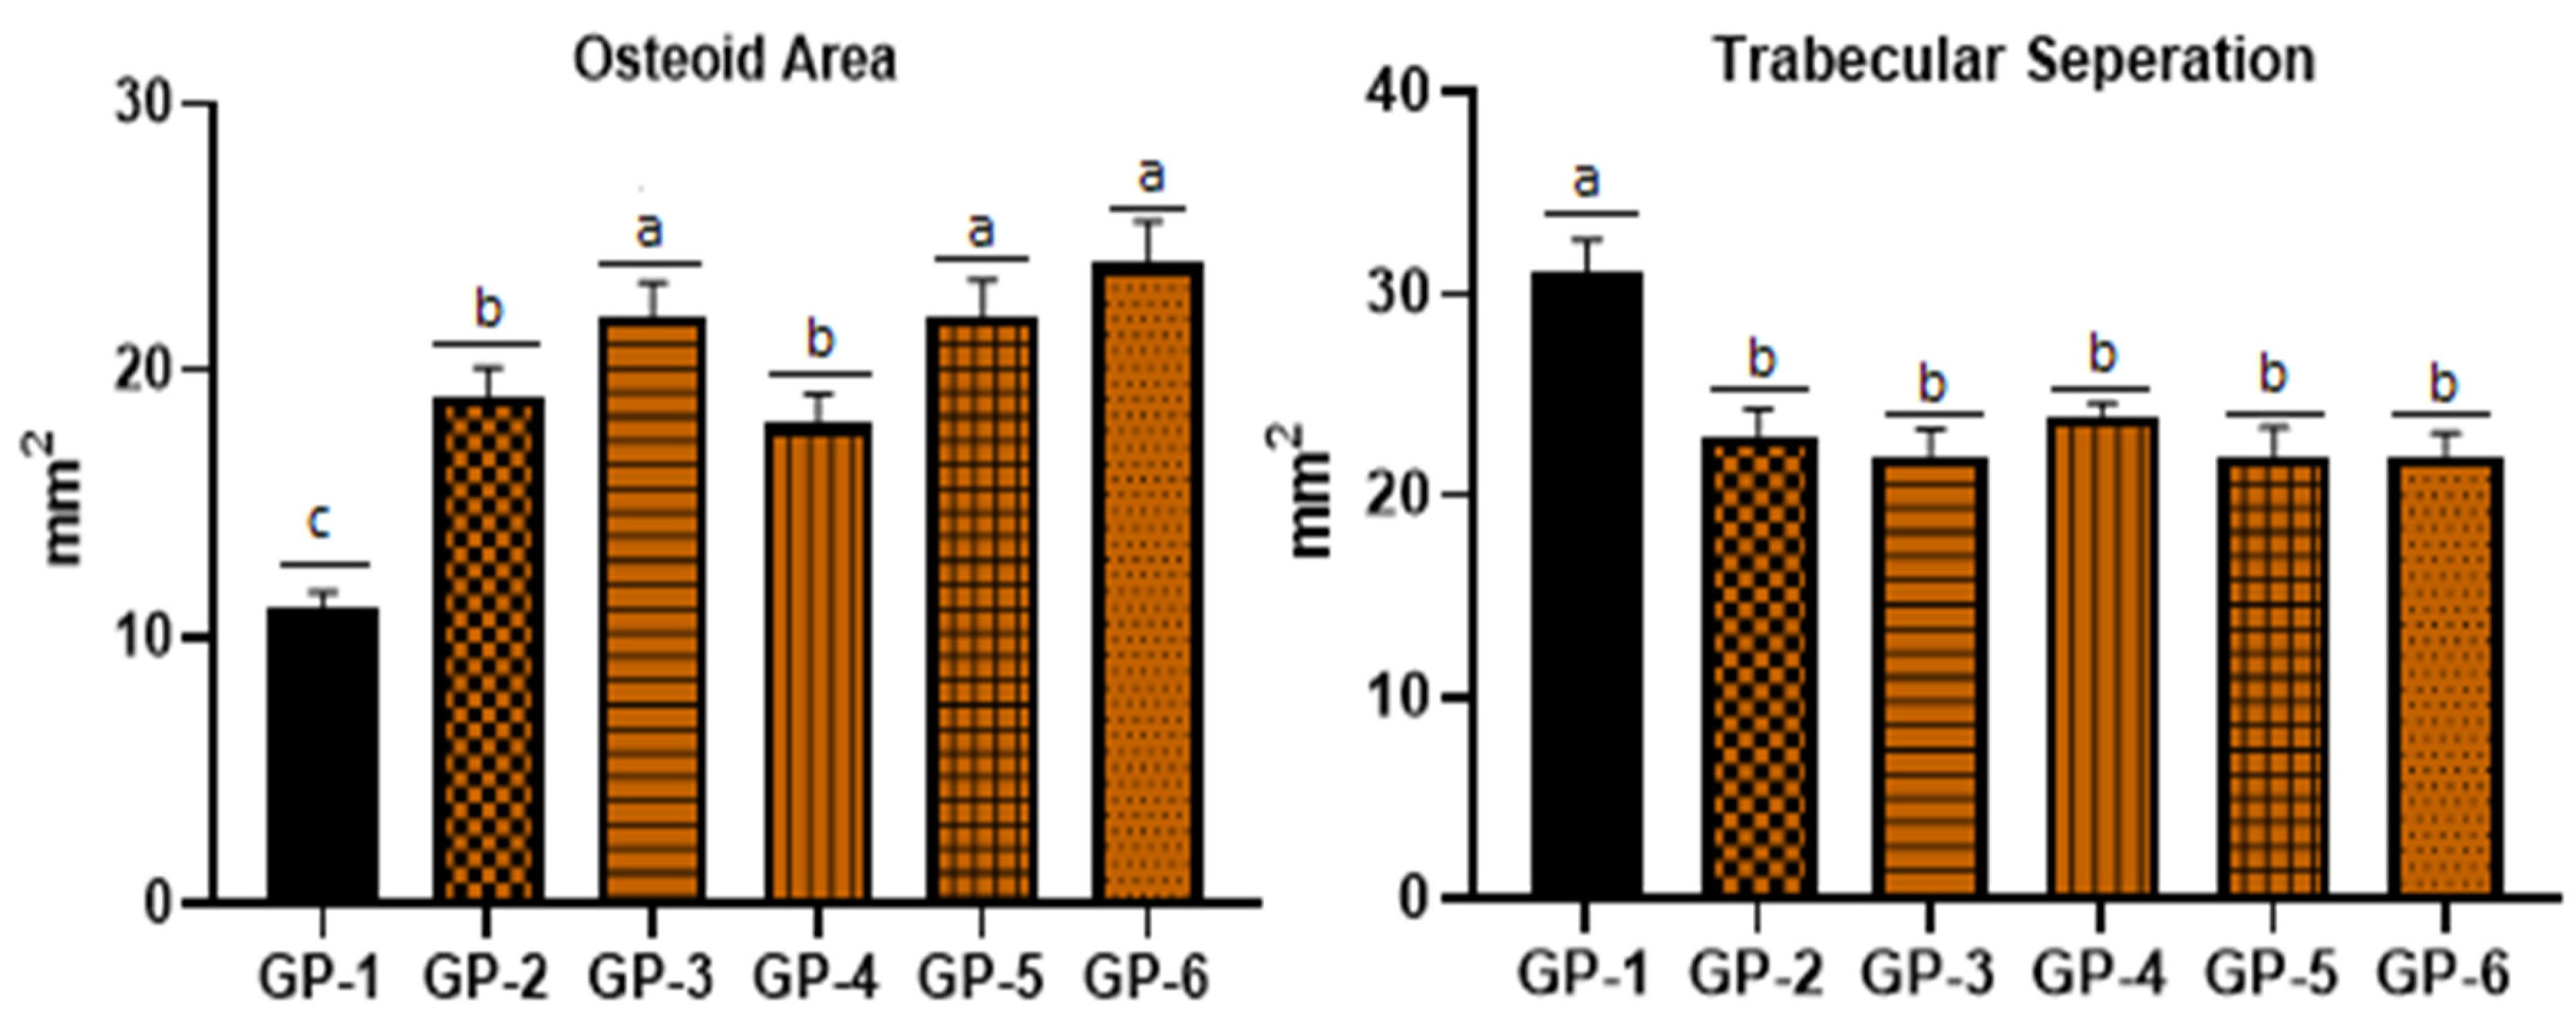
3.4. Bone Health of Rats Fed with Vitamin-D-Deficient Diet, Edible Mushrooms and Vitamin D Supplements
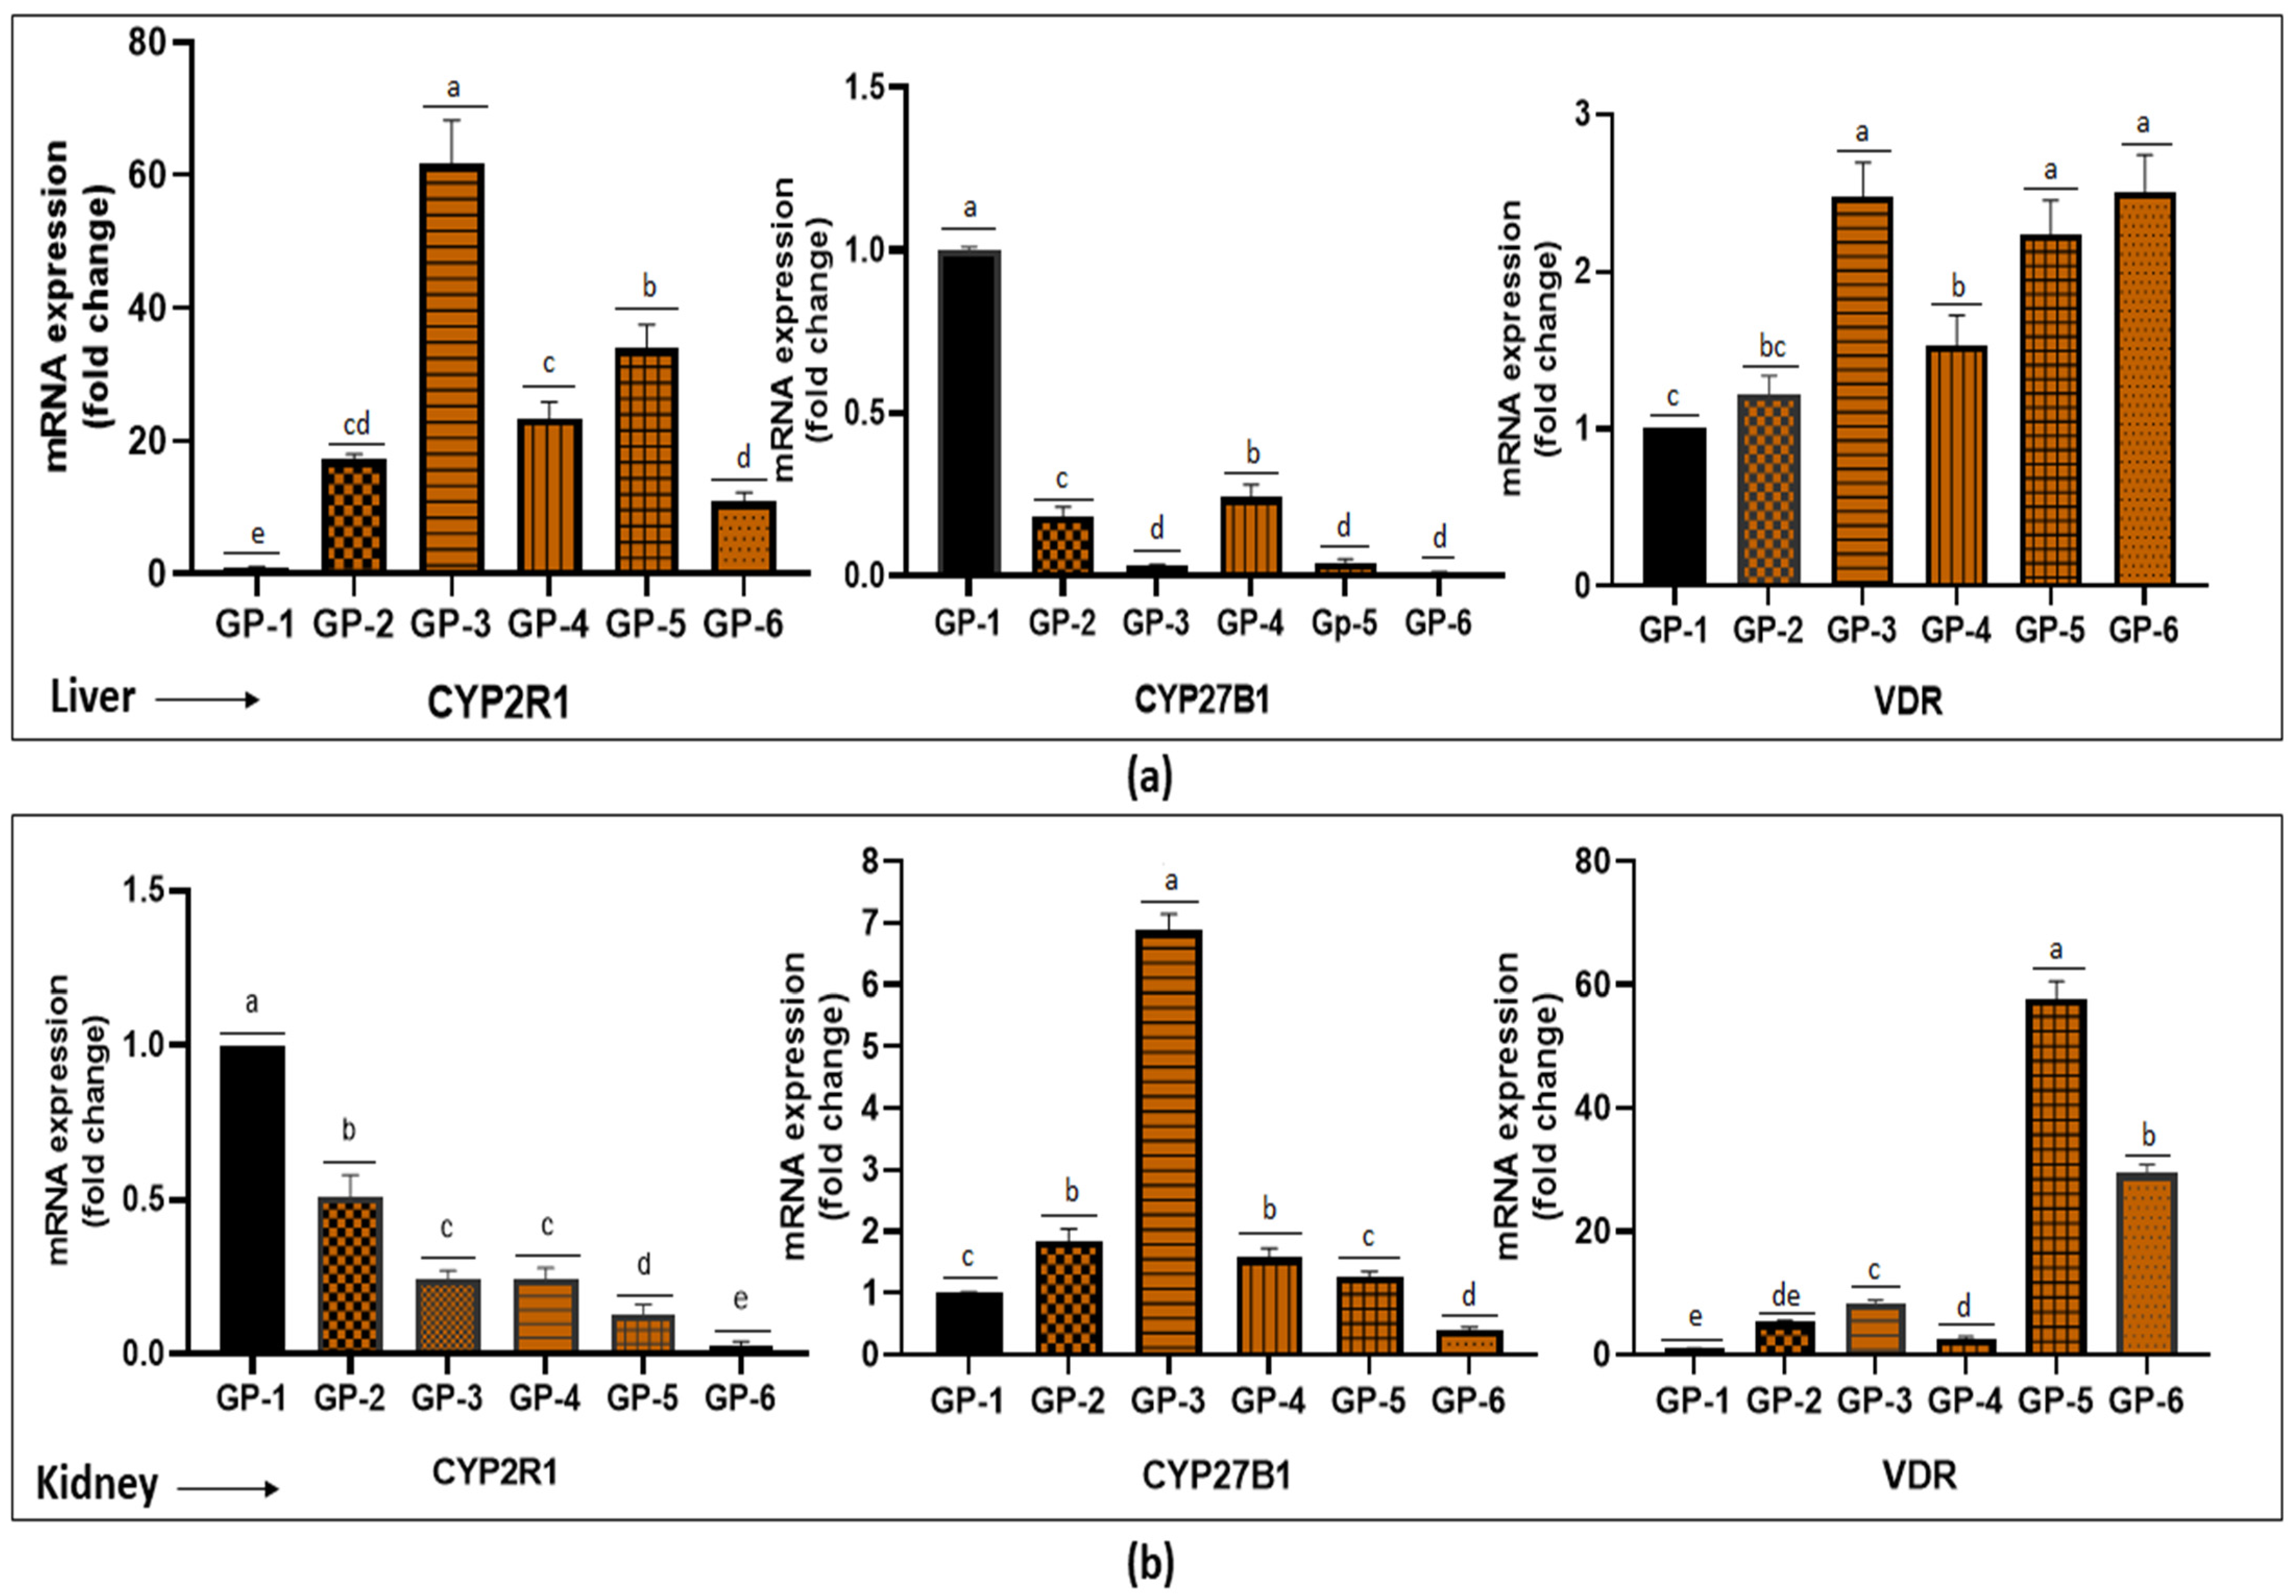
3.5. Expression of CYP2R1, CYP27B1 and VDR Gene in the Liver and Kidney of Rats after 4 Weeks of Feeding Period
4. Discussion
5. Conclusions
Supplementary Materials
Author Contributions
Funding
Institutional Review Board Statement
Informed Consent Statement
Data Availability Statement
Acknowledgments
Conflicts of Interest
References
- Holick, M.F.; Chen, T.C. Vitamin D Deficiency: A Worldwide Problem with Health Consequences. Am. J. Clin. Nutr. 2008, 87, 1080–1086. [Google Scholar] [CrossRef] [PubMed]
- Liu, X.; Baylin, A.; Levy, P.D. Vitamin D Deficiency and Insufficiency among US Adults: Prevalence, Predictors and Clinical Implications. Br. J. Nutr. 2018, 119, 928–936. [Google Scholar] [CrossRef] [PubMed]
- Jan, Y.; Malik, M.; Yaseen, M.; Ahmad, S.; Imran, M.; Rasool, S.; Haq, A. Vitamin D Fortification of Foods in India: Present and Past Scenario. J. Steroid Biochem. Mol. Biol. 2019, 193, 105417. [Google Scholar] [CrossRef] [PubMed]
- Cashman, K.D.; Dowling, K.G.; Škrabáková, Z.; Gonzalez-Gross, M.; Valtueña, J.; De Henauw, S.; Moreno, L.; Damsgaard, C.T.; Michaelsen, K.F.; Mølgaard, C.; et al. Vitamin D Deficiency in Europe: Pandemic? Am. J. Clin. Nutr. 2016, 103, 1033–1044. [Google Scholar] [CrossRef] [PubMed]
- Keflie, T.S.; Nölle, N.; Lambert, C.; Nohr, D.; Biesalski, H.K. Vitamin D Deficiencies among Tuberculosis Patients in Africa: A Systematic Review. Nutrition 2015, 31, 1204–1212. [Google Scholar] [CrossRef]
- Green, R.J.; Samy, G.; Miqdady, M.S.; El-Hodhod, M.; Akinyinka, O.O.; Saleh, G.; Haddad, J.; Alsaedi, S.A.; Mersal, A.Y.; Edris, A.; et al. Vitamin D Deficiency and Insufficiency in Africa and the Middle East, despite Year-Round Sunny Days. S. Afr. Med. J. 2015, 105, 603–605. [Google Scholar] [CrossRef]
- Keegan, R.J.H.; Lu, Z.; Bogusz, J.M.; Williams, J.E.; Holick, M.F. Photobiology of Vitamin D in Mushrooms and Its Bioavailability in Humans. Dermato-Endocrinology 2013, 5, 165–176. [Google Scholar] [CrossRef]
- Taofiq, O.; Fernandes, Â.; Barros, L.; Barreiro, M.F.; Ferreira, I.C.F.R. UV-Irradiated Mushrooms as a Source of Vitamin D2: A Review. Trends Food Sci. Technol. 2017, 70, 82–94. [Google Scholar] [CrossRef]
- Holick, M.F. Vitamin D: The Underappreciated D-Lightful Hormone That Is Important for Skeletal and Cellular Health. Curr. Opin. Endocrinol. Diabetes 2002, 9, 87–98. [Google Scholar] [CrossRef]
- Carlberg, C. Molecular Approaches for Optimizing Vitamin D Supplementation. Vitam. Horm. 2016, 100, 255–271. [Google Scholar] [CrossRef]
- Tangpricha, V.; Koutkia, P.; Rieke, S.M.; Chen, T.C.; Perez, A.A.; Holick, M.F. Fortification of Orange Juice with Vitamin D: A Novel Approach for Enhancing Vitamin D Nutritional Health. Am. J. Clin. Nutr. 2003, 77, 1478–1483. [Google Scholar] [CrossRef] [PubMed]
- Calvo, M.S.; Whiting, S.J. Survey of Current Vitamin D Food Fortification Practices in the United States and Canada. J. Steroid Biochem. Mol. Biol. 2013, 136, 211–213. [Google Scholar] [CrossRef] [PubMed]
- Cardwell, G.; Bornman, J.F.; James, A.P.; Black, L.J.; Au, A.P.J. A Review of Mushrooms as a Potential Source of Dietary Vitamin D. Nutrients 2018, 10, 1498. [Google Scholar] [CrossRef] [PubMed]
- Roncero-Ramos, I.; Delgado-Andrade, C. The Beneficial Role of Edible Mushrooms in Human Health. Curr. Opin. Food Sci. 2017, 14, 122–128. [Google Scholar] [CrossRef]
- Ma, G.; Yang, W.; Zhao, L.; Pei, F.; Fang, D.; Hu, Q. A Critical Review on the Health Promoting Effects of Mushrooms Nutraceuticals. Food Sci. Hum. Wellness 2018, 7, 125–133. [Google Scholar] [CrossRef]
- Urbain, P.; Singler, F.; Ihorst, G.; Biesalski, H.K.; Bertz, H. Bioavailability of Vitamin D 2 from UV-B-Irradiated Button Mushrooms in Healthy Adults Deficient in Serum 25-Hydroxyvitamin D: A Randomized Controlled Trial. Eur. J. Clin. Nutr. 2011, 65, 965–971. [Google Scholar] [CrossRef]
- Jasinghe, V.; Perera, C. Bioavailability of Vitamin D2 from Irradiated Mushrooms: An In Vivo Study. Br. J. Nutr. 2005, 93, 951–955. [Google Scholar] [CrossRef]
- Calvo, M.S.; Babu, U.S.; Garthoff, L.H.; Woods, T.O.; Dreher, M.; Hill, G.; Nagaraja, S. Vitamin D2 from Light-Exposed Edible Mushrooms Is Safe, Bioavailable and Effectively Supports Bone Growth in Rats. Osteoporos. Int. 2013, 24, 197–207. [Google Scholar] [CrossRef]
- Lv, L.; Tan, X.; Peng, X.; Bai, R.; Xiao, Q.; Zou, T.; Tan, J.; Zhang, H.; Wang, C. The Relationships of Vitamin D, Vitamin D Receptor Gene Polymorphisms, and Vitamin D Supplementation with Parkinson’s Disease. Transl. Neurodegener. 2020, 9, 34. [Google Scholar] [CrossRef]
- Malik, M.A.; Jan, Y.; Haq, A.; Kaur, J.; Panda, B.P. Enhancement of Vitamin D2 in Edible Mushroom Using Ultraviolet Irradiation and Assessing Its Storage and Cooking Stability. Nutr. Food Sci. 2022. [CrossRef]
- Bio-Serv, Rodent Diet; Bio-Serv Company: Flemington, NJ, USA, 2015; Available online: https://www.bio-serv.com/category/Rodent_diets.html (accessed on 4 August 2022).
- Nutrition. NRCUSSoLA. Nutrient Requirements of Laboratory Animals; National Research Council (U.S.), Subcommittee on Laboratory Animal Nutrition, National Academy of Sciences: Washington, DC, USA, 1995. [Google Scholar]
- Council, N.R. Nutrient Requirements of Laboratory Animals; The National Academies: Washington, DC, USA, 1995. [Google Scholar]
- Chen, Y.; Kinney, L.; Božović, A.; Smith, H.; Tarr, H.; Diamandis, E.P.; LeBlanc, A. Performance Evaluation of Siemens ADVIA Centaur and Roche MODULAR Analytics E170 Total 25-OH Vitamin D Assays. Clin. Biochem. 2012, 45, 1485–1490. [Google Scholar] [CrossRef] [PubMed]
- Risteli, J.; Winter, W.E.; Kleerekoper, M.R.L. Disorders of Bone and Mineral Metabolism. Tietz Fundam. Clin. Chem. Mol. Diagn. 2015, 7, 741–768. [Google Scholar]
- Juha, R.; William, E.W.; Michael, K.L.R. Bone and Mineral Metabolism. Tietz Text B Clin. Chem. Mol. Diagn. 2012, 5, 1733–1801. [Google Scholar]
- Yoshiki, S. A Simple Histological Method for Identification of Osteoid Matrix in Decalcified Bone. Biotech. Histochem. 1973, 48, 233–238. [Google Scholar] [CrossRef] [PubMed]
- Abulmeaty, M.M.A. Sunlight Exposure vs. Vitamin D Supplementation on Bone Homeostasis of Vitamin D Deficient Rats. Clin. Nutr. Exp. 2017, 11, 1–9. [Google Scholar] [CrossRef][Green Version]
- Del Prete, M.J.; Vernal, R.; Dolznig, H.; Müllner, E.W.; Garcia-Sanz, J.A. Isolation of Polysome-Bound MRNA from Solid Tissues Amenable for RT-PCR and Profiling Experiments. RNA 2007, 13, 414–421. [Google Scholar] [CrossRef]
- Livak, K.J.; Schmittgen, T.D. Analysis of Relative Gene Expression Data Using Real-Time Quantitative PCR and the 2-ΔΔCT Method. Methods 2001, 25, 402–408. [Google Scholar] [CrossRef]
- Larsen, E.R.; Mosekilde, L.; Foldspang, A. Vitamin D and Calcium Supplementation Prevents Osteoporotic Fractures in Elderly Community Dwelling Residents: A Pragmatic Population-Based 3-Year Intervention Study. J. Bone Miner. Res. 2004, 19, 370–378. [Google Scholar] [CrossRef]
- Shuai, B.; Shen, L.; Yang, Y.P.; Xie, J.; Zhou, P.Q.; Li, H.; Guo, X.F.; Zhao, J.; Wu, J.L. Effects of Chinese Kidney-Tonifying Drugs on Bone Mineral Density (BMD), Biomechanics, 25-Hydroxy Vitamin D3 and 1,25-Dihydroxy Vitamin D3 of Ovariectomized Osteoporosis Rats. Zhongguo Gu Shang 2008, 21, 850–853. [Google Scholar]
- Almajwal, A.M.; Abulmeaty, M.M.A.; Feng, H.; Alruwaili, N.W.; Dominguez-Uscanga, A.; Andrade, J.E.; Razak, S.; Elsadek, M.F. Stabilization of Vitamin D in Pea Protein Isolate Nanoemulsions Increases Its Bioefficacy in Rats. Nutrients 2019, 11, 75. [Google Scholar] [CrossRef]
- Khundmiri, S.J.; Murray, R.D.; Lederer, E. PTH and Vitamin D. Compr. Physiol. 2016, 6, 561–601. [Google Scholar] [CrossRef] [PubMed]
- Lips, P.; Van Schoor, N.M. The Effect of Vitamin D on Bone and Osteoporosis. Best Pract. Res. Clin. Endocrinol. Metab. 2011, 25, 585–591. [Google Scholar] [CrossRef] [PubMed]
- Millán, J.L. The Role of Phosphatases in the Initiation of Skeletal Mineralization. Calcif. Tissue Int. 2013, 93, 299–306. [Google Scholar] [CrossRef]
- Chuang, L.H.; Tung, Y.C.; Liu, S.Y.; Lee, C.T.; Chen, H.L.; Tsai, W.Y. Nutritional Rickets in Taiwanese Children: Experiences at a Single Center. J. Formos. Med. Assoc. 2018, 117, 583–587. [Google Scholar] [CrossRef] [PubMed]
- Bhambri, R.; Naik, V.; Malhotra, N.; Taneja, S.; Rastogi, S.; Ravishanker, U.; Mithal, A. Changes in Bone Mineral Density Following Treatment of Osteomalacia. J. Clin. Densitom. 2006, 9, 120–127. [Google Scholar] [CrossRef]
- Shaheen, S.; Noor, S.S.; Barakzai, Q. Serum Alkaline Phosphatase Screening for Vitamin D Deficiency States. J. Coll. Physicians Surg. Pak. 2012, 22, 424–427. [Google Scholar]
- Aloia, J.F.; Feuerman, M.; Yeh, J.K. Reference Range for Serum Parathyroid Hormone. Endocr. Pract. 2006, 12, 137–144. [Google Scholar] [CrossRef]
- Johnson-Delaney, C. Exotic Companion Medicine Handbook for Veterinarians; Wingers Publishing Incorporated: Lake Worth, FL, USA, 1996. [Google Scholar]
- Qunibi, W.; Winkelmayer, W.C.; Solomon, R.; Moustafa, M.; Kessler, P.; Ho, C.H.; Greenberg, J.; Diaz-Buxo, J.A. A Randomized, Double-Blind, Placebo-Controlled Trial of Calcium Acetate on Serum Phosphorus Concentrations in Patients with Advanced Non-Dialysis-Dependent Chronic Kidney Disease. BMC Nephrol. 2011, 12, 9. [Google Scholar] [CrossRef]
- Hasan, K.M.M.; Tamanna, N.; Haque, M.A. Biochemical and Histopathological Profiling of Wistar Rat Treated with Brassica Napus as a Supplementary Feed. Food Sci. Hum. Wellness 2018, 7, 77–82. [Google Scholar] [CrossRef]
- Kollenkirchen, U.; Walters, M.R.; Fox, J. Plasma Ca Influences Vitamin D Metabolite Levels as Rats Develop Vitamin D Deficiency. Am. J. Physiol.-Endocrinol. Metab. 1991, 260, 447–452. [Google Scholar] [CrossRef]
- Bronner, F. Calcium Absorption. In Physiology of the Gastrointestinal Tract, 2nd ed; Raven: New York, NY, USA, 1987; pp. 1419–1435. [Google Scholar]
- Lester, G.E.; VanderWiel, C.J.; Gray, T.K.; Talmage, R.V. Vitamin D Deficiency in Rats with Normal Serum Calcium Concentrations. Proc. Natl. Acad. Sci. USA 1982, 79, 4791–4794. [Google Scholar] [CrossRef] [PubMed]
- Holick, M.F.; Binkley, N.C.; Bischoff-Ferrari, H.A.; Gordon, C.M.; Hanley, D.A.; Heaney, R.P.; Murad, M.H.; Weaver, C.M. Evaluation, Treatment, and Prevention of Vitamin D Deficiency: An Endocrine Society Clinical Practice Guideline. J. Clin. Endocrinol. Metab. 2011, 96, 1911–1930. [Google Scholar] [CrossRef] [PubMed]
- Silver, J.; Naveh-Many, T.; Mayer, H.; Schmelzer, H.J.; Popovtzer, M.M. Regulation by Vitamin D Metabolites of Parathyroid Hormone Gene Transcription In Vivo in the Rat. Am. Soc. Clin. Investig. 1986, 78, 1296–1301. [Google Scholar] [CrossRef] [PubMed]
- Khammissa, R.A.G.; Fourie, J.; Motswaledi, M.H.; Ballyram, R.; Lemmer, J.; Feller, L. The Biological Activities of Vitamin D and Its Receptor in Relation to Calcium and Bone Homeostasis, Cancer, Immune and Cardiovascular Systems, Skin Biology, and Oral Health. BioMed Res. Int. 2018, 2018, 9276380. [Google Scholar] [CrossRef]
- Kumar, R.; Thompson, J.R. The Regulation of Parathyroid Hormone Secretion and Synthesis. J. Am. Soc. Nephrol. 2011, 22, 216–224. [Google Scholar] [CrossRef]
- Mundy, G.R.; Guise, T.A. Hormonal Control of Calcium Homeostasis. Clin. Chem. 1999, 45, 1347–1352. [Google Scholar] [CrossRef]
- Jonas, M.I.; Kuryłowicz, A.; Bartoszewicz, Z.; Lisik, W.; Jonas, M.; Kozniewski, K.; Puzianowska-Kuznicka, M. Vitamin D Receptor Gene Expression in Adipose Tissue of Obese Individuals Is Regulated by MiRNA and Correlates with the Pro-Inflammatory Cytokine Level. Int. J. Mol. Sci. 2019, 20, 5272. [Google Scholar] [CrossRef]
- Yuzbashian, E.; Asghari, G.; Hedayati, M.; Zarkesh, M.; Mirmiran, P.; Khalaj, A. Determinants of Vitamin D Receptor Gene Expression in Visceral and Subcutaneous Adipose Tissue in Non-Obese, Obese, and Morbidly Obese Subjects. J. Steroid Biochem. Mol. Biol. 2019, 187, 82–87. [Google Scholar] [CrossRef]
- Lopes Nobre, J.; Lisboa, P.C.; Peixoto-Silva, N.; Torres Quitete, F.; Carvalho, J.C.; De Oliveira, E. Role of Vitamin D in Adipose Tissue in Obese Rats Programmed by Early Weaning and Post Diet Calcium. Wiley Online Libr. 2016, 60, 810–822. [Google Scholar] [CrossRef]
- Takeyama, K.I.; Kitanaka, S.; Sato, T.; Kobori, M.; Yanagisawa, J.; Kato, S. 25-Hydroxyvitamin D3 1α-Hydroxylase and Vitamin D Synthesis. Science 1997, 277, 1827–1830. [Google Scholar] [CrossRef]
- Oczkowicz, M.; Szymczyk, B.; Świątkiewicz, M.; Furgał-Dzierżuk, I.; Koseniuk, A.; Wierzbicka, A.; Steg, A. Analysis of the Effect of Vitamin D Supplementation and Sex on Vdr, Cyp2r1 and Cyp27b1 Gene Expression in Wistar Rats’ Tissues. J. Steroid Biochem. Mol. Biol. 2021, 212, 105918. [Google Scholar] [CrossRef] [PubMed]
- Simon, R.R.; Phillips, K.M.; Horst, R.L.; Munro, I.C. Vitamin D Mushrooms: Comparison of the Composition of Button Mushrooms (Agaricus bisporus) Treated Postharvest with UVB Light or Sunlight. J. Agric. Food Chem. 2011, 59, 8724–8732. [Google Scholar] [CrossRef] [PubMed]
- European Union. European Union Commission Implementing Regulation (EU 2017/2470 of 20 December 2017 Establishing the Union List of Novel Foods in Accordance with Regulation (EU) 2015/2283 of the European Parliament and of the Council on novel foods. Off. J. Eur. Union 2017, L351, 72–201. Available online: https://eur-lex.europa.eu/legal-content/EN/TXT/PDF/?uri=CELEX:32017R2470&from=EN“ (accessed on 12 August 2022).
- Pedrali, D.; Gallotti, F.; Proserpio, C.; Pagliarini, E.; Lavelli, V. Kinetic Study of Vitamin D2 Degradation in Mushroom Powder to Improve Its Applications in Fortified Foods. LWT 2020, 125, 109248. [Google Scholar] [CrossRef]


| Ingredient | Concentration |
|---|---|
| Carbohydrates | 60% |
| Fat | 7% |
| Protein | 18% |
| Fiber | 5% |
| Ash | 2.5% |
| Calcium | 5 g/Kg |
| Phosphorous | 2.5 g/Kg |
| Vitamin D | 0.00 IU |
| Total energy | 3.85 Kcal/g |
| Primer | Symbol | Sequence 5′ → 3′ |
|---|---|---|
| Vitamin D receptor | VDR | F-TGTTCACCTGTCCCTTCAAT R-CGCTGTACCTCCTCATCTGT |
| Cytochrome P450 2R1 | CYP2R1 | F-CCTTCT’GCTACTACTCGTGC R-GCATGGTCTATCTC’GCCAAA |
| Cytochrome P450 27B1 | CYP27B1 | F-TTTCTCATCTTGGTCAGAGC R-AGAGTGTAGACACAAACACC |
| Glyceraldehyde 3-phosphate dehydrogenase | GAPDH | F-GGGTGTGAACCACGAGAAATA R-AGTTGTCATGGATGACCTTGG |
| Groups | 0th Week | 1st Week | 2nd Week | 3rd Week | 4th Week |
|---|---|---|---|---|---|
| GP-1 | 14.48 ± 2.12 e | 14.69 ± 1.18 e | 11.48 ± 2.12 e | 13.42 ± 1.42 e | 16.14 ± 3.31 e |
| GP-2 | 11.68 ± 1.92 e | 18.93 ± 3.31 d | 31.68 ± 4.92 c | 37.17 ± 4.62 c | 46.00 ± 7.61 b |
| GP-3 | 16.92 ± 0.48 e | 24.56 ± 2.73 d | 36.92 ± 5.48 c | 41.64 ± 8.83 b | 49.96 ± 5.42 b |
| GP-4 | 15.32 ± 1.28 e | 22.05 ± 4.67 e | 35.32 ± 3.28 c | 39.33 ± 3.32 c | 43.62 ± 5.83 b |
| GP-5 | 12.48 ± 2.12 e | 21.69 ± 3.15 d | 33.48 ± 4.12 c | 46.42 ± 6.20 b | 55.14 ± 6.60 ab |
| GP-6 | 14.22 ± 2.49 e | 28.17 ± 4.28 d | 37.48 ± 2.08 c | 55.53 ± 5.42 ab | 66.14 ± 6.32 a |
| Groups | PTH (pg/mL) | Calcium (mg/dL) | Phosphorous (mg/dL) | ALP (U/L) | ||||
|---|---|---|---|---|---|---|---|---|
| 0th Week | 4th Week | 0th Week | 4th Week | 0th Week | 4th Week | 0th Week | 4th Week | |
| GP-1 | 66.69 ± 4.18 a | 69.11 ± 6.11 a | 5.48 ± 2.12 a | 6.78 ± 1.18 a | 1.21 ± 0.12 a | 1.42 ± 0.18 a | 164.14 ± 27.31 b | 157 ± 23.13 b |
| GP-2 | 78.93 ± 5.31 a | 28.85 ± 3.18 b | 5.28 ± 1.92 b | 9.93 ± 1.21 a | 1.17 ± 0.22 b | 3.16 ± 0.78 a | 171.00 ± 36.61 b | 82 ± 13.25 a |
| GP-3 | 74.05 ± 4.67 a | 16.87 ± 2.12 b | 5.32 ± 1.28 b | 10.70 ± 1.48 a | 1.32 ± 0.32 b | 3.34 ± 1.11 a | 182.62 ± 41.83 b | 79 ± 16.18 a |
| GP-4 | 65.56 ± 7.73 a | 28.10 ± 4.23 b | 5.72 ± 0.48 b | 8.50 ± 0.78 a | 1.46 ± 0.23 b | 2.85 ± 0.88 a | 175.96 ± 35.42 b | 65 ± 11.09 a |
| GP-5 | 67.84 ± 6.16 a | 18.94 ± 3.88 b | 6.29 ± 1.15 b | 10.23 ± 2.01 a | 2.11 ± 0.34 b | 3.27 ± 1.18 a | 158.50 ± 14.47 b | 61 ± 15.33 a |
| GP-6 | 72.34 ± 5.98 a | 15.25 ± 5.10 b | 6.04 ± 0.92 b | 10.75 ± 1.85 a | 1.97 ± 0.47 b | 3.78 ± 1.22 a | 168.30 ± 18.17 b | 58 ± 13.18 a |
Publisher’s Note: MDPI stays neutral with regard to jurisdictional claims in published maps and institutional affiliations. |
© 2022 by the authors. Licensee MDPI, Basel, Switzerland. This article is an open access article distributed under the terms and conditions of the Creative Commons Attribution (CC BY) license (https://creativecommons.org/licenses/by/4.0/).
Share and Cite
Malik, M.A.; Jan, Y.; Al-Keridis, L.A.; Haq, A.; Ahmad, J.; Adnan, M.; Alshammari, N.; Ashraf, S.A.; Panda, B.P. Effect of Vitamin-D-Enriched Edible Mushrooms on Vitamin D Status, Bone Health and Expression of CYP2R1, CYP27B1 and VDR Gene in Wistar Rats. J. Fungi 2022, 8, 864. https://doi.org/10.3390/jof8080864
Malik MA, Jan Y, Al-Keridis LA, Haq A, Ahmad J, Adnan M, Alshammari N, Ashraf SA, Panda BP. Effect of Vitamin-D-Enriched Edible Mushrooms on Vitamin D Status, Bone Health and Expression of CYP2R1, CYP27B1 and VDR Gene in Wistar Rats. Journal of Fungi. 2022; 8(8):864. https://doi.org/10.3390/jof8080864
Chicago/Turabian StyleMalik, Muneeb Ahmad, Yasmeena Jan, Lamya Ahmed Al-Keridis, Afrozul Haq, Javed Ahmad, Mohd Adnan, Nawaf Alshammari, Syed Amir Ashraf, and Bibhu Prasad Panda. 2022. "Effect of Vitamin-D-Enriched Edible Mushrooms on Vitamin D Status, Bone Health and Expression of CYP2R1, CYP27B1 and VDR Gene in Wistar Rats" Journal of Fungi 8, no. 8: 864. https://doi.org/10.3390/jof8080864
APA StyleMalik, M. A., Jan, Y., Al-Keridis, L. A., Haq, A., Ahmad, J., Adnan, M., Alshammari, N., Ashraf, S. A., & Panda, B. P. (2022). Effect of Vitamin-D-Enriched Edible Mushrooms on Vitamin D Status, Bone Health and Expression of CYP2R1, CYP27B1 and VDR Gene in Wistar Rats. Journal of Fungi, 8(8), 864. https://doi.org/10.3390/jof8080864