


Abstract
Oxidative stress (OS) is generated by the imbalance between reactive oxygen species (ROS) and antioxidant enzyme activities, such as catalases, superoxide dismutases, and glutathione peroxidases. In the Y. lipolytica genome, three genes encoding catalases (CAT1, CAT2, and CAT3) have been identified; all three genes are transcriptionally active in cells grown under OS conditions. This study aimed to analyze whether the CAT1 and CAT2 genes exhibit a compensatory function that allows maintaining the functionality of the antioxidant response in Y. lipolytica cells lacking the CAT3 gene. The construction of the mutant strain (Ylcat3-Δ) was performed using Double-Joint PCR. OS was induced by the addition of H2O2 [5 mM], ROS production was quantified by fluorescence using 2′,7′-dichlorofluorescein diacetate (DCFH-DA), and gene expression was analyzed by semi-quantitative RT-PCR in both parental (P01a) and mutant (Ylcat3-Δ) strains exposed or not to oxidative conditions. ROS production was lower in P01a cells than in Ylcat3-Δ cells when exposed to H2O2 [5 mM]. Also, under OS conditions, CAT1 gene expression levels decreased in both strains, whereas CAT2 gene expression increased in both types of cells. Under OS, both parental and Ylcat3-Δ strains showed similar growth rate, sensitivity to oxidative conditions and gene expression patterns, and it can be concluded that CAT3 gene deletion does not alter the transcriptional activity of CAT1 and CAT2 genes, suggesting that the compensatory function among the CAT genes of Y. lipolytica may not be limited to the presence/absence of CAT3 gene.
1. Introduction
Biological processes such as breathing, digesting food, metabolizing xenobiotics, and lipoperoxidation produce byproducts such as superoxide radical (O2•−), hydrogen peroxide (H2O2), hydroxyl radicals (•OH), and singlet oxygen (1O2). Such molecules are commonly defined as reactive oxygen species (ROS) [1,2,3,4]. Under physiological conditions, ROS participate in essential cellular signaling pathways; however, when there are ROS accumulation, they can interact with macromolecules (lipids, proteins and nucleic acids) causing cellular damage and contributing to the development of oxidative stress (OS) [5,6,7,8,9]; the lipids of cell membranes can be damaged by an increase in the membrane fluidity and permeability; on the other hand, the protein damage involves the modification of amino acids, peptide chain fragmentation, enzymatic inactivation, electric charge alteration, protein aggregation and proteolysis, and DNA damage involves oxidizing deoxyribose, breaking strand, removing nucleotides, modifying bases, and crosslinking DNA–protein [6]. Free radicals in normal conditions are usually removed by the natural cellular antioxidant system, which is integrated by enzymatic and nonenzymatic molecules. An imbalance between the quantity and activity of these reactive substances and antioxidant mechanisms may cause a condition called oxidative stress (OS), which has been associated with degenerative processes and several diseases [9,10].
In response to OS conditions, organisms activate the synthesis of antioxidant enzymes (catalases, superoxide dismutases, glucose-6-phosphate dehydrogenase, and glutathione peroxidases, among others) and produce metabolites capable of detoxifying ROS [3,11]. Among all antioxidant enzymes, catalases are present in almost all aerobic organisms; they break down hydrogen peroxide into oxygen and water [12]. Increased catalase activity has been reported in yeast cells under OS conditions, suggesting that catalases play a preponderant role in yeast adaptation to OS [2,11,12,13,14,15,16]. Some yeast species possess two or more genes encoding catalase enzymes [17], whereas other species, such as Candida glabrata, contain only a single catalase-encoding gene, and it has been demonstrated that the lack of this enzyme (cta1-Δ) showed an alteration in their growth rate under OS conditions [18].
The Yarrowia lipolytica genome contains three CAT genes (identified by in silico analysis), and we hypothesized that the presence of the three genes encoding catalases allows it to maintain antioxidant activity when one CAT gene is lost. Previously, in our laboratory, we analyzed the transcriptional response of antioxidant defense genes in Y. lipolytica cells exposed to oxidative conditions induced by H2O2 [5 mM]. All genes reached maximal expression within the first 15 min; however, CAT3 and SOD showed the highest expression levels, suggesting that the catalase encoded by CAT3 may play an important role in the antioxidant defense system of this dimorphic yeast [19,20,21]. Therefore, to assess whether the absence of the CAT3 gene in Y. lipolytica modifies the capacity of the antioxidant defense system, we generated a CAT3 deletion mutant, assessing and evaluating CAT1 and CAT2 gene expressions and ROS production in cells subjected to normal and oxidative conditions. This study provides insights into the contribution of catalases to the antioxidant response of Y. lipolytica and improves our understanding of genetic redundancy and OS adaptation in yeasts.
2. Materials and Methods
2.1. Microorganisms and Culture Conditions
The Y. lipolytica strain P01a (MAT A, leu 2-270, ura 3-302) was used as a control and as a genetic background for the generation of the mutant strain (Ylcat3-Δ). The E. coli/pCR2.1-TOPO/URA3 strain [22] was used as a source of the URA3 gene, which served as a marker gene, for the replacement of the CAT3 gene ORF in the disruption cassette. Y. lipolytica strains were cultured in a liquid or solid YPD medium (1% yeast extract, 2% peptone, 2% glucose, and 2% agar, when required) or a YNB medium (17 g/L) supplemented with glucose (8 g/L), leucine (0.26 g/L), ammonium sulfate (5 g/L), and agar (8 g/L), when required. For experiments under different conditions, yeast cells in the exponential growth phase were inoculated (initial cell density OD600 = 0.2) in 250 mL Erlenmeyer flasks containing 50 mL of the YPD liquid medium. The E. coli/pCR2.1-TOPO/URA3 strain was cultured in the liquid LB medium supplemented with ampicillin (100 μg/mL).
The yeast and bacterial cultures were incubated at 28 °C or 37 °C, respectively, with shaking (200 rpm) overnight.
2.2. Construction of Disruption Cassette and Ylcat3-Δ Mutant
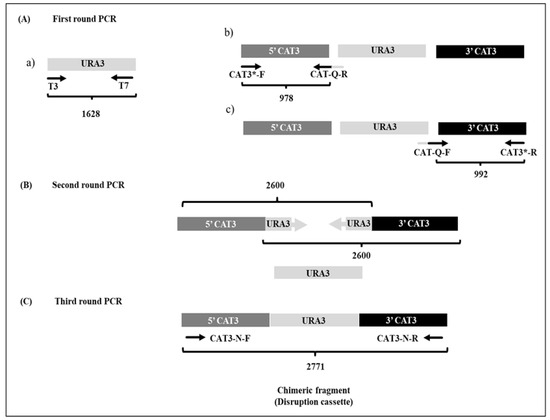
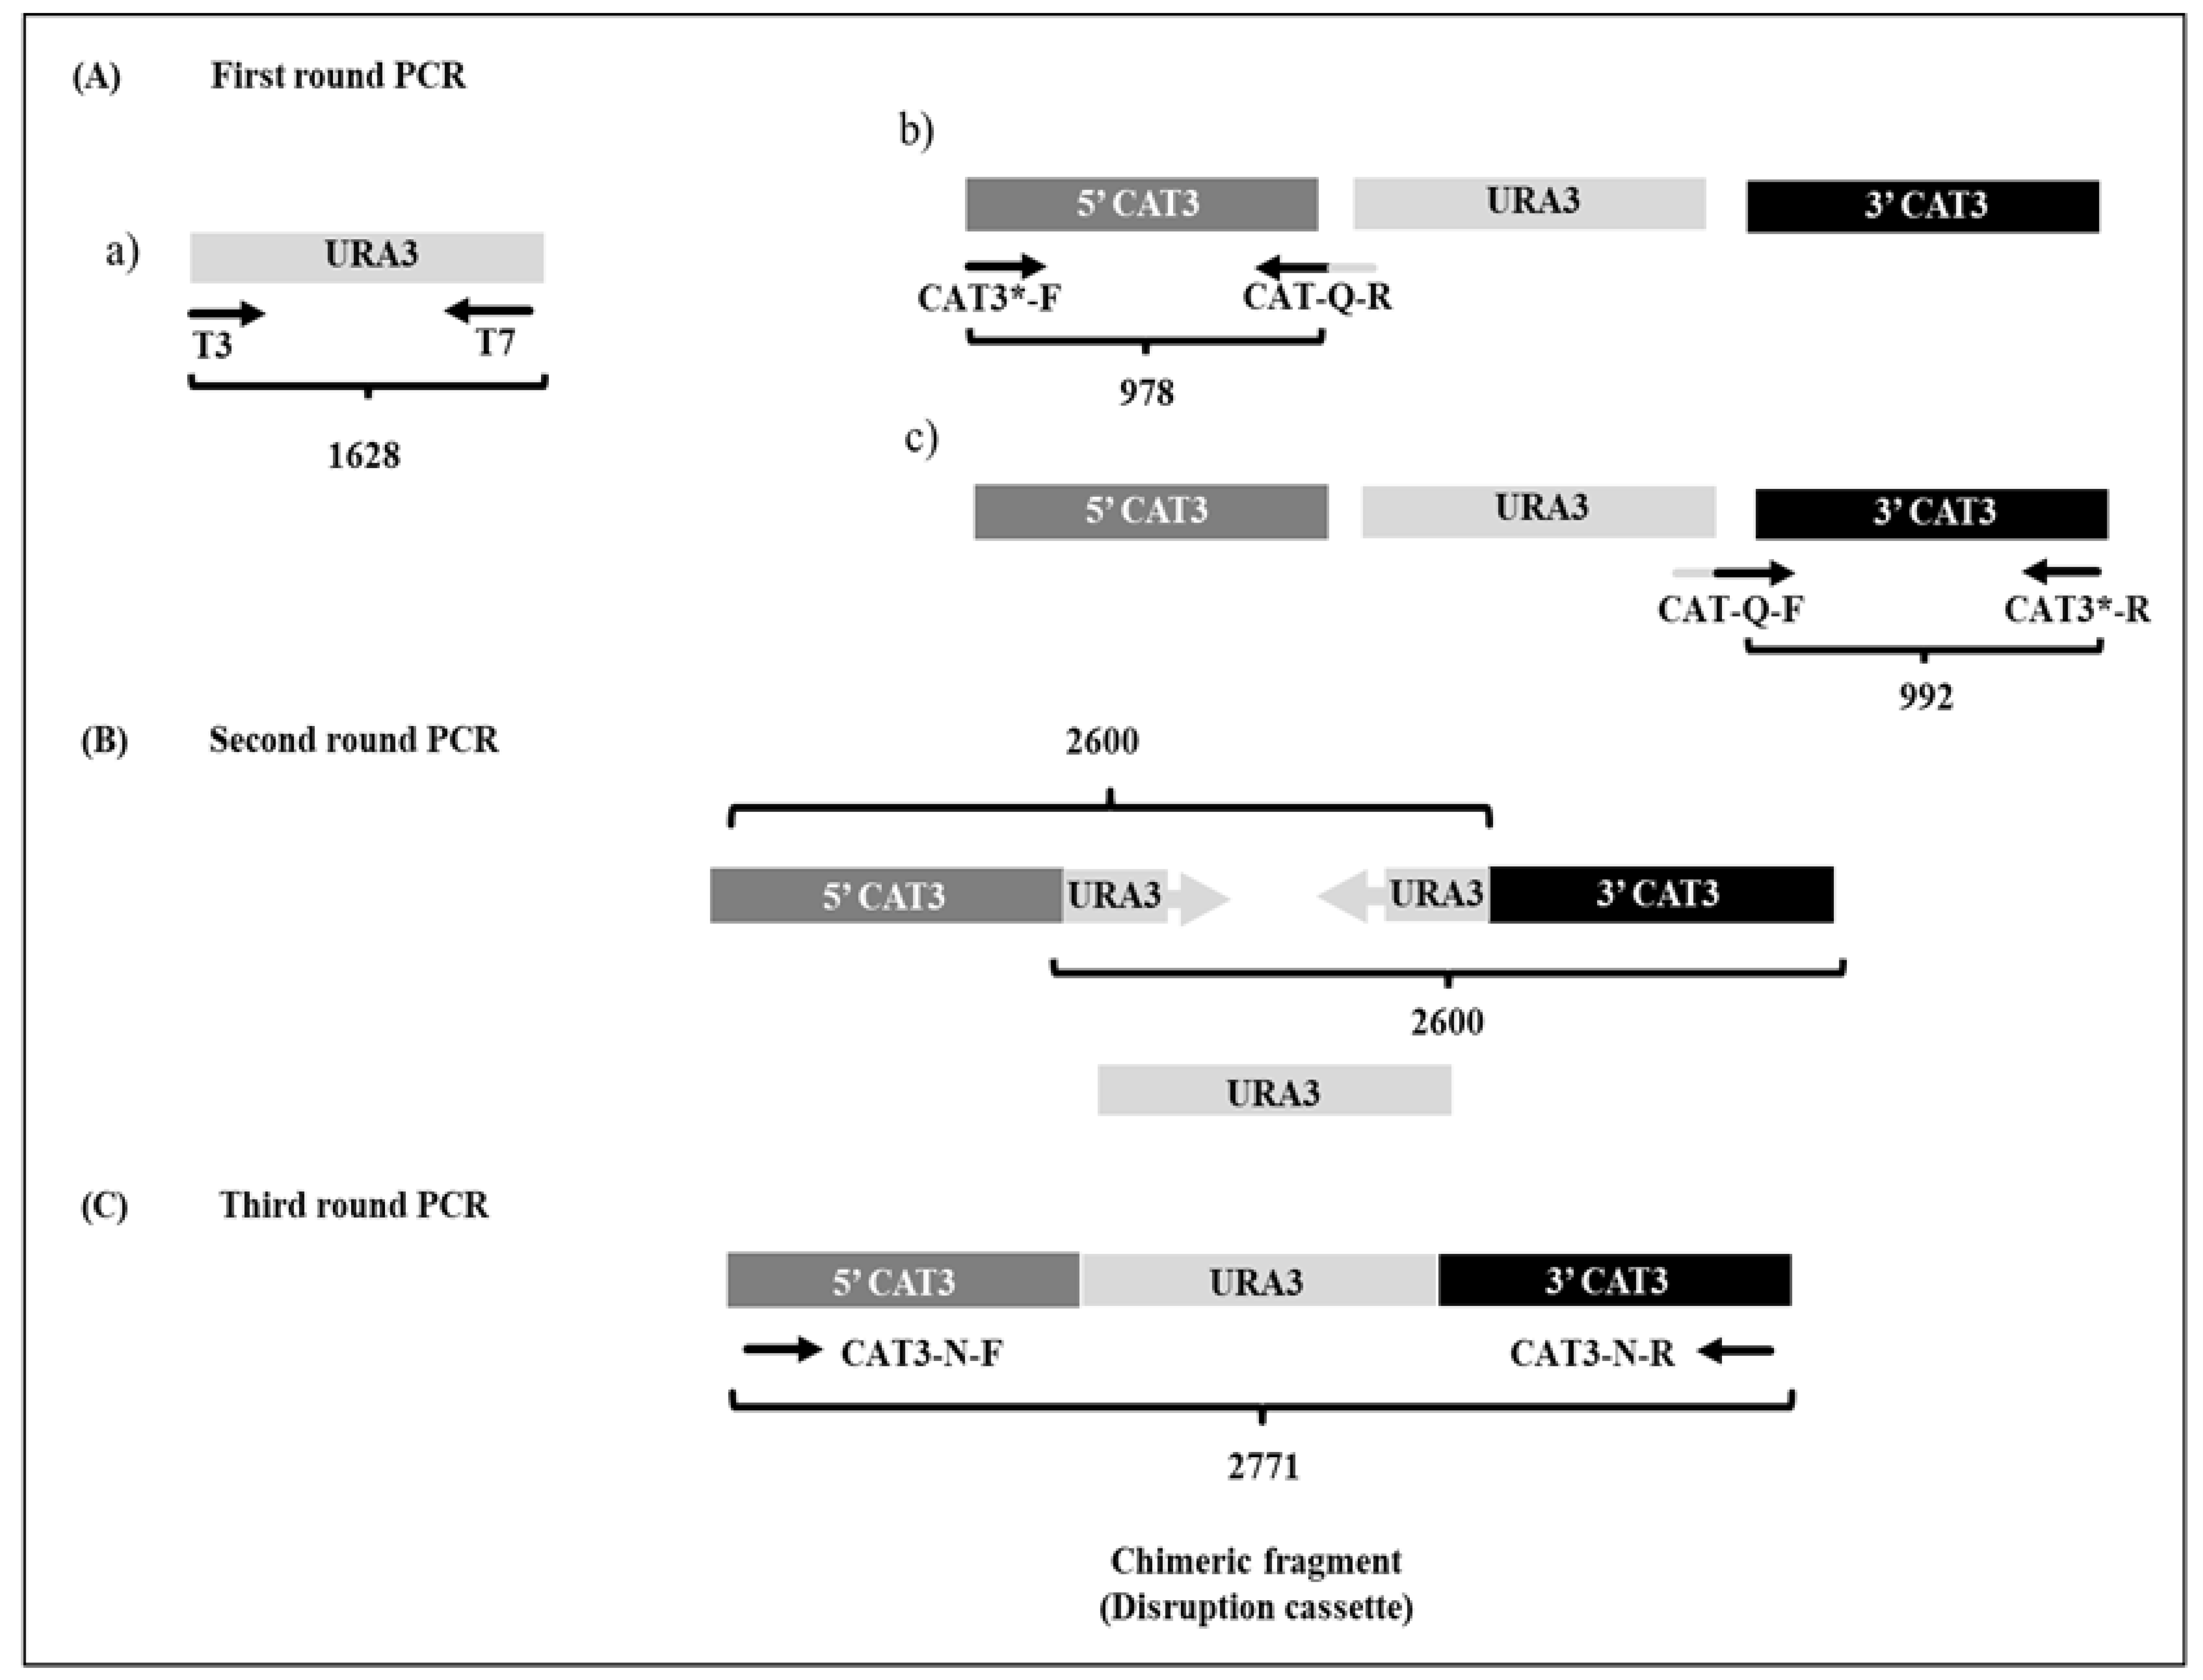
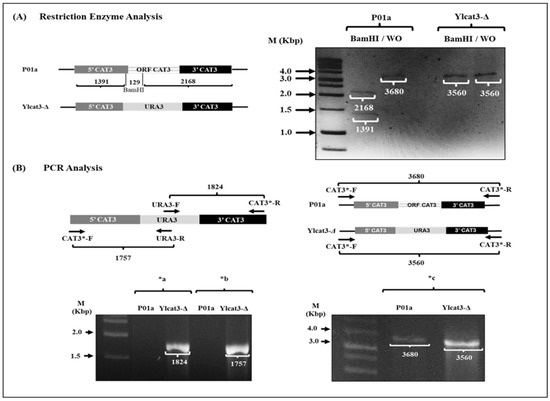
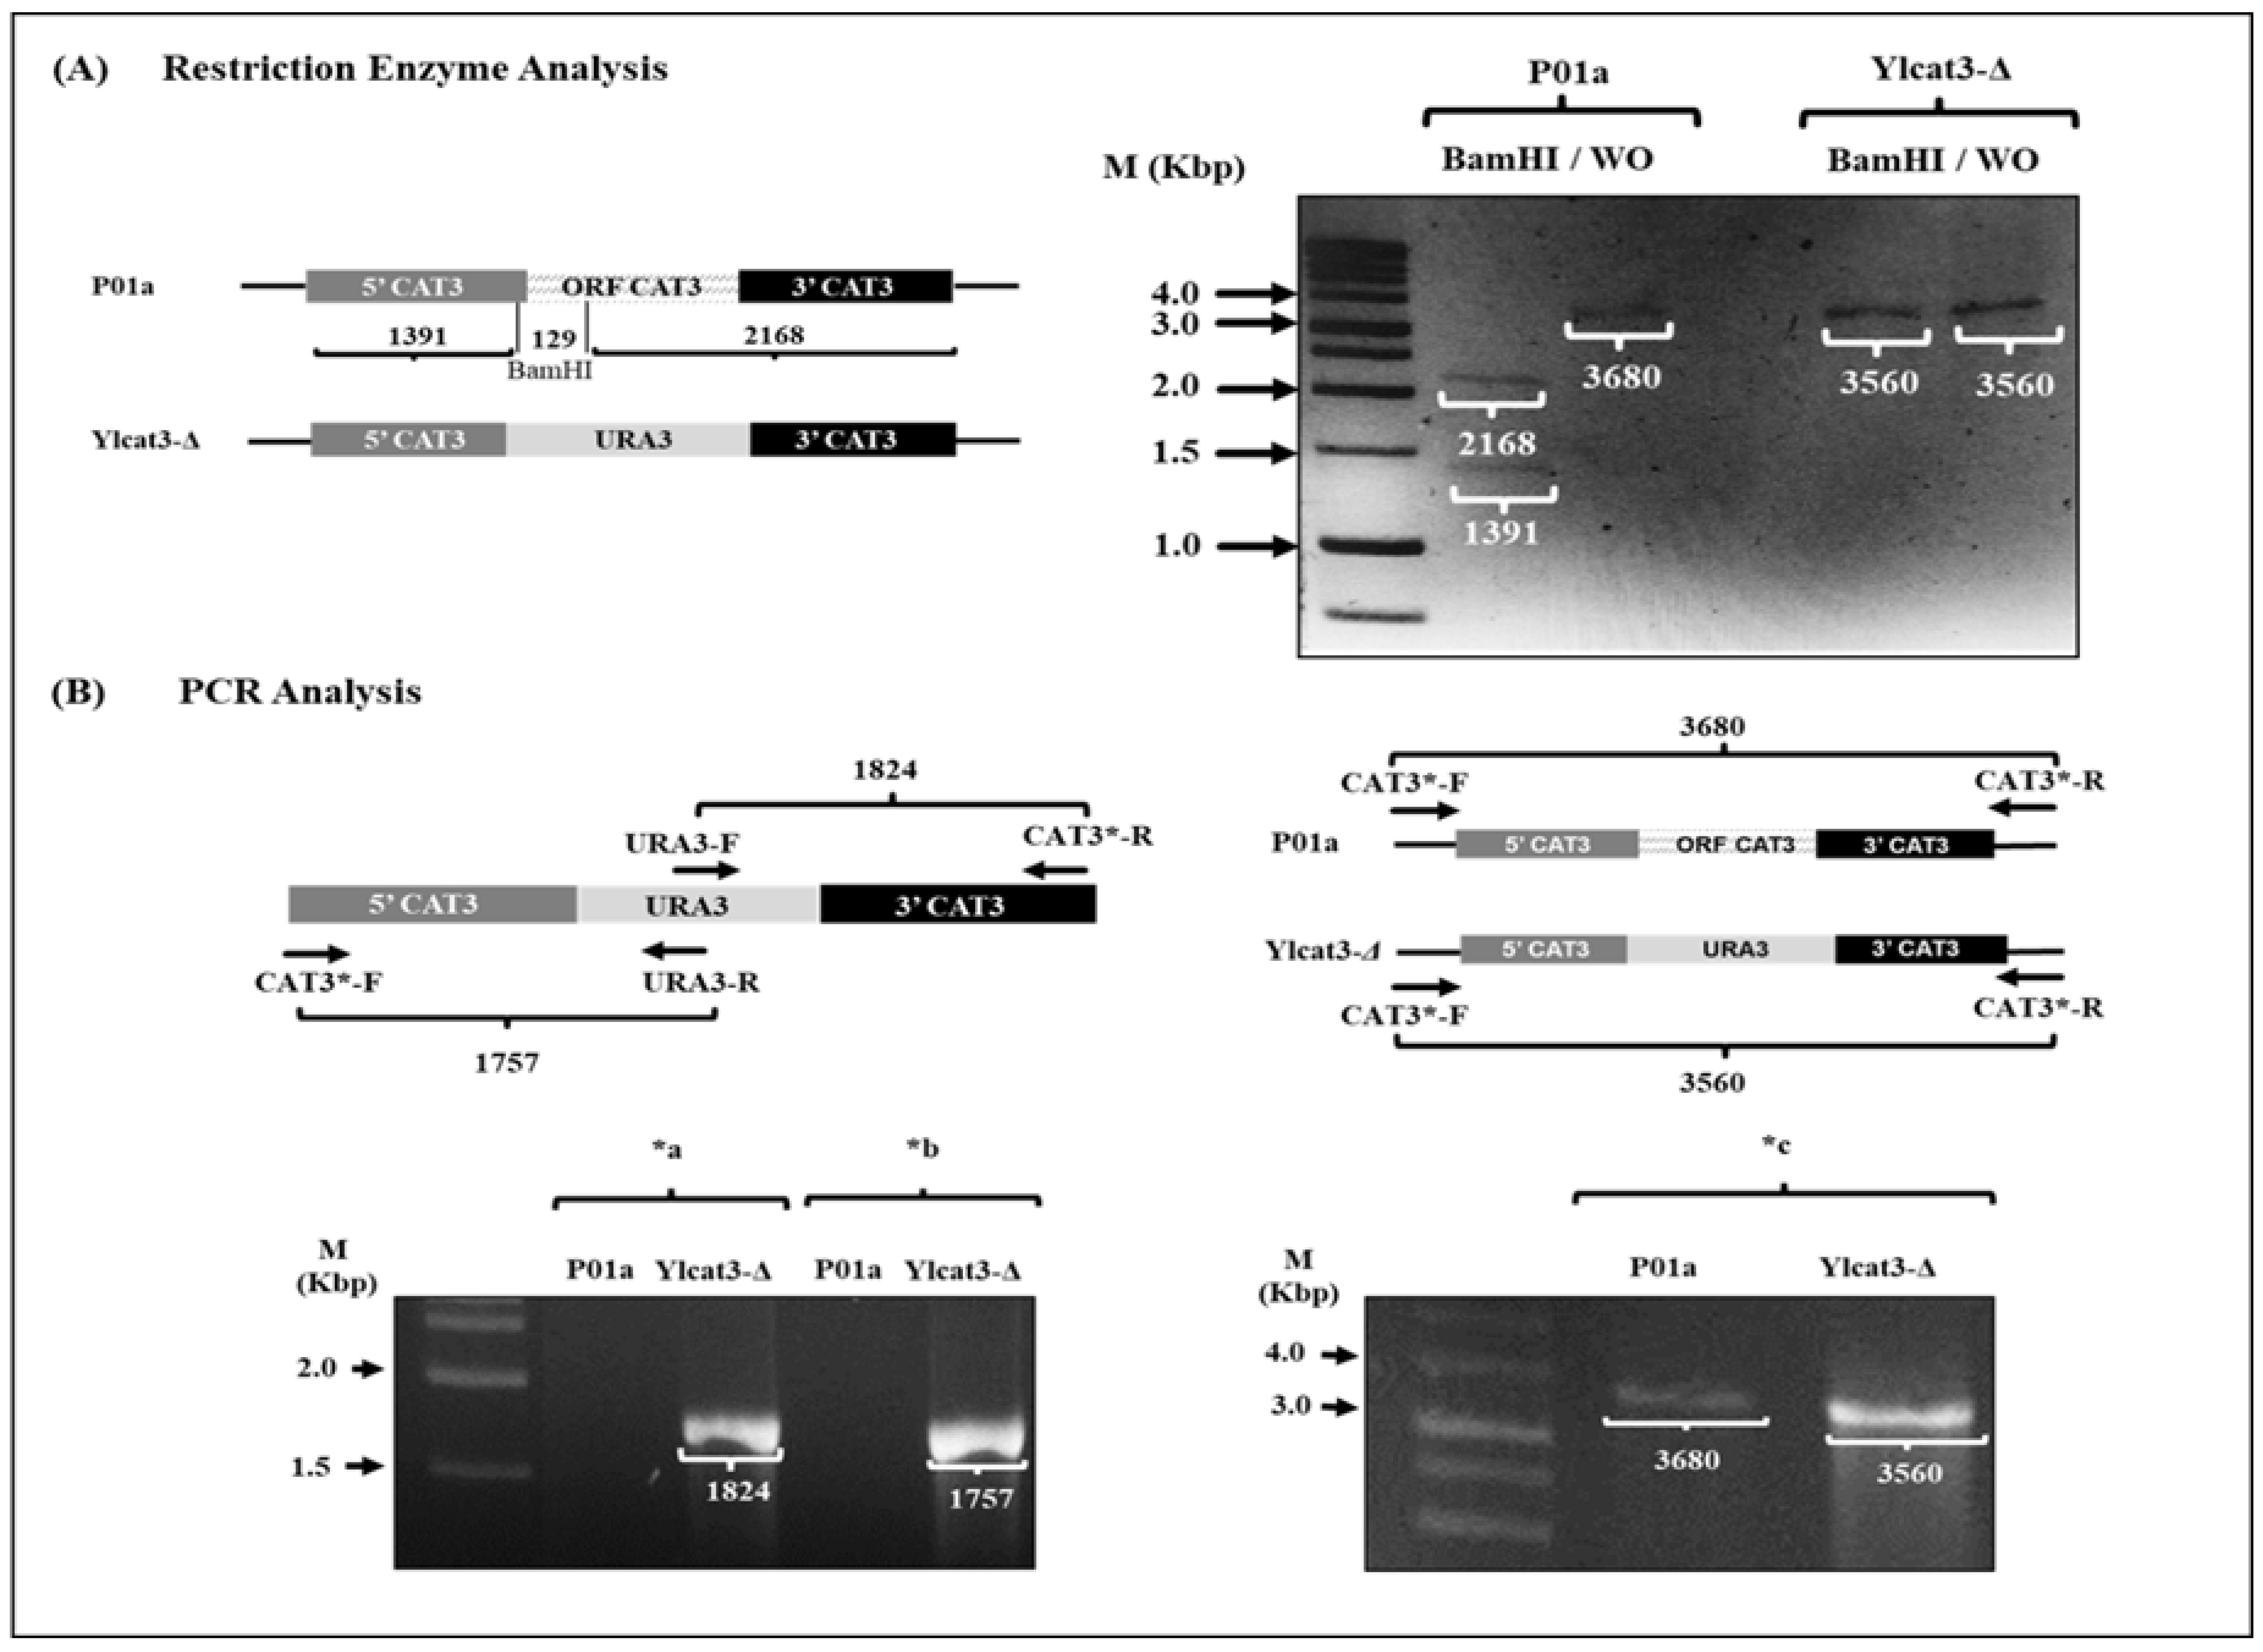
The nucleic acids (DNA and RNA) were isolated from Y. lipolytica cells (P01a strain) after overnight culture, using the glass bead lysis protocol described by Hoffman and Winston, which combines chemical and mechanical methods for cellular lysis [23]. The extraction of plasmid DNA (from E. coli cultures) was performed by the Birnboim method [24]. The nucleic acids were quantified and stored at −20 °C. The Double-Joint PCR (DJ-PCR) technique [25] was used to amplify the disruption cassette for the transformation of Y. lipolytica cells. This procedure was carried out using a set of specific primers/oligonucleotides (Table 1) and PlatinumTM Taq DNA Polymerase, High Fidelity (InvitrogenTM, Waltham, MA, USA). The DJ-PCR involved three PCRs. In the first PCR (Figure 1A), the 5′ and 3′ flanking regions of the CAT3 gene were obtained from the genomic DNA of the parental strain by using chimerical primers (CAT-Q-F: 5′-GAGAGAGAAGCCAAGATACGTGTGTTAGCGTTGTAGT-3′ or CAT-Q-R: 5′-GAGTCAGACATACT-CGTCCTCGGCGTTTCGCTACC-3′) and specific primers (CAT3*-F: 5′-GCTTCCAGTAGTGGCAATATGCGTG-3′ and CAT3*-R: 5′-CATCCTGAGACCATCCTTGTCGG-3′) designed to anneal to the adjacent regions (5′ and 3′) of CAT3 gene ID: YALI0F30987g. The marker URA3 gene (1700 bp) was amplified by PCR using the universal primers T3 and T7 (InvitrogenTM, Waltham, MA, USA) from plasmid DNA obtained from the E. coli/pCR2.1-TOPO/URA3 strain. In the second PCR (Figure 1B), the products obtained from the first PCR, corresponding to the 5′ and 3′ regions and the URA3 gene, were used both as primers and templates, respectively. In the third PCR (Figure 1C), the specifically designed “nested primers” (CAT3-N-F: 5′-GTCCGTCCT-CGCTCTAACACGTTG-3′ and CAT3-N-R: 5′-GGTCTTTCGCTTGGGCTTGATACG-3′) and products from the second PCR were used as primers and the template, respectively. The PCR products were visualized by agarose gel electrophoresis and purified using organic extraction following standard methods [26]. To generate the Y. lipolytica mutant cells, the disruption cassette (2771 bp, corresponding to the PCR product amplified with “nested primers”; Figure 1C) was purified and inserted into the genome of lithium-competent Y. lipolytica cells by electroporation, following the protocol described by Wang et al. [27]. Mutant cell candidates were selected based on their growth capacity in a selective medium (YNB plus leucine, without uracil). Additionally, restriction enzyme (BamHI) and PCR analyses were performed using primers designed to the ORF of the URA3 gene and adjacent non-handled regions of the CAT3 gene (Figure 2).
Table 1.
Oligonucleotides used in this work.
Figure 1.
Scheme of the disruption cassette construction. (A) First-round PCR: (a) amplification of the URA3 gene marker with universal primers T3 and T7, and amplification of the 5′ and 3′ regions ((b) and (c), respectively) of the CAT3 gene with the chimeric and specific primers. (B) Second-round PCR: overlap extension PCR with the amplified fragments from the first-round PCR. (C) Third-round PCR: amplification of the disruption cassette (CAT3-URA3-CAT3) from the products of the second reaction; the disruption cassette was amplified with the nested primers (F and R). In each PCR, the size of the obtained products is represented in base pairs (bp).
Figure 2.
Genotypic analysis of mutant Ylcat3-Δ strain. (A) Schematic representation and restriction pattern (BamHI enzyme) in the Ylcat3-Δ and parental strains. Experimental analysis of enzymatic restriction products in the parental (lanes 1 and 2) and mutant (lanes 3 and 4) strains. The molecular weight marker (M; 1 kilobase pairs (Kbp)) was used to identify the size of bands produced by digestion. BamH1/WO: enzymatic digestion with BamH1/without digestion. (B) Genotypic analysis by PCR; the URA3 gene insertion at the locus corresponding to the CAT3 gene was determined. In bottom (B), *a, *b, and *c correspond to PCR products obtained with different primer combinations as indicated at the top of (B).
2.3. Oxidative Stress Induction, Cell Growth, Sensitivity and ROS Quantification
The OS induction was achieved by exposure to hydrogen peroxide [5 mM]; to test the effect of CAT3 gene deletion (mutant strain Ylcat3-Δ) on cell growth, we analyzed and compared its growth (OD600) with that of the parental (P01a) strain in the presence or absence of H2O2 [5 mM] at different times (24–120 h). The cultures in YPD medium were incubated at 28 °C with orbital shaking (200 rpm), and the results were documented by measuring OD600 every 24 h until 120 h of incubation.
Additionally, the sensitivity of the mutant strain was compared with that of the parental strain using serial dilutions of cultures grown in YPD and YPD + H2O2. Both the parental (P01a) and mutant (Ylcat3-Δ) strains were tested at different H2O2 concentrations [0, 1, 3, 4.5, 5 and 10 mM]. Briefly, using the plate serial dilution spotting method as described by Sherman (2002) [28], 3 μL from each dilution was spotted onto YPD agar plates containing different concentrations of the oxidizing agent and incubated for 24 to 72 h at 28 °C in the dark.
The addition of H2O2 [5 mM] reduced cell growth, but it did not produce a lethal effect in either strain, as previously reported for the P01a strain [19,29]. To document the results, photographs were taken every 24 h with a photodocumentation system (GelDoc-It Imaging System, UVP).
The ROS quantification was performed using the fluorogenic probe 2,7′-dichlorofluorescein diacetate (DCFH-DA; Sigma-Aldrich, St. Louis, MO, USA). Briefly, Y. lipolytica cells in the logarithmic phase corresponding to the parental and mutant strains were cultured under OS conditions (YPD medium supplemented with H2O2 [5 mM]) at 28 °C for 15 min. After treatment, the culture optical density (OD600) was determined and adjusted to 1.0 with MilliQ H2O (5 mL final volume); then, cells were collected by centrifugation (12,000× g/3 min/TA; microcentrifuge 5415D; Eppendorf®, Hamburg, Germany) and exposed to a solution of DMSO/PBS/DCFH-DA [1 mM] or DMSO/PBS (control group, without fluorophore). The cells were incubated for 1 h in the dark, washed twice with PBS, suspended in 1.2 mL PBS buffer, and 200 µL/well was placed into a 96-well plate. The fluorescence was measured using a fluorimeter (Fluoroskan Ascent FL, Thermo Fisher Scientific; Waltham, MA, USA) with excitation/emission wavelengths of 485/538 nm, respectively. Measurements of fluorescence were performed in quadruplicate. The Relative Fluorescence Units (RFUs) were estimated by subtracting the fluorescence value of the control group (DMSO/PBS) from the fluorescence value of the cells treated with DMSO/PBS/DCFH-DA [1 mM].
2.4. Nucleic Acid Extraction and mRNA Purification
Nucleic acids were isolated from the Y. lipolytica cells (P01a and Ylcat3-Δ mutant strains), as described in Section 2.2, under both oxidative and non-oxidative conditions. To obtain DNA-free RNA for mRNA analysis, DNA was removed from the nucleic acid samples by treatment with DNase I (PureLink, Invitrogen; Waltham, MA, USA), following the manufacturer’s instructions. Briefly, 1000–1500 ng of nucleic acid was incubated with 1 μL (ca. 3 enzymatic units) of the enzyme for 1 h at 37 °C, followed by enzyme inactivation with 1 μL of EDTA [25 mM] at 65 °C for 10 min. The final RNA concentration was determined using a NanoDrop ND-1000 spectrophotometerTM (Thermo Fisher Scientific; Waltham, MA, USA) and adjusted to 100 ng/μL with DEPC–water (diethyl pyrocarbonate–water).
2.5. cDNA Synthesis and Semi-Quantitative RT-PCR
cDNA synthesis was performed using the GoScriptTM Reverse Transcription System (Promega®, Madison, WI, USA) following the manufacturer’s instructions. For RT reactions, 500 ng of purified RNA and oligo dT (0.5 µg) were used. The resulting cDNA was used in semi-quantitative RT-PCR with DNA polymerase (MyTaq, BIOLINE®; Alvinston, ON, Canada) and specific primers designed for each analyzed gene (see Table 1). The constitutive ALG9 gene was used to normalize gene expression levels across all experiments.
2.6. Gene Expression Analysis
The transcriptional analysis of the three CAT genes was performed in both (parental and mutant) strains using semi-quantitative RT-PCR. Polymerase chain reactions (PCRs) were conducted with a conventional methodology [26], using the cDNA obtained by reverse transcription from the mRNA of cells growing in the logarithmic phase cultured with or without oxidative conditions, DNA polymerase, and specific primers for CAT1, CAT2, and CAT3 genes (YALI0E34265g, YALI0E34749g, and YALI0F30987g, respectively), designed to amplify the CAT genes of Y. lipolytica (Table 1).
Before the sample analysis by RT-PCR, several critical parameters were assessed: the number of PCR cycles (which allows the detection of differences in the expression of genes between the analyzed samples). Furthermore, the amount of cDNA used in each reaction was determined. The different numbers of cycles of PCR (15, 20, 22, 25, and 32 cycles) and different amounts of cDNA (50, 100, 200, 500, and 1000 ng) were tested (Figure S1). As a result of these experimental approaches, the PCRs were performed in a Thermocycler (Sprint Thermal Cycler, Thermo Electron Corporation, Waltham, MA, USA), with 500 ng of cDNA and 22 PCR cycles for the expression analysis of each gene. Each PCR cycle for expression analysis was carried out under the following conditions: denaturation, 95 °C, 30 s; annealing, 60 °C, 60 s; extension, 72 °C, 60 s.
The RT-PCR products were resolved by electrophoresis on 2% agarose gels stained with ethidium bromide and visualized using the GelDoc-It Imaging System UVP analyzer (UVP; Uplan, CA, USA). The size of the amplified fragment was determined by comparison with the molecular weight marker (1500 bp Ladder; Hyperladder IV, BIOLINE®, Cincinnati, OH, USA). The bands corresponding to each gene were analyzed by densitometry using the Launch VisionWorks LS software, version number 7.1 (UVP; Uplan, CA, USA). Gene expression levels were calculated for samples under OS and control conditions.
2.7. Phylogenetic Tree Construction
A phylogenetic analysis was conducted to determine the putative location of each catalase encoded by the CAT genes of Y. lipolytica. Multiple sequence alignment and phylogenetic tree construction were performed using the ClustalW program (https://www.genome.jp/tools-bin/clustalw, accesed on 1 April 2025) and MEGA (Molecular Evolutionary Genetics Analysis) software, version 10.1. The nucleotide sequences of genes encoding catalase enzymes from yeasts, including Saccharomyces cerevisiae, Pichia pastoris, Candida albicans, Candida glabrata, and Y. lipolytica, were obtained from the NCBI (https://www.ncbi.nlm.nih.gov, accesed on 1 April 2025) and KEGG (https://www.genome.jp/kegg/, accesed on 1 April 2025 databases.
2.8. Statistical Analysis
All experiments were performed in triplicate or quadruplicate. Data normality was assessed using the Shapiro–Wilk test, and the homogeneity of variances was evaluated using Levene’s test. Intracellular ROS levels following acute H2O2 exposure (15 min) and CAT gene expression levels were compared between strains and treatments. When data presented a normal distribution, statistical comparisons were performed using one-way ANOVA followed by Tukey’s post hoc test, whereas the Kruskal–Wallis test was applied for non-normally distributed data. In addition, repeated-measures ANOVA with Bonferroni correction was used, when appropriate, to evaluate differences in the growth rate between the parental and Ylcat3-Δ strains, both in the presence or absence of H2O2. Data are presented as mean ± standard deviation or median and interquartile range, as appropriate. Statistical analyses were performed using IBM SPSS Statistics® version 22.0. Statistical significance was set at p < 0.05.
3. Results
3.1. Construction and Analysis of Ylcat3 Mutant
The Ylcat3-Δ strain was constructed with the Double-Joint PCR technique. Table 1 shows the primers used for the generation of mutant cells and for the gene expression analysis. Figure 1 depicts the strategy used for the construction of the disruption cassette, which was inserted into the genome of Y. lipolytica cells (for description see Section 2.2).
The genotypic characterization of putative mutant cells was performed using both restriction enzyme and PCR analyses (Figure 2). In silico restriction analysis with the BamH1 enzyme showed two restriction sites in the CAT3 gene locus (present in the P01a strain), and no restriction sites were found in the disruption cassette inserted in the Ylcat3-Δ strain (with the CAT3 gene deleted). Experimental analysis (using BamH1) corroborated the absence of the disruption cassette in the P01a strain and the band of the disruption cassette (2771 bp) in the genome of cells from the Ylcat3-Δ strain (Figure 2A). PCR analyses using different combinations of primers (shown at the top of Figure 2B) identified the presence of the disruption cassette containing the marker gene (URA3) in the genome of Ylcat3-Δ mutant cells (bottom of Figure 2B) and its absence in cells of the P01a strain.
3.2. CAT3 Deletion Does Not Modify Cell Growth or Susceptibility of Y. lipolytica Cells Exposed to Oxidative Conditions
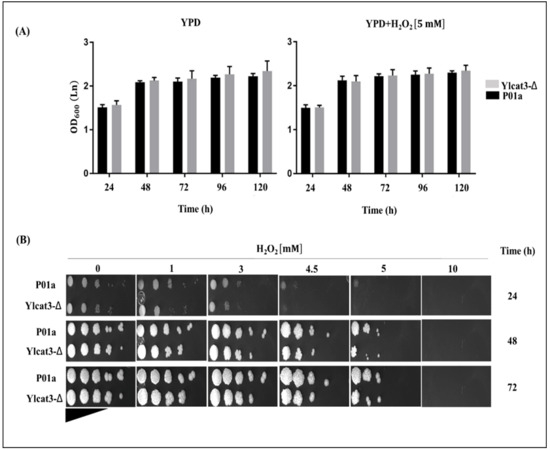
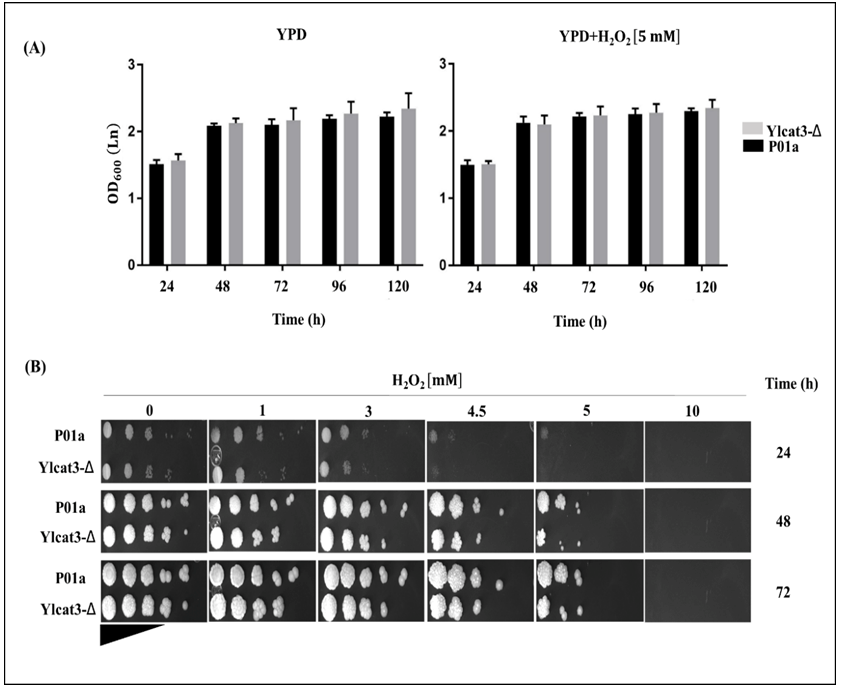
The performed analysis showed that the deletion of the CAT3 gene does not modify the growth of the mutant cells (strain Ylcat3-Δ) on the YPD medium with or without the addition of the oxidizing agent (Figure 3A); the growth of the mutant strain was similar to that of the P01a strain [19,29]. No significant differences were observed in the growth of both strains (p < 0.05) at 24, 48, 72, 96, and 120 h in the presence or the absence of oxidative conditions. The qualitative susceptibility analysis using the plate serial dilutions showed that 10 mM of H2O2 is lethal for both strains, as no growth was observed after 72 h of incubation; however, both 4.5 and 5 mM H2O2 showed an inhibitory effect on the growth of both strains (Figure 3B). Based on these results, we decided to use 5 mM of H2O2 for the remaining experiments in this study.
Figure 3.
Effect of H2O2 on the growth and susceptibility of the mutant strain Ylcat3-Δ. (A) Comparative growth analysis of the mutant strain Ylcat3-Δ and the parental strain P01a cultured in YPD medium and YPD supplemented with H2O2 [5 mM] during 24–120 h at 28 °C. Each column represents the mean ± standard deviation of the OD600 measurements in cultures of both strains. Statistical analysis was performed using repeated-measures ANOVA with Bonferroni correction. Data represents the average of three independent experiments. (B) Comparative analysis of the sensitivity to oxidative conditions of mutant strains Ylcat3-Δ and P01a in the YPD medium supplemented with different concentrations of the oxidizing agent. Cultures of both strains in the logarithmic growth phase (YPD medium, 28 °C, 20 h, 200 rpm) were performed, and serial dilutions (1:10) were prepared. From each culture, OD600 was adjusted to 1.0, and 3 µL of each dilution was spotted onto YPD plates with or without H2O2. Plates were incubated at 28 °C for different times, and photographs were taken every 24 h.
3.3. CAT3 Deletion Modifies the ROS Production in Y. lipolytica Cells Exposed to Oxidative Conditions
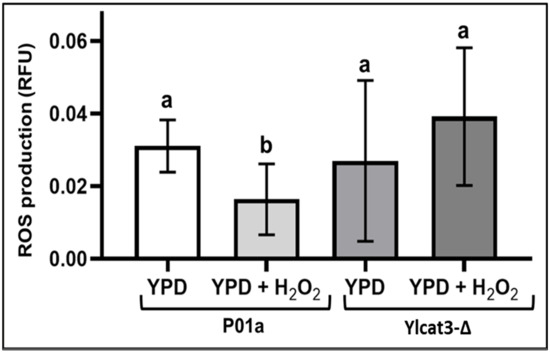
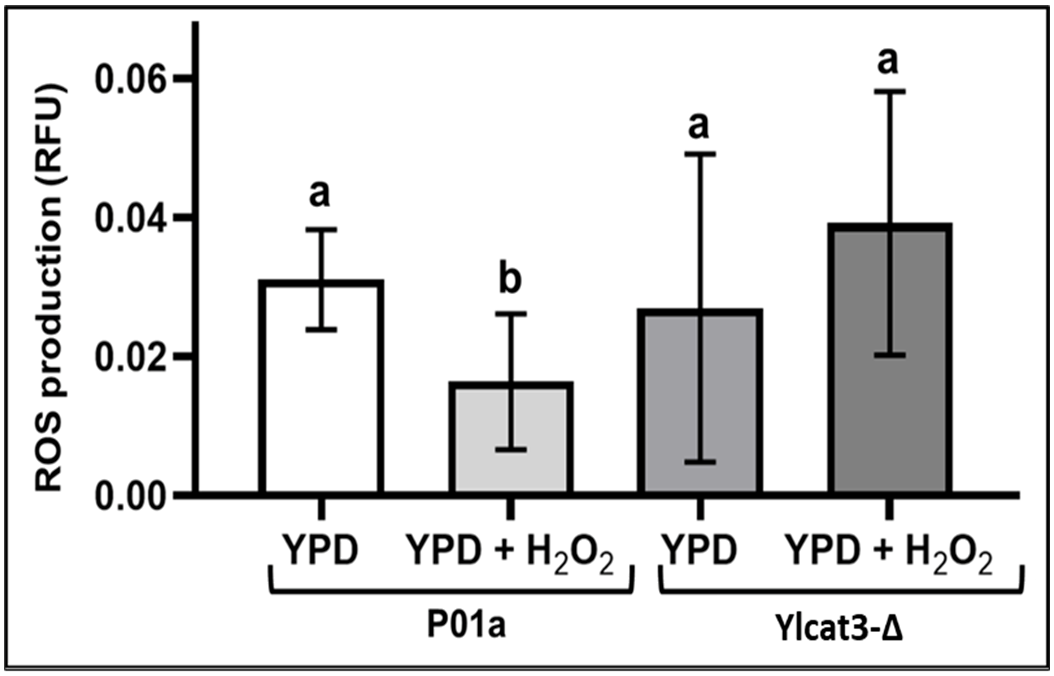
ROS levels were analyzed in parental and mutant strains in the presence or absence of H2O2 [5 mM] (Figure 4). Intracellular ROS levels were determined using the fluorescent probe DCFH-DA. Exposure to H2O2 significantly decreased ROS production in the parental strain. On the other hand, in the cells of the mutant strain exposed to H2O2, the ROS production showed an increase compared with their non-exposed counterparts, although the observed differences were not significant, an approximately 2.3-fold increase was observed. Also, comparison between cells (from parental and mutant strains) exposed to oxidative conditions showed a lower ROS production (p < 0.05) in the parental cells. For instance, ROS production or accumulation was greater in the cells lacking the CAT3 gene.
Figure 4.
Comparison of ROS production in the P01a and Ylcat3-Δ strains of Y. lipolytica, exposed or not to H2O2 [5 mM]. Data is presented as medians and interquartile ranges from nine replicates across three independent experiments. Different letters indicate significant differences between groups according to the Kruskal–Wallis test (p < 0.05). RFU: Relative Fluorescence Units. ROS: reactive oxygen species. P01a: parental strain. Ylcat3-Δ: mutant strain.
3.4. CAT3 Deletion Does Not Modify the Expression Pattern of the Other CAT Genes
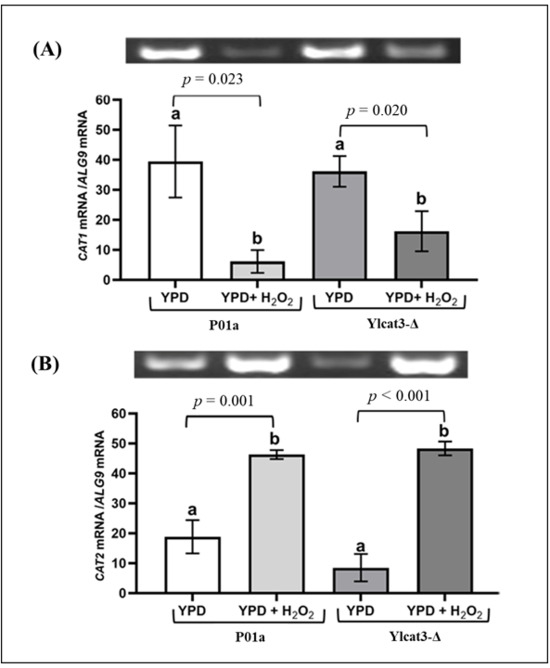
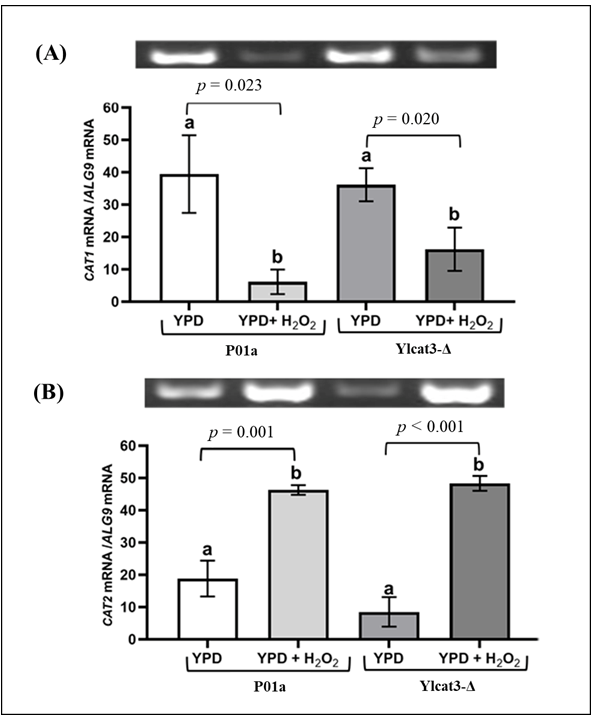
For the gene expression analysis, the RT-PCR products were separated by agarose gel electrophoresis and quantified by densitometry. The changes in the expression levels of the different CAT genes in both P01a and Ylcat3-Δ strains were calculated and compared. Both parental and mutant strains in normal conditions (YPD without H2O2 [5 mM]) showed a higher CAT1 gene expression than cells exposed to the oxidizing agent. On the other hand, in the presence of H2O2, CAT1 gene expression significantly decreased in both parental (p = 0.023) and mutant (p = 0.020) strains (Figure 5A) compared to non-exposed cells. In contrast, CAT2 gene expression was higher in P01a (p = 0.001) and Ylcat3-Δ (p < 0.000) cells treated with H2O2 than in cells cultured without the oxidant. In both strains, CAT2 gene expression reached similar levels when cells were exposed to H2O2 (Figure 5B).
Figure 5.
CAT1 (A) and CAT2 (B) gene expression in Y. lipolytica cells of parental (P01a) and mutant (Ylcat3-Δ) strains, with and without exposure to H2O2. Expressed values are the mean of nine replicates from three independent experiments; the bar (at the top of each column) represents the standard deviation (SD). A representative image of the products obtained by RT-PCR in each group is shown at the top of the graph. Different letters indicate statistically significant differences (p < 0.05) between groups compared by ANOVA and post hoc Tukey test.
All strains displayed comparable CAT1 expression patterns in the absence of OS. In the presence of H2O2, CAT1 gene expression decreased in both strains. The expression levels of the CAT2 gene increased in both strains in response to H2O2, P01a (p = 0.003), and Ylcat3-Δ (p = 0.011). The CAT3 gene exhibited a similar pattern to CAT2, reaching higher expression levels when cells were exposed to OS conditions. Numeric expression values for each CAT gene are shown in Table 2.
Table 2.
Expression levels of CAT genes in Y. lipolytica with or without OS conditions.
3.5. Phylogenetic Analysis of Y. lipolytica Catalases
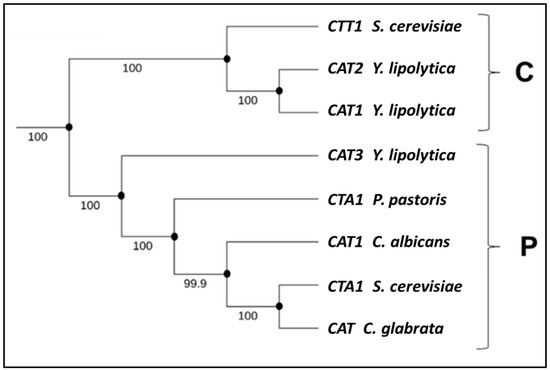
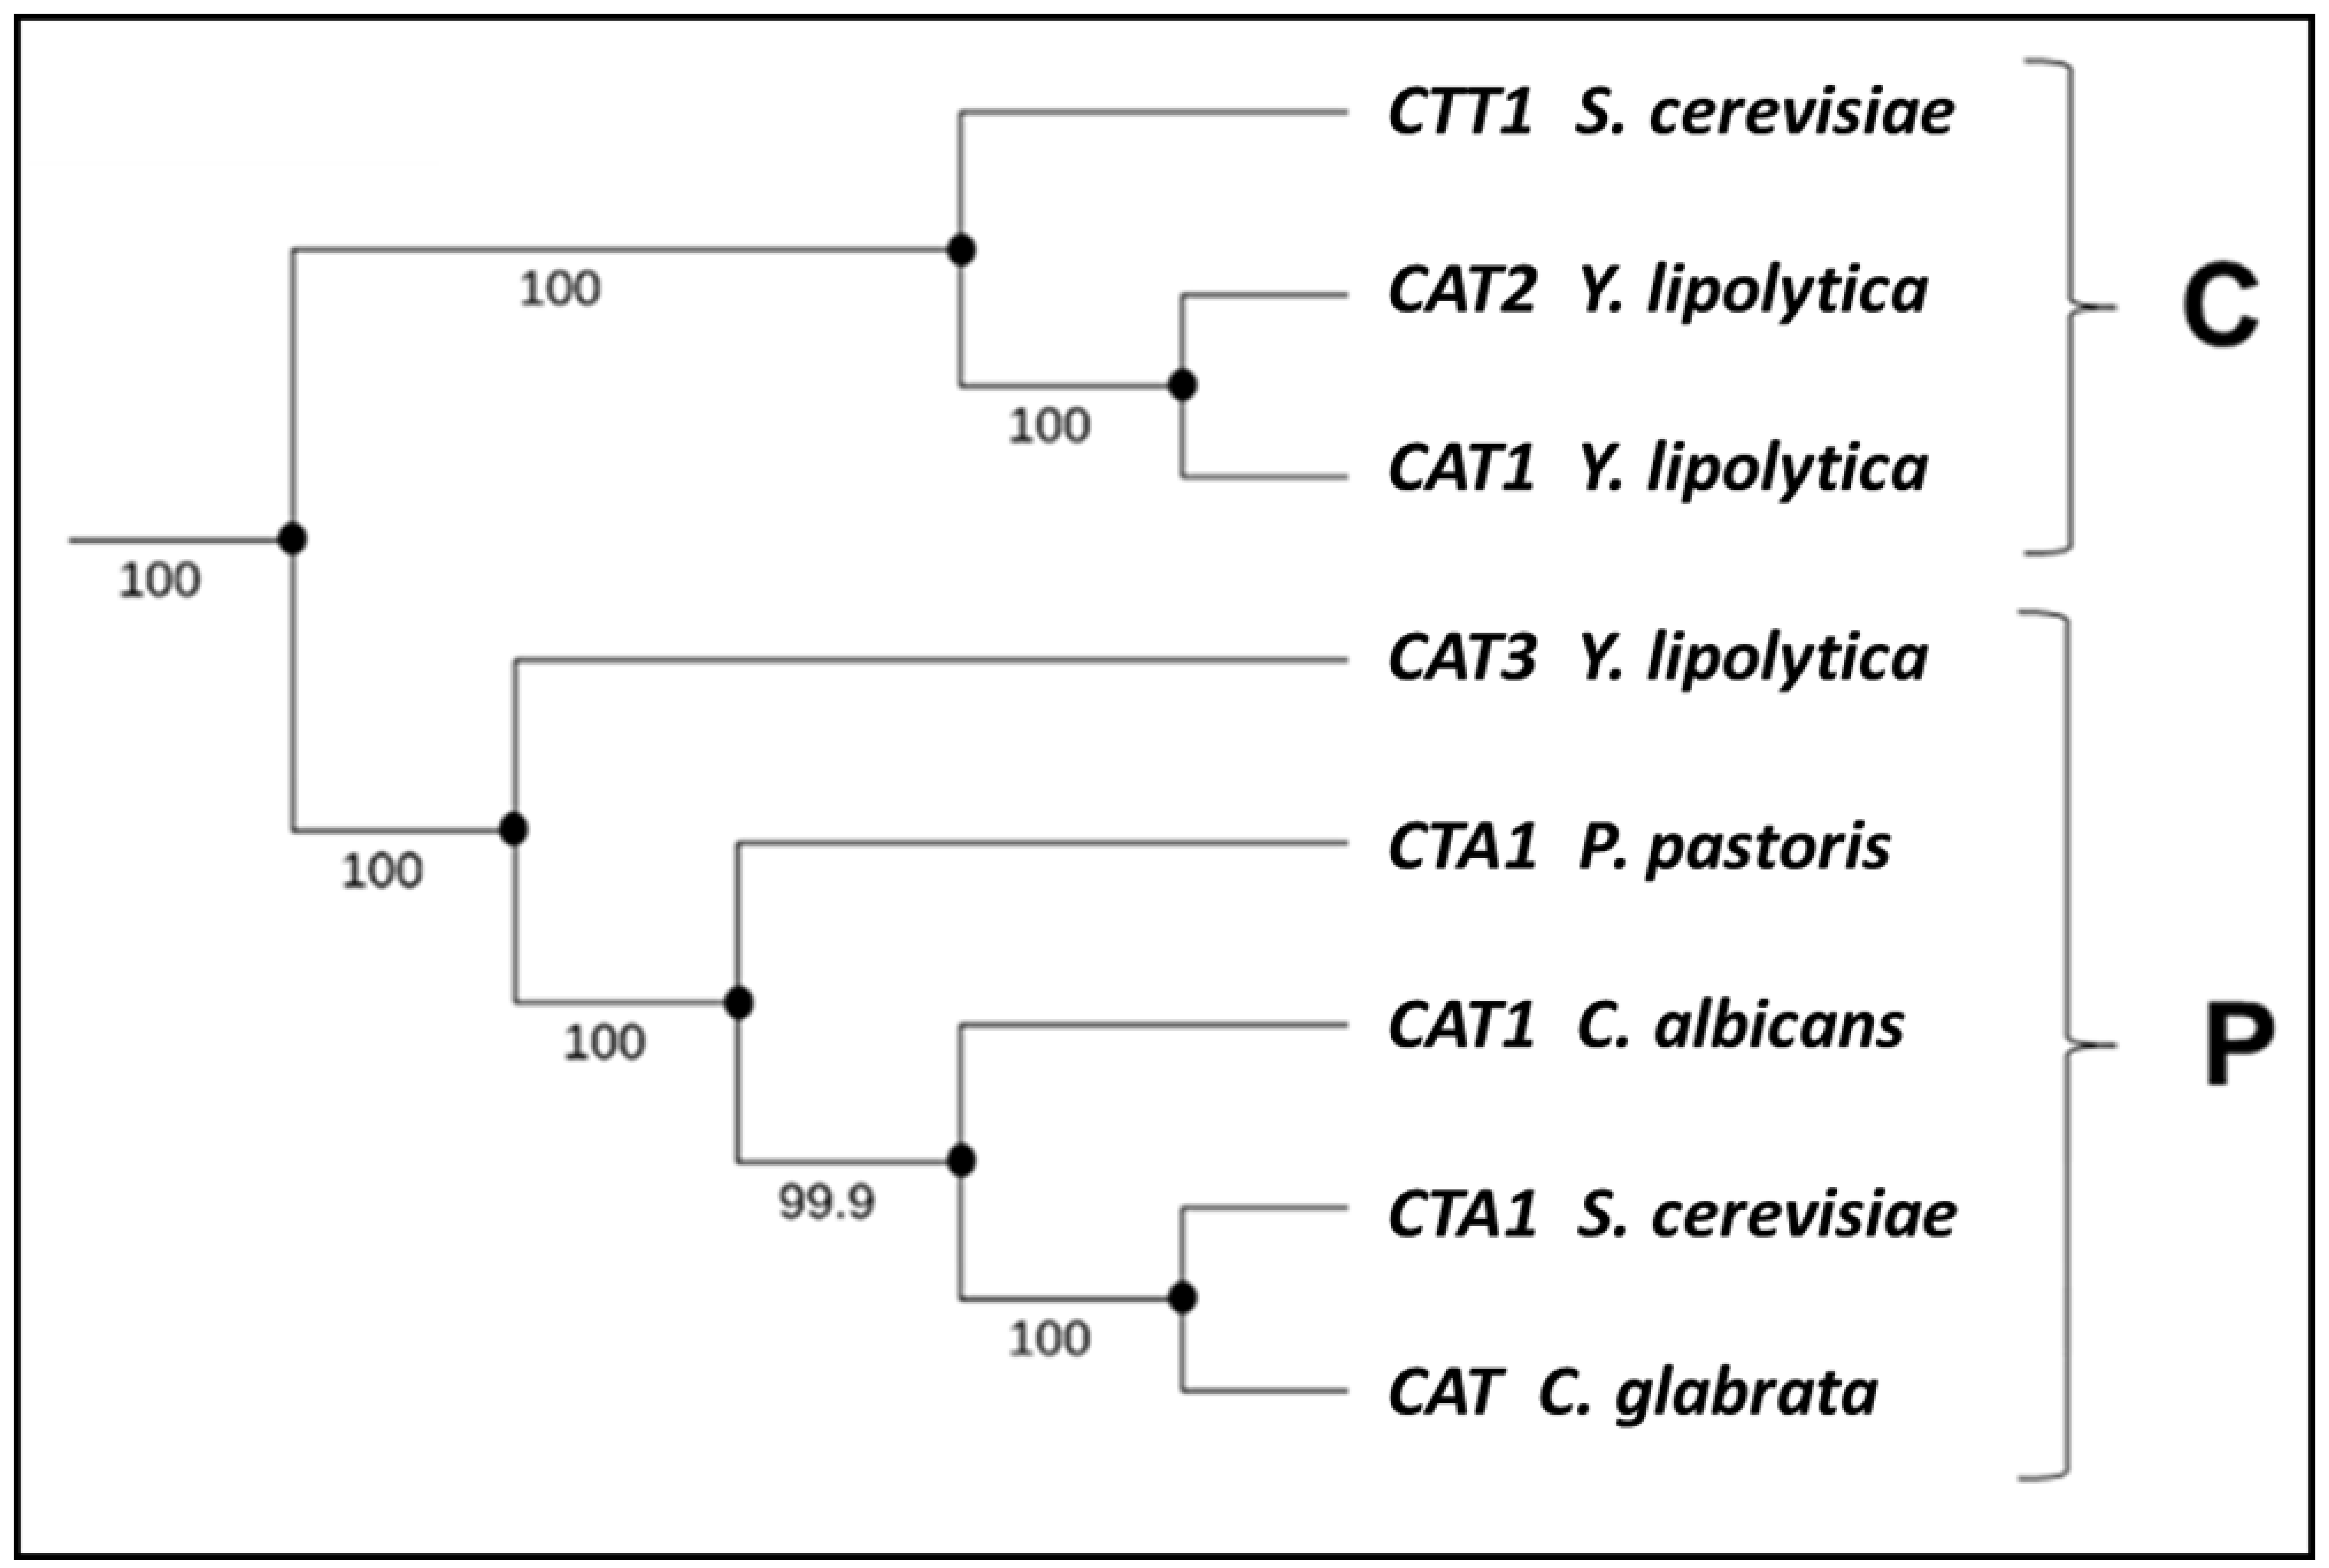
A phylogenetic analysis was performed to compare the nucleotide sequences of the genes encoding catalases in Y. lipolytica and catalase genes from S. cerevisiae, C. albicans, C. glabrata, and P. pastoris. The results revealed the phylogenetic relationship (Figure 6) among the catalase-encoding genes from different analyzed species, showing that the included sequences cluster into two well-defined clades corresponding to cytosolic and peroxisomal catalases.
Figure 6.
Phylogenetic tree of catalases from different yeast species. For the construction, different gene sequences coding for catalases in yeast species (S. cerevisiae: Saccharomyces cerevisiae (CTT1: NC_001139.9, CTA1: NC_001136.10); Y. lipolytica: Yarrowia lipolytica (CAT1: YALI0E34265g, CAT2: YALI0E34749g, CAT3: YALI0F30987g); P. pastoris: Pichia pastoris (CTA1: AB472085.1); C. albicans: Candida albicans (CAT1: CAALFM_C106810WA); C. glabrata: Candida glabrata (CTA1: CAGL0K10868g)) were included. C: cytosolic catalase clade; P: peroxisomal catalase clade. The phylogenetic tree was constructed with MEGA and the ClustalW programs.
In S. cerevisiae, the catalase Cttp1p, encoded by the CTT1 gene, is found in the cytosol [30]. Due to the percentage of identity between CTT1 and sequences corresponding to the CAT1 and CAT2 genes of Y. lipolytica, we have inferred that the enzymes encoded by these genes are found in the cytosol of Y. lipolytica cells (Figure 6).
By contrast, the CAT3 gene of Y. lipolytica clustered on the same branch of the phylogenetic tree as the CTA1 gene, which encodes peroxisomal catalases in both S. cerevisiae and P. pastoris [30,31,32], as well as with the sequence of the gene CAT encoding catalase in C. glabrata, a species reported to possess a single gene coding for this enzyme [18]. Additionally, the CAT3 gene of Y. lipolytica clustered with the CAT1 gene encoding for a catalase of C. albicans, which can be found in both peroxisomes and mitochondria [33].
4. Discussion
Reactive oxygen species (ROS) such as superoxide radical (O2•−), singlet oxygen (1O2), hydroxyl radical (HO•), and hydrogen peroxide (H2O2) are products of cellular metabolism [34]. The physiological levels of ROS are key in various signaling pathways; however, high ROS concentrations may induce OS, leading to cellular damage at both structural and functional levels [35], which contributes to the development of chronic degenerative pathologies [36]. Catalase activity is one of the most common cellular antioxidant defense mechanisms, observed when cells are exposed to oxidizing agents such as H2O2 [30,31,32,33,37].
We showed that P01a and Ylcat3-Δ strains presented similar ROS levels without exposure to the oxidizing agent. Izawa, Inoue, and Kimura (1996) [38] reported that catalases in S. cerevisiae cells might not be important under normal physiological conditions; however, they become essential under “emergency” or “adaptation” to OS. It has been reported that the cellular localization of catalases (peroxisomal or cytosolic) determines susceptibility to H2O2; in S. cerevisiae, catalases A and T (encoded by the CTA1 and CTT1 genes, respectively) can exert compensatory action protecting the cells from OS generated by H2O2, in response to the absence of catalase genes [38,39,40,41,42]. Consistent with our results, the Ylcat3-Δ strain shows no susceptibility to H2O2, given that, in the Y. lipolytica genome, three genes encoding catalase (CAT1, CAT2, and CAT3) could be involved in a compensatory mechanism among catalases encoded by these genes.
The results obtained with the Ylcat3-Δ strain showed that the deletion of the CAT3 gene modifies ROS production when cells are exposed to H2O2-induced oxidative stress. The mutant cells exhibited a notable increase in ROS levels compared with the parental strain (p > 0.05). Our analysis indicates that the parental strain (P01a) showed a higher antioxidant response upon exposure to H2O2, since the ROS values were significantly lower than those generated under normal conditions. Furthermore, our results differ from those reported for S. cerevisiae by Izawa et al. [36]. In our system (Y. lipolytica cells), catalases encoded by the CAT1, CAT2, and CAT3 genes were activated both under OS conditions and in their absence, as observed in the parental strain; however, a different phenomenon was observed in the mutant cells (Ylcat3-Δ), in which ROS production increased upon exposure to the oxidizing agent. These results suggest that, under normal conditions (without OS), the catalase encoded by the CAT3 gene is responsible for the decreased ROS production observed in P01a cells.
Conversely, the antioxidant response of yeast, including catalase activity, has been reported to be influenced by nutrient availability in the culture medium, and it has been suggested that products derived from glucose metabolism could contribute to the repression of catalase activity [30]. In our study, we used only the YPD medium (which used glucose as a carbon source); based on a previous report, it is possible that glucose and/or its metabolic products may repress catalase expression by inhibiting the transcription of CAT genes. In S. cerevisiae cells lacking peroxisomal catalase (encoded by the CTA1 gene), exposure to H2O2 is not lethal compared to cells lacking cytosolic catalase (encoded by the CTT1 gene) [38].
The regulation of gene expression under OS conditions in yeast is more complex than in prokaryotes, as it has been reported that the expression of at least 450 genes is required to maintain cellular resistance to ROS [32,34]. Genetic redundancy is a common feature of living organisms; their genomes have a large proportion (15 to 65%) of duplicated genes [42,43,44]. Duplicate genes have the potential for acquiring novel functions; however, not all gene duplication events result in functional innovation. Notably, about 25% of duplicate genes in yeast are from the whole-genome duplication and encode metabolic enzymes [44,45].
It has been demonstrated, in model organisms, that complete gene inactivation typically has little or no phenotypic effect, mainly due to two mechanisms responsible for such a functional compensation of mutations: genetic redundancy is one of these mechanisms, whereby the deletion of one gene has little effect due to the presence of its duplicate and functionally overlapping paralogous gene [46]. The second mechanism relies on the distributed nature of genetic networks; interactions among genes with unrelated functions also provide functional compensation [47,48]. It has been reported that only the double null mutant of S. cerevisiae lacking both Cta1 and Ctt1 is sensitive to OS, whereas single mutants show no stress-related phenotype [38]. These findings suggest that these activities are functionally redundant, which can be explained by the gene duplication that encodes for catalases in this species.
The phylogenetic analysis showed evidence suggesting that the CAT1 and CAT2 genes of Y. lipolytica encode putative cytosolic catalases, whereas the CAT3 gene encodes a putative peroxisomal catalase. Based on these observations, it is plausible that, as reported for S. cerevisiae [30], P. pastoris [32], C. glabrata [18], and C. albicans [33], the CAT3 gene or peroxisomal catalase deletion in Y. lipolytica cells does not represent a significant defense mechanism against OS generated by H2O2 addition. In support of the above, we observed that CAT3 gene deletion in Y. lipolytica cells did not lead to transcriptional changes in the other CAT genes (CAT1 and CAT2) when cells were exposed to H2O2. In addition, it is important to mention that the genome of Y. lipolytica contains three genes encoding for catalases (CAT1, CAT2 and CAT3); also, another series of genes that are part of this antioxidant response have been identified: one gene encoding superoxide dismutase enzyme (SOD gene), one gene encoding for a copper chaperone for Sod (CCS gene) and one gene encoding for the enzyme glutathione peroxidase (GPX gene). Each of these genes is transcriptionally active in response to OS conditions [21] and may contribute to the compensatory mechanism proposed here.
5. Conclusions
The CAT3 gene deletion in Y. lipolytica cells did not induce changes in the expression levels of CAT1 and CAT2 genes when exposed to H2O2 [5 mM]. These results suggest that, contrary to the hypothesis of this study, the deletion of CAT3 gene in Y. lipolytica cells did not modify the expression of CAT1 and CAT2 genes, and there is no compensatory mechanism of the antioxidant response mediated by CAT genes. However, a slight increase in ROS production was observed when mutant cells were exposed to H2O2.
The parental strain (P01a) showed a greater antioxidant response upon exposure to H2O2, which was not observed in the mutant strain (cells lacking the CAT3 gene), suggesting that the catalase encoded by the CAT3 gene is responsible for the decreased ROS production observed in P01a cells.
Consistent with phylogenetic analysis, the CAT3 gene of Y. lipolytica is predicted to encode a peroxisomal catalase, whereas CAT1 and CAT2 are predicted to encode cytosolic catalases. To our knowledge, this study provides one of the first descriptions of CAT gene expression in Y. lipolytica cells under oxidative conditions.
Supplementary Materials
The following supporting information can be downloaded at: https://www.mdpi.com/article/10.3390/jof12040240/s1, Figure S1: Standardization of parameters for semi-quantitative RT-PCR. (A) Nucleic acids (DNA and RNA) extracted from Y. lipolytica cells using the Hoffman and Winston (1987) protocol [23]; quality was assessed by agarose gel electrophoresis. (B) PCR amplification of nucleic acid samples subjected to different DNase treatments (Tx); genomic DNA (gDNA) was included as a positive PCR control (+). Amplifications were performed using specific CAT2 primers. All DNase Tx. were effective for gDNA removal. (C) Different cDNA concentrations were tested in PCR reactions after the RT step using specific primers for CAT2 gene; PCR product intensity increased with increasing cDNA concentration. (D) Optimization of PCR cycle number using different cDNA quantities. The figure shows representative results obtained with 22 and 30 PCR cycles. Using 22 cycles, clear differences in amplification intensity were observed depending on the amount of cDNA used as template. RT, reverse transcription; PCR, polymerase chain reaction; DNA, deoxyribonucleic acid; RNA, ribonucleic acid; Tx, treatments; DNase, deoxyribonuclease; gDNA, genomic DNA; CAT2, Y. lipolytica CAT2 gene; cDNA, complementary DNA synthesized from mRNA by RT. Figure S2: RT-PCR analysis of catalase genes in Y. lipolytica parental (P01a) and mutant (Ylcat3-Δ) strains under H2O2 stress. Products were amplified from cDNA obtained by RT of parental or mutant cells using forward and reverse primers specific for each gene (described in Table 1). The absence of CAT3 gene amplification in Ylcat3-Δ cells, whether exposed or not to oxidative conditions, confirms that the mutant strain lacks this gene. Numbers correspond to the expected fragment size (bp). YPD: cultures in YPD medium; YPD + H2O2: cultures in YPD supplemented with H2O2 [5 mM].
Author Contributions
Conceptualization E.C.-G.; investigation and data curation C.A.Q.-G., M.V.-G. and E.C.-G.; methodology C.A.Q.-G. and E.C.-G.; validation, formal analysis, and resources, C.A.Q.-G., M.V.-G. and E.C.-G.; writing—original draft preparation, C.A.Q.-G., M.V.-G., M.C.-G., P.R.-G. and E.C.-G.; writing—review and editing, C.A.Q.-G., M.V.-G., M.C.-G., P.R.-G. and E.C.-G.; supervision, E.C.-G.; project administration and funding acquisition, E.C.-G. All authors have read and agreed to the published version of the manuscript.
Funding
This research was supported by the National Council of Science and Technology of México (CONAHCYT) through fellowships to C.A.Q.-G. (No. 412867), M.V.-G. (No. 635877), P.R.-G. (No. 829382), and M.C.-G. (No. 830230); the UANL-PAICYT Program (163-CS-2022-ECG); and the UANL-ProACTI Program (Nos. 10-BQ-2023 and 10-BQ-2024).
Institutional Review Board Statement
Not applicable.
Informed Consent Statement
Not applicable.
Data Availability Statement
The original contributions presented in this study are included in the article/Supplementary Material. Further inquiries can be directed to the corresponding author.
Acknowledgments
The authors thank the institutions that provided the facilities, equipment, and reagents used in this work; the National Council of Science, Humanities and Technology of México (CONAHCYT); the UANL-PAICYT Program; and the UANL-ProACTI Program.
Conflicts of Interest
The authors declare no conflicts of interest.
References
- Sharifi-Rad, M.; Anil Kumar, N.V.; Zucca, P.; Varoni, E.M.; Dini, L.; Panzarini, E.; Rajkovic, J.; Tsouh Fokou, P.V.; Azzini, E.; Peluso, I.; et al. Lifestyle, oxidative stress, and antioxidants: Back and forth in the pathophysiology of chronic diseases. Front. Physiol. 2020, 11, 694. [Google Scholar] [CrossRef] [Scilit] [PubMed]
- Nandi, A.; Yan, L.J.; Jana, C.K.; Das, N. Role of catalase in oxidative stress- and age-associated degenerative diseases. Oxidative Med. Cell. Longev. 2019, 2019, 9613090. [Google Scholar] [CrossRef] [Scilit] [PubMed]
- Bardaweel, S.K.; Gul, M.; Alzweiri, M.; Ishaqat, A.; AL-Salamat, H.A.; Bashatwah, R.M. Reactive oxygen species: The dual role in physiological and pathological conditions of the human body. Eurasian J. Med. 2018, 50, 193–201. [Google Scholar] [CrossRef] [Scilit] [PubMed]
- Pizzino, G.; Irrera, N.; Cucinotta, M.; Pallio, G.; Mannino, F.; Arcoraci, V.; Squadrito, F.; Altavilla, D.; Bitto, A. Oxidative stress: Harms and benefits for human health. Oxid. Med. Cell. Longev. 2017, 2017, 8416763. [Google Scholar] [CrossRef] [Scilit]
- Abdelazim, A.M.; Abomughaid, M.M. Oxidative stress: An overview of past research and future insights. All Life 2024, 17, 2316092. [Google Scholar] [CrossRef] [Scilit]
- Juan, C.A.; Pérez de la Lastra, J.M.; Plou, F.J.; Pérez-Lebeña, E. The chemistry of reactive oxygen species (ROS) revisited: Outlining their role in biological macromolecules (DNA, lipids, and proteins) and induced pathologies. Int. J. Mol. Sci. 2021, 22, 4642. [Google Scholar] [CrossRef] [Scilit]
- Murphy, M.P.; Bayir, H.; Belousov, V.; Chang, C.; Davies, K.; Dick, T.; Finkel, T.; Forman, H.; Jassen-Heininger, Y.; Gems, D.; et al. Guidelines for measuring reactive oxygen species and oxidative damage in cells and in vivo. Nat. Metab. 2022, 4, 651–662. [Google Scholar] [CrossRef] [Scilit]
- Miller, V.J.; Villamena, F.A.; Volek, J.S. Nutritional ketosis and mitohormesis: Potential implications for mitochondrial function and human health. J. Nutr. Metab. 2018, 2018, 5157645. [Google Scholar] [CrossRef] [Scilit]
- Sies, H. Hydrogen peroxide as a central redox signaling molecule in physiological oxidative stress: Oxidative eu-stress. Redox Biol. 2017, 11, 613–619. [Google Scholar] [CrossRef] [Scilit]
- Chandimali, N.; Bak, S.G.; Park, E.H.; Lim, H.J.; Won, Y.S.; Kim, E.K.; Park, S.I.; Lee, S.J. Free radicals and their impact on health and antioxidant defenses: A review. Cell Death Discov. 2025, 11, 19. [Google Scholar] [CrossRef] [Scilit] [PubMed]
- Eleutherio, E.; Brasil, A.A.; França, M.B.; de Almeida, D.S.G.; Rona, G.B.; Magalhães, R.S.S. Oxidative stress and aging: Learning from yeast lessons. Fungal Biol. 2018, 122, 514–525. [Google Scholar] [CrossRef] [Scilit]
- Rasheed, Z. Therapeutic potentials of catalase: Mechanisms, applications, and future perspectives. Int. J. Health Sci. 2024, 18, 1–6. [Google Scholar] [PubMed] [PubMed Central]
- Perrone, G.G.; Tan, S.X.; Dawes, I.W. Reactive oxygen species and yeast apoptosis. Biochim. Biophys. Acta 2008, 1783, 1354–1368. [Google Scholar] [CrossRef] [Scilit]
- Biryukova, E.N.; Medentsev, A.G.; Arinbasarova, A.Y.; Akimenko, V.K. Tolerance of the yeast Yarrowia lipolytica to oxidative stress. Microbiology 2006, 75, 243–247. [Google Scholar] [CrossRef] [Scilit]
- Arinbasarova, A.Y.; Biryukova, E.N.; Mendentsev, A.G. Antistress systems of the yeast Yarrowia lipolitica (Review). Prikl. Biohim. Mikrobiol. 2015, 51, 122–131. [Google Scholar] [CrossRef] [Scilit]
- Paulo, E.; García-Santamarina, S.; Calvo, I.A.; Carmona, M.; Boronat, S.; Domènech, A.; Ayté, J.; Hidalgo, E. A genetic approach to study H2O2 scavenging in fission yeast—Distinct roles of peroxiredoxin and catalase. Mol. Microbiol. 2014, 92, 246–257. [Google Scholar] [CrossRef] [Scilit] [PubMed]
- Segal- Kischinevzky, C.; Rodarte-Murguía, B.; Valdés-López, V.; Mendoza-Hernández, G.; González, A.; Alba-Lois, L. The Euryhaline yeast Debaryomyces hansenii has two catalase genes encoding enzymes with differential activity profile. Curr. Microbiol. 2011, 62, 933–943. [Google Scholar] [CrossRef] [Scilit]
- Cuéllar-Cruz, M.; Briones-Martin-del-Campo, M.; Cañas-Villamar, I.; Montalvo-Arredondo, J.; Riego-Ruiz, L.; Castaño, I.; De Las Peñas, A. High resistance to oxidative stress in the fungal pathogen Candida glabrata is mediated by a single catalase, Cta1p, and is controlled by the transcription factors Yap1p, Skn7p, Msn2p, and Msn4p. Eukaryot. Cell 2008, 7, 814–825. [Google Scholar] [CrossRef] [Scilit] [PubMed]
- Desentis-Desentis, M.F. Expresión de Genes Que Codifican Para Enzimas de la Respuesta Antioxidante de Yarrowia lipolytica, Bajo Condiciones de Estrés Oxidativo. Master’s Thesis, Universidad Autónoma de Nuevo León, Monterrey, Nuevo León, Mexico, 2016. Available online: http://eprints.uanl.mx/id/eprint/13829 (accessed on 3 March 2025).
- Miranda-Roblero, H.O. El Envejecimiento Modifica la Expresión de Genes de Respuesta Antioxidante en Yarrowia lipolytica. Master’s Thesis, Universidad Autónoma de Nuevo León, Monterrey, Nuevo León, Mexico, 2016. Available online: http://eprints.uanl.mx/id/eprint/13875 (accessed on 3 March 2025).
- Arredondo-Mendoza, G.I.; Castillo-Roque, M.; Miranda-Roblero, H.O.; Desentis-Desentis, M.F.; Teniente, S.L.; Jiménez-Salas, Z.; Campos-Góngora, E. Antioxidant system response of Yarrowia lipolytica cells under oxidative stress. Int. J. Mol. Sci. 2025, 26, 9629. [Google Scholar] [CrossRef] [Scilit]
- Cervantes-Chavez, J.A.; Ruiz-Herrera, J. STE11 disruption reveals the central role of a MAPK pathway in dimorphism and mating in Yarrowia lipolytica. FEMS Yeast Res. 2006, 6, 801–815. [Google Scholar] [CrossRef] [Scilit]
- Hoffman, C.; Winston, F.A. Ten-minute DNA preparation from yeast efficiently releases autonomous plasmids for transformation of Escherichia coli. Gene 1987, 57, 267–272. [Google Scholar] [CrossRef] [Scilit]
- Birnboim, H.C. A rapid alkaline extraction method for the isolation of plasmid DNA. Methods Enzymol. 1983, 100, 243–255. [Google Scholar] [CrossRef] [Scilit] [PubMed]
- Yu, J.-H.; Hamari, Z.; Han, K.-H.; Seo, J.-A.; Reyes-Domínguez, Y.; Scazzocchio, C. Double-joint PCR: A PCR-based molecular tool for gene manipulations in filamentous fungi. Fungal Genet. Biol. 2004, 41, 973–981. [Google Scholar] [CrossRef] [Scilit]
- Sambrook, J.; Russell, D.W. Molecular cloning: A laboratory manual. In Agarose Gel Electrophoresis; Sambrook, J., Russell, D.W., Eds.; Cold Spring Harbor: New York, NY, USA, 2006; pp. 94–99. [Google Scholar] [CrossRef] [Scilit]
- Wang, J.H.; Hung, W.; Tsai, S.H. High efficiency transformation by electroporation of Yarrowia lipolytica. J. Microbiol. 2011, 49, 469–472. [Google Scholar] [CrossRef] [Scilit]
- Sherman, F. Getting started with yeast. In Methods in Enzymology; Guthrie, C., Fink, G.R., Eds.; Academic Press: New York, NY, USA, 2002; pp. 3–41. [Google Scholar] [CrossRef] [Scilit]
- Quiñones-González, C.A.; Arredondo-Mendoza, G.I.; Jiménez-Salas, Z.; Larriba-Calle, G.; Ruiz-Herrera, J.; Campos-Góngora, E. Genotoxic effect of caffeine in Yarrowia lipolytica cells deficient in DNA repair mechanisms. Arch. Microbiol. 2019, 201, 991–998. [Google Scholar] [CrossRef] [Scilit]
- Martins, D.; English, A.M. Catalase activity is stimulated by H2O2 in rich culture medium and is required for H2O2 resistance and adaptation in yeast. Redox Biol. 2014, 2, 308–313. [Google Scholar] [CrossRef] [Scilit]
- Zimmermann, J.; Lang, L.; Calabrese, G.; Laporte, H.; Amponsah, P.S.; Michalk, C.; Sukmann, T.; Oestreicher, J.; Tursch, A.; Peker, E.; et al. Tsa1 is the dominant peroxide scavenger and a source of H2O2-dependent GSSG production in yeast. Free Radic. Biol. Med. 2025, 26, 408–420. [Google Scholar] [CrossRef] [Scilit] [PubMed]
- Gómez, S.; Navas-Yuste, S.; Payne, A.M.; Rivera, W.; López-Estepa, M.; Brangbour, C.; Fullá, D.; Juanhuix, J.; Fernández, F.J.; Vega, M.C. Peroxisomal catalases from the yeasts Pichia pastoris and Kluyveromyces lactis as models for oxidative damage in higher eukaryotes. Free Radic. Biol. Med. 2019, 141, 279–290. [Google Scholar] [CrossRef] [Scilit] [PubMed]
- Wysong, D.R.; Christin, L.; Sugar, A.M.; Robbins, P.W.; Diamond, R.D. Cloning and sequencing of a Candida albicans catalase gene and effects of disruption of this gene. Infec. Immun. 1998, 66, 1953–1961. [Google Scholar] [CrossRef] [Scilit]
- Herb, M.; Gluschko, A.; Schramm, M. Reactive oxygen species: Not omnipresent but important in many locations. Front. Cell Dev. Biol. 2021, 9, 716406. [Google Scholar] [CrossRef] [Scilit]
- Averill-Bates, D. Reactive oxygen species and cell signaling. Biochim. Biophys. Acta Mol. Cell Res. 2024, 1871, 119573. [Google Scholar] [CrossRef] [Scilit]
- Zuo, L.; Prather, E.R.; Stetskiv, M.; Garrison, D.E.; Meade, J.R.; Peace, T.I.; Zhou, T. Inflammaging and oxidative stress in human diseases: From molecular mechanisms to novel treatments. Int. J. Mol. Sci. 2019, 20, 4472. [Google Scholar] [CrossRef] [Scilit]
- Anwar, S.; Alrumaihi, F.; Sarwar, T.; Babiker, A.Y.; Khan, A.A.; Prabhu, S.V.; Rahmani, A.H. Exploring therapeutic potential of catalase: Strategies in disease prevention and management. Biomolecules 2024, 14, 697. [Google Scholar] [CrossRef] [Scilit]
- Izawa, S.; Inoue, Y.; Kimura, A. Importance of catalase in the adaptative response to hydrogen peroxide: Analysis of acatalasemic Saccharomyces cerevisiae. Biochem. J. 1996, 320, 61–67. [Google Scholar] [CrossRef] [Scilit]
- Lopes, M.; Mota, M.; Belo, I. Comparison of Yarrowia lipolytica and Pichia pastoris cellular response to different agents of oxidative stress. App. Biochem. Biotechnol. 2013, 170, 448–458. [Google Scholar] [CrossRef] [Scilit]
- Nishimoto, T.; Watanabe, T.; Furuta, M.; Kataoka, M.; Kishida, M. Roles of catalase and trehalose in the protection from hydrogen peroxide toxicity in Saccharomyces cerevisiae. Biocontrol. Sci. 2016, 21, 179–182. [Google Scholar] [CrossRef] [Scilit]
- Semchyshyn, H. Hydrogen peroxide-induced response in E. coli and S. cerevisiae: Different stages of the flow of the genetic information. Cent. Eur. J. Biol. 2009, 4, 142–153. [Google Scholar] [CrossRef] [Scilit]
- Zhang, J. Evolution by gene duplication: An update. Trends Ecol. Evol. 2003, 18, 292–298. [Google Scholar] [CrossRef] [Scilit]
- Zhang, J.V. Gene Duplication. In The Princeton Guide to Evolution; Losos, J., Baum, D., Futuyma, D., Hoekstra, H., Lenski, R., Moore, A., Peichel, C., Schluter, D., Whitlock, M., Eds.; Princeton University Press: Princeton, NJ, USA, 2013; pp. 397–405. [Google Scholar] [CrossRef] [Scilit]
- Lynch, M.; Conery, J.S. The evolutionary fate and consequences of duplicate genes. Science 2000, 290, 1151–1155. [Google Scholar] [CrossRef] [Scilit] [PubMed]
- Ascencio, D.; DeLuna, A. Genetic redundancy. In Encyclopedia of Systems Biology; Dubitzky, W., Wolkenhauer, O., Cho, K.H., Yokota, H., Eds.; Springer: New York, NY, USA, 2013. [Google Scholar] [CrossRef] [Scilit]
- Dean, E.J.; Davis, J.C.; Davis, R.W.; Petrov, D.A. Pervasive and persistent redundancy among duplicated genes in yeast. PLoS Genet. 2008, 4, e1000113. [Google Scholar] [CrossRef] [Scilit] [PubMed]
- Wagner, A. Gene duplications, robustness and evolutionary innovations. BioEssays 2008, 30, 367–373. [Google Scholar] [CrossRef] [Scilit] [PubMed]
- Kuzmin, E.; Taylor, J.S.; Boone, C. Retention of duplicated genes in evolution. Trends Genet. 2022, 38, 59–72. [Google Scholar] [CrossRef] [Scilit] [PubMed]

Disclaimer/Publisher’s Note: The statements, opinions and data contained in all publications are solely those of the individual author(s) and contributor(s) and not of MDPI and/or the editor(s). MDPI and/or the editor(s) disclaim responsibility for any injury to people or property resulting from any ideas, methods, instructions or products referred to in the content. |
© 2026 by the authors. Licensee MDPI, Basel, Switzerland. This article is an open access article distributed under the terms and conditions of the Creative Commons Attribution (CC BY) license.