
Act1 out of Action: Identifying Reliable Reference Genes in Trichoderma reesei for Gene Expression Analysis


Abstract
1. Introduction
2. Materials and Methods
2.1. Fungal Strains
2.2. Transcriptome Dataset Processing and Analysis
2.3. Cultivation Conditions
2.4. RNA Extraction
2.5. cDNA Synthesis
2.6. qPCR
2.7. Data Analysis
3. Results
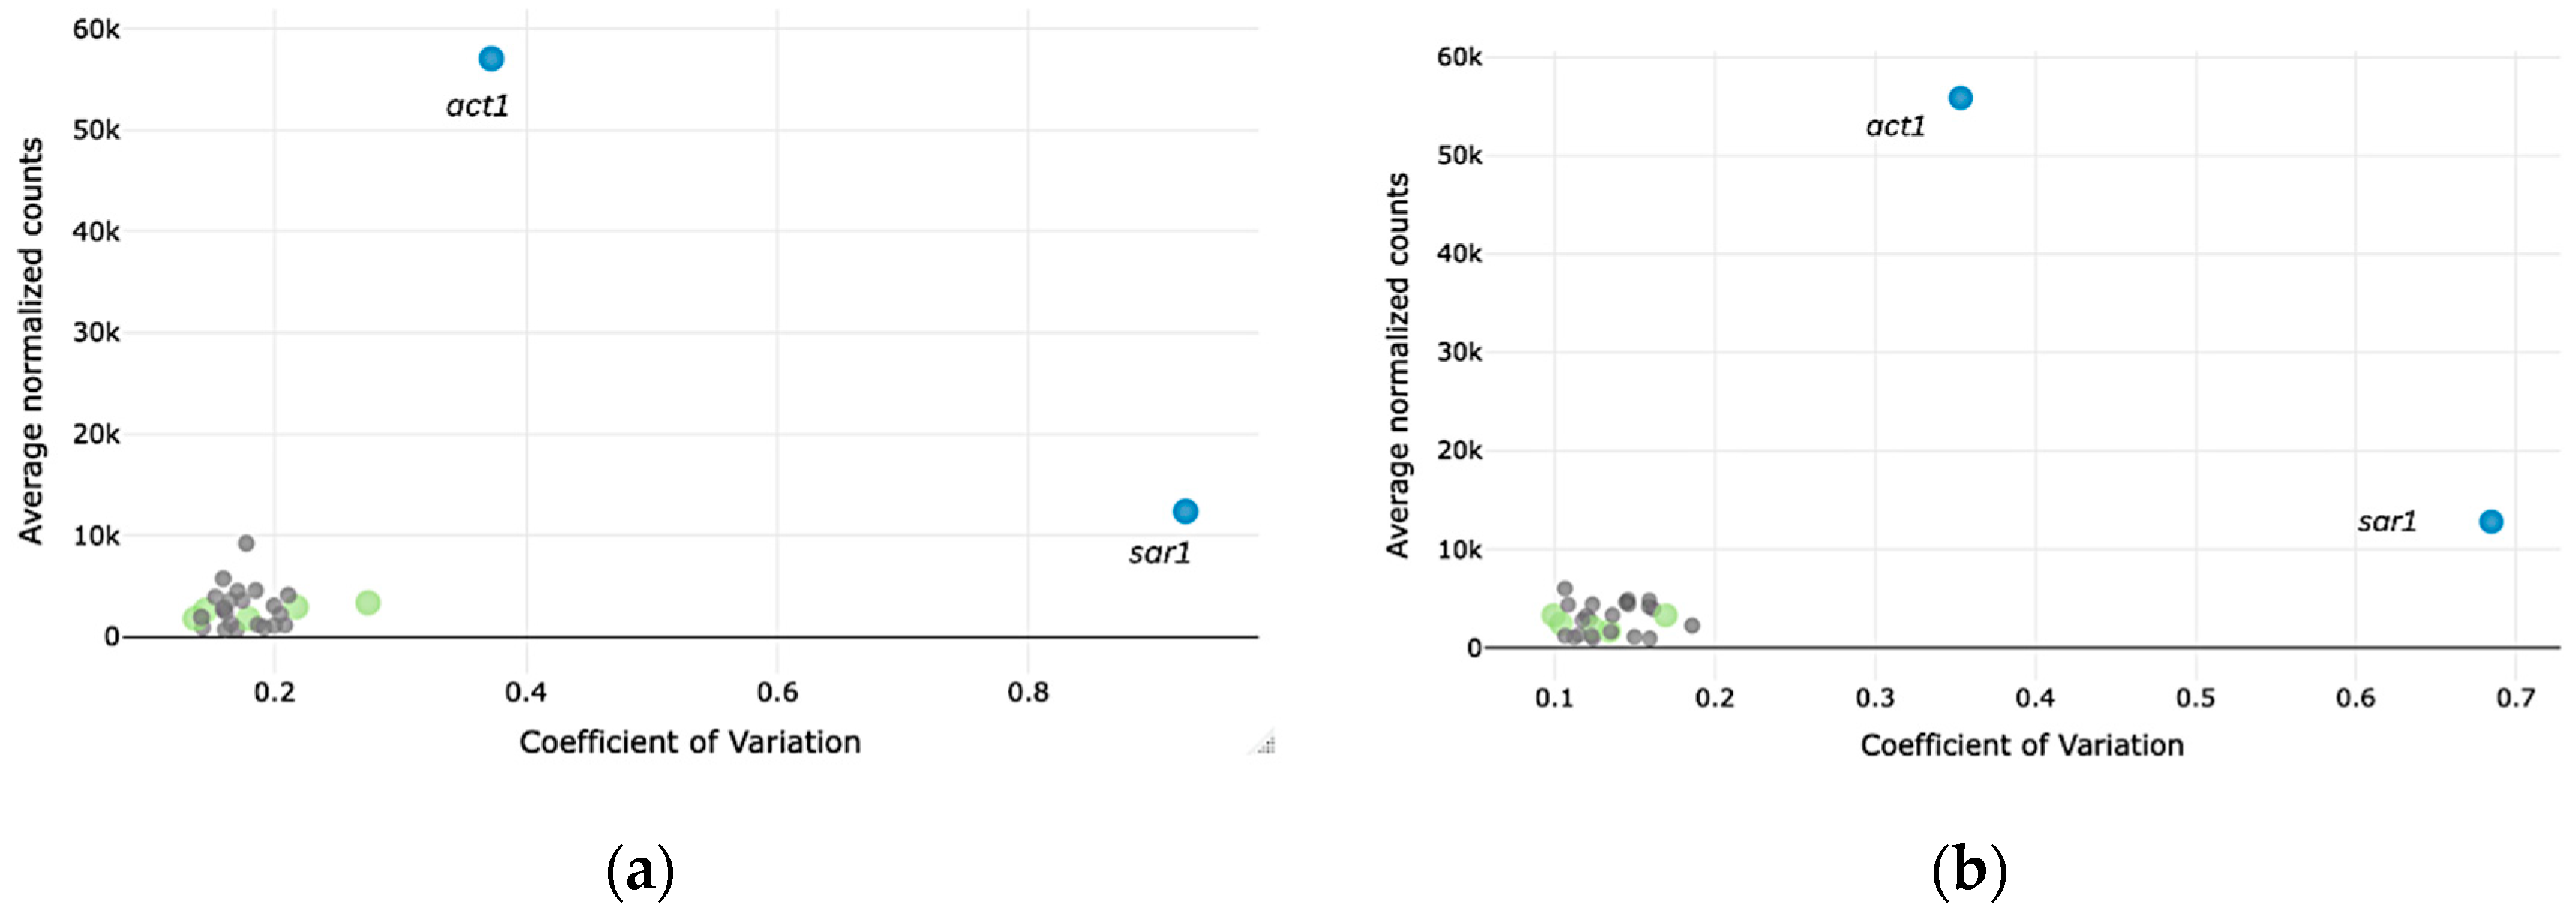
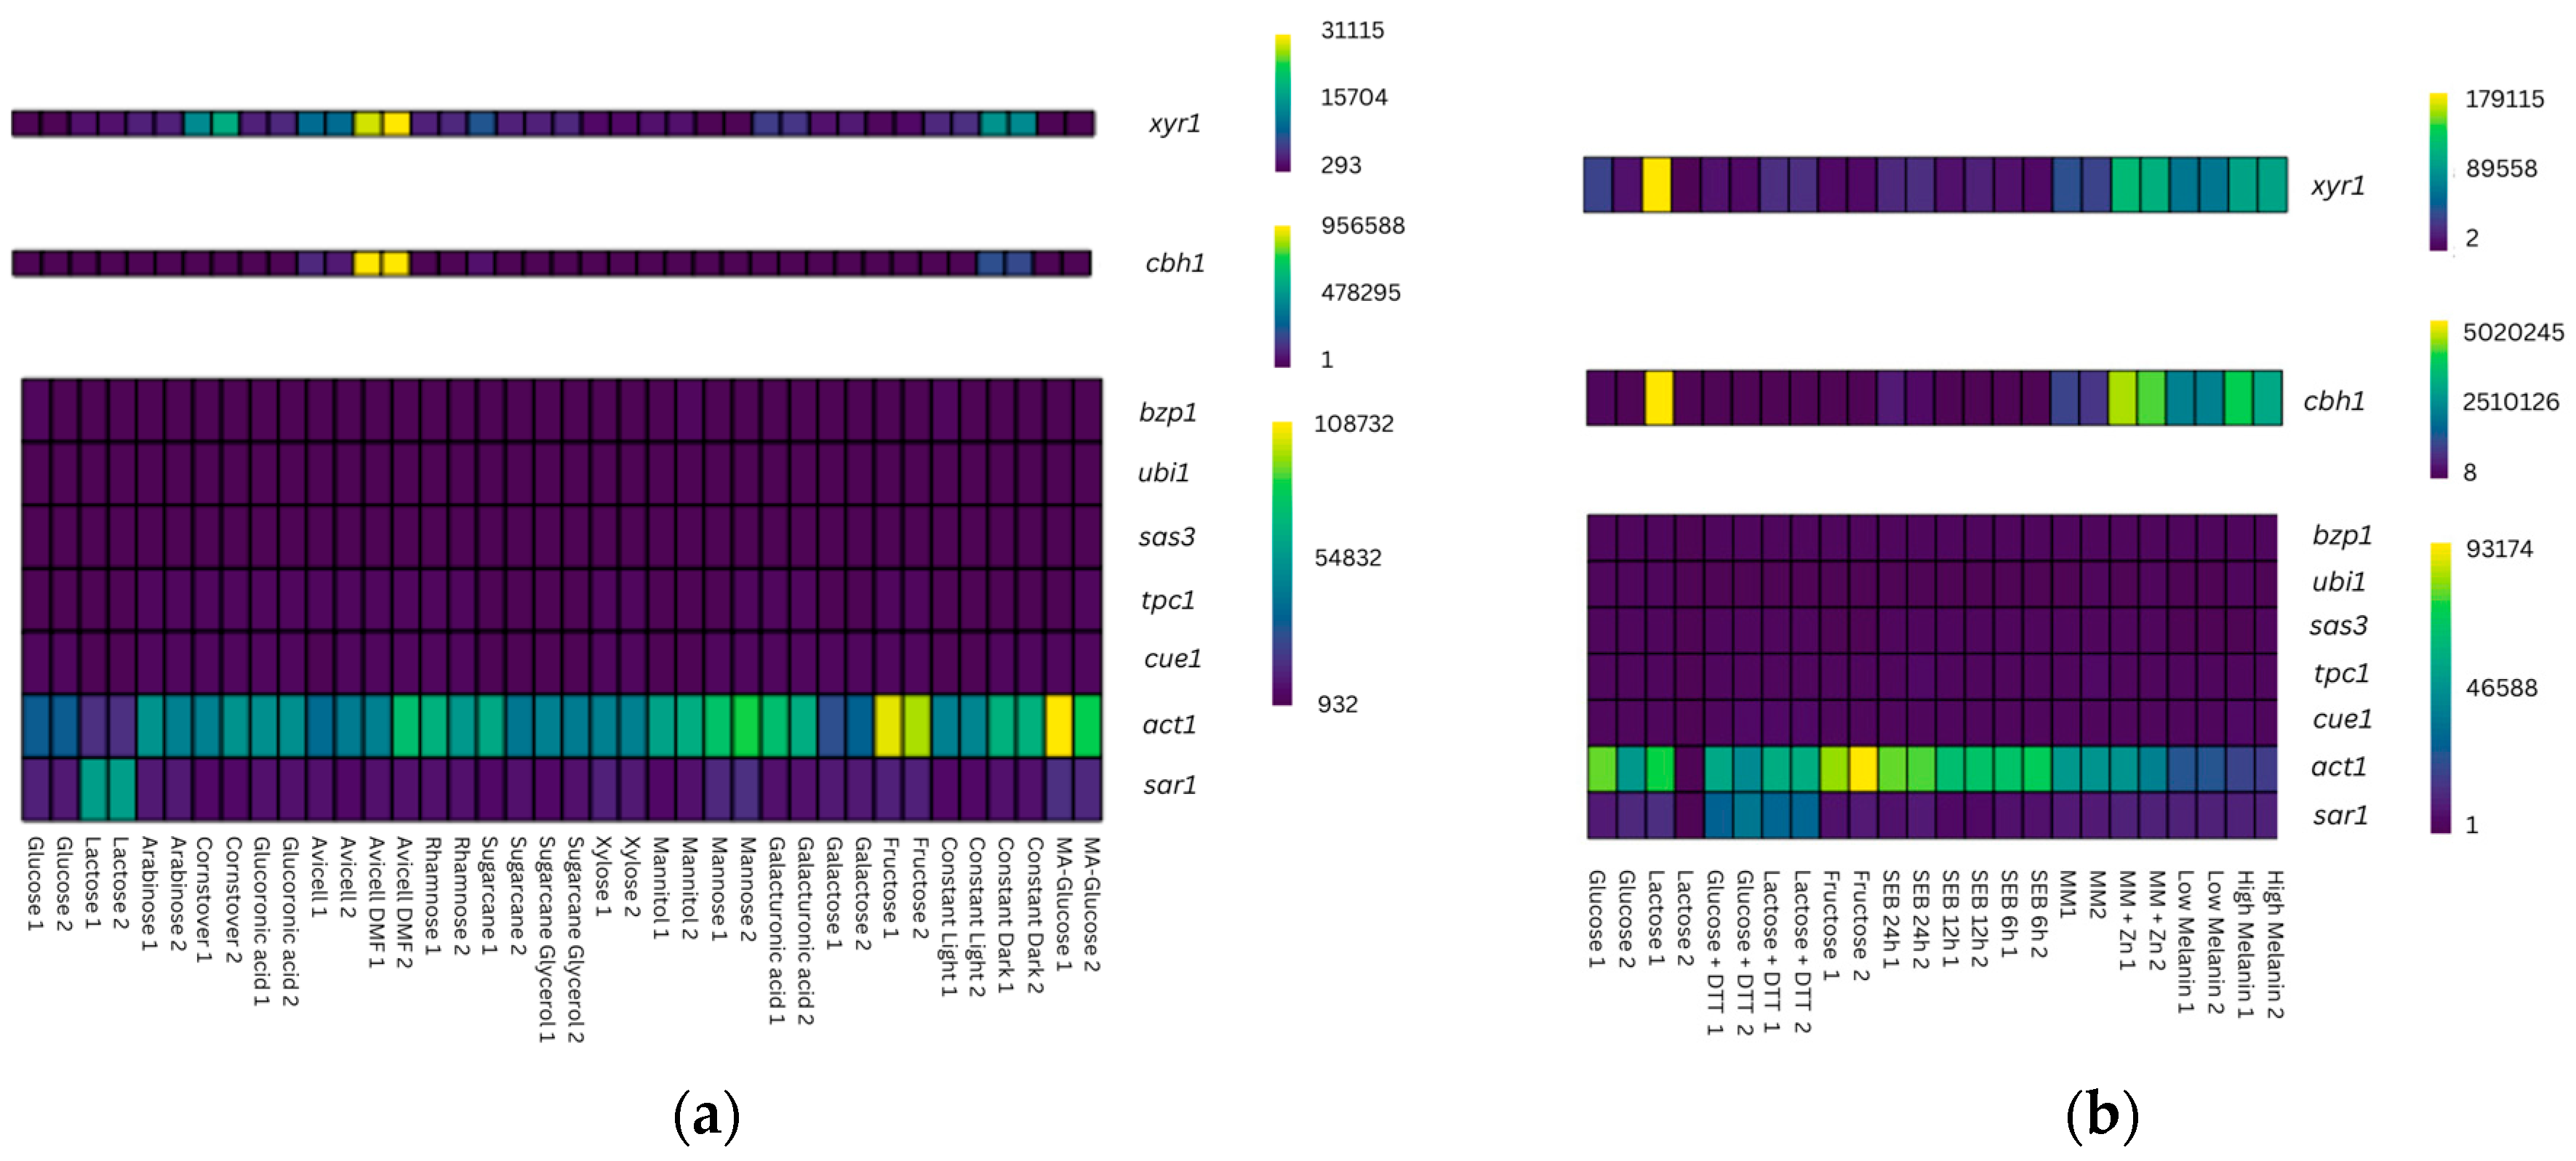
3.1. Identification of New Candidate Reference Genes for T. reesei Using WTS Data
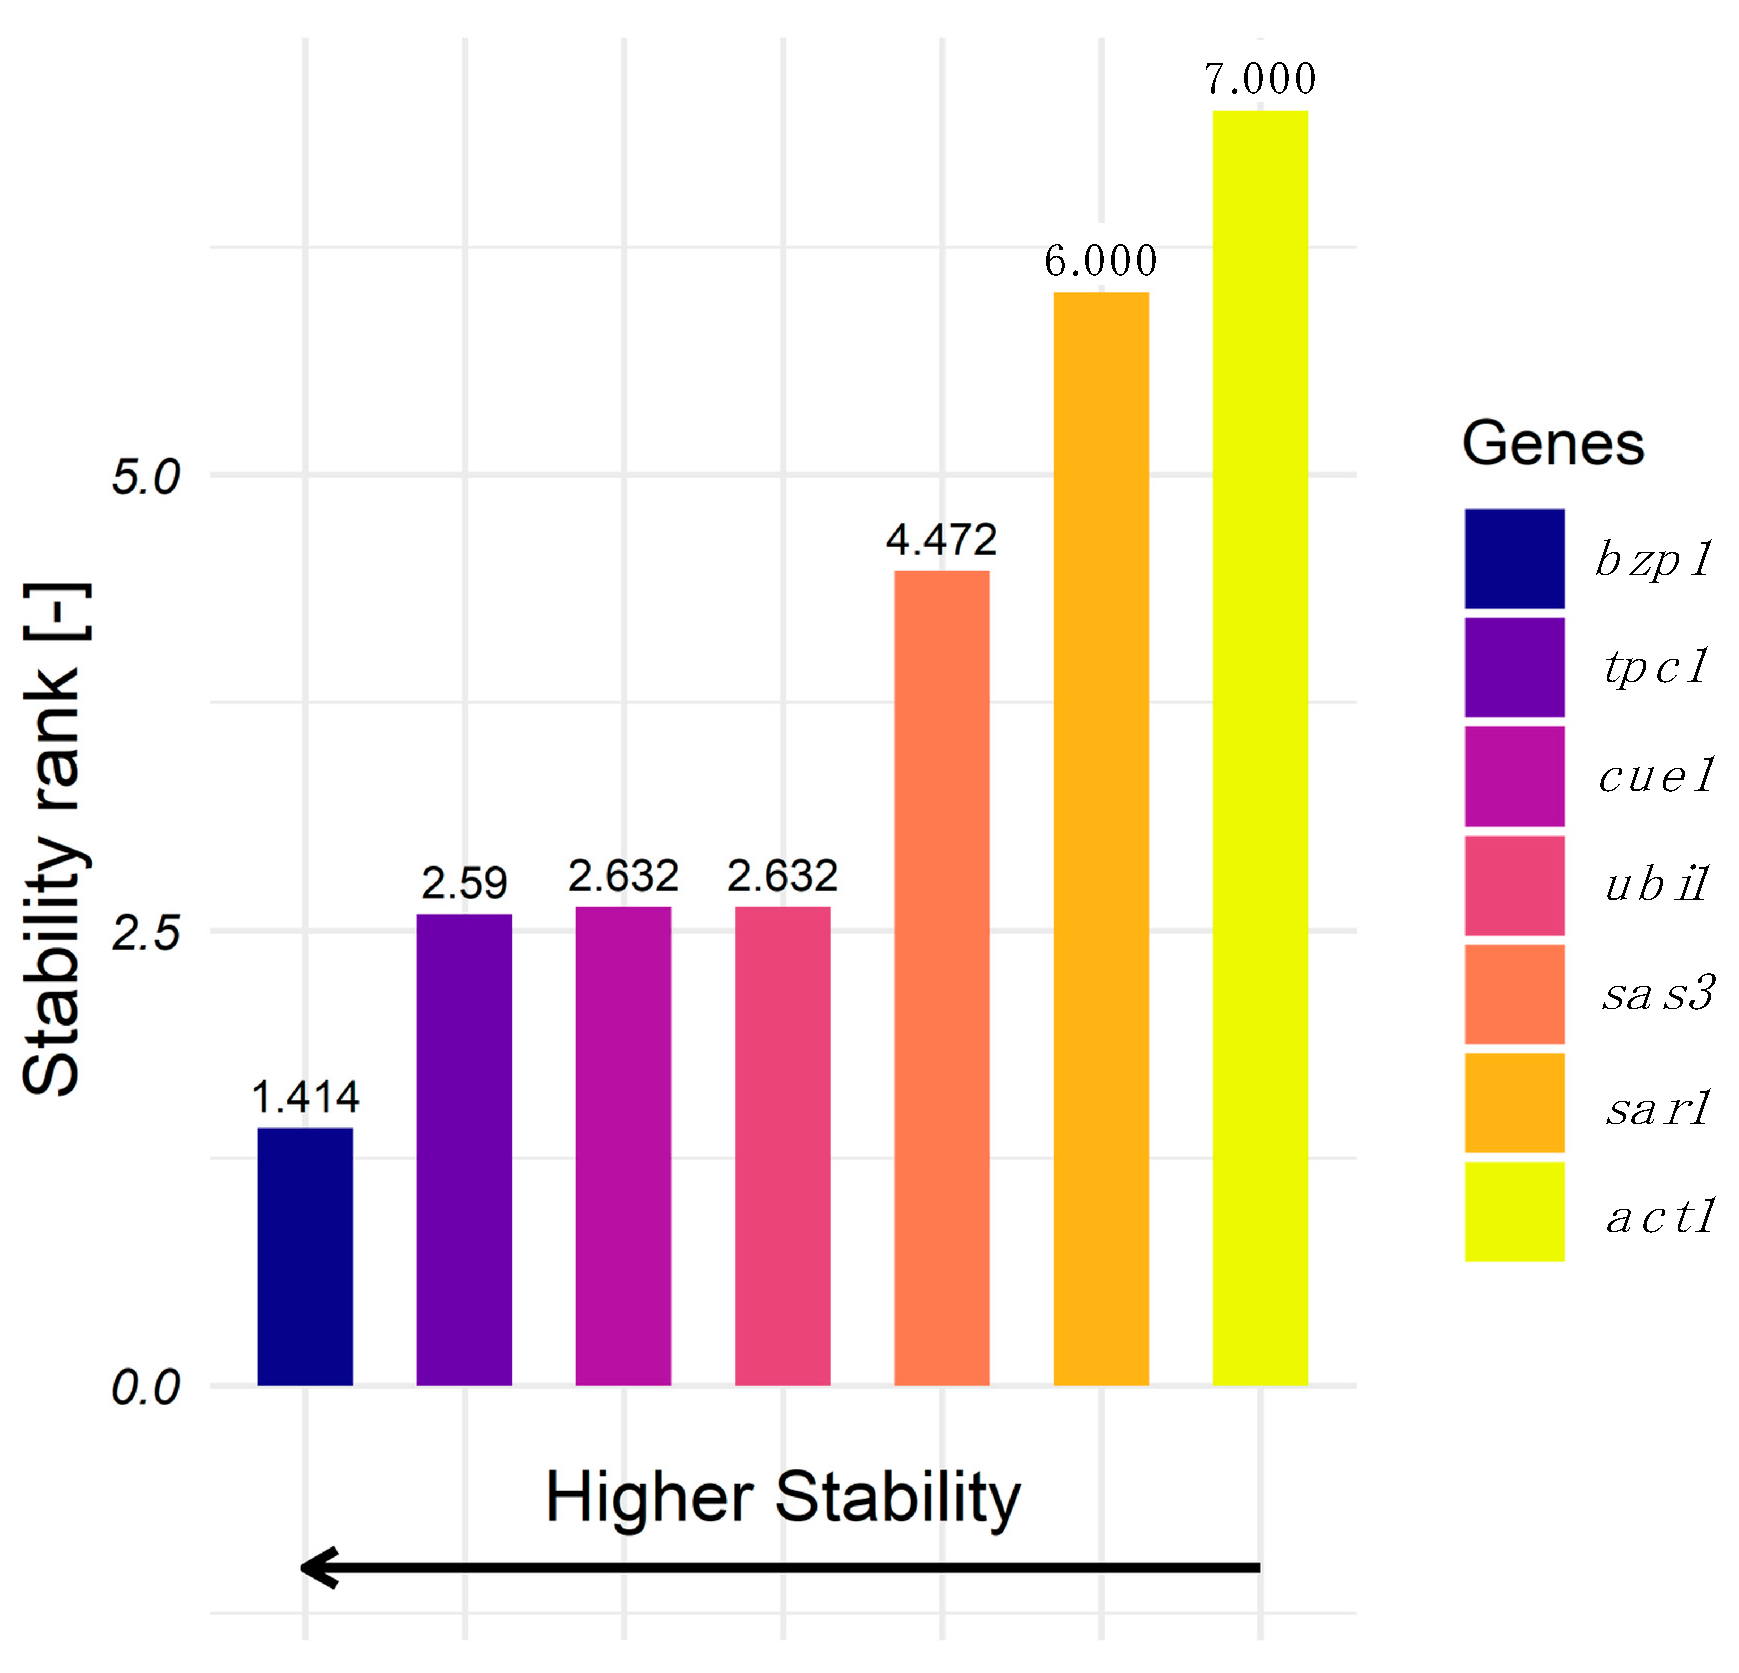
3.2. Evaluation of Gene Expression Stability Using RT-qPCR and RefFinder
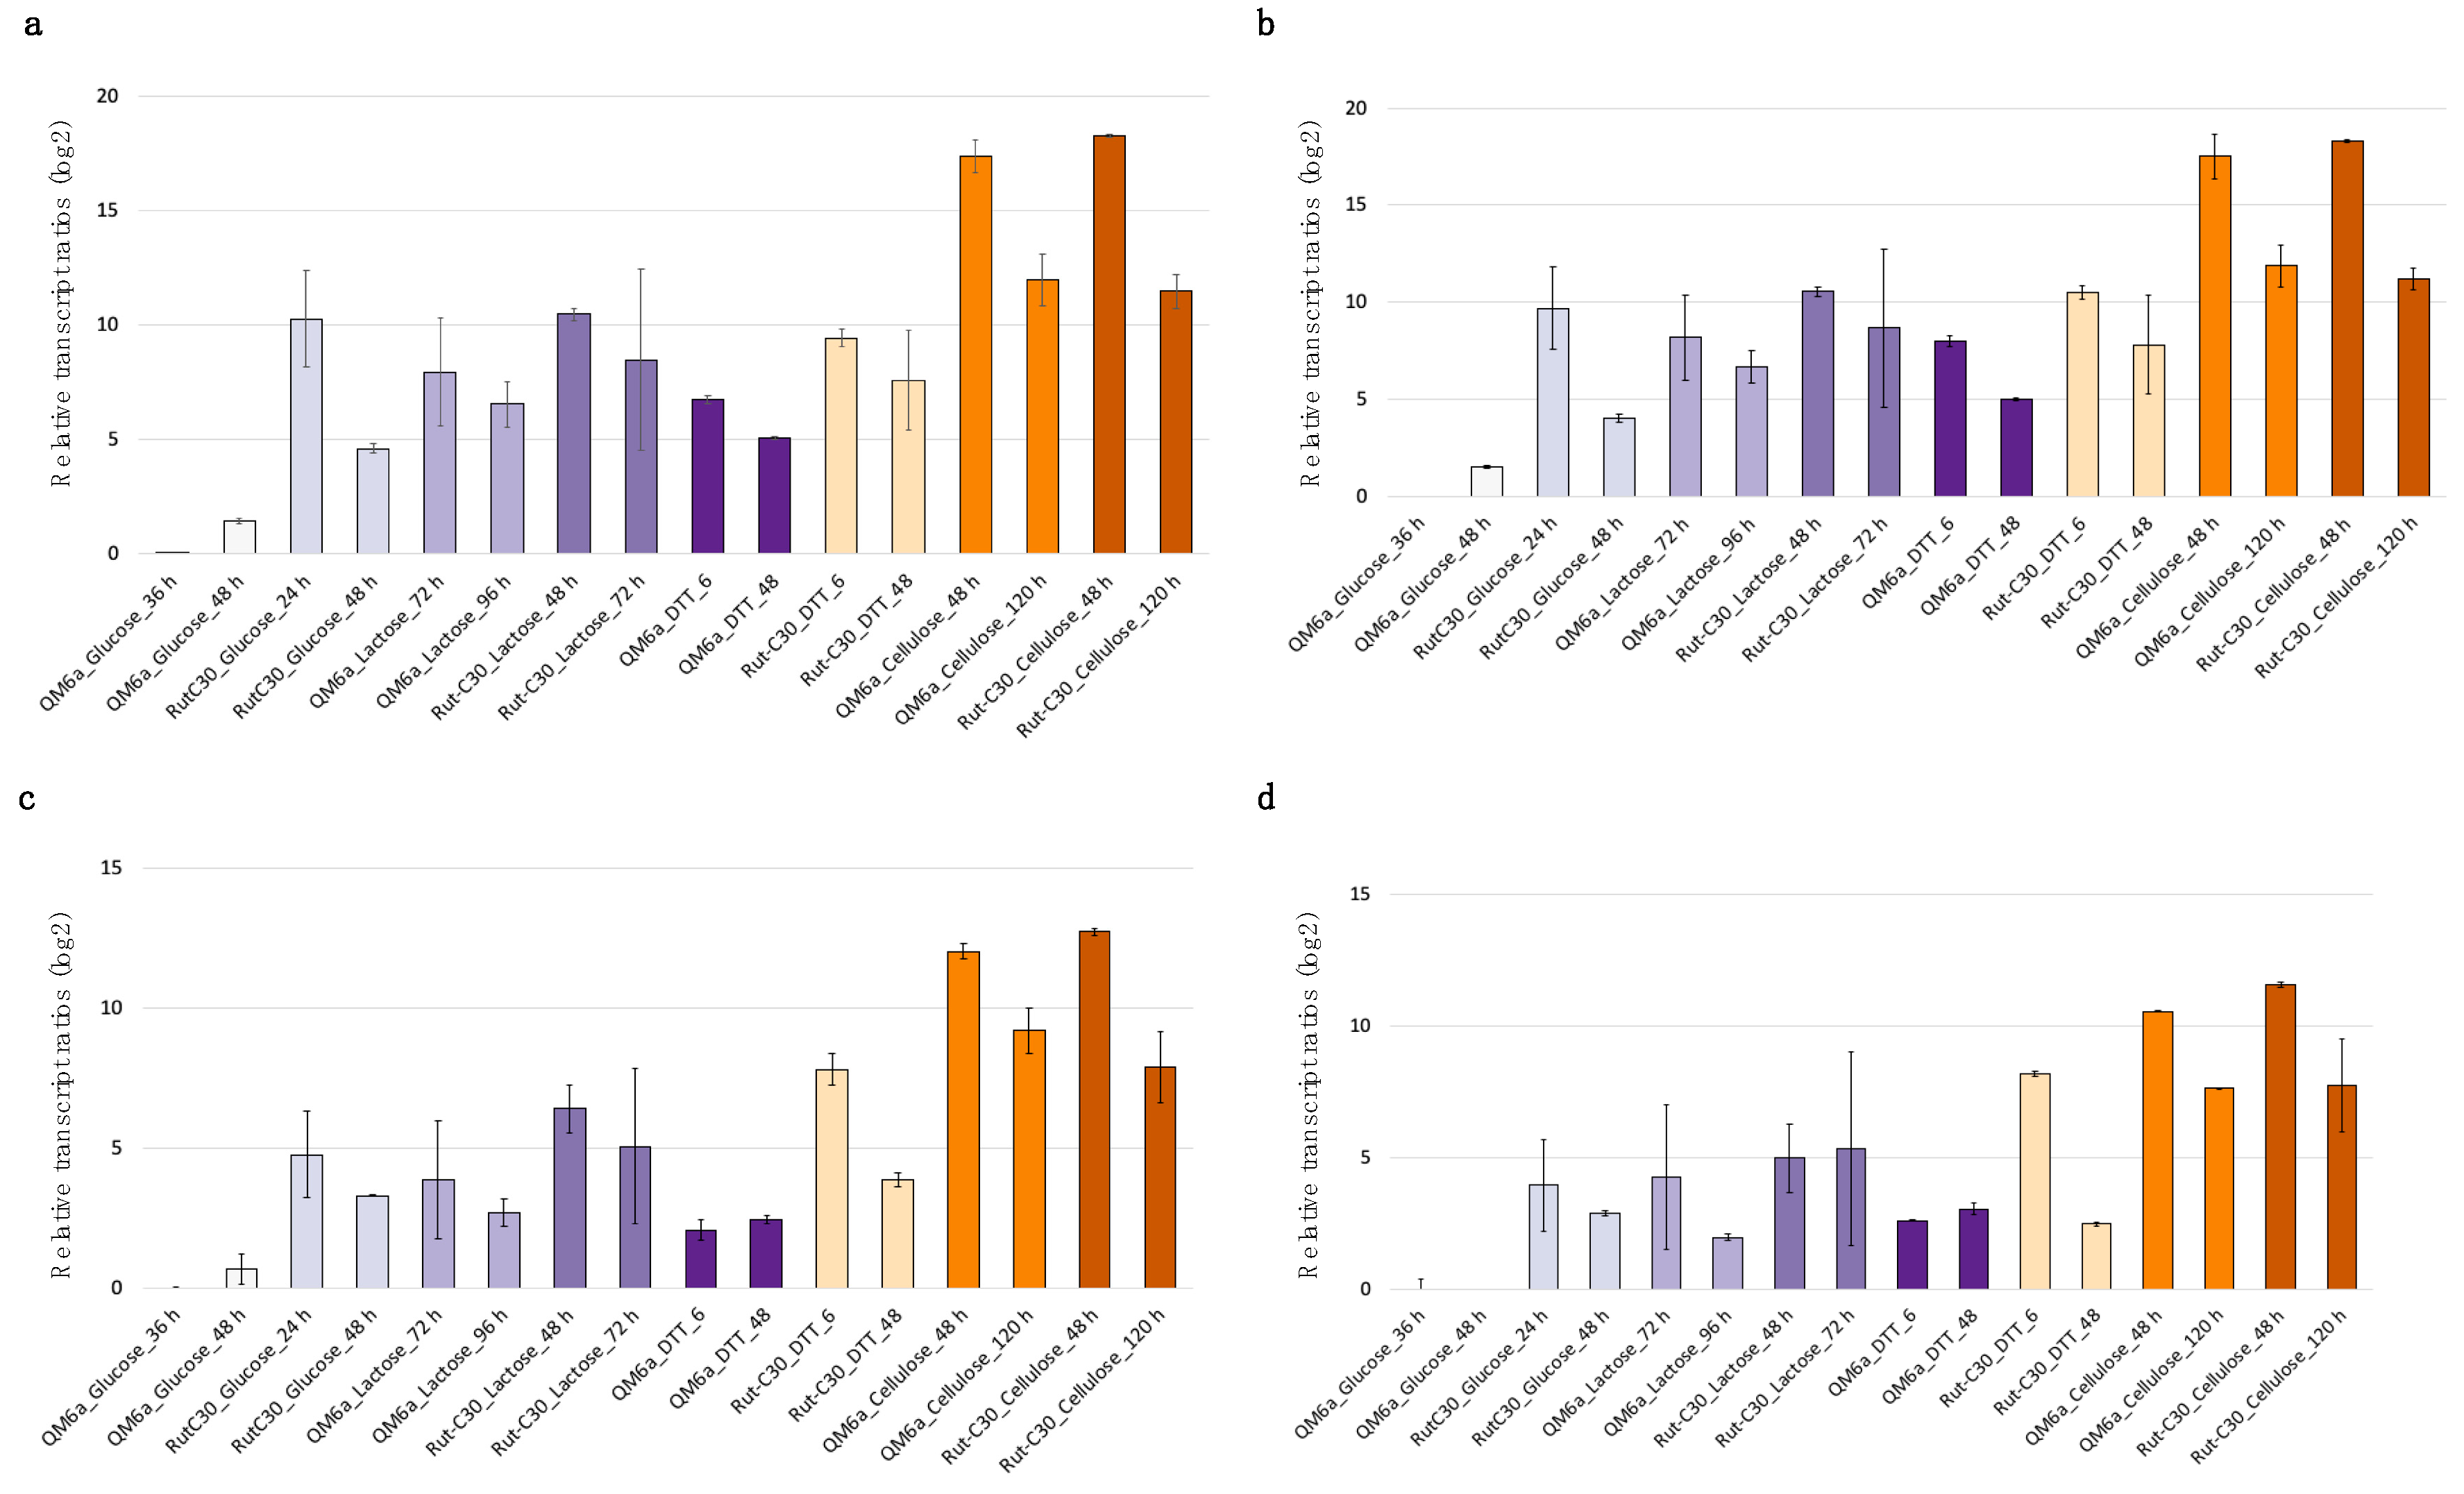
3.3. Use of bzp1 and tpc1 as Reference Genes for Analyzing Gene Expression Using RT-qPCR
4. Discussion
Author Contributions
Funding
Institutional Review Board Statement
Informed Consent Statement
Data Availability Statement
Conflicts of Interest
Abbreviations
| DTT | Dithiothreitol |
| RT-qPCR | Reverse transcription–quantitative polymerase chain reaction |
| MA | Mandels–Andreotti |
| DMF | Dimethylformamide |
| SEB | Sugarcane exploded bagasse |
| MM | Minimal medium |
| CV | Coefficient of variation |
| MIQE | Minimum information for publication of quantitative real-time PCR experiments |
| WTS | Whole transcriptome sequencing |
| Ct | Threshold cycle |
| SRA | Sequence Read Archive |
| BCM | Basic culture medium |
Appendix A
Appendix A.1

| Run | SRA 1 Study | Sequenced Bases | File Size | Platform | Condition | Reference |
|---|---|---|---|---|---|---|
| SRR23952272 | SRP429031 | 7.6 G | 2.1 Gb | Illumina NovaSeq 6000 (Illumina, San Diego, CA, USA) | glucose R1 2 | [67] |
| SRR23952273 | SRP429031 | 6.8 G | 1.9 Gb | Illumina NovaSeq 6000 | glucose R2 | |
| SRR8698740 | SRP187914 | 7 G | 2.9 Gb | Illumina HiSeq 2000 (Illumina, San Diego, CA, USA) | 2% lactose (transfer after 12 h) R1 | [68] |
| SRR8698741 | SRP187914 | 7.8 G | 3.2 Gb | Illumina HiSeq 2000 | 2% lactose (transfer after 12 h) R2 | |
| SRR5765024 | SRP110683 | 2.9 G | 2.0 Gb | Illumina HiSeq 2500 (Illumina, San Diego, CA, USA) | 1% sugarcane bagasse 48 h R1 | [69] |
| SRR5765025 | SRP110683 | 3.0 G | 2.0 Gb | Illumina HiSeq 2500 | 1% sugarcane bagasse 48 h R2 | |
| SRR5765030 | SRP110683 | 3.2 G | 2.1 Gb | Illumina HiSeq 2500 | 1% sugarcane bagasse (transfer from 1% glycerol) R1 | |
| SRR5765031 | SRP110683 | 4.0 G | 2.7 Gb | Illumina HiSeq 2500 | 1% sugarcane bagasse (transfer from 1% glycerol) R2 | |
| SRR7761289 | SRP159003 | 2.8 G | 1.8 Gb | Illumina HiSeq 2000 | MA with 1% cellulose in constant light R1 | [70] |
| SRR7761290 | SRP159003 | 2.7 G | 1.7 Gb | Illumina HiSeq 2000 | MA with 1% cellulose in constant light R2 | |
| SRR7761293 | SRP159003 | 2.7 G | 1.7 Gb | Illumina HiSeq 2000 | MA with 1% cellulose in constant dark R1 | |
| SRR7761294 | SRP159003 | 2.6 G | 1.6 Gb | Illumina HiSeq 2000 | MA with 1% cellulose in constant dark R2 | |
| SRR8329346 | SRP173612 | 7.5 G | 2.7 Gb | Illumina HiSeq X Ten (Illumina, San Diego, CA, USA) | MM with 1% Avicell 48 h R1 | [71] |
| SRR8329347 | SRP173612 | 6.9 G | 2.4 Gb | Illumina HiSeq X Ten | MM with 1% Avicell 48 h R2 | |
| SRR8329344 | SRP173612 | 7.6 G | 2.7 Gb | Illumina HiSeq X Ten | MM with 1% Avicell + 1% DMF 48 h R1 | |
| SRR8329345 | SRP173612 | 7.1 G | 2.5 Gb | Illumina HiSeq X Ten | MM with 1% Avicell + 1% DMF 48 h R2 | |
| SRR8756161 | SRP188940 | 882.3 M | 368.0 Mb | Illumina NextSeq 500 (Illumina, San Diego, CA, USA) | 24 h on MA with glucose (transfer for 3 h to 1% D-Mannitol) R1 | [72] |
| SRR8756162 | SRP188940 | 738.7 M | 306.6 Mb | Illumina NextSeq 500 | 24 h on MA with glucose (transfer for 3 h to 1% D-Mannitol) R2 | |
| SRR25252694 | SRP448956 | 2.7 G | 908.6 Mb | Illumina NovaSeq 6000 | MA with 1% corn stover (4 h transfer) R1 | [73] |
| SRR25252695 | SRP448955 | 2.7 G | 908.0 Mb | Illumina NovaSeq 6000 | MA with 1% corn stover (4 h transfer) R2 | |
| SRR19551435 | SRP378722 | 5.9 G | 1.7 Gb | Illumina NovaSeq 6000 | MA with 25 mM D-glucuronic acid (4 h transfer) R1 | |
| SRR19551437 | SRP378720 | 4.5 G | 1.3 Gb | Illumina NovaSeq 6000 | MA with 25 mM D-glucuronic acid (4 h transfer) R2 | |
| SRR19551421 | SRP378737 | 6.7 G | 2.0 Gb | Illumina NovaSeq 6000 | MA with 25 mM L-arabinose (4 h transfer) R1 | |
| SRR19551434 | SRP378723 | 6.9 G | 2.1 Gb | Illumina NovaSeq 6000 | MA with 25 mM L-arabinose (4 h transfer) R2 | |
| SRR19551432 | SRP378725 | 5.3 G | 1.6 Gb | Illumina NovaSeq 6000 | MA with 25 mM L-rhamnose (4 h transfer) R1 | |
| SRR19551433 | SRP378724 | 4.9 G | 1.5 Gb | Illumina NovaSeq 6000 | MA with 25 mM L-rhamnose (4 h transfer) R2 | |
| SRR19551429 | SRP378728 | 6.8 G | 2.0 Gb | Illumina NovaSeq 6000 | MA with 25 mM D-galacturonic acid (4 h transfer) R1 | |
| SRR19551431 | SRP378726 | 6.9 G | 2.0 Gb | Illumina NovaSeq 6000 | MA with 25 mM D-galacturonic acid (4 h transfer) R2 | |
| SRR19551420 | SRP378736 | 6.1 G | 1.8 Gb | Illumina NovaSeq 6000 | MA with 25 mM D-xylose (4 h transfer) R1 | |
| SRR19551428 | SRP378729 | 7.4 G | 2.2 Gb | Illumina NovaSeq 6000 | MA with 25 mM D-xylose (4 h transfer) R2 | |
| SRR19551424 | SRP378733 | 5.1 G | 1.5 Gb | Illumina NovaSeq 6000 | MA with 25 mM D-mannose (4 h transfer) R1 | |
| SRR19551425 | SRP378732 | 3.9 G | 1.1 Gb | Illumina NovaSeq 6000 | MA with 25 mM D-mannose (4 h transfer) R2 | |
| SRR19551413 | SRP378744 | 4.5 G | 1.2 Gb | Illumina NovaSeq 6000 | MA with 25 mM D-galactose (4 h transfer) R1 | |
| SRR19551423 | SRP378734 | 4.8 G | 1.4 Gb | Illumina NovaSeq 6000 | MA with 25 mM D-galactose (4 h transfer) R2 | |
| SRR19551416 | SRP378741 | 4.2 G | 1.2 Gb | Illumina NovaSeq 6000 | MA with 25 mM D-fructose (4 h transfer) R1 | |
| SRR19551418 | SRP378739 | 4.2 G | 1.2 Gb | Illumina NovaSeq 6000 | MA with 25 mM D-fructose (4 h transfer) R2 | |
| SRR19551414 | SRP378743 | 5.2 G | 1.5 Gb | Illumina NovaSeq 6000 | MA with 25 mM D-glucose (4 h transfer) R1 | |
| SRR19551415 | SRP378742 | 6.6 G | 1.8 Gb | Illumina NovaSeq 6000 | MA with 25 mM D-glucose (4 h transfer) R2 |
| Run | SRA 1 Study | Sequenced Bases | File Size | Platform | Condition | Reference |
|---|---|---|---|---|---|---|
| SRR24768099 | SRP440257 | 6.3 G | 2.0 Gb | Illumina NextSeq 2000 (Illumina, San Diego, CA, USA) | Fed batch with lactose + 10 mM DTT for 2 h R1 2 | [74] |
| SRR24768104 | SRP440257 | 5.9 G | 1.9 Gb | Illumina NextSeq 2000 | Fed batch with lactose + 10 mM DTT for 2 h R2 | |
| SRR24768100 | SRP440257 | 4.6 G | 1.4 Gb | Illumina NextSeq 2000 | Fed batch with lactose R1 | |
| SRR24768103 | SRP440257 | 5.2 G | 1.6 Gb | Illumina NextSeq 2000 | Fed batch with lactose R2 | |
| SRR24768101 | SRP440257 | 5.3 G | 1.6 Gb | Illumina NextSeq 2000 | Fed batch with glucose + 10 mM DTT for 2 h R1 | |
| SRR24768102 | SRP440257 | 5.7 G | 1.7 Gb | Illumina NextSeq 2000 | Fed batch with glucose + 10 mM DTT for 2 h R2 | |
| SRR24768105 | SRP440257 | 4.7 G | 1.4 Gb | Illumina NextSeq 2000 | Fed batch with glucose R1 | |
| SRR24768106 | SRP440257 | 4.5 G | 1.3 Gb | Illumina NextSeq 2000 | Fed batch with glucose R2 | |
| SRR4446960 | SRP091982 | 2.4 G | 1.6 Gb | Illumina HiSeq 2000 (Illumina, San Diego, CA, USA) | BCM with 1% fructose 48 h + 24 h R1 | [75] |
| SRR4446961 | SRP091982 | 2.5 G | 1.7 Gb | Illumina HiSeq 2000 | BCM with 1% fructose 48 h + 24 h R2 | |
| SRR4446958 | SRP091982 | 2.5 G | 1.7 Gb | Illumina HiSeq 2000 | BCM with 1% fructose 48 h (transfer to 0.5% SEB 24) R1 | |
| SRR4446959 | SRP091982 | 2.5 G | 1.7 Gb | Illumina HiSeq 2000 | BCM with 1% fructose 48 h (transfer to 0.5% SEB 24 h) R2 | |
| SRR4446955 | SRP091982 | 2.3 G | 1.6 Gb | Illumina HiSeq 2000 | BCM with 1% fructose 48 h (transfer to 0.5% SEB 12 h) R1 | |
| SRR4446956 | SRP091982 | 2.7 G | 1.8 Gb | Illumina HiSeq 2000 | BCM with 1% fructose 48 h (transfer to 0.5% SEB 12 h) R2 | |
| SRR4446953 | SRP091982 | 2.5 G | 1.7 Gb | Illumina HiSeq 2000 | BCM with 1% fructose 48 h (transfer to 0.5% SEB 6 h) R1 | |
| SRR4446954 | SRP091982 | 2.4 G | 1.7 Gb | Illumina HiSeq 2000 | BCM with 1% fructose 48 h (transfer to 0.5% SEB 6 h) R2 | |
| SRR23088649 | SRP417642 | 6.6 G | 1.9 Gb | Illumina NovaSeq 6000 | 1% Avicell 48 h R1 | [76] |
| SRR23088650 | SRP417642 | 7.2 G | 2.1 Gb | Illumina NovaSeq 6000 | 1% Avicell 48 h R2 | |
| SRR23088646 | SRP417642 | 8.3 G | 2.4 Gb | Illumina NovaSeq 6000 | 1% Avicell 48 h + 3 mM Zn2+ R1 | |
| SRR23088647 | SRP417642 | 7.1 G | 2.0 Gb | Illumina NovaSeq 6000 | 1% Avicell 48 h + 3 mM Zn2+ R2 | |
| SRR28595945 | SRP500486 | 7.9 G | 2.4 Gb | Illumina HiSeq 4000 (Illumina, San Diego, CA, USA) | high-melanin necromass from Hyaloscypha bicolor R1 | [77] |
| SRR28595946 | SRP500486 | 8.5 G | 2.6 Gb | Illumina HiSeq 4000 | high-melanin necromass from H. bicolor R2 | |
| SRR28595948 | SRP500486 | 8.0 G | 2.5 Gb | Illumina HiSeq 4000 | low-melanin necromass from H. bicolor R1 | |
| SRR28595949 | SRP500486 | 8.5 G | 2.6 Gb | Illumina HiSeq 4000 | low-melanin necromass from H. bicolor R2 |
Appendix B
Appendix B.1
- Indexing of genomes for further use in HISAT2:hisat2-build genome.fa genome
- Writing a SAM file from paired-end RNA-seq files:hisat2 -x genome -1 sample_R1.fastq.gz -2 sample_R2.fastq.gz -S output.sam
- Writing a SAM file from single-end RNA-seq file:hisat2 -x genome_index -U sample.fastq.gz -S output.sam
- Conversion from SAM to BAM format via SAMtools:samtools sort -l 9 -o output.bam -@ 4 output.sam
- Extraction of raw counts from the SAM file:featureCounts -p -t exon -g gene_id -a annotation.gtf -o output.txtoutput.bam
- If (!requireNamespace(“BiocManager”, quietly = TRUE)) {install.packages(“BiocManager”)}BiocManager::install(“DESeq2”)BiocManager::install(“EnhancedVolcano”)install.packages(“writexl”)library(writexl)library(DESeq2)library(EnhancedVolcano)
- cond1_1 <- read.table(“C:/---/cond1_1.txt”, header = TRUE, sep =“\t”, stringsAsFactors = FALSE)cond1_2 <- read.table(“C:/---/cond1_2.txt”, header = TRUE, sep =“\t”, stringsAsFactors = FALSE)cond2_1 <- read.table(“C:/---/cond2_1.txt”, header = TRUE, sep =“\t”, stringsAsFactors = FALSE)cond2_2 <- read.table(“C:/---/cond2_2.txt”, header = TRUE, sep =“\t”, stringsAsFactors = FALSE)
- countData1_cond1_1 <- cond1_1[, 7:ncol(cond1_2)]countData1_cond1_2 <- cond1_2[, 7:ncol(cond1_2)]countData2_cond2_1 <- cond2_1[, 7:ncol(cond2_1)]countData2_cond2_2 <- cond2_1[, 7:ncol(cond2_2)]
- countData1_cond1_1 <- as.data.frame(countData1_cond1_1)countData1_cond1_2 <- as.data.frame(countData1_cond1_2)countData2_cond2_1 <- as.data.frame(countData2_cond2_1)countData2_cond2_2 <- as.data.frame(countData2_cond2_2)
- rownames(countData1_cond1_1) <- cond1_1$Geneidrownames(countData1_cond1_2) <- cond1_2$Geneidrownames(countData2_cond2_1) <- cond2_1$Geneidrownames(countData2_cond2_2) <- cond2_2$Geneid
- countData<-cbind(countData1_cond1_1,countData1_cond1_2,countData2_cond2_1, countData2_cond2_2)colnames(countData) <- c(“Condition1 1”, “Condition1 2”)
- ncol(countData)
- sampleInfo <- data.frame(row.names = colnames(countData),condition = factor(rep(c(“Condition1”, “Condition2”), each = 2)),replicate = factor(rep(c(“Rep1”, “Rep2”), 2)))
- dds <- DESeqDataSetFromMatrix(countData = countData, colData =sampleInfo, design = ~ condition)dds <- estimateSizeFactors(dds)normalized_counts <- counts(dds, normalized=TRUE)normalized_counts_df <- as.data.frame(normalized_counts)normalized_counts_df$GeneID <- rownames(normalized_counts_df)normalized_counts_df <- normalized_counts_df[,c(ncol(normalized_counts_df), 1:(ncol(normalized_counts_df– - 1))]
- write_xlsx(normalized_counts_df“ “C:/---/normalized_counts.xl”x”)
Appendix B.2
| Strain | C-Source | Time Point | Replicate | Ct Values | |||||||
|---|---|---|---|---|---|---|---|---|---|---|---|
| sar1 | act1 | bzp1 | tpc1 | cue1 | ubi1 | sas3 | cbh1 | ||||
| QM6a | Cellulose | 120 | 1 | 19.80 | 19.56 | 18.50 | 19.55 | 18.83 | 19.48 | 20.59 | 17.00 |
| QM6a | Cellulose | 120 | 2 | 21.45 | 21.80 | 18.51 | 19.60 | 19.83 | 19.81 | 21.29 | 18.45 |
| QM6a | Cellulose | 48 | 1 | 18.46 | 17.35 | 19.26 | 20.74 | 19.57 | 20.59 | 22.09 | 11.00 |
| QM6a | Cellulose | 48 | 2 | 18.78 | 18.04 | 18.59 | 19.79 | 18.91 | 19.83 | 21.01 | 11.48 |
| QM6a | DTT | 6 | 1 | 19.84 | 22.19 | 19.97 | 22.40 | 19.60 | 21.08 | 21.66 | 24.65 |
| QM6a | DTT | 6 | 2 | 20.51 | 21.92 | 19.60 | 21.75 | 19.69 | 19.97 | 21.04 | 24.55 |
| QM6a | DTT | 48 | 1 | 21.38 | 23.29 | 18.35 | 19.05 | 18.97 | 18.51 | 19.37 | 26.00 |
| QM6a | DTT | 48 | 2 | 21.90 | 24.03 | 18.51 | 19.34 | 19.66 | 18.63 | 19.77 | 26.55 |
| QM6a | Glucose | 36 | 1 | 23.96 | 22.87 | 17.18 | 18.04 | 17.38 | 17.36 | 18.40 | 30.50 |
| QM6a | Glucose | 36 | 2 | 23.95 | 22.68 | 17.27 | 17.97 | 17.45 | 17.42 | 18.45 | 30.60 |
| QM6a | Glucose | 84 | 1 | 23.44 | 22.54 | 18.41 | 19.24 | 18.89 | 19.10 | 20.35 | 30.65 |
| QM6a | Glucose | 84 | 2 | 24.87 | 24.10 | 18.58 | 19.61 | 19.75 | 19.62 | 21.09 | 31.00 |
| QM6a | Glycerin | 84 | 1 | 23.83 | 24.88 | 21.37 | 21.98 | 22.19 | 20.77 | 22.01 | n.m. 1 |
| QM6a | Glycerin | 84 | 2 | 24.10 | 25.60 | 20.07 | 20.96 | 21.28 | 19.59 | 21.09 | n.m. |
| QM6a | Glycerin | 24 | 1 | 17.08 | 16.81 | 18.72 | 19.52 | 17.93 | 19.26 | 20.89 | n.m. |
| QM6a | Glycerin | 24 | 2 | 17.26 | 16.08 | 19.02 | 19.69 | 17.97 | 19.26 | 20.87 | n.m. |
| QM6a | Lactose | 96 | 2 | 20.81 | 20.13 | 19.03 | 20.06 | 19.99 | 18.63 | 19.68 | 19.70 |
| QM6a | Lactose | 96 | 1 | 21.55 | 20.33 | 17.26 | 18.30 | 18.19 | 16.47 | 17.73 | 24.05 |
| QM6a | Lactose | 72 | 1 | 19.10 | 21.37 | 17.93 | 18.77 | 18.82 | 17.88 | 18.98 | 23.75 |
| QM6a | Lactose | 72 | 2 | 19.67 | 20.73 | 17.88 | 19.15 | 19.25 | 18.20 | 19.37 | 23.40 |
| QM6a | NaCl | 6 | 1 | 21.08 | 21.01 | 18.55 | 19.80 | 19.12 | 18.87 | 19.71 | n.m. |
| QM6a | NaCl | 6 | 2 | 19.90 | 19.99 | 18.22 | 19.49 | 18.72 | 18.67 | 19.68 | n.m. |
| QM6a | NaCl | 24 | 1 | 19.16 | 19.24 | 17.88 | 19.13 | 18.06 | 19.02 | 20.22 | n.m. |
| QM6a | NaCl | 24 | 2 | 19.77 | 20.30 | 18.88 | 20.46 | 19.20 | 20.13 | 21.48 | n.m. |
| QM6a | Xylan | 48 | 1 | 21.62 | 22.38 | 18.82 | 20.26 | 20.54 | 19.18 | 20.65 | n.m. |
| QM6a | Xylan | 48 | 2 | 21.08 | 21.80 | 21.31 | 23.02 | 22.52 | 21.77 | 23.26 | n.m. |
| QM6a | Xylan | 24 | 1 | 18.89 | 18.75 | 17.93 | 18.98 | 18.65 | 18.13 | 19.39 | n.m. |
| QM6a | Xylan | 24 | 2 | 18.12 | 18.03 | 19.02 | 19.95 | 19.11 | 19.41 | 20.37 | n.m. |
| Rut-C30 | Cellulose | 120 | 1 | 20.66 | 20.73 | 18.80 | 19.76 | 19.23 | 19.65 | 20.87 | 9.90 |
| Rut-C30 | Cellulose | 120 | 2 | 20.32 | 21.33 | 17.61 | 18.34 | 17.84 | 18.24 | 19.26 | 9.90 |
| Rut-C30 | Cellulose | 48 | 1 | 17.77 | 17.36 | 18.60 | 19.68 | 18.88 | 19.85 | 21.13 | 19.25 |
| Rut-C30 | Cellulose | 48 | 2 | 17.69 | 17.36 | 18.38 | 19.40 | 18.61 | 19.46 | 20.56 | 16.90 |
| Rut-C30 | DTT | 6 | 1 | 23.88 | 22.19 | 19.67 | 21.70 | 21.20 | 20.22 | 21.43 | 20.65 |
| Rut-C30 | DTT | 6 | 2 | 25.49 | 25.82 | 19.11 | 21.24 | 20.32 | 18.49 | 19.45 | 20.85 |
| Rut-C30 | DTT | 48 | 1 | 20.53 | 19.97 | 20.81 | 22.24 | 20.11 | 21.38 | 22.54 | 23.45 |
| Rut-C30 | DTT | 48 | 2 | 20.96 | 20.73 | 16.79 | 17.86 | 17.63 | 17.31 | 18.56 | 23.45 |
| Rut-C30 | Glucose | 84 | 1 | 23.04 | 23.98 | 18.54 | 19.39 | 19.08 | 19.24 | 20.59 | 21.75 |
| Rut-C30 | Glucose | 84 | 2 | 23.84 | 24.92 | 18.76 | 19.82 | 19.93 | 19.20 | 20.50 | 19.10 |
| Rut-C30 | Glucose | 24 | 1 | 18.62 | 18.82 | 18.53 | 19.33 | 18.91 | 19.37 | 20.43 | 26.50 |
| Rut-C30 | Glucose | 24 | 2 | 18.58 | 18.39 | 19.56 | 20.64 | 20.07 | 20.54 | 22.19 | 26.55 |
| Rut-C30 | Glycerin | 36 | 1 | 20.50 | 19.42 | 17.84 | 18.60 | 18.13 | 17.10 | 17.99 | n.m. |
| Rut-C30 | Glycerin | 36 | 2 | 21.53 | 20.69 | 17.11 | 18.17 | 18.00 | 16.78 | 17.80 | n.m. |
| Rut-C30 | Glycerin | 84 | 1 | 18.87 | 20.41 | 18.36 | 19.58 | 19.02 | 19.29 | 20.40 | n.m. |
| Rut-C30 | Glycerin | 84 | 2 | 18.02 | 19.29 | 18.41 | 19.50 | 19.17 | 18.78 | 20.07 | n.m. |
| Rut-C30 | Lactose | 48 | 1 | 19.96 | 20.20 | 21.54 | 22.46 | 21.24 | 21.55 | 23.05 | 16.40 |
| Rut-C30 | Lactose | 48 | 2 | 19.68 | 20.86 | 20.21 | 21.25 | 21.03 | 20.33 | 21.88 | 14.40 |
| Rut-C30 | Lactose | 72 | 1 | 21.74 | 22.29 | 18.18 | 19.11 | 19.37 | 18.23 | 19.39 | 25.20 |
| Rut-C30 | Lactose | 72 | 2 | 20.01 | 22.33 | 18.75 | 20.07 | 19.98 | 18.87 | 20.17 | 18.70 |
| Rut-C30 | NaCl | 6 | 1 | 20.38 | 19.90 | 17.73 | 19.20 | 18.14 | 18.77 | 19.73 | n.m. |
| Rut-C30 | NaCl | 6 | 2 | 19.95 | 19.28 | 17.31 | 18.60 | 17.53 | 18.09 | 18.92 | n.m. |
| Rut-C30 | NaCl | 24 | 1 | 20.13 | 19.27 | 18.10 | 19.34 | 18.44 | 18.56 | 19.35 | n.m. |
| Rut-C30 | NaCl | 24 | 2 | 21.28 | 20.47 | 18.29 | 18.94 | 18.74 | 18.26 | 19.11 | n.m. |
| Rut-C30 | Xylan | 48 | 1 | 21.95 | 21.70 | 17.57 | 18.67 | 18.59 | 17.65 | 18.80 | n.m. |
| Rut-C30 | Xylan | 48 | 2 | 21.50 | 21.31 | 22.20 | 24.18 | 22.84 | 21.93 | 23.46 | n.m. |
| Rut-C30 | Xylan | 24 | 1 | 20.05 | 18.94 | 20.10 | 21.32 | 20.61 | 19.67 | 21.04 | n.m. |
| Rut-C30 | Xylan | 24 | 2 | 19.82 | 19.01 | 19.50 | 20.59 | 20.14 | 19.16 | 20.34 | n.m. |
| Subgroup | Calculation Method | Gene | Rank | Calculated Value 1 |
|---|---|---|---|---|
| QM6a | DeltaCT | bzp1 | 1 | 1.310 |
| tpc1 | 3 | 1.336 | ||
| cue1 | 2 | 1.330 | ||
| ubi1 | 4 | 1.374 | ||
| sas3 | 5 | 1.396 | ||
| act1 | 7 | 2.211 | ||
| sar1 | 6 | 2.033 | ||
| QM6a | BestKeeper | bzp1 | 1 | 0.92 |
| tpc1 | 4 | 1.01 | ||
| cue1 | 3 | 0.99 | ||
| ubi1 | 2 | 0.95 | ||
| sas3 | 5 | 1.10 | ||
| act1 | 7 | 1.91 | ||
| sar1 | 6 | 1.64 | ||
| QM6a | Normfinder | bzp1 | 2 | 0.702 |
| tpc1 | 3 | 0.840 | ||
| cue1 | 1 | 0.547 | ||
| ubi1 | 4 | 0.959 | ||
| sas3 | 5 | 0.995 | ||
| act1 | 7 | 2.017 | ||
| sar1 | 6 | 1.753 | ||
| QM6a | Genorm | ubi1/sas3 | 1/2 | 0.508 |
| tpc1 | 3 | 0.717 | ||
| bzp1 | 4 | 0.778 | ||
| cue1 | 5 | 0.865 | ||
| sar1 | 6 | 1.314 | ||
| act1 | 7 | 1.570 | ||
| Rut-C30 | DeltaCT | bzp1 | 1 | 1.213 |
| cue1 | 2 | 1.226 | ||
| tpc1 | 3 | 1.257 | ||
| ubi1 | 4 | 1.359 | ||
| sas3 | 5 | 1.457 | ||
| act1 | 6 | 2.037 | ||
| sar1 | 7 | 2.038 | ||
| Rut-C30 | BestKeeper | ubi1 | 1 | 1.04 |
| cue1 | 2 | 1.17 | ||
| bzp1 | 3 | 1.20 | ||
| sas3 | 4 | 1.20 | ||
| tpc1 | 5 | 1.35 | ||
| sar1 | 6 | 1.48 | ||
| act1 | 7 | 1.56 | ||
| Rut-C30 | Normfinder | cue1 | 1 | 0.527 |
| bzp1 | 2 | 0.568 | ||
| tpc1 | 3 | 0.725 | ||
| ubi1 | 4 | 0.854 | ||
| sas3 | 5 | 1.139 | ||
| act1 | 6 | 1.823 | ||
| sar1 | 7 | 1.826 | ||
| Rut-C30 | Genorm | bzp1/tpc1 | 1/2 | 0.448 |
| cue1 | 3 | 0.541 | ||
| sas3 | 4 | 0.764 | ||
| ubi1 | 5 | 0.823 | ||
| act1 | 6 | 1.303 | ||
| sar1 | 7 | 1.513 | ||
| Early | DeltaCT | Tpc1 | 1 | 1.279 |
| Bzp1 | 2 | 1.300 | ||
| cue1 | 3 | 1.359 | ||
| ubi1 | 4 | 1.462 | ||
| sas3 | 5 | 1.582 | ||
| act1 | 6 | 2.125 | ||
| sar1 | 7 | 2.190 | ||
| Early | BestKeeper | bzp1 | 1 | 0.93 |
| ubi1 | 2 | 0.94 | ||
| cue1 | 3 | 1.02 | ||
| tpc1 | 4 | 1.06 | ||
| sas3 | 5 | 1.19 | ||
| sar1 | 6 | 1.43 | ||
| act1 | 7 | 1.58 | ||
| Early | Normfinder | tpc1 | 1 | 0.503 |
| cue1 | 2 | 0.572 | ||
| bzp1 | 3 | 0.637 | ||
| ubi1 | 4 | 1.023 | ||
| sas3 | 5 | 1.300 | ||
| act1 | 6 | 1.882 | ||
| sar1 | 7 | 1.987 | ||
| Early | Genorm | bzp1/tpc1 | 1/2 | 0.609 |
| ubi1 | 3 | 0.791 | ||
| sas3 | 4 | 0.837 | ||
| cue1 | 5 | 0.903 | ||
| act1 | 6 | 1.383 | ||
| sar1 | 7 | 1.614 | ||
| Late | DeltaCT | bzp1 | 1 | 1.120 |
| cue1 | 2 | 1.126 | ||
| sas3 | 3 | 1.164 | ||
| Ubi1 | 4 | 1.181 | ||
| tpc1 | 5 | 1.236 | ||
| sar1 | 6 | 1.698 | ||
| act1 | 7 | 1.841 | ||
| Late | BestKeeper | Ubi1 | 1 | 1.00 |
| sar1 | 2 | 1.19 | ||
| sas3 | 3 | 1.19 | ||
| cue1 | 4 | 1.22 | ||
| bzp1 | 5 | 1.23 | ||
| tpc1 | 6 | 1.30 | ||
| act1 | 7 | 1.52 | ||
| Late | Normfinder | cue1 | 1 | 0.555 |
| bzp1 | 2 | 0.607 | ||
| sas3 | 3 | 0.722 | ||
| Ubi1 | 4 | 0.737 | ||
| tpc1 | 5 | 0.926 | ||
| sar1 | 6 | 1.451 | ||
| act1 | 7 | 1.663 | ||
| Late | Genorm | bzp1/tpc1 | 1/2 | 0.574 |
| cue1 | 3 | 0.638 | ||
| sas3 | 4 | 0.766 | ||
| ubi1 | 5 | 0.785 | ||
| sar1 | 6 | 1.138 | ||
| act1 | 7 | 1.339 |
References
- Fischer, A.J.; Maiyuran, S.; Yaver, D.S. Industrial Relevance of Trichoderma Reesei as an Enzyme Producer. Methods Mol. Biol. 2021, 2234, 23–43. [Google Scholar] [CrossRef]
- Bhat, M.K. Cellulases and Related Enzymes in Biotechnology. Biotechnol. Adv. 2000, 18, 355–383. [Google Scholar] [CrossRef]
- Fonseca, L.M.; Parreiras, L.S.; Murakami, M.T. Rational Engineering of the Trichoderma Reesei RUT-C30 Strain into an Industrially Relevant Platform for Cellulase Production. Biotechnol. Biofuels 2020, 13, 93. [Google Scholar] [CrossRef] [PubMed]
- Singh, K.P.; Miaskowski, C.; Dhruva, A.A.; Flowers, E.; Kober, K.M. Mechanisms and Measurement of Changes in Gene Expression. Biol. Res. Nurs. 2018, 20, 369–382. [Google Scholar] [CrossRef] [PubMed]
- Lovén, J.; Orlando, D.A.; Sigova, A.A.; Lin, C.Y.; Rahl, P.B.; Burge, C.B.; Levens, D.L.; Lee, T.I.; Young, R.A. Revisiting Global Gene Expression Analysis. Cell 2012, 151, 476–482. [Google Scholar] [CrossRef]
- Freeman, W.M.; Robertson, D.J.; Vrana, K.E. Fundamentals of DNA Hybridization Arrays for Gene Expression Analysis. Biotechniques 2000, 29, 1042–1055. [Google Scholar] [CrossRef]
- Ma, Y.; Dissen, G.; Rage, F.; Ojeda, S. RNase Protection Assay. Methods 1996, 10, 273–278. [Google Scholar] [CrossRef] [PubMed]
- Kukurba, K.R.; Montgomery, S.B. RNA Sequencing and Analysis. Cold Spring Harb. Protoc. 2015, 2015, 951–969. [Google Scholar] [CrossRef]
- Corchete, L.A.; Rojas, E.A.; Alonso-López, D.; De Las Rivas, J.; Gutiérrez, N.C.; Burguillo, F.J. Systematic Comparison and Assessment of RNA-Seq Procedures for Gene Expression Quantitative Analysis. Sci. Rep. 2020, 10, 19737. [Google Scholar] [CrossRef]
- Orlando, C.; Pinzani, P.; Pazzagli, M. Developments in Quantitative PCR. Clin. Chem. Lab. Med. 1998, 36, 255–269. [Google Scholar] [CrossRef]
- Heid, C.A.; Stevens, J.; Livak, K.J.; Williams, P.M. Real Time Quantitative PCR. Genome Res. 1996, 6, 986–994. [Google Scholar] [CrossRef]
- Kozera, B.; Rapacz, M. Reference Genes in Real-Time PCR. J. Appl. Genet. 2013, 54, 391–406. [Google Scholar] [CrossRef] [PubMed]
- Bustin, S.A.; Benes, V.; Garson, J.A.; Hellemans, J.; Huggett, J.; Kubista, M.; Mueller, R.; Nolan, T.; Pfaffl, M.W.; Shipley, G.L.; et al. The MIQE Guidelines: Minimum Information for Publication of Quantitative Real-Time PCR Experiments. Clin. Chem. 2009, 55, 611–622. [Google Scholar] [CrossRef]
- Vandesompele, J.; De Preter, K.; Pattyn, F.; Poppe, B.; Van Roy, N.; De Paepe, A.; Speleman, F. Accurate Normalization of Real-Time Quantitative RT-PCR Data by Geometric Averaging of Multiple Internal Control Genes. Genome Biol. 2002, 3, research0034.1. [Google Scholar] [CrossRef]
- Andersen, C.L.; Jensen, J.L.; Ørntoft, T.F. Normalization of Real-Time Quantitative Reverse Transcription-PCR Data: A Model-Based Variance Estimation Approach to Identify Genes Suited for Normalization, Applied to Bladder and Colon Cancer Data Sets. Cancer Res. 2004, 64, 5245–5250. [Google Scholar] [CrossRef] [PubMed]
- Pfaffl, M.W.; Tichopad, A.; Prgomet, C.; Neuvians, T.P. Determination of Stable Housekeeping Genes, Differentially Regulated Target Genes and Sample Integrity: BestKeeper-Excel-Based Tool Using Pair-Wise Correlations. Biotechnol. Lett. 2004, 26, 509–515. [Google Scholar] [CrossRef]
- Silver, N.; Best, S.; Jiang, J.; Thein, S.L. Selection of Housekeeping Genes for Gene Expression Studies in Human Reticulocytes Using Real-Time PCR. BMC Mol. Biol. 2006, 7, 33. [Google Scholar] [CrossRef] [PubMed]
- Zhou, Z.; Cong, P.; Tian, Y.; Zhu, Y. Using RNA-Seq Data to Select Reference Genes for Normalizing Gene Expression in Apple Roots. PLoS ONE 2017, 12, e0185288. [Google Scholar] [CrossRef]
- Freitas, F.C.P.; Depintor, T.S.; Agostini, L.T.; Luna-Lucena, D.; Nunes, F.M.F.; Bitondi, M.M.G.; Simões, Z.L.P.; Lourenço, A.P. Evaluation of Reference Genes for Gene Expression Analysis by Real-Time Quantitative PCR (qPCR) in Three Stingless Bee Species (Hymenoptera: Apidae: Meliponini). Sci. Rep. 2019, 9, 17692. [Google Scholar] [CrossRef]
- Chervoneva, I.; Li, Y.; Schulz, S.; Croker, S.; Wilson, C.; Waldman, S.A.; Hyslop, T. Selection of Optimal Reference Genes for Normalization in Quantitative RT-PCR. BMC Bioinform. 2010, 11, 253. [Google Scholar] [CrossRef]
- Steiger, M.G.; Mach, R.L.; Mach-Aigner, A.R. An Accurate Normalization Strategy for RT-QPCR in Hypocrea jecorina (Trichoderma reesei). J. Biotechnol. 2010, 145, 30–37. [Google Scholar] [CrossRef] [PubMed]
- Tao, Y.; van Peer, A.F.; Huang, Q.; Shao, Y.; Zhang, L.; Xie, B.; Jiang, Y.; Zhu, J.; Xie, B. Identification of Novel and Robust Internal Control Genes from Volvariella volvacea That Are Suitable for RT-QPCR in Filamentous Fungi. Sci. Rep. 2016, 6, 29236. [Google Scholar] [CrossRef]
- Fu, N.; Li, J.; Wang, M.; Ren, L.; Zong, S.; Luo, Y. Identification and Validation of Reference Genes for Gene Expression Analysis in Different Development Stages of Amylostereum areolatum. Front. Microbiol. 2021, 12, 827241. [Google Scholar] [CrossRef] [PubMed]
- Besleaga, M.; Vignolle, G.A.; Kopp, J.; Spadiut, O.; Mach, R.L.; Mach-Aigner, A.R.; Zimmermann, C. Evaluation of Reference Genes for Transcript Analyses in Komagataella phaffii (Pichia pastoris). Fungal Biol. Biotechnol. 2023, 10, 7. [Google Scholar] [CrossRef] [PubMed]
- Xie, F.; Wang, J.; Zhang, B. RefFinder: A Web-Based Tool for Comprehensively Analyzing and Identifying Reference Genes. Funct. Integr. Genomics 2023, 23, 125. [Google Scholar] [CrossRef]
- Montecourt, B.S.; Eveleigh, D.E. Selective Screening Methods for the Isolation of High Yielding Cellulase Mutants of Trichoderma reesei. In Hydrolysis of Cellulose: Mechanisms of Enzymatic and Acid Catalysis; Advances in Chemistry Series; Brown, R., Jurasek, L., Eds.; American Chemical Society: Washington, DC, USA, 1979; Volume 181, pp. 289–301. [Google Scholar]
- European Bioinformatics Institute (EMBL-EBI). SRA FTP Site. Available online: https://ftp.sra.ebi.ac.uk/ (accessed on 1 July 2024).
- Kim Lab at UT Southwestern Medical Center HISAT2—Graph-Based Alignment of Next Generation Sequencing Reads to a Population of Genomes HISAT2—Graph-Based Alignment of Next Generation Sequencing Reads to a Population of Genomes. 2024. Available online: https://daehwankimlab.github.io/hisat2/ (accessed on 5 July 2024).
- The SAMtools Development Team. SAMtools [Internet]. 2024. Available online: https://www.htslib.org/ (accessed on 5 July 2024).
- Liao, Y.; Smyth, G.K.; Shi, W. FeatureCounts: An Efficient General Purpose Program for Assigning Sequence Reads to Genomic Features. Bioinformatics 2014, 30, 923–930. [Google Scholar] [CrossRef]
- The Subread Project. featureCounts: An Ultrafast and Accurate Read Summarization Program [Internet]. Available online: https://subread.sourceforge.net/featureCounts.html (accessed on 5 July 2024).
- Love Lab, University of North Carolina at Chapel Hill. DESeq2: Differential Gene Expression Analysis Based on the Negative Binomial Distribution [Internet]. Available online: https://github.com/thelovelab/DESeq2 (accessed on 5 July 2024).
- Pertea, G. gffRead: GFF/GTF Utility Providing Format Conversions, Region Filtering, FASTA Sequence Extraction and More [Internet]. 2021. Available online: https://github.com/gpertea/gffread (accessed on 5 July 2024).
- Altschul, S.F.; Gish, W.; Miller, W.; Myers, E.W.; Lipman, D.J. Basic local alignment search tool. J. Mol. Biol. 1990, 215, 403–410. [Google Scholar] [CrossRef]
- Hernández-Plaza, A.; Szklarczyk, D.; Botas, J.; Cantalapiedra, C.P.; Giner-Lamia, J.; Mende, D.R.; Kirsch, R.; Rattei, T.; Letunic, I.; Jensen, L.J.; et al. EggNOG 6.0: Enabling Comparative Genomics across 12,535 Organisms. Nucleic Acids Res. 2023, 51, D389–D394. [Google Scholar] [CrossRef]
- Szklarczyk, D.; Kirsch, R.; Koutrouli, M.; Nastou, K.; Mehryary, F.; Hachilif, R.; Gable, A.L.; Fang, T.; Doncheva, N.T.; Pyysalo, S.; et al. The STRING Database in 2023: Protein-Protein Association Networks and Functional Enrichment Analyses for Any Sequenced Genome of Interest. Nucleic Acids Res. 2023, 51, D638–D646. [Google Scholar] [CrossRef]
- Guo, L.; Han, L.; Yang, L.; Zeng, H.; Fan, D.; Zhu, Y.; Feng, Y.; Wang, G.; Peng, C.; Jiang, X.; et al. Genome and Transcriptome Analysis of the Fungal Pathogen Fusarium oxysporum f. sp. cubense Causing Banana Vascular Wilt Disease. PLoS ONE 2014, 9, e95543. [Google Scholar] [CrossRef]
- Kocsis, B.; Lee, M.-K.; Yu, J.-H.; Nagy, T.; Daróczi, L.; Batta, G.; Pócsi, I.; Leiter, É. Functional Analysis of the BZIP-Type Transcription Factors AtfA and AtfB in Aspergillus nidulans. Front. Microbiol. 2022, 13, 1003709. [Google Scholar] [CrossRef] [PubMed]
- Leiter, É.; Emri, T.; Pákozdi, K.; Hornok, L.; Pócsi, I. The Impact of BZIP Atf1ortholog Global Regulators in Fungi. Appl. Microbiol. Biotechnol. 2021, 105, 5769–5783. [Google Scholar] [CrossRef] [PubMed]
- Wendler, F.; Gillingham, A.K.; Sinka, R.; Rosa-Ferreira, C.; Gordon, D.E.; Franch-Marro, X.; Peden, A.A.; Vincent, J.-P.; Munro, S. A Genome-Wide RNA Interference Screen Identifies Two Novel Components of the Metazoan Secretory Pathway. EMBO J. 2010, 29, 304–314. [Google Scholar] [CrossRef] [PubMed]
- Shih, S.C.; Prag, G.; Francis, S.A.; Sutanto, M.A.; Hurley, J.H.; Hicke, L. A Ubiquitin-Binding Motif Required for Intramolecular Monoubiquitylation, the CUE Domain. EMBO J. 2003, 22, 1273–1281. [Google Scholar] [CrossRef]
- Huang, D.T.; Walden, H.; Duda, D.; Schulman, B.A. Ubiquitin-like Protein Activation. Oncogene 2004, 23, 1958–1971. [Google Scholar] [CrossRef]
- Kwon, J.-Y.; Choi, Y.-H.; Lee, M.-W.; Yu, J.-H.; Shin, K.-S. The MYST Family Histone Acetyltransferase SasC Governs Diverse Biological Processes in Aspergillus fumigatus. Cells 2023, 12, 2642. [Google Scholar] [CrossRef]
- Mach-Aigner, A.R.; Pucher, M.E.; Steiger, M.G.; Bauer, G.E.; Preis, S.J.; Mach, R.L. Transcriptional Regulation of Xyr1, Encoding the Main Regulator of the Xylanolytic and Cellulolytic Enzyme System in Hypocrea jecorina. Appl. Environ. Microbiol. 2008, 74, 6554–6562. [Google Scholar] [CrossRef]
- Häkkinen, M.; Valkonen, M.J.; Westerholm-Parvinen, A.; Aro, N.; Arvas, M.; Vitikainen, M.; Penttilä, M.; Saloheimo, M.; Pakula, T.M. Screening of Candidate Regulators for Cellulase and Hemicellulase Production in Trichoderma reesei and Identification of a Factor Essential for Cellulase Production. Biotechnol. Biofuels 2014, 7, 14. [Google Scholar] [CrossRef]
- Messner, R.; Kubicek, C.P. Carbon Source Control of Cellobiohydrolase I and II Formation by Trichoderma reesei. Appl. Environ. Microbiol. 1991, 57, 630–635. [Google Scholar] [CrossRef]
- Margolles-Clark, E.; Ihnen, M.; Penttilä, M. Expression Patterns of Ten Hemicellulase Genes of the Filamentous Fungus Trichoderma reesei on Various Carbon Sources. J. Biotechnol. 1997, 57, 167–179. [Google Scholar] [CrossRef]
- Ilmén, M.; Saloheimo, A.; Onnela, M.L.; Penttilä, M.E. Regulation of Cellulase Gene Expression in the Filamentous Fungus Trichoderma reesei. Appl. Environ. Microbiol. 1997, 63, 1298–1306. [Google Scholar] [CrossRef]
- Bisaria, V.S.; Ghose, T.K. Biodegradation of Cellulosic Materials: Substrates, Microorganisms, Enzymes and Products. Enzyme Microb. Technol. 1981, 3, 90–104. [Google Scholar] [CrossRef]
- Pakula, T.M.; Laxell, M.; Huuskonen, A.; Uusitalo, J.; Saloheimo, M.; Penttilä, M. The Effects of Drugs Inhibiting Protein Secretion in the Filamentous Fungus Trichoderma reesei. J. Biol. Chem. 2003, 278, 45011–45020. [Google Scholar] [CrossRef] [PubMed]
- Dheda, K.; Huggett, J.F.; Chang, J.S.; Kim, L.U.; Bustin, S.A.; Johnson, M.A.; Rook, G.A.W.; Zumla, A. The Implications of Using an Inappropriate Reference Gene for Real-Time Reverse Transcription PCR Data Normalization. Anal. Biochem. 2005, 344, 141–143. [Google Scholar] [CrossRef]
- Flatschacher, D.; Eschlböck, A.; Zeilinger, S. Identification and Evaluation of Suitable Reference Genes for RT-QPCR Analyses in Trichoderma atroviride under Varying Light Conditions. Fungal Biol. Biotechnol. 2023, 10, 20. [Google Scholar] [CrossRef]
- Cusick, K.D.; Fitzgerald, L.A.; Pirlo, R.K.; Cockrell, A.L.; Petersen, E.R.; Biffinger, J.C. Selection and Evaluation of Reference Genes for Expression Studies with Quantitative PCR in the Model Fungus Neurospora Crassa under Different Environmental Conditions in Continuous Culture. PLoS ONE 2014, 9, e112706. [Google Scholar] [CrossRef] [PubMed]
- Teste, M.-A.; Duquenne, M.; François, J.M.; Parrou, J.-L. Validation of Reference Genes for Quantitative Expression Analysis by Real-Time RT-PCR in Saccharomyces cerevisiae. BMC Mol. Biol. 2009, 10, 99. [Google Scholar] [CrossRef] [PubMed]
- Li, Q.; Skinner, J.; Bennett, J.E. Evaluation of Reference Genes for Real-Time Quantitative PCR Studies in Candida Glabrata Following Azole Treatment. BMC Mol. Biol. 2012, 13, 22. [Google Scholar] [CrossRef]
- Ruan, W.; Lai, M. Actin, a Reliable Marker of Internal Control? Clin. Chim. Acta 2007, 385, 1–5. [Google Scholar] [CrossRef]
- Llanos, A.; François, J.M.; Parrou, J.-L. Tracking the Best Reference Genes for RT-QPCR Data Normalization in Filamentous Fungi. BMC Genomics 2015, 16, 71. [Google Scholar] [CrossRef]
- Pinto, F.; Pacheco, C.C.; Ferreira, D.; Moradas-Ferreira, P.; Tamagnini, P. Selection of Suitable Reference Genes for RT-QPCR Analyses in Cyanobacteria. PLoS ONE 2012, 7, e34983. [Google Scholar] [CrossRef] [PubMed]
- de Boer, M.E.; de Boer, T.E.; Mariën, J.; Timmermans, M.J.T.N.; Nota, B.; van Straalen, N.M.; Ellers, J.; Roelofs, D. Reference Genes for QRT-PCR Tested under Various Stress Conditions in Folsomia Candida and Orchesella cincta (Insecta, Collembola). BMC Mol. Biol. 2009, 10, 54. [Google Scholar] [CrossRef]
- Li, M.-Y.; Wang, F.; Jiang, Q.; Wang, G.-L.; Tian, C.; Xiong, A.-S. Validation and Comparison of Reference Genes for qPCR Normalization of Celery (Apium graveolens) at Different Development Stages. Front. Plant Sci. 2016, 7, 313. [Google Scholar] [CrossRef] [PubMed]
- Duan, Y.; Han, R.; Su, Y.; Wang, A.; Li, S.; Sun, H.; Gong, H. Transcriptional Search to Identify and Assess Reference Genes for Expression Analysis in Solanumlycopersicum under Stress and Hormone Treatment Conditions. J. Integr. Agric. 2022, 21, 3216–3229. [Google Scholar] [CrossRef]
- Xu, L.; Schulpen, J.; de Vries, R.P.; Peng, M. Identification of Putative Fungal Reference Genes with Stable Expression from Large RNA-Seq Datasets. Fungal Genet. Biol. 2025, 178, 103985. [Google Scholar] [CrossRef]
- Kim, H.-K.; Yun, S.-H. Evaluation of Potential Reference Genes for Quantitative RT-PCR Analysis in Fusarium Graminearum under Different Culture Conditions. Plant Pathol. J. 2011, 27, 301–309. [Google Scholar] [CrossRef]
- Mitsis, T.; Efthimiadou, A.; Bacopoulou, F.; Vlachakis, D.; Chrousos, G.; Eliopoulos, E. Transcription Factors and Evolution: An Integral Part of Gene Expression (Review). World Acad. Sci. J. 2020, 2, 3–8. [Google Scholar] [CrossRef]
- Calkhoven, C.F.; Ab, G. Multiple Steps in the Regulation of Transcription-Factor Level and Activity. Biochem. J. 1996, 317 Pt 2, 329–342. [Google Scholar] [CrossRef] [PubMed]
- Shepherd, M.J.; Reynolds, M.; Pierce, A.P.; Rice, A.M.; Taylor, T.B. Transcription Factor Expression Levels and Environmental Signals Constrain Transcription Factor Innovation. Microbiology 2023, 169, 001378. [Google Scholar] [CrossRef]
- East China University of Science and Technology Transcriptional Profile of the Trichoderma reesei OEtre105752 Mutant. Available online: https://www.ncbi.nlm.nih.gov/bioproject/PRJNA948159 (accessed on 7 July 2024).
- East China University of Science and Technology Transcriptional Profile of the Trichoderma reesei Ace3 Deletion Mutant Cultured in the Presence of Lactose. Available online: https://www.ncbi.nlm.nih.gov/bioproject/PRJNA526091 (accessed on 7 July 2024).
- Brazilian Bioethanol Science and Technology Laboratory (CTBE) Global Transcriptome and Gene Regulatory Network of MAPK Signaling Pathway in Trichoderma reesei During Sugarcane Bagasse Degradation. Available online: https://www.ncbi.nlm.nih.gov/bioproject/PRJNA392276 (accessed on 7 July 2024).
- Hitzenhammer, E.; Büschl, C.; Sulyok, M.; Schuhmacher, R.; Kluger, B.; Wischnitzki, E.; Schmoll, M. YPR2 Is a Light Dependent Regulator of Carbon and Secondary Metabolism in Trichoderma reesei. BMC Genom. 2019, 20, 211. Available online: https://www.ncbi.nlm.nih.gov/bioproject/PRJNA488233 (accessed on 7 July 2024). [CrossRef]
- East China University of Science and Technology Comparing the Two Transcriptomes of Trichoderma reesei QM6a Cultured with 0 and 1% DMF in Liquid MM Containing 1% Avicel as the Sole Carbon Source. Available online: https://www.ncbi.nlm.nih.gov/bioproject/PRJNA510366 (accessed on 7 July 2024).
- Working Group Mattanovich, Department of Biotechnology, University of Natural Resources and Life Sciences. RNAseq Analysis of Trichoderma reesei QM6a and Δace1 Transferred to MA Medium Containing 1% D-Mannitol as Carbon Source. Available online: https://www.ncbi.nlm.nih.gov/bioproject/PRJNA528215 (accessed on 7 July 2024).
- DOE Joint Genome Institute (JGI). Trichoderma reesei QM6a Crude Substrate Gene Expression Profiling. Available online: https://www.ncbi.nlm.nih.gov/bioproject/PRJNA695932 (accessed on 7 July 2024).
- Alharake, J.; Bidard, F.; Aouam, T.; Sénamaud-Beaufort, C.; Margeot, A.; Heiss-Blanquet, S. Effect of the Res2 Transcription Factor Gene Deletion on Protein Secretion and Stress Response in the Hyperproducer Strain Trichoderma reesei Rut-C30. BMC Microbiol. 2023, 23, 374. [Google Scholar] [CrossRef] [PubMed]
- Borin, G.P.; Sanchez, C.C.; de Souza, A.P.; de Santana, E.S.; de Souza, A.T.; Leme, A.F.P.; Squina, F.M.; Buckeridge, M.; Goldman, G.H.; de Castro Oliveira, J.V. Comparative Secretome Analysis of Trichoderma reesei and Aspergillus niger during Growth on Sugarcane Biomass. PLoS ONE 2015, 10, e0129275. [Google Scholar] [CrossRef] [PubMed]
- Li, N.; Li, J.; Chen, Y.; Shen, Y.; Wei, D.; Wang, W. Mechanism of Zn2+ Regulation of Cellulase Production in Trichoderma reesei Rut-C30. Biotechnol. Biofuels Bioprod. 2023, 16, 73. [Google Scholar] [CrossRef] [PubMed]
- Schilling Lab, Department of Plant and Microbial Biology, University of Minnesota. Melanization of Fungal Necromass Drives the Upregulation of Multiple Chitinase, Protease, and Laccase Genes When Being Degraded by Trichoderma reesei [Internet]. 2024. Available online: https://www.ncbi.nlm.nih.gov/bioproject/PRJNA1097855 (accessed on 7 July 2024).


| Growth Condition | Cultivation Volume (mL) | QM6a | Rut-C30 |
|---|---|---|---|
| Glucose | 200 | 36 h/84 h | 24 h/84 h |
| Lactose | 200 | 72 h/96 h | 48 h/72 h |
| Xylan | 200 | 24 h/48 h | 24 h/48 h |
| Glycerin | 200 | 24 h/84 h | 36 h/84 h |
| Cellulose | 200 | 48 h/120 h | 48 h/120 h |
| Lactose-DTT | 50 | 6 h/48 h | 6 h/48 h |
| Glucose-NaCl | 50 | 6 h/24 h | 6 h/24 h |
| Gene Name | Primer Sequences (5′-3′) | Amplicon Length (bp) |
|---|---|---|
| act1 | Fwd: TGAGAGCGGTGGTATCCACG Rev: GGTACCACCAGACATGACAATGTTG | 103 |
| sar1 | Fwd: TGGATCGTCAACTGGTTCTACGA Rev: GCATGTGTAGCAACGTGGTCTTT | 115 |
| bzp1 | Fwd: GGCCTTTCTTTGAGCAGTGATG Rev: AGCTGCCCTTTGTTGTTGTC | 92 |
| tpc1 | Fwd: TATGCGAATGAGCCGATTCC Rev: AACGTCCAGCTTCACATTGG | 78 |
| cue1 | Fwd: GCGTAATCAAGGCGGTTCTG Rev: TGTTTTGCGGCTCGTTCTTG | 108 |
| ubi1 | Fwd: TCAAATGCGGGCGACAAAAG Rev: TGTTGACCGGATGTTTGCAC | 112 |
| sas3 | Fwd: ATCGCGTGCTGTACATTTGC Rev: TGTTTCGCAGCGCATTTGAG | 91 |
| cbh1 | Fwd: ACTATGTCCAGAATGGCGTC Rev: TGGCGTAGTAATCATCCC | 209 |
| Gene Name | Gene Description | Transcript ID | CV (QM6a) | CV (Rut-C30) |
|---|---|---|---|---|
| bzp1 | B-ZIP domain protein | TRIREDRAFT_50536 | 0.1450 | 0.1038 |
| tpc1 | Trafficking protein particle complex subunit 1 | TRIREDRAFT_49838 | 0.2169 | 0.0993 |
| cue1 | CUE domain-containing protein | TRIREDRAFT_29932 | 0.2743 | 0.1691 |
| ubi1 | ubiquitin-like 1-activating enzyme E1 B | TRIREDRAFT_61945 | 0.1367 | 0.1340 |
| sas3 | Histone acetyltransferase SAS3 | TRIREDRAFT_5916 | 0.1787 | 0.1237 |
| act1 | Actin | TRIREDRAFT_44504 | 0.3725 | 0.3534 |
| sar1 | Secretion-associated Ras-related GTPase | TRIREDRAFT_61470 | 0.9250 | 0.6846 |
Disclaimer/Publisher’s Note: The statements, opinions and data contained in all publications are solely those of the individual author(s) and contributor(s) and not of MDPI and/or the editor(s). MDPI and/or the editor(s) disclaim responsibility for any injury to people or property resulting from any ideas, methods, instructions or products referred to in the content. |
© 2025 by the authors. Licensee MDPI, Basel, Switzerland. This article is an open access article distributed under the terms and conditions of the Creative Commons Attribution (CC BY) license (https://creativecommons.org/licenses/by/4.0/).
Share and Cite
Danner, C.; Karpenko, Y.; Mach, R.L.; Mach-Aigner, A.R. Act1 out of Action: Identifying Reliable Reference Genes in Trichoderma reesei for Gene Expression Analysis. J. Fungi 2025, 11, 396. https://doi.org/10.3390/jof11050396
Danner C, Karpenko Y, Mach RL, Mach-Aigner AR. Act1 out of Action: Identifying Reliable Reference Genes in Trichoderma reesei for Gene Expression Analysis. Journal of Fungi. 2025; 11(5):396. https://doi.org/10.3390/jof11050396
Chicago/Turabian StyleDanner, Caroline, Yuriy Karpenko, Robert L. Mach, and Astrid R. Mach-Aigner. 2025. "Act1 out of Action: Identifying Reliable Reference Genes in Trichoderma reesei for Gene Expression Analysis" Journal of Fungi 11, no. 5: 396. https://doi.org/10.3390/jof11050396
APA StyleDanner, C., Karpenko, Y., Mach, R. L., & Mach-Aigner, A. R. (2025). Act1 out of Action: Identifying Reliable Reference Genes in Trichoderma reesei for Gene Expression Analysis. Journal of Fungi, 11(5), 396. https://doi.org/10.3390/jof11050396