
Neural Network-Aided Milk Somatic Cell Count Increase Prediction

 , ,
, , 
Simple Summary
Abstract
1. Introduction
2. Materials and Methods
2.1. Data Collection
2.2. Data Preprocessing
2.3. Evaluation Metrics
2.4. Model Training
2.5. Combination of Tests
3. Results
4. Discussion
5. Conclusions
Author Contributions
Funding
Institutional Review Board Statement
Informed Consent Statement
Data Availability Statement
Conflicts of Interest
References
- Ruegg, P.; Pantoja, J. Understanding and using somatic cell counts to improve milk quality. Ir. J. Agric. Food Res. 2013, 52, 101–117. [Google Scholar]
- Cobirka, M.; Tancin, V.; Slama, P. Epidemiology and classification of mastitis. Animals 2020, 10, 2212. [Google Scholar] [CrossRef] [PubMed]
- Leitner, G.; Blum, S.E.; Krifucks, O.; Lavon, Y.; Jacoby, S.; Seroussi, E. Alternative Traits for Genetic Evaluation of Mastitis Based on Lifetime Merit. Genes 2024, 15, 92. [Google Scholar] [CrossRef] [PubMed]
- Martins, L.; Barcelos, M.M.; Cue, R.I.; Anderson, K.L.; Dos Santos, M.V.; Gonçalves, J.L. Chronic subclinical mastitis reduces milk and components yield at the cow level. J. Dairy Res. 2020, 87, 298–305. [Google Scholar] [CrossRef]
- Liu, J.; Liu, H.; Cao, G.; Cui, Y.; Wang, H.; Chen, X.; Xu, F.; Li, X. Microbiota characterization of the cow mammary gland microenvironment and its association with somatic cell count. Vet. Sci. 2023, 10, 699. [Google Scholar] [CrossRef]
- Pakrashi, A.; Ryan, C.; Guéret, C.; Berry, D.; Corcoran, M.; Keane, M.T.; Mac Namee, B. Early detection of subclinical mastitis in lactating dairy cows using cow-level features. J. Dairy Sci. 2023, 106, 4978–4990. [Google Scholar] [CrossRef]
- Bindel, L.J.; Seifert, R. Most European countries will miss EU targets on antibacterial use by 2030: Historical analysis of European and OECD countries, comparison of community and hospital sectors and forecast to 2040. Naunyn-Schmiedeberg’s Arch. Pharmacol. 2025, 1–26. [Google Scholar] [CrossRef]
- Silva, S.R.; Araujo, J.P.; Guedes, C.; Silva, F.; Almeida, M.; Cerqueira, J.L. Precision technologies to address dairy cattle welfare: Focus on lameness, mastitis and body condition. Animals 2021, 11, 2253. [Google Scholar] [CrossRef]
- Bobbo, T.; Biffani, S.; Taccioli, C.; Penasa, M.; Cassandro, M. Comparison of machine learning methods to predict udder health status based on somatic cell counts in dairy cows. Sci. Rep. 2021, 11, 13642. [Google Scholar] [CrossRef]
- Wang, Y.; Kang, X.; He, Z.; Feng, Y.; Liu, G. Accurate detection of dairy cow mastitis with deep learning technology: A new and comprehensive detection method based on infrared thermal images. Animal 2022, 16, 100646. [Google Scholar] [CrossRef]
- Kawai, K.; Hayashi, T.; Kiku, Y.; Chiba, T.; Nagahata, H.; Higuchi, H.; Obayashi, T.; Itoh, S.; Onda, K.; Arai, S.; et al. Reliability in somatic cell count measurement of clinical mastitis milk using D e L aval cell counter. Anim. Sci. J. 2013, 84, 805–807. [Google Scholar] [CrossRef] [PubMed]
- Lusis, I.; Laurs, A.; Antane, V. Viscosity method in robotic milking system for detection of somatic cell count in milk. In Proceedings of the Engineering for Rural Development, Proceedings of the 18th International Scientific Conference Engineering for Rural Development, Jelgava, Latvia, 22–24 May 2019; pp. 22–24. [Google Scholar]
- Janzekovic, M.; Brus, M.; Mursec, B.; Vinis, P.; Stajnko, D.; Cus, F. Mastitis detection based on electric conductivity of milk. J. Achiev. Mater. Manuf. Eng. 2009, 34, 39–46. [Google Scholar]
- Ferrero, F.; Valledor, M.; Campo, J. Screening method for early detection of mastitis in cows. Measurement 2014, 47, 855–860. [Google Scholar] [CrossRef]
- Schalm, O.; Noorlander, D. Experiments and observations leading to development of the California Mastitis Test. J. Am. Vet. Med. Assoc. 1957, 130, 199–204. [Google Scholar]
- Gohary, K.; McDougall, S. Predicting intramammary infection status at drying off using indirect testing of milk samples. N. Z. Vet. J. 2018, 66, 312–318. [Google Scholar] [CrossRef]
- Hisira, V.; Zigo, F.; Kadaši, M.; Klein, R.; Farkašová, Z.; Vargová, M.; Mudroň, P. Comparative analysis of methods for somatic cell counting in cow’s milk and relationship between somatic cell count and occurrence of intramammary bacteria. Vet. Sci. 2023, 10, 468. [Google Scholar] [CrossRef]
- Thompson, J.S.; Green, M.J.; Hyde, R.; Bradley, A.J.; O’Grady, L. The use of machine learning to predict somatic cell count status in dairy cows post-calving. Front. Vet. Sci. 2023, 10, 1297750. [Google Scholar] [CrossRef]
- Greener, J.G.; Kandathil, S.M.; Moffat, L.; Jones, D.T. A guide to machine learning for biologists. Nat. Rev. Mol. Cell Biol. 2022, 23, 40–55. [Google Scholar] [CrossRef]
- Benos, L.; Tagarakis, A.C.; Dolias, G.; Berruto, R.; Kateris, D.; Bochtis, D. Machine learning in agriculture: A comprehensive updated review. Sensors 2021, 21, 3758. [Google Scholar] [CrossRef]
- Kuhn, M. Building Predictive Models in R Using the caret Package. J. Stat. Softw. 2008, 28, 1–26. [Google Scholar] [CrossRef]
- R Core Team. R: A Language and Environment for Statistical Computing; R Foundation for Statistical Computing: Vienna, Austria, 2023. [Google Scholar]
- Plozza, K.; Lievaart, J.; Potts, G.; Barkema, H. Subclinical mastitis and associated risk factors on dairy farms in New South Wales. Aust. Vet. J. 2011, 89, 41–46. [Google Scholar] [CrossRef]
- Busanello, M.; Rossi, R.S.; Cassoli, L.D.; Pantoja, J.C.; Machado, P.F. Estimation of prevalence and incidence of subclinical mastitis in a large population of Brazilian dairy herds. J. Dairy Sci. 2017, 100, 6545–6553. [Google Scholar] [CrossRef] [PubMed]
- Hiitiö, H.; Vakkamäki, J.; Simojoki, H.; Autio, T.; Junnila, J.; Pelkonen, S.; Pyörälä, S. Prevalence of subclinical mastitis in Finnish dairy cows: Changes during recent decades and impact of cow and herd factors. Acta Vet. Scand. 2017, 59, 1–14. [Google Scholar] [CrossRef] [PubMed]
- Khasanah, H.; Setyawan, H.B.; Yulianto, R.; Widianingrum, D.C. Subclinical mastitis: Prevalence and risk factors in dairy cows in East Java, Indonesia. Vet. World 2021, 14, 2102. [Google Scholar] [CrossRef] [PubMed]
- Dingwell, R.T.; Leslie, K.E.; Schukken, Y.H.; Sargeant, J.M.; Timms, L.L. Evaluation of the California mastitis test to detect an intramammary infection with a major pathogen in early lactation dairy cows. Can. Vet. J. 2003, 44, 413. [Google Scholar]
- Sanford, C.; Keefe, G.P.; Sanchez, J.; Dingwell, R.; Barkema, H.; Leslie, K.; Dohoo, I.R. Test characteristics from latent-class models of the California Mastitis Test. Prev. Vet. Med. 2006, 77, 96–108. [Google Scholar] [CrossRef]
- Fosgate, G.T.; Petzer, I.M.; Karzis, J. Sensitivity and specificity of a hand-held milk electrical conductivity meter compared to the California mastitis test for mastitis in dairy cattle. Vet. J. 2013, 196, 98–102. [Google Scholar] [CrossRef]
- Kandeel, S.; Megahed, A.; Arnaout, F.; Constable, P. Evaluation and Comparison of 2 On-Farm Tests for Estimating Somatic Cell Count in Quarter Milk Samples from Lactating Dairy Cattle. J. Vet. Intern. Med. 2018, 32, 506–515. [Google Scholar] [CrossRef]
- Fernandes, L.; Guimaraes, I.; Noyes, N.; Caixeta, L.; Machado, V. Effect of subclinical mastitis detected in the first month of lactation on somatic cell count linear scores, milk yield, fertility, and culling of dairy cows in certified organic herds. J. Dairy Sci. 2021, 104, 2140–2150. [Google Scholar] [CrossRef]
- Thrusfield, M.; Christley, R. Chapter Diagnostic testing. In Veterinary Epidemiology; John Wiley & Sons: Hoboken, NJ, USA, 2018. [Google Scholar]
- Abdolrasol, M.G.; Hussain, S.S.; Ustun, T.S.; Sarker, M.R.; Hannan, M.A.; Mohamed, R.; Ali, J.A.; Mekhilef, S.; Milad, A. Artificial neural networks based optimization techniques: A review. Electronics 2021, 10, 2689. [Google Scholar] [CrossRef]
- Dey, P. Artificial neural network in diagnostic cytology. CytoJournal 2022, 19, 27. [Google Scholar] [CrossRef] [PubMed]
- Dastres, R.; Soori, M. Artificial neural network systems. Int. J. Imaging Robot. (IJIR) 2021, 21, 13–25. [Google Scholar]
- Desai, M.; Shah, M. An anatomization on breast cancer detection and diagnosis employing multi-layer perceptron neural network (MLP) and Convolutional neural network (CNN). Clin. eHealth 2021, 4, 1–11. [Google Scholar] [CrossRef]
- Hagenauer, J.; Helbich, M. A geographically weighted artificial neural network. Int. J. Geogr. Inf. Sci. 2022, 36, 215–235. [Google Scholar] [CrossRef]
- Abadi, M.; Agarwal, A.; Barham, P.; Brevdo, E.; Chen, Z.; Citro, C.; Corrado, G.S.; Davis, A.; Dean, J.; Devin, M.; et al. TensorFlow: Large-Scale Machine Learning on Heterogeneous Systems. 2015. Available online: https://www.tensorflow.org (accessed on 28 April 2025).
- Marshall, R.J. The predictive value of simple rules for combining two diagnostic tests. Biometrics 1989, 45, 1213–1222. [Google Scholar] [CrossRef]
- Grimes, D.A.; Schulz, K.F. Uses and abuses of screening tests. Lancet 2002, 359, 881–884. [Google Scholar] [CrossRef]
- Wong, H.B.; Lim, G.H. Measures of diagnostic accuracy: Sensitivity, specificity, PPV and NPV. Proc. Singap. Healthc. 2011, 20, 316–318. [Google Scholar] [CrossRef]
- Mammadova, N.M.; Keskin, I. Application of neural network and adaptive neuro-fuzzy inference system to predict subclinical mastitis in dairy cattle. Indian J. Anim. Res. 2015, 49, 671–679. [Google Scholar] [CrossRef]
- Ebrahimi, M.; Mohammadi-Dehcheshmeh, M.; Ebrahimie, E.; Petrovski, K.R. Comprehensive analysis of machine learning models for prediction of sub-clinical mastitis: Deep Learning and Gradient-Boosted Trees outperform other models. Comput. Biol. Med. 2019, 114, 103456. [Google Scholar] [CrossRef]

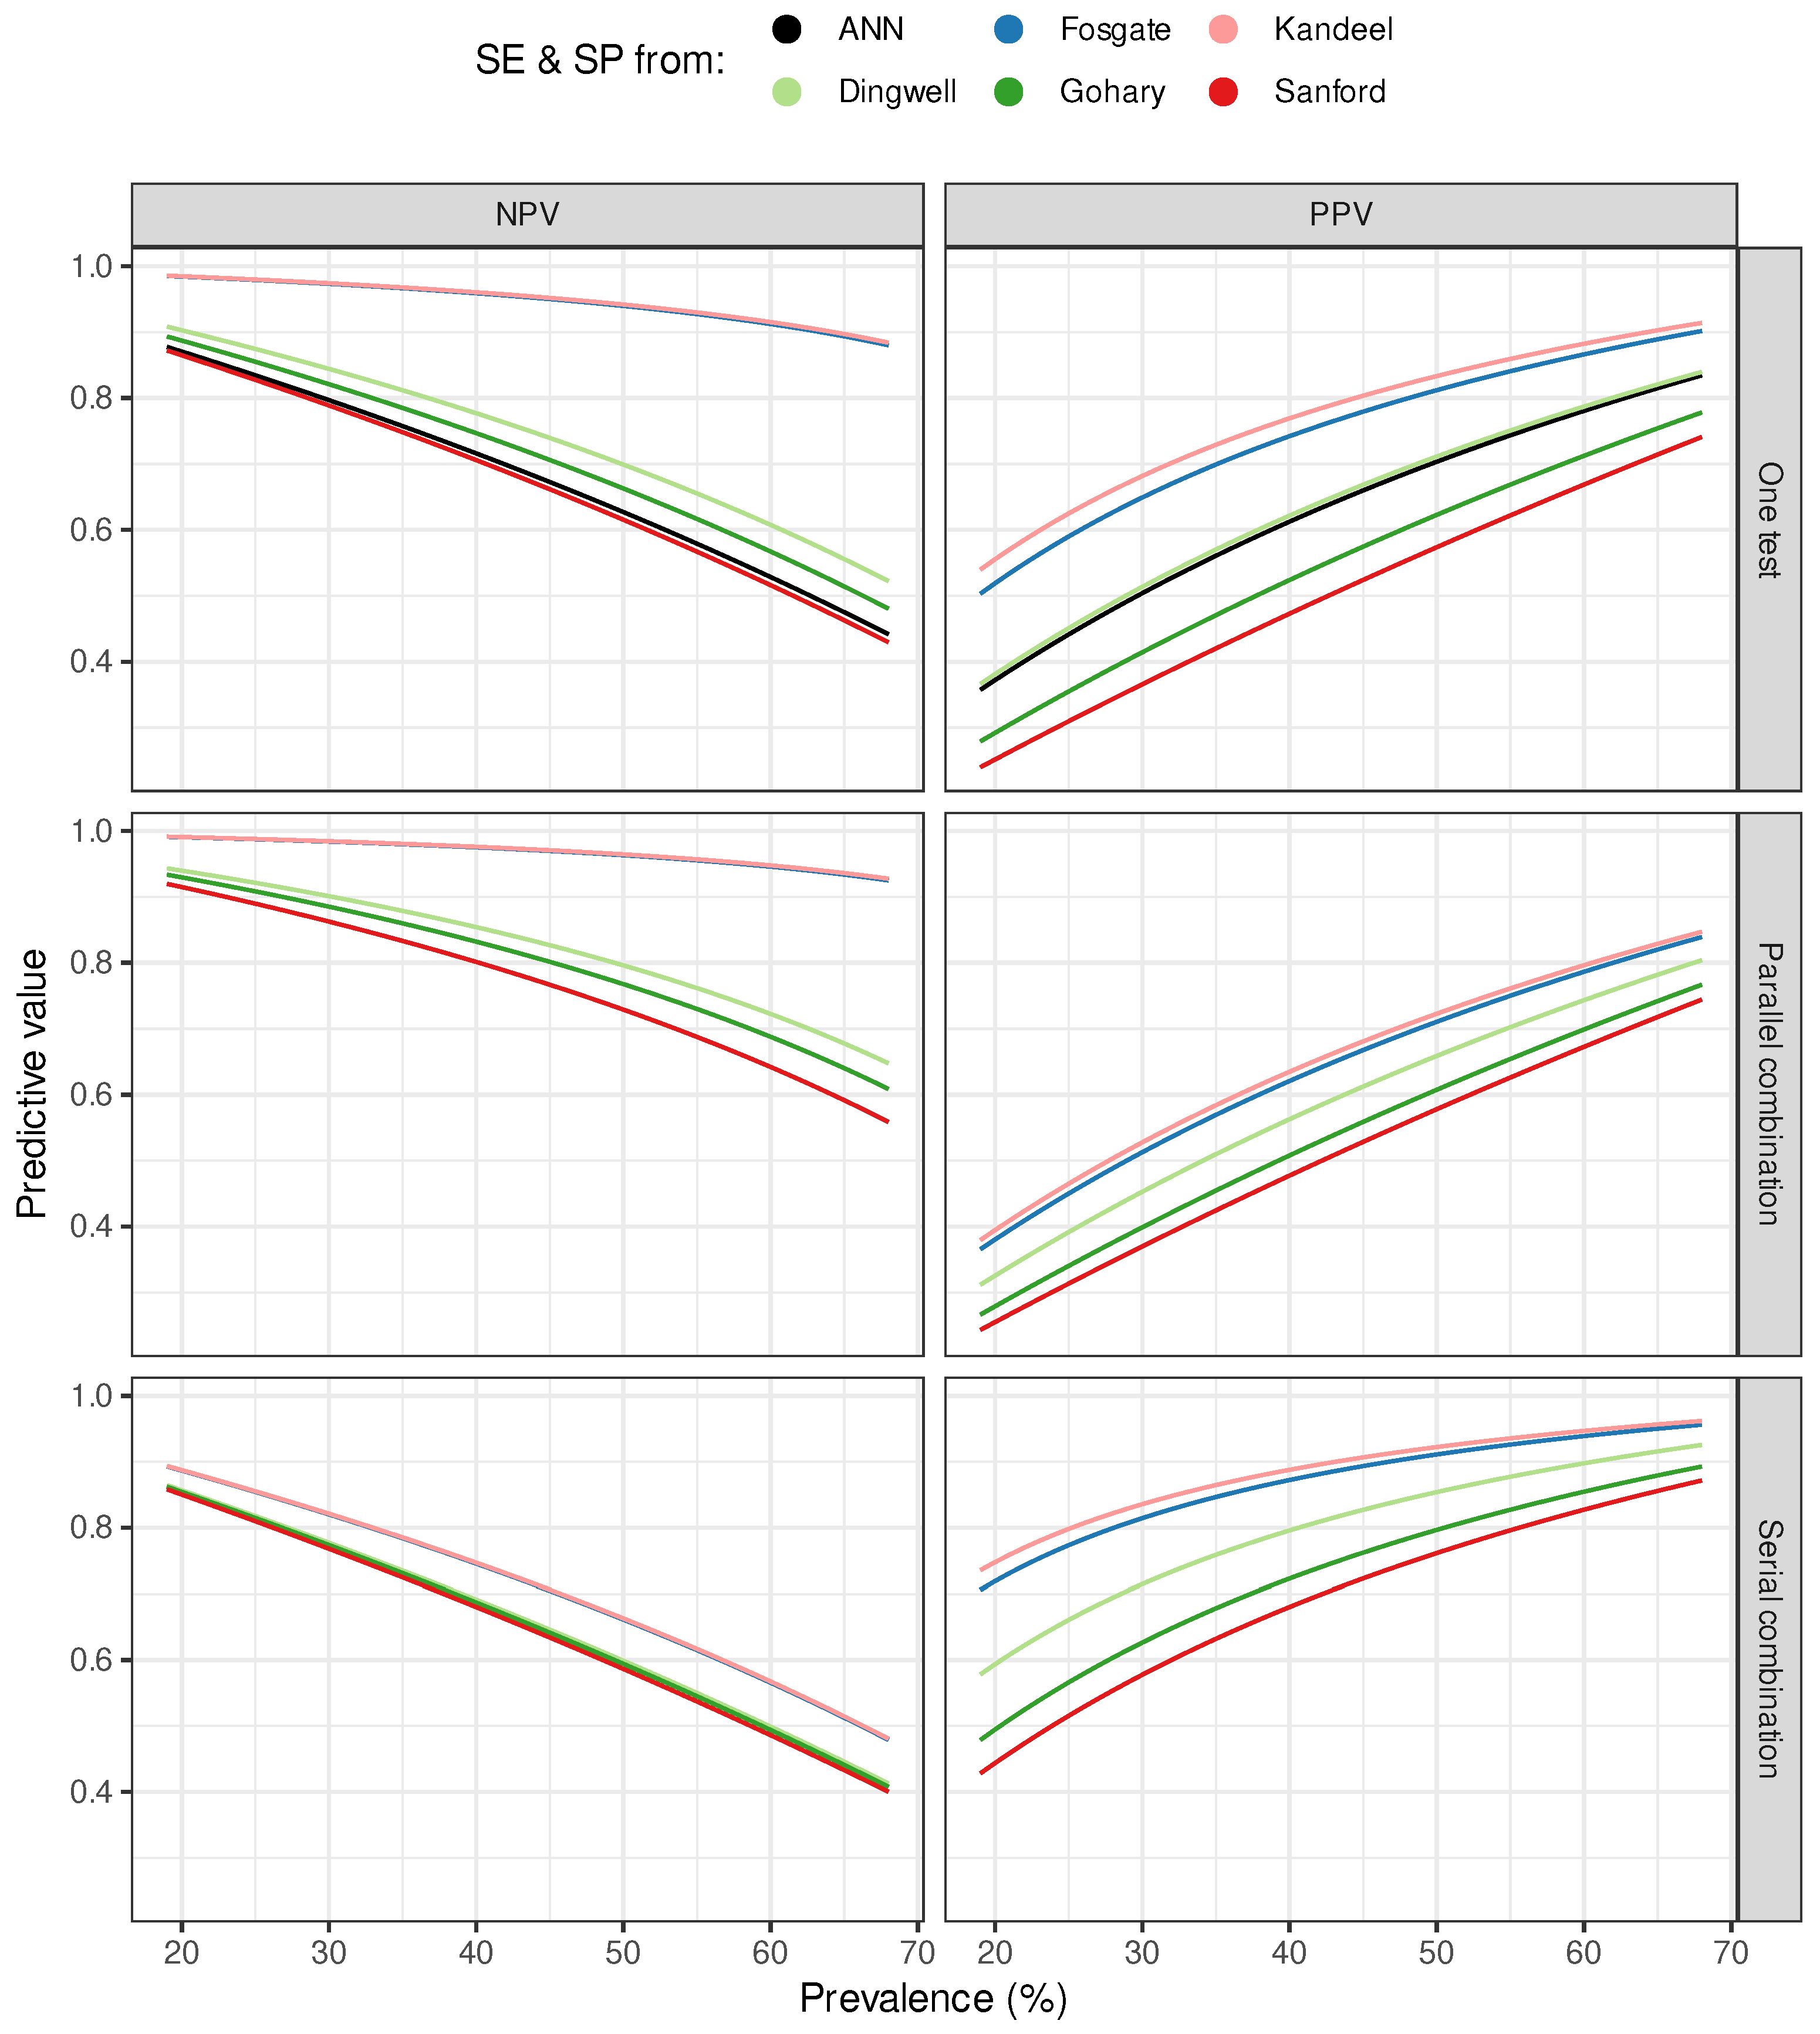
| Source | Negative Predictive Value | Positive Predictive Value | ||||
|---|---|---|---|---|---|---|
| One Test | Combination | One Test | Combination | |||
| Parallel | Serial | Parallel | Serial | |||
| Dingwell | 0.75 (0.19) | 0.84 (0.14) | 0.66 (0.22) | 0.65 (0.23) | 0.60 (0.24) | 0.82 (0.15) |
| Fosgate | 0.95 (0.05) | 0.97 (0.03) | 0.72 (0.20) | 0.77 (0.18) | 0.65 (0.23) | 0.89 (0.10) |
| Gohary | 0.72 (0.20) | 0.81 (0.16) | 0.66 (0.23) | 0.56 (0.25) | 0.54 (0.25) | 0.75 (0.19) |
| Kandeel | 0.95 (0.04) | 0.97 (0.03) | 0.72 (0.20) | 0.79 (0.17) | 0.67 (0.22) | 0.90 (0.09) |
| Sanford | 0.68 (0.22) | 0.78 (0.17) | 0.65 (0.23) | 0.51 (0.25) | 0.51 (0.25) | 0.71 (0.21) |
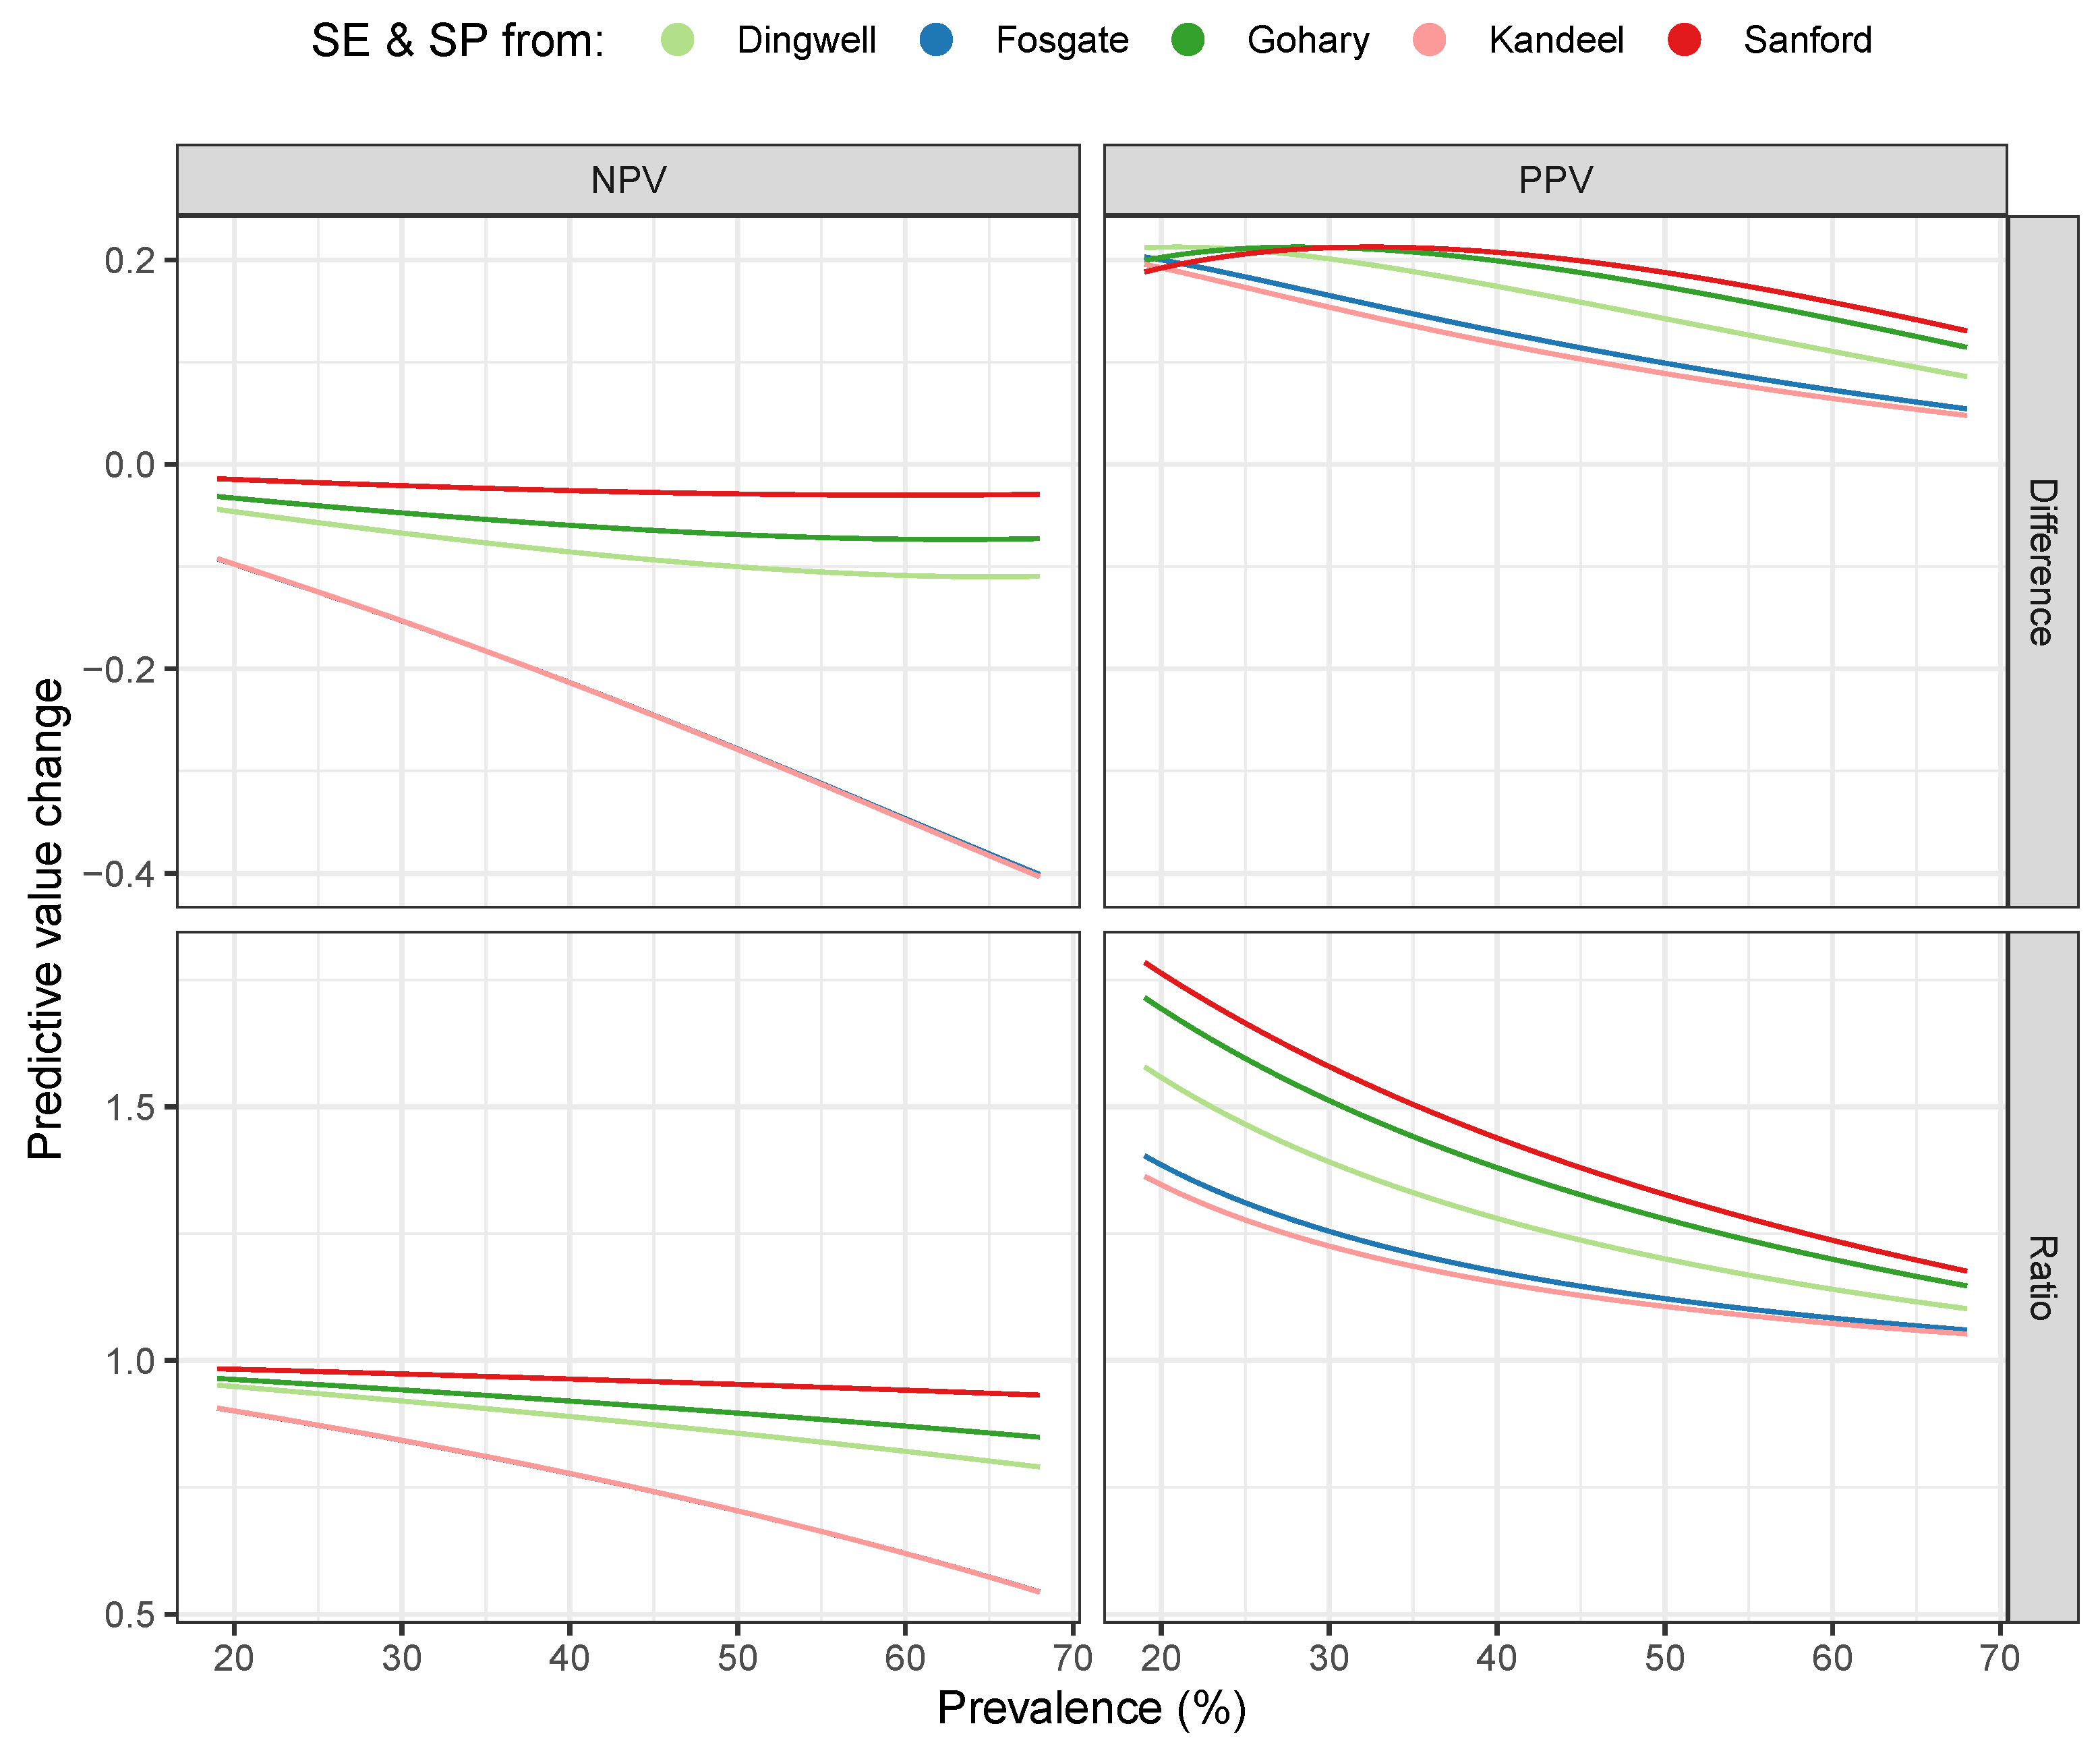
| Source | Difference | Ratio | ||
|---|---|---|---|---|
| NPV | PPV | NPV | PPV | |
| Dingwell | (0.04) | 0.16 (0.07) | 0.88 (0.08) | 1.25 (0.21) |
| Fosgate | (0.16) | 0.12 (0.08) | 0.75 (0.18) | 1.15 (0.14) |
| Gohary | (0.02) | 0.19 (0.05) | 0.91 (0.06) | 1.34 (0.26) |
| Kandeel | (0.16) | 0.11 (0.07) | 0.75 (0.18) | 1.14 (0.13) |
| Sanford | (0.01) | 0.20 (0.04) | 0.96 (0.03) | 1.40 (0.29) |
Disclaimer/Publisher’s Note: The statements, opinions and data contained in all publications are solely those of the individual author(s) and contributor(s) and not of MDPI and/or the editor(s). MDPI and/or the editor(s) disclaim responsibility for any injury to people or property resulting from any ideas, methods, instructions or products referred to in the content. |
© 2025 by the authors. Licensee MDPI, Basel, Switzerland. This article is an open access article distributed under the terms and conditions of the Creative Commons Attribution (CC BY) license (https://creativecommons.org/licenses/by/4.0/).
Share and Cite
Nagy, S.Á.; Csabai, I.; Varga, T.; Póth-Szebenyi, B.; Gábor, G.; Solymosi, N. Neural Network-Aided Milk Somatic Cell Count Increase Prediction. Vet. Sci. 2025, 12, 420. https://doi.org/10.3390/vetsci12050420
Nagy SÁ, Csabai I, Varga T, Póth-Szebenyi B, Gábor G, Solymosi N. Neural Network-Aided Milk Somatic Cell Count Increase Prediction. Veterinary Sciences. 2025; 12(5):420. https://doi.org/10.3390/vetsci12050420
Chicago/Turabian StyleNagy, Sára Ágnes, István Csabai, Tamás Varga, Bettina Póth-Szebenyi, György Gábor, and Norbert Solymosi. 2025. "Neural Network-Aided Milk Somatic Cell Count Increase Prediction" Veterinary Sciences 12, no. 5: 420. https://doi.org/10.3390/vetsci12050420
APA StyleNagy, S. Á., Csabai, I., Varga, T., Póth-Szebenyi, B., Gábor, G., & Solymosi, N. (2025). Neural Network-Aided Milk Somatic Cell Count Increase Prediction. Veterinary Sciences, 12(5), 420. https://doi.org/10.3390/vetsci12050420