Simple Summary
The oriental river prawn, Macrobrachium nipponense, is a widely distributed species in freshwater and low-salinity estuarine regions of China and other Asian countries. This species has become an important commercial commodity in China because of its high nutritional value and palatability. There are significant differences in growth between male and female M. nipponense. The aim of this study was to determine the hepatopancreas transcriptome differences between sex-related size differences in M. nipponense. We identified four genes associated with sex-related size differences, as well as six closely related metabolic pathways. The results indicated the molecular mechanism underlying the sex-related size differences and identified key genes and metabolic pathways. This data will be invaluable to support explanations of individual differences between male and female prawns.
Abstract
Macrobrachium nipponense, a commercially popular crustacean species within the Chinese context, is recognized for its exceptional nutritional composition and palatability. There are significant differences in growth between male and female M. nipponense. Herein, transcriptomics was used to determine the hepatopancreas transcriptome differences between sex-related size differences in M. nipponense. We identified 974 differentially expressed genes (DEGs) between the SHE (female) and BHE (male) groups, which were validated using RT-qPCR. The genes encoding matrix metalloproteinase-9 (MM9), Ribosome-binding protein 1 (RBP1), Aly/REF export factor 2, and hematological and neurological expressed 1 (HN1) may play a role in modulating the sex-related size differences observed in M. nipponense. Clusters of orthologous groups and gene ontology functional analysis demonstrated that the DEGs for sex-related size in M.nipponense were associated with various biological functions. The Kyoto Encyclopedia of Genes and Genomes pathways analysis demonstrated that upregulated DEGs were mainly enriched in lysine biosynthesis, tryptophan metabolism, and lysine degradation pathways, whereas the downregulated DEGs were mainly enriched in ascorbate and aldarate metabolism, retinol metabolism, and drug metabolism-cytochrome P450 pathways. The results indicated the molecular mechanism underlying the sex-related size differences and identified key genes. This data will be invaluable to support explanations of individual differences between male and female prawns.
1. Introduction
The oriental river prawn, Macrobrachium nipponense (Crustacea; Decapoda; Palaemonidae), is a widely distributed species in freshwater and low-salinity estuarine regions of China and other Asian countries [1,2,3]. This species has become an important commercial commodity in China because of its high nutritional value and palatability. The annual production of M. nipponense has exhibited a gradual increase in recent years, reaching 226,312 tons in 2022 [4]. The annual output value was approximately 2.8 billion US dollars in 2021 [3]. As is the case with other Macrobrachium species, there are notable differences between male and female M. nipponense. Males typically exhibit faster growth rates than their female counterparts, reaching larger sizes at the time of harvest each year [3]. Therefore, determining the molecular regulatory mechanisms underlying the growth and development of M. nipponense will enhance our understanding of sex-related size differences in prawns.
The significant difference in growth between males and females, succinctly termed male and female growth dimorphism, or more academically referenced as sexual size dimorphism (SSD), is a consistent and widely observed characteristic in prawns [5,6,7]. Predominant males possess an enhanced capacity to claim breeding territories and scavenge for sustenance, thereby perpetuating their own developmental trajectory [7]. Growth is a multifaceted quantitative characteristic, regulated by an entwined network of multiple genes. The discernment and analysis of growth-associated regulatory genes can furnish primordial data, fostering advancements in the molecular breeding of aquatic organisms. Fortuitously, a rising number of scholars are dedicating their efforts to elucidate the molecular regulatory mechanisms that underpin the growth of phenotypes of these aquatic entities. An assortment of pivotal functional genes, alongside their corresponding pathways, have been acknowledged, posing an instrumental influence in the orchestration of growth attributes [7,8,9,10]. The latest scientific inquiries have unveiled that central modulators of growth and evolution in aquatic organisms include growth hormone (GH), growth hormone receptor (GHR), and insulin-like growth factor (IGF) [11,12]. Similar outcomes were observed in Pangasianodon hypophthalmus [13], Odontobutis potamophila [14], Oreochromis niloticus [15], Salmo salar [16], Dicentrarchus labrax [17], Cyprinus carpio [18], Pelteobagrus fulvidraco [19], and Larimichthys crocea [20]. The growth of aquatic organisms is regulated by hormones secreted from the neuro-endocrine system, in addition to which other genes exert a regulatory influence. In Ctenopharyngodon idella, glyceraldehyde-3-phosphate dehydrogenase and myoglobin 1 showed elevated expression in the accelerated growth group [21]. These findings suggest that these enzymes may play a role in promoting muscle growth. In Acipenser dabryanus, it was established that the accelerated growth was markedly linked to glycolysis, protein synthesis, and antioxidant functions [22]. The expression of specific genes, including those encoding glycogen phosphorylase, heat shock protein 90, crustacean hyperglycemic hormone, cathepsin L, and peroxidasin, was observed in Macrobrachium rosenbergii, which were closely related to its growth [23,24,25].
Techniques such as RNA sequencing (RNA-seq) have been used extensively to identify genes linked to the growth and maturation of aquatic organisms, thereby elucidating those hereditary elements associated with growth efficiency and the proliferation of muscle fibers [7,26]. Leveraging this approach, an extensive array of functionally potent genes and enhanced pathways have been efficaciously discerned, while DEG analyses have proficiently illuminated the molecular regulatory machineries pertaining to growth in aquatic organisms [7,27]. The hepatopancreas is the most important metabolic organ of M. nipponense and is involved in a variety of its life processes, such as molting [28], growth [29], gonadal development [30], and the response to hypoxia [31]. Nevertheless, the growth mechanisms intrinsic to M. nipponense have not been intensively investigated. Consequently, the identification of functional genes and enriched pathways associated with sex-related size dynamics would provide invaluable insights for subsequent genomic studies investigating the adjustment mechanism underlying sex-related size-difference disparities.
Therefore, within the scope of this investigation, we employed next-generation sequencing in conjunction with bioinformatic methodologies to distinguish transcriptomic differences associated with sex-related size in M. nipponense. The objective was to identify functional genes and enriched pathways relevant to sex-related size, thereby establishing a robust theoretical framework for explaining individual differences between male and female prawns.
2. Materials and Methods
2.1. Sample Collection
Specimens of M. nipponense, all with a homogeneous genetic background, were obtained from the Chinese Academy of Fisheries Science, located in Wuxi City, China. The specimens of M. nipponense selected for study were all full-sibling offspring, descended from a single male and female progenitor, aged-matched, and nurtured within a uniform set of environmental parameters. We distinguished between males and females by examining their gonads [32]. Randomly selected males were referred to as the BHE group (5.2 ± 0.5 g) and females were referred to as the SHE group (3.1 ± 0.3 g). Thereafter, hepatopancreatic tissues (n = 3 per group) were excised rapidly for gene expression analyses, followed by their instantaneous immersion in liquid nitrogen and storage at a −80 °C until RNA extraction.
2.2. Total RNA Extraction and Illumina Sequencing
The extraction of total RNA from gonadal specimens was successfully accomplished utilizing the Trizol reagent (TaKaRa, Shiga, Japan), adhering strictly to previously reported procedures [24]. Instruments such as a Nanodrop 2000 spectrophotometer (Nanodrop Technologies, Wilmington, DE, USA), an Agilent 2100 bioanalyzer (Agilent Technologies, Santa Clara, CA, USA) were used to determine the purity, concentration, and integrity of the RNA samples. The subsequent construction of the cDNA libraries was conducted in accordance with the manufacturer’s guidelines, utilizing a AMPure XP Bead-Based Reagent (Beckman, Inc., Shanghai, China). The transcriptome sequencing (RNA-seq) of the libraries to produce paired-end reads was executed on the Novaseq-PE 150 platform This platform was developed by Genepioneer Biotechnologies Technology Co., Ltd. (Nanjing, China).
2.3. Transcriptome Sequence Assembly and Annotation
The raw reads were subjected to a series of filtration steps, including number of unknown bases N < 5, removal of sequences with base mass values less than 5 for 50% of the length of the reads and removal of splice sequences.
The clean data was aligned sequentially with the specified reference genome to generate mapped data (https://ftp.cngb.org/pub/CNSA/data2/CNP0001186/CNS0254395/CNA0014632/, accessed on 15 April 2024). All Mapped Data were searched against the NCBI non-redundant protein sequences (NR, http://ncbi.nlm.nih.gov/, accessed on 16 April 2024), Cluster of Orthologous Groups of proteins (COG, https://www.ncbi.nlm.nih.gov/COG/, accessed on 16 April 2024), Gene Ontology (GO, https://geneontology.org/, accessed on 16 April 2024), Kyoto Encyclopedia of Genes and Genome (KEGG, http://www.kegg.jp, accessed on 16 April 2024), and protein family (Pfam, http://pfam.xfam.org/, accessed on 16 April 2024) databases.
2.4. DEGs Analysis
In this study, DEGs were filtered through the DESeq2 (Version 1.26.0), subject to a sorting threshold of |log2 (fold change)| > 1 and Q-value < 0.05 (http://www.bioconductor.org/packages/release/bioc/html/DESeq2.html, accessed on 17 April 2024). Ultimately, the COG, GO, and KEGG enrichment analyses of DEGs were executed utilizing the Cluster Profiler software (Version 3.4.4). COG functions, GO terms, and KEGG pathways—exhibiting a False Discovery Rate (FDR) less than 0.05—were deemed as being significantly enriched.
2.5. Quantitative Real-Time Reverse Transcription PCR Validation (RT-qPCR)
To validate the RNA-seq data, 17 DEGs were selected for RT-qPCR analysis. PCR primers (Table S1) were designed using a Primer designing tool (https://www.ncbi.nlm.nih.gov/tools/primer-blast/, accessed on 17 April 2024).
RNA was meticulously extracted and subsequently reverse transcribed into cDNA. The qPCR reactions were performed using the SuperRT cDNA Synthesis Kit (Cwbio, Taizhou, China), with the EIF gene (encoding eukaryotic initiation factor) as the internal control [24]. In order to reduce the likelihood of experimental inaccuracy, each specimen was examined in triplicate. These investigative measures were conducted using a CFX96 Touch™ qRT-PCR instrument (Bio-Rad Laboratories, Hercules, CA, USA). The relative gene expression was assessed utilizing the 2−ΔΔCT technique.
3. Results
3.1. Comparative Analysis of Sexual Size Dimorphism of M. nipponense
Under the same aquaculture environment, males and females of the same batch of M. nipponense differed significantly from each other, showing obvious SSD (Figure 1).
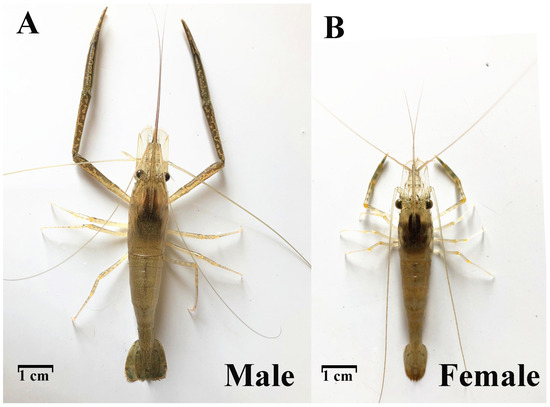
Figure 1.
Sexual size dimorphism in M. nipponense.
3.2. Transcriptome Profiles and Annotation
The M. nipponense RNA library sequencing generated 146,771,796 raw reads in total (Table 1). The clean data of each sample was ≥5.95 Gb, and the percentage of Q30 bases was ≥89.85%.

Table 1.
Data quality for each sample.
The abbreviated sequences derived from the RNA-sequencing dataset were accurately aligned to the M. nipponense genome using HISAT2 (http://daehwankimlab.github.io/hisat2, accessed on 17 April 2024) and the percentage of uniquely mapped transcripts increased from 88.41 to 90.84%. Finally, we constructed a stringent set of M. nipponense RNA transcripts comprising 47,712 annotated protein-coding genes.
3.3. Correlation Analysis between Samples
The outcomes derived from the Principal Component Analysis (PCA) executed on the transcriptome samples demonstrated that sex-related size discrepancies were the paramount element influencing transcriptomic data. Subsequently, the sequenced specimens were divided into two distinct subcategories based on their sex-related size (Figure 2A). The heatmap show that the clustering results were similar to those of the PCA analysis (Figure 2B).
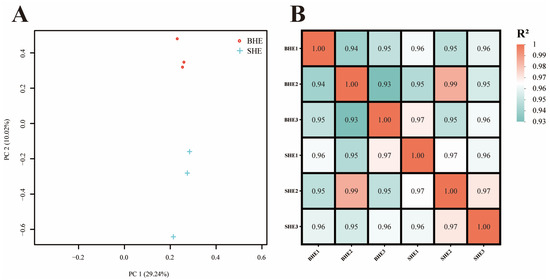
Figure 2.
Relationship analysis of sexual size dimorphism in M. nipponense. (A) Principal component analysis (PCA) of different transcriptome samples; (B) Inter-sample correlation coefficient heatmap.
3.4. DEGs Function Analysis
A volcano plot was used to show the DEGs between SHE and BHE groups, identified according to the fold change value (Figure 3A). A total of 974 DEGs were screened between SHE and BHE groups; 814 DEGs were downregulated and 160 DEGs were upregulated. Hierarchical clustering analysis was performed on the screened DEGs to cluster genes with the same or similar expression behavior, as shown in Figure 3B. The top 20 genes in the upregulated and downregulated groups were selected for analysis, and it was determined that only 17 genes had clear functional annotations (Table 2).
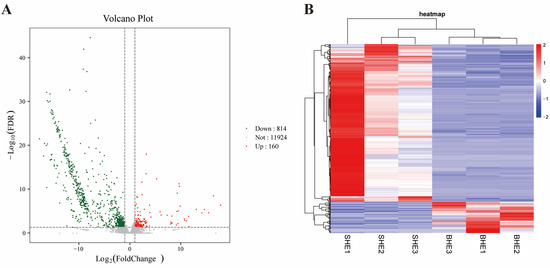
Figure 3.
(A) Volcano plot of DEGs between SHE and BHE groups. (B) Heatmap of DEGs between the SHE and BHE groups. DEG, differentially expressed gene; FDR, false discovery rate.

Table 2.
Expression of key DEGs between SHE and BHE groups.
3.5. Clusters of Orthologous Groups (COG) Functional Annotations of the DEGs
A total of 59 upregulated DEGs were annotated to 15 metabolic pathways in the COG functional annotation analysis. Most of the DEGs were annotated in general function prediction only (11 DEGs), followed by carbohydrate transport and metabolism (5 DEGs), and amino acid transport and metabolism (5 DEGs) (Figure 4A). In addition, 269 downregulated DEGs were annotated to 20 pathways by COG functional annotation. Most of the DEGs were annotated in general function prediction only (68 DEGs), followed by replication, recombination and repair (37 DEGs) and secondary metabolites biosynthesis, transport, and catabolism (18 DEGs) (Figure 4B).
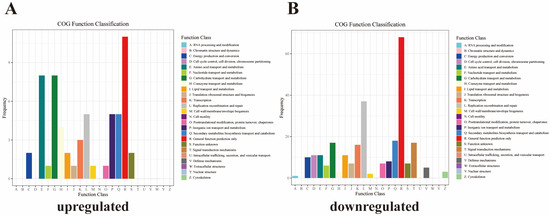
Figure 4.
Clusters of orthologous groups (COG) functional annotations of DEGs (A) upregulated DEGs; (B) downregulated DEGs.
3.6. Gene Ontology (GO) Analyses of DEGs
GO enrichment (Figure 5) categorized all DEGs into three groups: molecular functions, cellular components, and biological processes. A total of 43 GO terms (for the upregulated DEGs) and 49 GO terms (for the downregulated DEGs) were enriched, among which the highest classification terms were “binding” (48 DEGs) and “cellular process” (262 DEGs), respectively (Figure 5(A1,B1)). Further examination revealed that the upregulated DEGs were enriched in “endocytic vesicles”, “carbohydrate binding”, and “sterol transporter activity”. Conversely, the downregulated DEGs were enriched in “glucuronosyltransferase activity”, “cell division”, and “mitotic cell cycle” (Figure 5(A2,B2)).
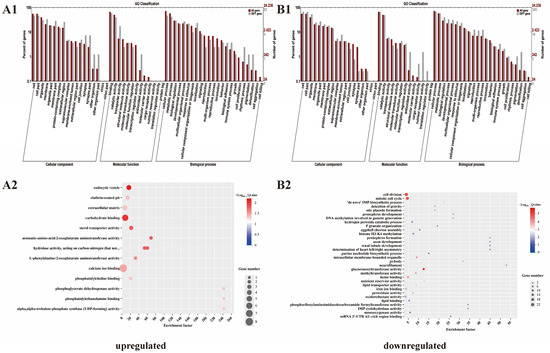
Figure 5.
Enriched gene ontology (GO) terms associated with the DEGs. (A1,A2) upregulated DEGs; (B1,B2) downregulated DEGs.
3.7. KEGG Enrichment Analyses of DEGs
KEGG analysis was used to determine the enrichment of the DEGs for metabolic pathways. The upregulated DEGs were enriched for 16 pathways and the downregulated DEGs were enriched for 33 pathways. In total, six types of KEGG pathway were identified in the downregulated group. In addition to pathways related to human diseases, other types of pathways were also associated with the upregulated group; however, there were differences in the degree of enrichment (Figure 6(A1,B1)). Further examination revealed that the upregulated DEGs were significantly enriched in “lysine biosynthesis”, “tryptophan metabolism”, and “lysine degradation”. Conversely, the downregulated DEGs were significantly enriched in “ascorbate and aldarate metabolism”, “retinol metabolism”, and “drug metabolism-cytochrome P450” (Figure 6(A2,B2) and Figure 7).
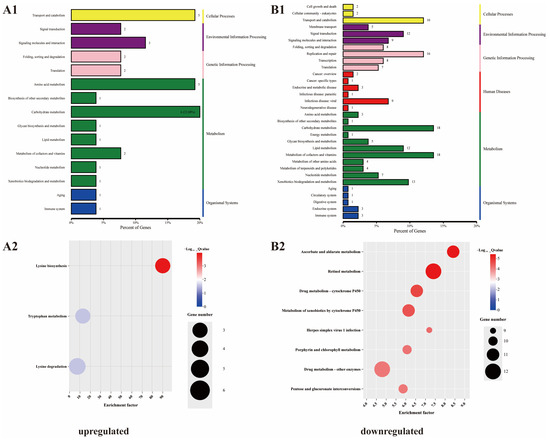
Figure 6.
Enriched Kyoto Encyclopedia of Genes and Genomes (KEGG) pathways associated with the DEGs. (A1,A2) upregulated; (B1,B2) downregulated.
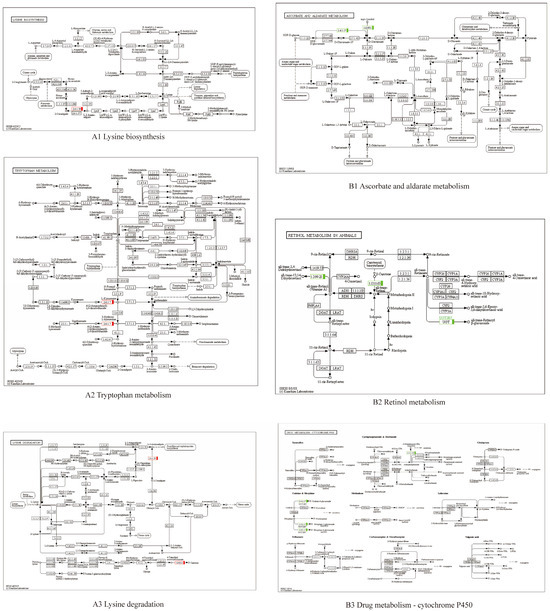
Figure 7.
KEGG enrichment of different metabolism pathway between SHE and BHE groups. (A1–A3) upregulated; (B1–B3) downregulated.
3.8. RT-qPCR Verification of Transcriptomic Data
The 17 DEGs with the most significant differences were selected, among which 7 were upregulated and 10 were downregulated. Concordance between the RT-qPCR and RNA-seq data-based mRNA expression was assessed for the 17 selected genes, and the results of the two analyses were consistent for 15 genes (Figure 8).
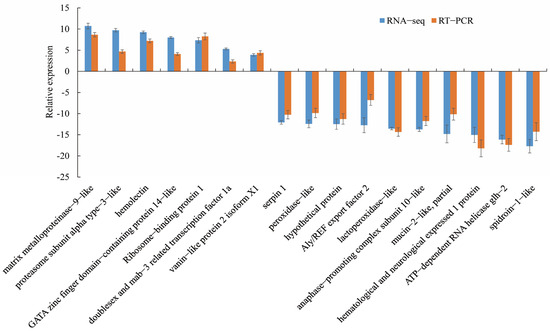
Figure 8.
Verification of DEGs in M. nipponense. RNA-seq, RNA sequencing; RT-qPCR, quantitative real-time reverse transcription PCR.
4. Discussion
Body weight is an important factor in the selection of animals for genetic improvement [7,33]. Nevertheless, the codified mechanism orchestrating body weight regulation continues to elude comprehension, an ambiguity which subsequently restrains the potential for genetic enhancement of these aquatic animals, thereby eliciting a ripple effect on the progression of aquacultural yield [7,34]. Male M. nipponense grow faster and are larger at harvest than females [35]. Therefore, we identified the DEGs between the different sexes to identify size-related difference genes. The comparison of transcription levels between sex-specific size differences enables the identification of DEGs that can be exploited to gain mechanistic insight into the underlying biological processes involved. The sexually dimorphic size-related DEGs identified in this study may be useful in revealing individual differences between male and female prawns.
In this paper, DEGs such as MMP-9, RBP1, Aly/REF export factor 2, and HN1 were identified through hepatopancreas transcriptomic analysis. MMP-9 represents a category defined as matrixins, a distinctive class of enzymes related to the zinc-metalloproteinases family. These are instrumental in orchestrating the degradation process of the extracellular matrix [36]. MMP family-mediated extracellular matrix breakdown is associated with normal physiological processes, such as embryonic development, reproduction, angiogenesis, bone development, and cell migration [37,38]. Studies have shown that ribosome-binding proteins are essential for embryonic development, and regulation of the cell cycle and proliferation [39]. The Aly/REF export factor, a universally expressed nuclear protein, operates as a molecular guardian and export mediator, playing a pivotal role in the nuclear export of both spliced and unspliced mRNA. Integral to this process is the Transcription-Export (TREX) complex, a master regulator in mRNA export that comprises the THO subcomplex, the RNA helicase UAP56, and the RNA-binding protein Aly [40,41,42]. Hematological and neurological expressed 1 protein, a member of the Notch family, is encoded by the HN1 gene [43]. Members of the Notch family serve crucial roles in numerous developmental sequences by governing decisions pertaining to cellular destiny [44]. The Notch signaling circuit represents an evolutionarily preserved intercellular transmission pathway, which oversees interactions between physically neighboring cells [45]. Particularly in Drosophila, the establishment of an intercellular communicative pathway through Notch interaction with its cellular ligands, Delta and Serrate, orchestrates a pivotal role in the organism’s developmental process [46,47]. In the present study, the genes that code for MMP 9, RBP1, Aly/REF export factor 2, and HN1 displayed significant differential expression between the SHE and BHE assemblies. This intimates that these DEGs could potentially contribute to modulating the sex-related size differences of M. nipponense.
Herein, the results of COG and GO analyses helped to reveal the mechanisms underlying M. nipponense growth. The upregulated DEGs were enriched in carbohydrate and amino acid metabolism. Carbohydrate metabolism represents the biochemical processes responsible for the metabolic formation, breakdown, and interconversion of carbohydrates in living organisms [48,49]. Carbohydrates are essential to many essential metabolic pathways [48]. When animals and fungi consume plants, they use cellular respiration to break down the stored carbohydrates to provide energy to cells [48]. Both animals and plants temporarily store the released energy in the form of high-energy molecules, such as ATP, for use in various cellular processes [50]. Amino acid metabolism refers to the biochemical processes that produce, break down, and use amino acids [51]. The body employs amino acids to synthesize a multitude of vital molecules, including proteins, enzymes, hormones, and other essential compounds. Additionally, amino acids serve as a precursor for glucose, a crucial source of energy for the body [51]. The body can also use amino acids to make lipids (fats) and cholesterol [52]. An organism can promote growth by regulating carbohydrate and amino acid metabolism [53,54,55,56].
The KEGG enrichment analysis showed that the upregulated DEGs were enriched in lysine biosynthesis and degradation, and tryptophan metabolism pathways. Lysine plays several roles, most importantly in protein synthesis, but also in the cross-linking of collagen polypeptides, in the absorption of essential minerals, and in the production of carnitine, which is vital for fatty acid metabolism [57,58]. From a regulatory perspective, lysine is located at the top level of control, affecting other amino acid metabolisms. Lysine can contribute to the metabolism of other nutrients, such as Ca and cholesterol [57]. The impact of dietary lysine on hormone production and activity is reflected in the alteration of plasma concentrations of insulin and insulin-like growth factor 1. Lysine residues in peptide chains represent crucial sites for post-translational modification (PTM), which is involved in histone modification and epigenetic regulation of gene expression. Beyond its involvement in PTM, lysine concurrently plays a role in the post-transcriptional phase of protein manifestation [58]. Tryptophan is an α-amino acid that is used in the biosynthesis of proteins [59]. Tryptophan is also a precursor of the neurotransmitter serotonin, the hormone melatonin, and vitamin B3 [60]. Dietary tryptophan might affect animal growth, such as in Mus musculus [61], Sus scrofa domestica [62], Gallus gallus [63], and Salmo gairdneri [64]. In Eriocheir sinensis, L-tryptophan promoted cheliped regeneration through melatonin, serotonin. and dopamine involvement [65].
The downregulated DEGs were enriched in “ascorbate and aldarate metabolism”, “retinol metabolism”, and “drug metabolism-cytochrome P450” pathways. Ascorbate and aldarate metabolism is a crucial carbohydrate metabolic pathway that can prevent cells from oxidative damage [66]. Ascorbic acid is an essential antioxidant and plays an essential role in growth [67,68]. Under crowding stress, the ascorbate and aldarate pathway was determined to affect the growth of hybrid sturgeon [68]. Additionally, ascorbate and aldarate metabolism was enriched in shrimp fed diets with different Se content, resulting in significant effects on shrimp growth [69]. Retinol metabolism is critical for many physiological processes, including embryonic development, reproduction, differentiation, and maintenance of various epithelia [70,71]. In rats, cytochrome P450 regulates growth hormone secretion and exhibits sexual dimorphism [72]. In contrast with the findings of this study, ascorbate and aldarate metabolism, drug metabolism-cytochrome P450, and retinol metabolism pathways were inhibited in Angus beef longissimus muscle during the growth phase [73]. These pathways can reveal the most important DEGs and provide clues to further understand the sex-related size differences in M. nipponense growth.
In recent years, there has been a growing recognition of the unstable production of M. nipponense. The emergence of early puberty and growth retardation as significant constraints on the development of M. nipponense aquaculture has also become increasingly evident [74]. This study used transcriptomic profiling technology to investigate the expressed hepatopancreas-related genes and identified gene candidates associated with sexually dimorphic size based on the existing theories and research results. The results of this research may also provide a theoretical basis for explaining individual differences between male and female prawns.
5. Conclusions
In the presented study, a transcriptome profiling analysis was performed to investigate the sex-related size differences in M. nipponense. The most important genes and pathways significantly associated with sex-related size were identified, and their functions were primarily related to tryptophan metabolism pathways and lysine biosynthesis and degradation pathways. The present study provides valuable fundamental information for further research on the molecular mechanism of individual differences between male and female prawns.
Supplementary Materials
The following supporting information can be downloaded at: https://www.mdpi.com/article/10.3390/vetsci11090445/s1, Table S1: Sequences of primers used for RT-qPCR. Table S2: All the differentially expressed genes.
Author Contributions
Conceptualization, S.P. and H.F.; Data curation, Y.W., G.Q., Y.Y. and H.F.; Formal analysis, Y.W.; Funding acquisition, Y.W. and H.F.; Investigation, Y.Y.; Methodology, Y.W. and G.Q.; Project administration, S.P.; Resources, G.Q. and Y.Y.; Supervision, S.P. and H.F.; Validation, G.Q.; Visualization, G.Q.; Writing—original draft, Y.W.; Writing—review & editing, S.P. and H.F. All authors have read and agreed to the published version of the manuscript.
Funding
This work was supported by a grant from the Sponsored by Shanghai Sailing Program [grant number 21YF1459900].
Institutional Review Board Statement
The study was approved by the Institutional Review Board of the Laboratory Animal Ethic Committee of the East China Sea Fisheries Research Institute (LAECECSFRI-2022-06-25-1).
Informed Consent Statement
Not Applicable.
Data Availability Statement
The RNA-seq data have been deposited in the NCBI Short Read Archive (SRA) under accession number PRJNA1056262 (https://www.ncbi.nlm.nih.gov/bioproject/PRJNA1056262, accessed on 17 April 2024).
Conflicts of Interest
The authors declare no conflict of interest.
References
- Ma, K.; Feng, J.; Lin, J.; Li, J. The complete mitochondrial genome of Macrobrachium nipponense. Gene 2011, 487, 160–165. [Google Scholar] [CrossRef] [PubMed]
- Yu, H.-P. Five species of the genus Macrobrachium (Crustacea, Decapoda, Palaemonidae) from Taiwan. OHMU Occas. Pap. Zool. Lab. Fac. Agric. Kyushu Univ. Fukuoka Jpn. 1972, 3, 45–55. [Google Scholar]
- Jin, S.; Bian, C.; Jiang, S.; Han, K.; Xiong, Y.; Zhang, W.; Shi, C.; Qiao, H.; Gao, Z.; Li, R. A chromosome-level genome assembly of the oriental river prawn, Macrobrachium nipponense. GigaScience 2021, 10, giaa160. [Google Scholar] [CrossRef]
- Xue, G. China’s Fisheries and Fisheries Management. In China and International Fisheries Law and Policy; China Agricultural Press: Beijing, China, 2023; pp. 70–101. [Google Scholar]
- Paschoal, L.R.P.; Zara, F.J. The androgenic gland in male morphotypes of the Amazon River prawn Macrobrachium amazonicum (Heller, 1862). Gen. Comp. Endocrinol. 2019, 275, 6–14. [Google Scholar] [CrossRef] [PubMed]
- Tan, K.; Jiang, H.; Jiang, D.; Wang, W. Sex reversal and the androgenic gland (AG) in Macrobrachium rosenbergii: A review. Aquac. Fish. 2020, 5, 283–288. [Google Scholar] [CrossRef]
- Liu, P.; Zhao, X.; Tang, Q.; Li, J.; Xia, Z.; Dong, H.; Yang, G.; Yi, S.; Gao, Q. Transcriptome analysis of the gonad reveals growth differences between large, medium and small individuals in a pure family of Macrobrachium rosenbergii. Aquaculture 2024, 586, 740739. [Google Scholar] [CrossRef]
- Yasumaru, F.; Lemos, D. Species specific in vitro protein digestion (pH-stat) for fish: Method development and application for juvenile rainbow trout (Oncorhynchus mykiss), cobia (Rachycentron canadum), and Nile tilapia (Oreochromis niloticus). Aquaculture 2014, 426, 74–84. [Google Scholar] [CrossRef]
- Fu, X.; Zou, Z.; Zhu, J.; Xiao, W.; Li, D.; Yu, J.; Chen, B.; Yang, H. Effects of different photoperiods on growth performance, daily rhythm of growth axis-related genes, and hormones in Nile tilapia (Oreochromis niloticus). Aquaculture 2022, 553, 738071. [Google Scholar] [CrossRef]
- Marín, A.; Alonso, A.M.; Delgadin, T.H.; López-Landavery, E.A.; Cometivos, L.J.; Saavedra-Flores, A.; Reyes-Flores, L.E.; Yzásiga-Barrera, C.G.; Fernandino, J.I.; Zelada-Mázmela, E. Analysis of truncated growth hormone receptor 1 in the differential growth of fine flounder Paralichthys adspersus. Aquaculture 2023, 574, 739691. [Google Scholar] [CrossRef]
- Canosa, L.F.; Bertucci, J.I. Nutrient regulation of somatic growth in teleost fish. The interaction between somatic growth, feeding and metabolism. Mol. Cell. Endocrinol. 2020, 518, 111029. [Google Scholar] [CrossRef]
- Yi, H.; Chen, X.; Liu, S.; Han, L.; Liang, J.; Su, Y.; Lai, H.; Bi, S.; Liu, X.; Zhang, Y. Growth, osmoregulatory and hypothalamic–pituitary–somatotropic (HPS) axis response of the juvenile largemouth bass (Micropterus salmoides), reared under different salinities. Aquac. Rep. 2021, 20, 100727. [Google Scholar] [CrossRef]
- Tran, T.T.H.; Nguyen, H.T.; Le, B.T.N.; Tran, P.H.; Van Nguyen, S.; Kim, O.T.P. Characterization of single nucleotide polymorphism in IGF1 and IGF1R genes associated with growth traits in striped catfish (Pangasianodon hypophthalmus Sauvage, 1878). Aquaculture 2021, 538, 736542. [Google Scholar] [CrossRef]
- Zhang, H.; Zhao, C.; Yin, S.; Li, Z.; Cao, Q.; Li, X.; Xie, W.; Zhang, J.; Zhu, W.; Wang, D. Characterization and Identification of Single Nucleotide Polymorphism Within the IGF-1R Gene Associated with Growth Traits of Odontobutis potamophila. J. World Aquac. Soc. 2018, 49, 366–379. [Google Scholar] [CrossRef]
- Cuevas-Rodríguez, B.L.; Sifuentes-Rincón, A.M.; Ambriz-Morales, P.; García-Ulloa, M.; Valdez-González, F.J.; Rodríguez-González, H. Novel single nucleotide polymorphisms in candidate genes for growth in tilapia (Oreochromis niloticus). Rev. Bras. Zootec. 2016, 45, 345–348. [Google Scholar] [CrossRef]
- Tsai, H.; Hamilton, A.; Guy, D.; Houston, R. Single nucleotide polymorphisms in the insulin-like growth factor 1 (IGF 1) gene are associated with growth-related traits in farmed Atlantic salmon. Anim. Genet. 2014, 45, 709–715. [Google Scholar] [CrossRef]
- Özcan Gökçek, E.; Işık, R. Associations between genetic variants of the insulin-like growth factor I (IGF-I) gene and growth traits in European sea bass (Dicentrarchus labrax, L.). Fish Physiol. Biochem. 2020, 46, 1131–1138. [Google Scholar] [CrossRef]
- Feng, X.; Yu, X.; Tong, J. Novel single nucleotide polymorphisms of the insulin-like growth factor-I gene and their associations with growth traits in common carp (Cyprinus carpio L.). Int. J. Mol. Sci. 2014, 15, 22471–22482. [Google Scholar] [CrossRef]
- Mei, J.; Gui, J.F. Sexual size dimorphism, sex determination, and sex control in yellow catfish. Sex Control Aquac. 2018, 24, 495–507. [Google Scholar]
- Gao, Y.; Huang, X.; Liu, Y.; Lv, H.; Yin, X.; Li, W.; Chu, Z. Transcriptome analysis of large yellow croaker (Larimichthys crocea) at different growth rates. Fish Physiol. Biochem. 2024, 50, 1745–1757. [Google Scholar] [CrossRef]
- Lu, X.; Chen, H.-M.; Qian, X.-Q.; Gui, J.-F. Transcriptome analysis of grass carp (Ctenopharyngodon idella) between fast-and slow-growing fish. Comp. Biochem. Physiol. Part D Genom. Proteom. 2020, 35, 100688. [Google Scholar] [CrossRef]
- Wu, Y.; Wu, T.; Yang, L.; Su, Y.; Zhao, C.; Li, L.; Cai, J.; Dai, X.; Wang, D.; Zhou, L. Generation of fast growth Nile tilapia (Oreochromis niloticus) by myostatin gene mutation. Aquaculture 2023, 562, 738762. [Google Scholar] [CrossRef]
- Jung, H.; Lyons, R.E.; Li, Y.; Thanh, N.M.; Dinh, H.; Hurwood, D.A.; Salin, K.R.; Mather, P.B. A candidate gene association study for growth performance in an improved giant freshwater prawn (Macrobrachium rosenbergii) culture line. Mar. Biotechnol. 2014, 16, 161–180. [Google Scholar] [CrossRef]
- Thanh, N.M.; Barnes, A.C.; Mather, P.B.; Li, Y.; Lyons, R.E. Single nucleotide polymorphisms in the actin and crustacean hyperglycemic hormone genes and their correlation with individual growth performance in giant freshwater prawn Macrobrachium rosenbergii. Aquaculture 2010, 301, 7–15. [Google Scholar] [CrossRef]
- Du, X.; Yan, X.; Zhang, W.; Zhu, Z.; Qin, W.; Dong, X.; Zhang, X. A SNP in Cathepsin L is associated with carapace length trait in giant freshwater prawn Macrobrachium rosenbergii. Biologia 2021, 76, 3587–3593. [Google Scholar] [CrossRef]
- Guo, X.-f.; Zhou, Y.-l.; Liu, M.; Wang, Z.-w.; Gui, J.-f. Integrated application of Iso-seq and RNA-seq provides insights into unsynchronized growth in red swamp crayfish (Procambarus clarkii). Aquac. Rep. 2022, 22, 101008. [Google Scholar] [CrossRef]
- Ye, H.; Lin, Q.; Luo, H. Applications of transcriptomics and proteomics in understanding fish immunity. Fish Shellfish Immunol. 2018, 77, 319–327. [Google Scholar] [CrossRef]
- Yuan, H.; Zhang, W.; Jin, S.; Jiang, S.; Xiong, Y.; Chen, T.; Gong, Y.; Qiao, H.; Fu, H. Transcriptome analysis provides novel insights into the immune mechanisms of Macrobrachium nipponense during molting. Fish Shellfish Immunol. 2022, 131, 454–469. [Google Scholar] [CrossRef]
- Li, Y.; Huang, Y.; Zhang, M.; Chen, Q.; Fan, W.; Zhao, Y. Effect of dietary vitamin E on growth, immunity and regulation of hepatopancreas nutrition in male oriental river prawn, Macrobrachium nipponense. Aquac. Res. 2019, 50, 1741–1751. [Google Scholar] [CrossRef]
- Jin, S.; Zhang, W.; Xiong, Y.; Jiang, S.; Qiao, H.; Gong, Y.; Wu, Y.; Fu, H. Identification of Important Genes Involved in the Sex-Differentiation Mechanism of Oriental River Prawn, Macrobrachium nipponense, During the Gonad Differentiation and Development Period. Front. Genet. 2022, 13, 797796. [Google Scholar] [CrossRef]
- Xu, L.; Zhang, W.; Qiao, H.; Jiang, S.; Xiong, Y.; Jin, S.; Gong, Y.; Fu, H. Integrated metabolomics and transcriptomic analysis of hepatopancreas in different living status Macrobrachium nipponense in response to hypoxia. Antioxidants 2021, 11, 36. [Google Scholar] [CrossRef]
- Zhang, Y.; Jiang, S.; Qiao, H.; Xiong, Y.; Fu, H.; Zhang, W.; Gong, Y.; Jin, S.; Wu, Y. Transcriptome analysis of five ovarian stages reveals gonad maturation in female Macrobrachium nipponense. BMC Genom. 2021, 22, 510. [Google Scholar] [CrossRef] [PubMed]
- Liu, F.; Zhan, W.; Xie, Q.; Lou, B.; Han, M.; Xu, W.; Tao, S. First genetic evaluation of growth traits in Larimichthys polyactis to guide the formulation of selective breeding programs. Aquaculture 2022, 554, 738141. [Google Scholar] [CrossRef]
- Sun, C.; Dong, J.; Li, W.; Tian, Y.; Hu, J.; Ye, X. Response to four generations of selection for growth performance traits in mandarin fish (Siniperca chuatsi). Aquaculture 2022, 548, 737590. [Google Scholar] [CrossRef]
- Jin, S.; Zhang, W.; Xiong, Y.; Fu, H. Recent progress of male sexual differentiation and development in the oriental river prawn (Macrobrachium nipponense): A review. Rev. Aquac. 2023, 15, 305–317. [Google Scholar] [CrossRef]
- Nagase, H. Matrix metalloproteinases. In Zinc Metalloproteases in Health and Disease; CRC Press: Boca Raton, FL, USA, 1996; pp. 173–224. [Google Scholar]
- Wang, J.; Tsirka, S.E. Neuroprotection by inhibition of matrix metalloproteinases in a mouse model of intracerebral haemorrhage. Brain 2005, 128, 1622–1633. [Google Scholar] [CrossRef]
- Vandooren, J.; Van den Steen, P.E.; Opdenakker, G. Biochemistry and molecular biology of gelatinase B or matrix metalloproteinase-9 (MMP-9): The next decade. Crit. Rev. Biochem. Mol. Biol. 2013, 48, 222–272. [Google Scholar] [CrossRef]
- Yamazaki, H.; Kasai, S.; Mimura, J.; Ye, P.; Inose-Maruyama, A.; Tanji, K.; Wakabayashi, K.; Mizuno, S.; Sugiyama, F.; Takahashi, S. Ribosome binding protein GCN1 regulates the cell cycle and cell proliferation and is essential for the embryonic development of mice. PLoS Genet. 2020, 16, e1008693. [Google Scholar] [CrossRef]
- Muravenko, O.; Gizatullin, R.; Al-Amin, A.; Protopopov, A.; Kashuba, V.; Zelenin, A.; Zabarovsky, E. HUMAN GENE MAPPING REPORT Human ALY/BEF gene Map position 17q25. 3. Chromosome Res. 2000, 8, 562. [Google Scholar] [CrossRef]
- Chi, B.; Wang, Q.; Wu, G.; Tan, M.; Wang, L.; Shi, M.; Chang, X.; Cheng, H. Aly and THO are required for assembly of the human TREX complex and association of TREX components with the spliced mRNA. Nucleic Acids Res. 2013, 41, 1294–1306. [Google Scholar] [CrossRef]
- Shi, M.; Zhang, H.; Wu, X.; He, Z.; Wang, L.; Yin, S.; Tian, B.; Li, G.; Cheng, H. ALYREF mainly binds to the 5′ and the 3′ regions of the mRNA in vivo. Nucleic Acids Res. 2017, 45, 9640–9653. [Google Scholar] [CrossRef]
- Zhou, G.; Wang, J.; Zhang, Y.; Zhong, C.; Ni, J.; Wang, L.; Guo, J.; Zhang, K.; Yu, L.; Zhao, S. Cloning, expression and subcellular localization of HN1 and HN1L genes, as well as characterization of their orthologs, defining an evolutionarily conserved gene family. Gene 2004, 331, 115–123. [Google Scholar] [CrossRef] [PubMed]
- Zanotti, S.; Canalis, E. Notch signaling and the skeleton. Endocr. Rev. 2016, 37, 223–253. [Google Scholar] [CrossRef] [PubMed]
- Schwanbeck, R.; Martini, S.; Bernoth, K.; Just, U. The Notch signaling pathway: Molecular basis of cell context dependency. Eur. J. Cell Biol. 2011, 90, 572–581. [Google Scholar] [CrossRef] [PubMed]
- Del Amo, F.F.; Gendron-Maguire, M.; Swiatek, P.J.; Jenkins, N.A.; Copeland, N.G.; Gridley, T. Cloning, analysis, and chromosomal localization of Notch-1, a mouse homolog of Drosophila Notch. Genomics. 1993, 15, 259–264. [Google Scholar] [CrossRef]
- Wu, L.; Aster, J.C.; Blacklow, S.C.; Lake, R.; Artavanis-Tsakonas, S.; Griffin, J.D. MAML1, a human homologue of Drosophila mastermind, is a transcriptional co-activator for NOTCH receptors. Nat. Genet. 2000, 26, 484–489. [Google Scholar] [CrossRef]
- Maughan, R. Carbohydrate metabolism. Surgery 2009, 27, 6–10. [Google Scholar]
- He, X.; Agnihotri, G.; Liu, H.-w. Novel enzymatic mechanisms in carbohydrate metabolism. Chem. Rev. 2000, 100, 4615–4662. [Google Scholar] [CrossRef]
- Cleri, F. Energy Production and Storage for Life. In The Physics of Living Systems; Springer International Publishing: Berlin, Germany; Cham, Switzerland, 2016; pp. 113–158. [Google Scholar]
- Felig, P. Amino acid metabolism in man. Annu. Rev. Biochem. 1975, 44, 933–955. [Google Scholar] [CrossRef] [PubMed]
- Wu, G. Amino acids: Metabolism, functions, and nutrition. Amino Acids 2009, 37, 1–17. [Google Scholar] [CrossRef]
- Vijayakumar, A.; Novosyadlyy, R.; Wu, Y.; Yakar, S.; LeRoith, D. Biological effects of growth hormone on carbohydrate and lipid metabolism. Growth Horm. IGF Res. 2010, 20, 1–7. [Google Scholar] [CrossRef]
- Tao, X.; Li, M.; Zhang, X.; Lu, J.; Jin, M.; Liu, W.; Jiao, L.; Zhou, Q. Dietary Vitamin B6 Could Improve the Utilization of High Carbohydrate Diet by Promoting Carbohydrate Degradation and Lipid Synthesis in Pacific White Shrimp (Litopenaeus Vannamei). Anim. Feed. Sci. Technol. 2024, 316, 116083. [Google Scholar] [CrossRef]
- Liang, J.; Zhao, L.; Gong, C.; Liu, Q.; Hu, Y.; Liu, H.; Guo, J.; Huang, R.; Li, Z.; Yang, S. Yinchenhao decoction alleviates high-carbohydrate diet-induced hepatic lipids deposition by strengthening lipids metabolism and transport in largemouth bass. Aquac. Res. 2022, 53, 6500–6512. [Google Scholar] [CrossRef]
- Zhou, W.-H.; Wu, C.-C.; Limbu, S.M.; Li, R.-X.; Chen, L.-Q.; Qiao, F.; Luo, Y.; Zhang, M.-L.; Han, T.; Du, Z.-Y. More simple more worse: Simple carbohydrate diets cause alterations in glucose and lipid metabolism in Nile tilapia (Oreochromis niloticus). Aquaculture 2022, 550, 737857. [Google Scholar] [CrossRef]
- Hall, C.J.; da Costa, T.P.S. Lysine: Biosynthesis, catabolism and roles. WikiJournal Sci. 2018, 1, 1–8. [Google Scholar] [CrossRef]
- Liao, S.F.; Wang, T.; Regmi, N. Lysine nutrition in swine and the related monogastric animals: Muscle protein biosynthesis and beyond. SpringerPlus 2015, 4, 147. [Google Scholar] [CrossRef]
- GDR, H.B.; Sharon, N.; Australia, E. Nomenclature and symbolism for amino acids and peptides. Pure Appl. Chem. 1984, 56, 595–624. [Google Scholar]
- Slominski, A.; Semak, I.; Pisarchik, A.; Sweatman, T.; Szczesniewski, A.; Wortsman, J. Conversion of L-tryptophan to serotonin and melatonin in human melanoma cells. FEBS Lett. 2002, 511, 102–106. [Google Scholar] [CrossRef]
- de Marte, M.L.; Enesco, H.E. Influence of low tryptophan diet on survival and organ growth in mice. Mech. Ageing Dev. 1986, 36, 161–171. [Google Scholar] [CrossRef]
- Shen, Y.; Voilqué, G.; Kim, J.; Odle, J.; Kim, S. Effects of increasing tryptophan intake on growth and physiological changes in nursery pigs. J. Anim. Sci. 2012, 90, 2264–2275. [Google Scholar] [CrossRef]
- Blair, R.; Newberry, R.; Gardiner, E. Effects of lighting pattern and dietary tryptophan supplementation on growth and mortality in broilers. Poult. Sci. 1993, 72, 495–502. [Google Scholar] [CrossRef]
- Walton, M.; Coloso, R.M.; Cowey, C.; Adron, J.; Knox, D. The effects of dietary tryptophan levels on growth and metabolism of rainbow trout (Salmo gairdneri). Br. J. Nutr. 1984, 51, 279–287. [Google Scholar] [CrossRef] [PubMed]
- Zhang, C.; Zhang, Q.; Song, X.; Pang, Y.; Song, Y.; Wang, Y.; He, L.; Lv, J.; Cheng, Y.; Yang, X. L-tryptophan promotes the cheliped regeneration of Chinese mitten crab (Eriocheir sinensis) through melatonin, serotonin and dopamine involvement. Aquaculture 2019, 511, 734205. [Google Scholar] [CrossRef]
- Peng, L.; Chen, L.; Wan, J.; Liu, W.; Lou, S.; Shen, Z. Single-cell transcriptomic landscape of immunometabolism reveals intervention candidates of ascorbate and aldarate metabolism, fatty-acid degradation and PUFA metabolism of T-cell subsets in healthy controls, psoriasis and psoriatic arthritis. Front. Immunol. 2023, 14, 1179877. [Google Scholar] [CrossRef]
- Kurpejović, E.; Wendisch, V.F.; Sariyar Akbulut, B. Tyrosinase-based production of L-DOPA by Corynebacterium glutamicum. Appl. Microbiol. Biotechnol. 2021, 105, 9103–9111. [Google Scholar] [CrossRef]
- Bi, B.; Yuan, Y.; Zhao, Y.; He, M.; Song, H.; Kong, L.; Gao, Y. Effect of crowding stress on growth performance, the antioxidant system and humoral immunity in hybrid sturgeon. Aquac. Rep. 2023, 28, 101468. [Google Scholar] [CrossRef]
- Yu, Q.; Fu, Z.; Huang, M.; Xu, C.; Wang, X.; Qin, J.G.; Chen, L.; Han, F.; Li, E. Growth, physiological, biochemical, and molecular responses of Pacific white shrimp Litopenaeus vannamei fed different levels of dietary selenium. Aquaculture 2021, 535, 736393. [Google Scholar] [CrossRef]
- GM, M.-K. Retinoids and mammalian development. Int. Rev. Cytol. 1999, 188, 73–131. [Google Scholar]
- Lidén, M.; Eriksson, U. Understanding retinol metabolism: Structure and function of retinol dehydrogenases. J. Biol. Chem. 2006, 281, 13001–13004. [Google Scholar] [CrossRef]
- Shapiro, B.H.; Agrawal, A.K.; Pampori, N.A. Gender differences in drug metabolism regulated by growth hormone. Int. J. Biochem. Cell Biol. 1995, 27, 9–20. [Google Scholar] [CrossRef]
- Moisá, S.J.; Shike, D.W.; Graugnard, D.E.; Rodriguez-Zas, S.L.; Everts, R.E.; Lewin, H.A.; Faulkner, D.B.; Berger, L.L.; Loor, J.J. Bioinformatics analysis of transcriptome dynamics during growth in angus cattle longissimus muscle. Bioinform. Biol. Insights 2013, 7, BBI-S12328. [Google Scholar] [CrossRef]
- Wang, M.; Jin, S.; Liu, S.; Fu, H.; Zhao, Y.; Jiang, L. Genome-Wide Association Study of Growth and Sex Traits Provides Insight into Heritable Mechanisms Underlying Growth Development of Macrobrachium nipponense (Oriental River Prawn). Biology 2023, 12, 429. [Google Scholar] [CrossRef] [PubMed]
Disclaimer/Publisher’s Note: The statements, opinions and data contained in all publications are solely those of the individual author(s) and contributor(s) and not of MDPI and/or the editor(s). MDPI and/or the editor(s) disclaim responsibility for any injury to people or property resulting from any ideas, methods, instructions or products referred to in the content. |
© 2024 by the authors. Licensee MDPI, Basel, Switzerland. This article is an open access article distributed under the terms and conditions of the Creative Commons Attribution (CC BY) license (https://creativecommons.org/licenses/by/4.0/).