Data Descriptor

A Dataset of Dropout Rates and Other School-Level Variables in Louisiana Public High Schools

1
Department of Information Services—GIS Section, City of Baton Rouge and Parish of East Baton Rouge, Baton Rouge, LA 70802, USA
2
Department of Geography and Anthropology, Louisiana State University, Baton Rouge, LA 70803, USA
3
Coastal Studies Institute, Louisiana State University, Baton Rouge, LA 70803, USA
*
Author to whom correspondence should be addressed.
Submission received: 18 March 2022 / Revised: 8 April 2022 / Accepted: 9 April 2022 / Published: 12 April 2022
(This article belongs to the Special Issue Education Data Mining)

Abstract

:
Students dropping out of high school is a nationwide problem in the United States, plaguing communities and often greatly reducing the prospects of a quality life for those students who do not complete their high school education. The state of Louisiana consistently has among the highest public high school dropout rates in the United States and, often, the highest. This massive dataset of school variables covering a duration of five academic years (2014–2015 to 2018–2019) was originally compiled with the intention of identifying the factors that correlate with high school dropouts in Louisiana public high schools, specifically. However, it can be useful to any researchers interested in analyzing school-level data concerning a wide range of variables beyond merely dropout rates. This dataset also contains socioeconomic demographics, financial variables, class size, and much more. The correlation analyses ultimately revealed many intriguing insights into the relationships between the tested variables and the dropout rates.
Dataset: The complete dataset, titled “A Dataset of Dropout Rates and Other School-Level Variables in Louisiana Public High Schools”, is published here on Zenodo, an online data repository managed by CERN. The Digital Object Identifier (DOI) of this dataset is 10.5281/zenodo.6382661. Assuming normal connectivity, the Excel spreadsheet should take no longer than 30 s to download. In the event that this link no longer provides you access to the dataset, please see the Data Availability Statement or contact Michael Stein via his permanent email address at [email protected], and he will send you the dataset directly.
Dataset License: Creative Commons Attribution 4.0 International

1. Introduction

Every year, well over half a million high school students drop out of school in the United States. Few of them return to earn their diplomas or General Education Development Test (GED) certificates. While some of these young people will ultimately get their lives back on track and secure stable careers, many of them will end up homeless or involved in criminal activity within a few years after dropping out of high school. One alarming study found that high school dropouts commit around 75 percent of all crimes in the United States [1]. In particular, male minorities living in urban areas correlate strongly with this trend. For example, a study found that about 60 percent of Black students in the Bronx who dropped out of high school serve prison time [2].
Completing high school education is a critical step in a person’s life, and failing to do so generally sets them on a dire course for the future. For prior generations of Americans, this was not the case, but in the current economy, it is difficult for anyone to gain employment in a legitimate career path without a high school diploma or GED certificate.
The average dropout has an annual income of only USD 20,241, which is USD 10,386 less than those with a high school diploma or GED [3]. That is the difference between living close to poverty levels by US standards and having a stable lower- to middle-class income. Over a lifetime, the average career earnings of dropouts are USD 260,000 less than those who earn a high school diploma or GED. A 2010 National Center for Education Statistics (NCES) study [
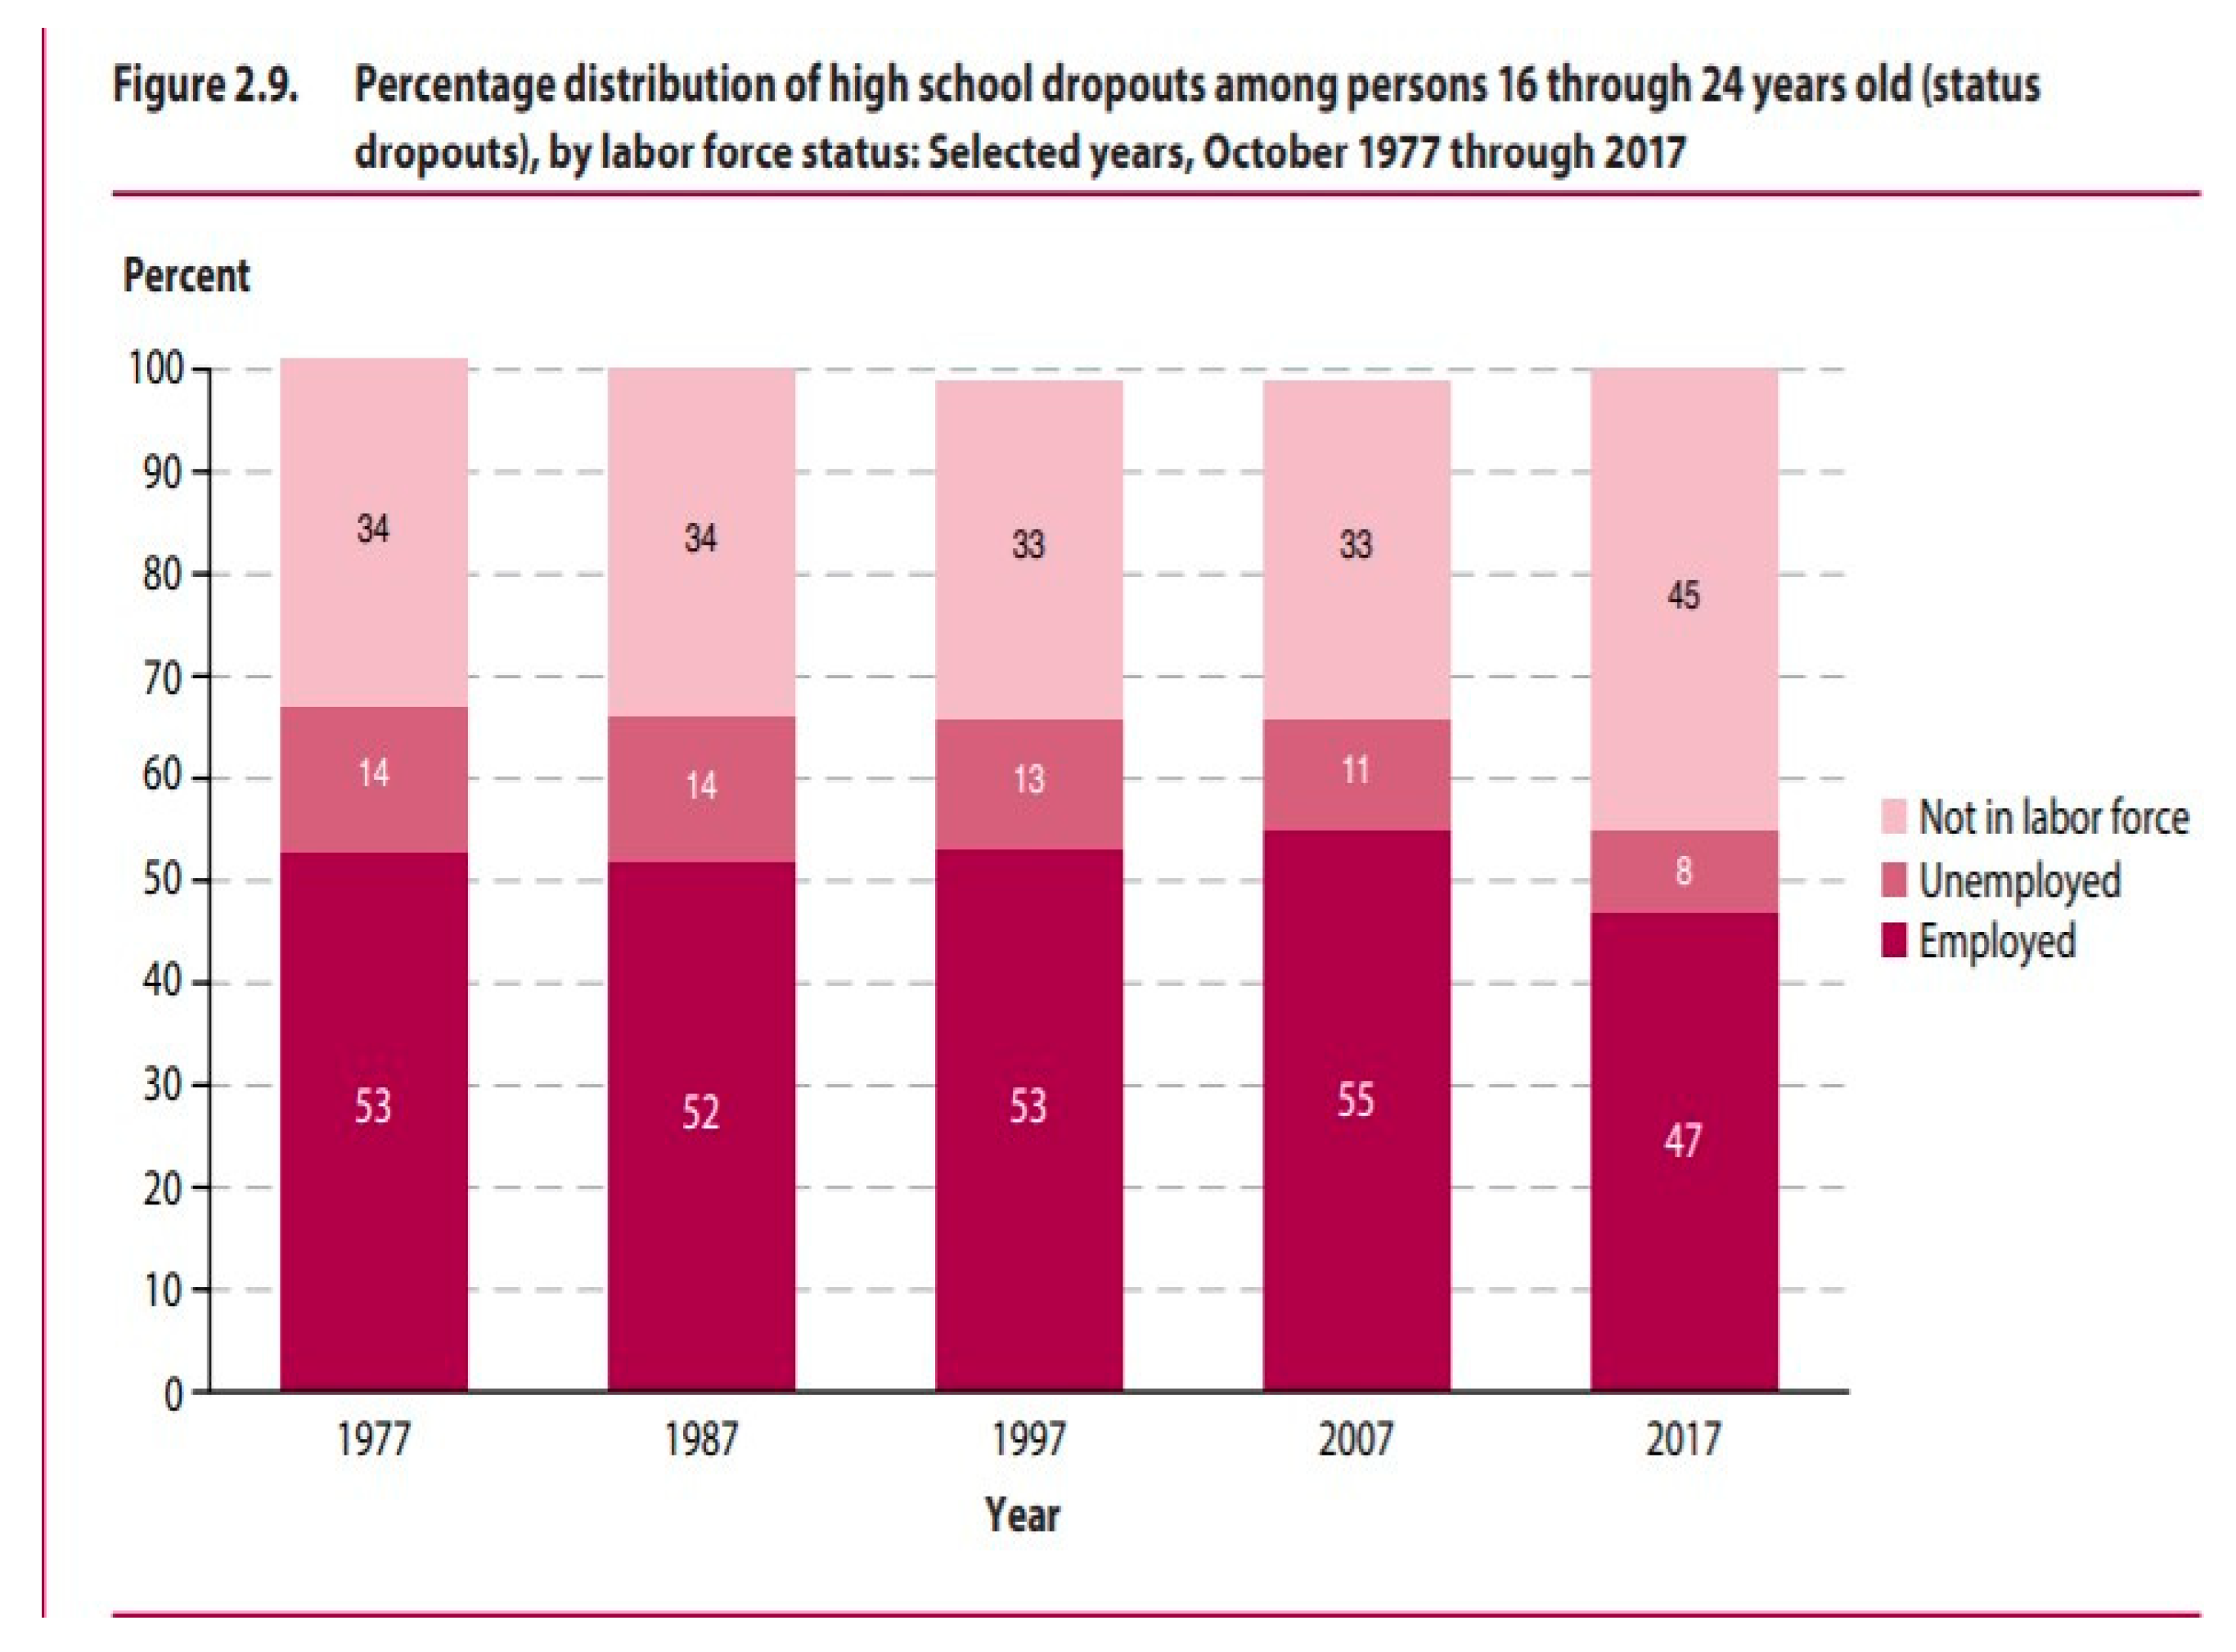
4] estimated that getting just one student to graduate from high school instead of dropping out would create an average societal net benefit of USD 200,000 over that person’s lifetime. High school dropouts in 2017 were also found to have the highest unemployment rate by far of any social class at around 13 percent [5]. For the first time on record, the majority of American dropouts aged 16–24 were not active participants in the labor force, as Figure 1 below shows. An increasing number of these people are no longer even employed in minimum wage jobs, as they were in prior decades.
While high school dropouts are a nationwide problem, they are a problem that is especially prevalent in the state of Louisiana. The 2019 NCES study [5] found that Louisiana public high schools had the highest dropout rate in the nation by far over the period from 2013 to 2017. A staggering 9.6 percent of Louisiana residents between ages 16 and 24 were high school dropouts far beyond the national average of 6.0 percent [3]. Louisiana public high schools consistently have among the highest dropout rates in the nation each year and, often, the very highest. In the dataset of this project, it was found that approximately one in nine of Louisiana’s seventh graders dropped out of public high schools before completing the twelfth grade. About 6000 students drop out of high school each year in Louisiana. The severity of the problem is a major factor in the state’s high poverty, violent crime rates, and its struggles to keep up with neighboring states economically [6].
This dataset was compiled for a project that studied high school dropouts in the state of Louisiana from the geospatial and statistical perspectives, seeking to find clear patterns for what factors cause the dropout rate to grow or diminish. Despite dropouts being such a prevalent and consistent problem in the state, there has been a miniscule amount of publicly available research about high school dropout rates in Louisiana [7]. What little there is tends to be a brief mention in national studies or a short annual update on school performance metrics, sometimes including dropout statistics, in a local paper [7,8,9]. The project aimed to help bridge that gap in the established research by performing a comprehensive analysis of the problem. The full project report, which also includes a spatial analysis of the dropout rates and further literature to explore, can be found here [10]. However, this dataset can be useful to researchers and analysts who are interested in studying other aspects of school-level data.
The paper is organized as follows. Section 2 describes in detail the characteristics of the study area to allow for a better understanding of the data. This section explains the types of schools included or omitted from the dataset and clarifies things for readers who may not be familiar with the structure of American high schools. Section 3 is used to outline the 86 school-level variables that constitute the dataset. Further information about some variables is provided in the appendices. The paper ends with a brief summary.

2. Study Area Characteristics

2.1. Overview

The study area of this dataset is composed of all standard public high schools in the state of Louisiana. The only schools from the available source data that were excluded from this dataset are alternative schools (reform schools for highly troubled or handicapped children) and virtual, online-only schools. These schools were omitted, because they tended to have abnormally high dropout rates that would skew the analysis and because their core purpose is so fundamentally different from standard public schools that cross-comparing them is neither practical nor useful. These schools omitted from the dataset are few in number and represent a negligible amount of Louisiana’s high school students. However, the same detailed information found in this dataset for the standard public high schools is still available for these omitted schools in the source datasets for those who wish to access it.
However, it is important to point out that private schools, which enroll roughly 15 percent of high school students in Louisiana annually [11], are not included in this dataset. The minimal amount of information that is publicly available concerning private schools is simply not comprehensive enough to cross-compare with the available data from public schools, and consequently, private schools were omitted from this study.
This dataset covers a duration of five academic school years: 2014–2015, 2015–2016, 2016–2017, 2017–2018, and 2018–2019 (for details see Supplementary Materials below). There are 313 schools included in this dataset for the 2014–2015 academic year, 311 schools for the 2015–2016 academic year, 315 schools for the 2016–2017 academic year, 319 schools for the 2017–2018 academic year, and 320 schools for the 2018–2019 academic year. The Louisiana Department of Education has been recording and publishing extensive records of a wide variety of variables starting with the 2014–2015 school year, which is why the duration of this study begins there. There are some data published for prior academic years dating back to 2007–2008, but these data are limited and not detailed enough to be included in this dataset with the richly detailed data from 2014–2015 and later.
To put the massive scale of this dataset into perspective, just over two hundred thousand 7th–12th grade students were included in the analyses for each year, and over a million 7th–12th grade students were included over the five-year study. Compiling and testing the data over a period of five years allowed for the tracking of two cohorts of eighth grade classes all the way through graduation, and it accounted for any student who completed a remedial period before starting the ninth grade.
The overwhelming majority of the 325 different schools in this study were teaching high school students for all five years of the study’s duration and kept the same school name. Table 1 shows the exceptions to that trend. Academic years during which the schools were open and teaching 9th grade students are shown in green, and the years during which the schools were closed or permanently stopped teaching 9th grade students (in the case of Northshore Charter School) are shown in red. The yellow cells represent two formerly separate schools that combined into one school, such as G.W. Carver High School in New Orleans. The gray cells represent years where the schools were not yet opened or not yet teaching 9th grade students.

2.2. Types of Schools

This subsection provides further details on the types of schools present in this dataset, which, in some cases, help to contextualize the data. In the dataset, Field AN denotes the school type.
Normal public schools—defined as standard (non-magnet and non-charter) public schools that must admit all student applicants from their mandated attendance zone. About eighty percent of the schools in this dataset fall under this category. The smallest of these have less than one hundred students, while the largest have more than two thousand students.
Magnet Schools—defined as public schools for highly gifted students that must qualify for admission to the school via a rigorous testing process. In this dataset, to qualify as a true magnet school, the entire student body must be enrolled in a magnet curriculum, and the school must not have a mandated attendance zone that constitutes less than an entire parish. Students who do not maintain the required academic performance standards are put on probation and eventually dismissed from the school if they do not make acceptable improvements.
Lab Schools—defined as schools operated with direct oversight from a college or university, with the specific aim of educating the children of their faculty and staff. Though fees are minimal, admission to these schools is highly selective.
Charter Schools—Charter schools are tuition-free public schools supported by taxpayer funding, and with few exceptions, enrollment is open to all students via a lottery process instead of attendance zones. They are independently operated schools that run with more flexibility than traditional public schools in exchange for increased accountability. The charter that establishes each school is a contract detailing the school’s mission, program, performance goals, and methods of assessment. Charter schools that perform poorly or otherwise break their contract in some way can have their authority to operate the school revoked, and the school can be closed or transferred to the oversight of a different charter organization. Charter schools are a relatively recent option for public education in the United States, and they have made significant inroads in Louisiana in the past two decades, particularly in the urban cores of major cities. In fact, in the aftermath of Hurricane Katrina in 2005, all public schools in the Orleans Parish are charter schools, in one form or another.

Types of Charter Schools

There are six types of charter schools, as defined by the Louisiana Charter Schools Handbook [12]:
  • Type 1: A new school chartered by a Local School Board;
  • Type 2: A new school or a converted preexisting school chartered by the BESE (Louisiana Board of Elementary and Secondary Education);
  • Type 3: A converted preexisting school chartered by a local school board;
  • Type 3B: A former Type 5 charter school transferred from the Recovery School District (RSD) to a local school board;
  • Type 4: A new school or a converted preexisting school chartered by BESE to a local school board;
  • Type 5: A formerly failing school chartered by BESE and supervised by the Recovery School District.
In addition to the six types of charter schools defined by the state, in this dataset, there are three special charter schools coined as “magnet charter” schools. In almost all cases, charter schools are not allowed to select students for enrollment based strictly on talent or academic achievements, but a few charter schools have special permission to do so and operate in the same manner as public magnet schools. All three of these schools existed as schools for gifted students prior to becoming charter schools, so they are allowed to retain this tradition as charter schools because it complements their mission as schools.
It should also be mentioned that school enrollments in Louisiana are quite consistent from year to year, both in total enrollment and in each individual grade. Once a school has been established for many years, it generally settles into a consistent and carefully planned number of enrolled students. Unless the school begins the process of closing down, its enrollment will generally remain consistent unless there is a significant external disruption introduced, such as a nearby school opening, closing, or merging with another school.

3. Dataset Description

There are 86 variables in this dataset. Variables that measure a similar component of the school are color-coded for convenience and grouped together. The following paragraphs in this section outline the variables that constitute this dataset.
The first three fields of the dataset, shown in gray, indicate the academic year (Field A), the school district (Field B), and the high school (Field C) that the rest of the data in each row correspond to. The data is organized by date in sequential order, from the oldest data (2014–2015 academic year) to the most recent data (2018–2019 academic year). Within each year, the data are arranged in the order they were recorded in the source records from which they were compiled. This generally means the schools are arranged in alphabetical order by parish (the administrative equivalent of a county in most of the US) and then further alphabetized by school name within each parish. However, the schools not under the jurisdiction of a parish school board were often recorded in a random order from year to year. These schools are found at the bottom of the list in each academic year.
The next nineteen fields of the dataset, shown in yellow, measure the number and rate of dropouts in each high school during a given academic year. Field D represents the total number of dropouts in each school, while Field E represents the number of dropouts in the 7th and 8th grades combined, and Field F represents the number of dropouts from the 9th through 12th grades combined. The next seven variables represent the number of dropouts in the 7th grade (Field G), the 8th grade (Field H), the transitional 9th grade (Field I), the 9th grade (Field J), the 10th grade (Field K), the 11th grade (Field L), and the 12th grade (Field M), respectively. It is important to note that some schools do not have students enrolled in all of the grades listed above, often the 7th and 8th grades. Those data points are marked as not applicable (N/A) rather than zero.
The remaining nine variables represent the dropout rate in the 7th–12th grades combined (Field N), 9th–12th grades combined (Field O), the 7th grade (Field P), the 8th grade (Field Q), the transitional 9th grade (Field R), the 9th grade (Field S), the 10th grade (Field T), the 11th grade (Field U), and the 12th grade (Field V), respectively. As with the dropout numbers, the dropout rates are marked as not applicable (N/A), rather than zero, for grades at a school with no students enrolled.
It is important to note that sometimes a student will transfer from one school to another before or during a school year. Although such students have left their original school, they did so with permission and are not considered to be dropouts in these variables. Only students that leave school unapproved for any reason except death are considered to be dropouts. Unfortunately, detailed information about the number of transferred students entering and leaving each school is not made available to the public at this time for privacy concerns.
The next three fields of the dataset, shown in green, show the number of students enrolled in the school, as recorded on October 1st, roughly eight weeks after the start of the school year. Recording this count in October allows the interschool movement of students in the opening weeks of the academic year to settle down, as families confirm their residences for the year. Field W lists the total enrollment of all students in the school from pre-kindergarten through the 12th grade. Field X lists the combined enrollment of the 9th through 12th grades, while Field Y lists the combined enrollment of the 7th through 12th grades. Depending on the nature of the school, these variables can all be identical or unique. They would be the same for a large, urban high school with students only in the 9th through 12th grades, but they would be unique for a small, rural high school with students from kindergarten through the 12th grade.
The next twelve variables, also shown in green, relate to the racial and socioeconomic demographics of the total student body enrolled in each school. Field Z is the percentage of female students, while Field AA is the percentage of male students. The following six variables represent the percentage of Native American students (Field AB), Asian students (Field AC), Black students (Field AD), Hispanic students (Field AE), Hawaiian and Pacific Islander students (Field AF), and White students (Field AG), respectively. Field AH represents the percentage of multiracial students (exclusive of all racial groups listed above). Field AI represents the percentage of minority students (a combination of all non-White student groups listed above). Field AJ represents the percentage of “At-Risk” students. Due to various factors, such students are considered to be Economically Disadvantaged by the state of Louisiana. See Appendix A for further information about this. Field AK represents the percentage of students with limited English language proficiency (LEP), which, in Louisiana, are primarily students who speak Spanish or Vietnamese at home as their first language.
The next seven fields, shown in light blue, represent the number of students enrolled in the 7th grade (Field AL), the 8th grade (Field AM), the transitional 9th grade (Field AN), the 9th grade (Field AO), the 10th grade (Field AP), the 11th grade (Field AQ), and the 12th grade (Field AR), respectively.
The next three fields of the dataset, shown in green, further cover the grade composition and nature of each school. Field AS represents the percentage of 9th graders in the school who were in the transitional 9th grade (T9). See Appendix B for more information about the T9 program. Field AT represents the starting grade of the school during that academic year, from the 1st grade at the earliest to the 12th grade at the latest. For simplicity, schools that start with kindergarten or earlier are recorded as starting in the 1st grade, while schools that start with the transitional 9th grade are recorded as starting in the 9th grade. Field AU denotes the school type for comparative purposes.
The next four fields of the dataset, shown in blue, relate to class sizes in each school. These variables are recorded as the percentage of classes with 20 students or less (Field AV), classes between 21 and 26 students (Field AW), classes between 27 and 33 students (Field AX), and classes with 34 or more students (Field AY).
The next two fields of the dataset, shown in orange, relate to the suspension rates at each school. Field AZ represents the percentage of students issued an in-school suspension, while Field BA represents the percentage of students issued an out-of-school suspension. A suspension is a disciplinary measure in American schools issued for serious offenses. An in-school suspension might be issued for an infraction such as cheating and restricts the privileges of the student while they are still required to attend school. An out-of-school suspension prohibits the student from attending school for a brief time and might be issued for an infraction such as fighting.
The next two fields of the dataset, shown in red, represent the attendance rates and truancy rates at each school across the entire student body. Field BB represents the percentage of students attending class each day, while Field BC represents the percentage of students who had one or more unexcused absences during the school year (truants). Schools want attendance rates to be high and truancy rates to be low.
The next six fields of the dataset, shown in purple, represent retention rates. These variables are the percentage of students held back from completing the 7th Grade (Field BD), the 8th Grade (Field BE), the 9th Grade (Field BF), the 10th Grade (Field BG), the 11th Grade (Field BH), and the 12th Grade (Field BI), respectively. This is a case where differences in terminology are very important. From the college perspective, retention is a good thing, as it refers to keeping college students at the university and on the path to graduating. In the context of high school students, however, retention means something quite different. When a high school student does not fulfill the requirements to advance to the next grade by the end of the academic year, they are retained, meaning they must repeat that grade again the next year. High schools want their retention rates to be as low as possible. Sometimes, schools get into trouble for passing students onto the next grade level who have not actually met the proper requirements, even falsifying test scores. A few schools have been closed down for doing such things, such as John F. Kennedy High School and Tallulah Charter School in this dataset.
Field BJ, shown in pink, is the average ACT (American College Test) score of students at a high school. Though far from perfect, the ACT is a general standard assessment of how prepared a high school student is for college, and it is taken by millions of American students each year. It tests reading comprehension, as well as basic knowledge of mathematics (algebra, geometry, and trigonometry) and English that students should have learned by the 11th grade. Scores range from 1 to 36, and the average ACT score for students in this study is 19.0.
The next four variables, shown in green, relate to the expense per student and staff salaries at each school. Field BK shows the average of US dollars spent per student across the entire student body. Field BL shows the average teacher salary, while Field BM shows the average salary of administrators. Field BN shows the average salary across all school staff, including those who are neither teachers nor administrators.
The next seven fields, shown in blue, relate to the teachers at each school. The first five variables cover the highest educational attainment of the teachers. They represent the percentage of teachers: with less than a Bachelor’s degree (Field BO), with a Bachelor’s degree (Field BP), with a Master’s degree (Field BQ), who are Education Specialists (Field BR), and with a Doctoral degree (Field BS). Field BT represents the average teacher experience in years. Field BU represents the percentage of staff who are teachers.
The next seven fields, shown in red, relate to the administrators at each school. The first five variables cover the highest educational attainment of the administrators. They represent the percentage of administrators: with less than a Bachelor’s degree (Field BV), with a Bachelor’s degree (Field BW), with a Master’s degree (Field BX), who are Education Specialists (Field BY), and with a Doctoral degree (Field BZ). Field CA represents the average administrator experience in years. Field CB represents the percentage of staff who are administrators.
The final six fields, shown in green, relate to the entire staff at each school, including those who are neither teachers nor administrators. The first five variables cover the highest educational attainment of the staff. They represent the percentage of staff: with less than a Bachelor’s degree (Field CC), with a Bachelor’s degree (Field CD), with a Master’s degree (Field CE), who are Education Specialists (Field CF), and with a Doctoral degree (Field CG). Field CH represents the average staff experience in years.

4. Conclusions

This paper contributes a dataset that includes a vast amount of school-level data over a duration of five academic years. It was compiled by combining dozens of source datasets and contains a wide range of variables that might be useful for additional research. The statistical analysis performed in the original research involved using a Pearson’s correlation coefficient to simply assess the nature of the relationships across the entire span of variables and present them in a way that would be easy for the general public to understand. However, more nuanced analytical methods can certainly be applied to this dataset by other researchers to answer more focused questions.
The correlation coefficient analysis performed with the dataset in the original project yielded many useful and interesting observations concerning predictive factors of the dropout rate. To briefly mention a few, funding per student was shown to have a significant positive correlation with the dropout rate, rather than negative, meaning that this is not a problem that can be solved with money alone. Likewise, the disparity in the dropout rates between White and Black students was conclusively not due to a disparity in funding. As Table 2 below shows, a difference in class size was also proven to have a critical impact on the dropout rate. The analyses of the data suggest that class sizes for high schools should be kept below twenty-six students as much as possible and, ideally, should be twenty students or less. In addition, the state’s new T9 (transitional 9th grade student) program has shown promising early results in combating the dropout rate, and its positive impacts should spread as the program is expanded in the coming years.

Supplementary Materials

The spreadsheets compiled for this master dataset can be found individually in the Data Center section of the Louisiana Department of Education website. All links listed below were accurate and working at the time of this publication. In addition to hosting data for the years included in this dataset (2014–2015 to 2018–2019), these webpages also store some data for academic years prior to and after that time period. The main webpage for the Data Center on the Louisiana Department of Education website can be found at https://www.louisianabelieves.com/resources/library/data-center. This page directs viewers to all of the data used in this master dataset, as well as additional data concerning Louisiana public schools that were not included. The datasets relating to School System Attributes, including the dropout rate, class size, discipline, attendance, truancy, and retention, can be found at https://www.louisianabelieves.com/resources/library/school-system-attributes. The datasets relating to Student Attributes, such as enrollment data, can be found at https://www.louisianabelieves.com/resources/library/student-attributes. The datasets relating to School Financial Data can be found at https://www.louisianabelieves.com/data/310/, and viewers will need to use a series of filters to download the desired financial records from this page. The datasets relating to High School Performance, such as the average ACT scores, can be found at https://www.louisianabelieves.com/resources/library/high-school-performance.

Author Contributions

Conceptualization, M.S. and M.L.; methodology, M.S. and M.L.; formal analysis, M.S.; data curation, M.S.; writing—original draft preparation, M.S.; writing—review and editing, M.S., M.L., J.C.T. and K.K.; supervision, M.L., J.C.T. and K.K.; and project administration, M.L. All authors have read and agreed to the published version of the manuscript.

Funding

This research received no external funding.

Institutional Review Board Statement

Not applicable.

Informed Consent Statement

Not applicable.

Data Availability Statement

As previously stated, this dataset is available for public use here on Zenodo. The Digital Object Identifier (DOI) of this dataset is 10.5281/zenodo.6382661. As a backup, the same dataset is also stored here in a Google spreadsheet titled “Louisiana High School Dropout Study—Master Dataset Compilation” on Michael Stein’s personal account. In the event that both of these links above no longer provide you access to the dataset, please contact Michael Stein via his permanent email address at [email protected], and he will send you the dataset directly.

Conflicts of Interest

The authors declare no conflict of interest.

Appendix A

Economically Disadvantaged means any one of the following characteristics of a student: (a) Is eligible for Louisiana’s food assistance program for low-income families; (b) Is eligible for Louisiana’s disaster food assistance program; (c) Is eligible for Louisiana’s program for assistance to needy families with children to assist parents in becoming self-sufficient; (d) Is eligible for Louisiana’s healthcare program for families and individuals with limited financial resources; (e) Is eligible for reduced price meals based on the latest available data; (f) Is an English Language Learner; (g) Is identified as homeless or migrant pursuant to the McKinney-Vento Homeless Children and Youth Assistance Act and the Migrant Education Program within the Elementary and Secondary Education Act; (h) Is incarcerated with the office of juvenile justice or in an adult facility or (i) has been placed into the custody of the state.

Appendix B

The T9 (transitional 9th grade student) program was developed in recent years to help Louisiana students make the often-difficult jump from 8th grade to 9th grade. Some middle schools prepare their students better than others, and especially at large, urban high schools, there are often disparities in the 9th grade class between students coming from different feeder schools.
The goal of the T9 program [13] is to get 9th grade students who entered high school with academic proficiencies a bit below grade level fully caught up by the end of their 9th grade year so that they do not have to repeat the grade and are less at risk of dropping out. T9 students are enrolled in a special curriculum that effectively supplements the material they were supposed to learn in middle school while still allowing them to learn their 9th grade material alongside their classmates. They are essentially considered to be 8th graders who were not held back, and they have five years to graduate by the time they finish 12th grade. The program is fairly new, starting in the Fall 2014 semester, and it is not used in all public high schools.

References

  1. Greene, J.P.; Winters, M.A. Leaving boys behind: Public high school graduation rates. Educ. Work. Pap. Arch. 2006. Available online: https://files.eric.ed.gov/fulltext/ED508984.pdf (accessed on 10 April 2022).
  2. Crotty, J.M. Four Things I Learned from Coaching ‘Poor Black Kids’. Forbes, 16 December 2011. Available online: https://www.forbes.com/sites/jamesmarshallcrotty/2011/12/16/5-things-i-learned-from-coaching-poor-black-kids/?sh=3cb5553f13fc (accessed on 10 April 2022).
  3. McFarland, J.; Cui, J.; Stark, P. Trends in High School Dropout and Completion Rates in the United States: 2014; NCES 2018-117; National Center for Education Statistics: Washington, DC, USA, 2018. Available online: https://nces.ed.gov/pubs2018/2018117.pdf (accessed on 10 April 2022).
  4. Chapman, C.; Laird, J.; Ifill, N.; Kewal Ramani, A. Trends in High School Dropout and Completion Rates in the United States: 1972–2009. Compendium Report; NCES 2012-006; National Center for Education Statistics: Washington, DC, USA, 2011. Available online: https://nces.ed.gov/pubs2012/2012006.pdf (accessed on 10 April 2022).
  5. McFarland, J.; Cui, J.; Holmes, J.; Wang, X. Trends in High School Dropout and Completion Rates in the United States: 2019; NCES 2020-117; National Center for Education Statistics: Washington, DC, USA, 2020. Available online: https://nces.ed.gov/pubs2020/2020117.pdf (accessed on 11 April 2022).
  6. Moses, C. Company Leaves BR because of LA Limitations. WAFB Baton Rouge. 14 December 2009. Available online: https://www.wafb.com/story/11675861/company-leaves-br-because-of-la-limitations/ (accessed on 11 April 2022).
  7. Shafer, M.; Hori, M. The spatial dynamics of high school dropout: The case of rural Louisiana. J. Rural. Soc. Sci. 2006, 21, 55–79. [Google Scholar]
  8. Vowell, E. School Officials Combat Dropout Rates. WAFB Baton Rouge. 19 September 2012. Available online: https://www.wafb.com/story/19581148/school-officials-combat-dropout-rates/ (accessed on 10 April 2022).
  9. Shaun, W.; Wang, F. Disparities in accessibility of public high schools, in metropolitan Baton Rouge, Louisiana 1990–2010. Urban Geogr. 2014, 35, 1066–1083. [Google Scholar]
  10. Stein, M.D. A Geospatial and Statistical Analysis of Dropout in Louisiana Public High Schools. LSU Master’s Theses. 5387. 2021. Available online: https://digitalcommons.lsu.edu/gradschool_theses/5387 (accessed on 10 April 2022).
  11. Buddin, R. The Impact of Charter Schools on Public and Private School Enrollments. Cato Institute Policy Analysis No. 707. 28 August 2012. Available online: https://ssrn.com/abstract=2226597 (accessed on 10 April 2022).
  12. Louisiana Charter School Handbook for School Administrators 2017. Available online: https://lacharterschools.org/wp-content/uploads/2019/03/School-Leader-Legal-Handbook-2017-PDF.pdf (accessed on 10 April 2022).
  13. Louisiana Department of Education. Transitional 9th Grade Promotion Policy Guidance 2021–2022 School Year. La Believes. 2021. Available online: https://www.louisianabelieves.com/docs/default-source/policy/2021-2022-transitional-9th-grade-policy-guidance.pdf?sfvrsn=8ceb6718_2 (accessed on 11 April 2022).
Figure 1. Labor Force Distribution of Status Dropouts, October 1977–2017. Source: Figure 2.9 from the 2019 NCES Compendium Report. Public domain.
Data 07 00048 g001
Table 1. Schools that opened, closed, and merged during the study duration.
School2014–20152015–20162016–20172017–20182018–2019
Mentorship Academy of Digital Arts Merged into Mentorship STEAM Academy
Mentorship Academy of Science & Technology Merged into Mentorship STEAM Academy
Miller-McCoy Academy Closed
Grambling State University Lab School Closed
G. W. Carver Collegiate Academy Merged into G.W. Carver High School
G. W. Carver Preparatory Academy Merged into G.W. Carver High School
Algiers Technology Academy Closed
Fair Park High School Closed
Lake Area New Tech Closed
Northshore Charter School Closed
Mentorship STEAM Academy
Einstein Charter School
Kenner Discovery Health Sciences Academy
KIPP Booker T. Washington
Lincoln Preparatory School
Livingston Collegiate Academy
Magnolia School of Excellence
Collegiate Baton Rouge
Istrouma High SchoolClosedOpened
Morris Jeff Community School
Rooted School
Southside High School
Tallulah Charter School Closed
Jefferson RISE Charter School
John F. Kennedy High School
New Harmony High Institute
Rosenwald Collegiate Academy
Legend. Green = years schools were open and teaching 9th grade students; Red = years schools were closed or permanently stopped teaching 9th grade students; Yellow = years where two previously separate schools merged into one; and Gray = years schools were not yet open or not yet teaching 9th grade students.
Table 2. Correlation test results for class size variables.
DRt_7_12DRt_9_12DRate_7DRate_8DRate_T9DRate_9DRate_10DRate_11DRate_12
CS1_20−0.2229−0.1967−0.049−0.0982−0.0847−0.0985−0.1795−0.1179−0.1123
CS21_260.02990.02560.03140.00580.0563−0.01030.03580.0179−0.0241
CS27_330.22020.18890.03750.15960.05020.11150.16620.10530.1234
CS340.26350.24560.05480.06560.07240.13270.21050.1570.1803
The table above shows the Pearson correlation coefficients between percentages of average class sizes in the school and dropout rates (7th–12th, 9th–12th, and each individual grade). The two highlighted columns clearly demonstrate the critical relationship between class sizes and dropout rates in a school.
Publisher’s Note: MDPI stays neutral with regard to jurisdictional claims in published maps and institutional affiliations.

