
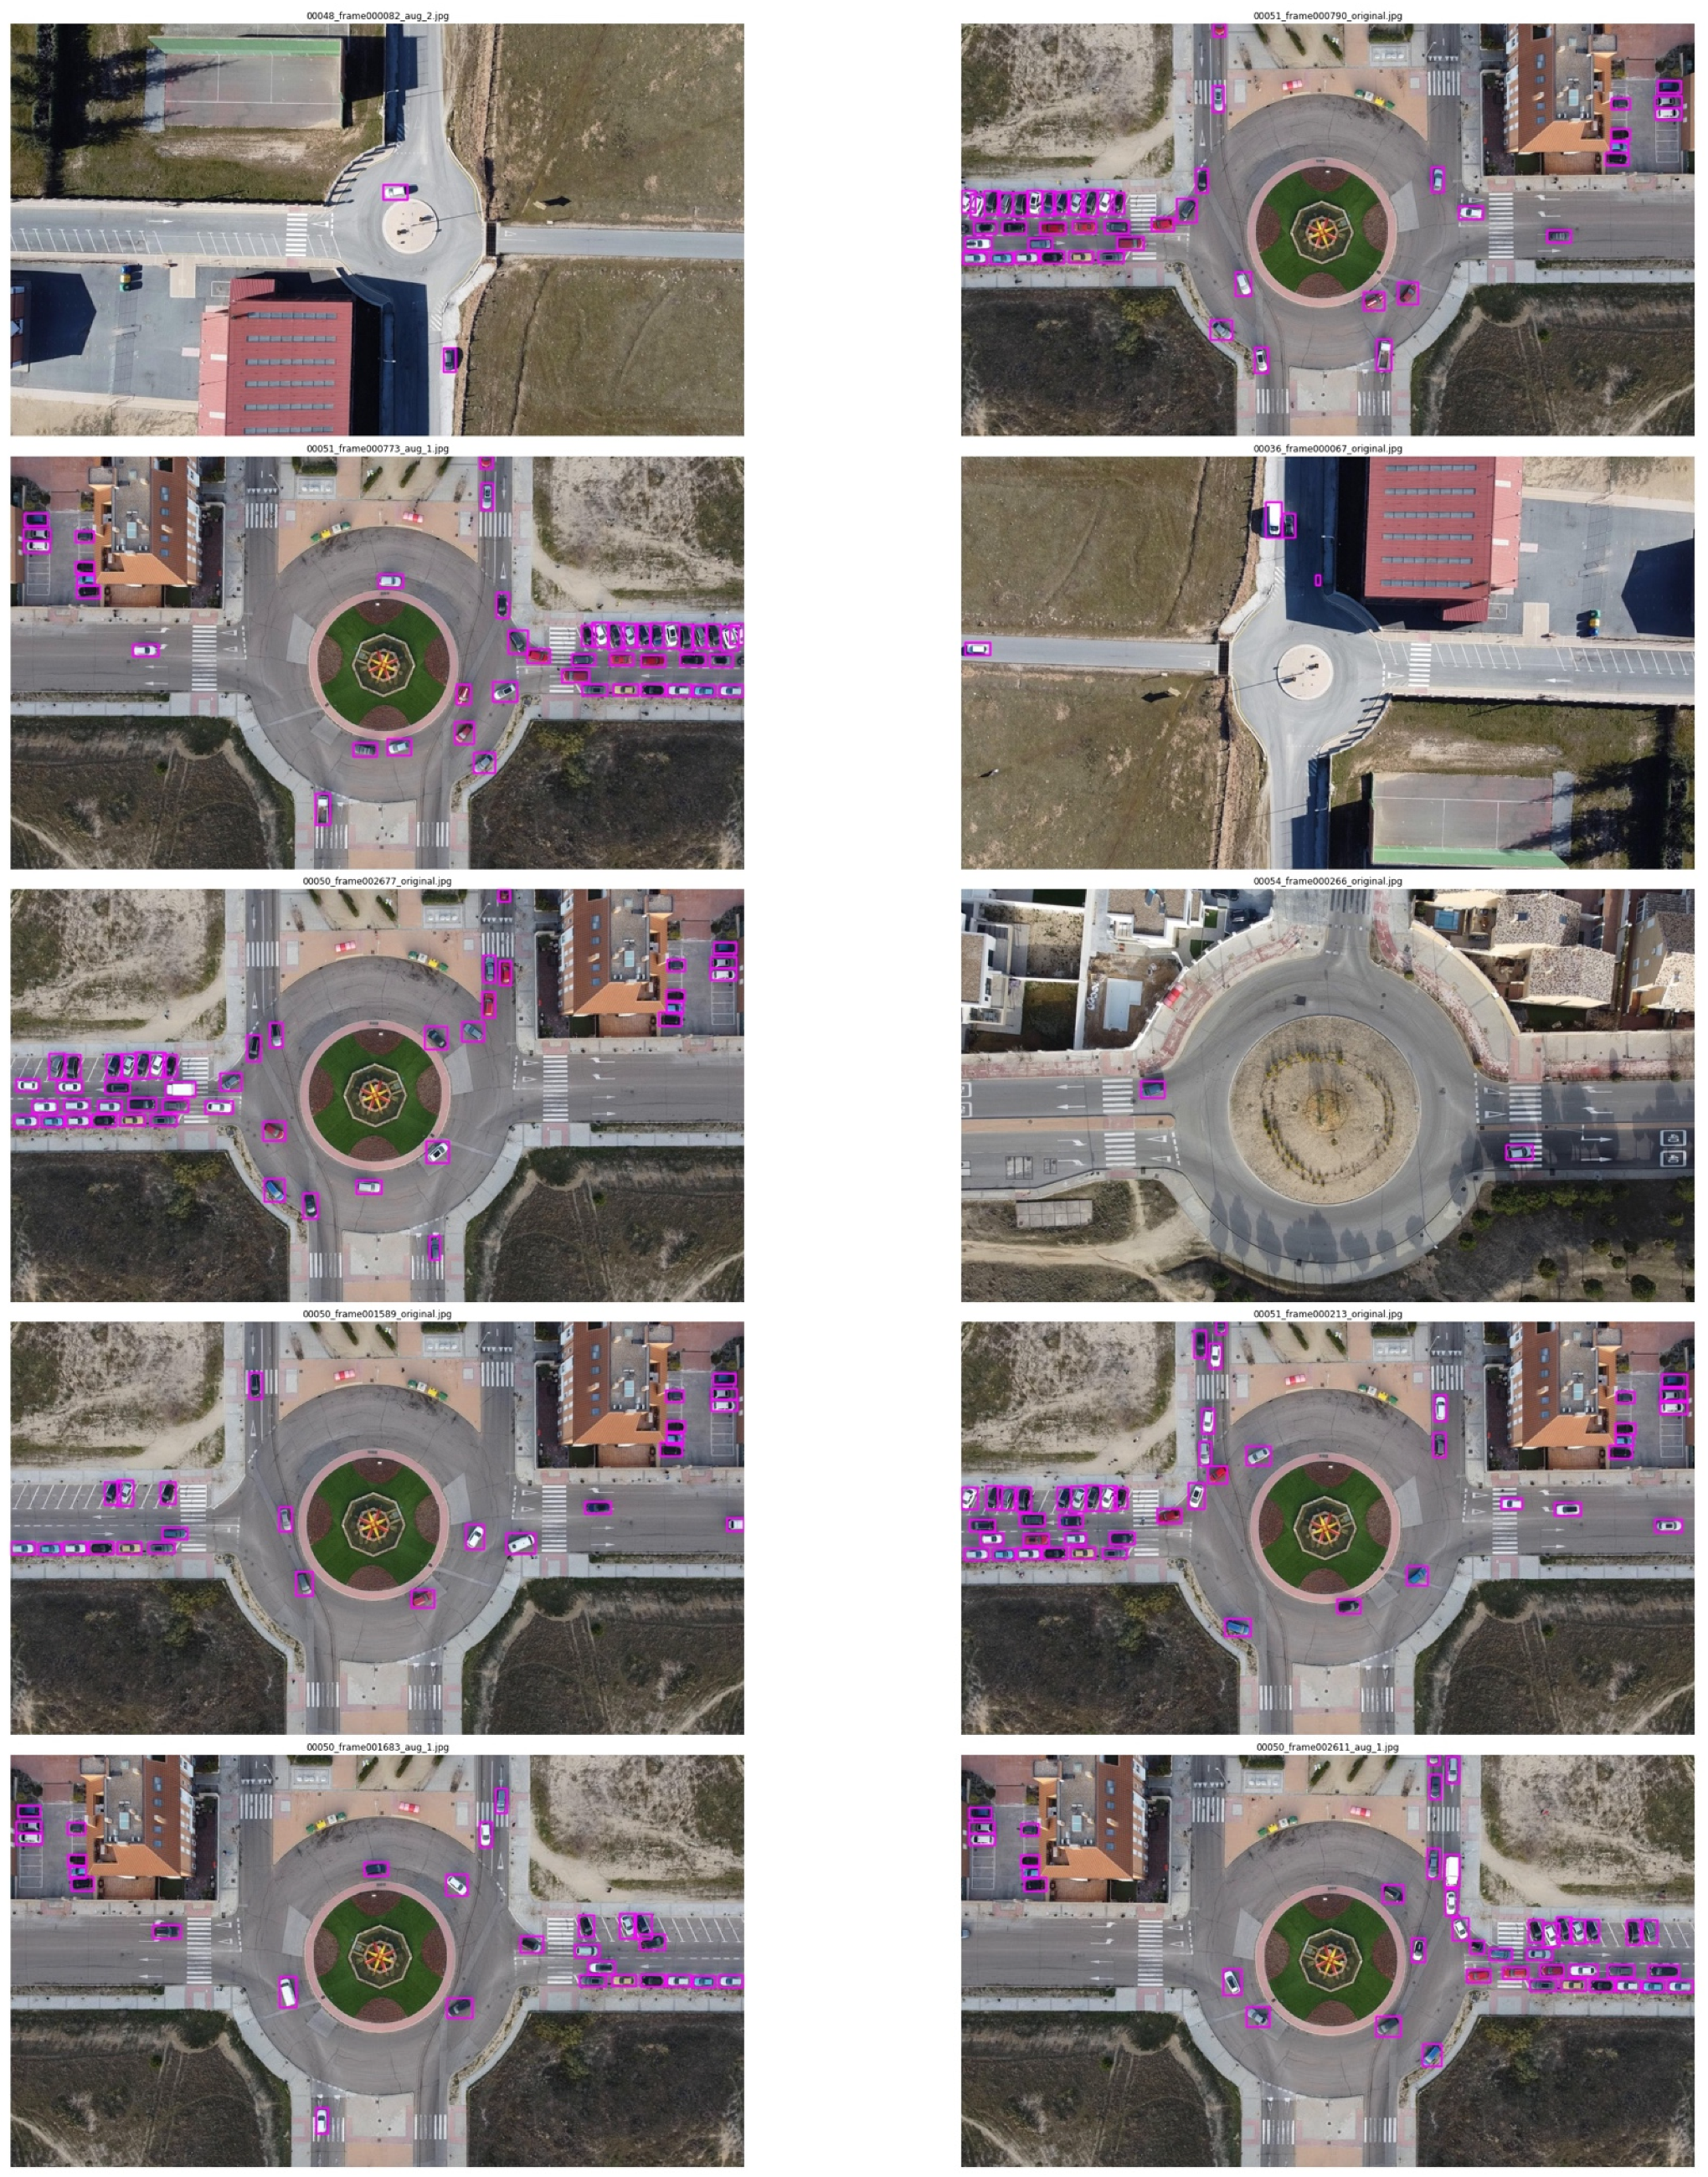
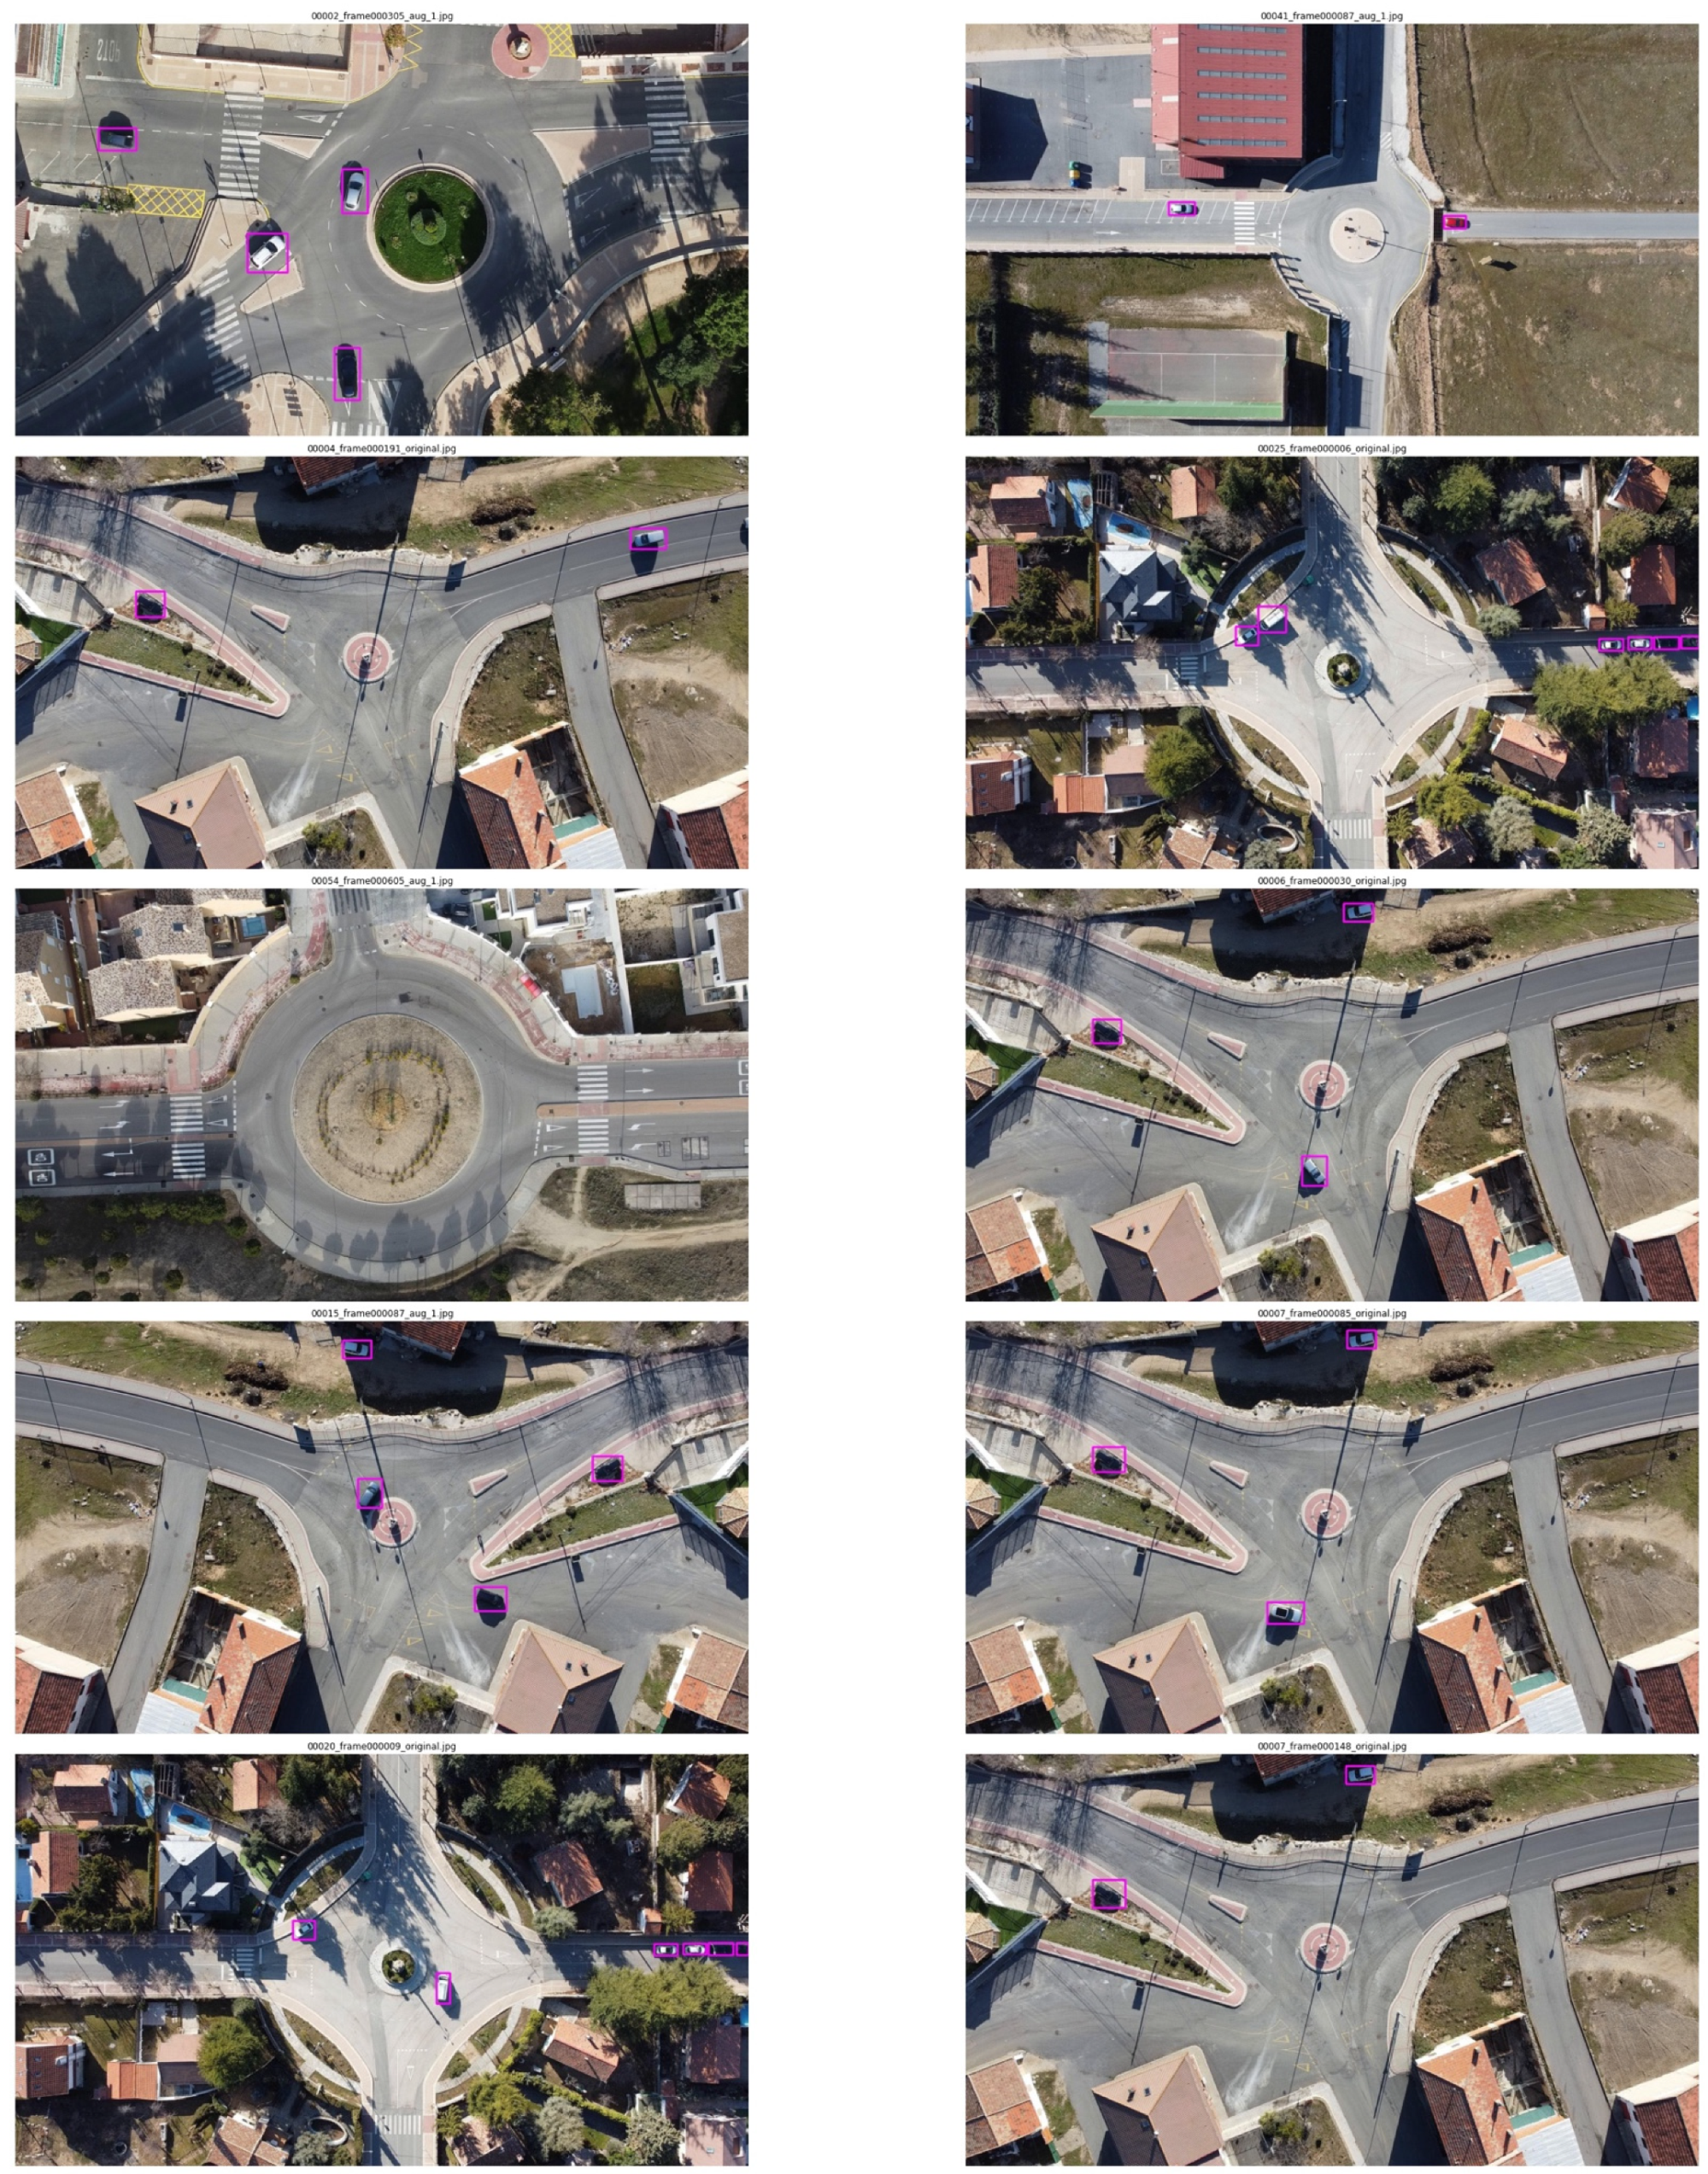
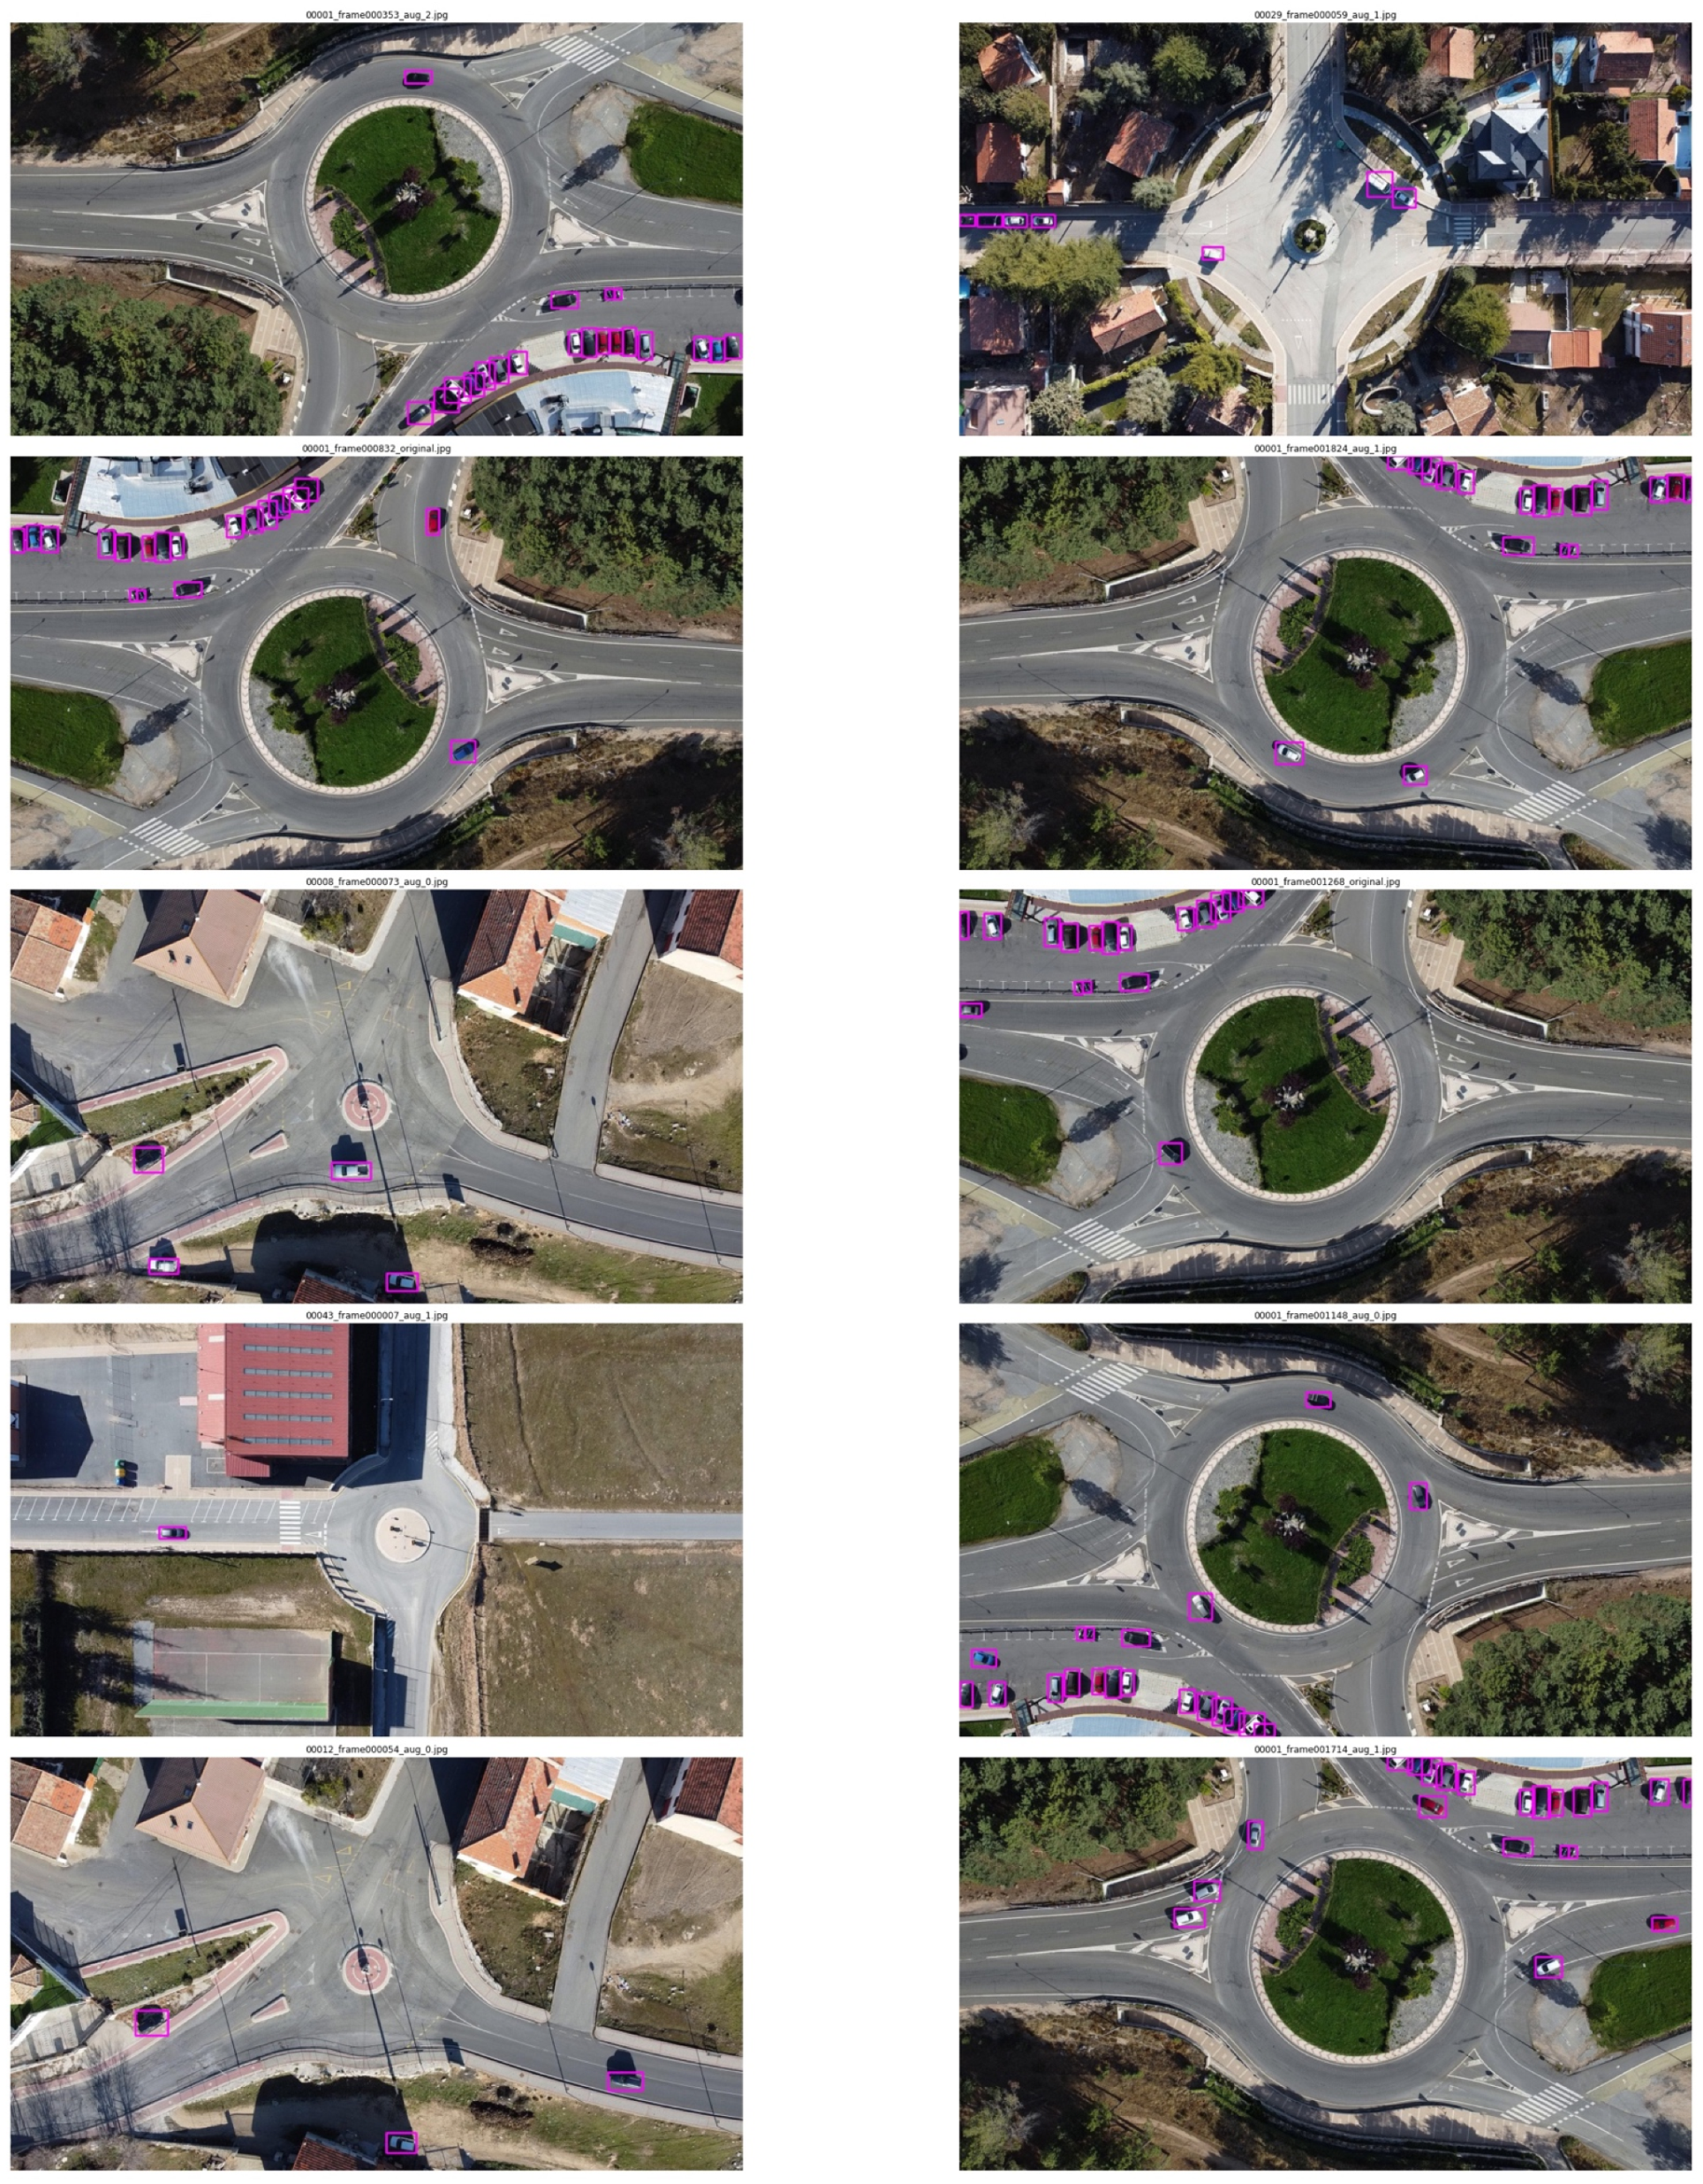
Dataset: Roundabout Aerial Images for Vehicle Detection

 ,
,  ,
,  and
and 
Abstract
:1. Introduction
2. Data Description
2.1. Dataset Summary
2.2. Annotations File
- folder: Indicates the folder where the images are located.
- filename: Name and extension of the image file to which the annotation file refers.
- path: Absolute path of the image file after annotation.
- size: Size in pixels and number of channels. Color images have three channels, while black and white images have one channel.
- object: It contains the data related to the object located in the image. This label and its contents are repeated for every single object located.
- o
- name: Object class name.
- o
- bndbox:
- ▪
- xmin: x-coordinate top left corner.
- ▪
- ymin: y-coordinate top left corner.
- ▪
- xmax: x-coordinate bottom right corner.
- ▪
- ymax: y-coordinate bottom right corner.
2.3. Folder Contents
- roundabout_dataset/
- o
- data.csv
- o
- roundabouts.csv
- o
- original/
- ▪
- imgs/
- ▪
- annotations/
- o
- aug_0/
- ▪
- imgs/
- ▪
- annotations/
- o
- aug_1/
- ▪
- imgs/
- ▪
- annotations/
- o
- aug_2/
- ▪
- imgs/
- ▪
- annotations/
- data.csv: Each row contains the following information separated by commas (,): image_name, x_min, y_min, x_max, y_max, class_name.
- roundabouts.csv: scene, id_roundabout, lat, long, height_(meters), with_zoom_height_(meters).
- imgs: Image files in .jpg format.
- annotations: Annotation files in .xml format.
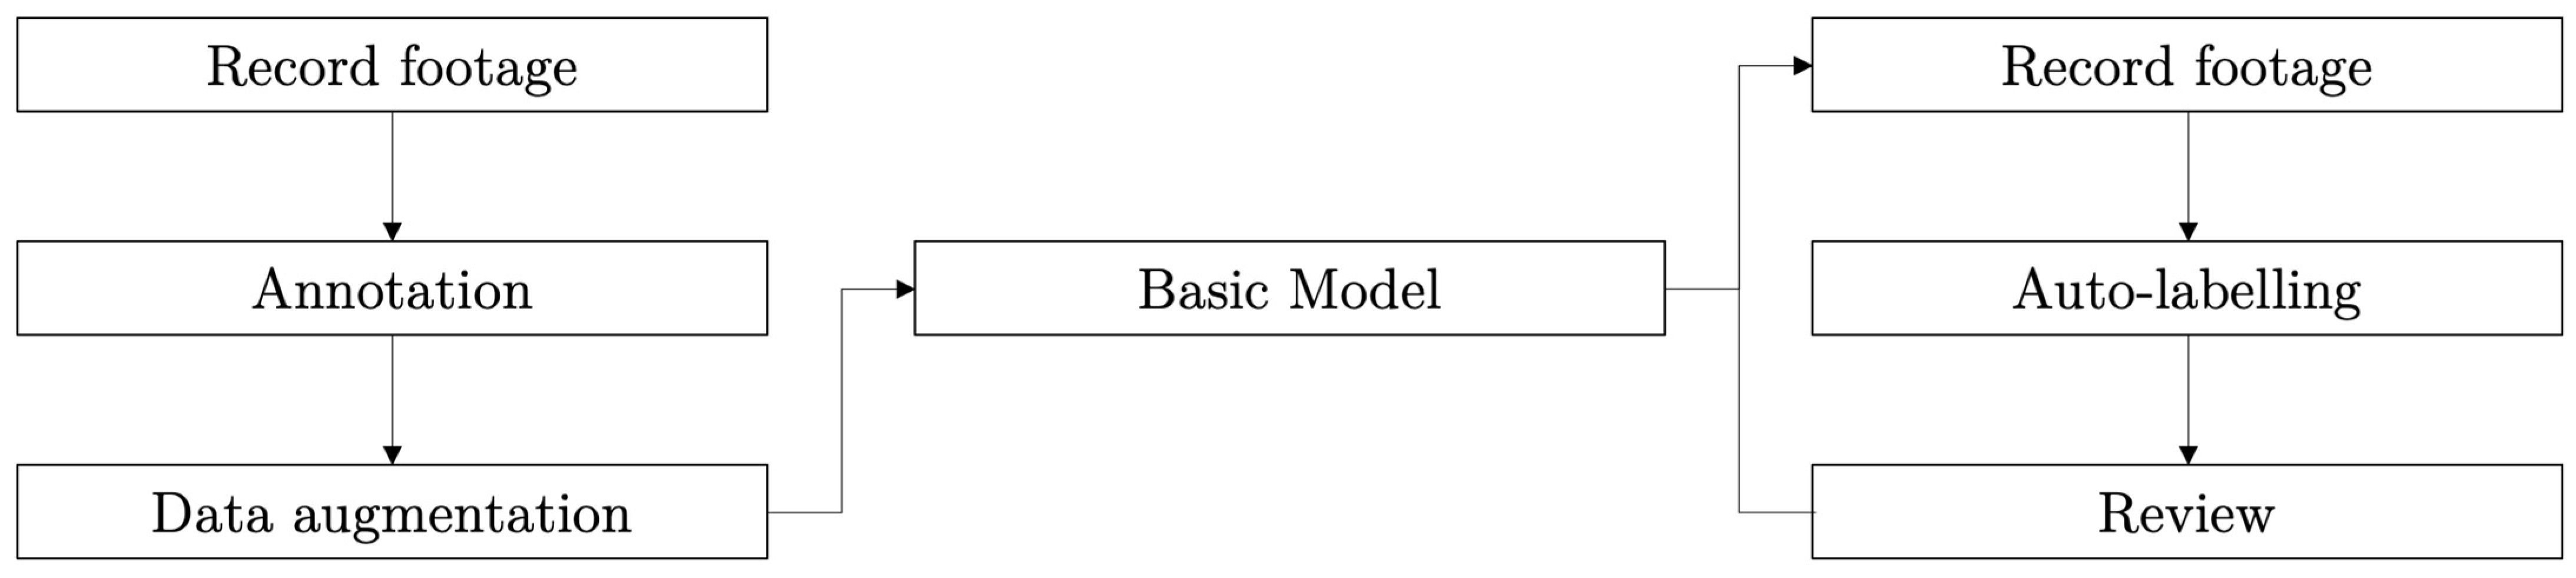
3. Methodology
4. Data Quality
5. Conclusions
Author Contributions
Funding
Institutional Review Board Statement
Informed Consent Statement
Data Availability Statement
Conflicts of Interest
References
- Soviany, P.; Ionescu, R.T. Optimizing the Trade-Off between Single-Stage and Two-Stage Deep Object Detectors using Image Difficulty Prediction. In Proceedings of the 2018 20th International Symposium on Symbolic and Numeric Algorithms for Scientific Computing (SYNASC), Timisoara, Romania, 20–23 September 2018; pp. 209–214. [Google Scholar]
- Redmon, J.; Divvala, S.; Girshick, R.; Farhadi, A. You only look once: Unified, real-time object detection. In Proceedings of the IEEE Conference on Computer Vision Andpattern Recognition, Las Vegas, NV, USA, 26 June–1 July 2016; pp. 779–788. [Google Scholar]
- Redmon, J.; Farhadi, A. YOLO9000: Better, Faster, Stronger. arXiv 2017, arXiv:1612.08242v1. [Google Scholar]
- Redmon, J.; Farhadi, A. YOLOv3: An Incremental Improvement. arXiv 2018, arXiv:1804.02767. [Google Scholar]
- Bochkovskiy, A.; Wang, C.-Y.; Liao, H.-Y.M. YOLOv4: Optimal Speed and Accuracy of Object Detection. arXiv 2020, arXiv:2004.10934. [Google Scholar]
- Liu, W.; Anguelov, D.; Erhan, D.; Szegedy, C.; Reed, S.; Fu, C.-Y.; Berg, A.C. Ssd: Single shot multibox detector. In Proceedings of the European Conference on Computer Vision, Amsterdam, The Netherlands, 11–14 October 2016; pp. 21–37. [Google Scholar]
- Lin, T.-Y.; Goyal, P.; Girshick, R.; He, K.; Dollár, P. Focal Loss for Dense Object Detection. IEEE Trans. Pattern Anal. Mach. Intell. 2020, 42, 318–327. [Google Scholar] [CrossRef] [PubMed] [Green Version]
- Girshick, R.; Donahue, J.; Darrell, T.; Malik, J. Rich Feature Hierarchies for Accurate Object Detection and Semantic Segmentation. In Proceedings of the IEEE Computer Society Conference on Computer Vision and Pattern Recognition, Portland, OR, USA, 23–28 June 2013. [Google Scholar]
- Girshick, R. Fast R-CNN. In Proceedings of the 2015 IEEE International Conference on Computer Vision (ICCV), Santiago, Chile, 7–13 December 2015; pp. 1440–1448. [Google Scholar]
- Ren, S.; He, K.; Girshick, R.; Sun, J. Faster R-CNN: Towards Real-Time Object Detection with Region Proposal Networks. IEEE Trans. Pattern Anal. Mach. Intell. 2017, 39, 1137–1149. [Google Scholar] [CrossRef] [PubMed] [Green Version]
- Elkhrachy, I. Accuracy Assessment of Low-Cost Unmanned Aerial Vehicle (UAV) Photogrammetry. Alex. Eng. J. 2021, 60, 5579–5590. [Google Scholar] [CrossRef]
- Dijkstra, K.; van de Loosdrecht, J.; Schomaker, L.R.B.; Wiering, M.A. Hyperspectral demosaicking and crosstalk correction using deep learning. Mach. Vis. Appl. 2019, 30, 1–21. [Google Scholar] [CrossRef] [Green Version]
- Gupta, A.; Watson, S.; Yin, H. Deep learning-based aerial image segmentation with open data for disaster impact assessmen. Neurocomputing 2021, 439, 22–33. [Google Scholar] [CrossRef]
- Shen, J.; Liu, N.; Sun, H. Vehicle detection in aerial images based on lightweight deep convolutional network. IET Image Processing 2021, 15, 479–491. [Google Scholar] [CrossRef]
- Stuparu, D.-G.; Ciobanu, R.-I.; Dobre, C. Vehicle Detection in Overhead Satellite Images Using a One-Stage Object Detection Model. Sensors 2020, 20, 6485. [Google Scholar] [CrossRef]
- Liu, K.; Mattyus, G. Fast Multiclass Vehicle Detection on Aerial Images. IEEE Geosci. Remote Sens. Lett. 2015, 12, 1938–1942. [Google Scholar]
- Zhong, J.; Lei, T.; Yao, G. Robust Vehicle Detection in Aerial Images Based on Cascaded Convolutional Neural Networks. Sensors 2017, 17, 2720. [Google Scholar] [CrossRef] [Green Version]
- Tang, T.; Zhou, S.; Deng, Z.; Zou, H.; Lei, L. Vehicle detection in aerial images based on region convolutional neural networks and hard negative example mining. Sensors 2020, 20, 336. [Google Scholar] [CrossRef] [PubMed] [Green Version]
- Deng, Z.; Sun, H.; Zhou, S.; Zhao, J.; Zou, H. Toward fast and accurate vehicle detection in aerial images using coupled region-based convolutional neural networks. IEEE J. Sel. Top. Appl. Earth Obs. Remote Sens. 2017, 10, 3652–3664. [Google Scholar] [CrossRef]
- Yu, Y.; Gu, T.; Guan, H.; Li, D.; Jin, S. Vehicle detection from high-resolution remote sensing imagery using convolutional capsule networks. IEEE Geosci. Remote Sens. 2019, 16, 1894–1898. [Google Scholar] [CrossRef]
- Chen, Z.; Wang, C.; Wen, C.; Teng, X.; Chen, Y.; Guan, H.; Luo, H.; Cao, L.; Li, J. Vehicle detection in high-resolution aerial images via sparse representation and superpixels. IEEE Trans. Geosci. Remote Sens. 2015, 54, 103–116. [Google Scholar] [CrossRef]
- Kembhavi, A.; Harwood, D.; Davis, L.S. Vehicle detection using partial least squares. IEEE Trans. Pattern Anal. Mach. Intell. 2010, 33, 1250–1265. [Google Scholar] [CrossRef]
- Cheng, G.; Wang, Y.; Xu, S.; Wang, H.; Xiang, S.; Pan, C. Automatic Road Detection and Centerline Extraction via Cascaded End-to-End Convolutional Neural Network. IEEE Trans. Geosci. Remote Sens. 2017, 55, 3322–3337. [Google Scholar] [CrossRef]
- Chang, Y.-C.; Huang, C.; Chuang, J.-H.; Liao, I.-C. Pedestrian Detection in Aerial Images Using Vanishing Point Transformation and Deep Learning. In Proceedings of the 2018 25th IEEE International Conference on Image Processing (ICIP), Athens, Greece, 7–10 October 2018; pp. 1917–1921. [Google Scholar]
- Soleimani, A.; Nasrabadi, N.M. Convolutional Neural Networks for Aerial Multi-Label Pedestrian Detection. In Proceedings of the 2018 21st International Conference on Information Fusion (FUSION), Cambridge, UK, 10–13 July 2018; pp. 1005–1010. [Google Scholar]
- Rodríguez, J.I. Cómo circular por una glorieta. Tráfico Segur. Vial 2014, 228, 28–30. [Google Scholar]
- Cuenca, L.G.; Sanchez-Soriano, J.; Puertas, E.; Andrés, J.F.; Aliane, N. Machine Learning Techniques for Undertaking Roundabouts in Autonomous Driving. Sensors 2019, 19, 2386. [Google Scholar] [CrossRef] [Green Version]
- Cuenca, L.G.; Puertas, E.; Andrés, J.F.; Aliane, N. Autonomous Driving in Roundabout Maneuvers Using Reinforcement Learning with Q-Learning. Electronics 2019, 8, 1536. [Google Scholar] [CrossRef] [Green Version]
- Breuer, A.; Termöhlen, J.-A.; Homoceanu, S.; Fingscheidt, T. OpenDD: A Large-Scale Roundabout Drone Dataset. In Proceedings of the 2020 IEEE 23rd International Conference on Intelligent Transportation Systems (ITSC), Rhodes, Greece, 20–23 September 2020; pp. 1–6. [Google Scholar]
- Bock, J.; Krajewski, R.; Moers, T.; Runde, S.; Vater, L.; Eckstein, L. The inD Dataset: A Drone Dataset of Naturalistic Road User Trajectories at German Intersections. In Proceedings of the 2020 IEEE Intelligent Vehicles Symposium (IV), Las Vegas, NV, USA, 19 October–13 November 2020; pp. 1929–1934. [Google Scholar]
- Krajewski, R.; Bock, J.; Kloeker, L.; Eckstein, L. The highD Dataset: A Drone Dataset of Naturalistic Vehicle Trajectories on German Highways for Validation of Highly Automated Driving Systems. In Proceedings of the 2018 21st International Conference on Intelligent Transportation Systems (ITSC), Maui, HI, USA, 4–7 November 2018; pp. 2118–2125. [Google Scholar]
- Krajewski, R.; Moers, T.; Bock, J.; Vater, L.; Eckstein, L. The rounD Dataset: A Drone Dataset of Road User Trajectories at Roundabouts in Germany. In Proceedings of the 2020 IEEE 23rd International Conference on Intelligent Transportation Systems (ITSC), Rhodes, Greece, 20–23 September 2020; pp. 1–6. [Google Scholar]
- DJI. DJI Mini 2. Available online: https://www.dji.com/ca/mini-2/specs (accessed on 8 February 2022).
- Ministerio De La Presidencia, Para Las Administraciones Territoriales. Boletín Oficial Del Estado. 29 December 2017. Available online: https://www.boe.es/boe/dias/2017/12/29/pdfs/BOE-A-2017–15721.pdf (accessed on 14 March 2022).
- Tzutalin. LabelImg. GitHub. Available online: https://github.com/tzutalin/labelImg (accessed on 11 January 2021).
- OpenCV. OpenCV. Available online: https://docs.opencv.org/4.x/index.html (accessed on 11 January 2022).
- Zoph, B.; Cubuk, E.; Ghiasi, G.; Lin, T.; Shlens, J.; Le, Q. Learning Data Augmentation Strategies for Object Detection. In Proceedings of the Computer Vision–ECCV 2020, Glasgow, UK, 23–28 August 2020; pp. 566–583. [Google Scholar]
- Fizyr. Keras RetinaNet. Available online: https://github.com/fizyr/keras-retinanet (accessed on 23 January 2022).
- Hui, J. Object Detection: Speed and Accuracy Comparison (Faster R-CNN, R-FCN, SSD, FPN, RetinaNet and YOLOv3. Available online: https://jonathan-hui.medium.com/object-detection-speed-and-accuracy-comparison-faster-r-cnn-r-fcn-ssd-and-yolo-5425656ae359 (accessed on 11 January 2022).
- De-Las-Heras, G.; Sánchez-Soriano, J.; Puertas, E. Advanced Driver Assistance Systems (ADAS) Based on Machine Learning Techniques for the Detection and Transcription of Variable Message Signs on Roads. Sensors 2021, 21, 5866. [Google Scholar] [CrossRef] [PubMed]
- Shermeyer, J.; van Etten, A. The Effects of Super-Resolution on Object Detection Performance in Satellite Imagery. In Proceedings of the 2019 IEEE/CVF Conference on Computer Vision and Pattern Recognition Workshops (CVPRW), Long Beach, CA, USA, 16–17 June 2019; pp. 1432–1441. [Google Scholar]


| Roundabout (Videos Names) | Number of Images | Car | Truck | Cycle | Bus | Empty |
|---|---|---|---|---|---|---|
| 1 (00001) | 1996 | 34,558 | 0 | 4229 | 0 | 0 |
| 2 (00002) | 514 | 743 | 0 | 0 | 0 | 157 |
| 3 (00003–00017) | 1795 | 4822 | 58 | 0 | 0 | 0 |
| 4 (00018–00033) | 1027 | 6615 | 0 | 0 | 0 | 0 |
| 5 (00034–00049) | 1261 | 2248 | 0 | 550 | 0 | 81 |
| 6 (00050–00052) | 5501 | 180,342 | 1420 | 120 | 1376 | 0 |
| 7 (00053) | 2036 | 5789 | 562 | 0 | 226 | 92 |
| 8 (00054) | 1344 | 1733 | 222 | 0 | 150 | 222 |
| Total | 15,474 | 236,850 | 2262 | 4899 | 1752 | 552 |
| Data augmentation | ×4 | ×4 | ×4 | ×4 | ×4 | ×4 |
| Total after augmentation | 61,896 | 947,400 | 9048 | 19,596 | 7008 | 2208 |
| Component | Specification |
|---|---|
| Size | 1920 × 1080 px |
| GSD (100 m height) | 6.67 cm/px |
| GSD (110 m height) | 7.27 cm/px |
| GSD (120 m height) | 8.00 cm/px |
| FOV angle | 83° |
| Focal (35 mm) | 24 mm |
| Aperture | f/2.8 |
| Aspect Ratio | 19:9 |
| Sensor | 1/2.3″ CMOS |
| Component | Name |
|---|---|
| Processor | Intel i7 9800K 3.6 GHz |
| Motherboard | MPG Z390 Gaming Pro Carbon |
| RAM | 32 GBs |
| Graphics card | Nvidia RTX 2080 Ti |
| Hard disk | 500 Tb SSD M2 |
| OS | Ubuntu 18.04.4 LTS |
| Metric | Value |
|---|---|
| Num. images | 2020 |
| Batch size | 2 |
| Steps | Auto |
| Backbone | Resnet 50 |
| Learning rate | 10−5 |
| Train/validation split | 80–20% |
| IoU | 0.5 |
| Freeze backbone | True |
| Total epochs | 6 |
| Final mAP | 0.9879 |
| Metric | Value |
|---|---|
| Num. images | 61,896 |
| Batch size | 2 |
| Steps | Auto |
| Backbone | Resnet 50 |
| Learning rate | 10−5 |
| Train/validation/test split | 70%/20%/10% |
| IoU | 0.5 |
| Freeze backbone | True |
| Total epochs | 4 |
| Final mAP | 0.9622 |
| Class | Minimum Score = 0.05 | Minimum Score = 0.5 | ||
|---|---|---|---|---|
| AP@.50 | AP@.75 | AP@.50 | AP@.75 | |
| Car | 0.9992 | 0.9920 | 0.9987 | 0.9916 |
| Cycle | 0.8791 | 0.7816 | 0.8485 | 0.7721 |
| Truck | 0.9991 | 0.9856 | 0.9960 | 0.9836 |
| Bus | 0.9955 | 0.9720 | 0.9866 | 0.9645 |
| Weighted AP | 0.9969 | 0.9879 | 0.9957 | 0.9872 |
| mAP | 0.9682 | 0.9328 | 0.9574 | 0.9280 |
Publisher’s Note: MDPI stays neutral with regard to jurisdictional claims in published maps and institutional affiliations. |
© 2022 by the authors. Licensee MDPI, Basel, Switzerland. This article is an open access article distributed under the terms and conditions of the Creative Commons Attribution (CC BY) license (https://creativecommons.org/licenses/by/4.0/).
Share and Cite
Puertas, E.; De-Las-Heras, G.; Fernández-Andrés, J.; Sánchez-Soriano, J. Dataset: Roundabout Aerial Images for Vehicle Detection. Data 2022, 7, 47. https://doi.org/10.3390/data7040047
Puertas E, De-Las-Heras G, Fernández-Andrés J, Sánchez-Soriano J. Dataset: Roundabout Aerial Images for Vehicle Detection. Data. 2022; 7(4):47. https://doi.org/10.3390/data7040047
Chicago/Turabian StylePuertas, Enrique, Gonzalo De-Las-Heras, Javier Fernández-Andrés, and Javier Sánchez-Soriano. 2022. "Dataset: Roundabout Aerial Images for Vehicle Detection" Data 7, no. 4: 47. https://doi.org/10.3390/data7040047
APA StylePuertas, E., De-Las-Heras, G., Fernández-Andrés, J., & Sánchez-Soriano, J. (2022). Dataset: Roundabout Aerial Images for Vehicle Detection. Data, 7(4), 47. https://doi.org/10.3390/data7040047