
A High-Accuracy GNSS Dataset of Ground Truth Points Collected within Îles-de-Boucherville National Park, Quebec, Canada


Abstract
1. Summary
2. Data Description
3. Methods
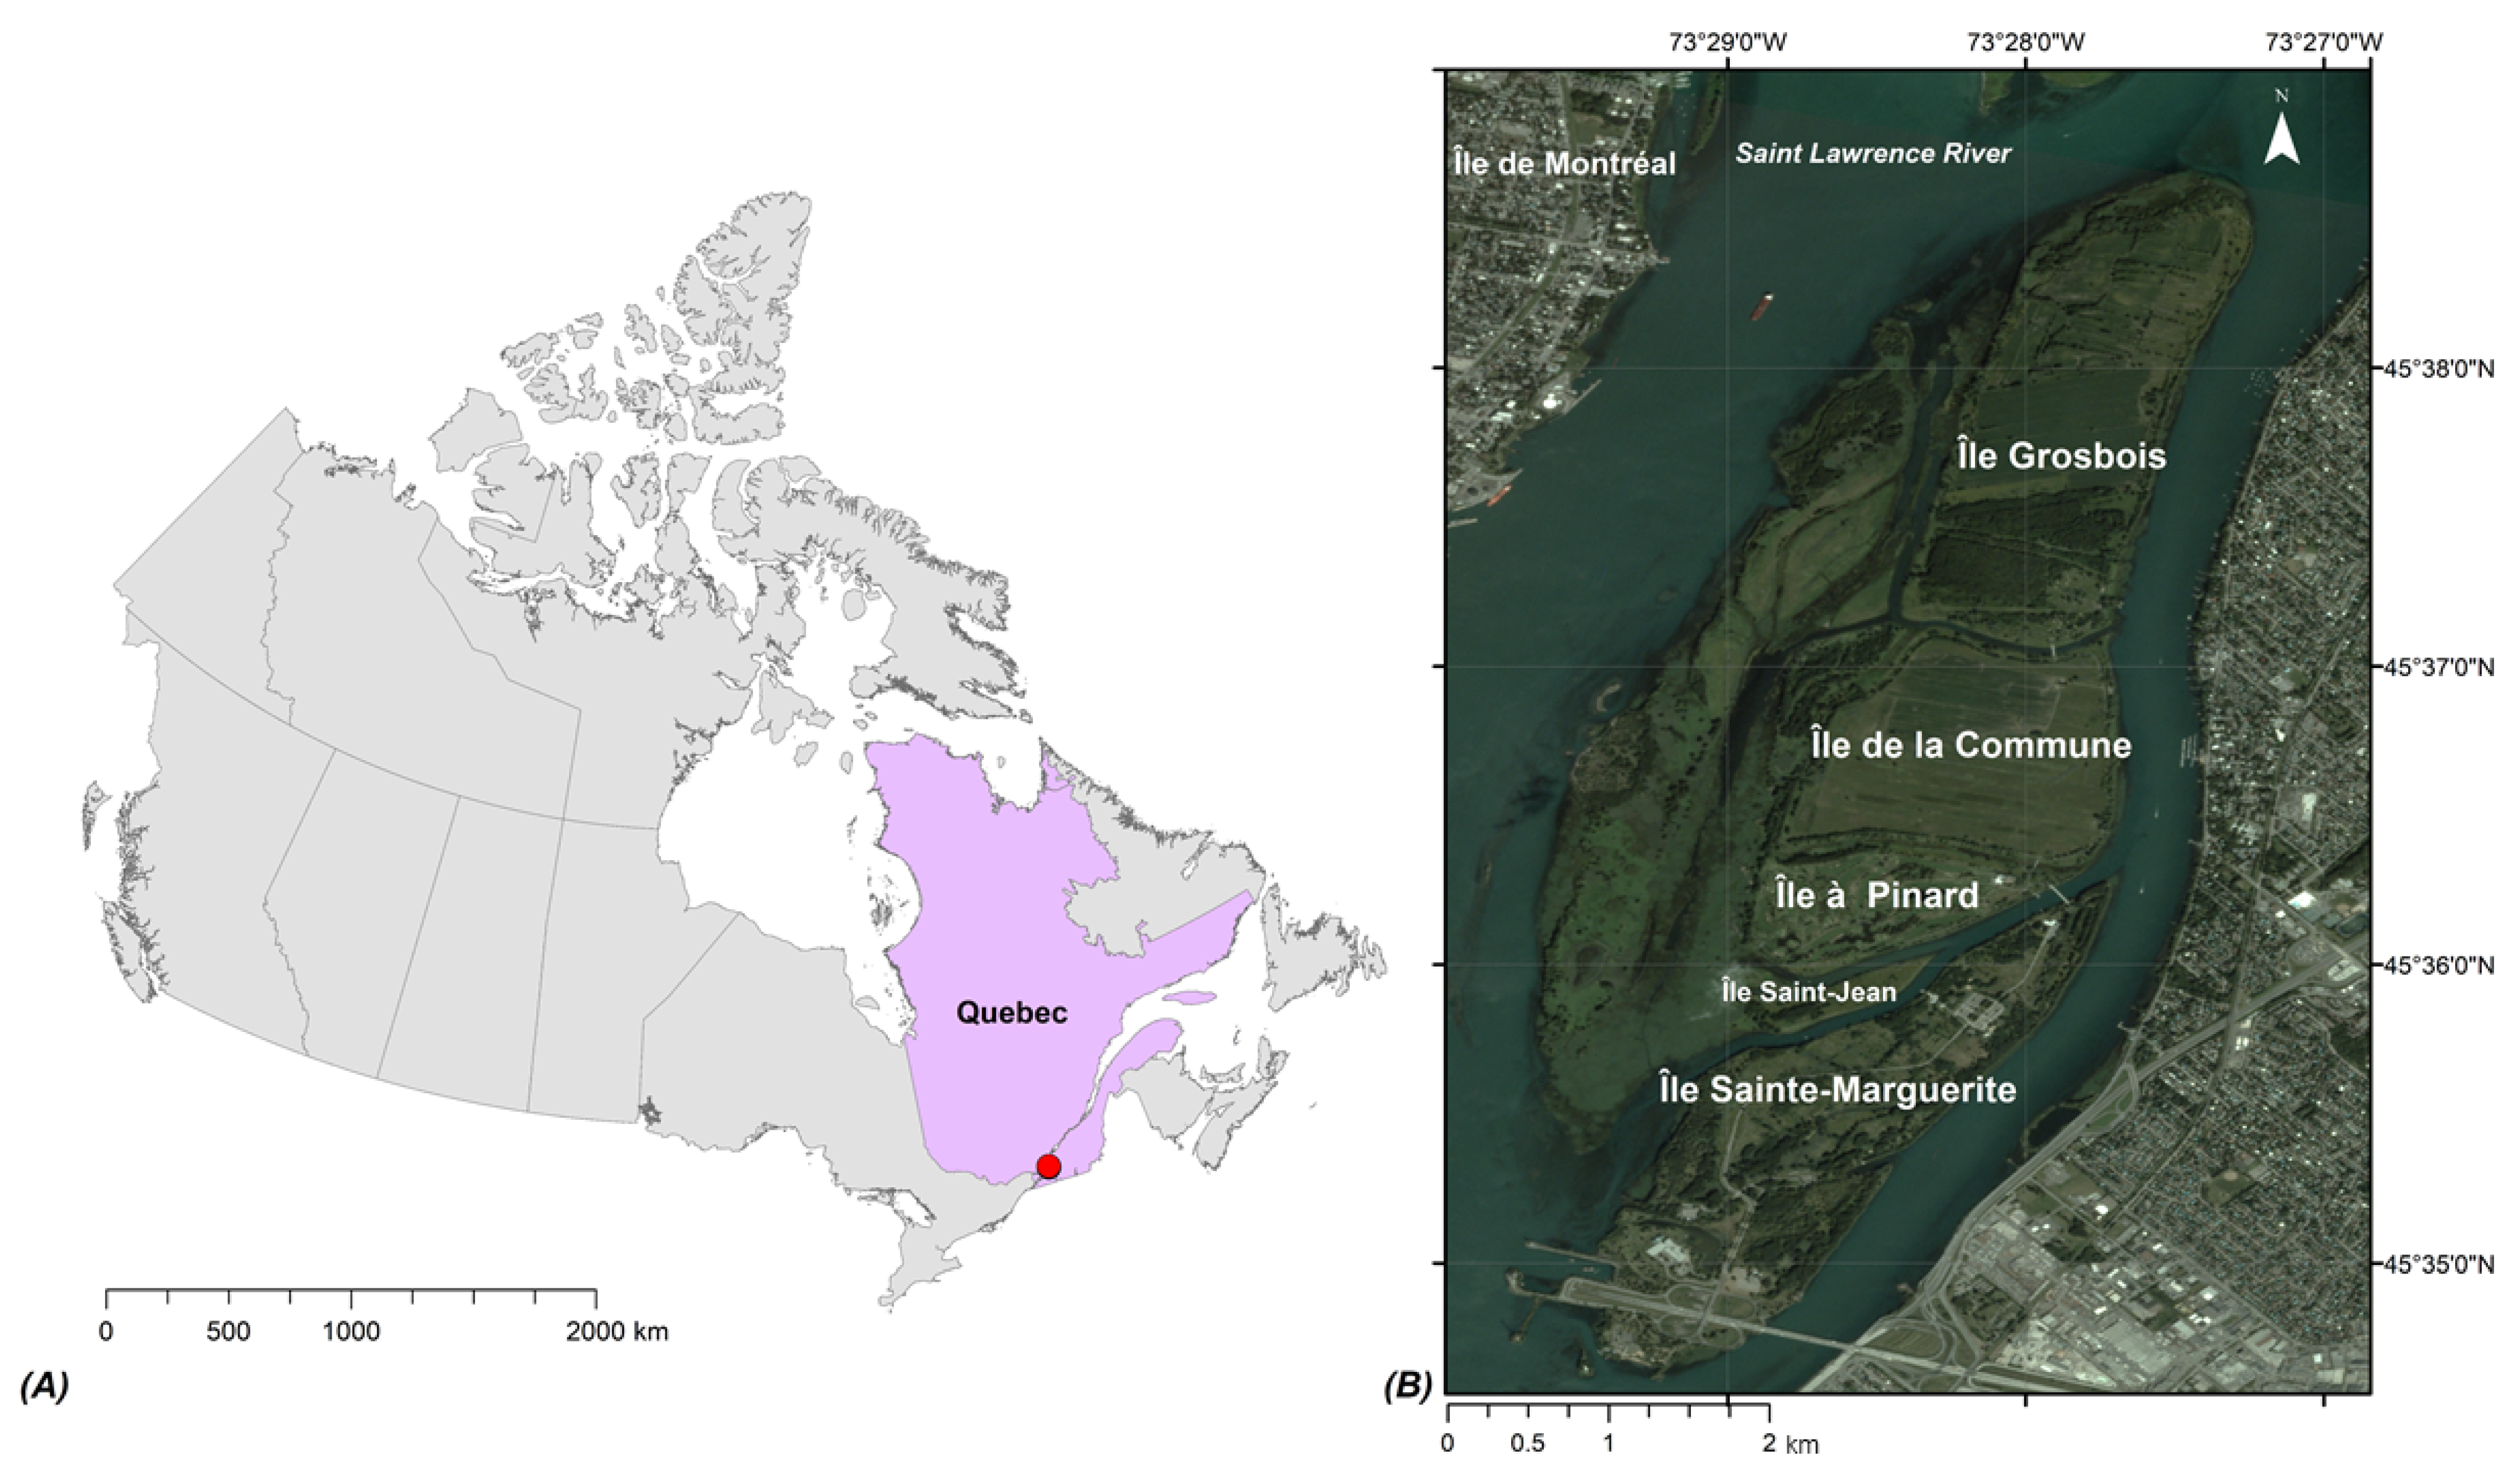
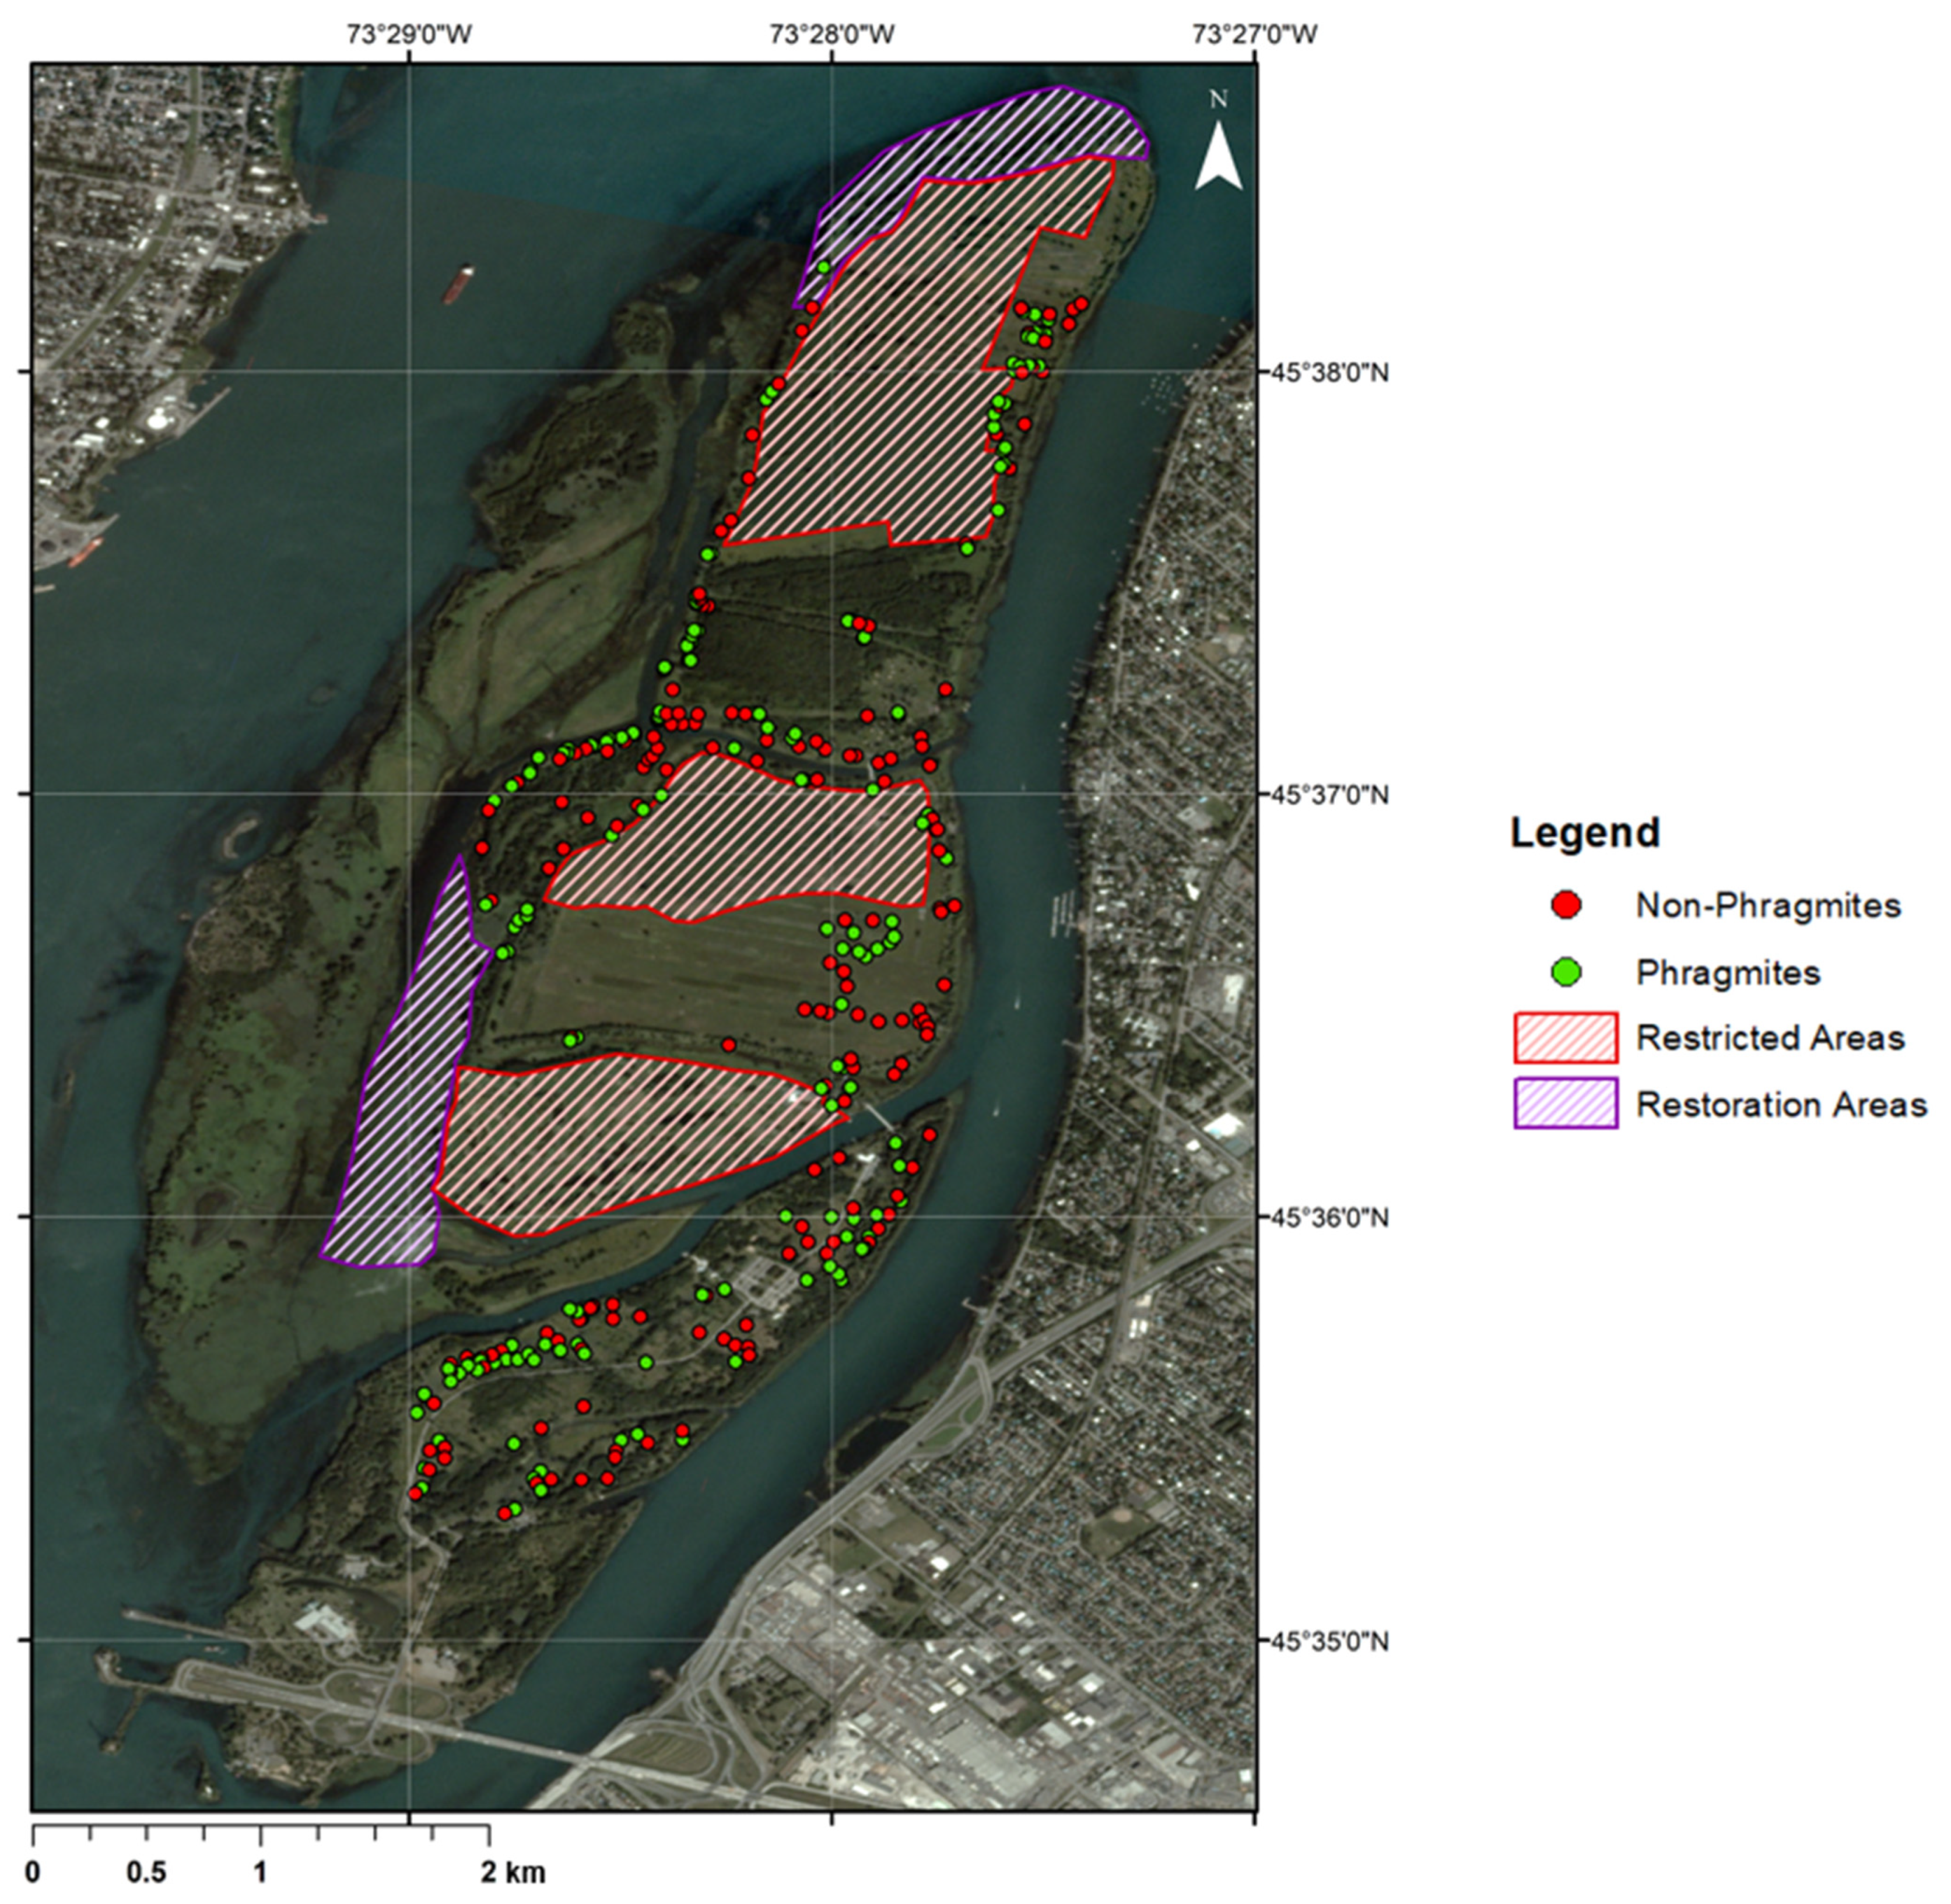
3.1. Study Area
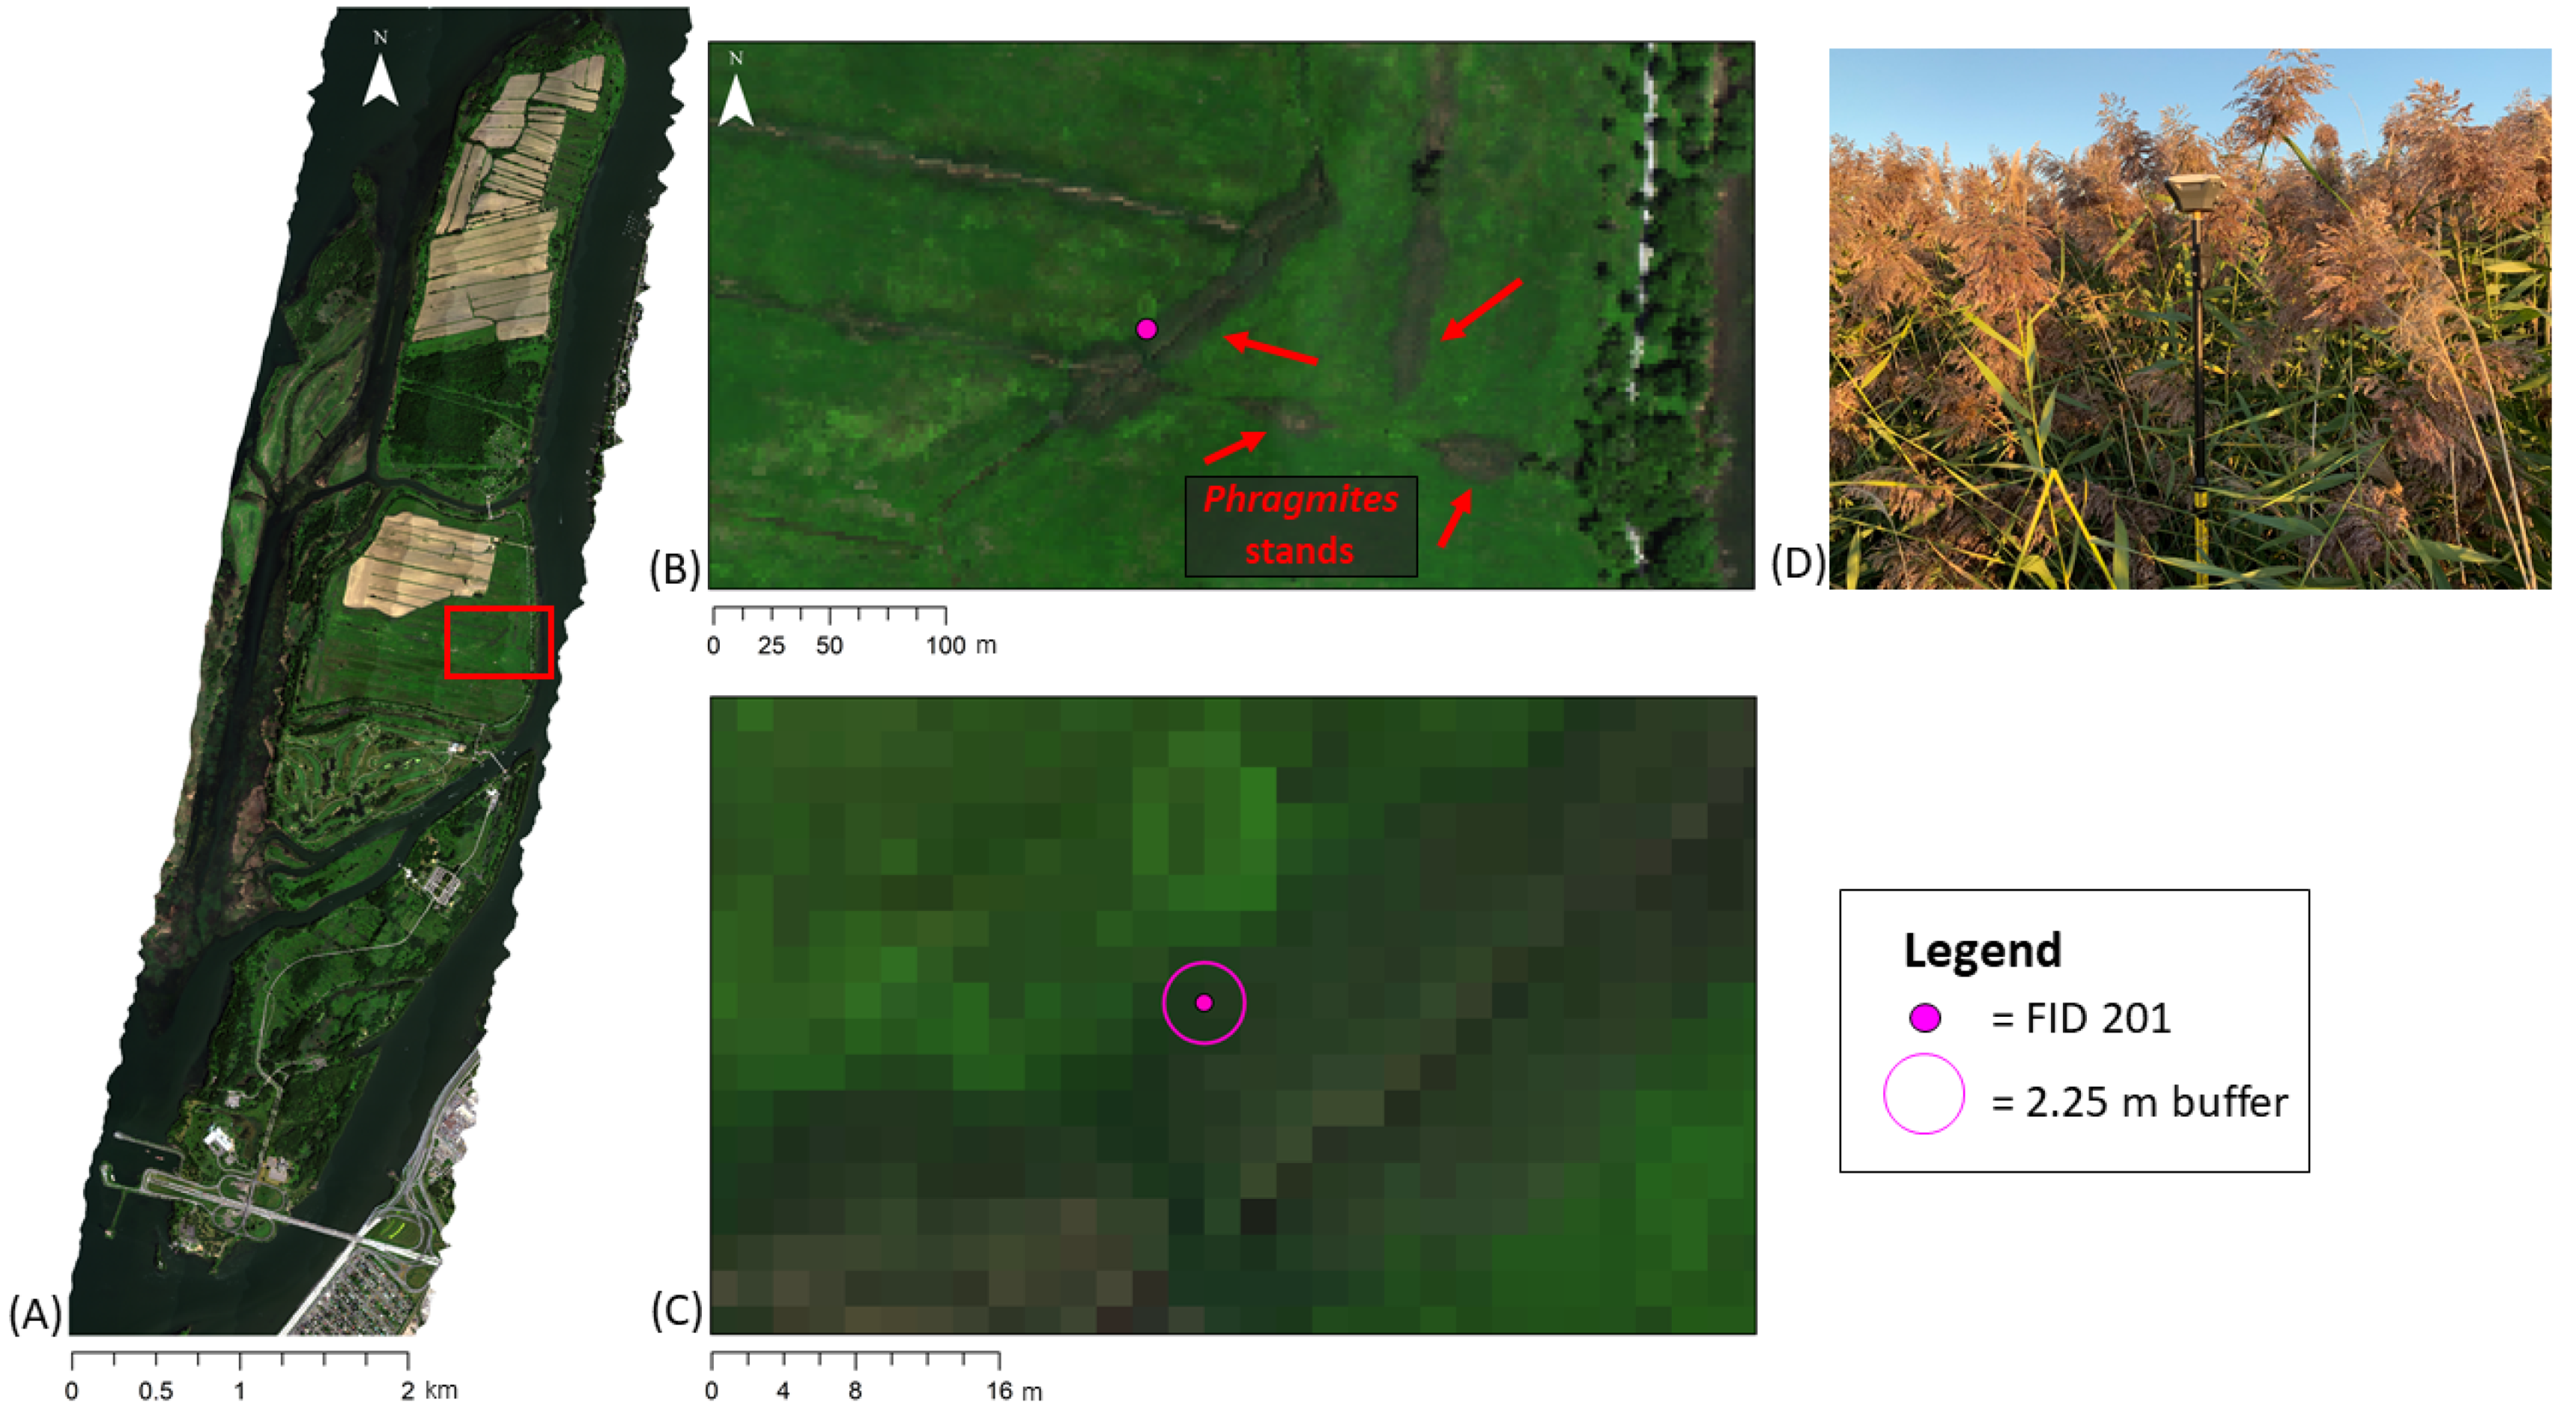
3.2. Ground Truth Data Collection
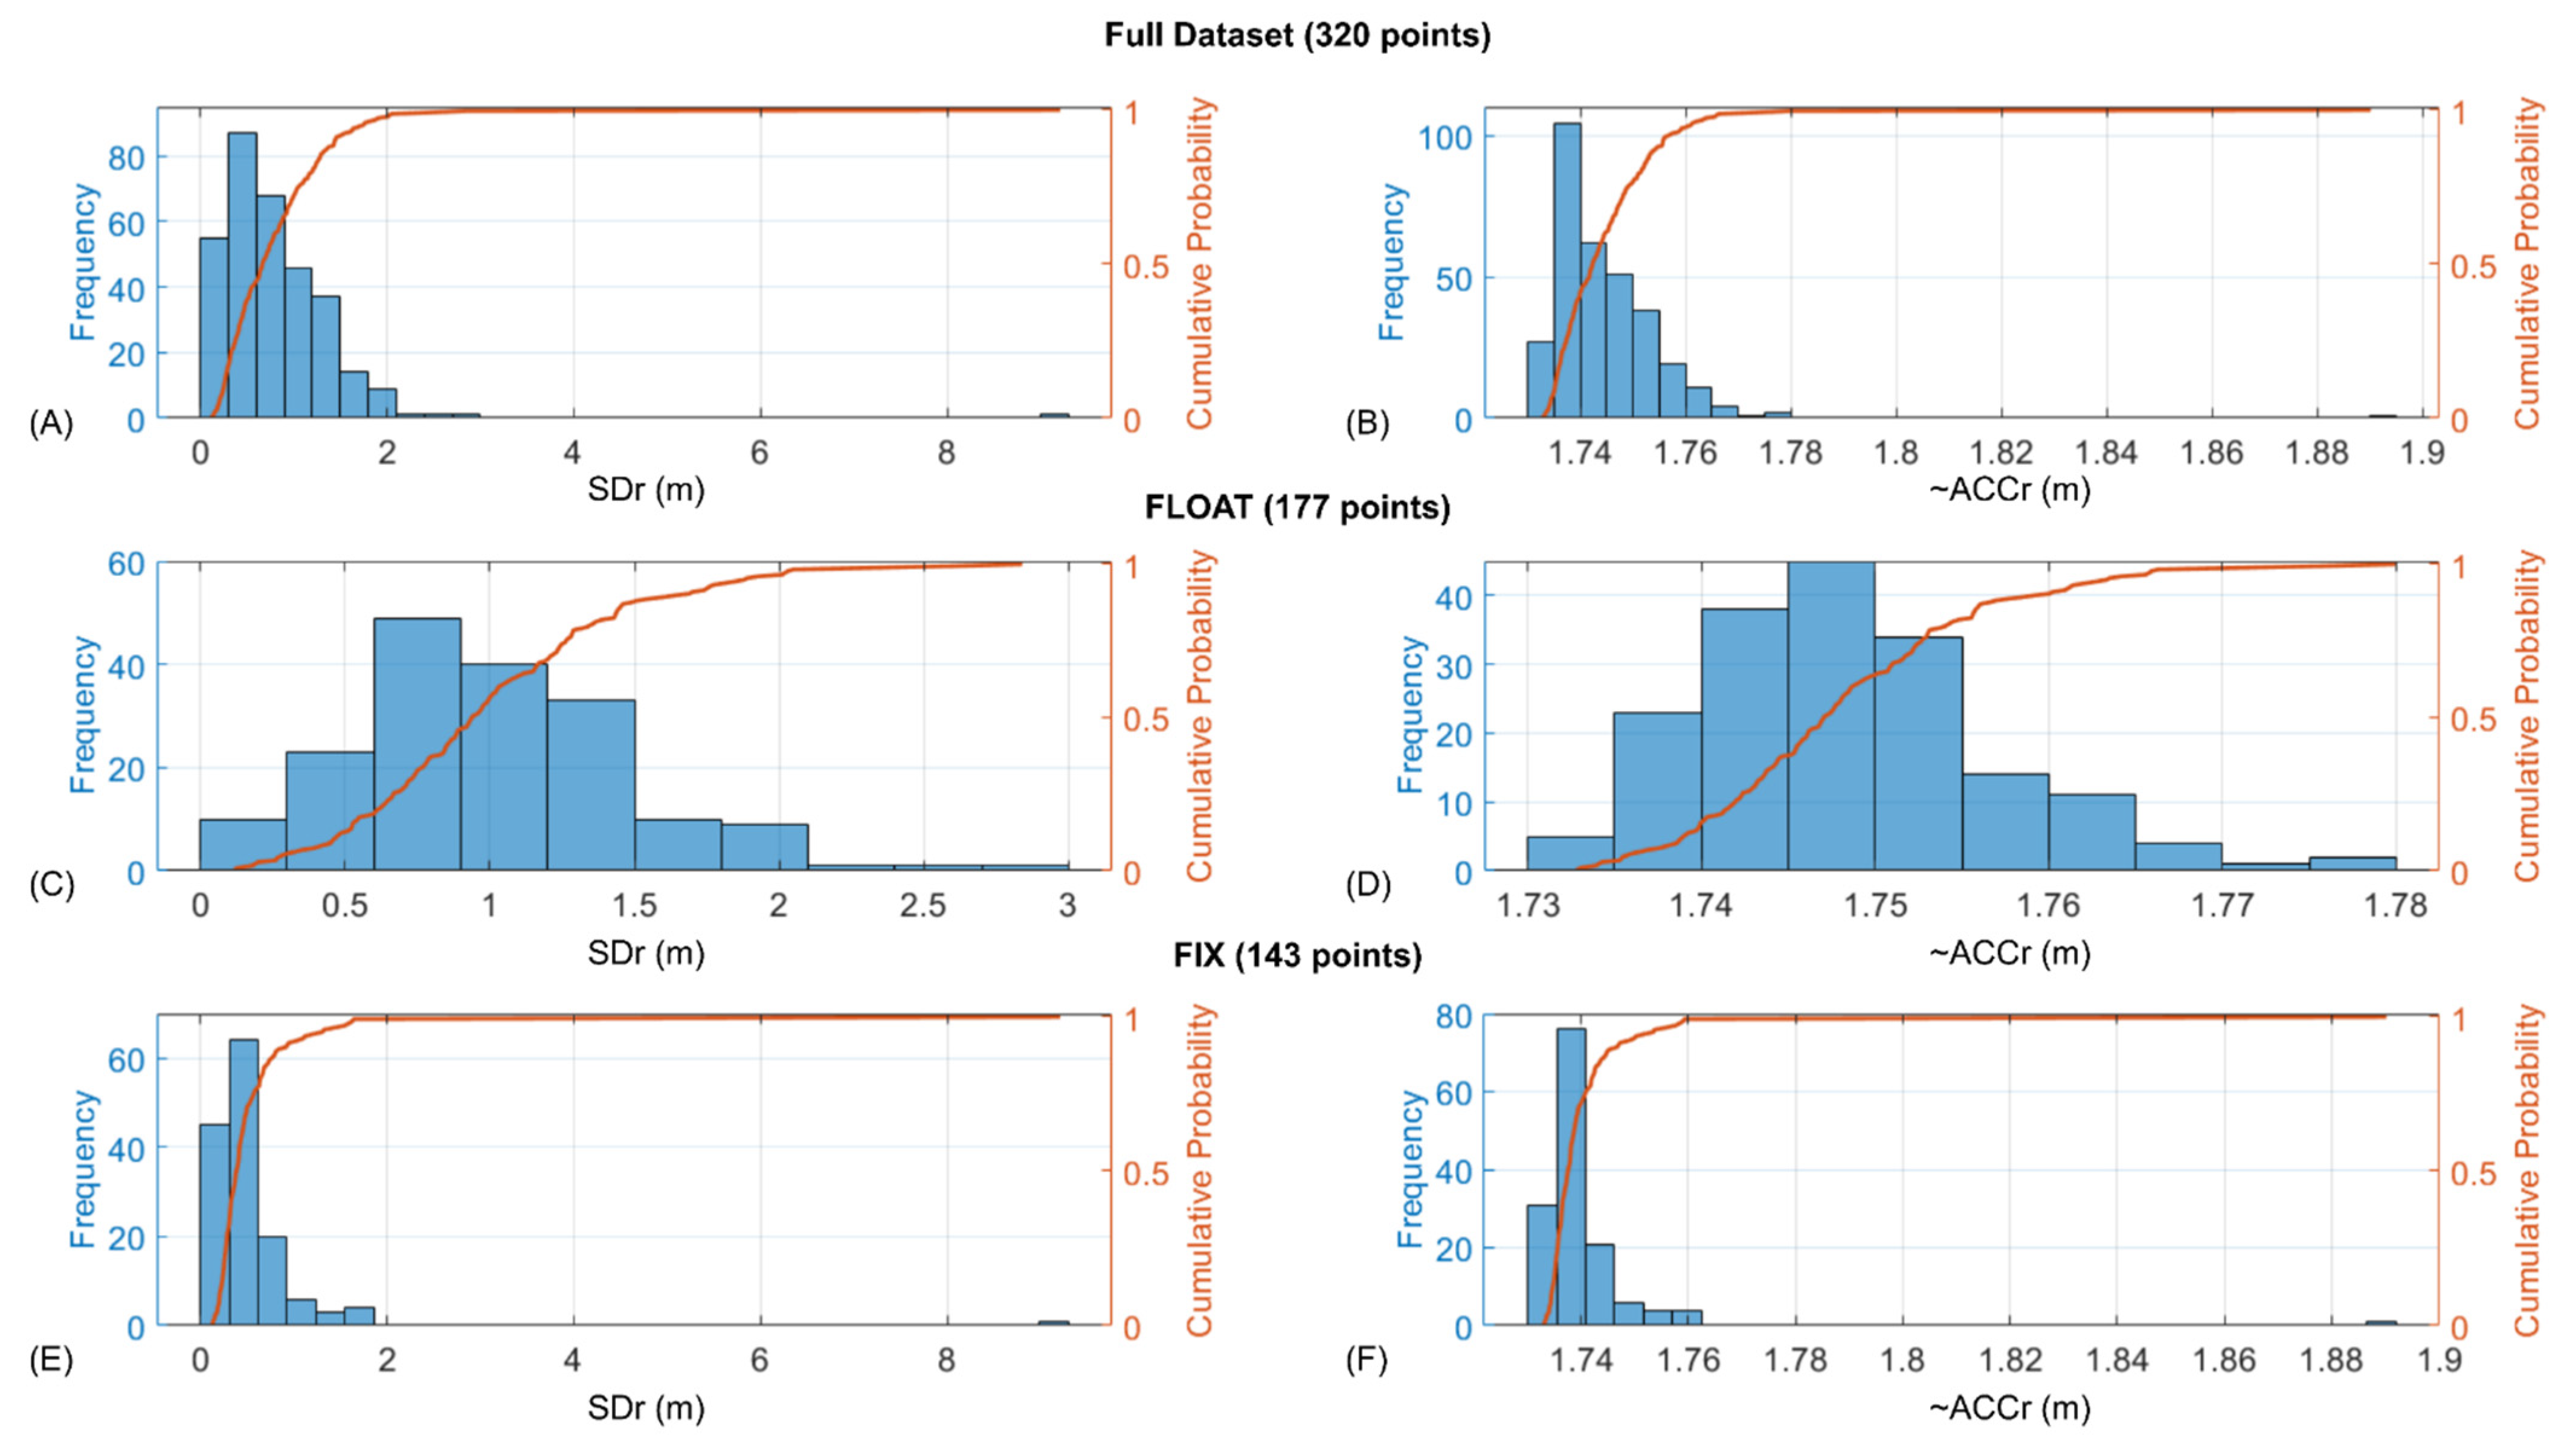
3.3. Approximate Positional Accuracy
4. Conclusions
5. User Notes
Author Contributions
Funding
Data Availability Statement
Acknowledgments
Conflicts of Interest
References
- Chambers, R.M.; Meyerson, L.A.; Saltonstall, K. Expansion of Phragmites australis into tidal wetlands of North America. Aquat. Bot. 1999, 64, 261–273. [Google Scholar] [CrossRef]
- NOAA Great Lakes Environmental Research Laboratory. Great Lakes Aquatic Nonindigenous Species Information System: Phragmites australis australis (Cav.) Trin. ex Steud. Available online: https://nas.er.usgs.gov/queries/greatlakes/FactSheet.aspx?SpeciesID=2937 (accessed on 8 December 2018).
- Saltonstall, K. Cryptic invasion by a non-native genotype of the common reed, Phragmites australis, into North America. Proc. Natl. Acad. Sci. USA 2002, 99, 2445–2449. [Google Scholar] [CrossRef] [PubMed]
- Belzile, F.; Labbé, J.; LeBlanc, M.-C.; Lavoie, C. Seeds contribute strongly to the spread of the invasive genotype of the common reed (Phragmites australis). Biol. Invasions 2010, 12, 2243–2250. [Google Scholar] [CrossRef]
- Saltonstall, K. Alien Plant Invaders of Natural Areas. Available online: http://www.nps.gov/plants/alien (accessed on 1 April 2019).
- Avers, B.; Fahlsing, R.; Kafcas, E.; Schafer, J.; Collin, T.; Esman, L.; Finnell, E.; Lounds, A.; Terry, R.; Hazelman, J. A Guide to the Control and Management of Invasive Phragmites; Michigan Department of Environmental Quality: Lansing, MI, USA, 2007. [Google Scholar]
- Inamdar, D.; Kalacska, M.; Leblanc, G.; Arroyo-Mora, J.P. Characterizing and Mitigating Sensor Generated Spatial Correlations in Airborne Hyperspectral Imaging Data. Remote Sens. 2020, 12, 641. [Google Scholar] [CrossRef]
- Natural Resources Canada’s Canadian Geodetic Survey (CGS). Geodtic Tools and Applications: GPS-H. Available online: https://www.nrcan.gc.ca/maps-tools-publications/maps/tools-applications/10925#gpsh (accessed on 13 February 2021).
- Laliberté, E.; Cogliastro, A.; Bouchard, A. Projet pilote de restauration de paysages forestiers au parc national des îles-de-Boucherville. Rapport Final Présenté à la Direction du Parc National des îles-de-Boucherville, Société des Établissements de Plein Air du Québec (SÉPAQ); Institut de recherche en biologie végétale: Montréal, QC, Canada, 2006. [Google Scholar]
- Giroux, L. Synthèse et cartographie du potentiel biophysique et humain du Parc des îlesde-Boucherville; Maîtrise en Sciences de l’environnemen: Montréal, QC, Canada, 1986. [Google Scholar]
- SOCIETE des Etablissements de Plein air du Québec. Parc National Des Îles-De-Boucherville: Portait of the park. Available online: https://www.sepaq.com/pq/bou/decouvrir/portrait.dot?language_id=1 (accessed on 17 October 2019).
- Ross, M. Étude sur L’évolution de Boisé Grosbois au Parc des Iles-De-Boucherville; Parcs de la Montérégie: Montérégie, Canada, 1990. [Google Scholar]
- Kalacska, M. Emlid GPS NTRIP Protocol; Protocols.io: Berkeley, CA, USA, 2018. [Google Scholar] [CrossRef]
- Weber, G.; Dettmering, D.; Gebhard, H.; Kalafus, R. Networked transport of RTCM via internet protocol (Ntrip)… IP-Streaming for Real-Time GNSS Applications. In Proceedings of Proceedings of the 18th International Technical Meeting of the Satellite Division of the Institute of Navigation (ION GNSS 2005), Long Beach, CA, USA, 13–16 September 2005; pp. 2243–2247. [Google Scholar]
- Leica Geosystems. White Paper: Take it to the MAX! An Introduction to the Philosophy and Technology behind Leica Geosystems’ SpiderNET Revolutionary Network RTK Software and Algorithms; Leica Geosystems AG, Nune: Heerbrugg, Switzerland, 2005. [Google Scholar]
- EMLID. Reach RS/RS+ docs: Placing the Base. Available online: https://docs.emlid.com/reachrs/common/tutorials/placing-the-base/ (accessed on 13 February 2021).
- Fedorov, E.; RMS? [Discussion Post]. EMLID Community Forum, April 14 2018. Available online: https://community.emlid.com/t/rms/6340/5 (accessed on 25 February 2021).
- American Society for Photogrammetry and Remote Sensing (ASPRS). ASPRS Positional Accuracy Standards for Digital GEospactial Data (2014); ASPRS: Bethesda, MD, USA, 2015; pp. A1–A26. [Google Scholar]
- Natural Resources Canada. Station Report: 95K0003. Available online: https://webapp.geod.nrcan.gc.ca/geod/data-donnees/station/report-rapport.php?id=95K0003 (accessed on 13 February 2021).
- Kalacska, M.; Lucanus, O.; Arroyo-Mora, J.P.; Laliberté, É.; Elmer, K.; Leblanc, G.; Groves, A. Accuracy of 3d landscape reconstruction without ground control points using different uas platforms. Drones 2020, 4, 13. [Google Scholar] [CrossRef]


| Easting | Northing | |
|---|---|---|
| Mean error (m) | 0.91 | 0.67 |
| Standard deviation (m) | ±0.98 | ±0.56 |
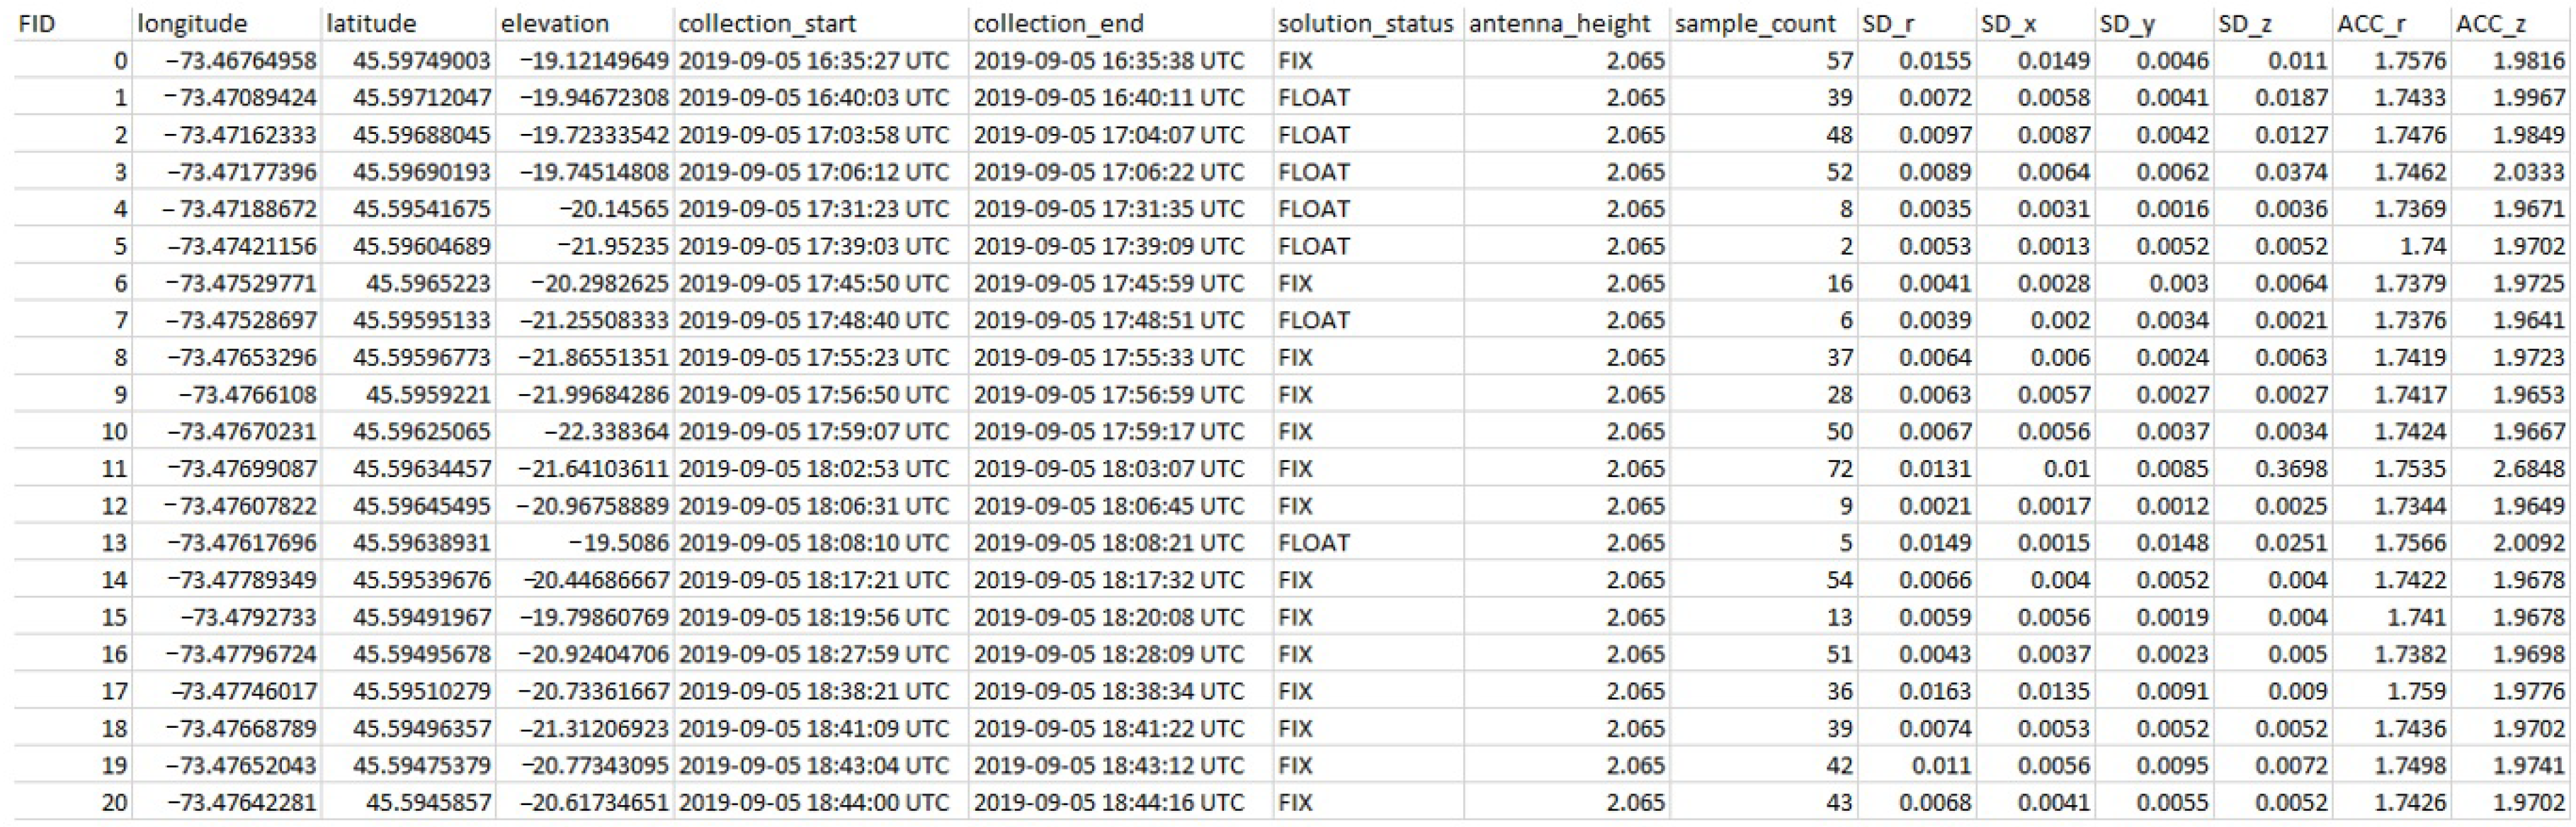
| Field Name | Description |
|---|---|
| FID | The point’s numerical identifier (ObjectID of the ESRI shapefile) |
| longitude | The measured longitude of the point |
| latitude | The measured latitude of the point |
| elevation | The measured elevation of the point (ellipsoidal height) |
| collection_start | The date and time that collection of the point began |
| collection_end | The date and time that collection of the point ended |
| solution_status | The solution status at the time the point was collected |
| antenna_height | The height of the antenna above the ground (m) |
| sample_count | The number of measurements that were used in the calculation of the position |
| SD_r * | The radial standard deviation (m) |
| SD_x * | The standard deviation in the x dimension (m) |
| SD_y * | The standard deviation in the y dimension (m) |
| SD_z * | The standard deviation in the z dimension (m) |
| ACC_r | The approximate horizontal accuracy at the 95% confidence level (m) |
| ACC_z | The approximate vertical accuracy at the 95% confidence level (m) |
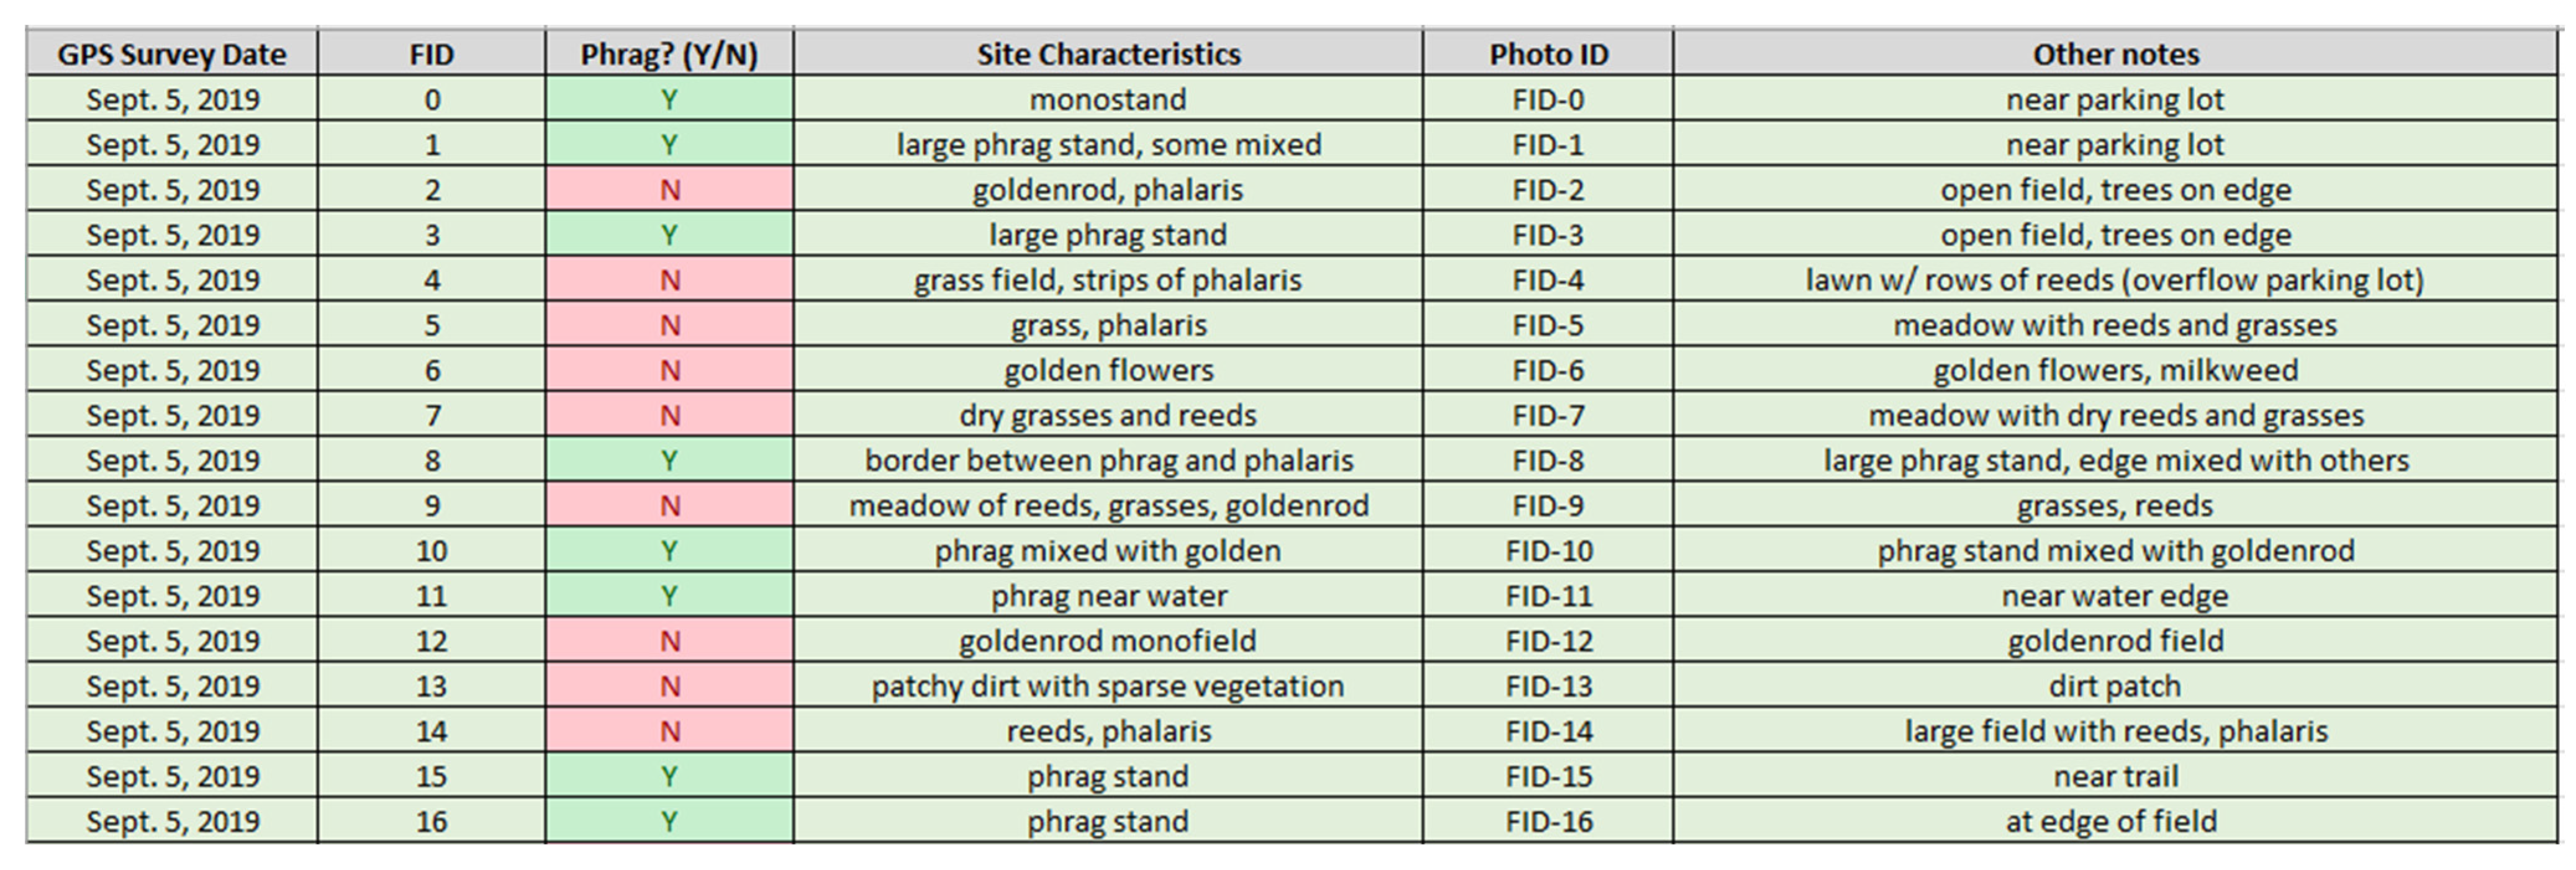
| Field Name | Description |
|---|---|
| GPS Survey Date | The date that the points were collected |
| FID | The point’s numerical identifier (ObjectID of the ESRI shapefile) |
| Phrag? (Y/N) | “Y” for “yes” or “N” for “no”, representing whether Phragmites was present at the specified point |
| Site Characteristics | A brief description of the immediate area surrounding the measured point |
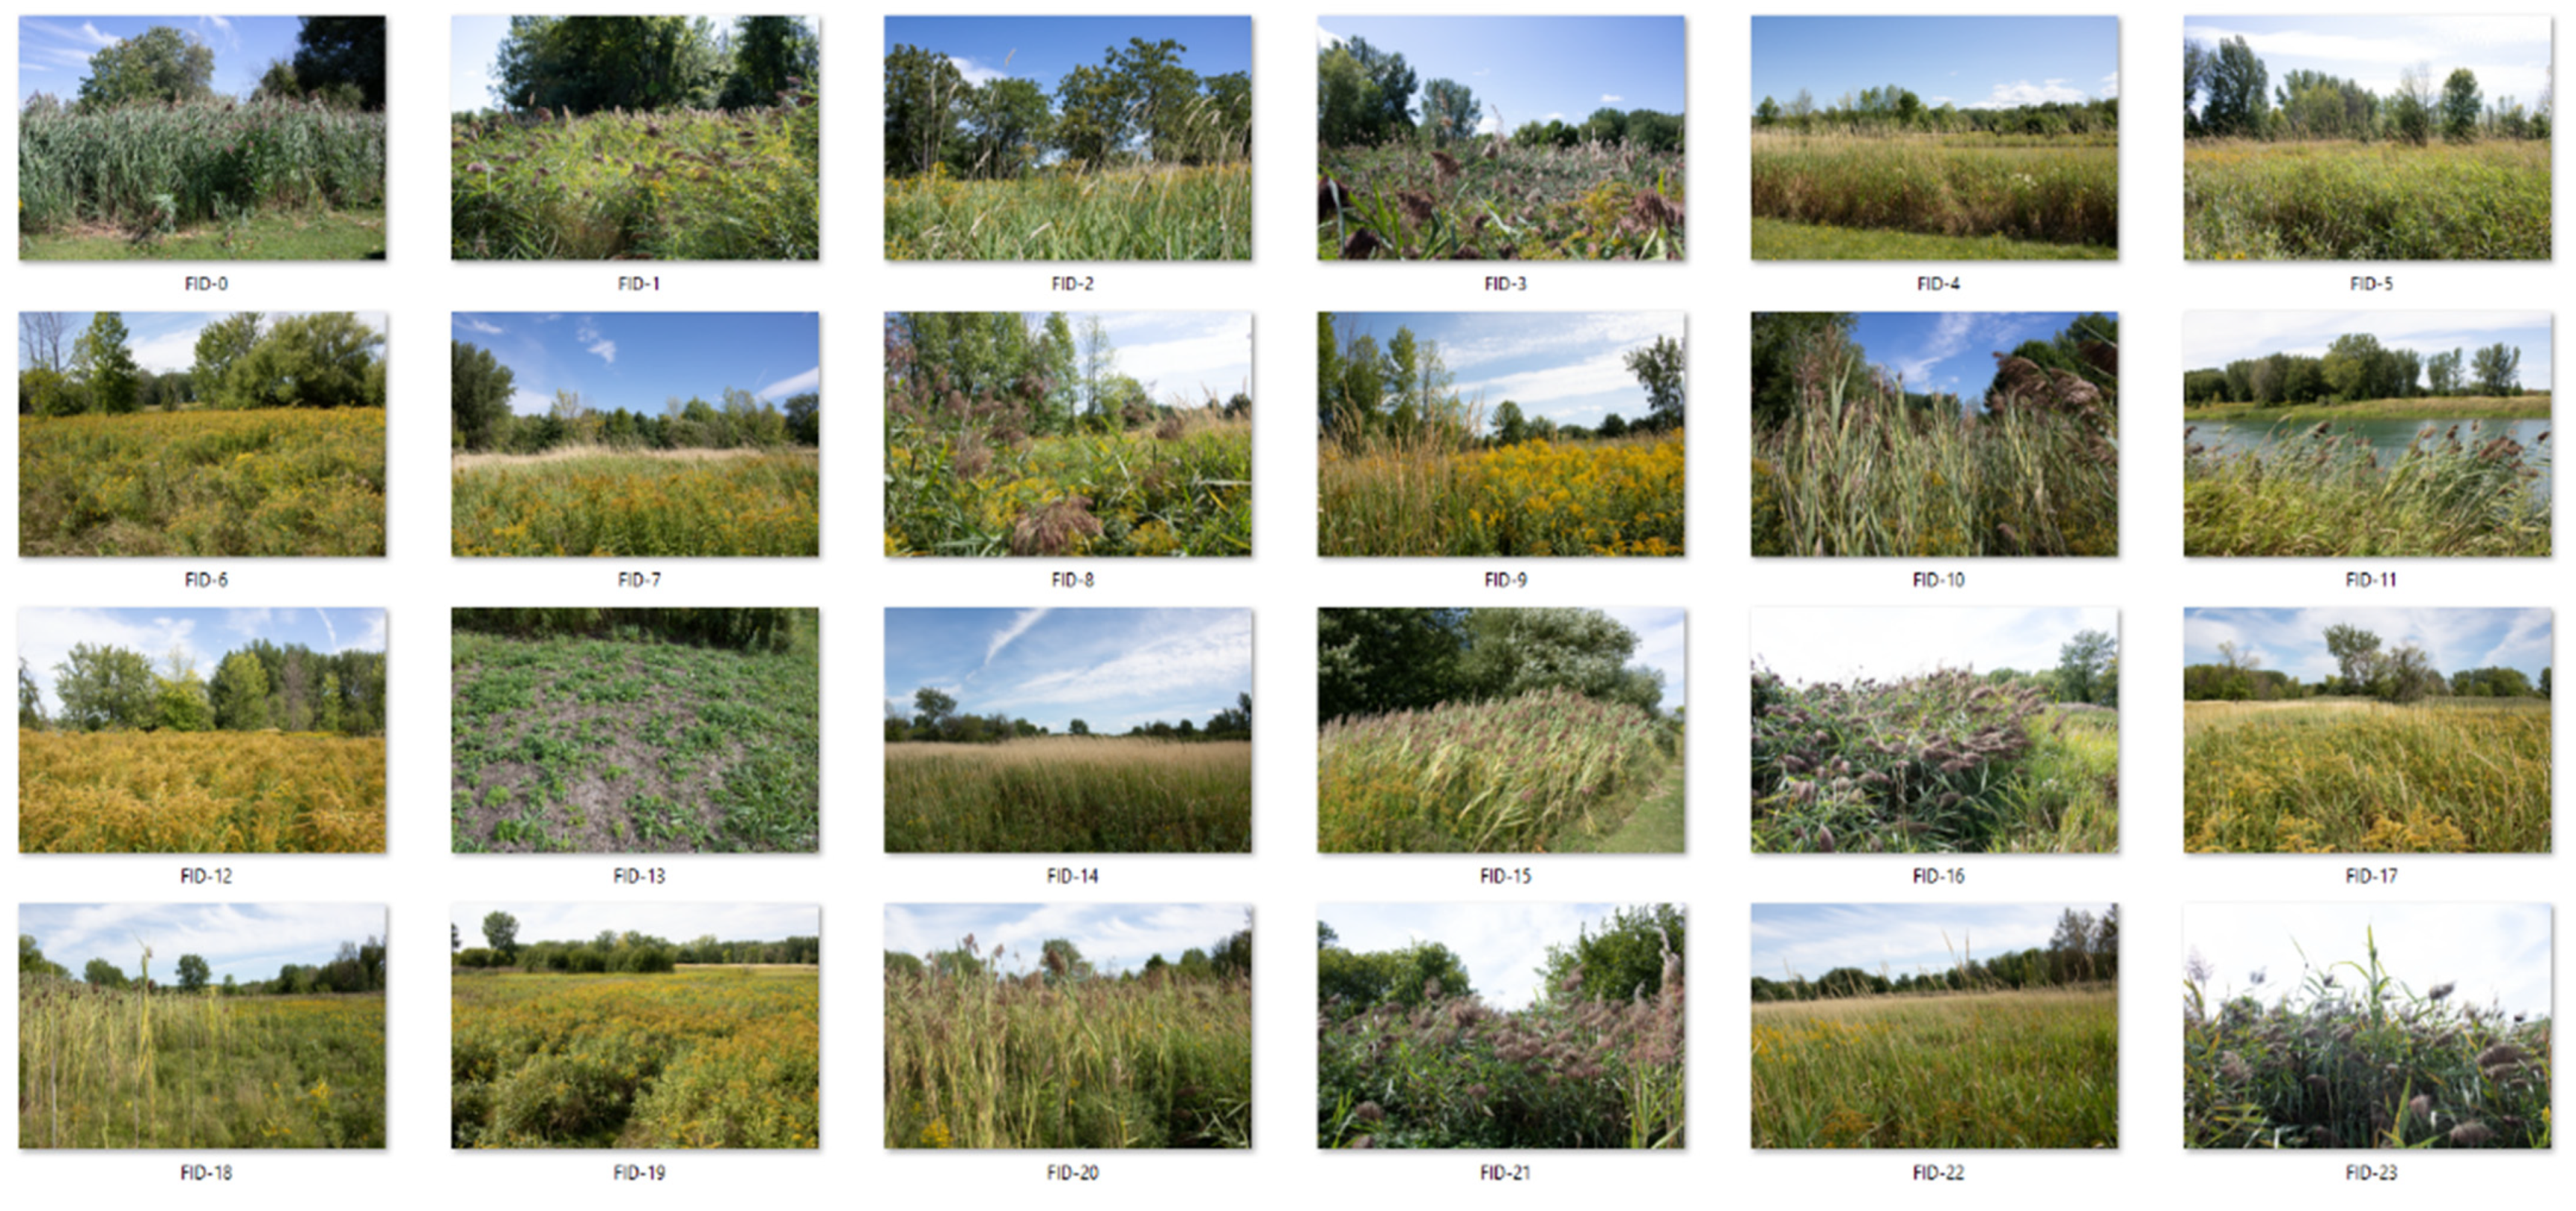
| Photo ID | The identifier for the corresponding field photograph |
| Other notes | Any other notes/comments regarding the measured point, surrounding area, or other characteristics |
| Metric | Average | Standard Deviation | Minimum | Maximum |
|---|---|---|---|---|
| 0.80 | 0.68 | 0.12 | 9.21 | |
| 0.53 | 0.59 | 0.01 | 8.44 | |
| 0.53 | 0.43 | 0.04 | 3.69 | |
| 174.46 | 1.17 | 173.28 | 189.02 | |
| 198.09 | 4.47 | 196.13 | 268.48 |
| Metric | Average | Standard Deviation | Minimum | Maximum |
|---|---|---|---|---|
| 0.54 | 0.79 | 0.13 | 9.21 | |
| 0.37 | 0.72 | 0.06 | 8.44 | |
| 0.36 | 0.36 | 0.04 | 3.69 | |
| 174.02 | 1.37 | 173.31 | 189.02 | |
| 197.43 | 6.24 | 196.27 | 268.48 |
| Metric | Average | Standard Deviation | Minimum | Maximum |
|---|---|---|---|---|
| 1.01 | 0.48 | 0.12 | 2.84 | |
| 0.66 | 0.40 | 0.01 | 1.85 | |
| 0.67 | 0.44 | 0.09 | 2.74 | |
| 174.82 | 0.82 | 173.28 | 177.99 | |
| 198.63 | 2.02 | 196.13 | 206.76 |
Publisher’s Note: MDPI stays neutral with regard to jurisdictional claims in published maps and institutional affiliations. |
© 2021 by the authors. Licensee MDPI, Basel, Switzerland. This article is an open access article distributed under the terms and conditions of the Creative Commons Attribution (CC BY) license (http://creativecommons.org/licenses/by/4.0/).
Share and Cite
Elmer, K.; Kalacska, M. A High-Accuracy GNSS Dataset of Ground Truth Points Collected within Îles-de-Boucherville National Park, Quebec, Canada. Data 2021, 6, 32. https://doi.org/10.3390/data6030032
Elmer K, Kalacska M. A High-Accuracy GNSS Dataset of Ground Truth Points Collected within Îles-de-Boucherville National Park, Quebec, Canada. Data. 2021; 6(3):32. https://doi.org/10.3390/data6030032
Chicago/Turabian StyleElmer, Kathryn, and Margaret Kalacska. 2021. "A High-Accuracy GNSS Dataset of Ground Truth Points Collected within Îles-de-Boucherville National Park, Quebec, Canada" Data 6, no. 3: 32. https://doi.org/10.3390/data6030032
APA StyleElmer, K., & Kalacska, M. (2021). A High-Accuracy GNSS Dataset of Ground Truth Points Collected within Îles-de-Boucherville National Park, Quebec, Canada. Data, 6(3), 32. https://doi.org/10.3390/data6030032