Abstract
The existence of diagnostic features in the visible and infrared regions makes it possible to use reflectance spectra not only to identify mineral assemblages but also for calibration and classification of satellite images, considering lithological and/or mineral mapping. For this purpose, a consistent spectral library with the target spectra of minerals and rocks is needed. Currently, there is big market pressure for raw materials including lithium (Li) that has driven new satellite image applications for Li exploration. However, there are no reference spectra for petalite (a Li mineral) in large, open spectral datasets. In this work, a spectral library was built exclusively dedicated to Li minerals and Li pegmatite exploration through satellite remote sensing. The database includes field and laboratory spectra collected in the Fregeneda–Almendra region (Spain–Portugal) from (i) distinct Li minerals (spodumene, petalite, lepidolite); (ii) several Li pegmatites and other outcropping lithologies to allow satellite-based lithological mapping; (iii) areas previously misclassified as Li pegmatites using machine learning algorithms to allow comparisons between these regions and the target areas. Ancillary data include (i) sample location and coordinates, (ii) sample conditions, (iii) sample color, (iv) type of face measured, (v) equipment used, and for the laboratory spectra, (vi) sample photographs, (vii) continuum removed spectra files, and (viii) statistics on the main absorption features automatically extracted. The potential future uses of this spectral library are reinforced by its major advantages: (i) data is provided in a universal file format; (ii) it allows users to compare field and laboratory spectra; (iii) a large number of complementary data allow the comparison of shape, asymmetry, and depth of the absorption features of the distinct Li minerals.
Dataset: http://doi.org/10.5281/zenodo.4575375.
Dataset License: CC-BY.
1. Summary
The use of reflectance spectroscopy to identify minerals through diagnostic absorption features in the visible and infrared regions has been described by several authors in recent decades [1,2,3,4]. Due to these diagnostic features, the acquired mineral spectra can be employed in several knowledge-based satellite image classification approaches to delineate target areas for mineral occurrences [5,6]. Moreover, field spectra allows ground-checking of the remotely sensed data (e.g., [7,8,9]) and validation of the atmospheric corrections made to satellite images.
The recent growing economic importance of lithium (Li), mainly due to its application in batteries for electric cars, has triggered several attempts to use satellite images to target the occurrence of Li minerals and Li pegmatites [10,11,12,13,14]. Reference spectra for some of the most important Li minerals, such as spodumene and lepidolite, can be found in the United States Geological Survey (USGS) [15] and ECOSTRESS [16] spectral libraries. Nonetheless, there are no reference spectra for petalite in these open domain spectral libraries. The Geological Survey of Brazil (CPRM) has been trying to address this issue by compiling a spectral database with a Li minerals’ dedicated section, but so far the petalite diagnostic features have not been identified [17].
To fill in this gap and to complement the development of image classification algorithms for Li exploration, a spectral database was built in this work based on samples collected in the Fregeneda–Almendra aplite–pegmatite field (Figure 1). In this region, spodumene, petalite, and lepidolite minerals occur in evolved pegmatites [18,19] that intruded metasedimentary rocks belonging to the “Complexo Xisto–Grauváquico” (CXG) [20].
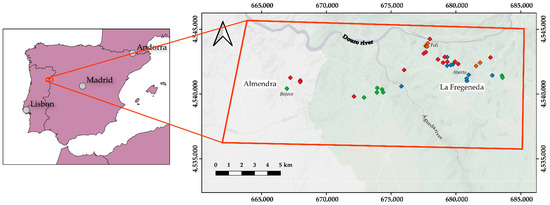
Figure 1.
Location of the Fregeneda–Almendra pegmatite field in the Iberian Peninsula. Diamonds represent pegmatites containing Li minerals: green–petalite; blue–spodumene; red–lepidolite; orange–spodumene + lepidolite [18,19]. The map projection is Universal Transverse Mercator zone 29N from the WGS84 datum.
The spectral library is composed of field and laboratory spectra not only of Li minerals (spodumene, petalite, lepidolite) but also from the main outcropping lithologies of the Fregeneda–Almendra area (granitoid rocks, CXG metasediments, Li pegmatite). These rock spectra were mainly acquired in areas of good exposition so they could be used as training areas for satellite-based lithological mapping. Additionally, to allow further investigation on the ability to discriminate Li minerals and Li pegmatites from other lithologies, the spectra from areas misclassified as Li pegmatites using machine learning algorithms [13] are also provided. The comparison of the aforementioned data can allow users to evaluate the degree of spectral similarity between the target minerals/rocks and the remaining within-scene elements.
Complementary data such as (i) the sample location and coordinates (when available), (ii) degree of alteration of the sample, (iii) sample color, (iv) type of face measured, and (v) equipment used, are provided for each spectrum. Spectra acquisition and curation are described thoroughly. For the laboratory spectra, also available are (i) sample photographs, (ii) respective continuum removed spectra files, and (iii) details on the main absorption features automatically extracted.
This spectral database was established in the ambit of the “Lightweight Integrated Ground and Airborne Hyperspectral Topological Solution” (LIGHTS) project, whose goal is to develop a tool that combines remote sensing data acquired at different scales with geological and geochemical data to rapidly identify target areas for Li exploration [21,22]. However, such a database could be useful for other ongoing research projects, namely: (i) the fiber laser plasma spectroscopy system for real-time element analysis (FLaPsys) project, which aims at developing an advanced spectroscopy system capable of real-time element identification and quantification mainly applied to Li mineralizations [23], and in which laser-induced breakdown spectroscopy (LIBS) will be correlated with the visible and infrared data acquired; (ii) new exploration tools for a European pegmatite green-tech resources (GREENPEG) project which aims at improving responsible exploration in Europe for pegmatites through the development of integrated, multi-method exploration toolsets that include satellite image processing and airborne and ground-based geophysics and geochemical approaches [24]. Part of this spectral database was already the basis for some publications [25,26], but more works are expected in the future since there is great potential in this dataset whose main advantages include: (i) that the data are provided in a universal text file format that is not dependent on software; (ii) the ability to compare field and laboratory spectra for 52 coincident spots; (iii) finally, the details and statistics of the extracted features provided allow the user to compare the shape, asymmetry, and depth of the absorption features of the distinct Li minerals, including petalite.
2. Data Description
The spectral database is divided into two subsets; the first concerning the spectra collected in the laboratory and the second corresponding to the spectra acquired in the field. The spectra were organized into categories within each subset according to their application purpose (Table 1). To allow a rapid and easy identification of the spectra, the spectrum naming was made considering logical codes embedded in the spectrum title (Table 1). Consequently, information such as the location of the sample and analyzed lithology/mineralogy can be readily extracted based just on the spectrum name. Besides the codes of Table 1, each spectrum has its associated measurement number.

Table 1.
String, numerical, and alphanumerical codes used for spectrum naming and identification.
All spectra are provided in a universal UTF-8 text file format that can be read in any proprietary or open-source software, representing measurements made in the visible and near-infrared (VNIR) and shortwave infrared (SWIR) regions. From a total of 340 spectra collected in the laboratory, 84 represent Li minerals, 196 correspond to the outcropping lithologies of the Fregeneda–Almendra area that can be used as training areas for satellite image classification, and 60 spectra were collected from samples in Li pegmatite false-positive areas identified in previous satellite image classification attempts [13]. Additionally, 75 field spectra are presented in the spectral database (35 measurements of Li minerals and 40 measurements of distinct Li pegmatites). As mentioned in Table 1, two spectrometers were used for spectral measurements. For the data acquired with the SR-6500 equipment, the UTF-8 text files are composed of a 28 line-header containing information about the equipment and acquisition settings and two columns, the first with the wavelength (in nanometers or nm) and the second with the measured reflectance (in percentage). In the case of the spectra acquired with the ASD FieldSpec 4, there are just two columns, one with the wavelength (in nm) and the other with absolute reflectance values. For each subset (field and laboratory spectra) there is a *.xlsx table containing important ancillary data:
- Spectrum name
- Acquisition equipment
- Sample type
- Sample conditions
- Sample face type
- Sample color
- Location
- Coordinates (Universal Transverse Mercator zone 29N from the WGS84 datum).
The coordinates are only available for samples collected in situ and, therefore, samples collected in ore stockpiles (for example) do not have this kind of information registered. For the spectra acquired in the laboratory, additional information is also provided, namely: (i) sample photographs with the analyzed spots highlighted, (ii) a UTF-8 text file with the respective continuum removed spectra (with absolute reflectance values); (iii) PNG files showing for each spectrum the main absorption features and a CSV file summarizing the main statistics of each feature (Section 3.2).
3. Methods
3.1. Spectra Acquisition
Two field campaigns were carried out in February and July of 2020 to collect the data to build the spectral library. At the time of the first campaign, there was no portable spectrometer available in the University of Porto to collect spectra in situ, therefore representative samples from 25 locations were taken to the GeoRessources laboratory (University of Lorraine). The spectral measurements were performed with the SR-6500 equipment. Due to difficulties in accessing pegmatites containing spodumene on the field, samples from an existing Li mineral collection at the University of Porto were also analyzed. In the second field survey, favorable weather conditions (absence of clouds) allowed collection of spectra from several Li pegmatites and the different Li minerals in 35 locations dispersed along the Fregeneda–Almendra pegmatite field. In this case, the ASD FieldSpec 4 spectrometer was used. Samples were retrieved in 28 of these 35 locations to collect further spectra under a controlled environment at the University of Porto, using the same equipment. Either in the field or the laboratory, the two spectrometers were calibrated using a Spectralon (Labsphere) plate with a maximum reflectance higher than 95% for the 250–2500 nm region, and higher than 99% for 400–1500 nm interval. In the field, the calibration was repeated every time the solar lighting conditions changed (about each 30′). Regarding the acquisition settings, to improve the signal-to-noise ratio, each of the spectra acquired in the laboratory represented the average of 40 scans. To expedite spectra acquisition in the field, this value was lowered to 30 scans. However, when using the ASD FieldSpec 4 equipment, five spectra were acquired in each analyzed spot. These five spectra were averaged afterward (Section 3.2) and only the final spectrum was provided in the spectral library. The characteristics of each spectrometer are compared in Table 2. The major differences are observed in terms of the spectral resolution with the SR-6500 outperforming the ASD FieldSpec 4.
Table 2.
Comparison of the main characteristics of the employed spectrometers [27,28].
3.2. Spectra Curation and Treatment
The spectra acquired with ASD FieldSpec 4 were post-processed using the ASD ViewSpec Pro™ software [29]. The first step included averaging each of the five spectra collected for each spot. To the averaged spectrum, a splice correction was applied to remove the offset between detectors that is caused by differences in their sensibility [29] (Figure 2). Finally, the final spectra were exported to UTF-8 text files. In the case of the spectra collected using the SR-6500, a simple conversion from SED to the UTF-8 text file was necessary. The SpectraGryph software [30] was used to analyze each spectrum individually to exclude the ones with measurement errors or with noticeable noise caused by the presence of vegetation, for example.
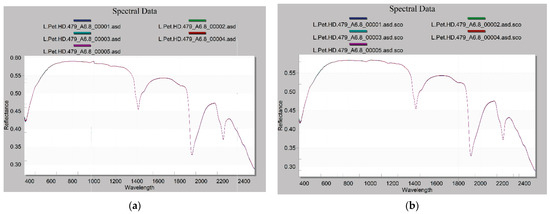
Figure 2.
Splice correction process: (a) before and (b) after applying the correction. The VNIR and SWIR2 ranges are adjusted using the endpoints (~1000 to 1800 nm) and shape of the curve of the SWIR1 range since this detector is more stable to temperature changes [29].
To allow a more detailed analysis of each spectrum, a hull quotient procedure was applied to remove the continuum and normalize the spectra (Figure 3). This was accomplished in a Python environment using the pysptools library [31] based on the technique proposed by Clark and Roush [2]. First, a convex hull was fitted to the spectrum (Figure 3a) connecting the hull points (corresponding to local maxima) [32]. Afterwards, the convex hull (continuum) was removed through a hull-quotient process and the measured reflectance values were divided by the convex hull [2,33,34]. The continuum removal process is of great importance because it not only allows the comparison of the data obtained with different spectrometers but also allows the enhancement and correct determination of the absorption features [32,33,34]. The pysptools library was used to automatically extract the main absorption features (Figure 3b–d) and to calculate their associated statistics according to the work of Kokaly [35]. To avoid the extraction of non-significant features, a baseline value of 0.93 was employed: all features below the baseline were kept and the ones above it were rejected [31] (Figure 3). For each spectrum, a CSV file was automatically created summarizing the statistics of each absorption feature. Table 3 shows a list of the extracted statistics and the respective abbreviation used in the CSV files. The Supplementary Materials provided shows the adaptation of the pysptools functions to batch process this particular spectral library.
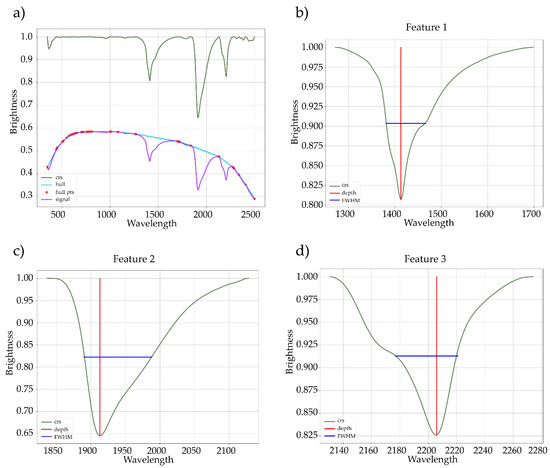
Figure 3.
(a) Convex hull fitting to the original signal and the respective continuum removed spectrum (crs); (b–d) automatic extraction of the main absorption features using the pysptools library [31]. pts–points; FWHM–full width at half maximum.
Table 3.
List of the statistics automatically extracted for each spectrum and respective abbreviations used in the resultant CSV file.
4. User Notes
This spectral database has the advantage of presenting field and laboratory spectra for 52 analyzed spots, allowing comparisons and evaluation of the influence of the acquisition conditions on the final spectra. Additionally, field spectra are expected to better match the spectral signatures acquired by airborne sensors. However, as can be seen in Figure 4, field spectra present additional sharp bands around 1400 and 1800 nm caused by atmospheric water that should be removed before additional processing.
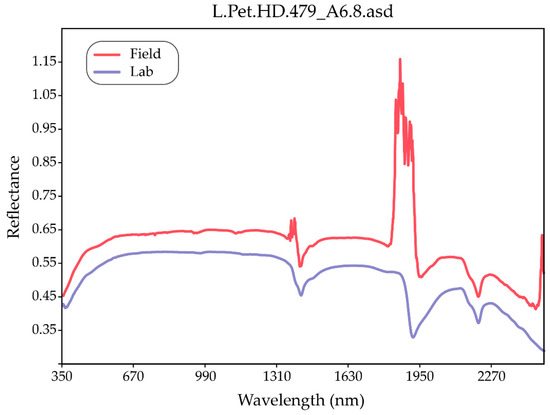
Figure 4.
Comparison of laboratory and field spectra obtained for the same petalite sample. Notice the spikes in the field spectrum caused by the presence of water in the atmosphere.
A final note on the usage of the automatically extracted features that are available for all spectra acquired in the laboratory. As aforementioned, a baseline value was set to determine which absorption features to extract. Therefore, setting a different baseline may produce different results and change the features’ statistics. Additionally, different results can be obtained if the features are extracted considering the whole spectrum or spectra subset matching a given region of interest [34]. According to the user’s objectives, one of the two methods may be more appropriate.
Supplementary Materials
The source code adapted in this study to remove the continuum and automatically extract the main absorption features is available online at https://www.mdpi.com/2306-5729/6/3/33/s1.
Author Contributions
Conceptualization, J.C.-F., A.L., and A.C.T.; methodology, J.C.-F., A.L., and A.C.T.; software, J.C.-F.; formal analysis J.C.-F., J.S., M.P., and M.A.R.; investigation, J.C.-F., J.S., F.D., A.L., A.C.T., M.P., and M.A.R.; resources A.L., E.R.-R., O.B., and J.C.; data curation, J.C.-F., J.S., and F.D.; writing—original draft preparation, J.C.-F.; writing—review and editing, all remaining authors; visualization, J.C.-F., J.S., and F.D.; supervision, A.L., A.C.T., M.A.R., M.P., E.R.-R., and O.B.; project administration, J.C., A.L., and A.C.T.; funding acquisition, J.C. and A.L. All authors have read and agreed to the published version of the manuscript.
Funding
The authors are grateful for the financial support provided by FCT– Fundação para a Ciência e a Tecnologia, I.P., through the ERA-MIN/0001/2017–LIGHTS project and also the 869274–GREENPEG–H2020-SC5-2018-2019-2020 project. The work was also supported by National Funds through the FCT project UIDB/04683/2020–ICT (Institute of Earth Sciences). Joana Cardoso-Fernandes and Filipa Dias are financially supported within the compass of their respective Ph.D. theses, ref. SFRH/BD/136108/2018 and ref. 2020.05534.BD, by national funds from MCTES through FCT, and cofinanced by the European Social Fund (ESF) through POCH—Programa Operacional Capital Humano—and NORTE 2020 regional program. The Spanish Ministerio de Ciencia, Innovacion y Universidades (Project RTI2018-094097-B-100, with ERDF funds) and the University of the Basque Country (UPV/EHU) (grant GIU18/084) also contributed economically. The French National Research Agency (ANR–10–LABX 21–LABEX RESSOURCES 21) partly supported Master Student personal grant and the 776804–NEXT– H2020-SC5-2017 project participated to equipment purchase.
Data Availability Statement
The data presented in this study are publicly archived in the Zenodo platform: https://zenodo.org/record/4575375#.YFAgGNwRVPY (accessed on 16 March 2021).
Conflicts of Interest
The authors declare no conflict of interest.
Abbreviations
The following abbreviations are used in this manuscript:
| CPRM | Geological Survey of Brazil |
| crs | continuum removed spectra |
| CSV | comma-separated values |
| CXG | Complexo Xisto–Grauváquico (Schist–graywacke complex) |
| FWHM | full-width at half maximum |
| Lab | laboratory |
| LIBS | laser-induced breakdown spectroscopy |
| Li | lithium |
| NEdL | noise equivalent radiance |
| PNG | portable network graphics |
| pts | points |
| SWIR | shortwave infrared |
| TE | thermoelectrically |
| USGS | United States Geological Survey |
| UTF | unicode transformation format |
| VNIR | visible and near-infrared |
| WGS | World Geodetic System |
References
- Hunt, G.R.; Salisbury, J.W. Visible and near-infrared spectra of minerals and rocks: I Silicate minerals. Modern Geol. 1970, 1, 283–300. [Google Scholar]
- Clark, R.N.; Roush, T.L. Reflectance spectroscopy: Quantitative analysis techniques for remote sensing applications. J. Geophys. Res. Space Phys. 1984, 89, 6329–6340. [Google Scholar] [CrossRef]
- Clark, R.N.; King, T.V.V.; Klejwa, M.; Swayze, G.A.; Vergo, N. High spectral resolution reflectance spectroscopy of minerals. J. Geophys. Res. Space Phys. 1990, 95, 12653–12680. [Google Scholar] [CrossRef]
- Pontual, S.; Merry, N.J.; Gamson, P. Spectral interpretation field manual. In GMEX Spectral Analysis Guides for Mineral Exploration, 3rd ed.; AusSpec International Ltd.: Queenstown, New Zealand, 2008; Volume 1. [Google Scholar]
- Asadzadeh, S.; Filho, C.R.D.S. A review on spectral processing methods for geological remote sensing. Int. J. Appl. Earth Obs. Geoinf. 2016, 47, 69–90. [Google Scholar] [CrossRef]
- Naleto, J.L.C.; Perrotta, M.M.; da Costa, F.G.; Filho, C.R.D.S. Point and imaging spectroscopy investigations on the Pedra Branca orogenic gold deposit, Troia Massif, Northeast Brazil: Implications for mineral exploration in amphibolite metamorphic-grade terrains. Ore Geol. Rev. 2019, 107, 283–309. [Google Scholar] [CrossRef]
- Pour, A.B.; Hashim, M. Hydrothermal alteration mapping from Landsat-8 data, Sar Cheshmeh copper mining district, south-eastern Islamic Republic of Iran. J. Taibah Univ. Sci. 2015, 9, 155–166. [Google Scholar] [CrossRef]
- Teodoro, A.C.; Veloso-Gomes, F. Quantification of the Total Suspended Matter Concentration around the Sea Breaking Zone from In Situ Measurements and Terra/Aster Data. Mar. Georesour. Geotechnol. 2007, 25, 67–80. [Google Scholar] [CrossRef]
- Rivard, B.; Zhang, J.; Feng, J.; Sanchez-Azofeifa, A.G. Remote predictive lithologic mapping in the Abitibi Greenstone Belt, Canada, using airborne hyperspectral imagery. Can. J. Remote Sens. 2009, 35, 95. [Google Scholar] [CrossRef]
- Cardoso-Fernandes, J.; Teodoro, A.C.; Lima, A.; Perrotta, M.; Roda-Robles, E. Detecting Lithium (Li) Mineralizations from Space: Current Research and Future Perspectives. Appl. Sci. 2020, 10, 1785. [Google Scholar] [CrossRef]
- Cardoso-Fernandes, J.; Teodoro, A.C.; Lima, A. Remote sensing data in lithium (Li) exploration: A new approach for the detection of Li-bearing pegmatites. Int. J. Appl. Earth Obs. Geoinf. 2019, 76, 10–25. [Google Scholar] [CrossRef]
- Cardoso-Fernandes, J.; Lima, A.; Roda-Robles, E.; Teodoro, A.C. Constraints and potentials of remote sensing data/techniques applied to lithium (Li)-pegmatites. Can. Mineral. 2019, 57, 723–725. [Google Scholar] [CrossRef]
- Cardoso-Fernandes, J.; Teodoro, A.C.M.; Lima, A.; Roda-Robles, E. Evaluating the performance of support vector machines (SVMs) and random forest (RF) in Li-pegmatite mapping: Preliminary results. In Earth Resources and Environmental Remote Sensing/GIS Applications X; SPIE: Bellingham, DC, USA, 2019; Volume 11156, p. 111560Q. [Google Scholar]
- Cardoso-Fernandes, J.; Teodoro, A.C.; Lima, A.; Roda-Robles, E. Semi-Automatization of Support Vector Machines to Map Lithium (Li) Bearing Pegmatites. Remote Sens. 2020, 12, 2319. [Google Scholar] [CrossRef]
- Kokaly, R.F.; Clark, R.N.; Swayze, G.A.; Livo, K.E.; Hoefen, T.M.; Pearson, N.C.; Wise, R.A.; Benzel, W.M.; Lowers, H.A.; Driscoll, R.L.; et al. USGS Spectral Library Version 7, 1035; USGS: Reston, VA, USA, 2017; p. 68. [Google Scholar]
- Meerdink, S.K.; Hook, S.J.; Roberts, D.A.; Abbott, E.A. The ECOSTRESS spectral library version 1.0. Remote Sens. Environ. 2019, 230, 111196. [Google Scholar] [CrossRef]
- Costa, M.A.C.; Perrotta, M.M.; Melo, T.G.; Turra, B. Estudos Espectrais. In Avaliação do Potencial do Lítio no Brasil: Área do Médio Rio Jequitinhonha, Nordeste de Minas Gerais: Texto Explicativo e Mapas; Paes, V.J.C., Santos, L.D., Tedeschi, M.F., Betiollo, L.M., Eds.; CPRM: Belo Horizonte, Brazil, 2016; p. 276. [Google Scholar]
- Roda, E.; Fontan, F.; Pesquera, A.; Velasco, F. The phosphate mineral association of the granitic pegmatites of the Fregeneda area (Salamanca, Spain). Mineral. Mag. 1996, 60, 767–778. [Google Scholar] [CrossRef]
- Vieira, R. Aplitopegmatitos com Elementos Raros da Região Entre Almendra (V.N. de Foz Côa) e Barca d’Alva (Figueira de Castelo Rodrigo). Campo Aplitopegmatítico da Fregeneda-Almendra. Ph.D. Thesis, Faculdade de Ciências da Universidade do Porto, Porto, Portugal, 2010. [Google Scholar]
- Costa, J.C.S. Notícia Sobre uma Carta Geológica do Buçaco, de Nery Delgado; Serviços Geológicos de Portugal: Lisboa, Portugal, 1950. [Google Scholar]
- LIGHTS (Lightweight Integrated Ground and Airborne Hyperspectral Topological Solution). Available online: http://lights.univ-lorraine.fr/ (accessed on 9 November 2020).
- Cardoso-Fernandes, J.; Teodoro, A.C.; Lima, A.; Mielke, C.; Korting, F.; Roda-Robles, E.; Cauzid, J. Multi-Scale Approach using Remote Sensing Techniques for Lithium Pegmatite Exploration: First Results. IGARSS 2020, 5226–5229. [Google Scholar] [CrossRef]
- PROJECTS: FLAPSYS. Available online: https://www.inesctec.pt/pt/projetos/flapsys (accessed on 9 November 2020).
- GREENPEG. Available online: https://www.greenpeg.eu/ (accessed on 9 November 2020).
- Cardoso-Fernandes, J.; Silva, J.; Lima, A.; Teodoro, A.C.; Perrotta, M.; Cauzid, J.; Roda-Robles, E. Characterization of lithium (Li) minerals from the Fregeneda–Almendra region through laboratory spectral measurements: A comparative study. In Earth Resources and Environmental Remote Sensing/GIS Applications XI; SPIE: Bellingham, DC, USA, 2020; Volume 11534, p. 115340N. [Google Scholar]
- Cardoso-Fernandes, J.; Silva, J.; Lima, A.; Teodoro, A.C.; Perrotta, M.; Cauzid, J.; Roda-Robles, E.; Ribeiro, M.D.A. Reflectance spectroscopy to validate remote sensing data/algorithms for satellite-based lithium (Li) exploration (Central East Portugal). In Earth Resources and Environmental Remote Sensing/GIS Applications XI; SPIE: Bellingham, DC, USA, 2020; Volume 11534, p. 115340M. [Google Scholar]
- Full Range Photodiode Array UV-VIS-NIR-SWIR. Available online: https://spectralevolution.com/products/hardware/compact-lab-spectroradiometers/ (accessed on 5 November 2020).
- ASD FieldSpec 4 Standard-Res Spectroradiometer. Available online: https://www.malvernpanalytical.com/en/products/product-range/asd-range/fieldspec-range/fieldspec-4-standard-res-spectroradiometer#specs (accessed on 5 November 2020).
- ASD Inc. ViewSpec Pro™ User Manual. ASD Document 600555 Rev. A. Boulder, 2008. Available online: http://geoinfo.amu.edu.pl/geoinf/m/spektr/viewspecpro.pdf (accessed on 4 November 2020).
- Menges, F. Spectragryph Optical Spectroscopy Software, Version 1.2.14. Available online: http://www.effemm2.de/spectragryph/ (accessed on 22 July 2020).
- Therien, C. Welcome to the PySptools Documentation. Available online: https://pysptools.sourceforge.io/ (accessed on 22 July 2020).
- Van Der Meer, F. Spectral curve shape matching with a continuum removed CCSM algorithm. Int. J. Remote Sens. 2000, 21, 3179–3185. [Google Scholar] [CrossRef]
- Carrino, T.A.; Crósta, A.P.; Toledo, C.L.B.; Silva, A.M. Hyperspectral remote sensing applied to mineral exploration in southern Peru: A multiple data integration approach in the Chapi Chiara gold prospect. Int. J. Appl. Earth Obs. Geoinf. 2018, 64, 287–300. [Google Scholar] [CrossRef]
- Continuum Removal. Available online: https://www.l3harrisgeospatial.com/docs/ContinuumRemoval.html (accessed on 6 November 2020).
- Kokaly, R.F. PRISM: Processing Routines in IDL for Spectroscopic Measurements (Installation Manual and User’s Guide, Version 1.0); 2011-1155; Reston, VA, 2011. Available online: https://pubs.usgs.gov/of/2011/1155/pdf/ofr2011-1155-17oct2011.pdf (accessed on 6 November 2020).


Publisher’s Note: MDPI stays neutral with regard to jurisdictional claims in published maps and institutional affiliations. |
© 2021 by the authors. Licensee MDPI, Basel, Switzerland. This article is an open access article distributed under the terms and conditions of the Creative Commons Attribution (CC BY) license (http://creativecommons.org/licenses/by/4.0/).