Article

Future Prediction of COVID-19 Vaccine Trends Using a Voting Classifier

by
Syed Ali Jafar Zaidi
1,
Saad Tariq
2 and
Samir Brahim Belhaouari
3,*
1
Department of Computer Science, Khwaja Fareed University of Engineering and Information Technology, Rahim Yar Khan 64200, Pakistan
2
Department of Information Technology, Khwaja Fareed University of Engineering and Information Technology, Rahim Yar Khan 64200, Pakistan
3
Division of Information and Computing Technology, College of Science and Engineering, Hamad Bin Khalifa University, Doha, Qatar
*
Author to whom correspondence should be addressed.
Data 2021, 6(11), 112; https://doi.org/10.3390/data6110112
Submission received: 8 August 2021 / Accepted: 10 September 2021 / Published: 2 November 2021

Abstract

:
Machine learning (ML)-based prediction is considered an important technique for improving decision making during the planning process. Modern ML models are used for prediction, prioritization, and decision making. Multiple ML algorithms are used to improve decision-making at different aspects after forecasting. This study focuses on the future prediction of the effectiveness of the COVID-19 vaccine effectiveness which has been presented as a light in the dark. People bear several reservations, including concerns about the efficacy of the COVID-19 vaccine. Under these presumptions, the COVID-19 vaccine would either lower the risk of developing the malady after injection, or the vaccine would impose side effects, affecting their existing health condition. In this regard, people have publicly expressed their concerns regarding the vaccine. This study intends to estimate what perception the masses will establish about the role of the COVID-19 vaccine in the future. Specifically, this study exhibits people’s predilection toward the COVID-19 vaccine and its results based on the reviews. Five models, e.g., random forest (RF), a support vector machine (SVM), decision tree (DT), K-nearest neighbor (KNN), and an artificial neural network (ANN), were used for forecasting the overall predilection toward the COVID-19 vaccine. A voting classifier was used at the end of this study to determine the accuracy of all the classifiers. The results prove that the SVM produces the best forecasting results and that artificial neural networks (ANNs) produce the worst prediction toward the individual aptitude to be vaccinated by the COVID-19 vaccine. When using the voting classifier, the proposed system provided an overall accuracy of 89.9% for the random dataset and 45.7% for the date-wise dataset. Thus, the results show that the studied prediction technique is a promising and encouraging procedure for studying the future trends of the COVID-19 vaccine.

1. Introduction

Machine learning applications are widely used for forecasting to improve decision-making processes in different fields, e.g., medical treatment and self-driving systems [1]. In addition, machine, earning algorithms play an important role in natural language processing, robotics, image, video, and voice processing. Machine learning algorithms follow a uniform procedure that is quite opposite to traditional programming language based on conditional statements [2]. Statistical approaches and ML methods are similar, as both typically aim to forecast accuracy. However, ML methods are more demanding because they must be implemented using computer science [3]. This research focuses on the prediction of the COVID-19 vaccine’s impact. Several other ML models have been used predict the diseases and their cures, such as heart attacks [4], diabetes [4], and cancer [5]. In the study conducted by the authors of [6], a live COVID-19 prediction about the confirmed cases and number of deaths in particular areas was made. The authors of [7] also focused on the COVID-19 outbreak and the forecasting of deaths and number of recoveries. Hence, the best solution must anticipate the problems of various natural factors in this regard. The trend of vaccination in different countries can be seen in Figure 1.
This study aims to predict the perception of people toward the COVID-19 vaccine. Although different governments have attempted to stop the impact of the COVID-19 using different methods [7], COVID-19 has affected countries worldwide since the end of 2019. Since the end of 2019, COVID-19 has been a very serious threat to human lives. Individuals are infected by this disease daily in huge numbers, which may lead to death [8]. The authors of [9] briefly discussed the cure and treatment of COVID-19, as well as precautionary measures to avoid this novel disease. Thousands of people have been infected and hundreds of people have died due to this novel disease. The COVID-19 vaccine introduces a solution to mitigate the risk of COVID-19 infection. Although, in the beginning, everyone experienced some serious concern about this vaccine, there is no question that the coronavirus is out of the premises of proper treatment. However, the public has heeded to the rumors instead of perceiving the vaccine as a proper medicine. It is natural to react with hesitance towards a newborn vaccine. We would have to demolish all such baseless notions against the inoculation of this medicine to prevent this reaction. Human health and safety are considered top priorities among everyone. Therefore, within a year of the introduction of the COVID-19 pandemic, different research teams accepted the challenge and developed the vaccine to protect against SARS-CoV-2, which causes COVID-19 [10]. Since of the middle of 2020, many COVID-19 vaccines have been introduced. However, the study conducted by the authors of [11] showed that people are hesitant resistant to being vaccinated with a safe vaccine. To reduce deaths related to COVID-19, almost every country across the globe has initiated protocols to ensure the availability of vaccine. However, not everybody is willing to receive the vaccine. This may be related to the number of deaths and infections due to vaccines when the vaccine was introduced.
Machine learning algorithms have always been helpful to predict various diseases, e.g., COVID-19, cardio-vascular disease, and many more [12]. However, analysis surrounding the presence of COVID-19 and its vaccination trend has long been questioned. Different supervised learning algorithms have also been used in different prospects [13,14,15]. To address the current human health problems due to COVID-19, this study aims to predict the tendency of the people to be vaccinated by the vaccine so that a system can be developed to convince people to get vaccinated. The prediction model has been made for the following important models for upcoming days:
  • To identify the trend of people towards the vaccination;
  • To find out the accuracy of the vaccinations;
  • The assess the growth in the number of new vaccinated cases.
The prediction problem is considered a regression problem, so this research focuses on different regression models use in ML, e.g., decision tree (DT), random forest (RF), a support vector machine (SVM), K-nearest neighbor (KNN), and artificial neural network (ANN). These ML models were trained using feedback tweets of vaccinated and non-vaccinated people. The dataset is obtained from Kaggle (San Francisco, CA, USA) which contains 60,303 tweets from tweeter users who have tweeted about COVID-vaccination all over the globe from December 2020 to April 2021. The unprocessed dataset has been processed before training and testing and is divided into two subparts: training sets (80% tweets) and testing sets (20% tweets). Four evaluation parameters (logarithm loss, accuracy score, F1 score, and area under the curve) have been used in this study to find the accuracy from the test dataset.
In the result of this study, besides predicting the trend towards vaccination, some other central findings were realized:
  • Different models give different forecasting results with the same dataset;
  • These forecast results can be helpful in future decision-making;
  • Date-wise datasets show poor accuracy than random dataset.
This paper consists of six sections. Section 1 consists of the introduction. In Section 2, the problem statement is defined. Section 3 describes the dataset and contains the description of models and testing matrix. The methodology is then discussed in Section 4. Discussion and results has been discussed in Section 5 while conclusions has been discussed precisely at last in Section 6.

2. Problem Statement

Since the COVID-19 has encompassed the world, there is always a real-time threat to life for everyone. Anyone can be infected with SARS-CoV-2 from anywhere that may cause a real problem for health or even lead to death. At the same time, vaccination played an important role in the protection from this novel disease. As this vaccine is new and may cause different health issues, so people are worry to get vaccinated in early stages. This study aims to develop a system to predict the trend of people who are getting COVID-19 vaccination.

3. Material and Methods
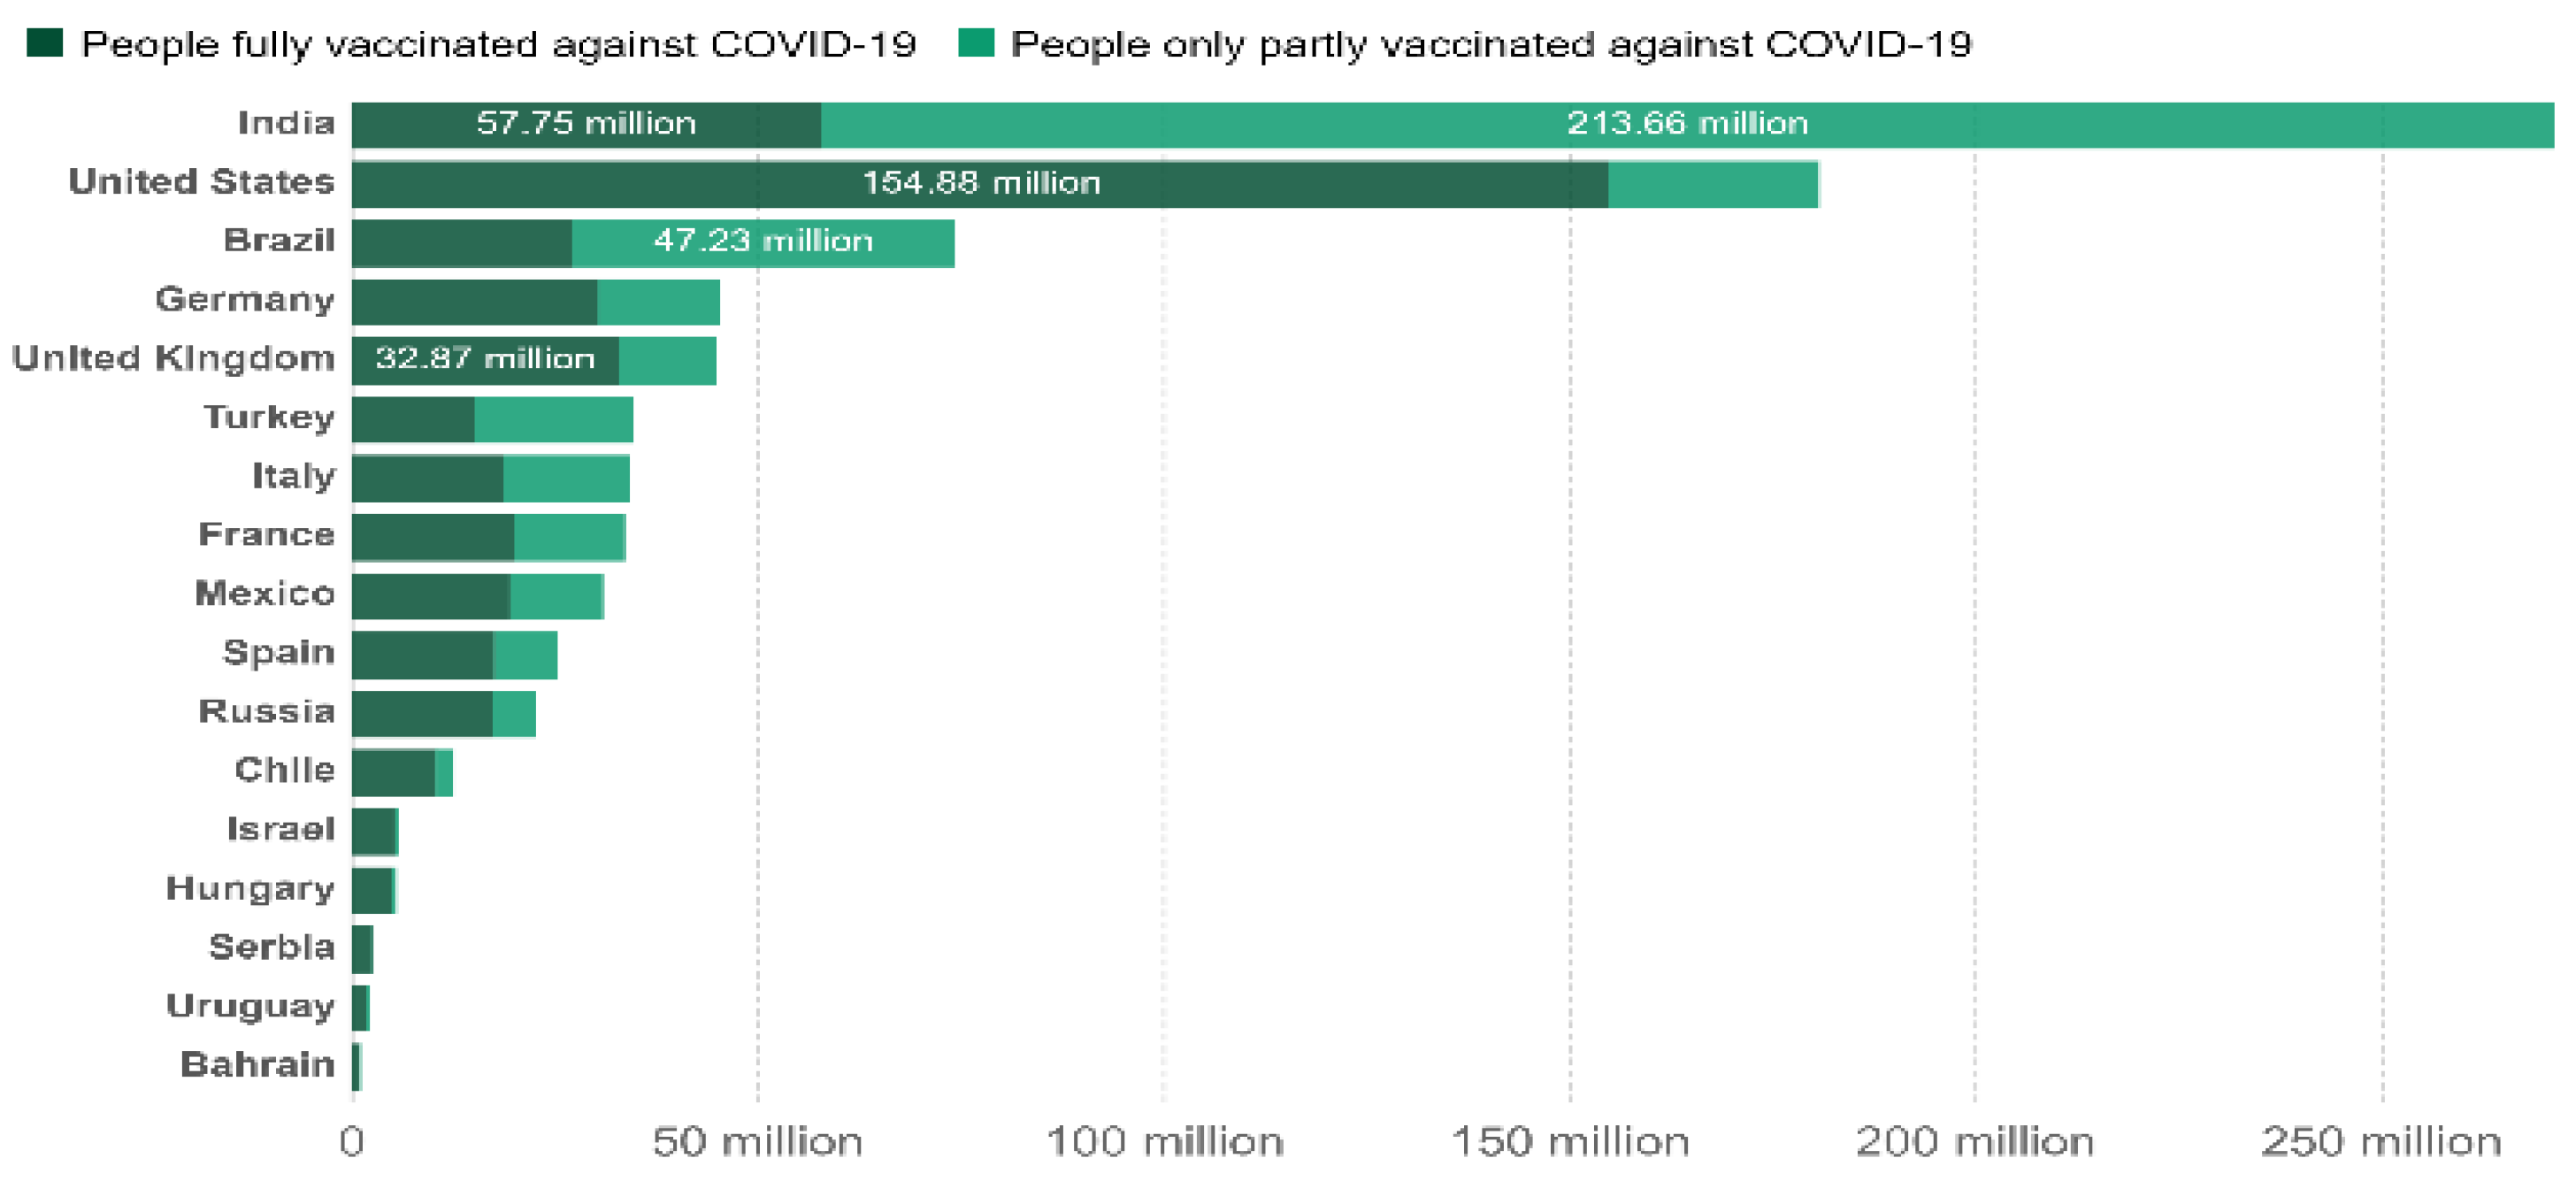
3.1. Dataset

This study aims to predict the trend of people towards the COVID-19 vaccination. For this purpose, the dataset used in this study was based on the feedback of users given on Twitter, and the number of total vaccinations with the total number of recoveries is obtained from Kaggle [16,17]. Thus, the dataset contains the tweets of only Twitter users, without any age barrier, who have tweeted about the vaccination. A comma-separated values (CSV) file has been used to contain feedback tweets, dates of tweets, hashtags, and locations. One CSV file contains the data of vaccination by different countries and number of recoveries. Table 1 shows the tweets and the date of tweets which may be positive, negative, or neutral. The first field of contains the date of the tweets, while the second field contains the tweets which has been used to analyze the sentiment and train the data. Sentiment analysis was carried out to find the sentiment of the tweets. Table 2 contains number of people who has been vaccinated in different countries from December 2020 to April 2021. In Table 1 and Table 2, sample dataset is shown, i.e., data that were preprocessed using different python libraries.

3.2. Supervised Machine Learning Models

There are a different number of supervised machine learning models used for prediction from the given input with an unknown dataset. Normally labeled datasets are used to train a model or a classifier to predict the output in both regression and classification models [18]. Classifiers might use this for classification in machine learning; hence, simple classification is useful in the learning of embattled data which maps each predefined label y with the attribute x.
In this study, five supervised machine learning models were used to train the dataset and predict the output by using testing dataset:
  • Decision tree;
  • Random forest;
  • Support vector machine;
  • K-nearest neighbor;
  • Artificial neural network.

3.2.1. Random Forest

A random forest classifier is used to solve classification and regression problems. Multiple decision trees have been used as a base classifier for the random forest [19].
The basic idea behind the RF is that it is both powerful and simple. In data science language, the decision trees in RF point out the number of different uncorrelated trees working as an assembly which will outperform any of the individual integral models.
So, as there are multiple decision trees in the RF, there might some decision trees that predict the true output, some might predict the false output, but altogether every tree will predict the single output. The reason behind the implementation of RF is very simple; it takes very little time to obtain the data train, it predicts output with high accuracy, and it predicts the accuracy when a large set of data is missing or not in true sequence [20].
Thus, multiple decision trees are generated by a random forest classifier and can work in two ways:
  • A random sampling of data for bootstrap sampling;
  • Generate N number of individual decision trees based on a random input selection.
As discussed earlier, RF can be used in both types of problem(s), i.e., either regression or classification. Over-fitting problems can be overcome with RF which leads to an increase in the accuracy of these problem(s).

3.2.2. Support Vector Machine (SVM)

Like RF, SVM is also a supervised machine learning model which is used for both regression and classification problems [21]. To solve the problem in SVM, the idea is pretty simple. A line is drawn in SVM which separates the classes in it that line is also known as hyper line. Besides separating the boundary into classes, the purpose of this hyper lane is to find out the closest point in between both classes. This closest point is called the support vector.
Two types of SVM classifiers are used: (1) linear SVM; and (2) non-linear SVM. Any of them can be used to solve a particular problem. If the data are linearly arranged, then it can be separated with the help of the hyper lane, but the non-linear data cannot be separated with the help of the hyper line. We have 2d space in the linear dataset but not for the nonlinear dataset, we have to add on more dimensions to arrange it into classes.
Kernel Trick is used in SVM to transform the given data and then to find the optimal boundary between the expected outcome with the help of transformation performed earlier. SVM is considered as a memory-efficient model and is supposed to work much more effectively when there are high dimensional spaces.

3.2.3. Decision Tree

A decision tree is a machine learning model used to predict the output with the help of input provided. Decision trees are much simpler and easier to understand compared to other classifiers. They deal with nodes and sub-nodes or leaf nodes while predicting an output; the external nodes of the decision tree represent the attributes and the sub-nodes or leaf nodes represent the class. Whereas, the process of the prediction in the decision tree starts from the root node of the tree. Usually, the decision tree follows the divide and conquer technique to predict the outcome(s).
Somehow, decision trees work like the thinking ability of the human brain. The flow of the decision tree is simple as there are several different components of the DT, including nodes, branches, splitting stopping, and pruning. The branches and nodes are the most important parts of any DT model, while the rest of the three make up important components in building a decision tree.
There are three types of nodes: (1) the root node which is also known as the decision tree; (2) the internal nodes which are also known as the chance node; and (3) the leaf nodes which contain the possible outcome of the event. The second component are branches, i.e., the flow of any decision tree, depends upon the branches. Normally, branches follow the if-then-else rule in decision making, whereby every path from the root to the internal or leaf nodes represents classification. The third component in DT involves splitting which occurs when there is an input variable which causes the nodes to split into one or more than one leaf or internal nodes according to the input of the variable. The process of splitting continuous until the final criteria does not meet. At the same time, the different complexities of these two components (stopping and pruning) are avoided [22].

3.2.4. K-Nearest Neighbor (KNN)

Unlike other classifiers, KNN is also used in a different field with different robotics features and required high efficiency [23]. Although it is considered as a good classifier to find out the accuracy, there are few major drawbacks of this classifier: (1) it is a slow model to train the dataset; and (2) as it is slow to train, there may be a dependency that exists to find out the best result [24]. KNN is considered an attractive classifier for recommendation systems and can also be useful for detecting any type of fraud detection.
As it is a slow learner classifier, it does not learn from the training set. The working of KNN is simple as it compares the input from the available classes and puts the new input into similar classes. It maintains the dataset and predicts the output at the time of classification. As it uses both regression and classification problems, its implementation is much easier than the other classifiers. In this study, it has been discussed that the DT classifier does not have good output when there is a large set of data, but KNN can be good when there is a large set of data to be trained and to be tested.
It works simply, for instance, when there are two classes, i.e., class A and class B. Then, the number of neighbors will be identified, and, with the help of Euclidean distance, the number of nearest neighbors in both classes will be identified. After calculating the Euclidian distance, Class A has four neighbors and Class B has two neighbors. When the data is tested, a new data point should belong to class A.

3.2.5. Artificial Neural Network (ANN)

Artificial neural network (ANN) and neural networks (NN) are considered interchangeable terms. It has also been considered as branch of artificial intelligence. An ANN is the combination of different nodes, called neurons, which are connected. These nodes are known as processing units which are the combination of outputs and input units. As a result of the implementation of ANN the results might be accurate and demanding. An advantage of ANN is that when it has been trained on a dataset, it can be tested on a new dataset [25,26]. The ANN model has been trained with the input where it has been taught with the pattern.
Another advantage of ANN over other classifiers is it may provide results without complete data once it was trained. It also has the ability to do multiple jobs at once. ANN works like a human brain as it consists of a model of neurons. In ANN, the process is carried out in the form of signals that have been sent in the form of electrical and chemical signals. Although ANN is considered a great algorithm in data science. ANN consists of three layers: (1) the input layer; (2) the hidden layer; (3) the output layer.
Usually, the input layer is used to obtains input values; it receives a single value as an input and replicates as many and sends it to the hidden layer. The number of the hidden layer may vary as it can be one or more than one. After processing the input, the hidden layer sends the value to the output layer. The output layer may also receive the value from the input layer as it receives the value from the output layer. The value that the output layer receives is the forecasting value of input variables. The application of ANN is in the stock market, speech and voice recognition, and many others.

3.3. Testing Matrix

Testing a model involves checking how accurate and effective it is. In this study, each trained model was evaluated and tested on different parameters in terms of precision, recall, F-measure, logarithmic loss (LL), and area under the curve (AUC). At the end of this study, all the results of different classifiers were used in the voting classifier to predict accuracy.

3.3.1. Precision, Recall, and F-Measure

Precision and recall are the two most common and misunderstood evaluations of machine learning. Both of them may rectify the imbalance classification problems in an information retrieval scheme, usually with text. In this study, they were both used to evaluate the trained model to classify the trend in the information retrieval system. Precision is measured as a tendency towards accuracy and discusses the closeness of more than one quantity, regardless of whether these quantities are true or not [27]. The precision is obtained by true positives (TP) divided by the combination of both true positives (TP) and false positives (FP).
P r e c i s i o n = T P T P + F P
In this study, the trained model was also tested using a recall parameter that is helpful to find out the total number of the relative redundant in a dataset. So, in recall, the scenario is a bit different than precision. Recall can be defined as the total number of true positives divided by the total number of rudiments belonging to the positive class [28]. The positive class contains the total number of false negatives (FNs) and true positives (TPs).
R e c a l l = T P F N + T P
To acquire a balance between precision and recall, the F-measure is used to find out the accuracy of the model on trained dataset. The F-measure is also known as the F-score or the F1 score. The F1 score is the harmonic mean (HM) of recall and precision [29]. The highest possible value in the F score is 1 and the lowest possible value of the F score is 0. Usually, the F-measure might be used to balance the equation of recall and precision. The equation of the F1 score is given below.
F 1   S c o r e = 2   ×   P r e c i s o n   ·   R e c a l l P r e c i s o n + R e c a l l

3.3.2. Logarithmic Loss (LL)

In this study, logarithmic loss was calculated to test the accuracy of the trained model. Logarithmic loss, or log loss, is considered a useful evaluation metric to find out the accuracy of the classification problem. Log loss indicates the closeness of the actual value with the value of prediction probability. If the change in the value of prediction from actual value is more diverse, the log loss value will be the maximum. The binary log loss value is 0 or 1; however, in this case, the minimum value should be [30]. The log loss is calculated with the help of Equation (4) (given below).
L o g L o s s i = [ y i l n p i + ( 1 y i ) l n ( 1 p i ) ]
In Equation (4), y denotes true values, i denotes the given observations, and p is the predicted probability where ln is the natural log of the number. The resultant value from the equation will be between 0 and 1. The predicted value nearer to 0 will be considered more accurate.

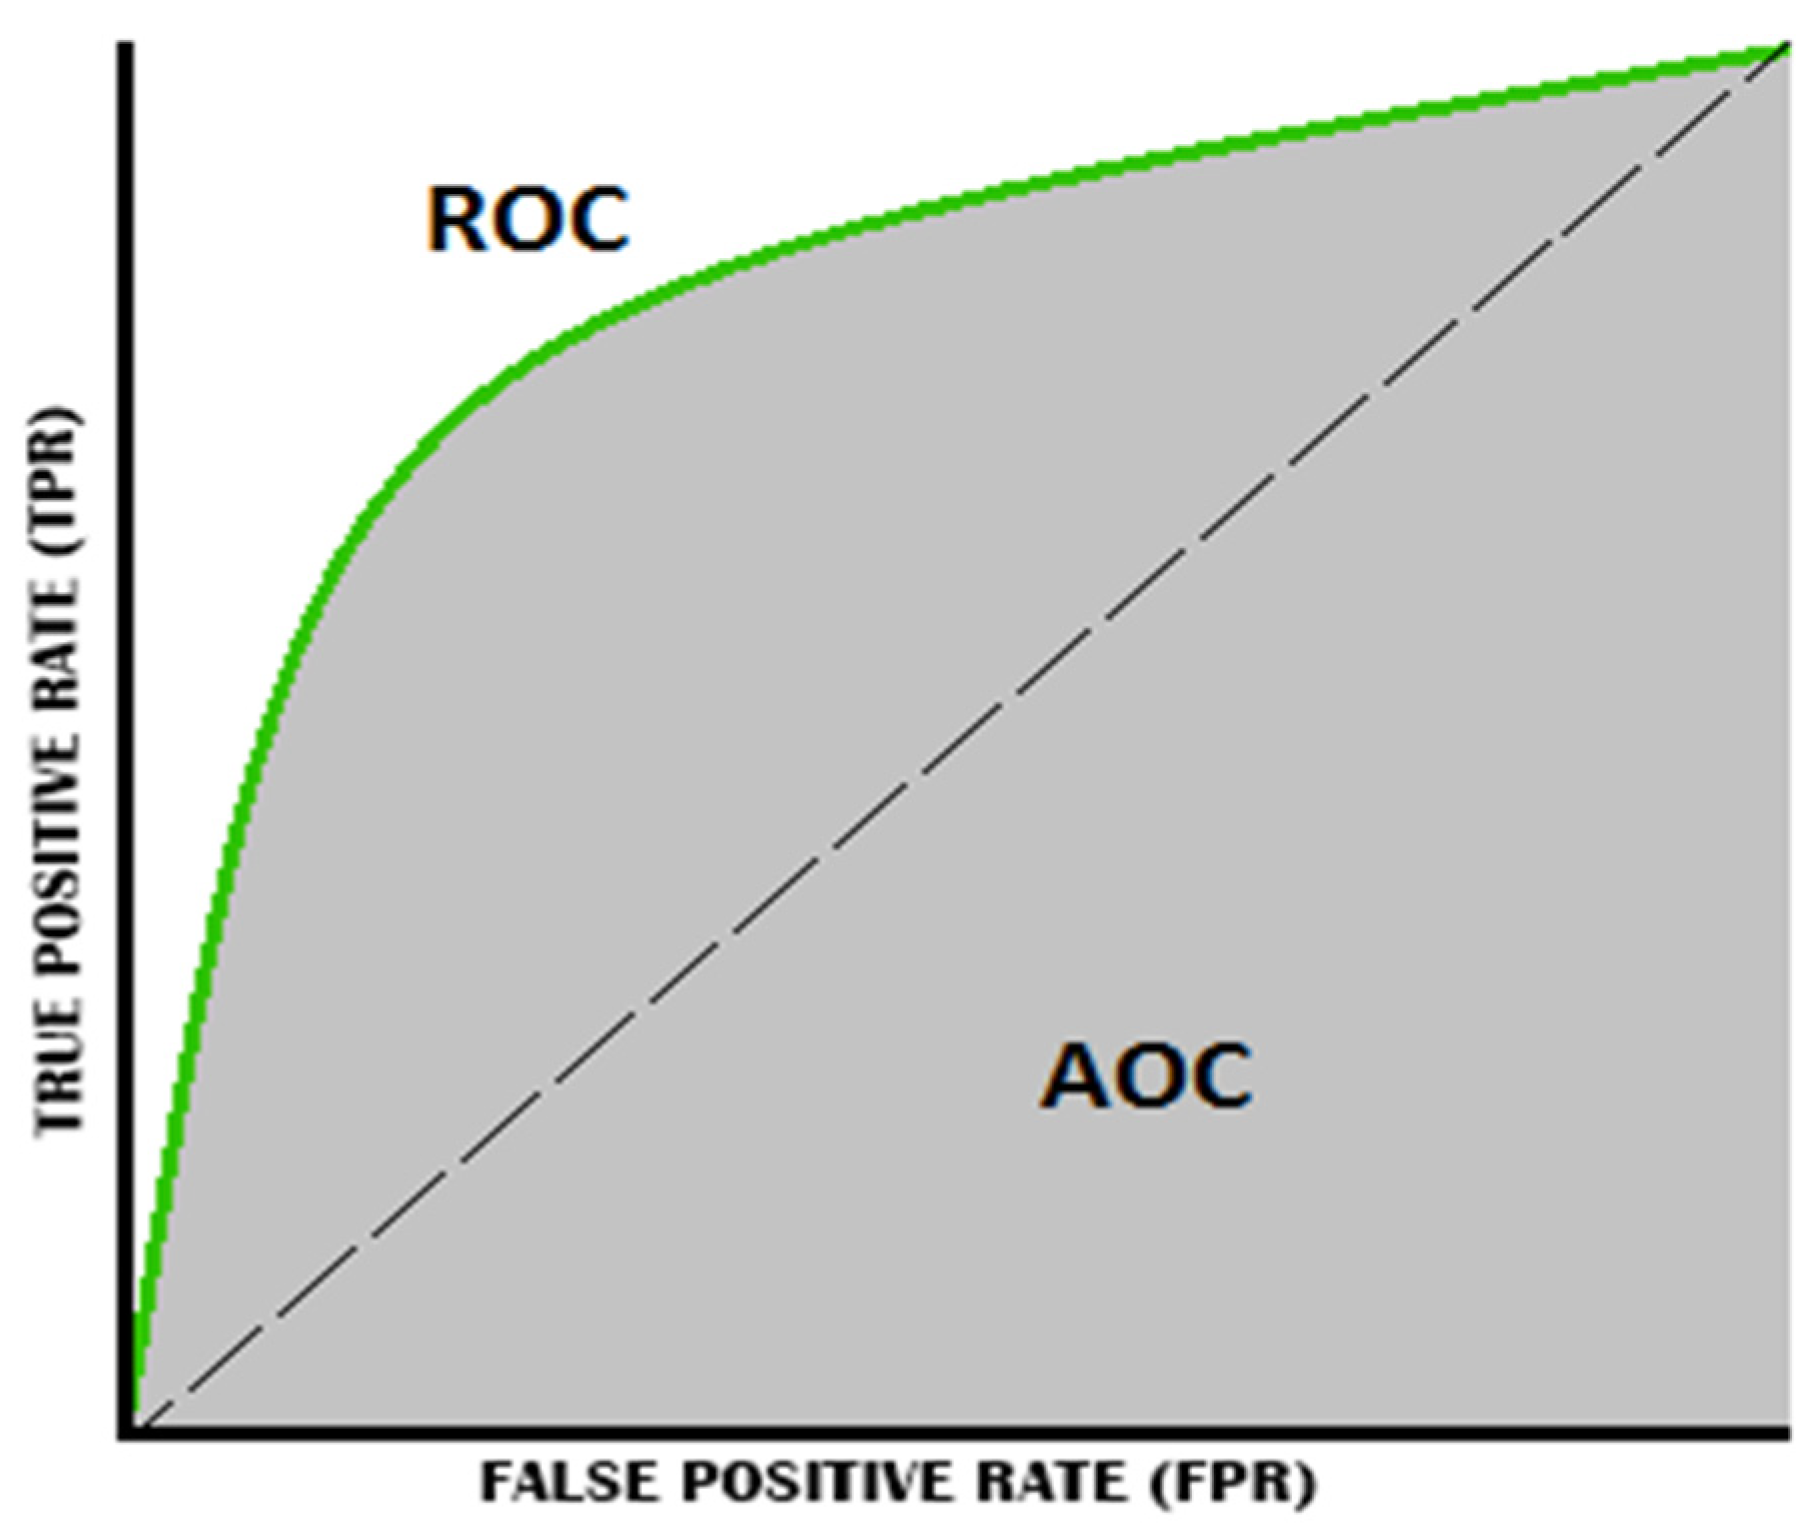
3.3.3. Area under the Curve (AUC)

An AUC classifier is used to differentiate between multiple classes. To find out the multiple cases of classification, an AUC-ROC has been used. Receiver operation characteristic (ROC) indicates probabilistic curves, while AUC can be any curve that may characterize the degree [31]. The simple background of ROC-AUC suggests that the AUC would be higher and there would be stronger chances of better results predicted by the model. The ROC-AUC curve (Figure 2) is plotted with a false positive rate (FPR) and a true positive rate (TPR), while the TPR is on the x-axis and FPR is on the y-axis [32].
TPR also known as recall (Equation (2)), while FPR is calculated as a total number of false positives (FPs) divided by the sum of true negatives (TNs) and false positives.
FPR = F P F P + T N
The AUC curve always lies between 0 to 1. If the AUC value is 0 or near to 0, it means that the AUC has the worst measure of divisibility. For example, if the value is 1 or near to 1, the AUC has the best measure of divisibility, while if the value is 0.5, it means that the classifier is not able to split the measure into different classes. The best scenario to differentiate the classes in AUC is when there is no overlap in classes. In Figure 2, ROC-AUC curves show the positive intent.

3.3.4. Voting Classifier
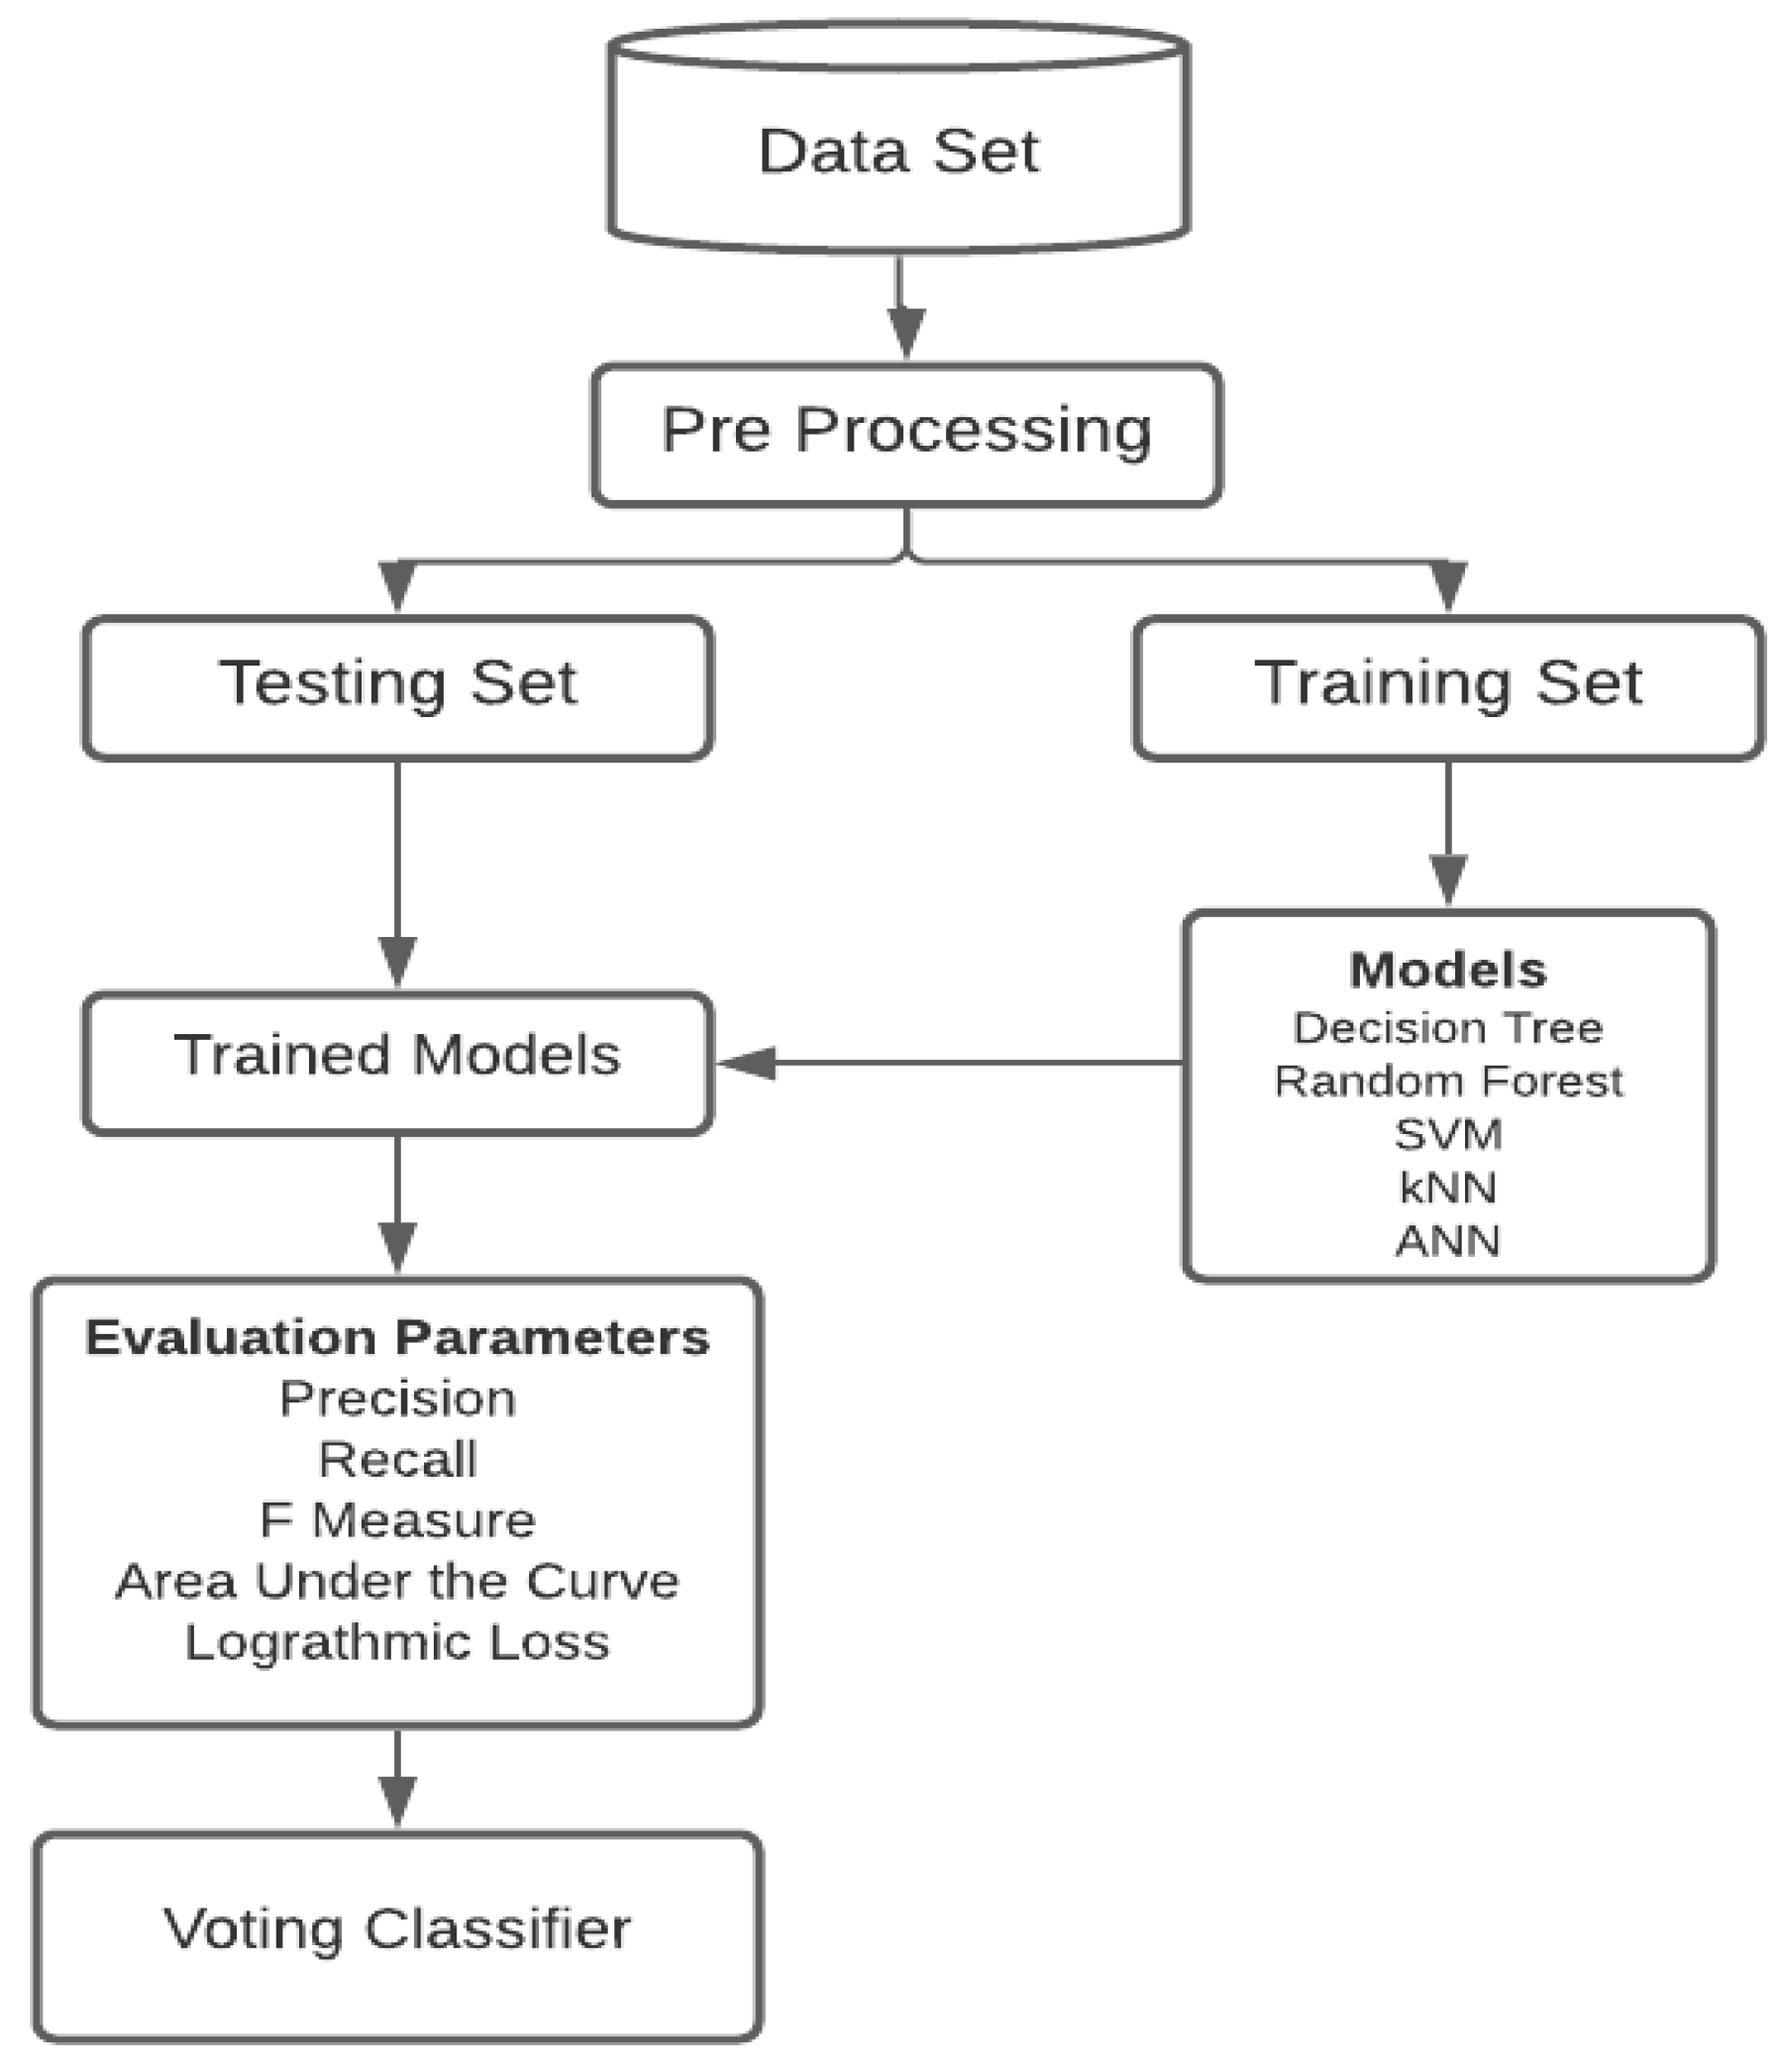
A voting classifier can predict the aggregate value of all the classifier’s results instead of nominating a single model or classifier. In other words, the finding or results of all the classifiers are passed into this voting classifier, which gives a single resultant value [33]. To build and implement a smart voting classifier, features of the python module SCIKIT learn were used.

4. Methodology

This study was carried out to predict the future trend of the novel coronavirus (also known as COVID-19) vaccination. At a time, COVID-19 became a threat to human lives so the invention of COVID-19 vaccination was no more than a blessing for humans, but there are some myths about the vaccination which forces people to avoid it. This study aims to provide a systemize tool that would predict the trend of the people towards the vaccination.
In this study, different ML models were used to predict future trends. The dataset used in this study was fetched from Kaggle in a comma-separated values (CSV) format which contains feedbacks regarding COVID-19 vaccination. Preprocessing was achieved using python programming language. The processed form of the dataset was then divided into two parts: the testing set (20% tweets) and the training set (80% tweets). Furthermore, the data were divided into two categories: the date-wise dataset and the random dataset.
The date-wise dataset follows the sequence from a specific date until the last date. However, the random dataset was chosen randomly, which does not follow any specific date. For experimental purposes, both datasets trained 20% of tweets while 80% of the dataset was tested on a trained model. The training set was trained on ML classifiers, e.g., decision tree, random forest, a support vector machine, and K-nearest neighbor. After the dataset was trained on these classifiers, it was then tested using different evaluation parameters, such as precision recall, area under the curve, logarithmic loss, and F-measure. In the end, all results of all the evaluation parameters were tested through the voting classifier to predict the aggregate instead of nominating a single model. The workflow of the proposed study can be seen in Figure 3.

5. Performance and Results

This study aims to classify the trends of the public towards the COVID-19 vaccination. It is important to understand that too many people have been vaccinated [34]. Some of them have suffered from side effects, but the majority of the vaccinated people saw the positive impact of the vaccination. Different studies have also been proposed to predict the COVID-19 vaccination trend with the help of artificial intelligence; semi-supervised machine learning; data mining; and data science [35] with different tools, e.g., WEKA [36]. After several experiments, the results of this study show that the vaccination may cause some side effects in the human body, but the chances of side effect is extremely bleak an in rare scenario. Public brains have been encompassed with different thoughts regarding the vaccination. In this study, the classification of trends towards the COVID-19 vaccine has been predicted. For this purpose, the data were trained on five different classifiers to predict the trend of the data tested by precision, recall, F1 measure, logarithmic loss, and area under the curve. In the end, the voting classifier was used to combine the results of all classifiers to give a cumulative result in terms of accuracy.

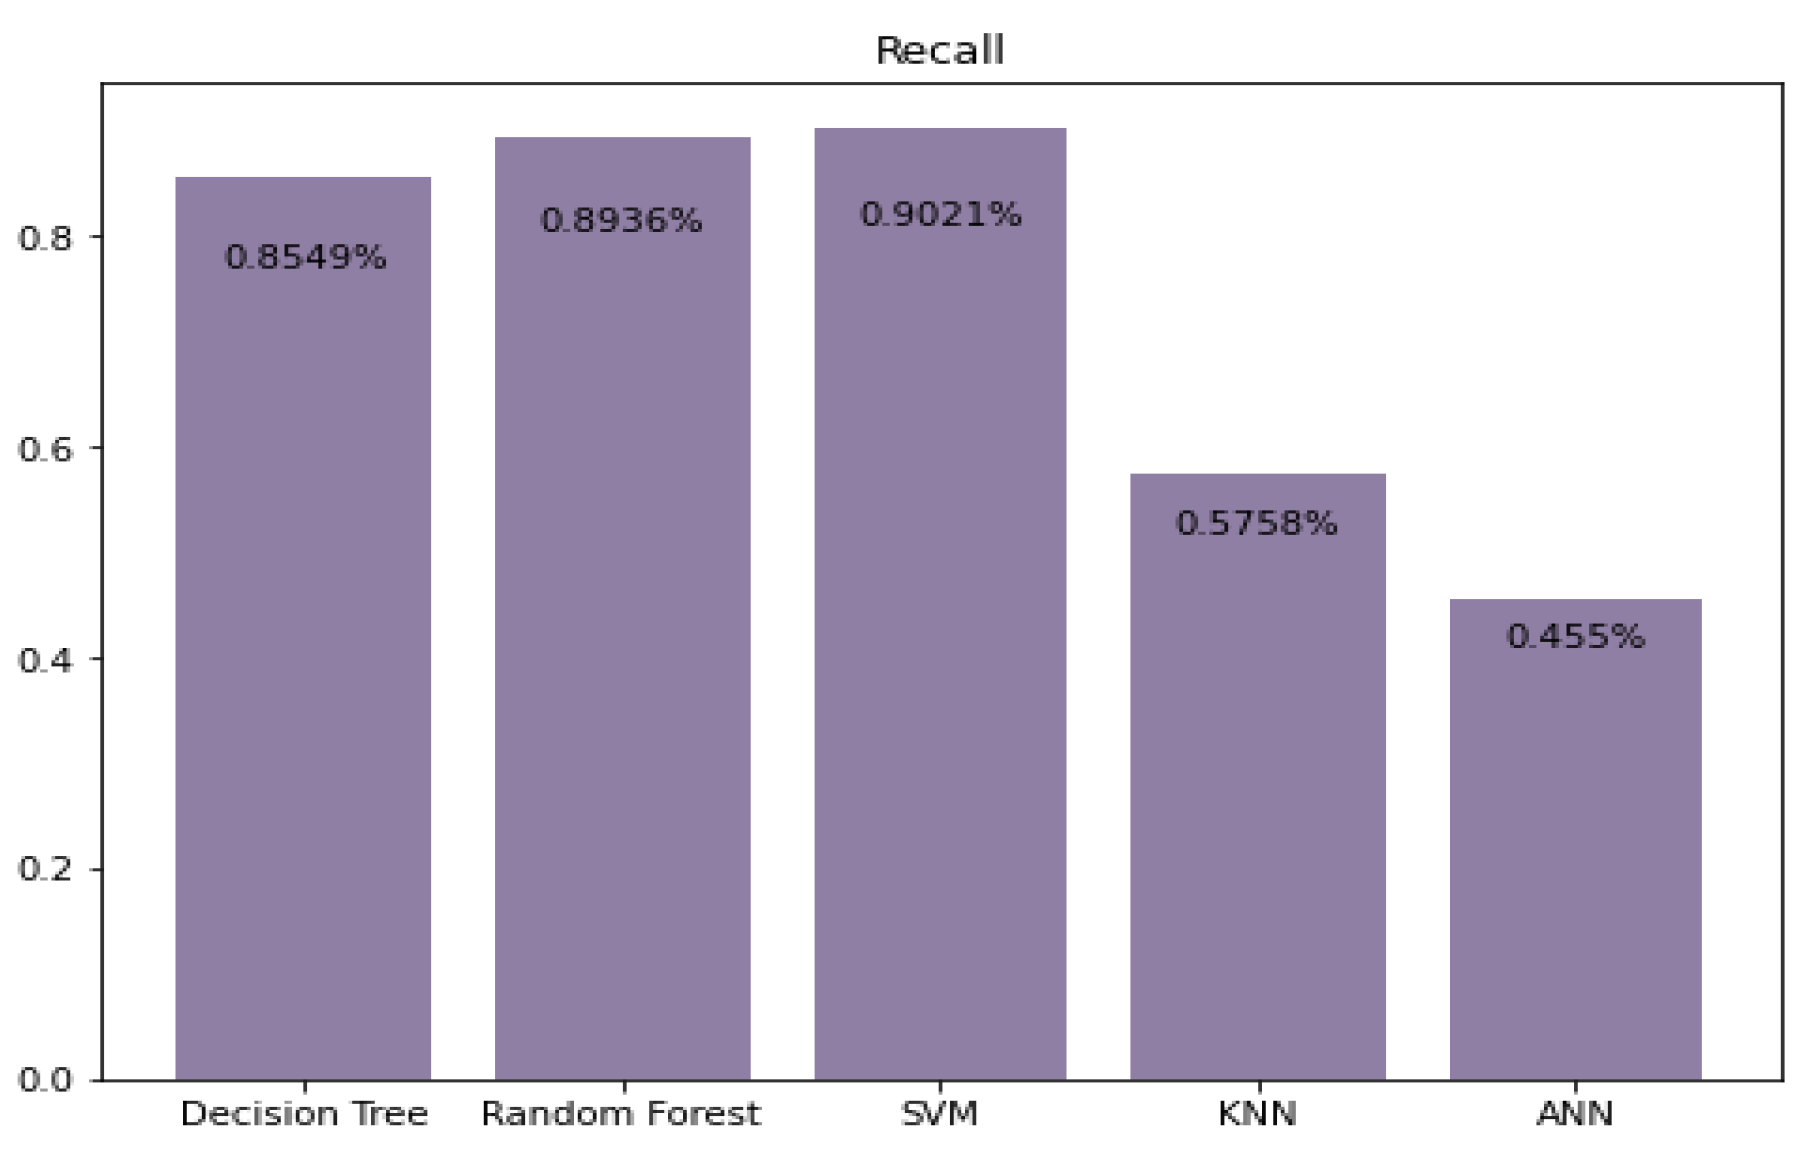
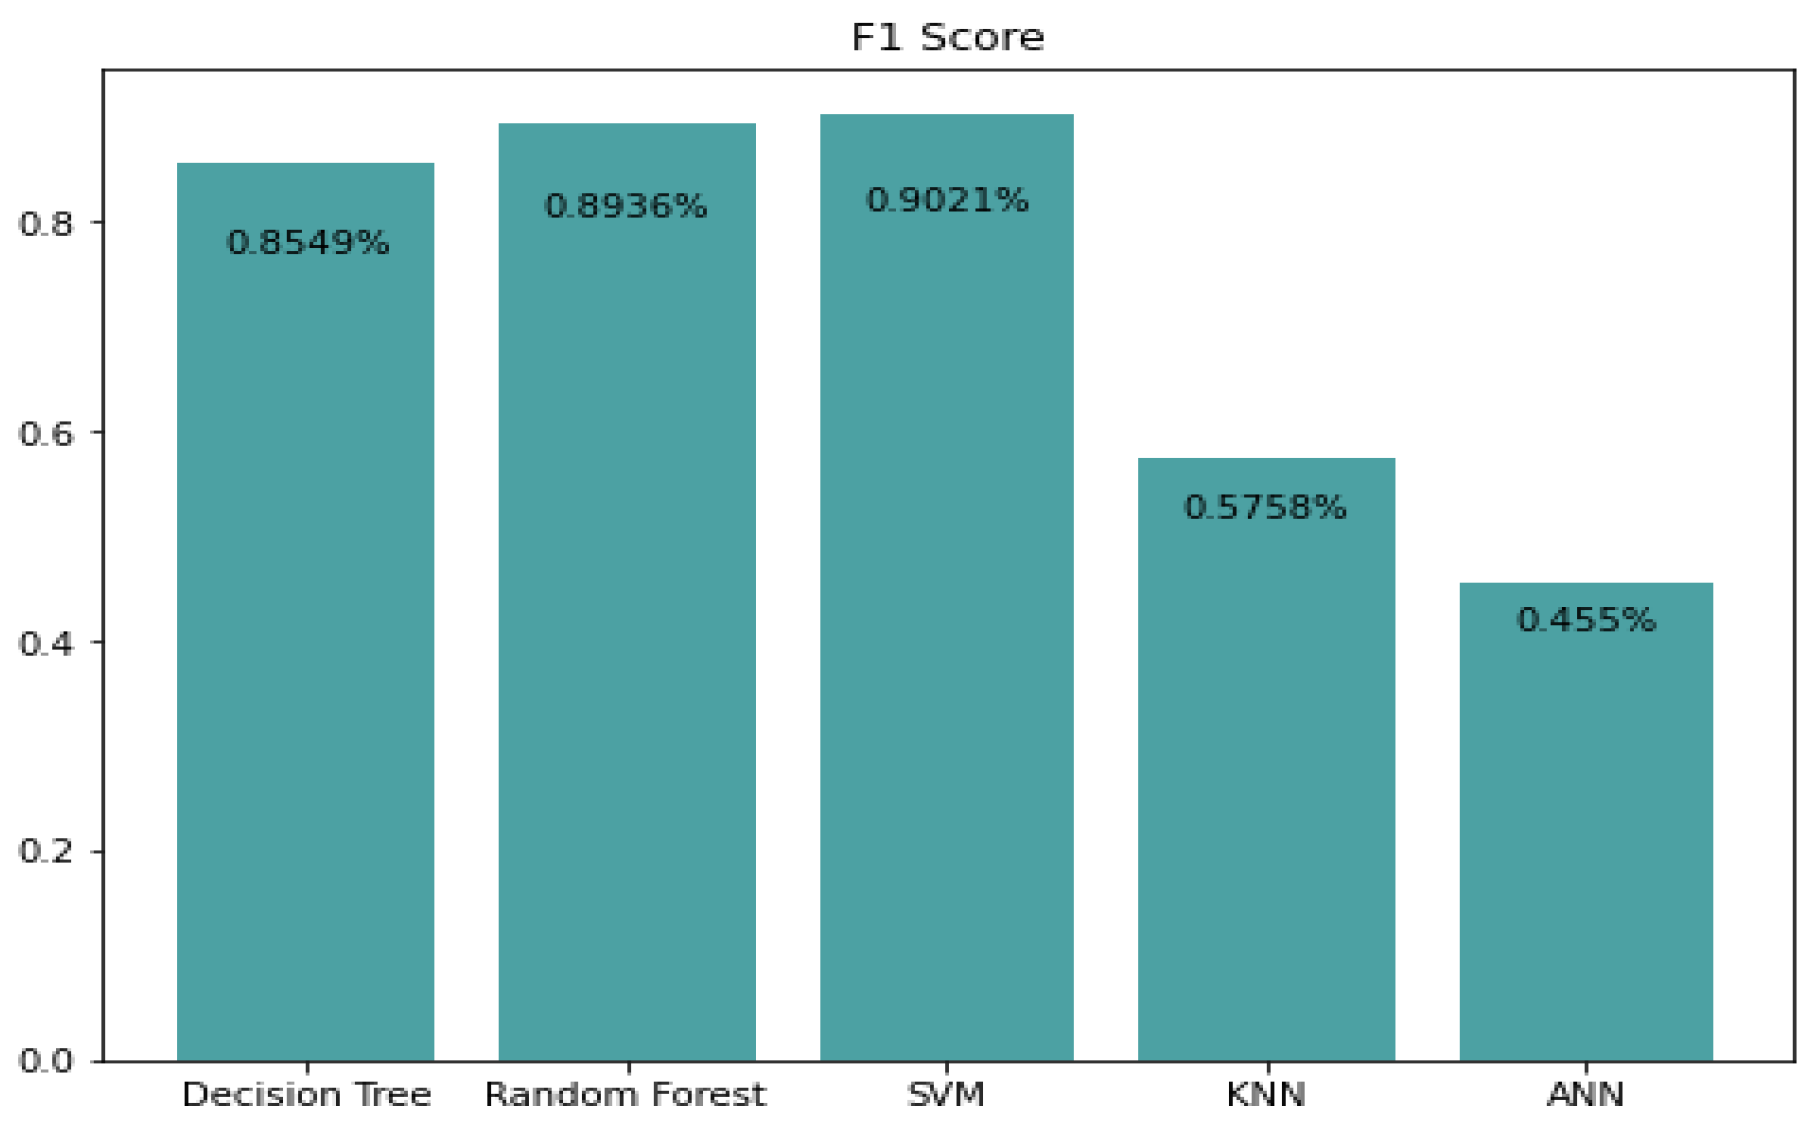
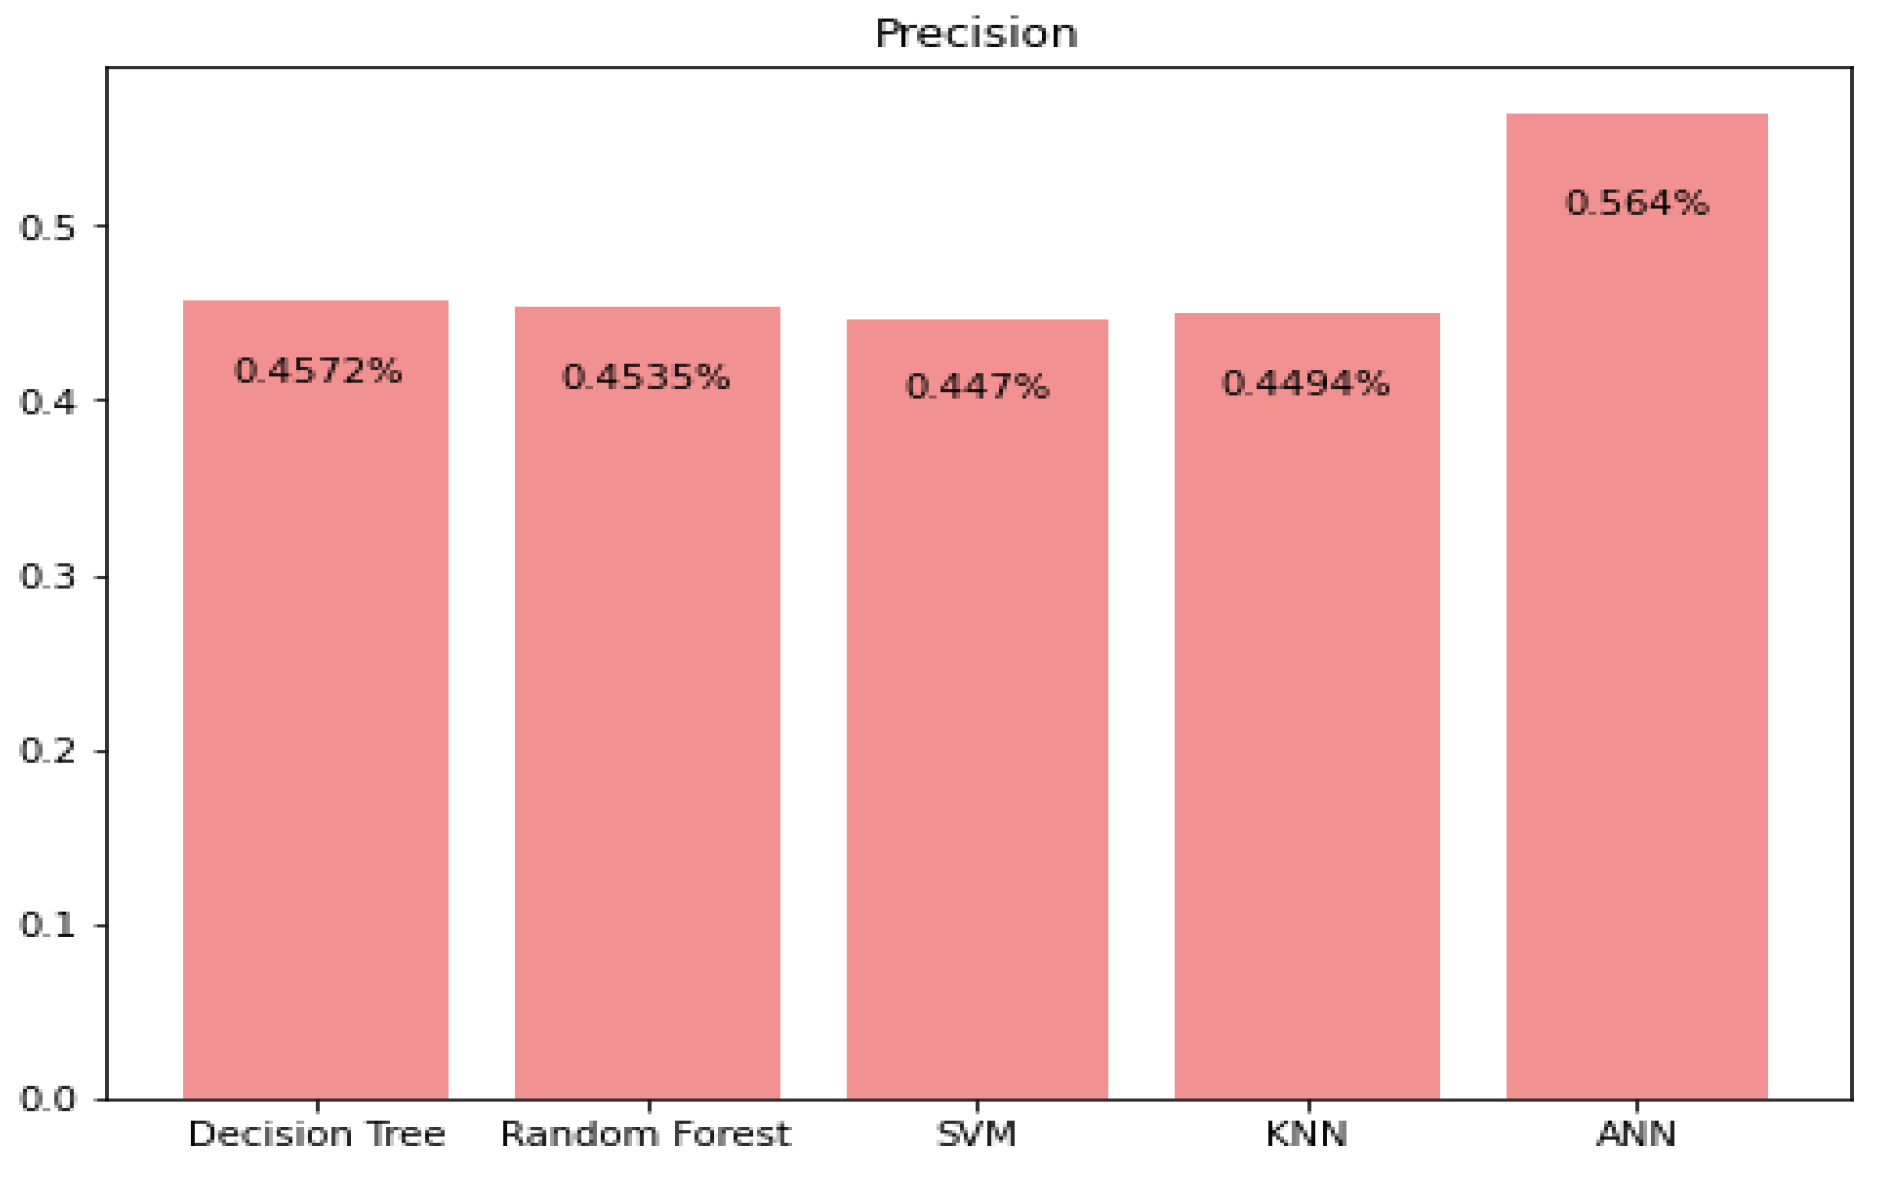
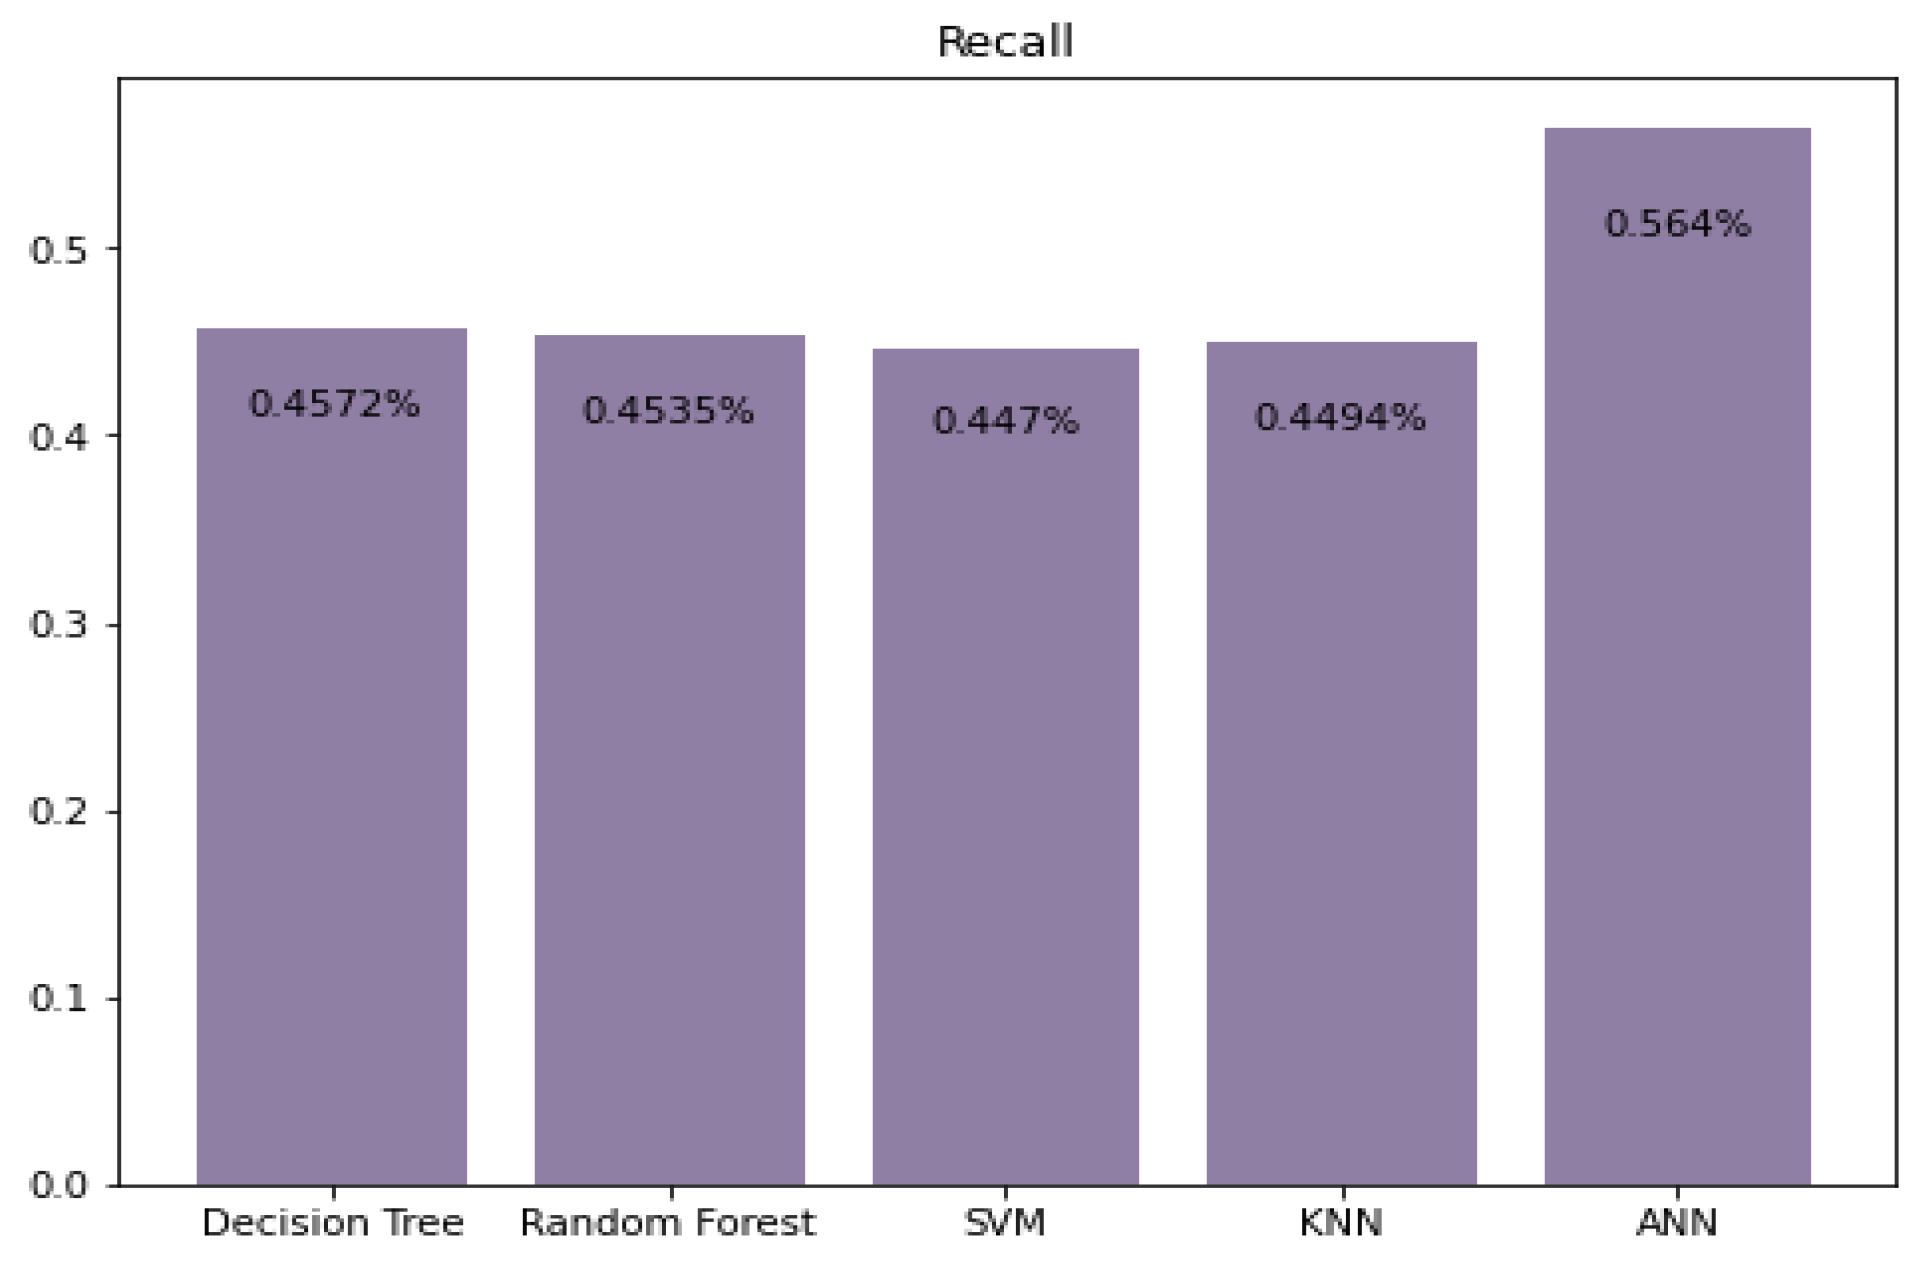
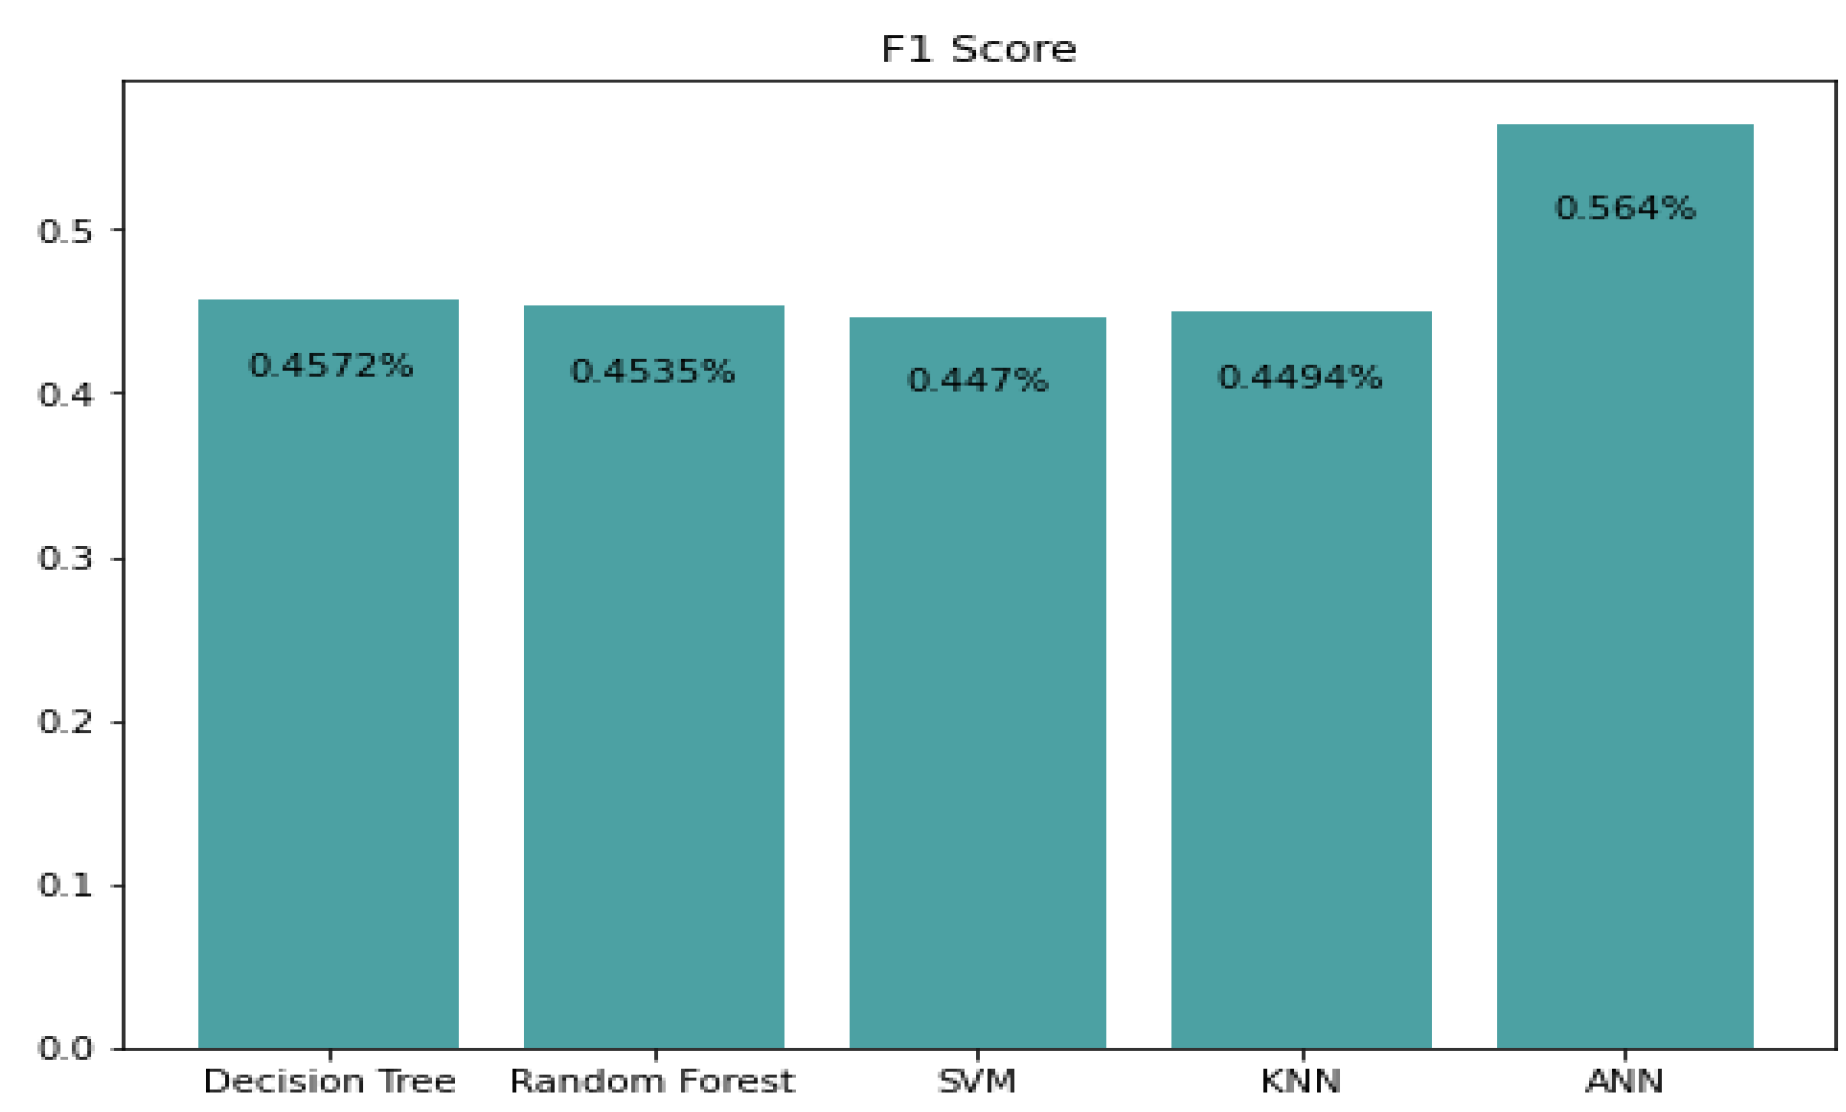
5.1. Precision, Recall, and F1 Score Prediction

In this section, the dataset was tested on precision, recall, and F1 measure (F1 Score). While testing the trained model on a random dataset, the results of SVM show around 90.21% precision, which is the best among all; however, ANN shows the worst precision of 45.5%. All of them (precision, recall, F1 measure) performed equally and predicted the same results, as shown in Figure 4, Figure 5 and Figure 6, respectively. The result of all the testing matrix are the same because scikit-learn metrics were used in this study for micro-averaging.
While using a date-wise dataset in this study (80% data from beginning dates and 20% data from end dates), precision, recall, and F1 score perform equally well on all the trained models. However, the results obtained from the artificial neural network (ANN) are the best, while the random tree gave the worst results, although the difference is very slight. Results are shown in Figure 7, Figure 8 and Figure 9.

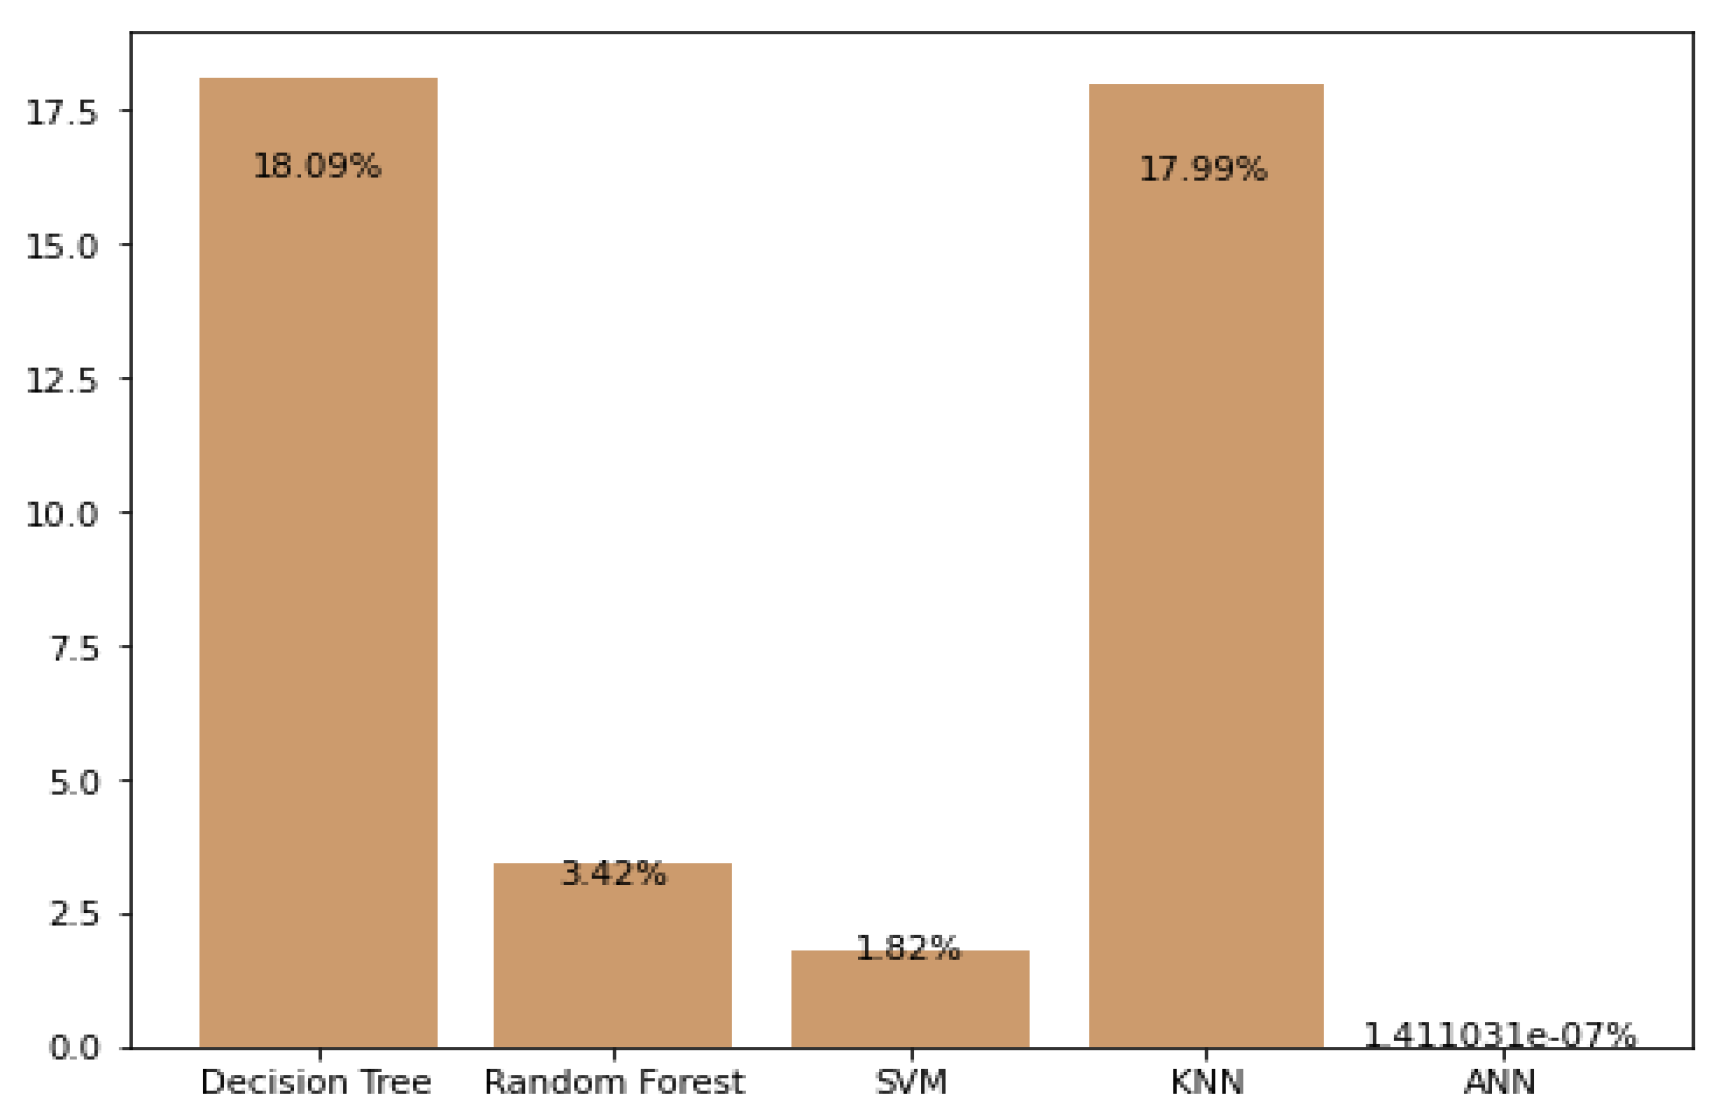
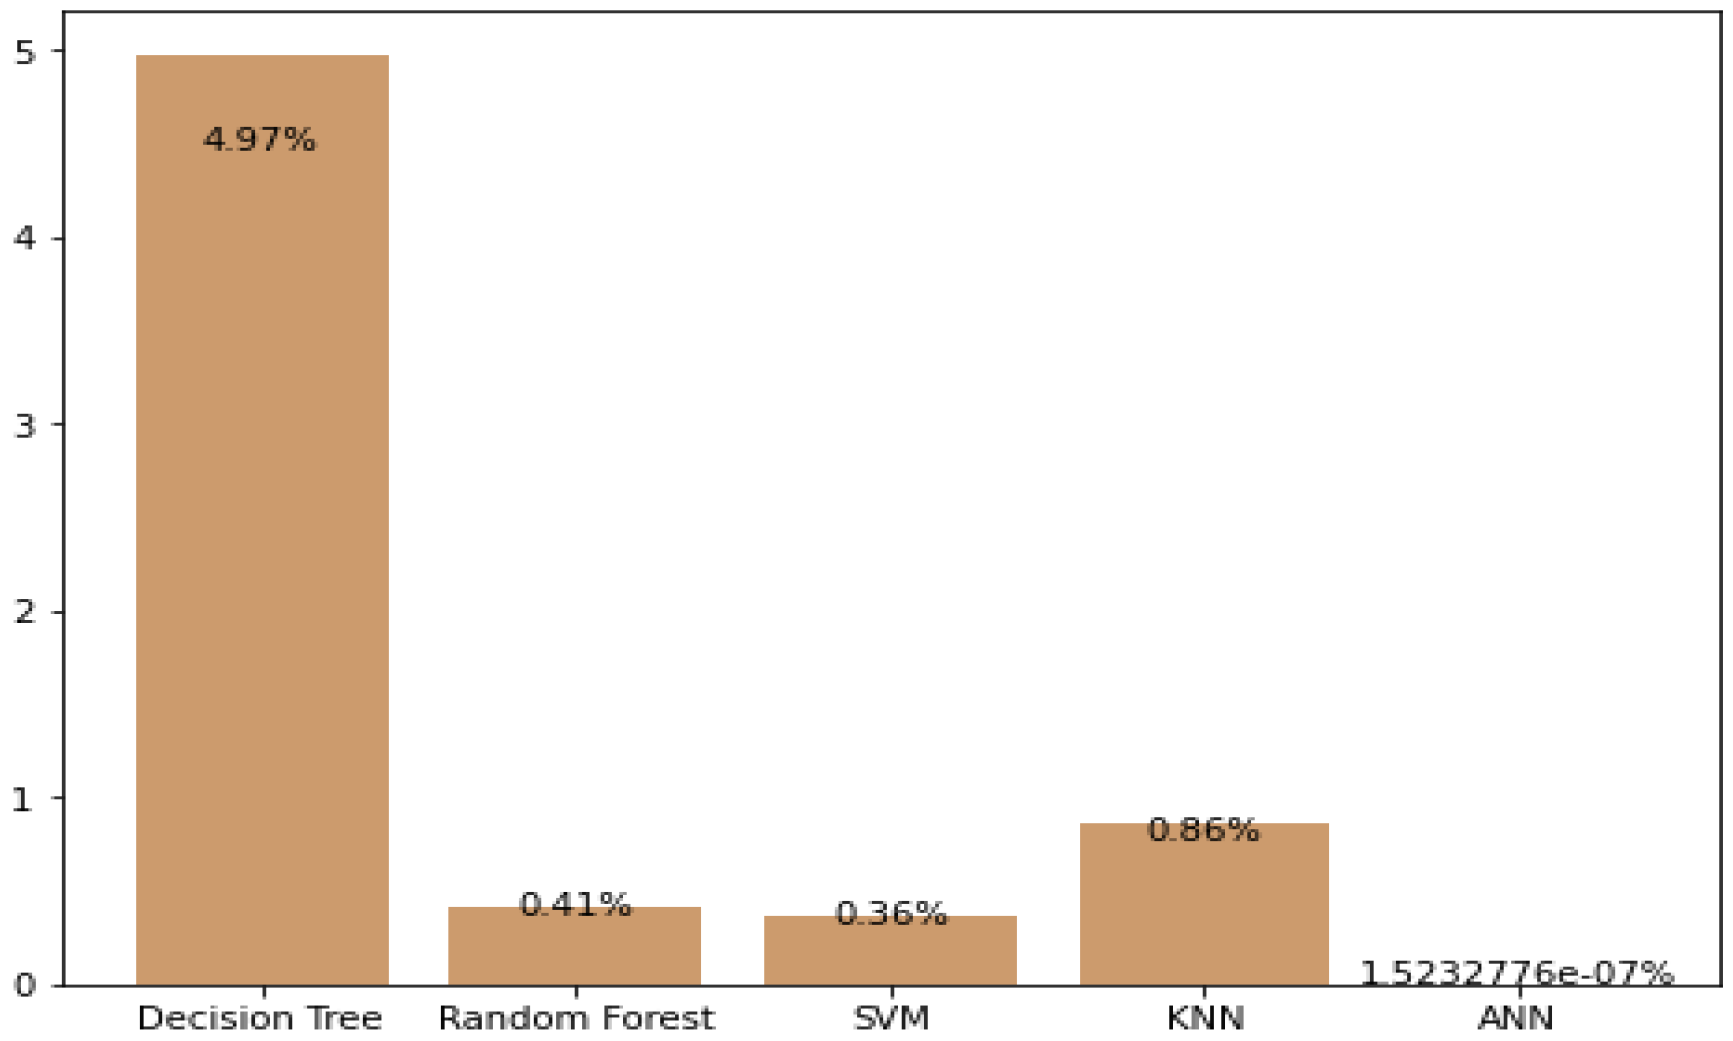
5.2. Prediction Using Logarithmic Loss

In this section, predictions were made using the logarithmic loss parameter on the testing trained module. Both forms of data, e.g., the random dataset and the date-wise dataset, were used. These results are shown in Figure 10 and Figure 11, respectively.
While using a date-wise dataset, the decision tree has the worst prediction loss of 4.97% and, according to random dataset, the results had also quite similar and decision tree showed the 18.09% loss. While in random dataset KNN has also 17.99% prediction loss. At the same time, ANN showed minimal accuracy in both datasets, which is approximately zero. Hence, in terms of logarithmic loss, ANN has the minimum loss because the interpretation of logarithmic loss is minimal. Hence, lesser the loss will show the better results, while a bigger loss will show bad results. Whereas, the accuracy of the date-wise dataset in the logarithmic loss testing parameter shows the best results collectively.

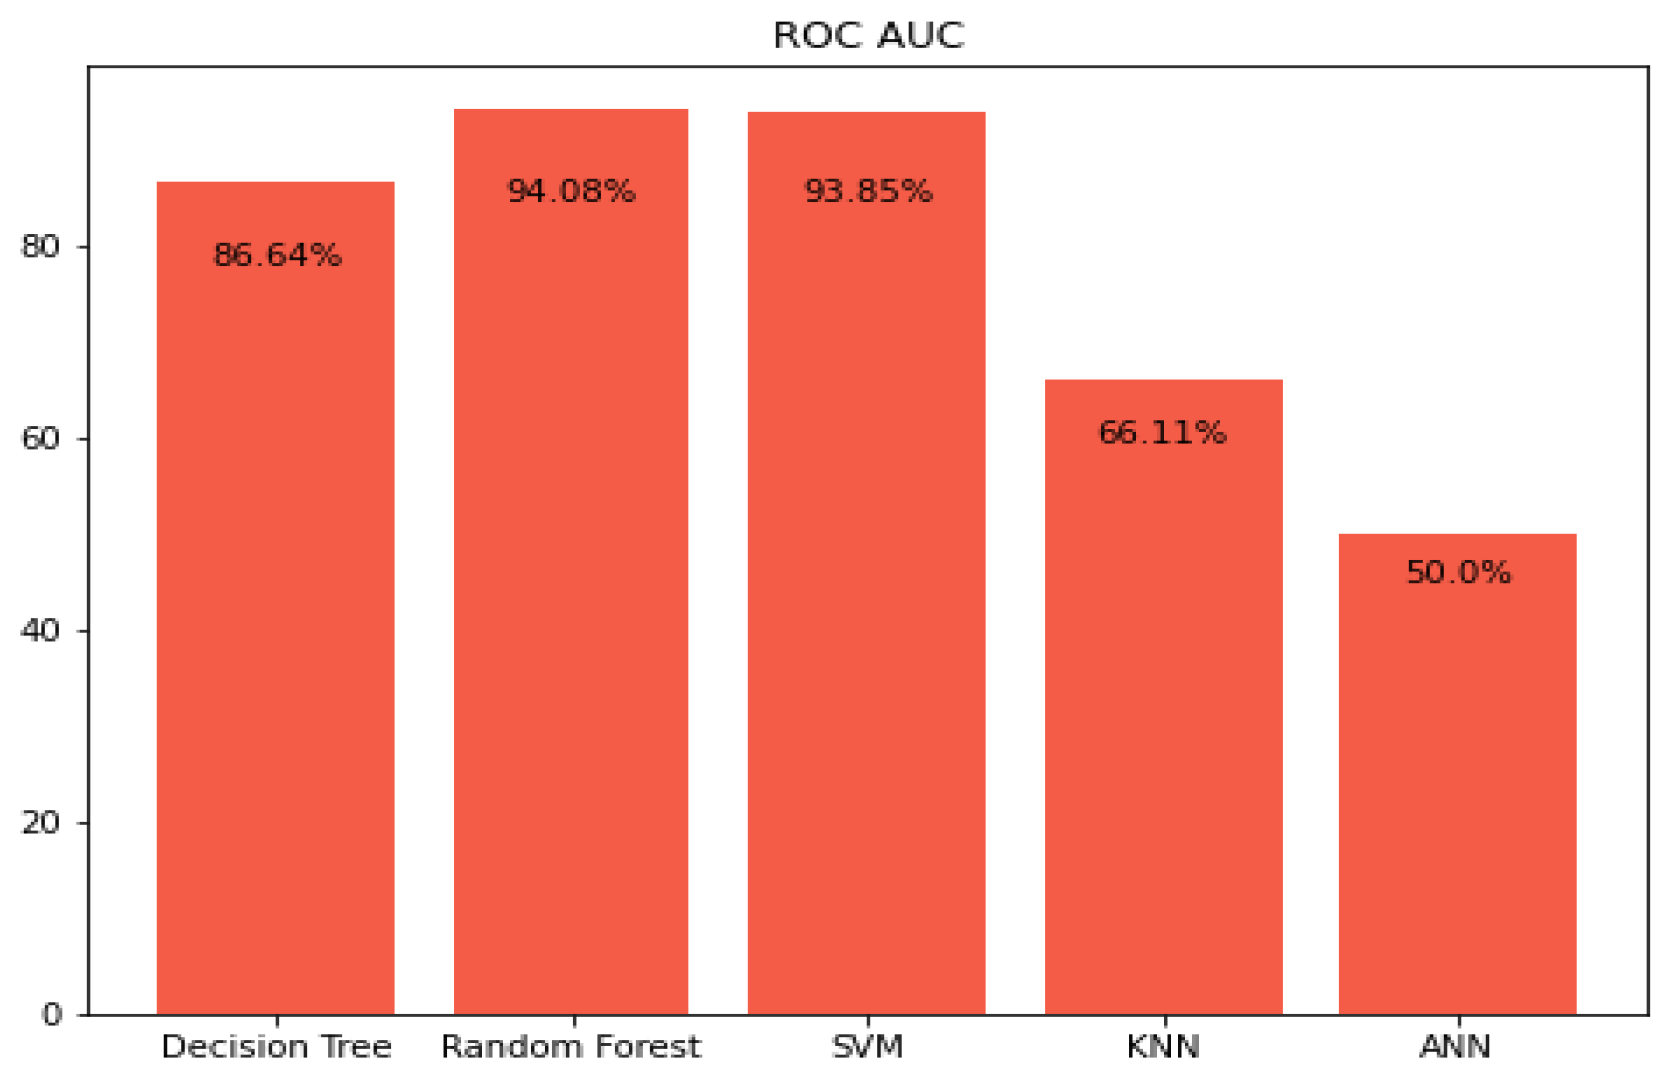
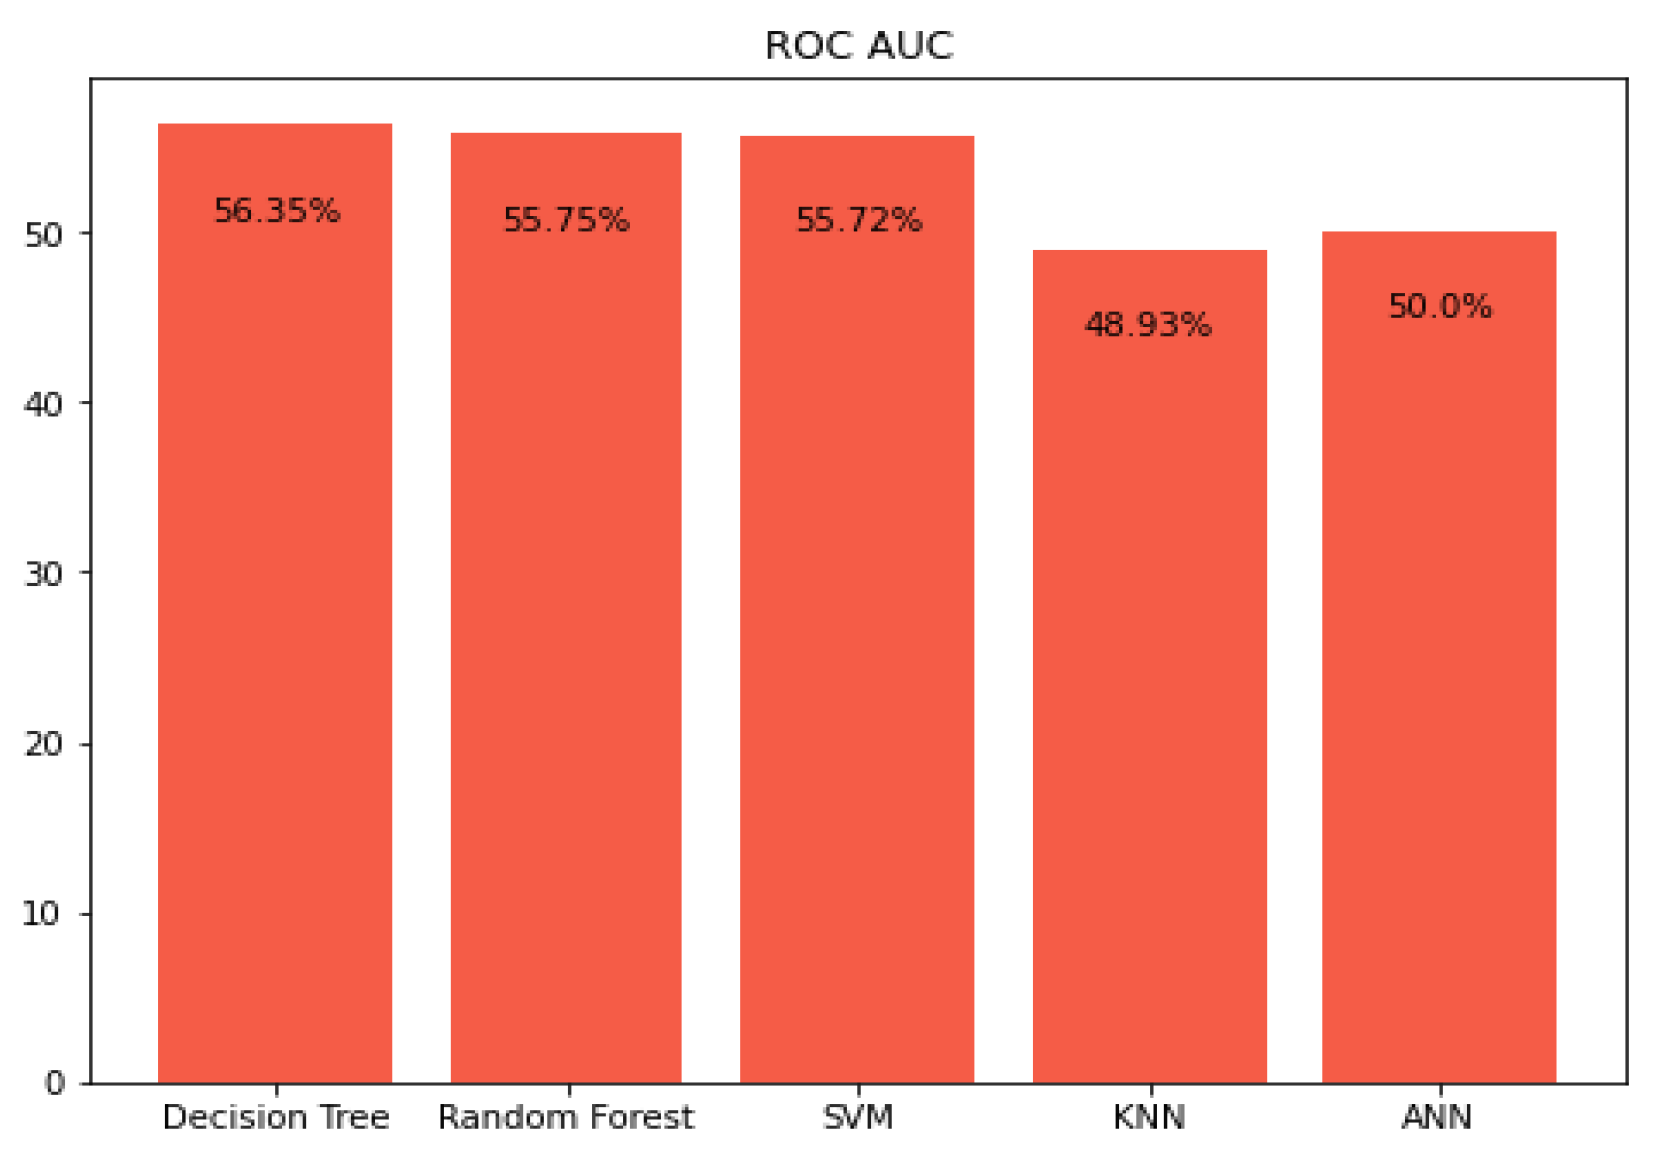
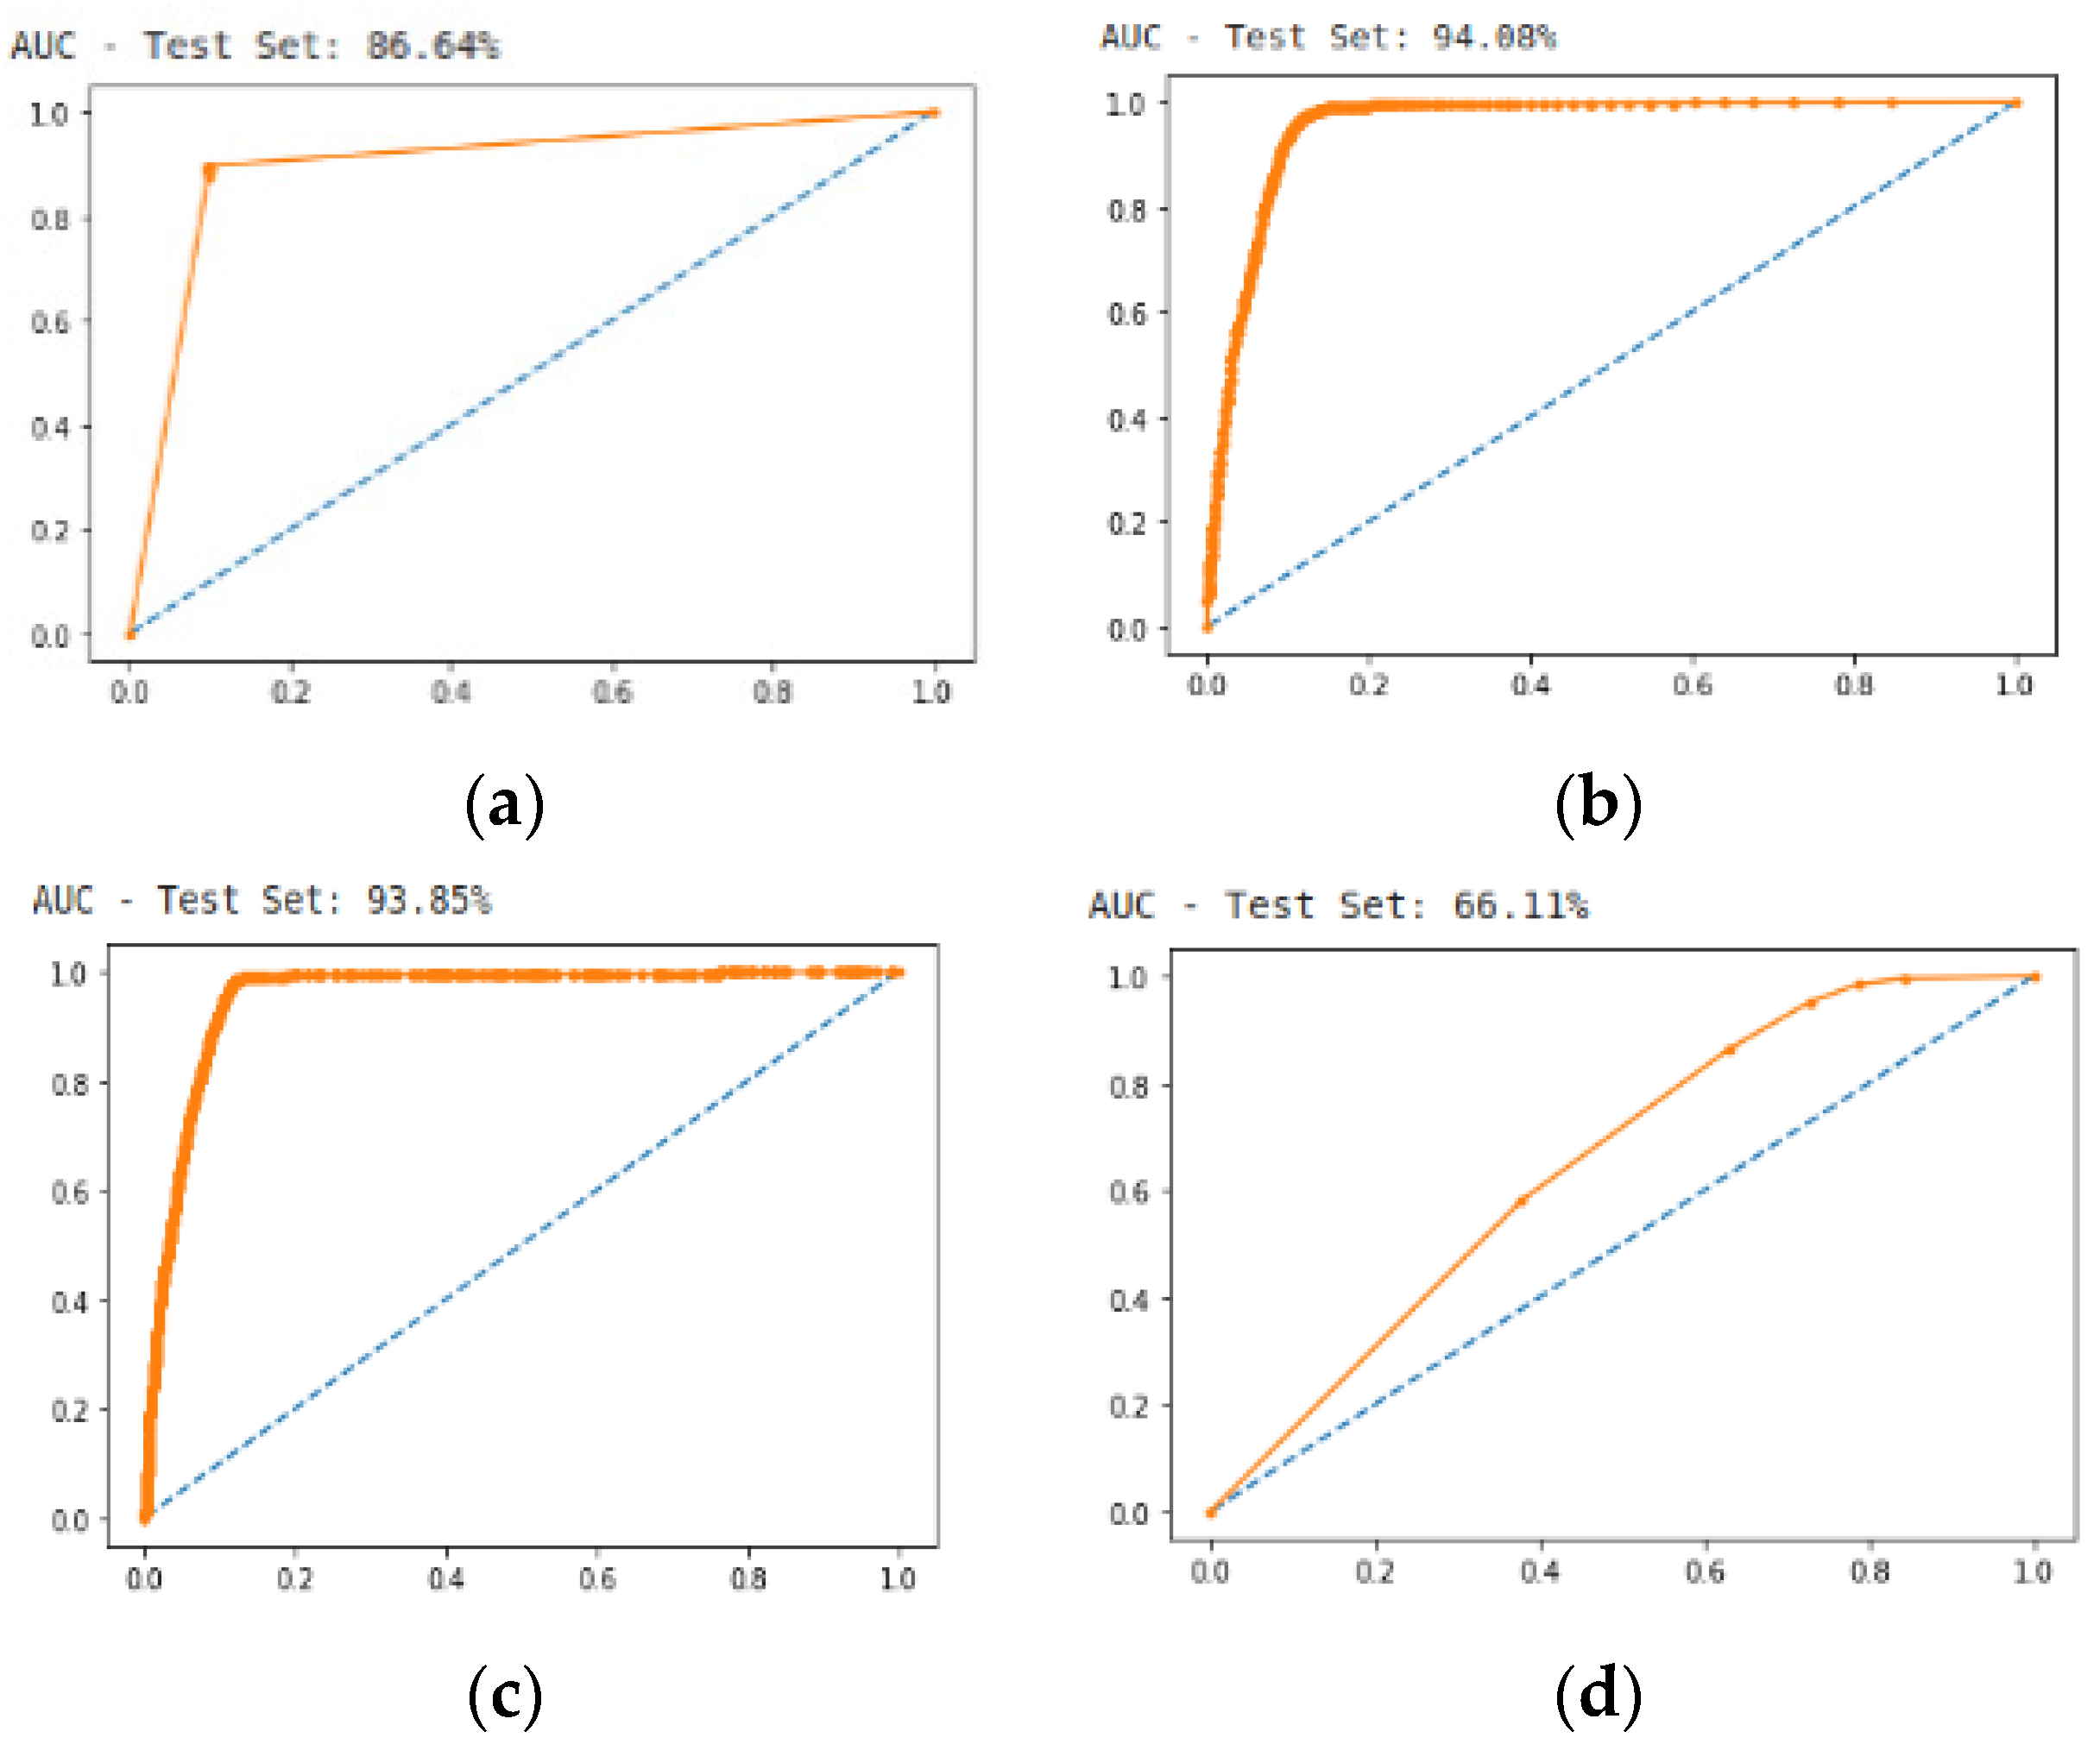
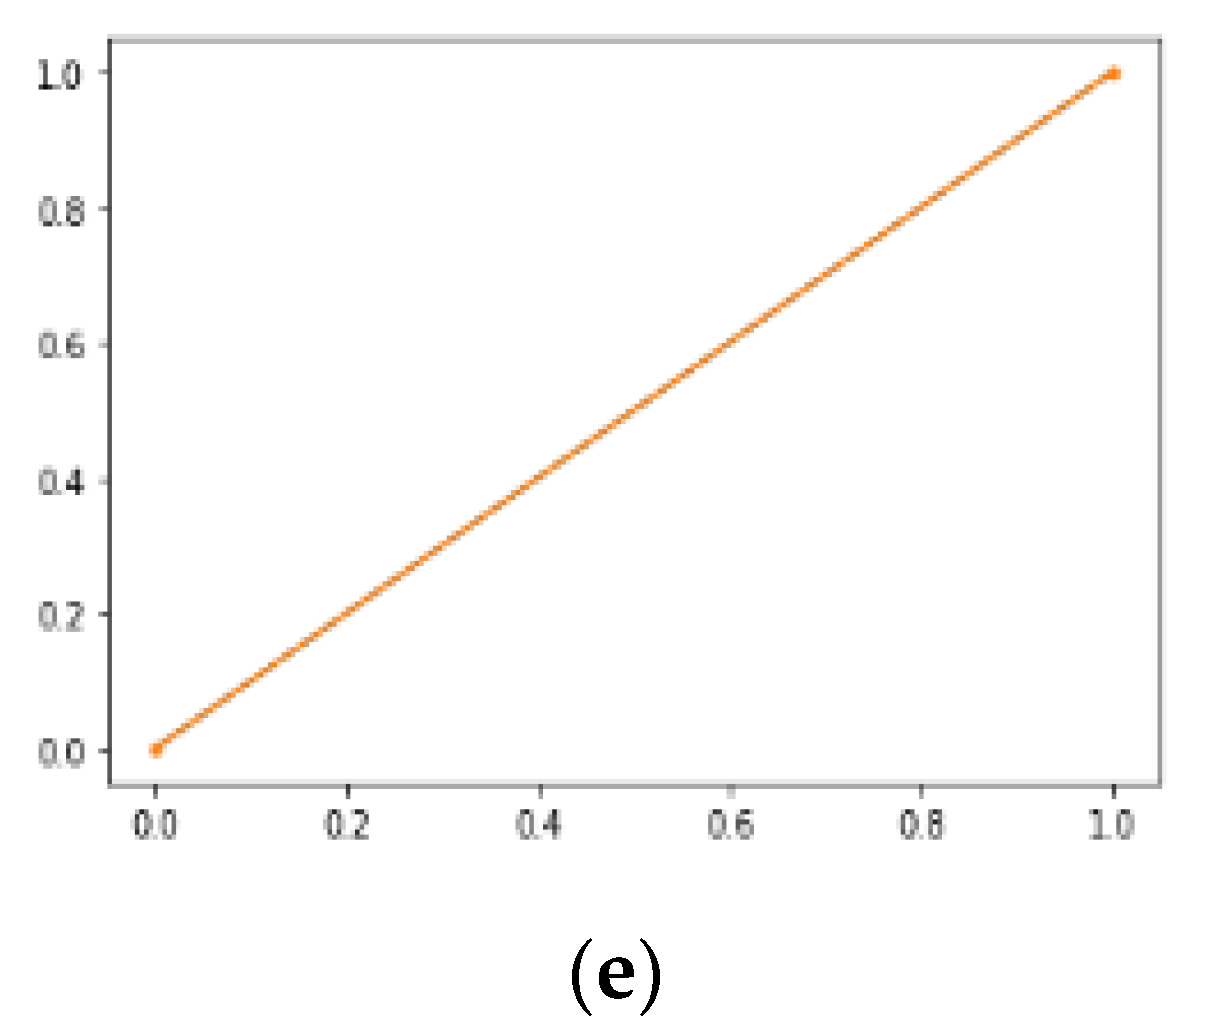
5.3. Prediction Using Area under the Curve ROC-AUC

In this section of ROC-AUC prediction, the results show that random forest has the best outcome on a random dataset of 94.08%, while KNN shows the worst trend of 66.11%. Result comparison can be seen in Figure 12.
While using a date-wise dataset of feedbacks, the decision tree had the best result, although there was not much deviation among the decision tree, random tree, and SVM classifiers. The ANN shows the worst tendency of 50.00% accuracy in Figure 12 with a random dataset, while Figure 13 KNN shows the worst tendency of 48.93% accuracy with the date-wise dataset. Like the logarithmic loss, the ROC-AUC accuracy of the random dataset shows better results instead of the date-wise dataset.
The ROC-AUC curve of the random dataset is shown in Figure 14, while the ROC-AUC curve of the time series dataset is shown in Figure 15.
However, the results of the KNN classifier are not good enough for the time-series dataset when tested under ROC-AUC. Hence, implementation of the voting classifier on the result of all the evaluation parameters (precision, recall, accuracy, and F1 score) shows that the result accuracy with a random dataset is 89.9%, while the result accuracy of the date-wise dataset is 45.7%. So, the pictorial representation of the dataset that has been shown in Figure 16 shows that the number of vaccinations has increased, which is also directly proportional to the implementation of the random dataset. Hence, it can be said that this proposed system has quite good outcomes with these classifiers and workflow. Figure 16 shows the presentation of Table 2, where it can be seen that the people are getting vaccinated rapidly in different countries, and where the intention towards the vaccine is increasing day by day. The trend in Figure 16 shows that the results of this study are pretty much aligned with the current number of the vaccinated people.

6. Conclusions

COVID-19 has been spread rapidly all over the globe. In this pandemic, the COVID-19 vaccination can be considered as a safe corner to save a human life and to avoid deaths and infections from COVID-19[37]. Different research has been made on the COVID-19 vaccination since the vaccination was introduced. For future prediction, different techniques may be helpful with different approaches to predict the results of this vaccination [38,39]. The goal of this study is to predict the trend of the people towards the COVID-19 vaccinations, besides different myths and side effects of vaccination on health. The used dataset contains a huge number of tweets of people which may belong to a different school of thoughts. For this purpose, different classifiers, e.g., a support vector machine, decision tree, random forest, K-nearest neighbor, and an artificial neural network, were used to train a dataset. After that, the trained module was tested to find out the precision, recall, F1 measure, logarithmic loss, and area under the curve. Then, the results of all the evaluation matrices were tested with a voting classifier to identify the aggregate of all the results and to find out the best among both datasets. As a consequence, the proposed system shows a better result on the random dataset with the voting classifier, as it produced 89.9% accuracy score. The date-wise data-set, has been showed 45.7% accuracy score. The results of this study are more promising and encouraging for the random dataset. While the overall results with the given dataset shows that there is a positive trend of people towards the vaccination, there are still people who are apprehensive towards the vaccination because of different myths and risks or any other health concerns. Moreover, this proposed system may be used with different a dataset to predict the impact on different challenging fields, e.g., employee’s satisfaction, student feedback, trends towards newly introduced products, and many other areas. The authors aim to enhance this work in the future by using more efficient classifiers with effective techniques to implement on real-time prediction.

Author Contributions

Conceptualization, S.A.J.Z.; methodology, S.A.J.Z. and S.B.B.; investigation, S.B.B.; data curation, S.T.; experimentation, S.T.; writing original draft, S.A.J.Z.; writing review and editing, S.B.B. All authors have read and agreed to the published version of the manuscript.

Funding

This research received no external funding.

Institutional Review Board Statement

Not applicable.

Informed Consent Statement

Not applicable.

Data Availability Statement

The data used for experimentation in the study is openly available at https://www.kaggle.com/gpreda/all-covid19-vaccines-tweets (accessed on 8 August 2021).

Acknowledgments

This works is supported by Qatar National Library (QNL). The authors would like to thank QNL for their support.

Conflicts of Interest

The authors declare no conflict of interest.

References

  1. Zhang, J.M.; Harman, M.; Ma, L.; Liu, Y. Machine Learning Testing: Survey, Landscapes and Horizons. Available online: https://doi.org/10.1109/tse.2019.2962027 (accessed on 8 August 2021). [CrossRef] [Green Version]
  2. Bontempi, G.; Ben Taieb, S.; Le Borgne, Y.-A. Machine learning strategies for time series forecasting. In Proceedings of the European Business Intelligence Summer School, Brussels, Belgium, 15–21 July 2012; Aufaure, M.A., Zimányi, E., Eds.; Springer: Berlin/Heidelberg, Germany, 2013; pp. 62–77. [Google Scholar] [CrossRef]
  3. Makridakis, S.; Spiliotis, E.; Assimakopoulos, V. Statistical and machine learning forecasting methods: Concerns and ways forward. PLoS ONE 2018, 13, e0194889. [Google Scholar] [CrossRef] [PubMed] [Green Version]
  4. Tigga, N.P.; Garg, S. Prediction of type 2 diabetes using machine learning classification methods. Procedia Comput. Sci. 2020, 167, 706–716. [Google Scholar] [CrossRef]
  5. Singh, S.N.; Thakral, S. Using data mining tools for breast cancer prediction and analysis. In Proceedings of the 4th International Conference on Computing Communication and Automation (ICCCA), Greater Noida, India, 14–15 December 2018; pp. 1–4. [Google Scholar] [CrossRef]
  6. Omran, N.F.; Ghany, S.F.A.-E.; Saleh, H.; Ali, A.A.; Gumaei, A.; Al-Rakhami, M. Applying deep learning methods on time-series data for forecasting COVID-19 in Egypt, Kuwait, and Saudi Arabia. Complexity 2021, 2021, 6686745. [Google Scholar] [CrossRef]
  7. Zoabi, Y.; Deri-Rozov, S.; Shomron, N. Machine learning-based prediction of COVID-19 diagnosis based on symptoms. NPJ Digit. Med. 2021, 4, 3. [Google Scholar] [CrossRef]
  8. Son, C.; Hegde, S.; Smith, A.; Wang, X.; Sasangohar, F. Effects of COVID-19 on college students’ mental health in the United States: Interview survey study. J. Med. Internet Res. 2020, 22, e21279. [Google Scholar] [CrossRef] [PubMed]
  9. Jean, S.-S.; Lee, P.-I.; Hsueh, P.-R. Treatment options for COVID-19: The reality and challenges. J. Microbiol. Immunol. Infect. 2020, 53, 436–443. [Google Scholar] [CrossRef] [PubMed]
  10. Edwards, B.; Biddle, N.; Gray, M.; Sollis, K. COVID-19 vaccine hesitancy and resistance: Correlates in a nationally representative longitudinal survey of the Australian population. PLoS ONE 2021, 16, e0248892. [Google Scholar] [CrossRef]
  11. Forni, G.; Mantovani, A. COVID-19 vaccines: Where we stand and challenges ahead. Cell Death Differ. 2021, 28, 626–639. [Google Scholar] [CrossRef]
  12. Kara, M.; Öztürk, Z.; Akpek, S.; Turupcu, A. COVID-19 Diagnosis from chest CT scans: A weakly supervised CNN-LSTM approach. AI 2021, 2, 330–341. [Google Scholar] [CrossRef]
  13. Villavicencio, C.; Macrohon, J.; Inbaraj, X.; Jeng, J.-H.; Hsieh, J.-G. COVID-19 Prediction applying supervised machine learning algorithms with comparative analysis using WEKA. Algorithms 2021, 14, 201. [Google Scholar] [CrossRef]
  14. Hussain, A.A.; Bouachir, O.; Al-Turjman, F.; Aloqaily, M. Notice of Retraction: AI Techniques for COVID-19. IEEE Access 2020, 8, 128776–128795. [Google Scholar] [CrossRef]
  15. Nistal, R.; de la Sen, M.; Gabirondo, J.; Alonso-Quesada, S.; Garrido, A.; Garrido, I. A Study on COVID-19 Incidence in Europe through Two SEIR Epidemic Models Which Consider Mixed Contagions from Asymptomatic and Symptomatic Individuals. Appl. Sci. 2021, 11, 6266. [Google Scholar] [CrossRef]
  16. All COVID-19 Vaccines Tweets. 2021. Available online: https://www.kaggle.com/gpreda/all-covid19-vaccines-tweets (accessed on 24 April 2021).
  17. COVID-19 World Vaccination Progress. 2021. Available online: https://www.kaggle.com/gpreda/covid-world-vaccination-progress (accessed on 24 April 2021).
  18. Maxwell, A.E.; Warner, T.A.; Fang, F. Implementation of machine-learning classification in remote sensing: An applied review. Int. J. Remote Sens. 2018, 39, 2784–2817. [Google Scholar] [CrossRef] [Green Version]
  19. Kulkarni, Y.V.; Sinha, P.K. Effective Learning and Classification Using Random Forest Algorithm. Available online: https://shodhganga.inflibnet.ac.in/handle/10603/125758. (accessed on 8 August 2021).
  20. Liu, Y.; Wang, Y.; Zhang, J. New machine learning algorithm: Random forest. In Information Computing and Applications. ICI-CA 2012; Lecture Notes in Computer Science; Liu, B., Ma, M., Chang, J., Eds.; Springer: Berlin/Heidelberg, Germany, 2012; Volume 7473, pp. 246–252. [Google Scholar] [CrossRef]
  21. Kausar, N.; Samir, B.B.; Abdullah, A.; Ahmad, I.; Hussain, M. A Review of classification approaches using support vector machine in intrusion detection. In Informatics Engineering and Information Science. ICIEIS 2011. Communications in Computer and Information Science; Abd Manaf, A., Sahibuddin, S., Ahmad, R., Mohd Daud, S., El-Qawasmeh, E., Eds.; Springer: Berlin/Heidelberg, Germany, 2011; Volume 253, pp. 24–34. [Google Scholar] [CrossRef]
  22. Song, Y.-Y.; Lu, Y. Decision tree methods: Applications for classification and prediction. Shanghai Arch. Psychiatry 2015, 27, 130–135. [Google Scholar] [CrossRef]
  23. Sun, B.; Du, J.; Gao, T. Study on the improvement of K-nearest-neighbor algorithm. In Proceedings of the 2009 International Conference on Artificial Intelligence and Computational Intelligence, Shanghai, China, 7–8 November 2009; Volume 4, pp. 390–393. [Google Scholar] [CrossRef]
  24. Guo, G.; Wang, H.; Bell, D.; Bi, Y.; Greer, K. KNN model-based approach in classification. In On the Move to Meaningful Internet Systems 2003: CoopIS, DOA, and ODBASE. OTM 2003; Meersman, R., Tari, Z., Schmidt, D.C., Eds.; Lecture Notes in Computer Science; Springer: Berlin/Heidelberg, Germany, 2003; Volume 2888, pp. 986–996. [Google Scholar] [CrossRef]
  25. Wang, S.-C. Artificial neural network. In Interdisciplinary Computing in Java Programming; The Springer International Series in Engineering and Computer Science; Springer: Boston, MA, USA, 2003; Volume 743, pp. 81–100. [Google Scholar] [CrossRef]
  26. Rahman, A.S.A.; Belhaouari, S.B.; Bouzerdoum, A.; Baali, H.; Alam, T.; Eldaraa, A.M. Breast mass tumor classification using deep learning. In Proceedings of the IEEE International Conference on Informatics, IoT, and Enabling Technologies (ICIoT), Doha, Qatar, 2–5 February 2020; pp. 271–276. [Google Scholar] [CrossRef]
  27. Zaidi, S.A.J.; Buriro, A.; Riaz, M.; Mahoob, A. Implementation and comparison of text-based image retrieval schemes. Int. J. Adv. Comput. Sci. Appl. 2019, 10, 611–618. [Google Scholar] [CrossRef]
  28. Rolls, E.T. The storage and recall of memories in the hippocampo-cortical system. Cell Tissue Res. 2018, 373, 577–604. [Google Scholar] [CrossRef] [PubMed] [Green Version]
  29. Chicco, D.; Jurman, G. The advantages of the Matthews correlation coefficient (MCC) over F1 score and accuracy in binary classification evaluation. BMC Genom. 2020, 21, 6. [Google Scholar] [CrossRef] [PubMed] [Green Version]
  30. Wang, Q.; Ma, Y.; Zhao, K.; Tian, Y. A Comprehensive Survey of Loss Functions in Machine Learning. Available online: https://doi.org/10.1007/s40745-020-00253-5 (accessed on 8 August 2021). [CrossRef]
  31. Pruessner, J.C.; Kirschbaum, C.; Meinlschmid, G.; Hellhammer, D.H. Two formulas for computation of the area under the curve represent measures of total hormone concentration versus time-dependent change. Psychoneuroendocrinology 2003, 28, 916–931. [Google Scholar] [CrossRef]
  32. Li, L.; Greene, T.; Hu, B. A simple method to estimate the time-dependent receiver operating characteristic curve and the area under the curve with right censored data. Stat. Methods Med. Res. 2016, 27, 2264–2278. [Google Scholar] [CrossRef]
  33. Kumar, U.K.; Nikhil, M.S.; Sumangali, K. Prediction of breast cancer using voting classifier technique. In Proceedings of the IEEE International Conference on Smart Technologies and Management for Computing, Communication, Controls, Energy and Materials (ICSTM), Chennia, India, 2–4 August 2017; pp. 108–114. [Google Scholar] [CrossRef]
  34. Samuel, J.; Ali, G.; Rahman, M.; Esawi, E.; Samuel, Y. COVID-19 Public sentiment insights and machine learning for tweets classification. Information 2020, 11, 314. [Google Scholar] [CrossRef]
  35. Levashenko, V.; Rabcan, J.; Zaitseva, E. Reliability evaluation of the factors that influenced COVID-19 patients’ condition. Appl. Sci. 2021, 11, 2589. [Google Scholar] [CrossRef]
  36. Iqbal, M.J.; Faye, I.; Said, A.M.; Samir, B.B. Data Mining of Protein Sequences with Amino Acid Position-Based Feature Encoding Technique. In Proceedings of the First International Conference on Advanced Data and Information Engineering (DaEng-2013); Herawan, T., Deris, M., Abawajy, J., Eds.; Springer: Singapore, 2014; Volume 285. [Google Scholar] [CrossRef]
  37. Sallahi, N.; Park, H.; El Mellouhi, F.; Rachdi, M.; Ouassou, I.; Belhaouari, S.; Arredouani, A.; Bensmail, H. Using unstated cases to correct for COVID-19 pandemic outbreak and its impact on easing the intervention for Qatar. Biology 2021, 10, 463. [Google Scholar] [CrossRef] [PubMed]
  38. El-Harbawi, M.; Samir, B.B.; Babaa, M.-R.; Mutalib, M.I.A. A new QSPR model for predicting the densities of ionic liquids. Arab. J. Sci. Eng. 2014, 39, 6767–6775. [Google Scholar] [CrossRef]
  39. Mehboob, S.; Zaidi, S.A.; Rizwan, M.; Dilshad, U.; Lashari, N.; Adeel, M.; Sanwal, G. Sentiment base emotions classification of celebrity tweets by using R language. Pak. J. Eng. Technol. 2020, 3, 95–99. [Google Scholar]
Figure 1. Population of different countries that have been vaccinated to date (at least one dose).
Data 06 00112 g001
Figure 2. ROC-AUC curve.
Data 06 00112 g002
Figure 3. Workflow of Research.
Data 06 00112 g003
Figure 4. Precision comparison of different trained models using the random dataset.
Data 06 00112 g004
Figure 5. Recall comparison of different trained models using the random dataset.
Data 06 00112 g005
Figure 6. F1 score comparison of different trained models using the random dataset.
Data 06 00112 g006
Figure 7. Precision comparison of different trained models using the date-wise dataset.
Data 06 00112 g007
Figure 8. Recall comparison of different trained models using the date-wise dataset.
Data 06 00112 g008
Figure 9. F1 score comparison of different trained models using the date-wise dataset.
Data 06 00112 g009
Figure 10. Logarithm loss comparison of different trained models using the random dataset.
Data 06 00112 g010
Figure 11. Logarithm loss comparison of different trained models using the date-wise dataset.
Data 06 00112 g011
Figure 12. ROC-AUC accuracy comparison of different trained models using the random dataset.
Data 06 00112 g012
Figure 13. ROC-AUC accuracy comparison of different trained models using date-wise dataset.
Data 06 00112 g013
Figure 14. Area under the curve tested on different classifier using the random dataset. (a) Decision tree; (b) random forest; (c) a support vector machine; (d) K-nearest neighbor; (e) an artificial neural network.
Data 06 00112 g014aData 06 00112 g014b
Figure 15. Area under the curve tested on different classifier using the date-wise dataset. (a) Decision tree; (b) random forest; (c) a support vector machine; (d) K-nearest neighbor; (e) an artificial neural network.
Data 06 00112 g015
Figure 16. Percentage of COVID-19 vaccinated people since invention, fetched from the dataset shown in Table 2.
Data 06 00112 g016
Table 1. Feedback (Tweets) on the COVID-19 vaccine from people around the world.
DateSample Tweets (Feedback about Vaccination)
12/20/2020same folks said daikon paste could treat a cytokine storm #PfizerBioNTech
12/13/2020While the world has been on the wrong side of history this year, hopefully, the biggest vaccination effort we’ve ev…
12/12/2020#coronavirus #SputnikV #AstraZeneca #PfizerBioNTech #Moderna #Covid_19 Russian vaccine is created to last 2–4 years…
12/12/2020Facts are immutable, Senator, even when you’re not ethically sturdy enough to acknowledge them. (1) You were born i…
12/12/2020Explain to me again why we need a vaccine @BorisJohnson @MattHancock #whereareallthesickpeople #PfizerBioNTech…
12/20/2020Same folks said daikon paste could treat a cytokine storm #PfizerBioNTech
12/13/2020While the world has been on the wrong side of history this year, hopefully, the biggest vaccination effort we’ve ev…
12/12/2020#coronavirus #SputnikV #AstraZeneca #PfizerBioNTech #Moderna #Covid_19 Russian vaccine is created to last 2–4 years…
…………..
…………..
4/8/2021@Reuters EMBARRASING Moscow Russia everything is open business as usual. Ontario reporting 3215 cases of #COVID19 1…
4/8/2021#Germany is negotiating with #Russia to purchase the #SputnikV #vaccine.
Table 2. Country-wise data of the COVID-19 vaccination and total recoveries.
CountryDateDaily VaccineDaily Recoveries
USA3/22/2021126,509,73682,772,416
India3/22/202148,494,59440,631,153
Brazil3/5/202110,169,1607,701,146
Russia3/3/20215,489,3424,287,423
Italy2/14/20213,055,5921,743,683
Iran3/27/2021103,006103,006
Portugal3/27/20211,598,9881,107,360
Pakistan>3/27/202126,471120
China3/21/20211,818,2861263
Malaysia3/22/2021452,919581
Indonesia3/26/202110,412,8247,179,014
Publisher’s Note: MDPI stays neutral with regard to jurisdictional claims in published maps and institutional affiliations.

