1. Summary
Adapting to social conventions is an unavoidable requirement for the acceptance of assistive and social robots. While the scientific community broadly accepts that assistive robots and social robot companions are unlikely to have widespread use in the near future, their presence in health-care and other medium-sized institutions is becoming a reality. These robots will have a beneficial impact in industry (see [
1,
2]) and other fields such as health care (see [
3,
4]). The growing number of research contributions to social navigation is also indicative of the importance of the topic. To foster the future prevalence of these robots, they must be useful, but also socially accepted. As first proposed by [
5] and later by [
6,
7], robots should navigate politely, actively asking for permission or collaboration when necessary. The first step to be able to actively ask for collaboration or permission is to estimate whether the robot would make people feel uncomfortable otherwise, and that is precisely the goal of algorithms estimating social navigation compliance. Some approaches provide analytic models, whereas others use machine learning techniques such as neural networks (see [
8]). Regardless of the approach followed, modelling social conventions is very challenging. Firstly, because the problem itself is subjective. Secondly, because of the variables involved, whose number and weight is undetermined and changing. This paper presents and describes SocNav1, a dataset for social navigation conventions. The aims of SocNav1 are two-fold: (a) enabling comparison of the algorithms that robots use to assess the convenience of their presence in a particular position when navigating; (b) providing a sufficient amount of data so that modern machine learning algorithms such as deep neural networks can be used. Because of the structured nature of the data, SocNav1 is particularly well-suited to be used to benchmark non-Euclidean machine learning algorithms such as graph neural networks (see [
9,
10]).
There are many different factors that influence robot social acceptance ([
11]), including visual appearance, interaction skills and an appropriate management of the interaction spaces. The study of how humans manage their interaction distances with other people is called proxemics ([
12]). Multiple social navigation approaches build on the idea of proxemics to improve robots’ social acceptability in navigation (e.g., [
13,
14]). However, as pointed out by [
11], there are other factors that should be taken into account to avoid disturbing humans, such as human interaction groups, information process spaces or affordance and activity spaces. Some of these concepts have been incorporated in studies where an analytic solution is provided (e.g., [
6,
15]), whereas others follow a machine learning approach (e.g., [
13,
14]). Independently of the nature of its implementation, the importance of social navigation makes key having appropriate datasets, not only for benchmarking but also for learning purposes.
Several public datasets have been used in social navigation. In [
16], authors use the Edinburgh Informatics Forum Pedestrian Database (EIPD) to make a robot learn the behaviour of pedestrians. Another interesting dataset is the one used in [
17], which contains recorded action sequences that correspond to social interactions. The authors use it in a social mapping approach. In [
18], a dataset for public space surveillance task was also made public. It consists of 28 video sequences of 6 different scenarios. Two data sets are also described in [
19] for tracking multiple people. The dataset was acquired from birds-eye and manually annotated.
To the best of our knowledge, the social navigation datasets available in the literature provide data to benchmark and/or learn route estimators based on the behaviour of humans. The first motivation to generate a new dataset is that, especially while the technology readiness level is not high enough, the behaviour that humans expect from robots might be different from the one expected from fellow humans. Generally, humans would expect robots to keep a safer distance in comparison to other humans. Among the possible causes of this phenomena, we can highlight the noise made when robots move, and the apparent unpredictability of their behaviour in comparison to that of humans. The second motivation of the dataset is that SocNav1 aims at evaluating the robots’ ability to assess the level of discomfort that their presence might generate among humans. This ability would be used by robot navigation systems to estimate path costs, but SocNav1 does not directly deal with path costs.
The remainder of the paper is as follows.
Section 2 describes the dataset.
Section 3 describes the methods used to collect data.
Section 4 provides an analysis and validation of the data collected. A discussion on the advantages and limitations of SocNav1 is provided in
Section 5.
2. Data Description
The dataset is composed of four JSON files: three files for training, development and testing, and a fourth file for training with data augmentation. The percentage of samples for the training, development and testing datasets were 88%, 6% and 6% respectively. The split was made to ensure a fair comparison of the algorithms using the dataset, especially given the high number of samples in comparison to the size of each scenario description. In addition, data augmentation was carried out by mirroring the scene over the frontal axis, assuming that mirrored scenarios should have the same labels. The samples were shuffled before splitting the dataset into train/dev/set. The augmented dataset was also shuffled after the augmentation process. The main files in the dataset are located in the data subdirectory:
socnav_training.json: training dataset. No data augmentation. It contains 8168 labels/scenarios.
socnav_training_dup.json: training dataset with data augmentation. It contains 16,336 labels/scenarios.
socnav_dev.json: development dataset. It contains 556 labels/scenarios.
socnav_test.json: testing dataset. It contains 556 labels/scenarios.
Each line in these files contains a description of a labelled scenario, which is a representation of a scene at a given time during robot navigation. They contain the following elements:
identifier: a string that identifies the scenario. Several instances of the same labelled scenario might exist.
robot: it is a dictionary containing the identifier of the robot in the scenario.
room: a list of points defining the wall polyline that delimits the room.
humans: a list of humans. Each human is implemented as a dictionary with the following keys: id (identifying the human in the scenario), xPos and yPos (they are the center of the human and represent its location expressed in centimetres), orientation (expressed in degrees). Humans are assumed to be 40 cm wide, and 20 cm from chest to back.
objects: a list of objects. Each object is implemented as a dictionary with the following keys: id (identifying the object in the scenario), xPos and yPos (the location of the object, expressed in centimetres), orientation (expressed in degrees). Objects are assumed to be cm.
links: a list of interaction tuples, where the first element of the tuple is a human who is interacting with the second element in the tuple, which can be an object or another human.
score: the score assigned to the robot in the scenario. From 0 to 100.
The dataset was generated using two sets of possible scenarios. The second set was created to increase the number of different scenarios. Both of them were randomly generated and the two include a wide variety of potential situations. Using the first subset, composed of 2500 scenarios, three subjects generated a total of 5522 labels for the scenarios. These scenarios were labelled multiple times with some level of disagreement between humans, as the nature of the problem is subjective. Using the second subset, composed of 10,000 scenarios, nine subjects generated a total of 3758 labelled scenarios with a low number of duplicates. As a result, 12 subjects generated 9280 labels for the scenarios provided. The age of the participants was between 22 to 45 years, 30% of whom were women and the rest men. They are native middle class residents of Spain. Three of the subjects were researchers involved in the project, the rest were computer science students with no domain knowledge beyond the instructions they were given. A total of 5735 different scenarios were used, 2761 were labelled once, 2406 were labelled twice and 568 were labelled three or more times. When the dataset was designed, labelling scenarios multiple times was considered beneficial to evaluate to what extent humans agree on the labelling (see
Section 4). The whole data collection process took place between 13 April and 27 April 2019.
Besides the data sub-directory, the repository has two other sub-directories: raw_data, which contains the data collected by each of the 12 subjects, and unlabelled, where the two subsets of scenarios used can be found (following the same file format and a score of 0 for all the scenarios). All angles are expressed in degrees, distances are expressed in centimetres.
3. Methods
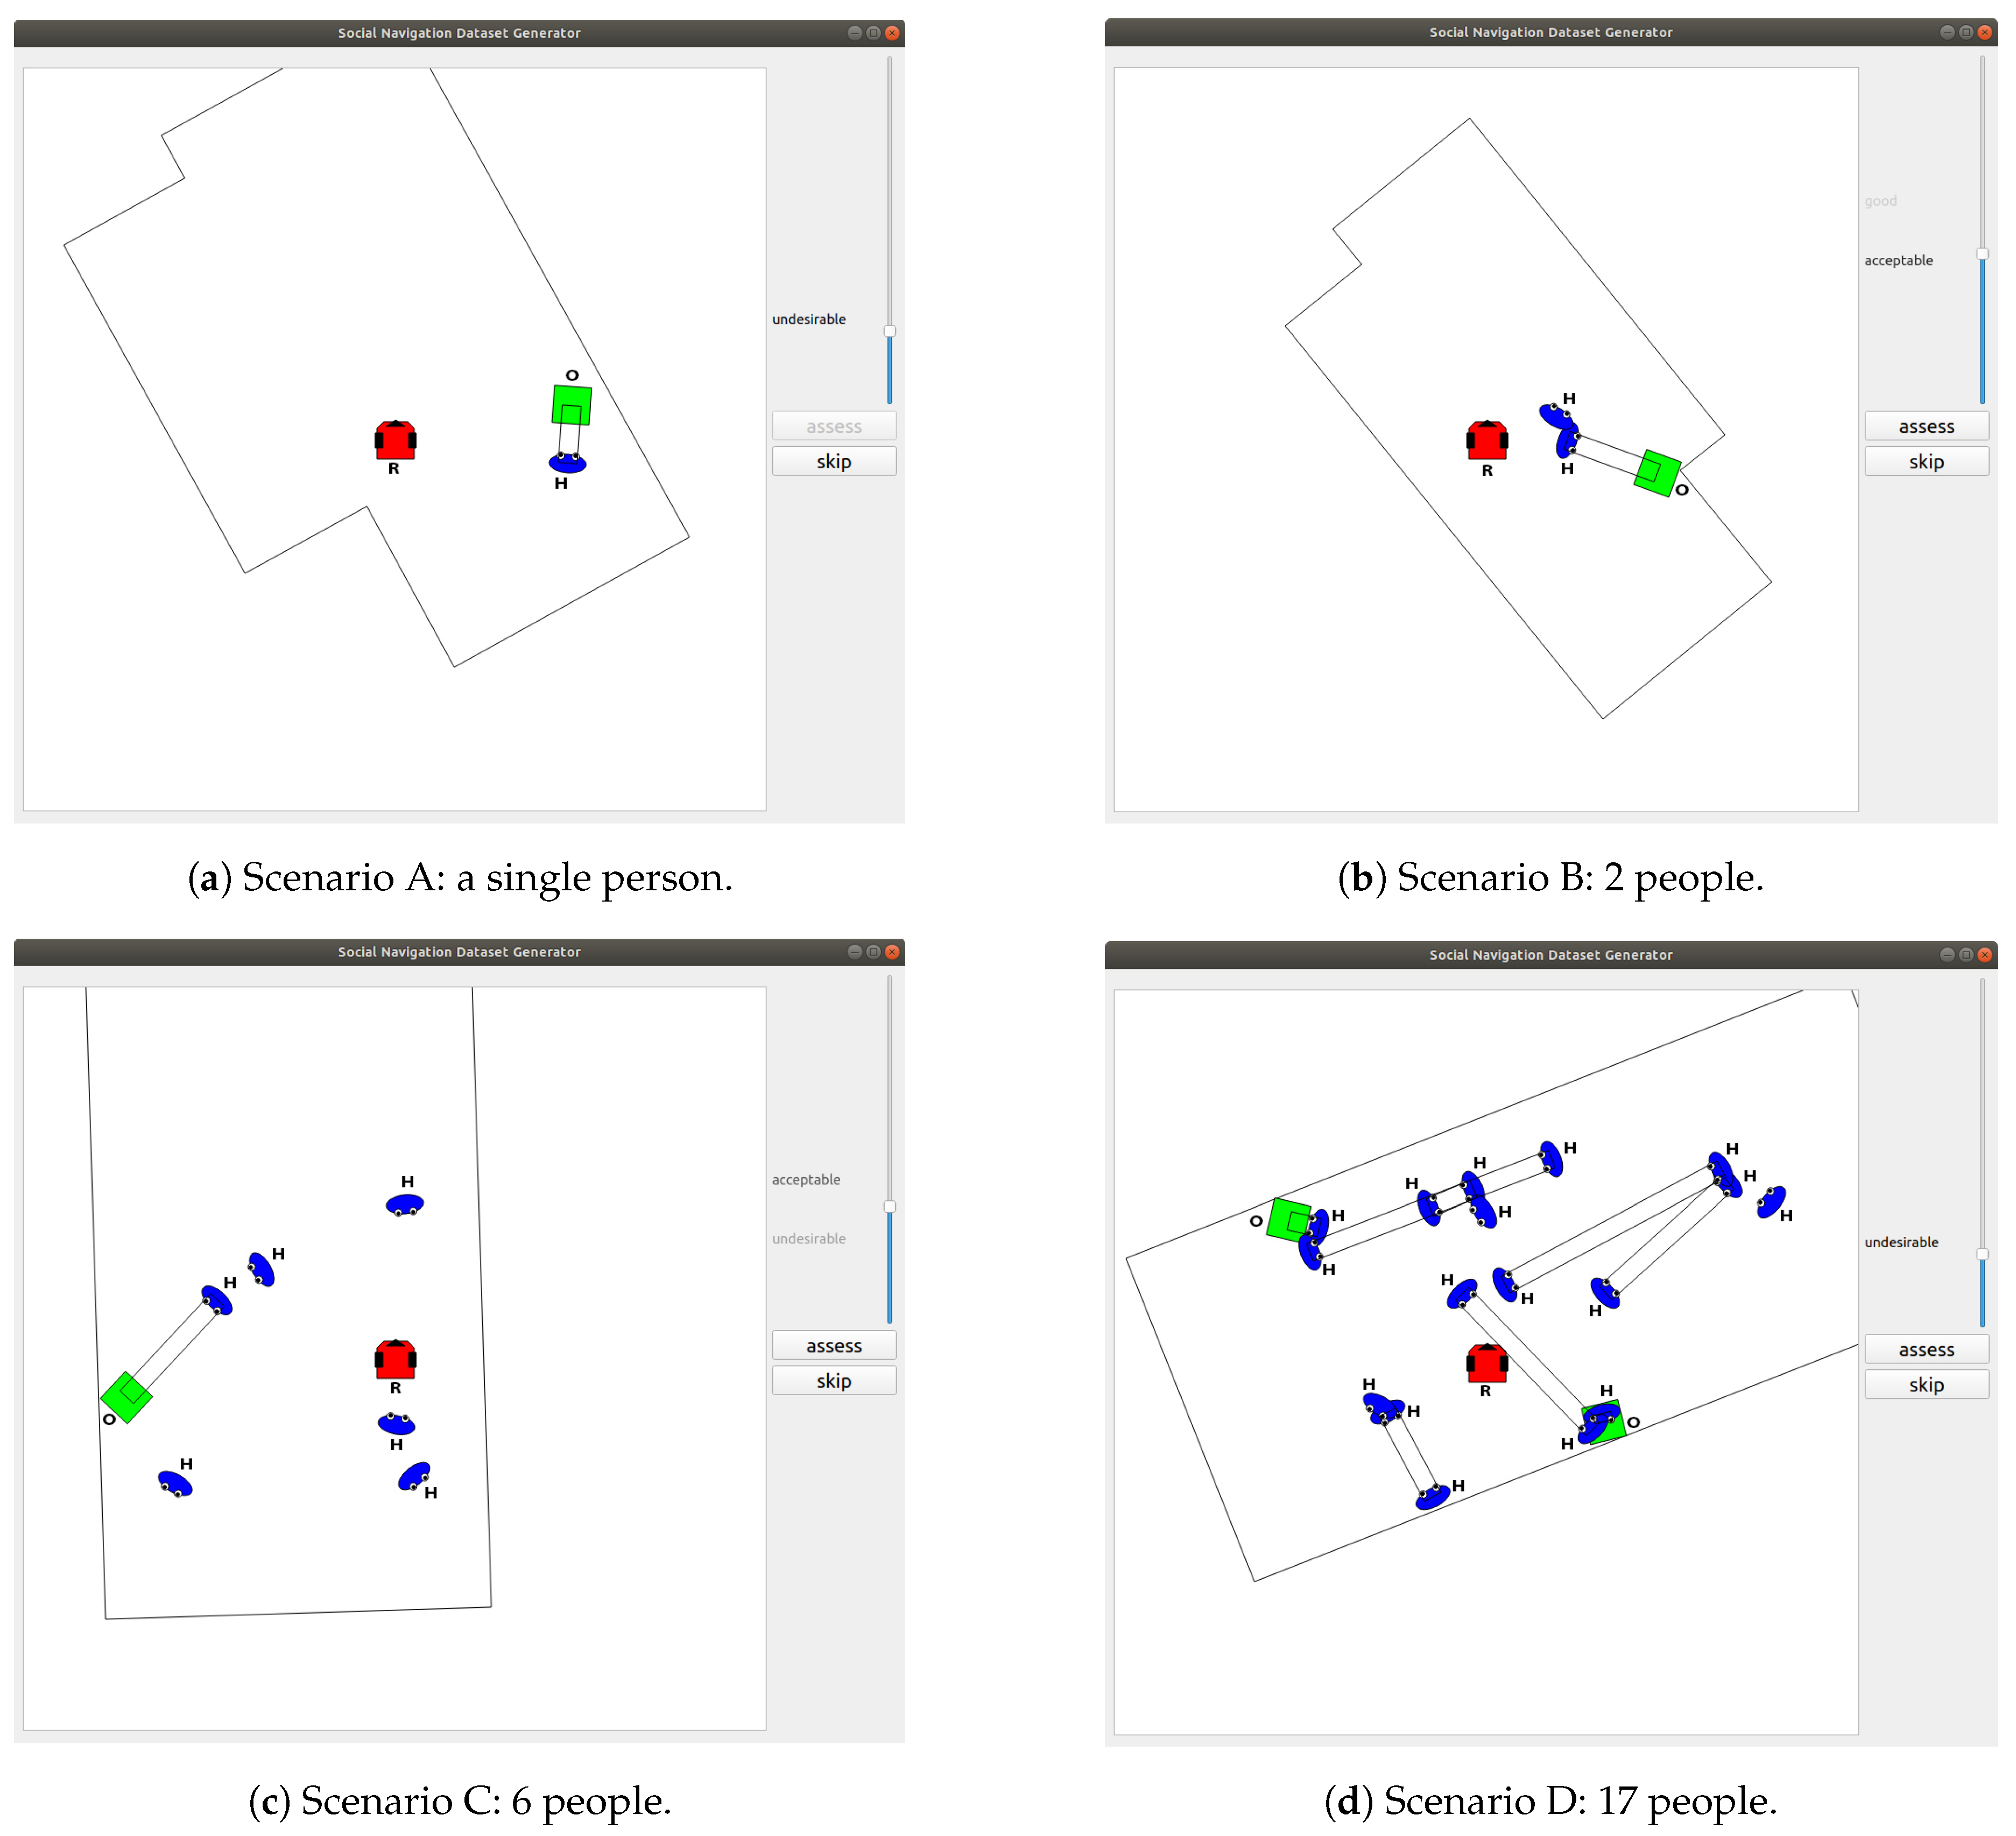
In order to acquire data at a feasible cost and gather robot-specific information (i.e., not imitating the behaviour of humans), it was decided to develop an ad hoc application depicting the scenarios that humans had to manually assess (see
Figure 1).
The interface of the tool has two main areas. The canvas on the left-hand side is used to depict the scenarios where subjects were asked to assess the robot’s behaviour in terms of the disturbance caused to humans. On the right hand side, users have a slider which value goes from 0 (unacceptable) to 100 (perfect). The intermediate labels are undesirable, acceptable, good and very good. The interface smoothly transitions from one label to another using font transparency to make easier selecting intermediate values. Also on the right-hand side, users can make use of two buttons, one to assess the current scene and generate a new one (button on top) and another one to avoid labelling the current scene in case they are unsure of how to label a particular scene (button on the bottom).
The scenarios, rooms randomly generated under some restrictions to make them feasible, depict metres square areas where different elements can be found: the robot, walls, humans, objects and interaction indicators. The generative process randomizes most of the elements in a scenario: the number and locations of the humans, the structure of the room, the number of objects and the interactions between humans and between humans and objects. This randomization favours the diversification of the potential situations represented by the different scenarios.
The representation is robot-centric, so the robot—in red and labelled with R—is always in the centre of the canvas and aligned with the axes. There is always a room composed of, at least, four walls represented by black lines. Humans—in blue and labelled with H—and objects—in green and labelled with O—can be anywhere in the room. They are only generated within the canvas, enforcing that even if the room is bigger than the canvas users will not miss any element. Interactions are represented by parallel lines. These might exist between humans—for human-to-human interactions—or between a human and an object—to represent any kind of interaction with objects. Interaction are composed of two elements, the first one is a human and the second one is an object or another human. The positions of the two elements and the orientation of one of them are randomly generated. The second element is assigned the opposite orientation of the first one. The black lines representing interactions are drawn according to the positions of the two interacting elements.
Despite some guidelines were provided, subjects were asked to feel free to express how they thought they would feel in the scenarios. It must be noted that subjects are not asked about any particular human. They should annotate the scenarios according to the disturbance caused by the robot to the humans in general. The guidelines were the following:
The closer the robot is to humans from their perspective, the more it disturbs.
A collision with a human should have a 0 score (unacceptable).
We want to consider, not only the personal spaces but also the spaces that humans need to interact with other humans or objects. The closer the robot gets to the interaction space (human to human, or human to object) the lower the score—up to a non-critical limit.
A collision with an interaction area should have a maximum score of 20 (undesirable). The interaction area is considered the zone needed by a human to comfortably interact with other human or with an object.
The score should decrease as the number of people it is interrupting increases.
In small rooms with a high number of people, closer distances are acceptable in comparison to big rooms with fewer people. It is somewhat acceptable to get closer to people in crowded environments. Therefore, in general terms, the higher the density, the higher the score.
You should consider only social aspects, not the robot’s intelligence. Even if the robot seems to be having a close look at one of the walls, it should have a decent score as long as it is not disturbing anyone. The variable to assess is not related to the robot’s performance or whether or not the robot collides with walls and objects. We are only asking about social aspects.
4. Analysis and Validation of the Dataset
This section provides a brief analysis of the data to facilitate understanding its relatively subjective nature and how the labels are distributed. To this end, a subset of the scenarios which were labelled by three subjects is used (see
Figure 2).
Figure 2a depicts a histogram of the labels provided by three different subjects for 500 common scenarios. Each label represents a score range:
for perfect,
for very good,
for good,
for acceptable,
for undesirable, and
for unacceptable. From this figure, certain variability on the opinion of the 3 subjects can be observed. Thus, subjects 1 and 3 tend to give a more extreme score to the different scenarios than subject 2, who scores a higher number of situations with intermediate labels. Despite the observed variations, the three subjects assign a score greater than 50, the limit between good and acceptable, to a similar number of scenarios (around 320). This indicates that no relevant divergences are found among the different opinions of a common scenario.
In order to quantitatively evaluate the consistency of the labelling of the three users, additional reliability measures were obtained. In particular, the inter-rater and intra-rater agreement has been computed using the linearly weighted kappa coefficient [
20]. The intra-rater measures have been obtained using a set of 200 scenarios labelled twice by each subject. The inter-rater agreement has been computed from 522 common scenarios labelled by the three subjects. The results of these measures can be observed in
Table 1. The diagonal cells of the
Table 1 represent the intra-rater reliability, while the remaining cells show the inter-rater agreement for every pair of subjects. As can be seen, the inter-rater consistency ranges from
to
, showing substantial agreement among the three users according to [
21]. In addition, intra-rater reliability for all the subjects are above
, which indicates substantial to almost perfect agreement, i.e., high reliability.
Figure 2b provides additional data that reinforce the above observation. This figure represents the difference between the score of a subject and the mean score of the three subjects for 150 common scenarios. The four scenarios of
Figure 1 have been marked in the chart with vertical dotted lines. The standard deviation for each of the three subjects considering the 150 scenarios is around 10 points. Given that this value is lower than the width of the label ranges, the variation of the score provided by the three subjects can be considered moderately low. For a considerable number of scenarios, such as the scenarios in
Figure 1a,d, the three subjects assign similar scores. Nevertheless, other scenarios produce more variability. This is the case of the scenarios in
Figure 1b,c, which are more susceptible to generate different feelings than those in
Figure 1a,d.
Considering the whole set of 5735 different scenarios labelled by all the subjects, similar results are observed. The variability in these scenarios has been individually measured for different subsets, grouping the scenarios according to the number of times they have been labelled. For each subset, the pooled standard deviation (
) ([
22]) has been computed as a measure of dispersion. The pooled standard deviation is a weighted average of standard deviations of several groups. For each subset, since every scenario is labelled by the same number of subjects, the value of
can be computed as follows:
where
n is the number of scenarios of the corresponding subset and
the standard deviation of a given scenario.
Using the above measure, the resulting values show that the dispersion remains below
points in all the subsets. Taking into account that the highest difference between two labels is 100, the obtained values of dispersion can be considered certainly low. Moreover, combining the dispersion of all the subsets, a global
of
is obtained, which is in line with the results of
Figure 2.
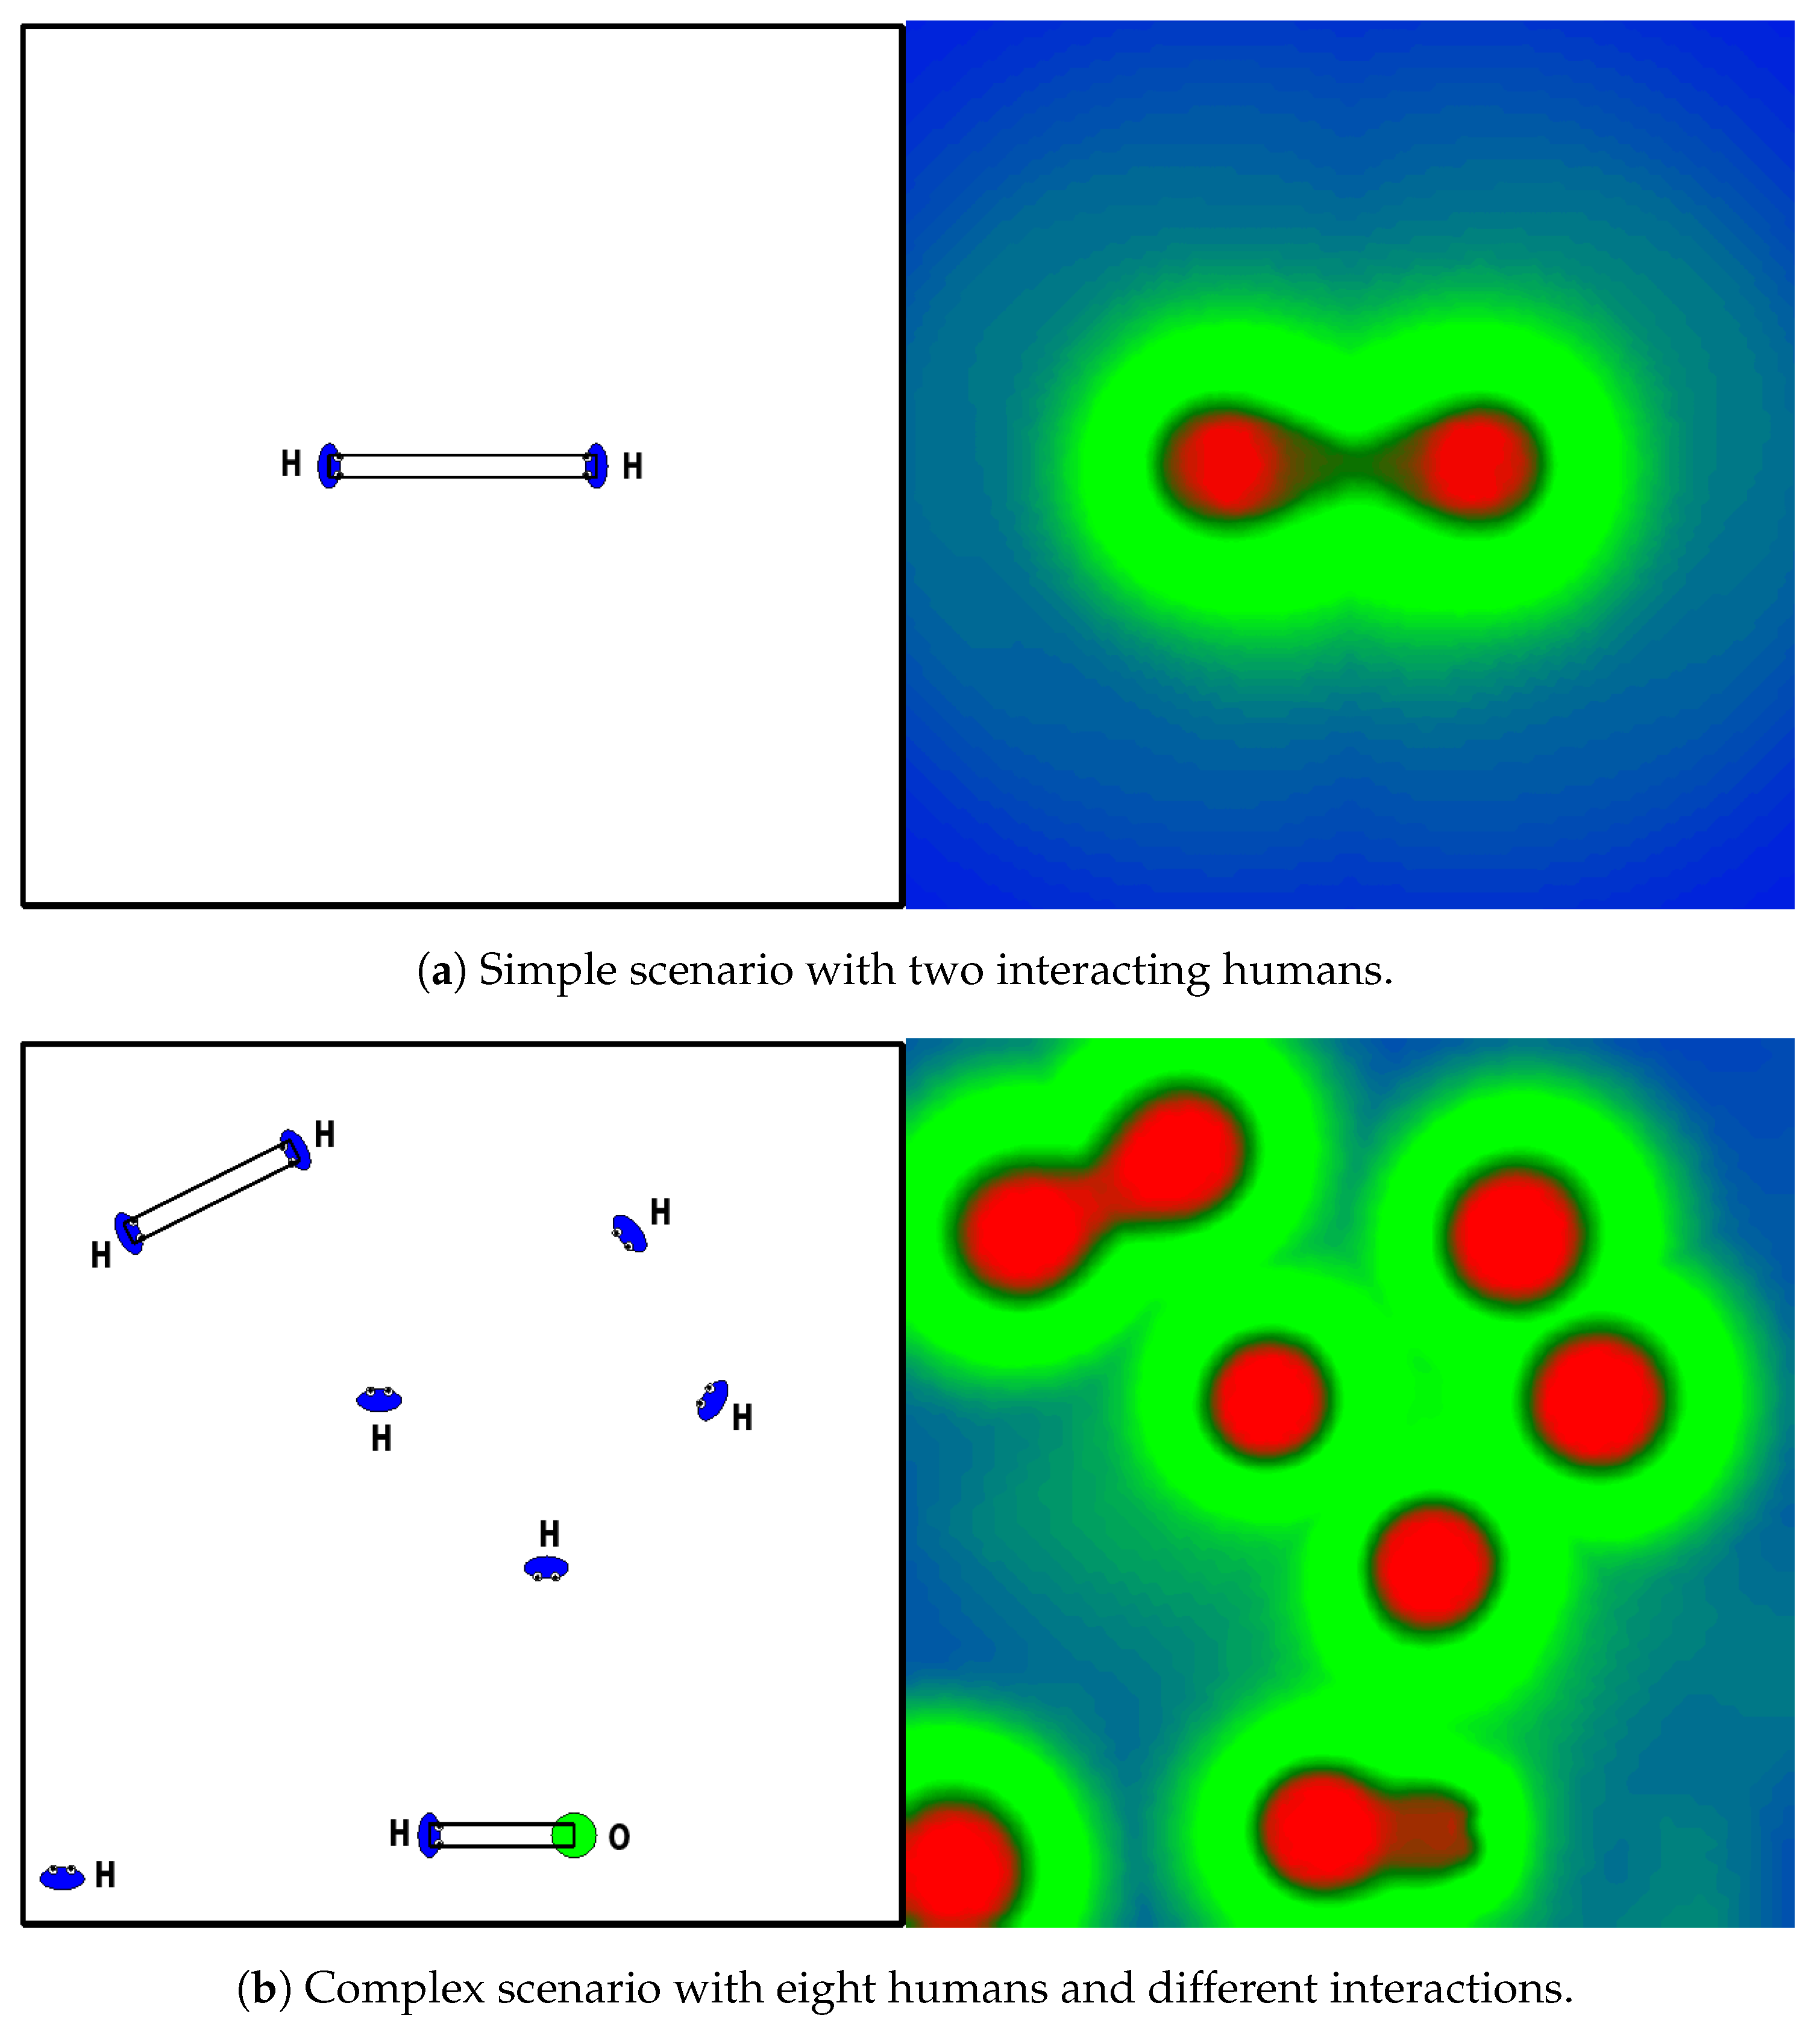
Besides this analysis, the dataset has been successfully applied to train Graph Neural Networks (GNNs) that model adherence to social-navigation conventions for robots. Some results are presented in
Figure 3. The figure shows several scenarios (left) and the response of the network for the different locations of the robot in each scenario (right). The disturbance of the robot in each position of the scene is represented using a heat color scale, where red indicates unacceptable position and blue expresses perfect position. More details about the application of the dataset to GNNs can be found in [
10].
5. Discussion
Datasets are extremely important in many scientific disciplines. They are essential for benchmarking and algorithm comparison, but with the emergence of deep learning, datasets have become the basic support over which the new artificial intelligence is sustained. For the problem at hand, the variable size of the data and its structured nature is one of the challenges from a learning point of view. The 9280 samples generated in SocNav1 seem to be enough for machine learning purposes given the size of the data structures describing the scenarios. Initial results applying the dataset to graph neural networks support this idea [
10].
Regarding the design of the experiments, it is worth noting that the labels describe how humans think they would feel in the situation, not how they would feel if they were actually there. Generating a dataset providing direct measurements would be extremely challenging from a technological point of view (how are the measurements taken) as well as from a managerial perspective (time and resources needed). Nevertheless, the main reason for constructing a synthetic dataset is based on the very nature of the data. The aim is to include scenarios that offer the greatest range of possibilities. If limited by real scenarios, situations that could endanger the integrity of the human being, such as, for example, those that represent a robot-human collision, could not have been included.
Even though the data for each scenario might not seem very complex, as mentioned in the introduction in more detail, the datasets currently available do not consider interactions between people or objects. We are however open to extending the dataset with new features in the future if it is found useful.


