Data Descriptor

Assessing Urban Livability through Residential Preference—An International Survey

by
Anna Kovacs-Györi
1,* and
Pablo Cabrera-Barona
2
1
Department of Geoinformatics—Z_GIS, University of Salzburg, 5020 Salzburg, Austria
2
Department of Public Affairs, Latin American Social Sciences Institute—FLACSO, Quito 170135, Ecuador
*
Author to whom correspondence should be addressed.
Data 2019, 4(4), 134; https://doi.org/10.3390/data4040134
Submission received: 30 August 2019 / Revised: 26 September 2019 / Accepted: 29 September 2019 / Published: 1 October 2019

Abstract

:
Livability is a popular term for describing the satisfaction of residents with living in a city. The assessment of livability can be of high relevance for urban planning; however, existing assessment methods have various limitations, especially in terms of transferability. In our main research article, we developed a conceptual framework and an assessment workflow to provide a transferable way of assessing livability, also considering intra-urban differences of the identified livability assessment factors to use for further geospatial analysis. As a key part of this assessment, we developed a survey to investigate residential preference and satisfaction concerning different urban factors. The current Data Descriptor introduces the questionnaire we used, the distribution of the responses, and the most important findings for the socioeconomic and demographic parameters influencing urban livability. We found that the development of an area, the number of persons in the household, and the income level are significant circumstances in assessing how satisfied a person would be with living in a given city.
Dataset: The paper itself contains data (questionnaire and statistical analysis) along with supplementary files.
Dataset License: CC BY-NC 4.0

1. Summary

Livability is a frequently used term, to refer to the quality of urban environments in the light of the dwellers’ needs and expectations. However, consensus is lacking on how to define livability and its main components, or how these parameters can be assessed in a transferable way [1,2,3,4]. Based on the extensive literature reviews of Van Kamp et al., Pacione, and Young and Hermanson [1,3,5], it is visible that most of the existing definitions share some basic elements regarding what the urban living environment (both natural and built elements) provides and how it is connected to the individuals. Various livability-related factors are also listed in these works; however, the authors do not discuss their analysis or the overall assessment of livability.
There are various existing ways to rank and assess cities based on their livability [6,7,8,9,10,11]. On the one hand, these methods are often tailored to a specific city, and thereby, they are less transferable, or they evaluate the whole city without distinguishing intra-urban differences and other variance of the phenomena at finer spatial scales (e.g., neighborhoods). In our main research article [4], we developed a conceptual framework (Figure 1) and an assessment workflow to provide a transferable way of assessing livability, also considering intra-urban variance of the parameters to use for further geospatial analysis. The main guiding principle of our approach was to reflect the quality of the person–environment relationship. This was achieved by using assessment factors that are not merely statistical (e.g., number of a given facility) but focusing more on how the given parameter can be defined in a way that it reflects the real connection between the residents’ perception and the urban environment. It can either be grasped spatially (how accessible the facility is) or through needs and expectations (are there facilities in the neighborhood to fulfill a given need at a given level).
Mobility has a special role in the assessment of livability [4]. As it is highlighted in Figure 1, individual preferences can influence mobility and its perception by defining the destination (human need—urban functions) or the choice of transportation mode (personal values). On the other hand, the urban environment, especially the built environment, affects the actual trajectory taken. This and further hypotheses on the role of mobility and the road network are tested in the main research article [4].
The current work describes the fundamental element of our methodology for livability assessment. We developed a questionnaire using the principle of representing the person-environment relationship. This questionnaire was used in eight different cities with different population sizes in six different countries, both developing and developed. By nature, for the assessment of complex phenomena such as livability, there is no finite or axiomatic list of factors. Thereby to provide the best possible thematic coverage, we investigated five key areas of livability based on state-of-the-art literature and our conceptual framework [4], ranging from the sense of community to urban functions, and investigated the role of a set of parameters in each thematic unit. This paper describes these thematic units in the following sections, along with some basic, mainly descriptive analysis of the responses. Further details can be found in our research paper [4] on how this questionnaire was utilized in assessing the urban quality and how it might contribute as an intermediary step and possible analysis technique to achieve New Urban Agenda aims and Sustainable Development Goals. By publishing the whole questionnaire and detailed thematic results, we hope that it can serve other useful purposes in urban planning and in improving the livability of cities in other contexts as well.

2. Data Description

Our questionnaire consists of 49 questions in the following thematic categories [4]:
  • General information: As the introductory part of the questionnaire, this section contains questions about demography (sex, age, marital status, education, household members, etc.) and information on the monthly income of the household.
  • Sense of community and belonging: In the first thematic part of the survey, participants were asked about the neighborhood and community they lived in and their general satisfaction with it. The community means their home and the group of people living in its closest surroundings (few buildings/building blocks), and the neighborhood is the part of the city where this community lives. Community has a strong role in the perception of livability, which we wanted to consider in our assessment, beyond the rather physical parameters, such as urban environment or mobility [12].
  • Urban form: Participants were also asked about the built environment of their neighborhood. Built environment consists of the buildings, public spaces, and other elements of the street such as trees and street furniture. Urban form is a key element in the conceptual framework of livability, namely livability is interpreted as the quality of the person–environment relationship. Most of the existing livability definitions emphasize the role of the environment in representing the quality of life of the residents in a city [1,13].
  • Mobility: This part of the questionnaire investigated transportation mode preferences according to different activity types, motivations for dominant car usage, importance, and availability of different mobility-related factors, perceived transportation safety, as well as the self-reported overall quality of walking, cycling, and transportation. The important role of mobility in urban livability was a key hypothesis in our livability assessment framework; see Section 1, Figure 1 and our research article for further details [4].
  • Urban functions: In the third part of the survey, people were asked about how they travel within the city and for what purposes (e.g., to work or school, for shopping, etc.). Similarly to urban form, urban functions are essential in satisfying the needs of residents in order to provide better quality of life. Urban functions represent how the urban environment is used or can be used, see also Figure 1.
  • Housing: This part of the questionnaire addressed the housing conditions and its infrastructure. Housing belongs to the finest spatial scale, a most private aspect of urban livability, and housing conditions tend to effect the perception of livability, even if it is less likely to be improved by urban planning directly [1].
  • General satisfaction: as a final topic, we asked the participants about their general satisfaction in terms of city quality, which represents their self-reported livability value.
Our study areas are located in three continents to provide a more in-depth investigation of how cultural and potential socioeconomic differences might influence the satisfaction of people with living in a given city. Table 1 summarizes the most important information about these study areas. More details about the selection of the study areas and sampling can be found in the main research article [4]. Overall, we had 440 responses, mostly through the online version of the questionnaire, but in Léon, Nicaragua, and Nairobi, Kenya, we also had paper-based responses. The content of the questionnaire was identical in both cases.

3. Methods

Our questionnaire contains six different types of questions. Apart from the ones concerning demographic information, all responses reflect residential preference or self-reported evaluation. The first type of questions asks residents how well certain urban characteristics are represented by a given statement (e.g., most of the people in the community know them by name). The second type of questions evaluates the quality of the urban form or function-related factors (e.g., overall housing quality). The last larger group of questions addresses the importance of given characteristics or factors for the respondent. (e.g., how important it is to have well-maintained public transportation vehicles). The questionnaire also contained questions with binary response options, for example, if a person has or does not have a given urban function available in their vicinity. There were two more categories regarding evaluating safety and frequency of use for mobility or different transportation modes. In most cases, the possible answers are ordinal values (e.g., ‘Not at all’ to ‘Completely’), but the exact answer options for each question can be found in Section 4. Further analysis details to evaluate the livability of place can be found in the main research paper, also in the form of a multi-regression analysis and relational-statistical learning [4]. Section 4.1, Section 4.2, Section 4.3, Section 4.4, Section 4.5 and Section 4.6 contain the distribution of the responses for each question in each thematic group, whereas Section 4.7.2 investigates the statistical connection between perceived satisfaction and various socioeconomic parameters.

4. Content and Findings of the Questionnaire per Thematic Groups

4.1. General Information

4.1.1. Questions

  • 1. What is your place of residence (country, city)?
  • 2. Are you a male or a female?
  • 3. What is your age?
    • Below 18 years/18–25/26–35/36–45/46–55/56–65/Above 65 years
  • 4. What is your current marital status?
    • Married/Not married, living with partner/Separated/Divorced/Widowed/Single (never married)/Other (please, specify):
  • 5. Your nationality:
  • 6. How many people live with you in your household? (including you)
  • 7. Besides yourself, do you have any of the following people living in your household?
    • Child(ren) under 18/Child(ren) 18 or older/Parents (yours)/Other adult relative or friend 18 or older/I live alone
  • 8. What is the highest level of education you have completed?
    • Elementary school/High school/Post-high school education or training (no degree)/Bachelor degree (or equivalent)/Master degree (or equivalent)/PhD or higher/Other:
  • 9. How much is your average net (after paying taxes if applies) monthly household income?
    • (options vary from country to country)
  • 10. How would you consider your annual household income in terms of your basic needs (e.g. housing, food, etc.)?
It is much more/It is more/It is the amount/It is less/It is much less than what I would

4.1.2. Findings

Table 2 contains the distribution of the responses for the questions regarding demographic information. From the 438 respondents, 58% were female and 42% male. In terms of age, 55% of the people were below 35 years, and 45% were older than 35 years old. Out of 437 people, only 51 persons had a nationality different from the locals in the study areas—out of which nine respondents were German, living in Salzburg, which is a quite common phenomenon. The German border is located right next to the city, and it has a long history, that Germans live and work in Salzburg. A quarter of the people who answered our questions live alone, a third live together with their partner, and around 40% have a household with at least three persons in it. For 1/3 of the respondents, this household also includes children under 18. More than 50% of the people have a university degree, and everyone finished elementary school even in our study areas belonging to developing countries. In terms of household income, around 22% percent of the responses report lower incomes than what they think would be necessary to fulfill their basic needs.

4.2. Sense of Community and Belonging

4.2.1. Questions

  • 1. What is the name of the neighborhood you live in? (If there is no official name for it: How do residents call that area?)
  • 2. How long have you lived in this neighborhood?
    • Less than 5 years/5 up to 15 years/15 up to 25 years/25 up to 35 years/more than 35 years
  • 3. Are you satisfied with living in this neighborhood? (Does it fulfill your needs and expectations to live a good life?)
    • Completely/Mostly/Somewhat/Not at all
  • 4. How well do each of the following statements represent how you feel about your community (the people living in your neighborhood)?
    • Not at all/Somewhat/Mostly/Completely
      • Being a member of this community makes me feel good.
      • People in this community have similar needs, priorities, and goals.
      • I trust people in this community.
      • I can recognize most of the members of this community.
      • Most community members know me by face.
      • Most community members know me by name.
      • Being integrated into this community is important to me.
      • I am with other community members a lot and enjoy being with them.
      • I expect to be a part of this community for a long time.
      • Members of this community have shared important events together, such as holidays, celebrations, or disasters.
      • Members of this community care about each other.
      • Members of this community fairly plan outdoor activities and events together.

4.2.2. Findings

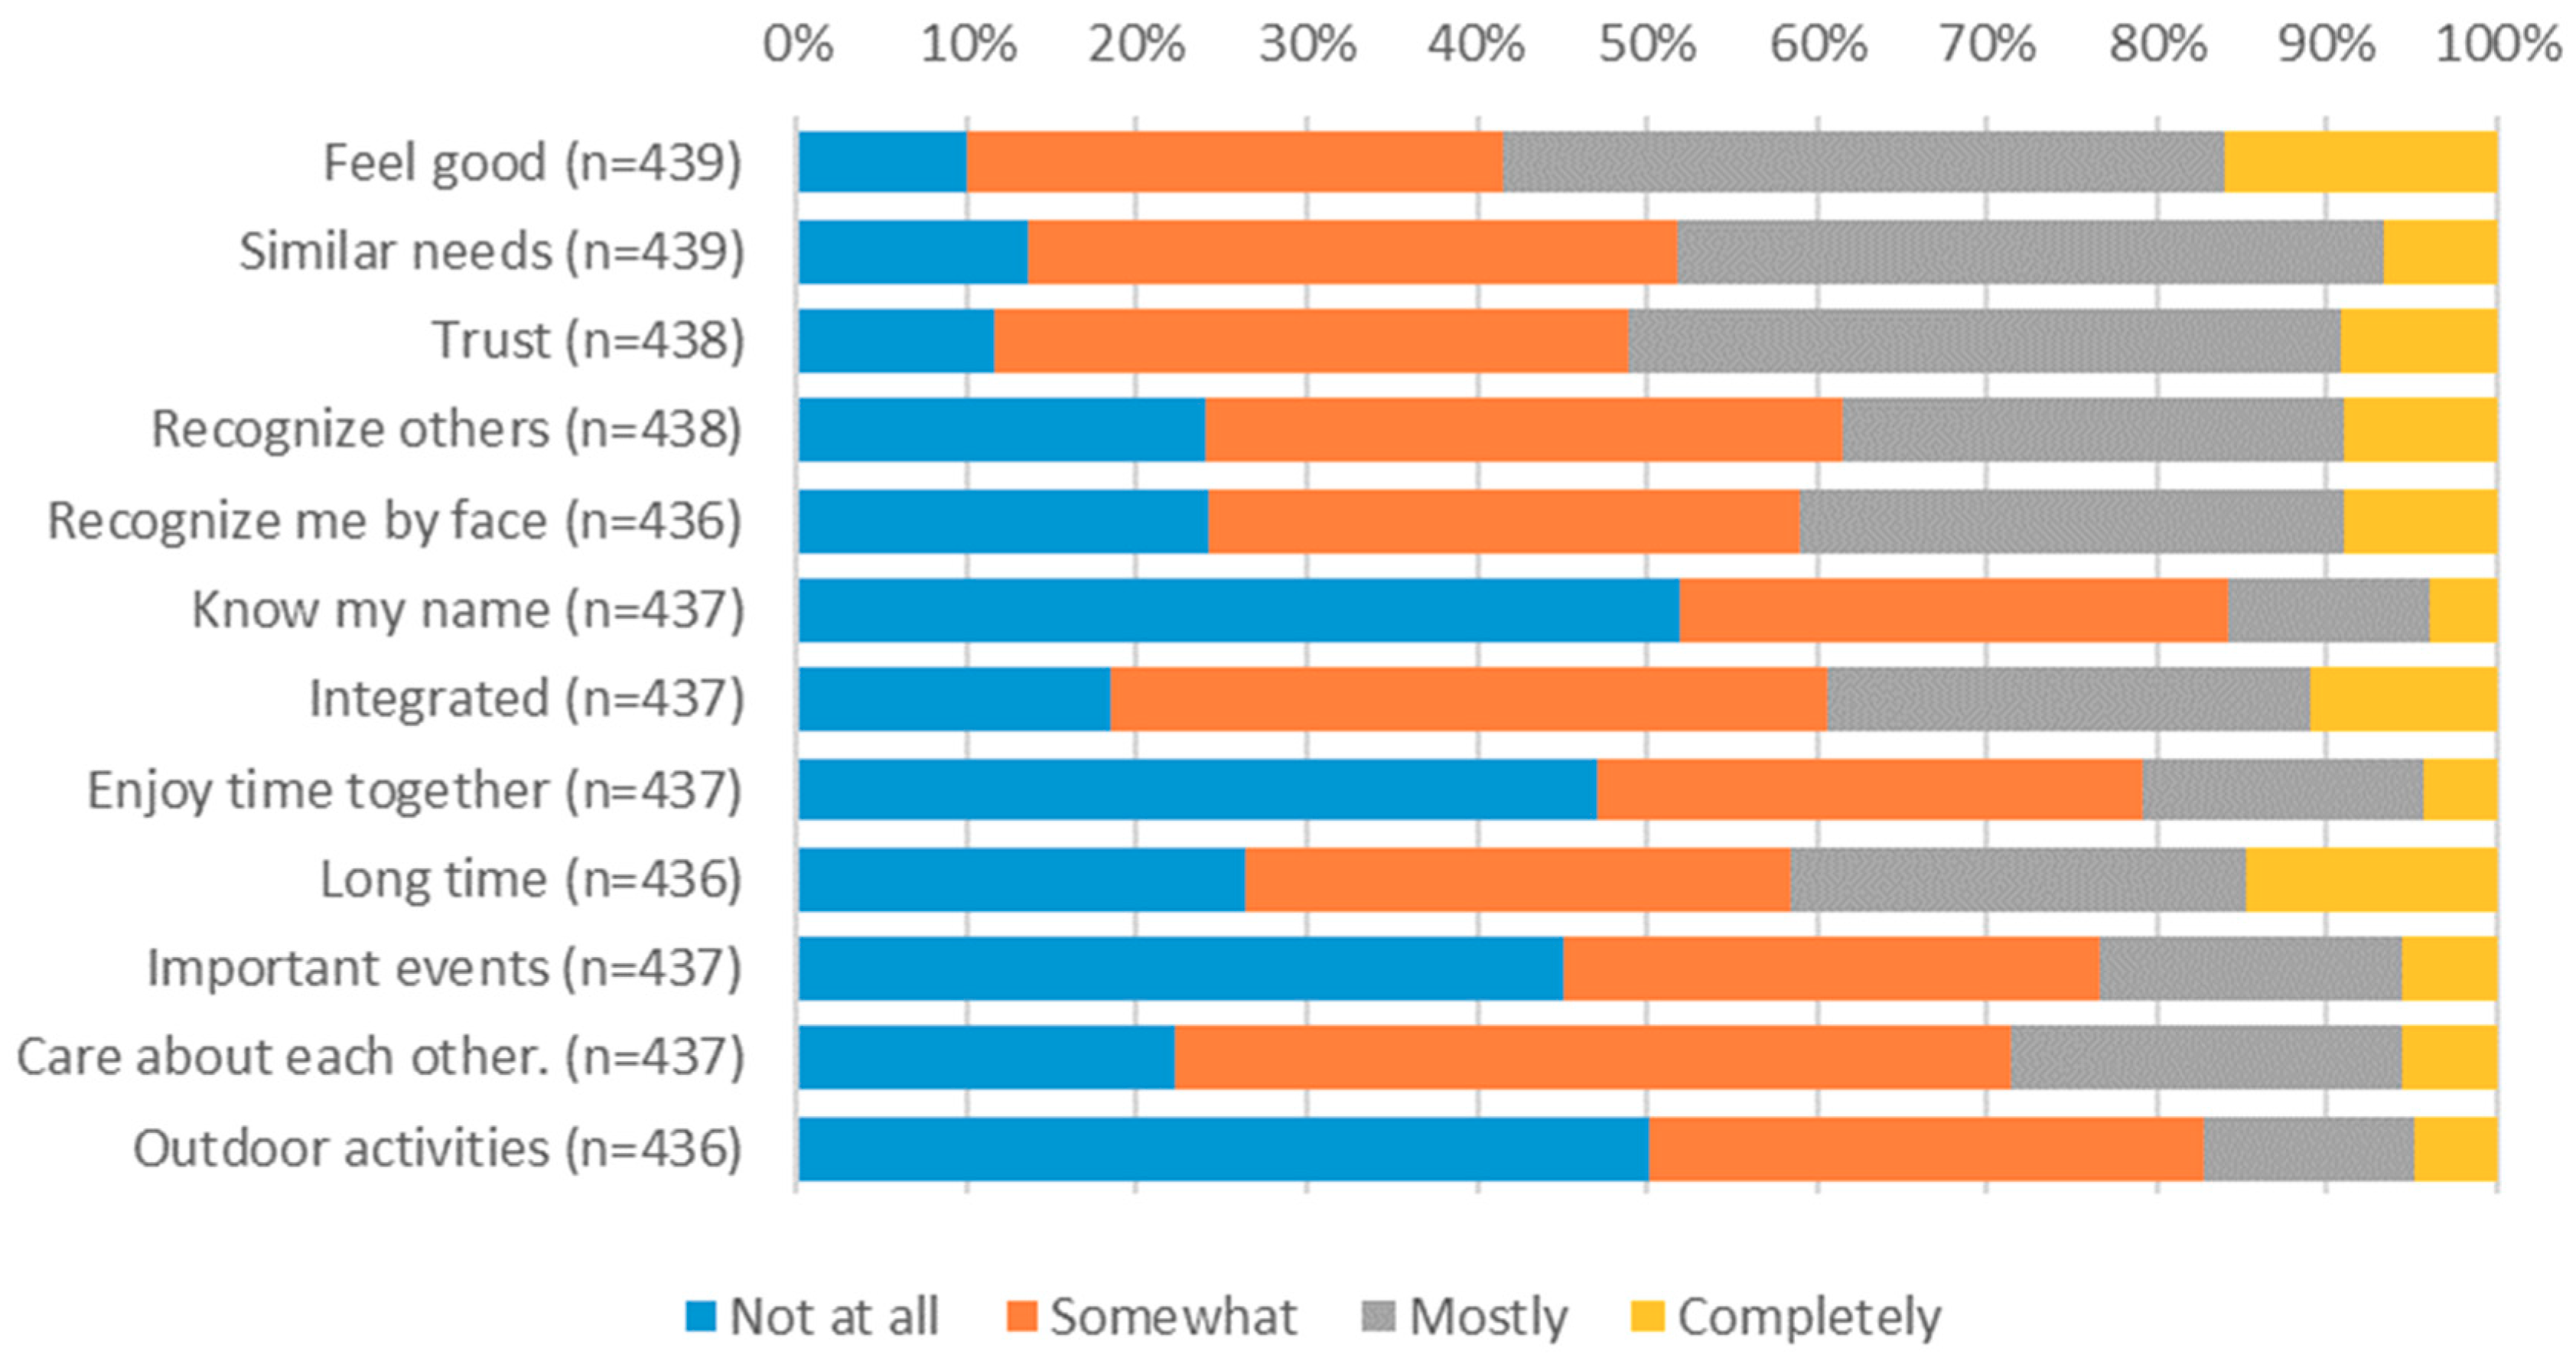
In general, interviewees are satisfied with living in their neighborhood, but almost half of them live only less than five years in their current community (Table 3). The results show that around 60% of the respondents feel good as a member of the community; thereby, most of them have a “sense of community” (Figure 2). A significant number of residents trust the other community members. However, results also indicate that around half of the residents do not enjoy spending time and do not plan outdoor activities and events together with their neighbors.

4.3. Urban Form

4.3.1. Questions

  • 1.a How important do you think it is to have the following in your neighborhood?
    • Not at all/Somewhat/Mostly/Completely *
  • 1.b Does the neighborhood where you live have the following? Yes/No/Not sure
    • Buildings in a street with similar style (architectural design).
    • Buildings in a street with similar age.
    • Buildings in a street with similar height.
    • Buildings in a street with the same function (only residential/commercial/administrative/industrial).
    • Buildings only lower than five floors.
    • Mixed land use (multiple functions—residential/commercial/etc.—within the same building block/neighborhood so they are more easily accessible also by walking).
    • Lower building density (wider streets and open spaces, fewer number of floors, bigger space between buildings).
    • Homogeneous, harmonious streetscape (the building looks similar—similar height, style, age etc.).
    • Something interesting to see while walking (e.g., storefronts, lively streetscape with traffic and other people, interesting buildings/statues).
    • Street furniture (benches or chairs to sit, dustbins, shade, drinking fountains, etc.).
    • Trees along the streets.
    • Aesthetic streetscape.
    • Public squares or plazas to linger.
  • 3. How would you rate the overall quality of the built environment in your neighborhood? (also based on the features mentioned above)
    • Excellent/Very good/Good/Fair/Poor
* to avoid ambiguity, instead of “Mostly”/“Completely” we advise to use “Important”, “Extremely important”

4.3.2. Findings

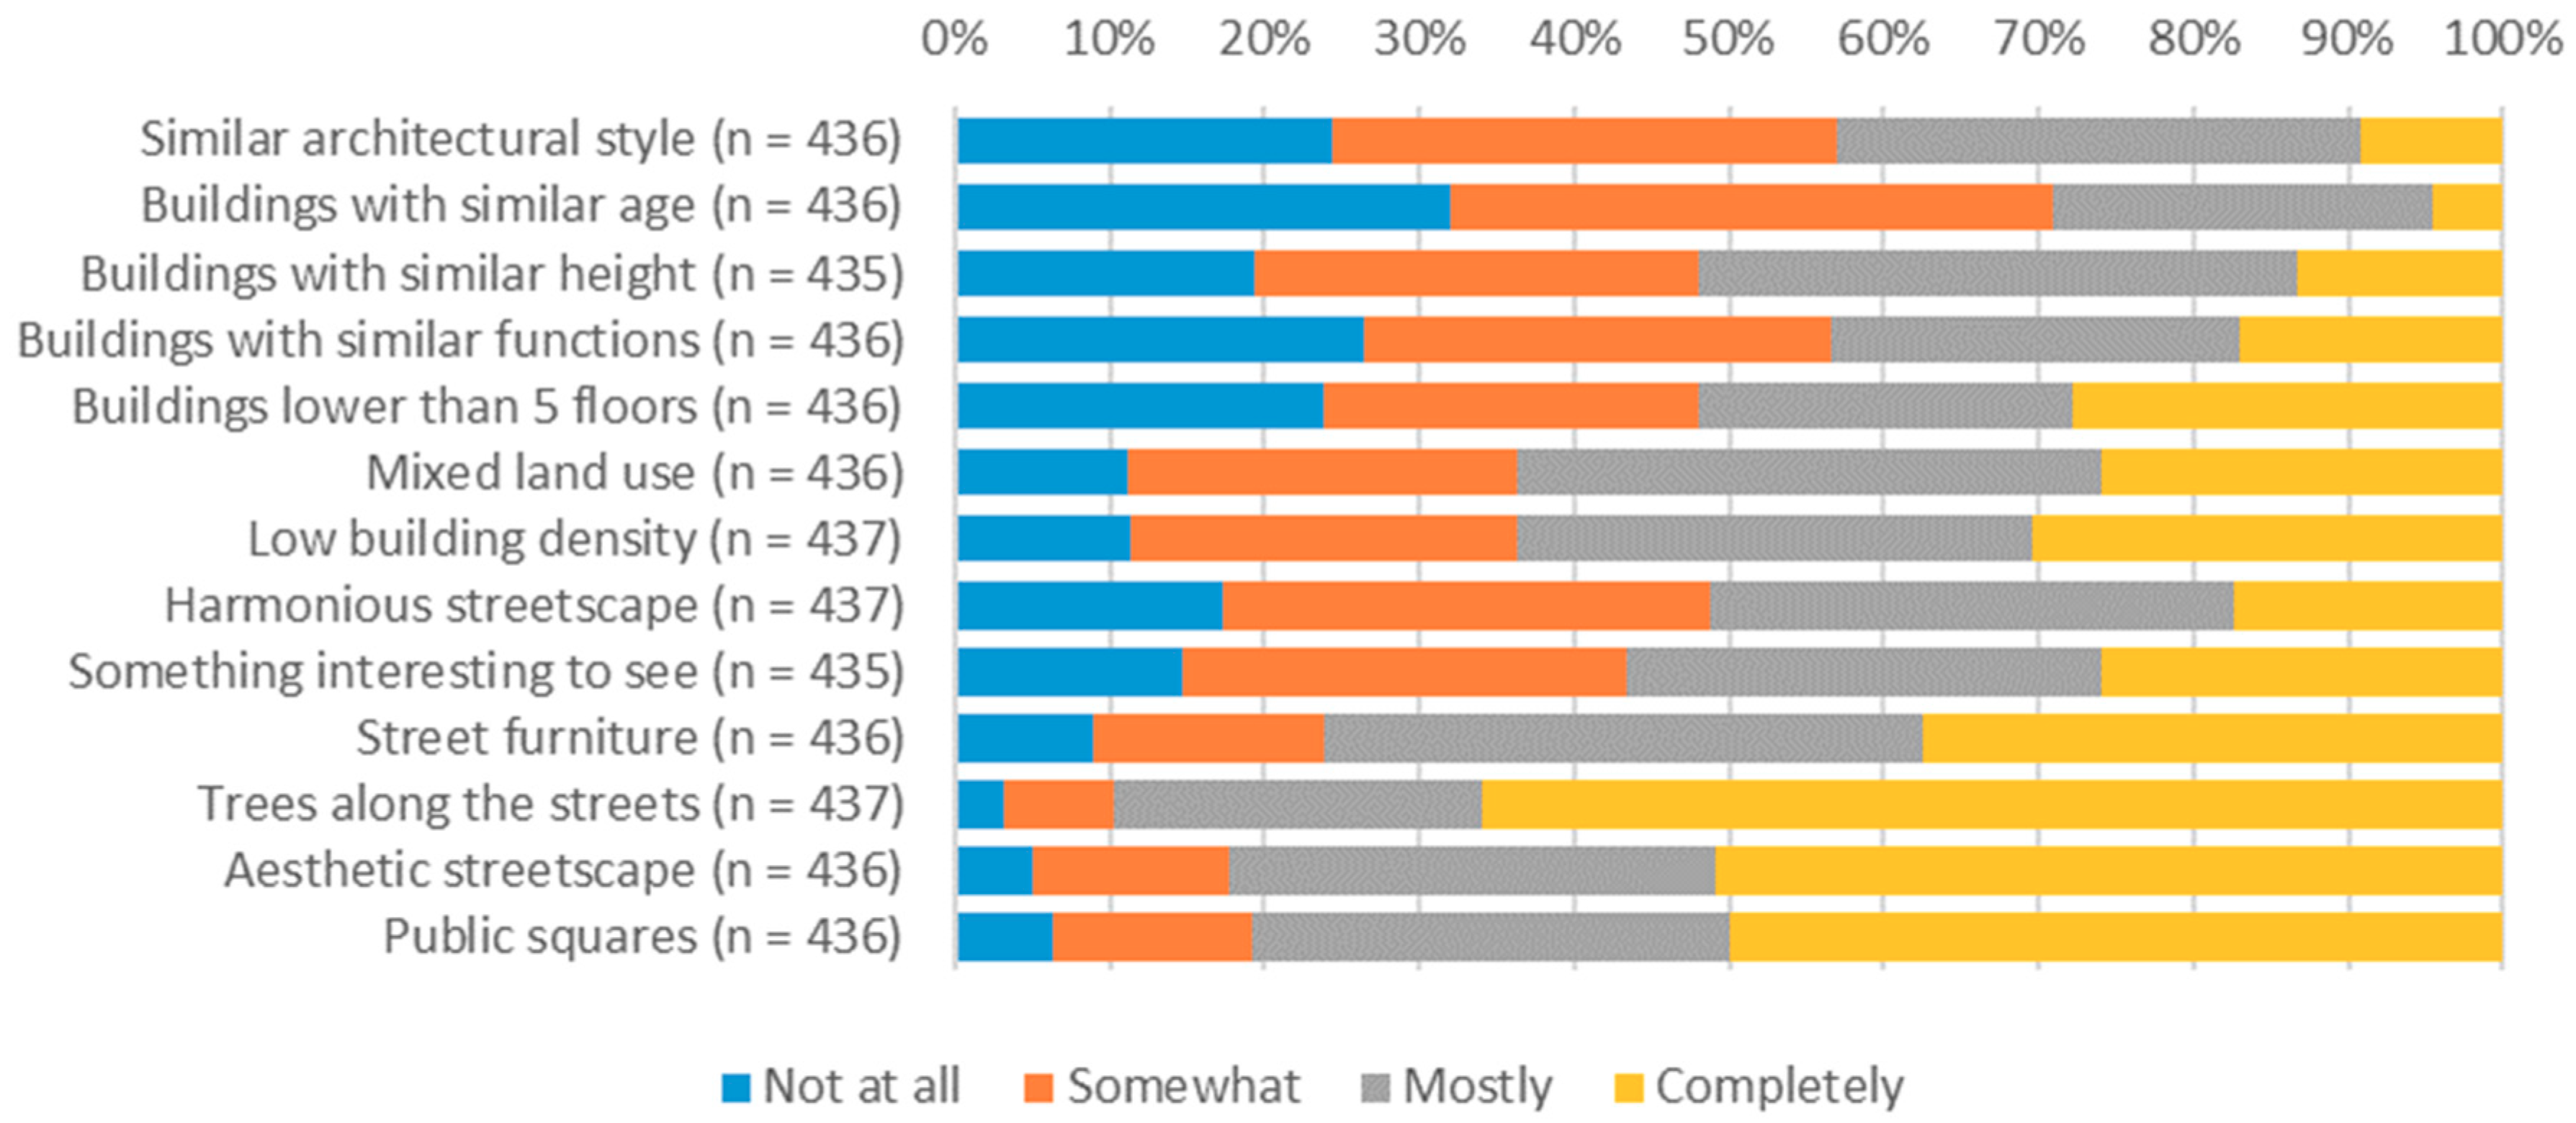
Regarding the importance of neighborhood’s features (Figure 3), it is striking how greenness, aesthetic streetscape, and public spaces to linger are neighborhood characteristics of high importance for consulted citizens of the different countries. We see here a clear importance of socio-ecological context over architectural features.
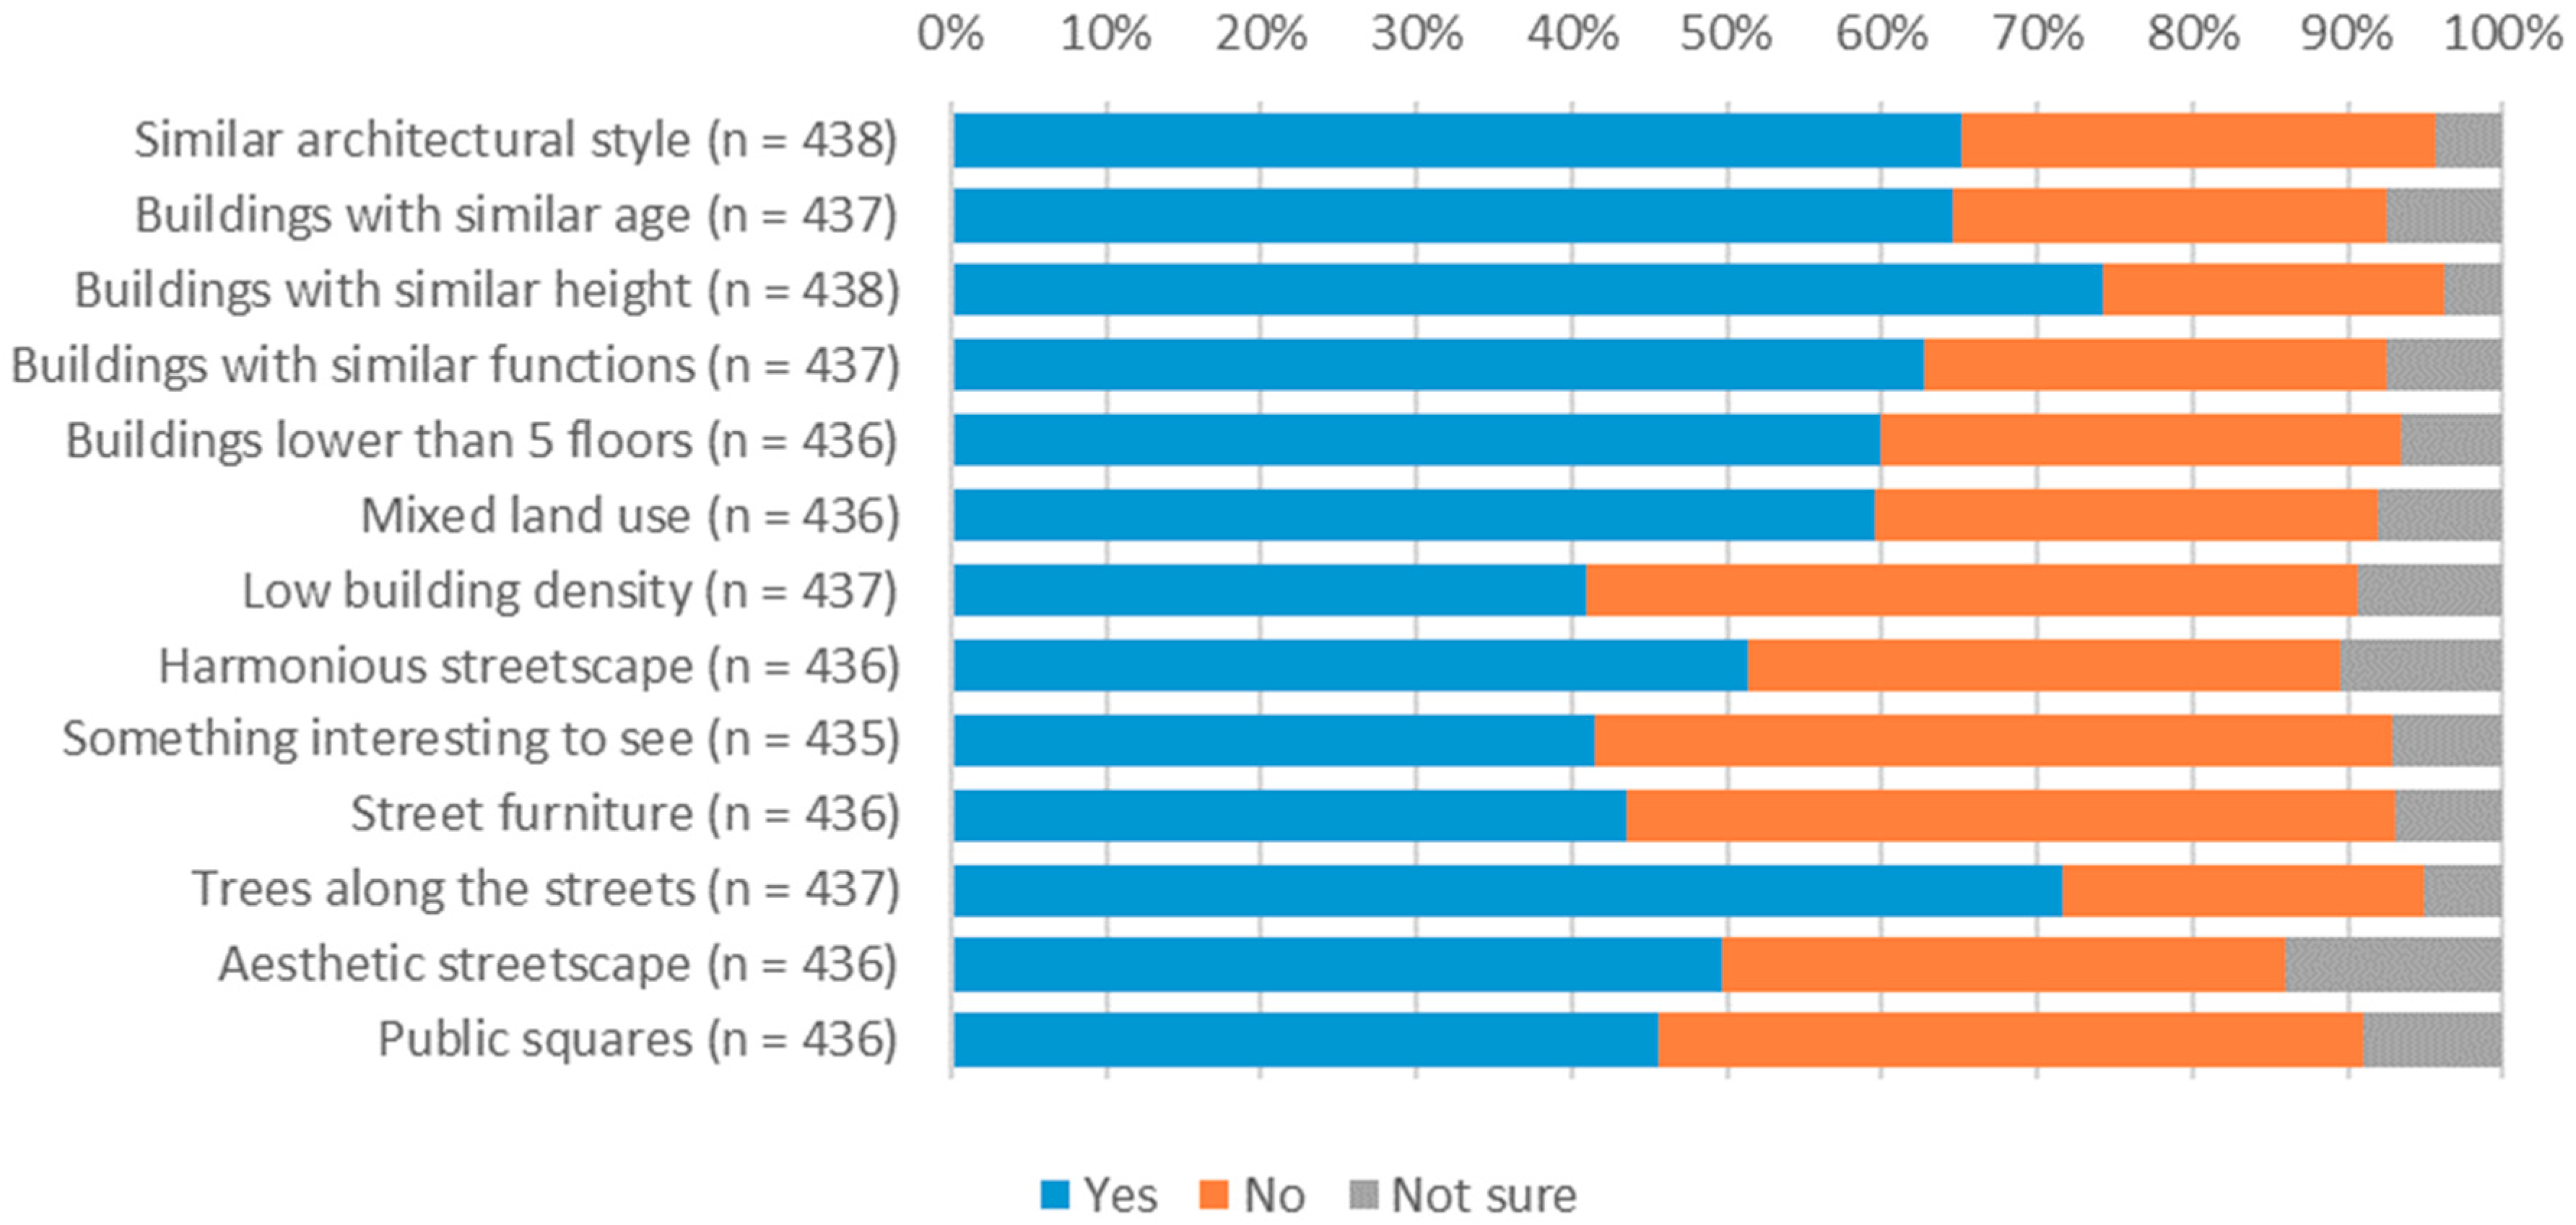
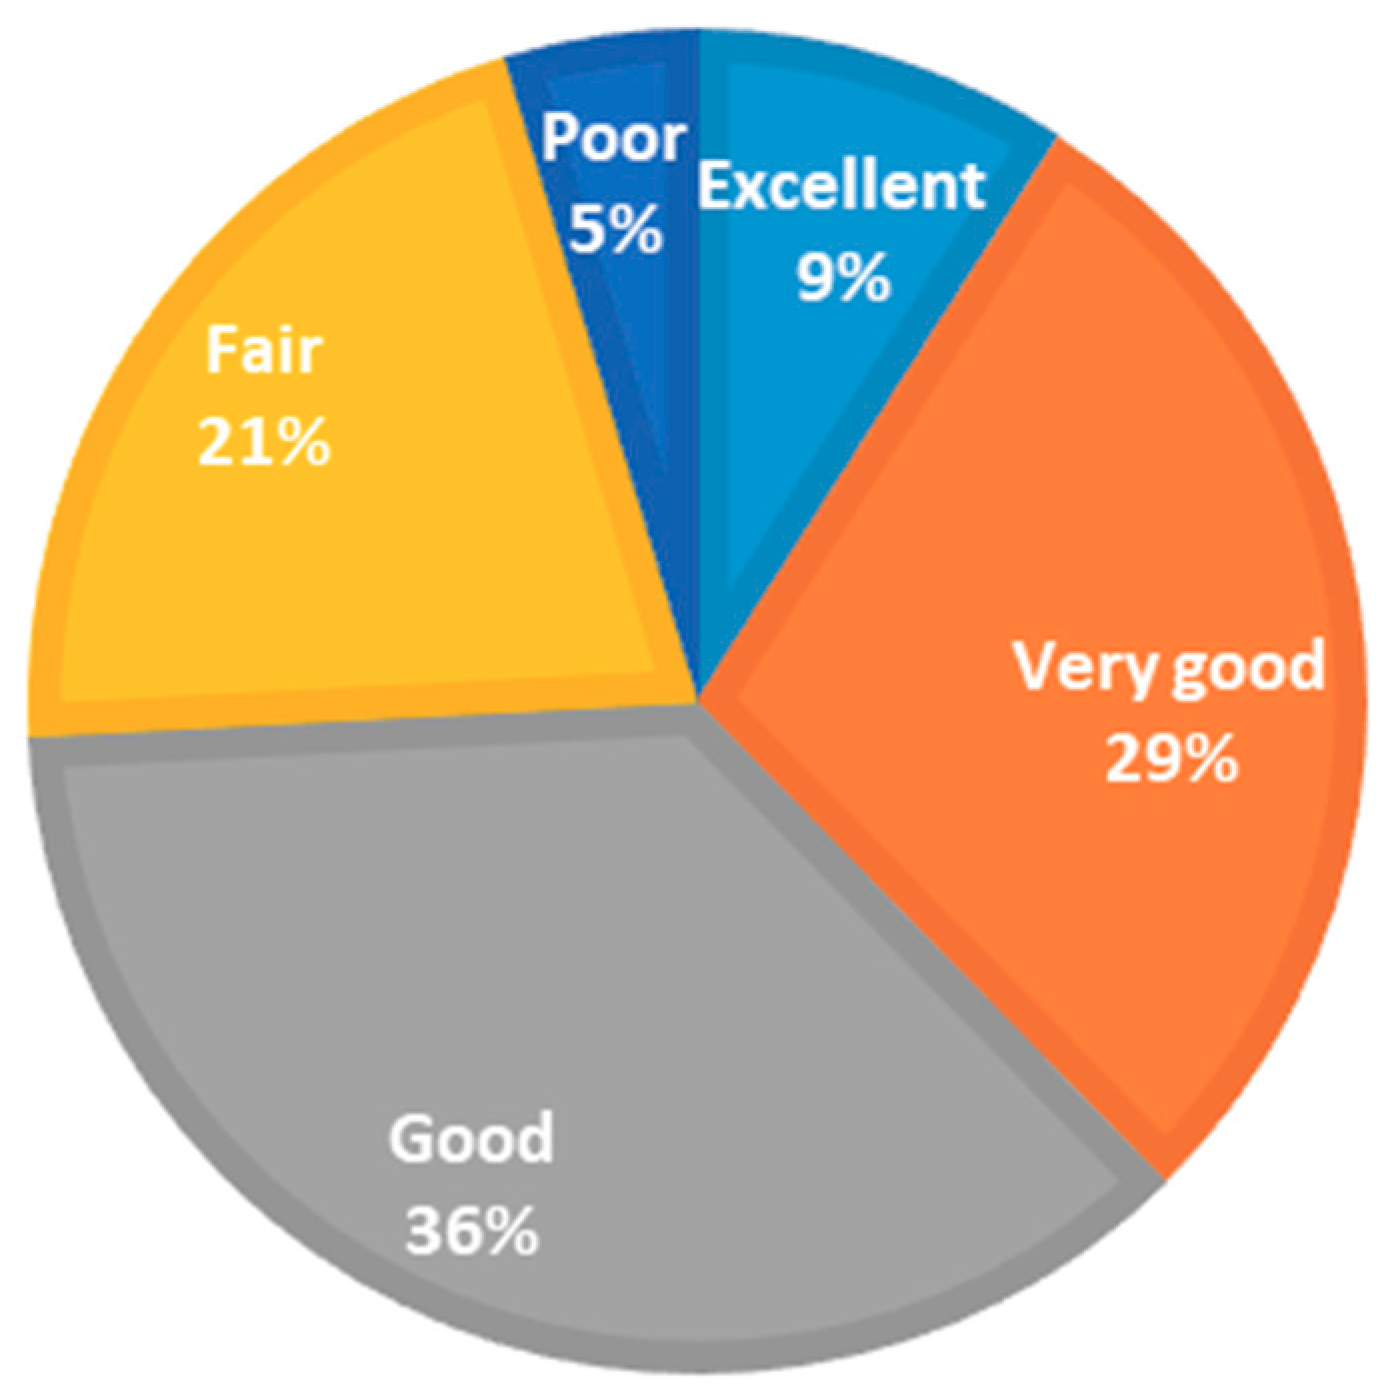
Trees are important, and many of the residents also reported to have them along the streets in their neighborhood (Figure 4). Whereas, in the case of the low building density, it occurs in many neighborhoods; however, the respondents do not find it really important. On the contrary, even if public squares are of high importance for urban residents, less than 50% of interviewees reported having these public spaces available for lingering. In terms of built environmental quality (Figure 5) three quarters of the respondents found their neighborhood good or even excellent.

4.4. Mobility

4.4.1. Questions

  • 1.a How often do you use the following modes of transport to go to work/school?
  • 1.b … to go shopping?
  • 1.c … to reach your destination for free time activities (e.g., meeting friends, going to restaurant, cinema, museum, sport facilities etc.)?
    (if the given activity applies, selecting multiple modes per activity is possible)
    Car/Public transport/Cycling/Walking/Other
    • All the time (every day, almost every day)
    • Most of the time (2–4 times in a week)
    • Occasionally (4–5 times in a month)
    • Rarely (1–2 times in a month)
    • Almost never (less than 10 times in a year)
    • I do not use this mode
  • 2. If you selected “automobile” for daily mobility at least once for the three questions above, to what extent do the following statements represent your feeling about transportation in the city?
    • I use a car because it is convenient.
    • I use a car because that is the only way to reach my destination.
    • I use my car because my destinations are usually too far.
    • I use my car because usually that is the fastest way to reach my destination.
    • I use a car because I am not able to walk or cycle due to my health conditions.
    • I use a car because public transport is not an alternative (too long/too many changes/poor accessibility).
    • I would walk/cycle more if it would be safer.
    • I would walk/cycle more if there would be more/better infrastructure. (e.g., sidewalks, bicycle lane, intersections with traffic light, etc.)
    • Using my car is expensive, but there are no more suitable alternatives.
    • I use my car because it is a general trend among other residents as well.
    • I use my car due to climate/weather characteristics (e.g., It rains a lot, it is too hot/cold).
    • I use my car due to topographic conditions (too steep).
    • I use my car even if there are traffic congestion because of the lacking competitive alternatives. (it is still the fastest/most convenient way).
  • 3. How safe do you consider cycling and walking in your neighborhood?
    • Very safe/Safe/Dangerous/Very dangerous
  • 4.a How important do you think it is to have the following in your neighborhood?
    • Not at all/Somewhat/Important/Extremely important
  • 4.b Does the neighborhood where you live have the following? Yes/No/Not sure
    • Accessible and convenient public transportation.
    • Affordable public transportation.
    • Well-maintained public transportation vehicles.
    • Reliable public transportation.
    • Safe public transportation stops or areas.
    • Special transportation services for people with disabilities and older adults.
    • Well-maintained streets.
    • Easy to read traffic signs.
    • Enforced speed limits.
    • Public parking lots, spaces and areas to park.
    • Well-lit, safe streets and intersections for all users (pedestrians, bicyclists, drivers).
    • Well-connected street network (more junctions, denser network) for all transportation modes.
    • Traffic-reduced areas (pedestrian and residential areas, 30 km/h speed limit, speed bumps etc.).
  • 5. How would you rate the overall quality of walking and cycling in your neighborhood? (also based on the features mentioned above)
    • Excellent/Very good/Good/Fair/Poor
  • 6. How would you rate the overall quality of transportation in your neighborhood? (also based on the features mentioned above)
    • Excellent/Very good/Good/Fair/Poor

4.4.2. Findings

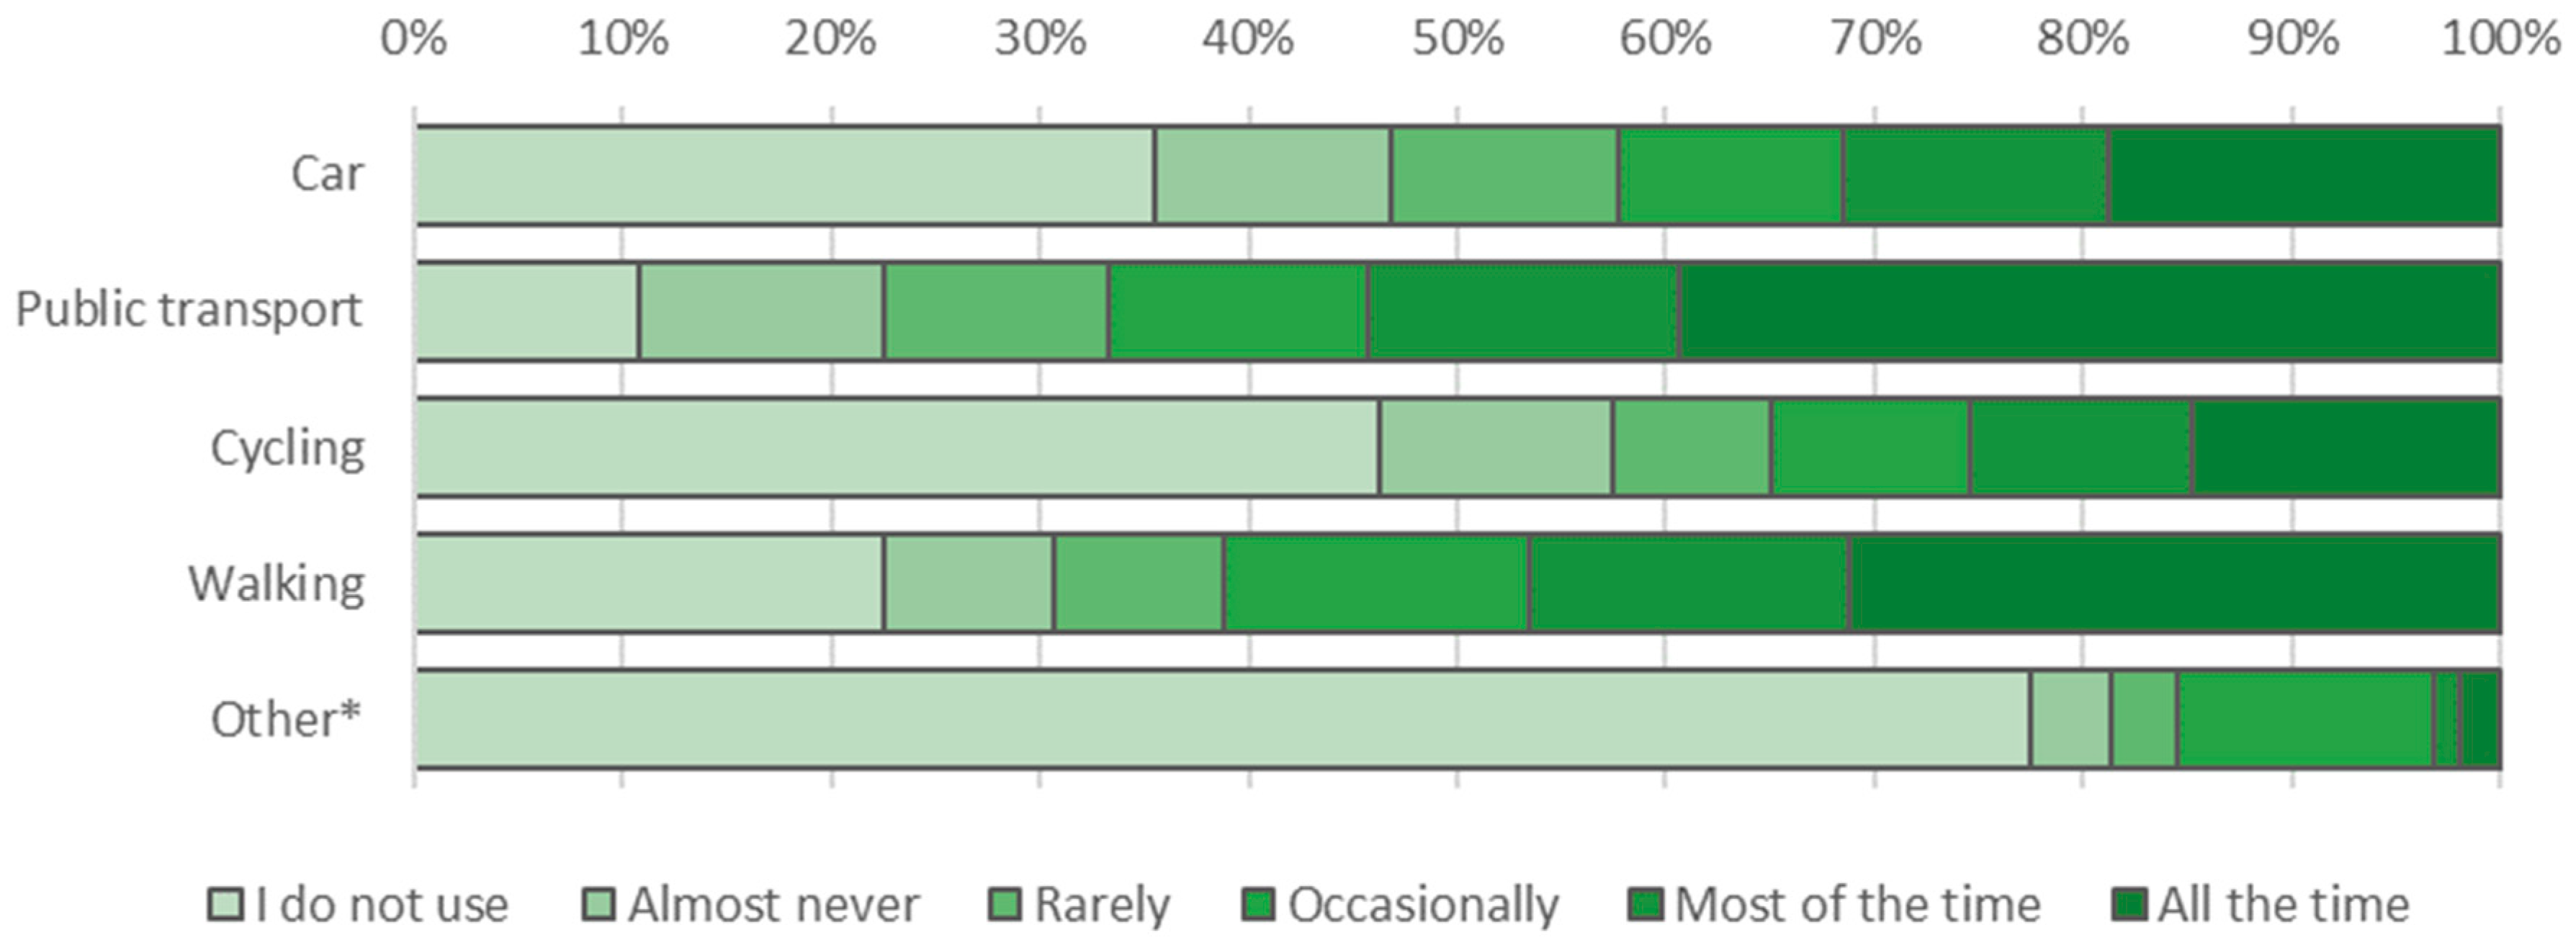
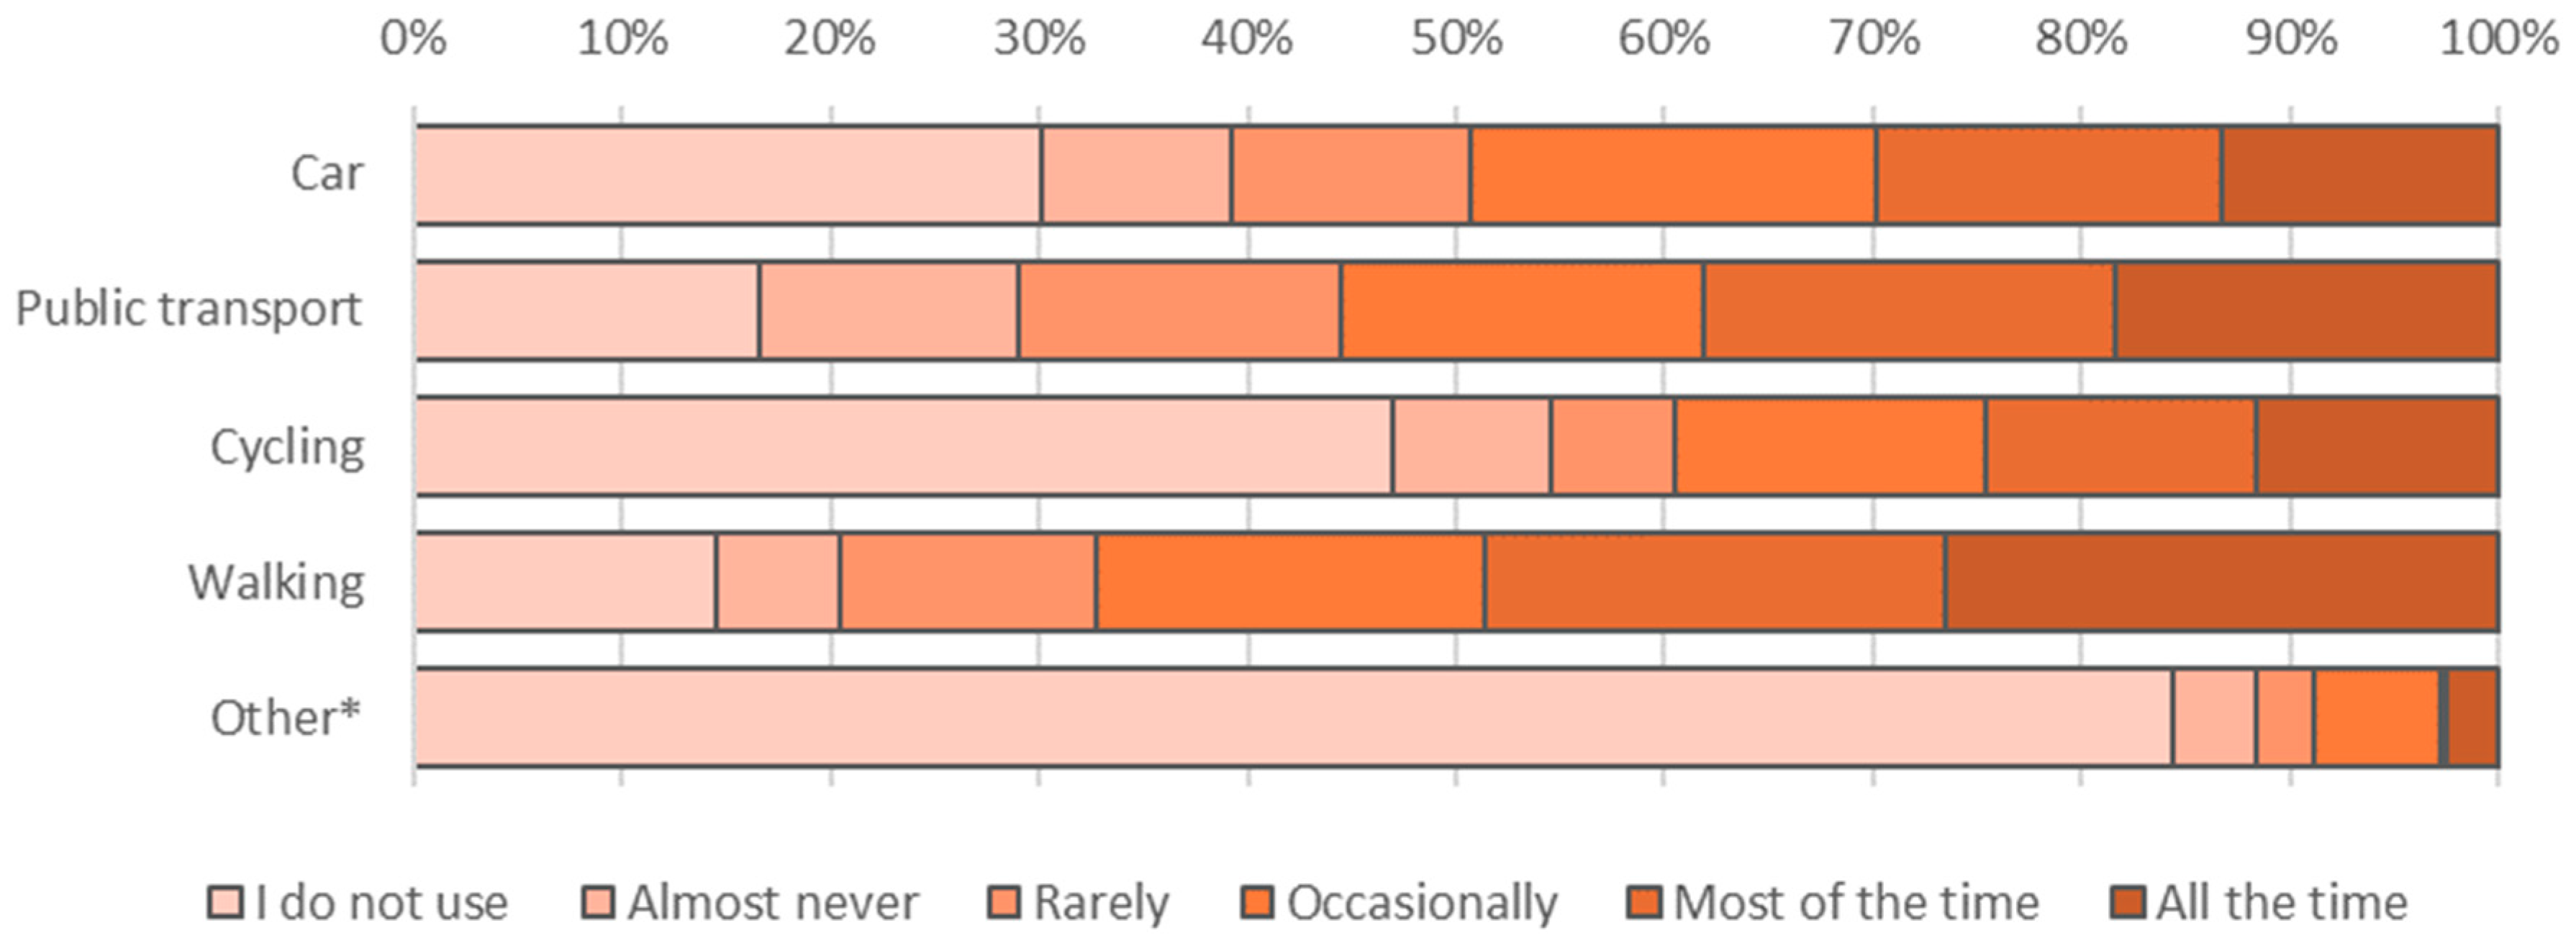
There are common patterns of frequency in using different transportation modes for different types of destinations (Figure 6, Figure 7 and Figure 8). Walking and use of public transportation are popular means of urban mobility. Using a car has an almost equal distribution for all three types of mobility (Figure 9). At the same time, using public transport is the most popular when people commute, while most people prefer to walk when going shopping. Cycling has a higher share in the case of going to work or in peoples’ free time.
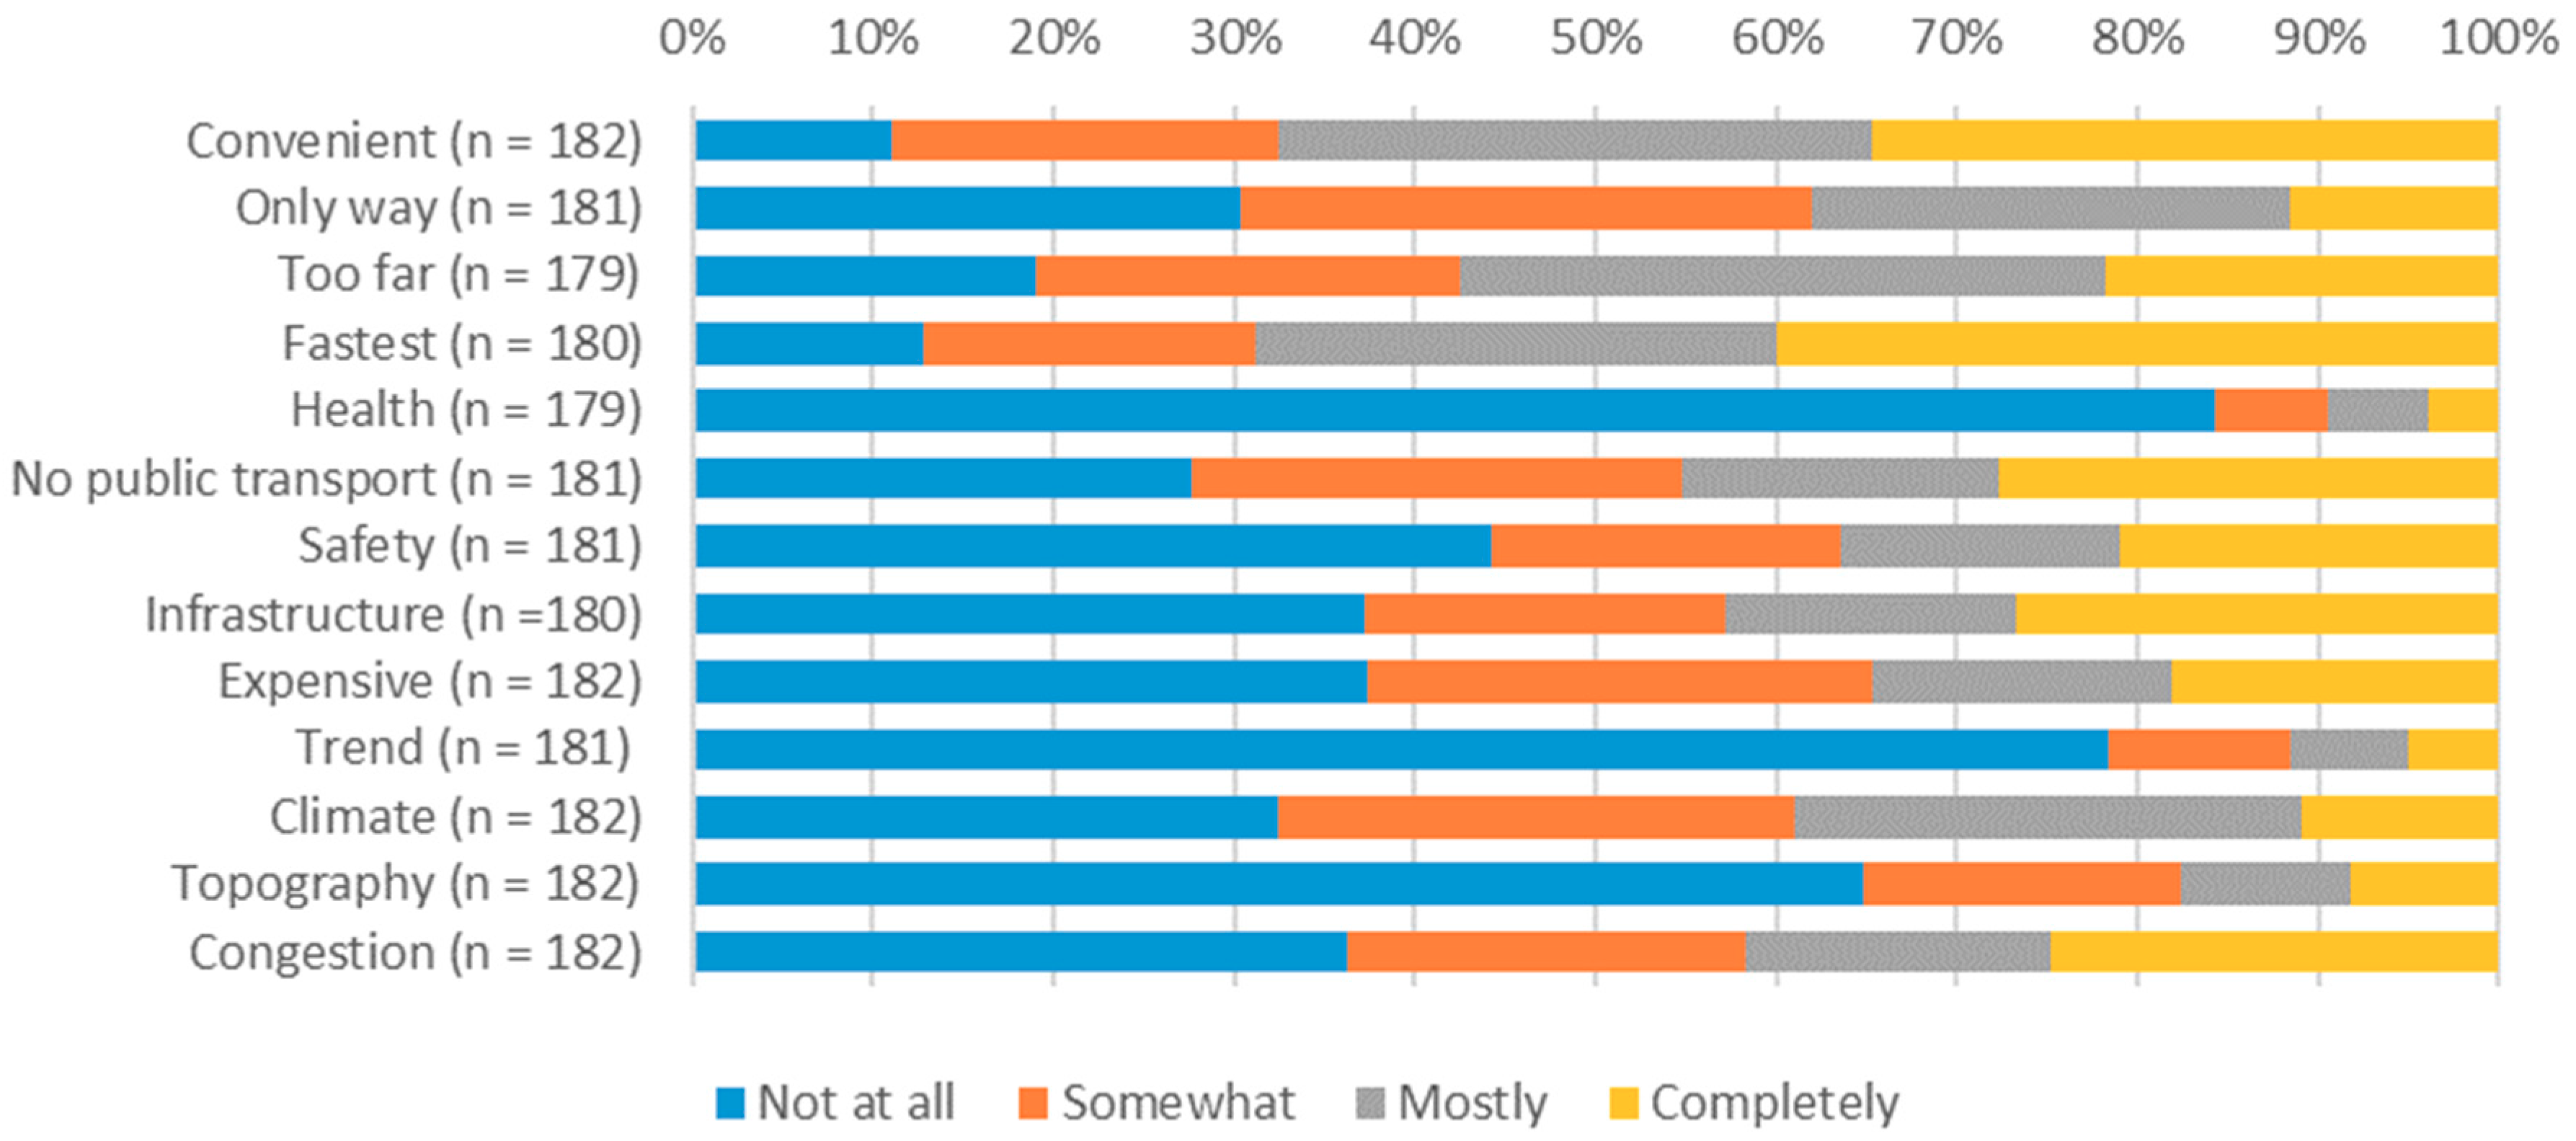
Results of the motivation for car usage (Figure 10) are striking. Residents agreed that the main reasons for using the car are convenience (67%), fastest mobility (68%), or the ability to reach far locations (64%). At the same time, health conditions, topography, or trend among community members were the main motivation for using a car only for a few people.
Figure 11 shows the evaluation of the respondents regarding perceived safety, and perceived quality for walking and cycling or transportation in general. More than 75% found walking and cycling in their area safe or very safe. Moreover, 70% found the quality of walking and cycling good or even excellent. Regarding overall transportation quality, the distribution is similar, 67% percent rated it at least ‘good’.
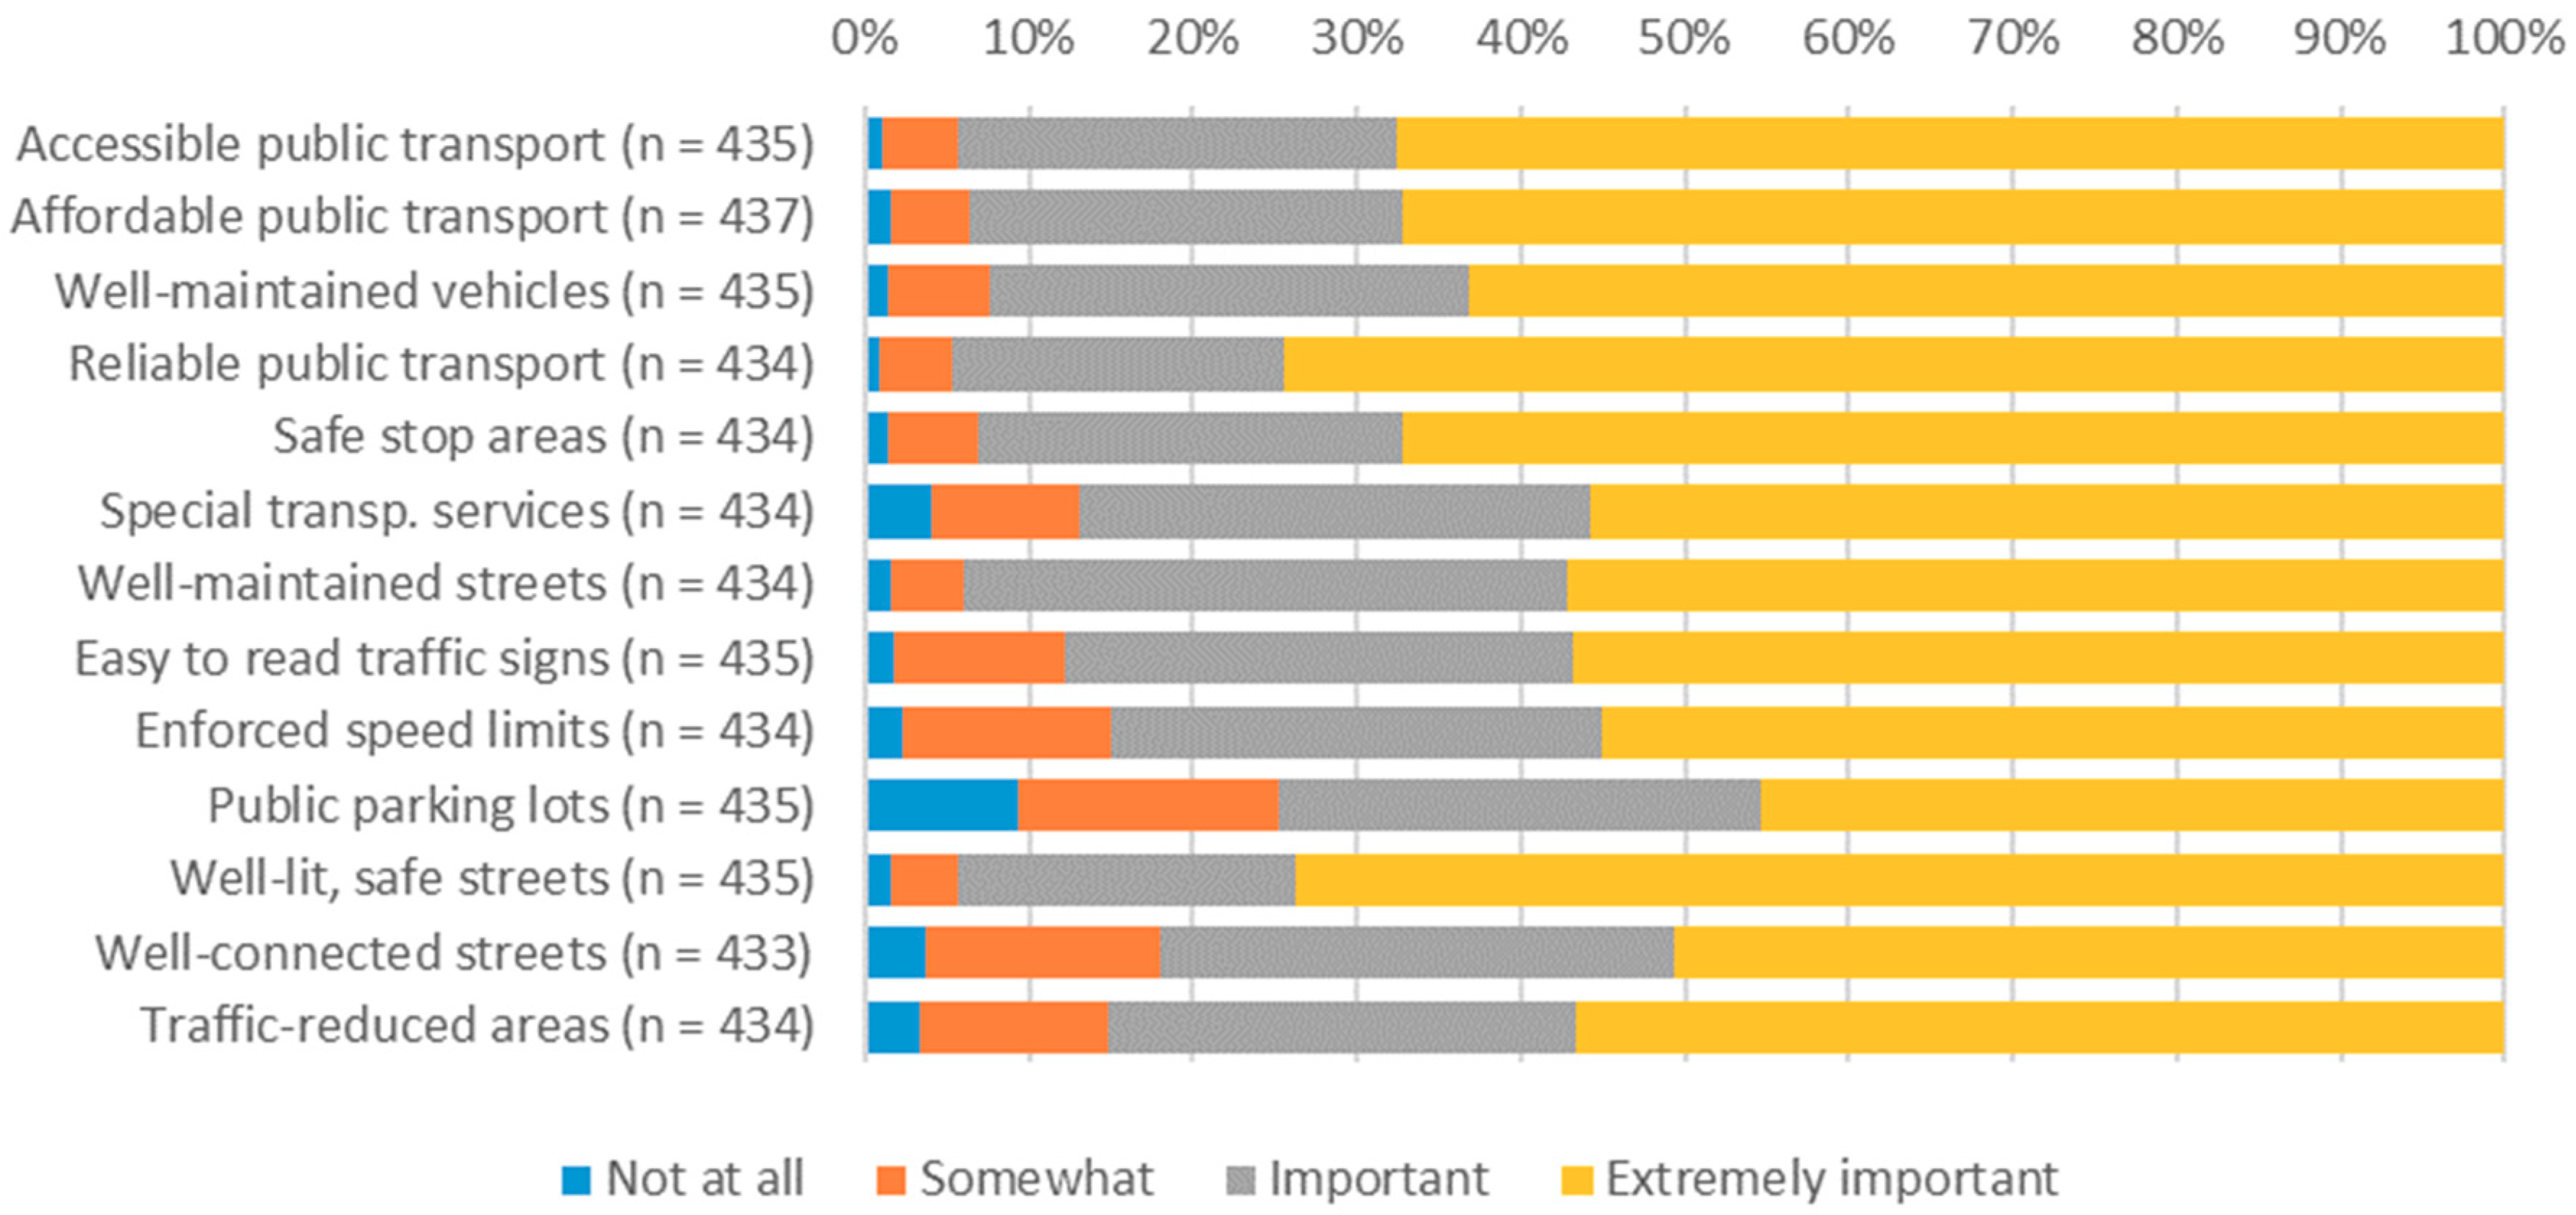
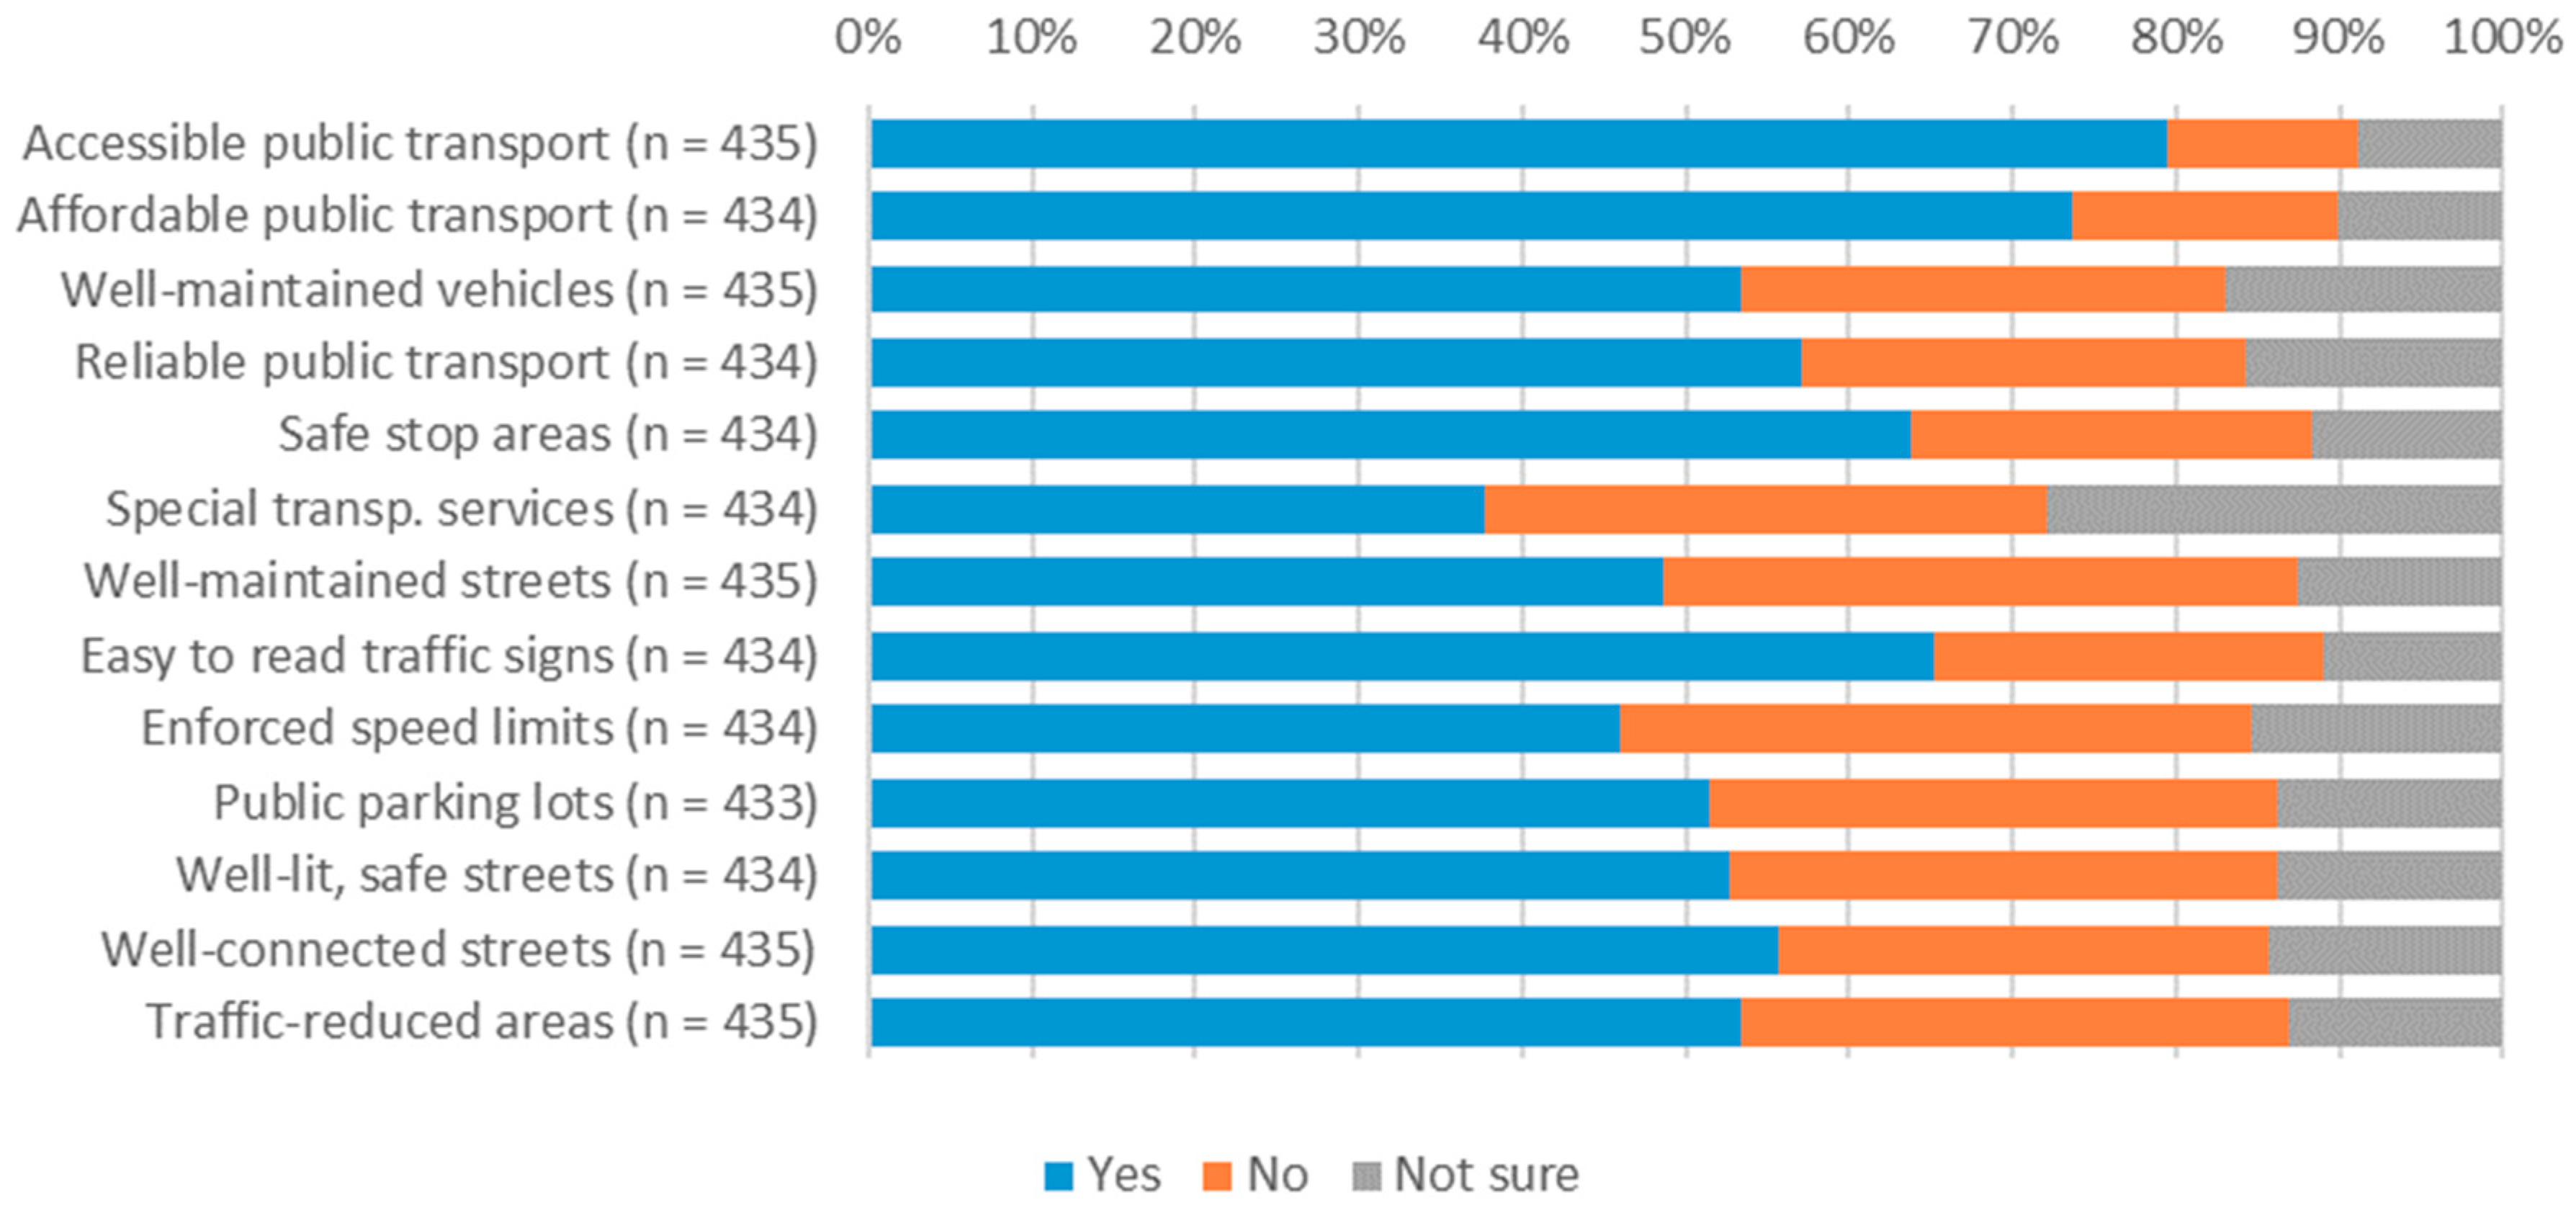
Concerning the mobility-infrastructure-related factors, accessibility, affordability, and availability of public transportation are the most important features, as well as the safety of streets (Figure 12). Figure 13 shows that if we consider the availability of these mobility infrastructure factors, special transportation services and enforced speed limits are the factors that are the least available. Although their importance values are also slightly lower than for example in the case of affordable public transportation.

4.5. Urban Functions and Needs

4.5.1. Questions

  • 1. How well does each of the following statements represent how you feel about mobility (and safety) in your neighborhood?
    • Not at all/Somewhat/Mostly/Completely/Not applies
      • There are many places I can go within 5–15 min walking distance of my home (e.g., to work, shopping, park, cinema, café, library, etc.).
      • There are sidewalks on most streets in my neighborhood.
      • There are bicycle or walking trails in my neighborhood.
      • It is safe to walk or jog near my home (traffic safety).
      • It is safe to walk or jog near my home (crime risk).
      • There is so much traffic that it makes it hard to walk near my home.
      • There is so much traffic that it makes it hard to walk near my working place/school.
      • There is a lot of crime in my neighborhood.
      • I often see other girls or boys playing outside in my neighborhood.
      • There are many interesting things to look at while walking in my neighborhood (e.g., other people outdoors, traffic, storefronts, interesting building/object).
      • I would let my child(ren) walk/ride a bike to school alone.
  • 2.a How important do you think it is to have the following in your neighborhood?
    • Not at all/Somewhat/Important/Extremely important
  • 2.b Does the neighborhood where you live have the following? Yes/No/Not sure
    • Well-maintained and safe parks that are within 5–15 min walking distance of your home.
    • Public parks with enough benches.
    • Sidewalks that are in good condition, free from obstruction, safe for pedestrian use, and accessible for wheelchairs or other assistive mobility devices.
    • Separate pathways for bicyclists and pedestrians.
    • Conveniently located venues for leisure (e.g., entertainment, recreation, meeting with friends).
    • Well-maintained and safe waterbodies (lakes, riverbeds, seashore, etc.) that are 5–15 min within walking distance of your home.
    • Shops (for everyday items such as grocery and other basic functions) within 5–15 min walking distance of your home.
    • Shops that provide fresh fruits, vegetables (and healthy grocery in general) within 5–15 min walking distance of your home.
    • Shops for non-everyday items (e.g., electronics, fashion, etc.) within 5–15 min walking distance of your home.
  • 3. Are your needs fulfilled in this neighborhood by the available urban functions? (for shopping, free time activities, etc.)
    • Completely/Mostly/Somewhat/Not at all

4.5.2. Findings

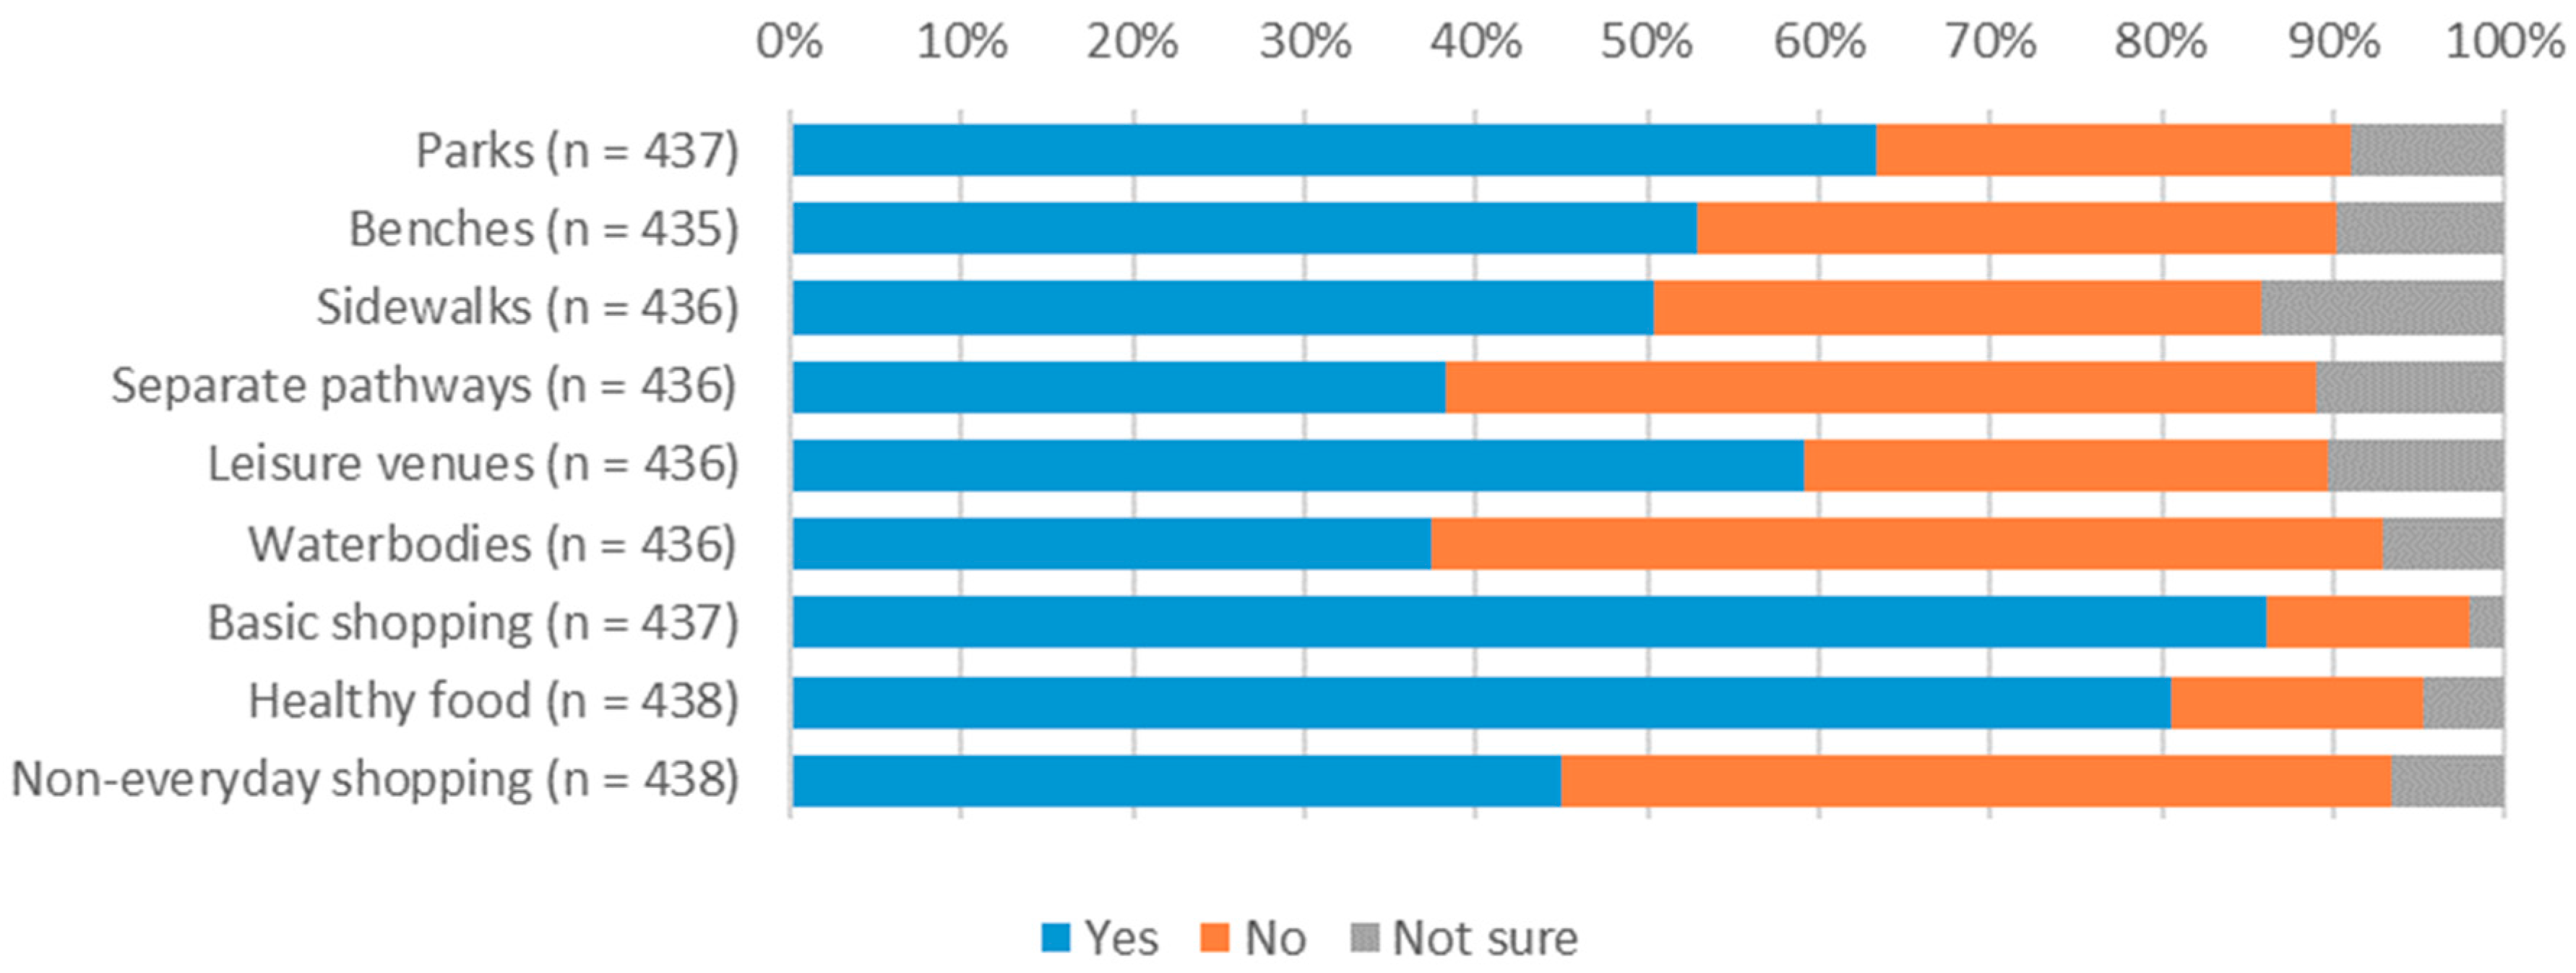
According to the respondents, livable neighborhoods are walkable places, meaning safe and convenient sidewalks (Figure 14) as well as with proper accessibility to green areas and healthy food or basic shopping facilities (Figure 15). While most of the people have access to these shopping facilities, many neighborhoods lack separate pathways for pedestrians (Figure 16).
Figure 17 shows that the needs of around 30% of the respondents are not fulfilled by the available urban functions in the neighborhood.

4.6. Housing

4.6.1. Questions

  • 1. Do you own or rent your primary home—or do you have some other type of living arrangement, such as living with a family member or friend?
    • Own/Rent/Other (please, specify):
  • 2. What is the type of your primary home?
    • Single family house/Apartment/Other, please, specify:
  • 3. Do you have access to clean (tap) water in your home?
    • Yes/Not always/No
  • 4. Do you have access to electricity in your home?
    • Yes/Not always/No
  • 5. How would you rate your overall housing conditions?
    • Excellent/Very good/Good/Fair/Poor

4.6.2. Findings

Figure 18 depicts the different types of homeownership and house types, as well as the overall evaluation of the housing quality. The proportion of people who own or rent their homes are almost the same. Whereas two times more people among the respondents live in apartments than in family houses. Overall, less than 10% of the people find their housing quality not good.
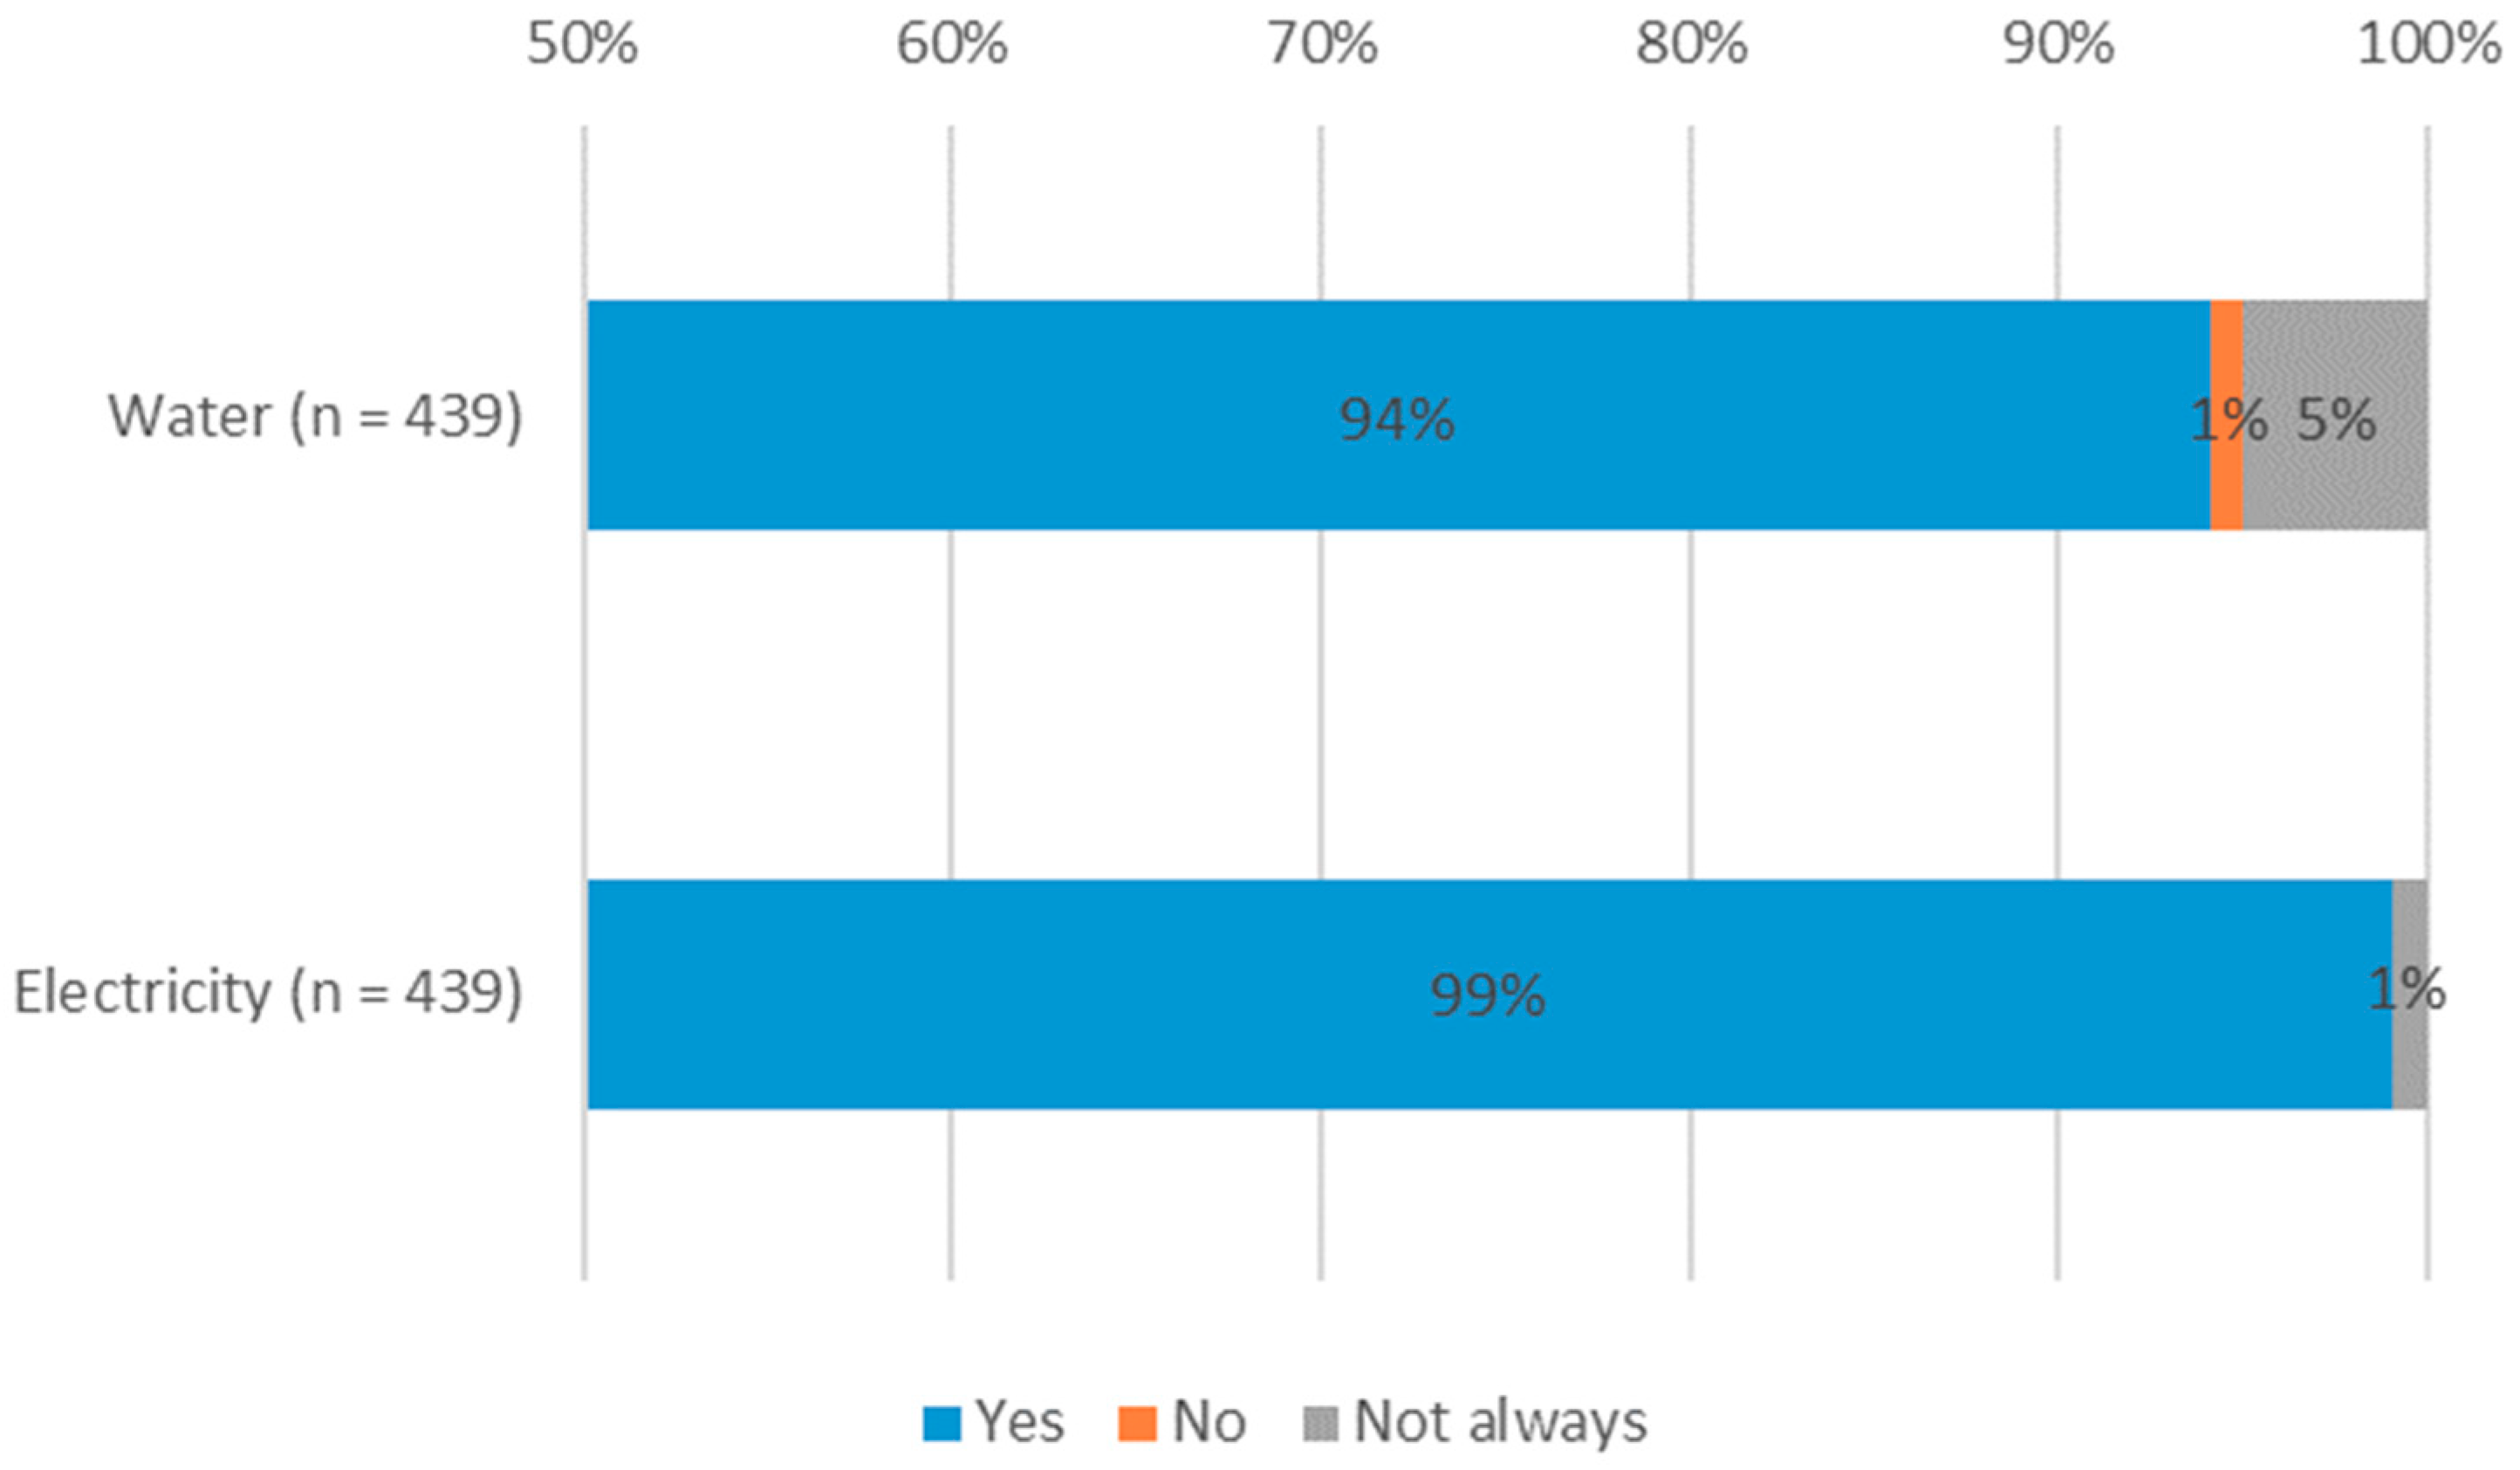
Regarding the basic infrastructure, 99% of the responses reported stable electricity and 94% stable water access (Figure 19).

4.7. General Satisfaction

4.7.1. Questions

  • 1. How satisfied are you with living in this city? Does it fulfill your needs? Think about the built environment, the services, transportation, and housing conditions, security etc.
    • Not at all/Somewhat satisfied/Satisfied/Very satisfied
  • 2. What are the three most important things/characteristic/function/etc. for you in a city to consider it livable (good quality, fulfilling your needs and expectations)? Please, list them!

4.7.2. Findings

To investigate the statistical relationship between the general satisfaction of the residents and their socioeconomic and demographic conditions, we used a Kruskal–Wallis H test. This non-parametric method is appropriate to compare different samples, in the case of categorical ordinal dependent variable, which is in our case the satisfaction with living in a given city. As the distribution of the responses in almost all cases had different shapes for a given category, we only used the test to compare the mean ranks instead of the median values. The null hypothesis in this case is that the mean ranks of the groups are the same. However, if there are more than two independent variables as grouping parameters, the Kruskal–Wallis H test is only able to point out that there are at least two statistically significant groups. To determine which of the groups differ from each other, a pairwise post hoc test is necessary.
We rejected the null hypothesis in the case of development (p < 0.01), place of residence (p < 0.01), the household size (p = 0.013), and income levels (p < 0.01). This means that the mean ranks for these groups in our sample are significantly different, and therefore, there is a statistical connection between these socioeconomic parameters and the perception of livability. However, this does not apply for the remaining parameters from Section 4.1, such as sex, education level, marital status or age. The significance of the level of development might shows the relevance of the fulfillment of basic needs by the available services in a city. This means that livability is a non-linear phenomenon, and different urban functions or the characteristics of the urban environment can have very different influence at the different contexts. Alternatively, this influence tends to be more similar in the case of basic needs than for more advanced ones, such as leisure, aesthetics, or self-realization.
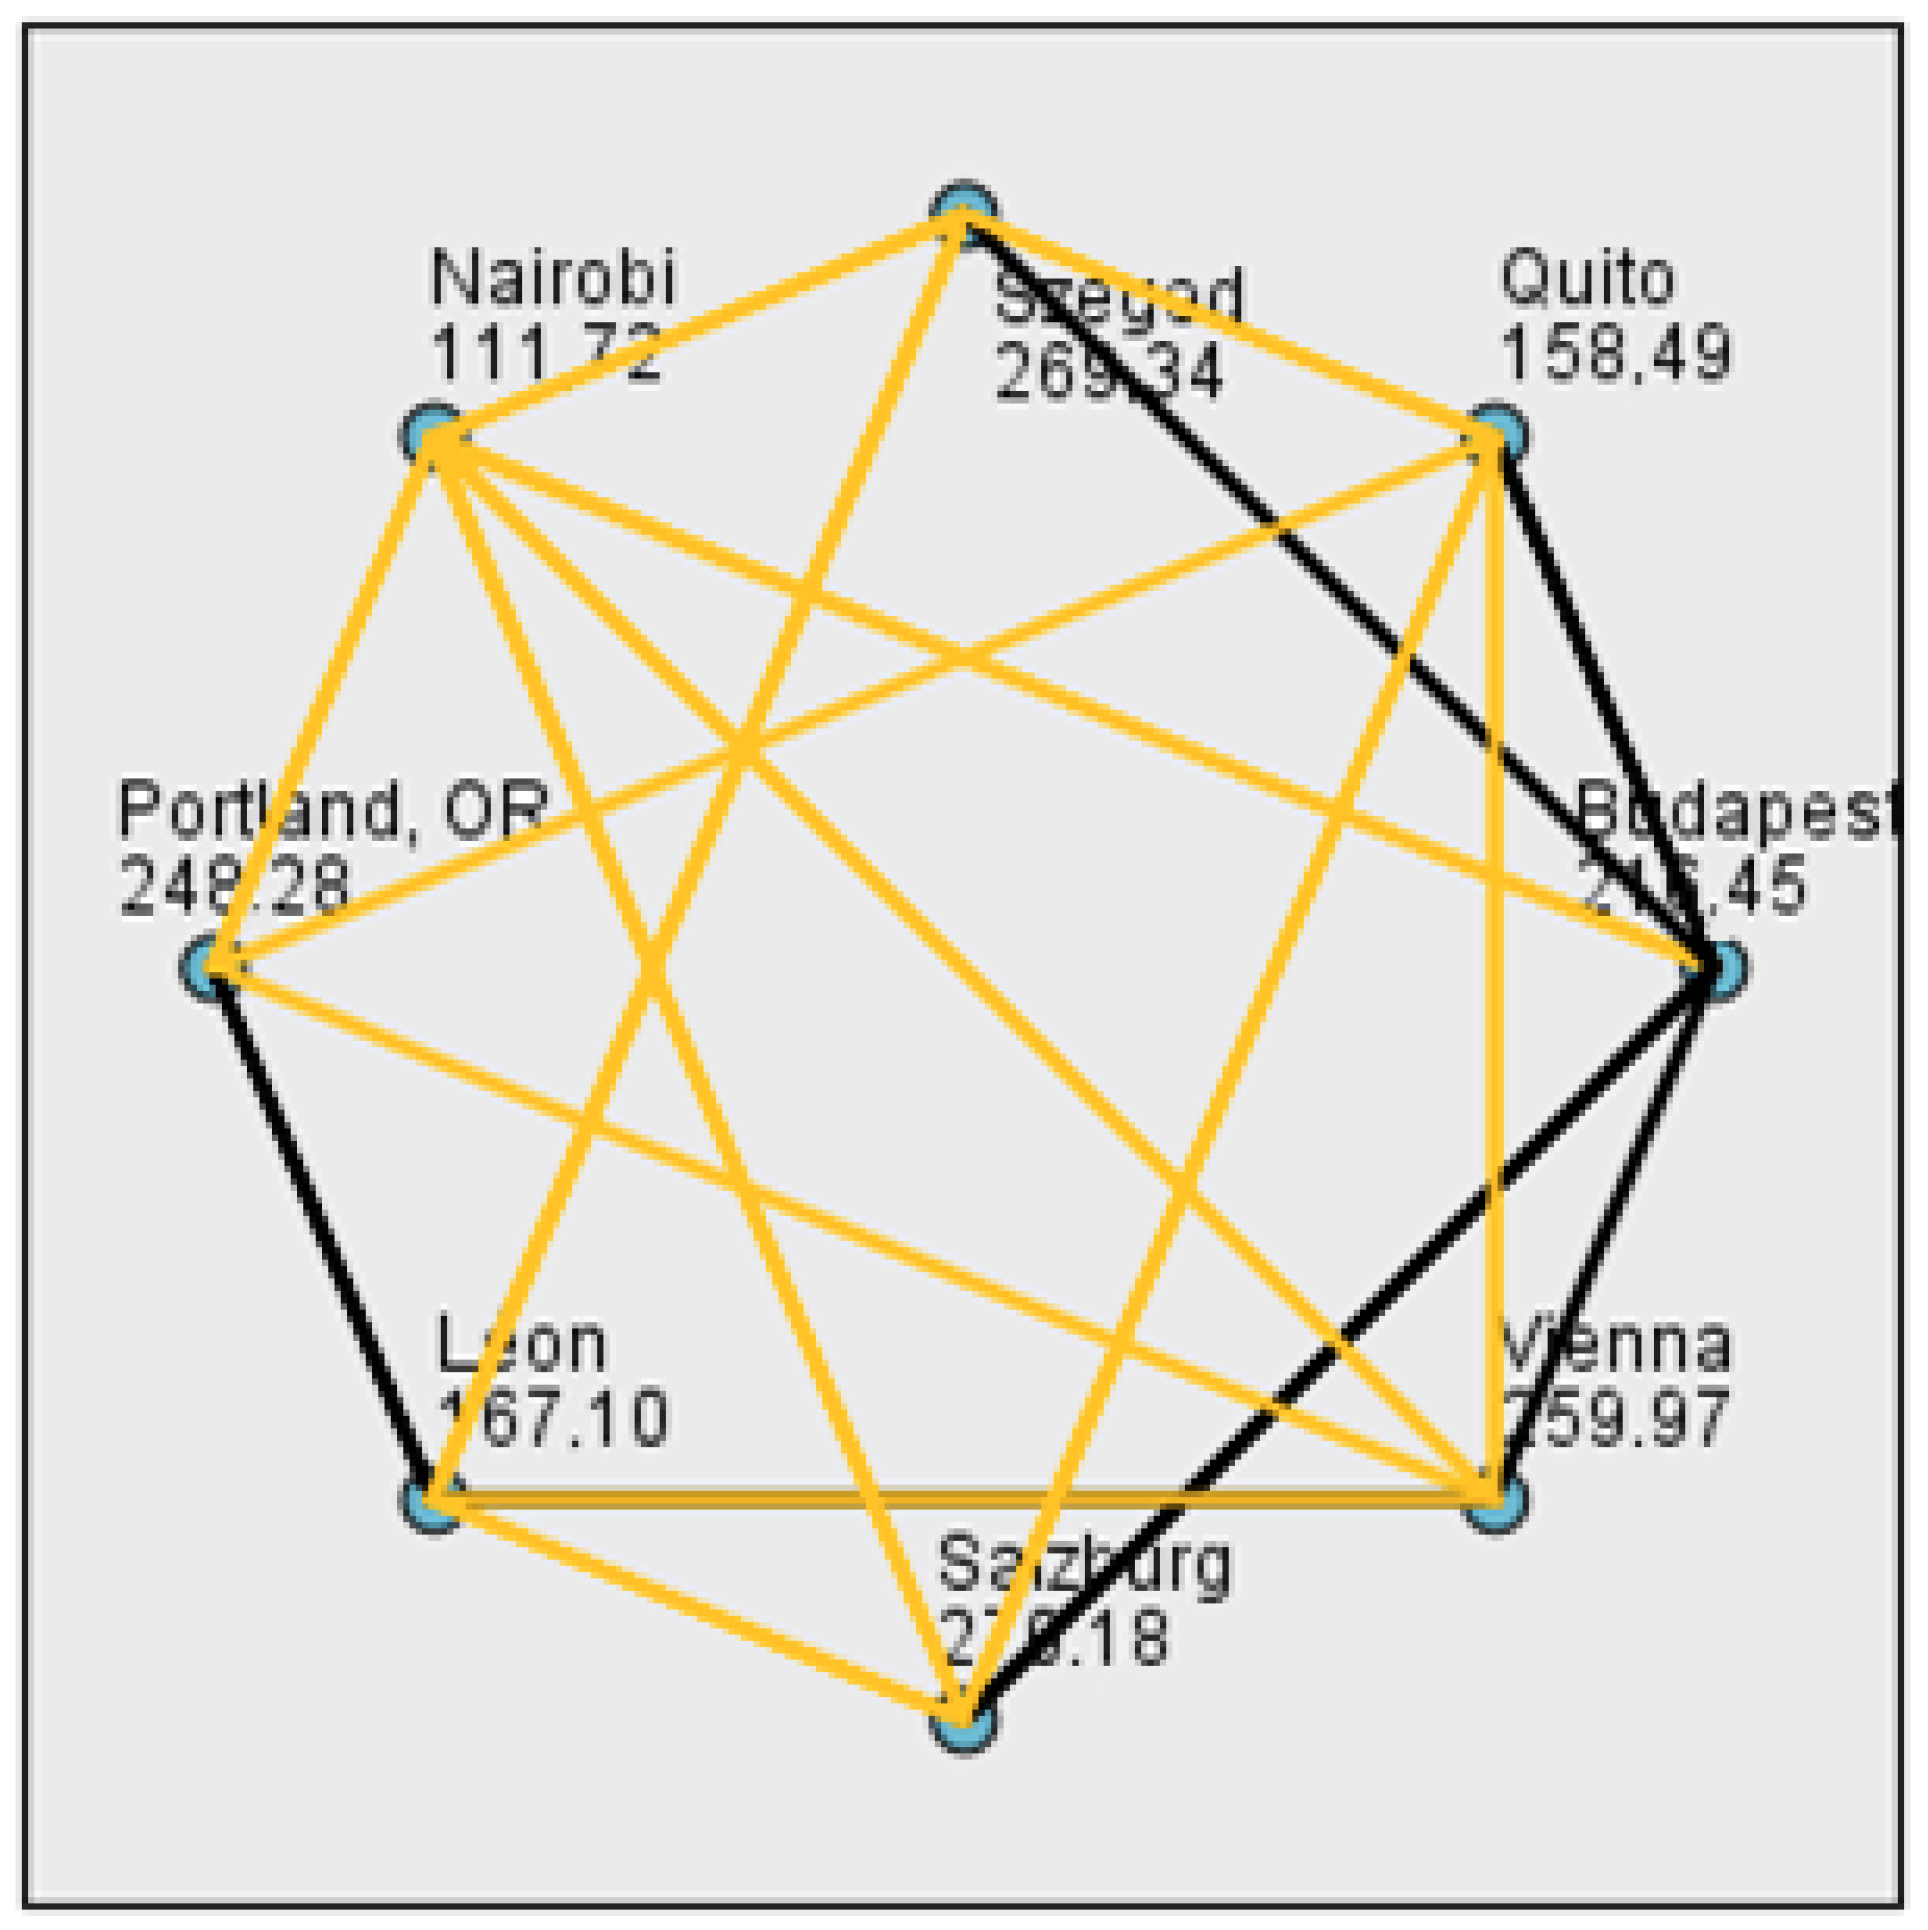
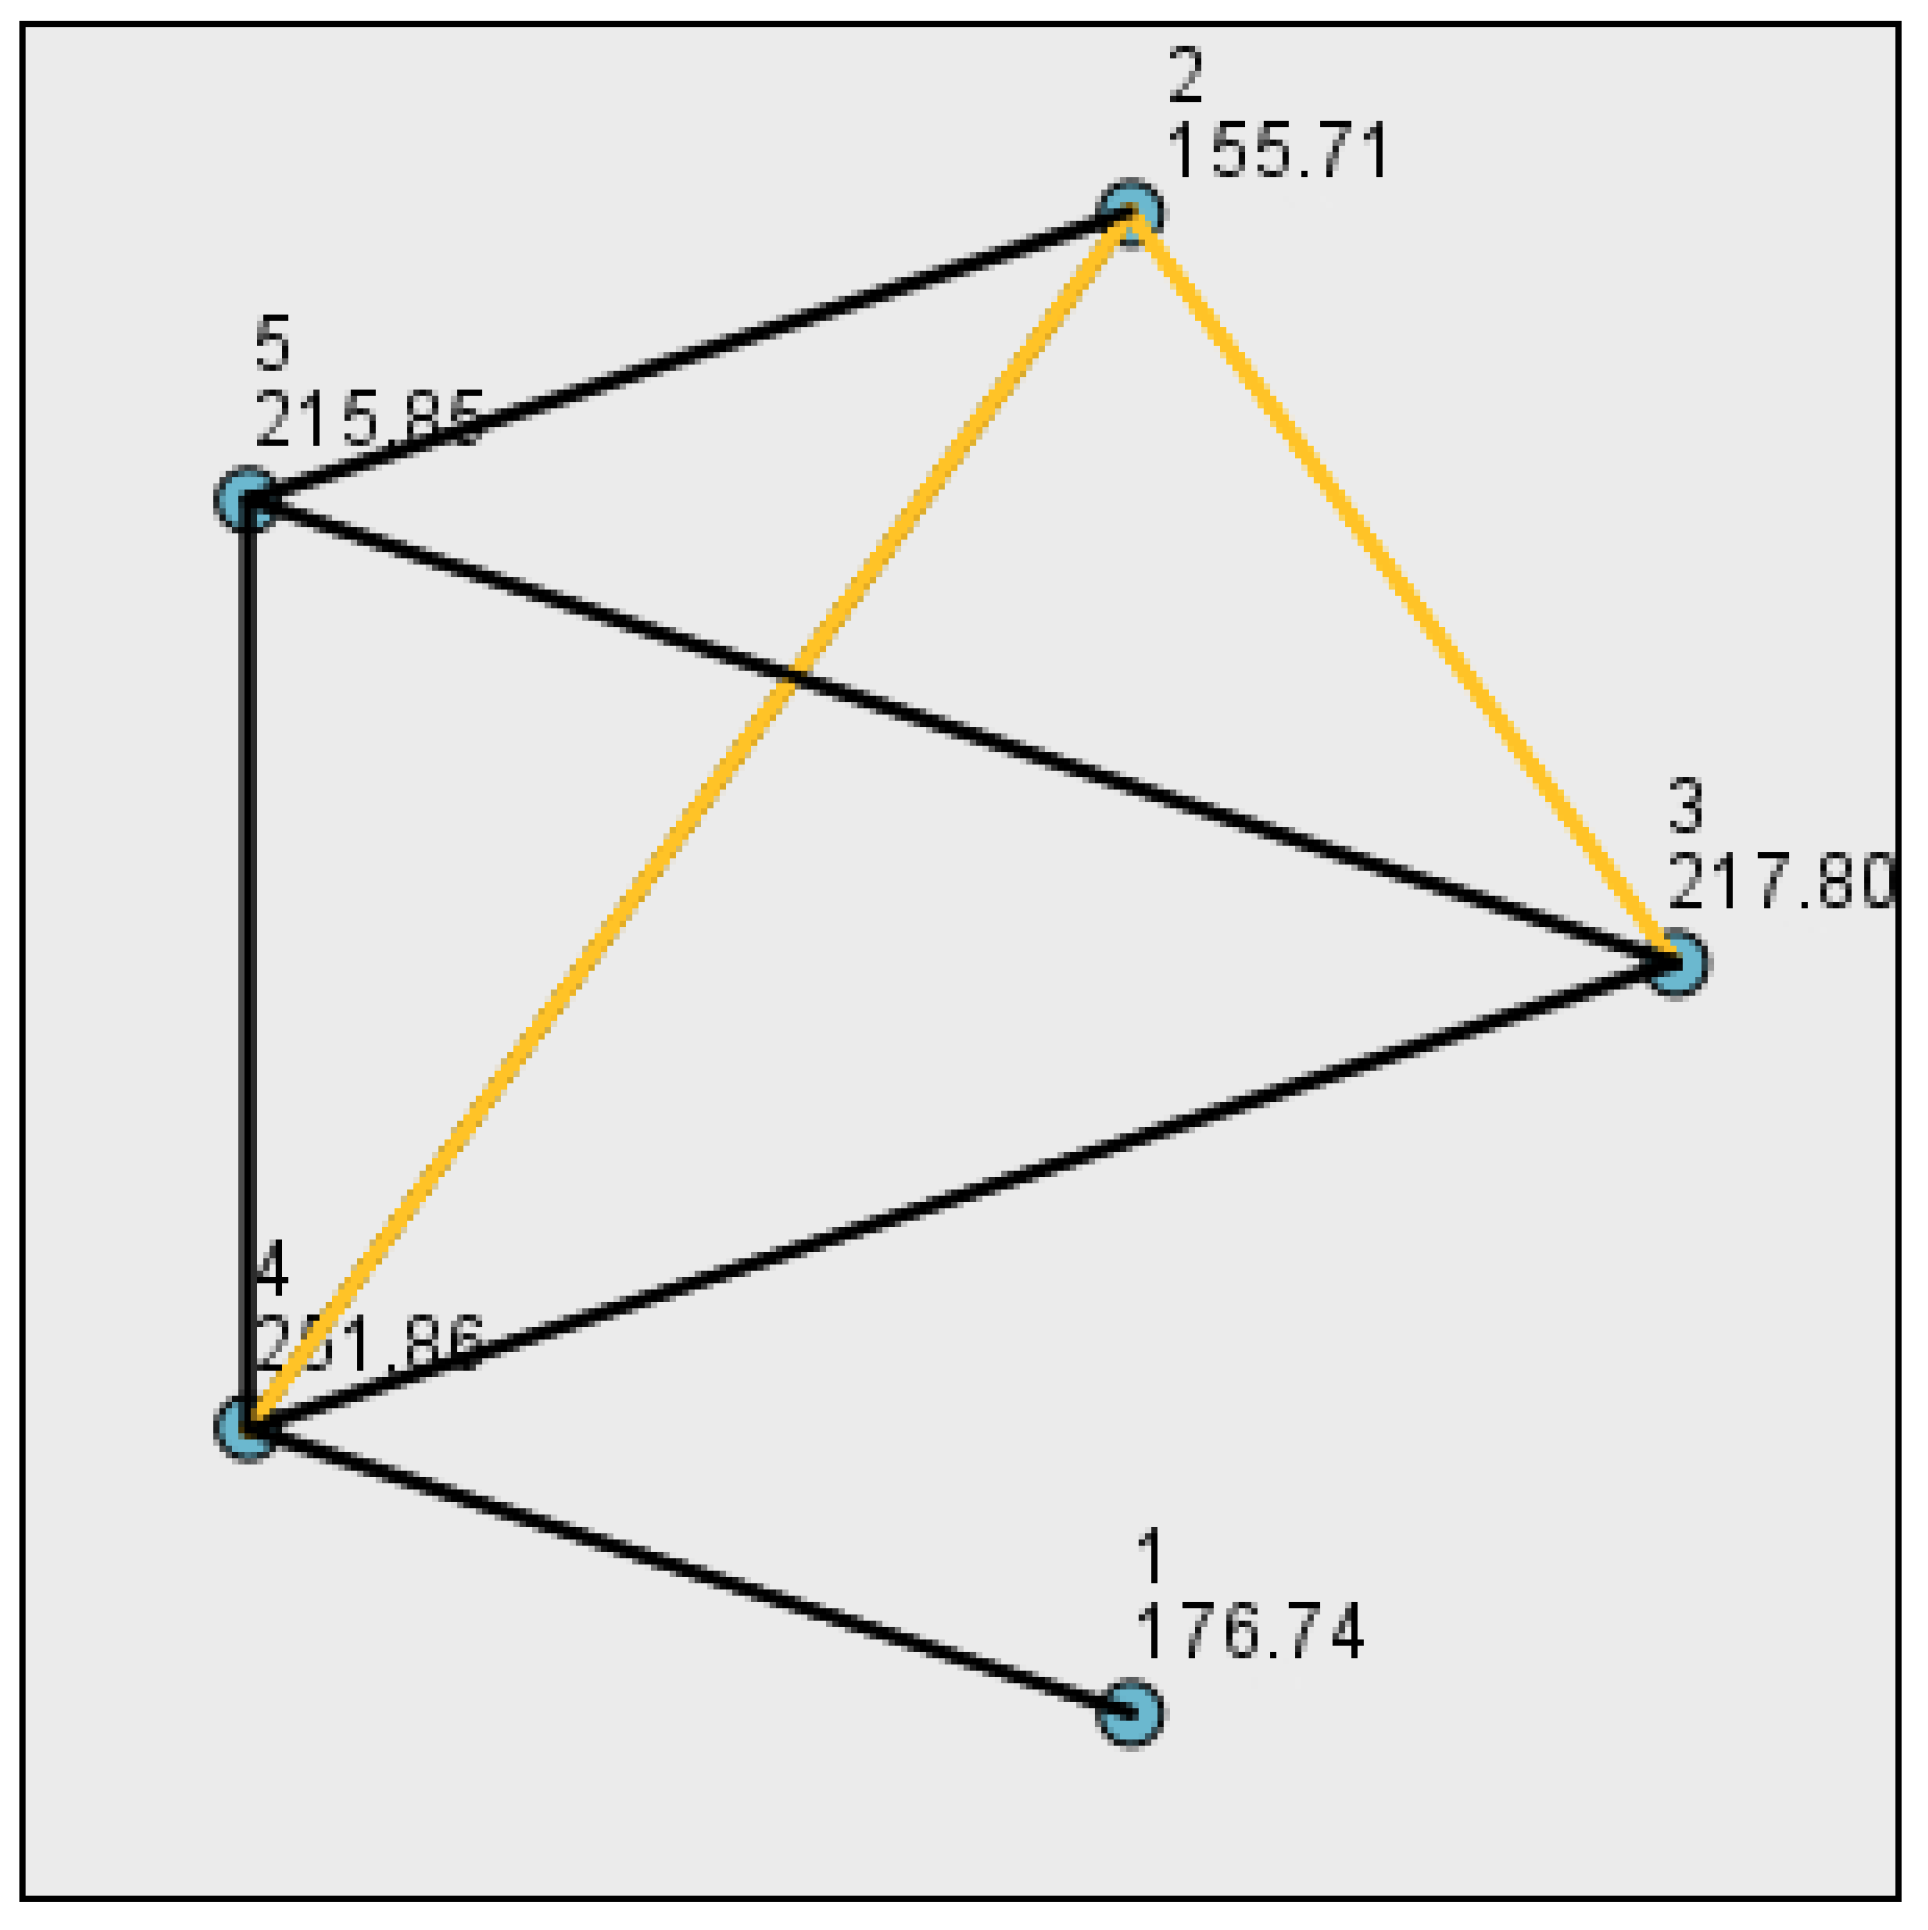
According to the results of the Kruskal–Wallis H test, city-specific characteristics can also influence by itself the perceived satisfaction. People from Salzburg and Szeged tended to be more satisfied, whereas residents in Nairobi found their place the least livable. Figure 20 depicts the pairwise comparisons of the mean ranks, and the orange lines indicate the significant connections. Except in the case of Budapest, almost all connections are statistically significant.
Another factor that might affect the perception of livability beyond urban environmental factors is the number of persons living in the household. Our analysis showed that respondents having households with one or two persons reported higher satisfaction on average than people from large households consisting of more than four people (Figure 21).
The connection between income level and perceived satisfaction was also identified in the regression analysis performed in the main research paper [4]. The post-hoc test showed that people reporting on having an income, which is less what they need to fulfill their basic needs were less satisfied with living in a city than respondents whose income is enough or more than what they need to cover expenses considering basic needs. However, this holds not for the richest dwellers, as the connection in this case was not significant with any other groups (Figure 22).
The second question in this thematic group was open, as there were no given answers, and the respondents could freely add any description of the most important characteristics or factors of a livable city in their opinion. We categorized their responses and found that most of the mentioned factors related to (the satisfaction of) needs or transportation. It can be either the satisfaction of basic needs, such as housing, or health care, or more special ones towards healthy food or in general good access to any type of urban function in their neighborhood. The other significant category concerning transportation mainly referred to active mobility (walking, cycling) or the quality of public transportation. Several people also mentioned the presence of leisure facilities, perceived safety (both crime and transportation), or access to the urban green. Clean air and less noise pollution were also often mentioned, whereas, there were also less typical answers, given only by a few respondents such as tackling the issue with homelessness or affordable living.
Our main research paper [4] details the statistical relationship between the further factors in each thematic group and the overall satisfaction with living in a given city. Furthermore, the Supplementary Materials attached to this paper contain the description of each factor (S1) along with the conversion values mentioned in the main research paper [4], as well as all the probability values calculated (S2) for the livability assessment.

Supplementary Materials

The following are available online at https://www.mdpi.com/2306-5729/4/4/134/s1, S1: Description of factors and their converted values—we highlighted the factors that were identified significant in the main research paper [4]. S2: Probability values calculated in relational-statistical learning in [4].

Author Contributions

Conceptualization, A.K.-G.; methodology, A.K.-G.; formal analysis, A.K.-G.; writing—original draft preparation, A.K.-G., P.C.-B.; writing—review and editing, A.K.-G., P.C.-B.; visualization, A.K.-G.

Funding

This research was funded by the Austrian Science Fund (FWF) through the Doctoral College GIScience at the University of Salzburg (DK W 1237-N23).

Acknowledgments

Open Access Funding by the Austrian Science Fund (FWF) to publish this manuscript.

Conflicts of Interest

The authors declare no conflict of interest. The funders had no role in the design of the study; in the collection, analyses, or interpretation of data; in the writing of the manuscript; or in the decision to publish the results.

References

  1. Van Kamp, I.; Leidelmeijer, K.; Marsman, G. Urban environmental quality and human well-being: Towards a conceptual framework and demarcation of concepts; a literature study. Landsc. Urban. Plan. 2003, 65, 5–18. [Google Scholar] [CrossRef]
  2. Blečić, I.; Bibo Cecchini, A.; Talu, V. The capability approach in urban quality of life and urban policies: Towards a conceptual framework. In City Project and Public Space; Springer: Dordrecht, The Netherlands, 2013; ISBN 9789400760370. [Google Scholar]
  3. Pacione, M. Urban Liveability: A Review. Urban. Geogr. 1990, 11, 1–30. [Google Scholar] [CrossRef]
  4. Kovacs-Györi, A.; Cabrera-Barona, P.; Resch, B.; Meha, M. Assessing and Representing Livability through the Analysis of Residential Preference. Sustainability 2019, 11, 4934. [Google Scholar] [CrossRef]
  5. Young, E.; Hermanson, V. Livability Literature Review: A Synthesis of Current Practice; TRID: Washington, DC, USA, 2012. [Google Scholar]
  6. Okulicz-Kozaryn, A. City Life: Rankings (Livability) Versus Perceptions (Satisfaction). Soc. Indic. Res. 2013, 110, 433–451. [Google Scholar] [CrossRef]
  7. IMCL The Value of Rankings and the Meaning of Livablity. Available online: http://www.livablecities.org/blog/value-rankings-and-meaning-livability (accessed on 19 April 2017).
  8. Kashef, M. Urban livability across disciplinary and professional boundaries. Front. Archit. Res. 2016, 5, 239–253. [Google Scholar] [CrossRef] [Green Version]
  9. Conger, B.W. On Livability, Liveability and the Limited Utility of Quality-Of-Life Rankings. SSRN 2015, 7. Available online: https://ssrn.com/abstract=2614678 (accessed on 1 October 2019).
  10. Perez, P.; Namazi, M.H. Living Well in Cities: Towards a Location-Based Model of Perceived Urban Liveability. Well-being, Recovery and Mental Health; Slade, M., Oades, L., Jarden, A., Eds.; Cambridge University Press: Cambridge, UK, 2017; ISBN 9781107543058. [Google Scholar]
  11. Giap, T.K.; Thye, W.W.; Aw, G. A new approach to measuring the liveability of cities: The Global Liveable Cities Index. World Rev. Sci. Tech. Sustain. Dev. 2014, 11, 176–196. [Google Scholar] [CrossRef]
  12. Cabrera-Barona, P.; Merschdorf, H. A Conceptual Urban Quality Space-Place Framework: Linking Geo-Information and Quality of Life. Urban. Sci. 2018, 2, 73. [Google Scholar] [CrossRef]
  13. Pacione, M. Urban environmental quality and human wellbeing—a social geographical perspective. Landsc. Urban. Plan. 2003, 65, 19–30. [Google Scholar] [CrossRef]
  14. INIDE. Anuario Estadístico 2015; INIDE: Managua, Nicaragua, 2016. [Google Scholar]
  15. Demographia World Urban Areas: 15th Annual Addition. 2019. Available online: http://www.demographia.com/db-worldua.pdf (accessed on 15 August 2019).
  16. INEC. Proyección de la Población Ecuatoriana; INEC: Quito, Ecuador, 2013. [Google Scholar]
  17. Statistik Austria. Die größten Städte in Österreich am 1. Januar 2019 (in Einwohnern); Statistik Austria: Vienna, Austria, 2019. [Google Scholar]
  18. United States of America Census Bureau City and Town Population Totals: 2010–2018. Available online: https://www.census.gov/data/tables/time-series/demo/popest/2010s-total-cities-and-towns.html (accessed on 2 October 2018).
  19. Központi Statisztikai Hivatal. Magyarország Közigazgatási Helynévkönyve; Központi Statisztikai Hivatal: Budapest, Hungary, 2018. [Google Scholar]
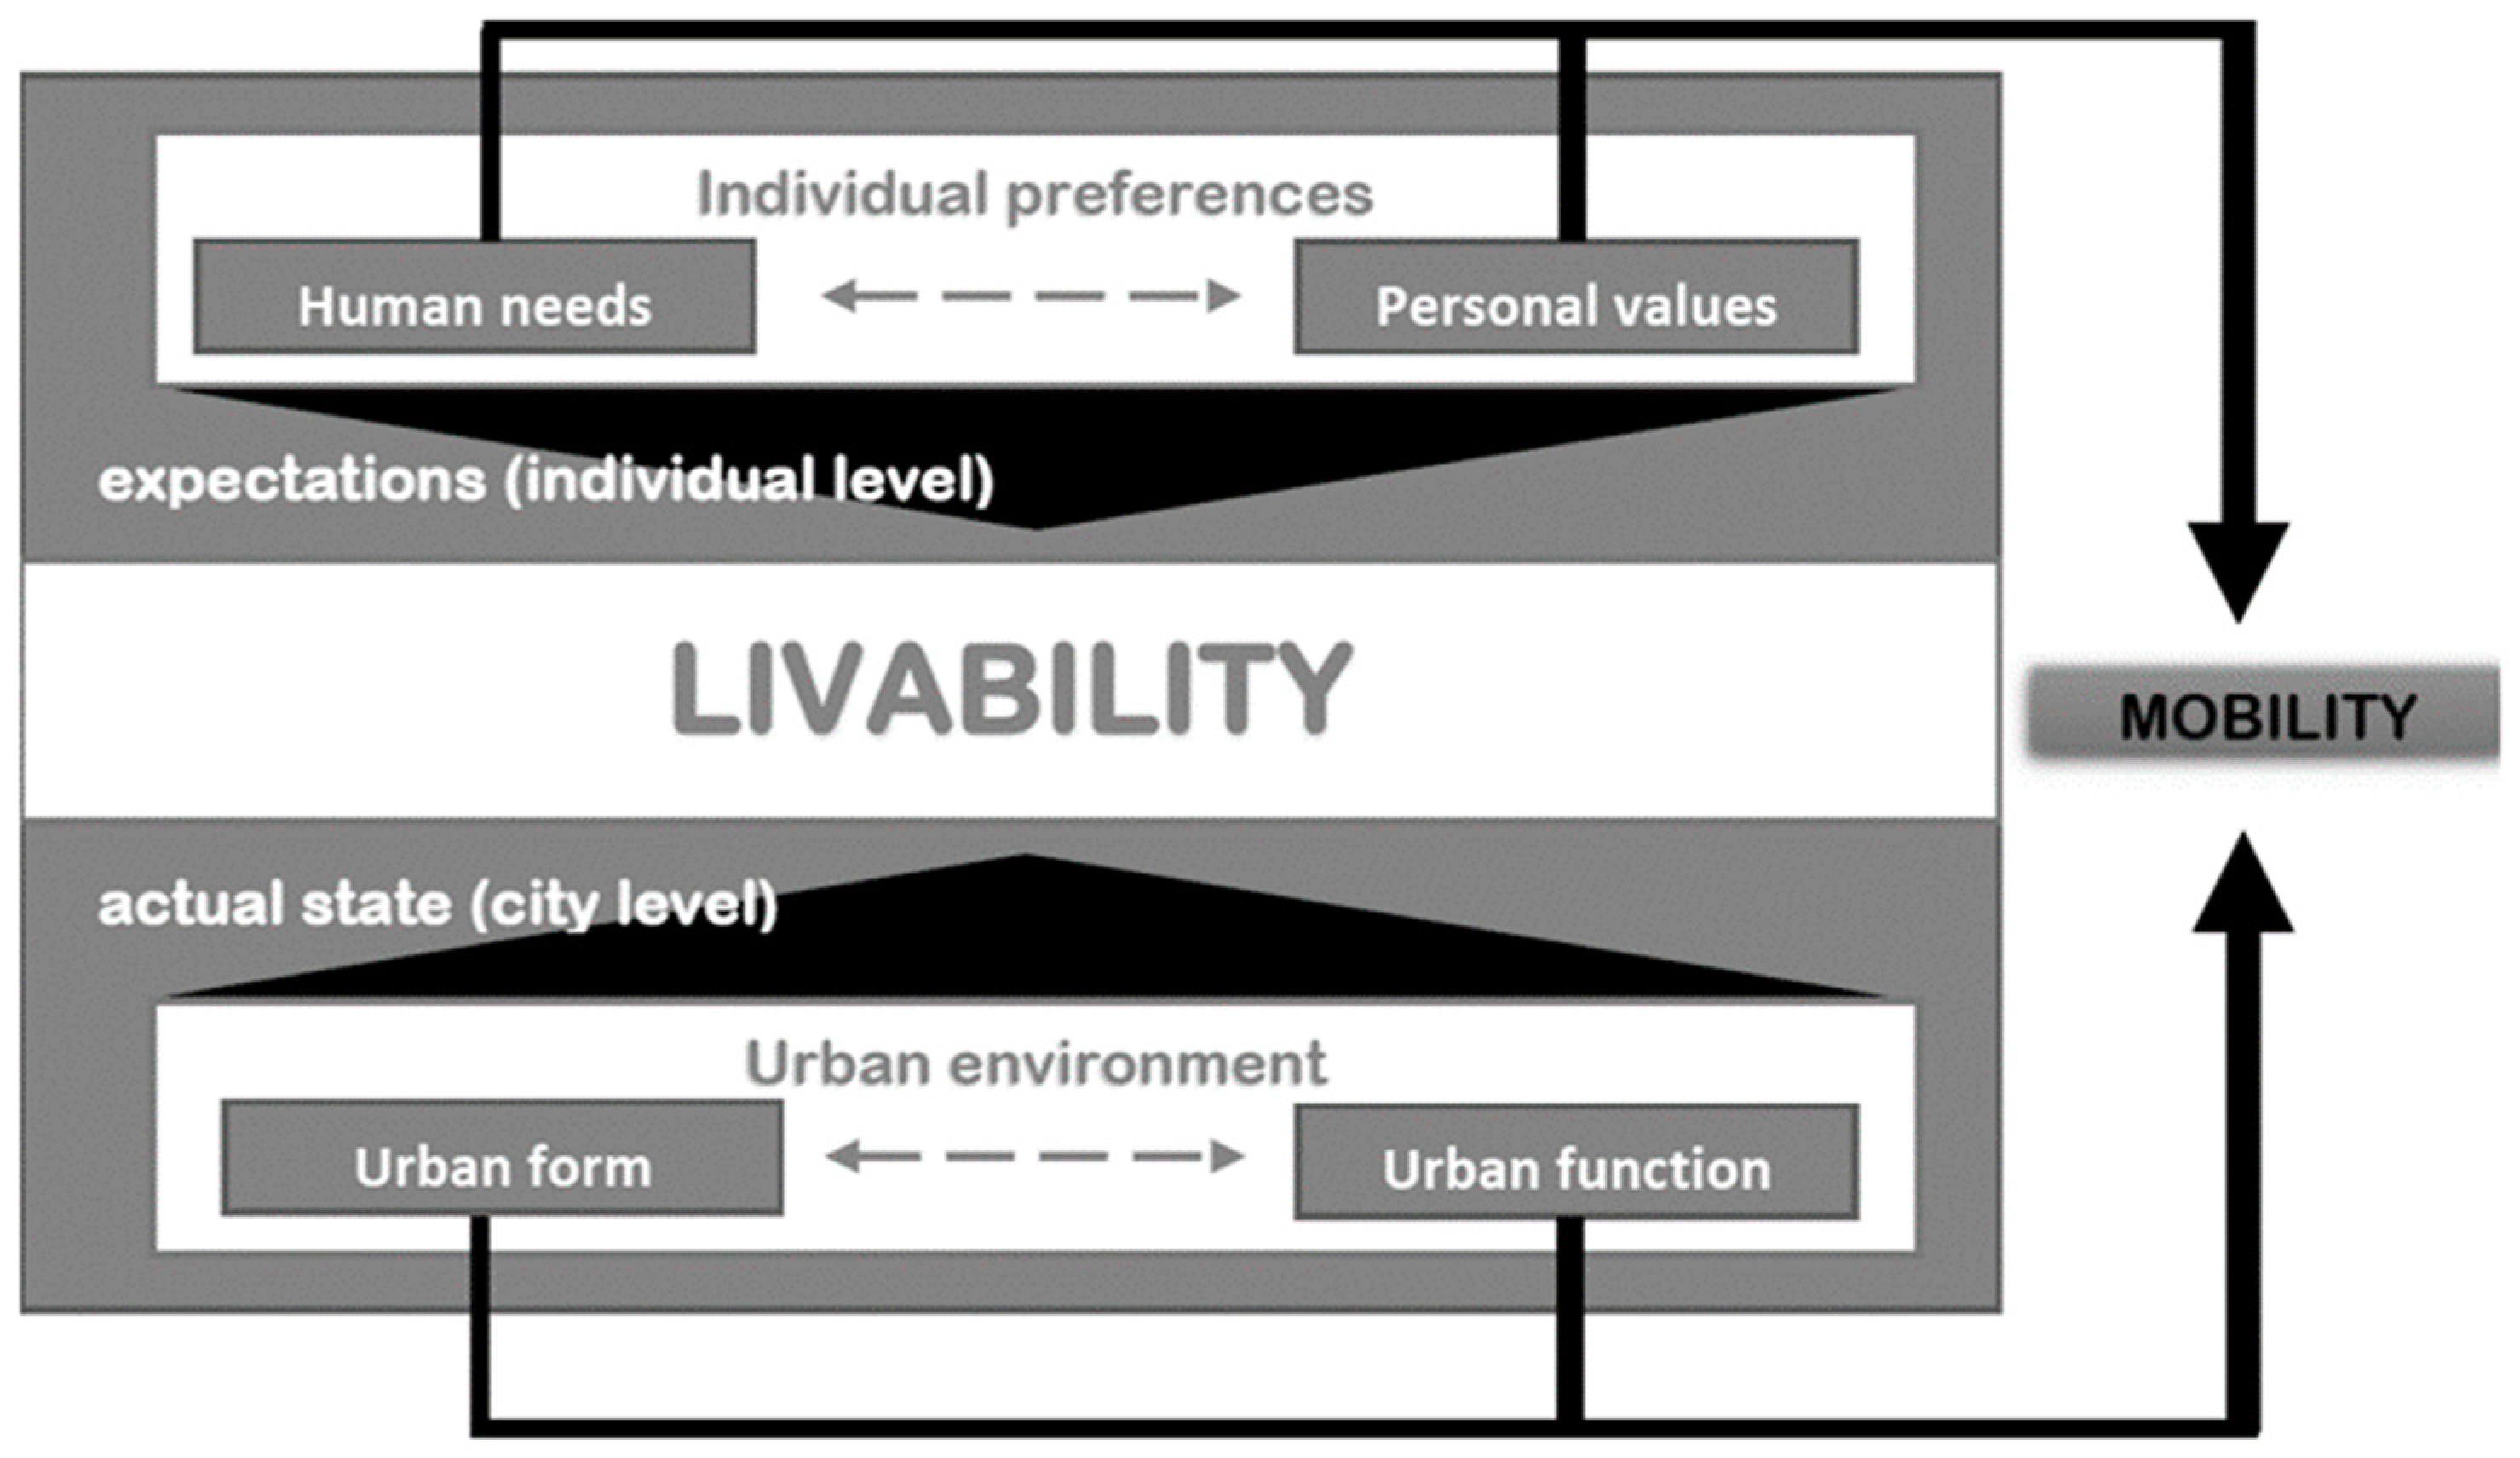
Figure 1. Key elements of livability.
Data 04 00134 g001
Figure 2. Distribution of the responses for community-related factors (how well feeling about the community is represented).
Data 04 00134 g002
Figure 3. Distribution of the responses for urban form-related factors (importance).
Data 04 00134 g003
Figure 4. Distribution of the responses for urban form-related factors (occurrence).
Data 04 00134 g004
Figure 5. Distribution of the responses for the overall evaluation of the built environment quality (n = 430).
Data 04 00134 g005
Figure 6. Going to work per transportation mode according to frequency (n = 378) * e.g., scooter, taxi, motorbike.
Data 04 00134 g006
Figure 7. Going shopping per transportation mode according to frequency (n = 410) * e.g., scooter, taxi, motorbike.
Data 04 00134 g007
Figure 8. Reaching free time activity destinations per transportation mode according to frequency (n = 385) * e.g., scooter, taxi, motorbike.
Data 04 00134 g008
Figure 9. Proportion of most frequent transportation modes per activity type.
Data 04 00134 g009
Figure 10. Motivation for car usage.
Data 04 00134 g010
Figure 11. (Left) Safety for walking and cycling (n = 435). (Center) Quality of walking and cycling (n = 439). (Right) Quality of transport (n = 439).
Data 04 00134 g011
Figure 12. Distribution of the responses for mobility infrastructure-related factors (importance).
Data 04 00134 g012
Figure 13. Distribution of the responses for mobility-infrastructure-related factors (occurrence).
Data 04 00134 g013
Figure 14. Distribution of the responses for perceived mobility-related factors.
Data 04 00134 g014
Figure 15. Distribution of the responses for factors reflecting the accessibility of urban functions (importance).
Data 04 00134 g015
Figure 16. Distribution of the responses for factors reflecting the availability of urban functions.
Data 04 00134 g016
Figure 17. Needs fulfilled by the available urban functions.
Data 04 00134 g017
Figure 18. (Left) Type of homeownership. (Center) Type of home. (Right) Self-reported overall housing conditions (n = 439).
Data 04 00134 g018
Figure 19. Access to basic infrastructure at home.
Data 04 00134 g019
Figure 20. Pairwise post-hoc test of the mean ranks considering place of residence.
Data 04 00134 g020
Figure 21. Pairwise post-hoc test of the mean ranks considering household size (‘5’ refers to households with more than four persons)
Data 04 00134 g021
Figure 22. Pairwise post-hoc test of the mean ranks considering income levels (1—much less what the basic needs require, 3—the amount what the basic needs require, 5—much more than what the basic needs require, see also Section 4.1.1).
Data 04 00134 g022
Table 1. Population (rounded) and number of responses for each study area (based on [4]).
CountryCityPopulationNumber of Responses *
NicaraguaLéon168,000 [14]32 *131 responses from developing countries
KenyaNairobi5,970,000 [15]46 *
EcuadorQuito2,700,000 [16]53
AustriaVienna1,900,000 [17]91309 responses from developed countries
Salzburg154,000 [17]51
United StatesPortland, OR653,000 [18]43
HungaryBudapest1,800,000 [19]69
Szeged161,000 [19]55
* In Nicaragua and Kenya where paper-based questionnaires were used, it might occur that not every question was completely answered.
Table 2. Distribution of the responses for “General information” factors.
VariableValue
Place of residence (n = 440)see Table 1
Sex (n = 438)58% female
42% male
Age (n = 437)1% below 18
14% 18–25
40% 26–35
22% 36–45
10% 46–55
7% 56–65
7% Above 65
Marital status (n = 438)35% married
21% living with a partner
35% single
5% divorced
3% separated
only two persons widowed
Nationality (n = 437)51 people different from locals
Number of persons in the household (n = 437)24% alone,
33% 2
32% 3 or 4
11% more than 4
Composition of the household (n = 438)
* multiple conditions can be true
27% has children under 18,
10% children over 18,
11% lives with parents,
50% lives together with other relative or friend
Education (n = 438)1% elementary school
10% high school
16% post-high school
25% Bachelor
37% Masters
9% PhD or higher
3% other
Household income compared to basic needs (n = 433)4% much less
18% less
33% the amount
36% more
8% much more
Table 3. Distribution of the responses for community-related factors (length and satisfaction).
VariableValue
Length (n = 440)43% less than 5 years
27% 5–15
14% 16–25
8% 26–35
8% more than 35
Satisfaction (n = 440)5% not at all
17% somewhat
49% mostly
30% completely